the labor impact of lao export growth
TRANSCRIPT

Report No: AUS9112
The Labor Impact of
Lao Export Growth February 2016


Currency Equivalent
Exchange rate effective as of February 24, 2016 (from BCEL) : Currency Unit = LAK (Lao Kip)
LAK 8,110 = US$ 1.00
Fiscal Year = October to September
Acronyms and abbreviations
ASEAN Association of Southeast Asian Nations
EAP East Asia and Pacific
EU European Union
GDP Gross Domestic Product
LDC Least Developed Country
LECS Lao Expenditure and Consumption Survey
SME Small and Medium Enterprise
SOE State Owned Enterprise
TDF-2 Second Trade Development Facility
WTO World Trade Organization
Acknowledgements
This report was prepared by Elizabeth Ruppert Bulmer – Lead Economist, Jobs Cross-Cutting
Solutions Area, and Claire H. Hollweg – Trade Economist, Trade and Competitiveness Global
Practice. The authors are grateful for comments received from Julian Clark – Senior Economist,
GTC02; Mombert Hoppe – Senior Trade Economist, GTC02; Thomas Farole – Lead Economist,
Jobs Cross-Cutting Solutions Area; and Lars Sondergaard – Program Leader, EACTF. We would
also like to thank the Government of Lao PDR, especially the Ministry of Industry and
Commerce and the Lao Statistics Bureau for data access and collaboration. This report was
prepared as a part of a trade-related analytical program of work carried out by the World Bank in
Lao PDR, under the Second Trade Development Facility program, and financed by Australia, the
European Union, Germany, Ireland, and the United States.
Disclaimer: The findings, interpretations and conclusions expressed herein are those of the
authors, and do not necessarily reflect the views of the World Bank Group, its Executive
Directors, or the governments they represent.
Regional Vice President : Axel van Trotsenburg
Country Director : Ulrich Zachau
Senior Practice Director : Cecile Fruman
Country Manager : Sally Burningham
Practice Manager : Mona E. Haddad
Primary Authors : Elizabeth Ruppert Bulmer
Claire H. Hollweg
Table of Contents
Executive Summary ......................................................................................................................... i
Chapter 1: Introduction and Trade Context .................................................................................... 1
1.1. Introduction .......................................................................................................................... 1
1.2. Trade Context ....................................................................................................................... 2
Chapter 2. Lao PDR’s Labor Market and Recent Employment Trends ......................................... 6
2.1. Characteristics of the Labor Force ....................................................................................... 6
2.2. Sectoral Employment Trends ............................................................................................... 9
2.3. Productivity and Average Wages ....................................................................................... 12
2.4. Determinants of Earnings ................................................................................................... 16
Chapter 3. Labor Sophistication and Competitiveness in Export Markets ................................... 18
3.1. Snapshot of Lao PDR’s Export Basket .............................................................................. 18
3.2. Measuring the Labor Content of Exports ........................................................................... 19
Chapter 4. Export-Employment Elasticity .................................................................................... 29
4.1. Comparing Exporting Behavior and Labor Demand ......................................................... 29
4.2. Estimating the Employment Elasticity of Exporting.......................................................... 32
4.3. Impact of the Business Environment on the Export-Employment Elasticity..................... 33
Chapter 5: Labor Mobility and Adjustment Costs ........................................................................ 35
5.1 Defining Labor Mobility Costs and Labor Adjustment Costs ............................................ 35
5.2. Worker Transitions in Lao PDR......................................................................................... 36
5.3. Labor Mobility Costs ......................................................................................................... 39
5.4. Labor Adjustment Costs ..................................................................................................... 42
References ..................................................................................................................................... 47
Annexes......................................................................................................................................... 50

i
Executive Summary
1. Lao PDR has seen strong economic growth during the past decade with an average
growth rate of 7.8 percent per annum. Much of this has been driven by the growing external
appetite for Lao PDR’s natural resources, which have not generated broad-based job creation and
income growth for a significant proportion of the Lao population. Manufacturing – and
especially garment manufacturing – has the potential to generate jobs for the large unskilled
segment of the Lao labor force. The garment sector did indeed provide substantial job creation in
the 1990s, especially for women, but more recent trends suggest a relative contraction of the
manufacturing sector since 2007/08, both in terms of employment and weaker wage growth. This
contraction is mirrored in Lao PDR’s manufacturing trade outcomes over the past decade,
pointing to a decline in competitiveness on the international stage. While exports can be an
avenue to growth and job creation, the success of policies aiming to sustainably improve
employment outcomes will depend on the realities of Lao export competitiveness and global
market demand.
2. Based on a series of complementary methodological approaches and datasets implicitly
linking trade to jobs, this report paints a mixed picture of Lao PDR’s recent export
performance and how this has translated into job creation and improved job quality across
the economy. The findings of these various analytical approaches provide insight into the
potential drivers of Lao PDR’s labor outcomes including the role of exports, and what the
Government and firms can do to better position Lao producers in external markets so that more
and better jobs are created for Lao workers in the future.
3. Whereas the economy is undergoing some structural transformation away from
agriculture, workers are primarily shifting into low-skill non-tradable service activities and there
is no strong concurrent rural-to-urban shift. Agricultural employment continues to dominate the
Lao labor market, but agricultural production accounts for only a small share of Lao exports. The
most dynamic export sectors – mineral products, base metals, and wood and pulp – are not
generating sufficient labor demand to absorb the large unskilled segment of the labor force.
Mining wages are higher than other sectors, controlling for other factors, but mining activities
are not labor-intensive. Even the garment sector, which accounts for a tenth of exports, employs
less than 2 percent of the labor force, pays very low wages, and experienced slower real wage
growth than the rest of the economy (except for hotels and restaurants).
4. Manufacturing in Lao PDR is more export-oriented than average compared to other
countries, with export rates similar to Vietnam. Exporting firms tend to be larger than non-
exporting firms, both in Lao PDR and elsewhere. However, comparing Lao PDR’s 2012 export
basket to countries at a similar level of development, Lao exports tend to be less sophisticated
than those from Senegal, Cambodia, Indonesia, Bangladesh and the Philippines, based on
indirect (global trade-weighted average) measures of wage, value-added, and human and
physical capital. In the case of garments, which have a high labor content, Lao garment exports
may in fact be less competitive due to higher wages vis-à-vis Bangladesh and Cambodia. Lao
PDR’s small scale of garment production also makes it less well placed to compete for large
contracts in certain markets compared to Cambodia and Bangladesh, even if Lao producers have

ii
found a competitive niche in European markets. In dynamic terms, the labor sophistication of
Lao PDR’s export basket has remained relatively flat since 2006, and made little progress in
closing the competitiveness gap vis-à-vis comparator countries. This suggests relatively low-tech
production methods and/or weak education outcomes. These factors in turn limit exporters’
capacity or incentives to invest in more productive technologies.
5. A key obstacle to attracting investment in high-value manufacturing is the Lao labor
force’s low schooling levels. With respect to wages, the Lao labor market rewards higher
education levels with higher wages, although we find evidence of declining returns to each level
of education between 2007/08 and 2012/13. For those with a tertiary degree, for example, the
premium relative to less than primary fell from 58 percent in 2007/08 to 39 percent in 2012/13,
suggesting that there is increasing supply of skilled labor to meet current demand (this may be
partly driven by civil service wage distortions). This also translates into relatively lower
incentives for workers to achieve higher education levels. This trend contrasts with other
dynamic economies where the diversification into higher value products and the adoption of new
technologies require more and more top skills and therefore generate increasing returns to the
highest levels of education.
6. It is notable that in the garment sector in particular, wage growth for those with a
vocational degree was much faster than the average for all garment workers (14 percent vs. 2.6
percent annual growth). Whereas this implies increasing returns to semi-skilled workers,
consistent with reported shortages of skilled labor, the slower wage growth for unskilled or
entry-level garment workers may explain why employers have difficulty retaining workers
(factories report high turnover rates of new entrants, most of whom lack a secondary or
vocational degree). This either means that employers are actually willing to incur the repeated
recruitment and training costs of their rapidly changing unskilled labor force, or that profit
margins are too small to accommodate higher wages for this majority segment of the garment
sector workforce.
7. Data on worker movements between jobs and into and out of different sectors suggest
that the Lao labor market is relatively fluid, but workers seeking better work opportunities in
other sectors typically face significant costs to transition. High labor mobility costs are the norm
for countries with a large share of primary employment, and Lao PDR is no exception. Skilled
workers face relatively lower mobility costs than unskilled workers, while female workers face
higher transition costs compared to men. The agriculture sector has the lowest entry costs, and as
such acts as the “sector of last resort”.
Policy Recommendations
8. Policies to facilitate better labor outcomes could focus on improving existing firms’
or producers’ competitiveness, helping firms to enter and/or grow, facilitating access to
technology and higher value production, and enhancing the skills in the labor market to
attract and induce higher-value activities.
9. Small profit margins in the low-value garments sector mean that Lao producers have little
room for finding productivity gains vis-à-vis competitors such as Bangladesh and Cambodia. A
more promising strategy would focus on creating more attractive niches or product lines for high

iii
income economies through e.g., upgrading labor standards and environmental standards, thus
helping big brand retailers and buyers to meet their corporate social responsibility objectives.
10. High turnover and exit rates from garment factories back to farm work or migration
results in productivity and production losses for the Lao economy. Policies to reshape the
incentive structure of garment jobs (such as working conditions and/or career development)
could entice workers to remain in relatively more productive work.
11. A large pool of skilled and competitive labor is an essential component both for attracting
investment in higher-value activities, and for enabling firms to upgrade the quality of their
output. This means policies to increase educational attainment, more support for basic education,
curricula reform to meet market demand including soft skills and entrepreneurial skills, and
aligning vocational training to private sector demand.
12. Exporting rather than selling to the domestic market is correlated with more skilled and
unskilled employment, although the effect is quite small. Policies that help producers access new
external markets could include joining (electronic) knowledge platforms, improving standards
compliance and certification in line with international standards, reducing trading costs by
improving trade logistics and trade facilitation systems, and providing enterprises with support
for marketing assistance and training, for example.
13. Whereas labor regulations do not seem to be a binding constraint on hiring, there is
anecdotal evidence of confusion surrounding the implementation of the new minimum wage
regulation which could diminish labor demand, suggesting a need for clarification and outreach
by the Ministry of Labor. In addition, other recent World Bank reports1 identify critical business
climate challenges that present larger impediments for firms trying to export, and that should be
addressed.
14. Lao’s relatively low-tech export basket limits its capacity to access higher income
consumers seeking higher quality goods and services. Policies should therefore focus on
facilitating access to technology and higher value production through for example more
favorable (but still non-distortionary) investment incentives, or more generally by easing access
to formal finance through banks or SME-targeted credit institutions.
15. The high labor mobility costs in Lao PDR prevent efficient labor allocation across
sectors, and could generate significant welfare losses in the event of a sudden change in the
economic environment by slowing and dampening the labor market response. Policies to
facilitate labor mobility could include labor market information or matching services, or cost-
share training that is demand-driven and targeted to specific private sector needs.
16. Diversifying production and employment away from the primary sector toward industry
and services will also reduce labor mobility costs, enabling workers to transition more easily to
better jobs. In addition to policies directly targeting lower mobility costs, there is scope for
reforming distortionary public employment hiring, compensation and human resource
management policies, and revisiting the role of SOEs. Reducing these distortions could curtail
queuing for public sector jobs and free more educated workers to enter the private sector.
1 See World Bank 2011b, World Bank 2014a, World Bank 2014b, World Bank 2015

iv
17. The limitations of Lao PDR’s manufacturing sector – both in size and quality – mean that
any positive policy impacts are likely to have only modest effects on aggregate welfare and
inclusive growth. Policies will need to go beyond the manufacturing sector to address the limited
employment and demand spillovers of mining production, and the limited market integration and
value addition in agricultural production. Policies to enhance agricultural productivity, job
quality and economic opportunities in rural areas will not only foster greater equity, but will also
reduce urban-rural distortions and dampen the incentives to migrate.

1
Chapter 1: Introduction and Trade Context
1.1. Introduction
1. As countries become increasingly integrated into the global economy, increased trade links
with other countries translate into increased access to better or cheaper imports and increased
demand for exports. Both can have an impact on consumers, producers and workers through
household consumption, household production, and labor incentives. The channels through
which increased trade integration can affect labor include: (i) the consumption channel, typically
leading to an increase in purchasing power and therefore higher real wages, and (ii) the
employment effect due to increased labor demand. The extent of these gains to trade will depend
on the incidence of trade policies or trade shocks; in other words, the impact will depend on
which products become less expensive, which sectors increase demand for skilled or unskilled
labor, and which workers can access these new jobs.
2. Lao PDR has experienced very strong export growth in the past decade, and this report tests
several key research questions linking export performance to employment. For example, does
increased trade boost aggregate employment, or simply generate a reallocation of workers
between sectors? Do increased trade opportunities and export growth generate more jobs only in
specific trade-related sectors or across the economy? Does increased trade lead to skill upgrading
and/or more demand for skilled workers, enhancing long-term competitiveness? Does export
growth lead to better jobs in terms of skill level and higher wages?
3. This report utilizes a range of methodologies and datasets that implicitly link trade and jobs;
by using these complementary analytical approaches, we generate multiple perspectives on Lao
PDR’s recent labor market outcomes, and their implications for Lao PDR’s current and future
trade competitiveness. The objective of this report is to provide evidence using the following
analytical approaches:
Employment and wage trends in the traded and non-traded sectors. Using the Lao PDR
Earnings and Consumption Survey (LECS waves 4 (2007/08) and 5 (2012/13)) and the 2010
Lao PDR Labor Force and Child Labor Survey, we examine patterns of labor supply and
demand in the Lao labor market, the nature of employment and how it has changed over
time, the patterns of structural transformation of employment in the Lao economy, and the
ways in which Lao PDR’s increased trade integration has affected worker welfare. This
report builds on similar analysis in the World Bank’s recent Lao Development Report (World
Bank 2014b), exploring wage gaps across sectors and population groups, and estimating the
returns to education, controlling for sector differences and other individual characteristics.
Education and skills are critical aspects of labor supply and demand, as pointed out in World
Bank (2014a); respondents to the 2012 Enterprise Survey named insufficient skills as the
main impediment to private sector growth. Furthermore, education and skills can be a
fundamental driver of mismatch that could explain unemployment or underemployment. In
addition to broad labor market characteristics, the analysis pays particular attention to the
manufacturing sector, which is highly concentrated in exported garments. The analysis uses
data on sectoral employment, productivity and wage trends to draw inferences about the

2
quality of jobs across sectors, and estimates the returns to working in different sectors and/or
provinces. The results highlight the existing incentives for skill acquisition and identify
access and job quality gaps that will affect labor competitiveness in the future.
Labor sophistication of exports. With respect to the traded goods sector, the analysis
considers the types of labor utilized in Lao’s manufacturing exports and how this compares
to the labor content of exports from competitor countries, which can shed light on the relative
competitive position of Lao exports. Looking to future competitiveness prospects, we
analyze the labor sophistication of Lao PDR’s existing export basket, how this has changed
in recent years, and how these shifts compare to neighboring Vietnam or Cambodia, or to
other countries at a similar stage of development.
Export-employment elasticity. The analysis compares firms’ demand for labor across sectors,
and the degree to which exporting firms exhibit employment practices that differ from non-
exporters. Given ongoing and planned Government efforts to address the regulatory
environment in Lao PDR including with respect to labor regulations, the analysis also
explores whether more competitive environments give rise to higher labor demand, or
demand for different types of labor.
Labor mobility and adjustment costs. This part of the analysis examines the circumstances
under which a trade shock can benefit or harm workers through changing labor demand and
the role that mobility costs play in impeding labor adjustment to the shock. The impact will
depend on the nature and cost of mobility constraints facing Lao workers, as well as the
sectoral distribution of employment, skill sets and wages, and the relative impact of a trade
shock on particular sectors. Even for a favorable shock, not all workers will benefit equally,
and some workers may lose. The analysis uses panel data to derive transition matrices (the
movement of workers between jobs and sectors), from which we estimate labor mobility
costs. This provides the basis for testing the labor response to a hypothetical trade-related
price shock.
4. The findings of these separate analyses provide a multi-faceted picture of Lao’s labor market
and the role of trade in creating competitive jobs in competitive sectors. The conclusions point to
a set of policy implications for policymakers to bear in mind as they address Lao PDR’s long-
term development and growth challenges.
1.2. Trade Context
5. Lao PDR has seen strong economic growth during the past decade, driven by the
exploitation of natural resources and closer regional integration. The country is surrounded
by some of the fastest growing economies in the world, and it has benefited significantly from
external demand for tradables and increased foreign direct investment inflows. Real GDP grew at
an average growth rate of 7.8 percent per annum over the past decade. In 2010, Lao PDR
graduated from low income to (lower-) middle income country status, and by 2014, per capita
Gross National Income had climbed to US$1,600. At this pace, Lao PDR is on track to achieve
its long-term vision: to graduate from Least Developed Country (LDC) status by 2020.

3
6. Despite impressive poverty reduction and progress towards achieving the Millennium
Development Goals over the past ten years, significant gaps remain. Between 2002/03 and
2012/13, inequality widened, as the gains for the bottom 40 percent were significantly less than
for the rest of the population, a pattern typical of natural-resource led growth. While absolute
poverty (based on the national poverty line) declined from 33.5 percent of the population in
2002/03 to 23.2 percent in 2012/13, the Gini coefficient rose from 32.5 to 36.2. Measured using
the internationally comparable poverty line of US$1.25 a day in 2005 PPP terms, poverty
declined from 41.4 percent in 2002/03 to 28.8 percent in 2012/13. Human development
indicators have not improved commensurately with poverty reduction, however, and certain
population groups in remote areas lag behind.
7. Against this background, Lao PDR’s economy is going through a structural shift from
agriculture to natural-resource based industry. Natural resource-based sectors have been
growing very rapidly during the past decade, averaging around 18 percent real annual growth
between 2003 and 2015 (supported by mining and hydropower mega projects). As a result, the
share of these sectors in GDP has tripled since 1998, increasing from 6 percent of GDP in 1998
to 18 percent in 2012 and beyond. The share of non-tradables (services) to GDP grew more
moderately, driven by increases in tourism and trade in recent years as well as expansion in
infrastructure construction. Similarly, manufacturing (garments, wood and wood products,
construction materials, light manufacturing, handicrafts, and, increasingly, food, beverages, and
related processing) as a share of GDP has expanded, but at a relatively slower rate.
8. Lao PDR continues to integrate more closely into the rapidly growing regional economy through the implementation of trade commitments both multilaterally and within the Association
of Southeast Asian Nations (ASEAN), the maintenance of relatively low tariffs, and through
improved physical infrastructure and connectivity with neighbors. This has resulted in strong
growth in cross-border flows of goods, services and investment. However, much of this has been
driven by the growing external appetite for Lao PDR’s natural resources. Although the resources
sector has brought significant benefits to Lao PDR’s economy in the form of higher economic
growth, an increase in fiscal revenues, and infrastructure improvements, an over-reliance on the
sector as a primary source of economic growth poses serious risks to the sustainability of the
country’s long-term development. There is also a risk of increased volatility as the economy
becomes more susceptible to external shocks driven by commodity price movements. In
addition, the sector may not generate the kind of broad-based jobs and incomes levels needed to
benefit a significant proportion of the Lao population.
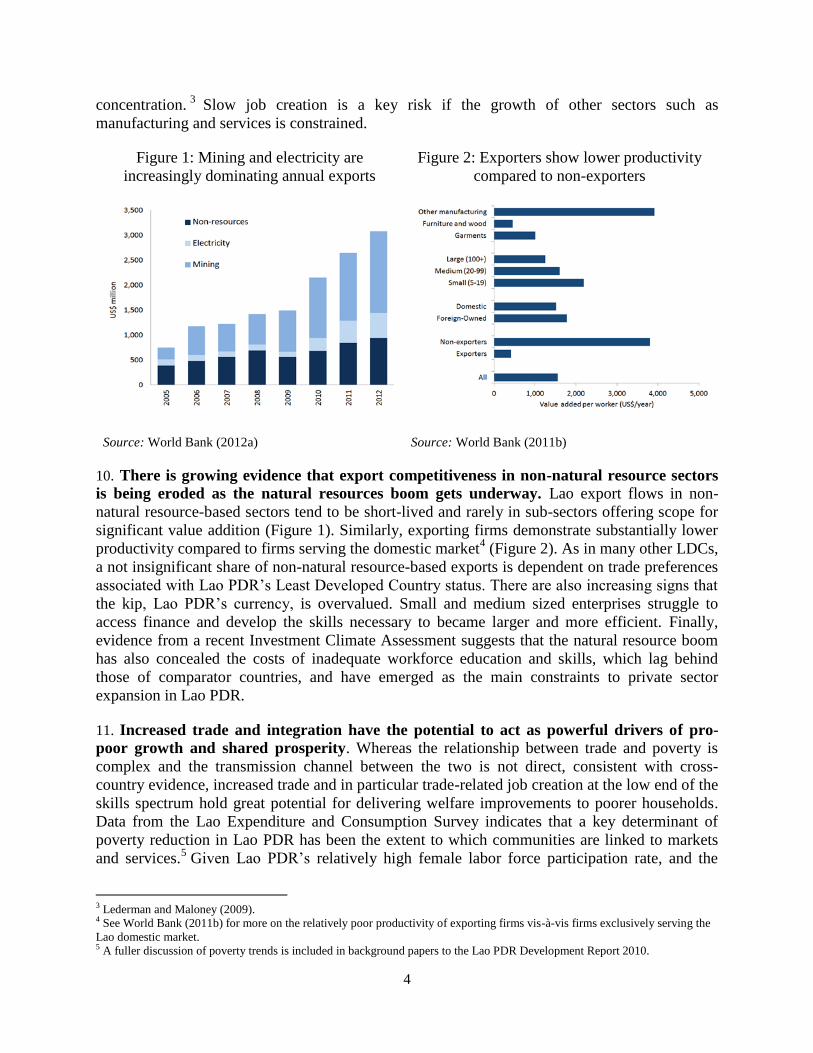
9. Even under fairly modest projections, Lao trade performance is likely to become
increasingly skewed towards natural resource (hydropower and minerals) exports in the
years ahead (Figure 1). While this brings tremendous opportunities, it also presents risks
associated with the lack of export diversification. Recent analytical work describes how lack of
diversification can restrict economic growth through the early onset of diminishing marginal
returns to a more limited range of export products, and through increased risk of terms-of-trade
shocks.2 Cross-country research on the “natural resources curse” actually finds that the core
driver of the curse is not the presence of natural resources per se, but the degree of export
2 See World Bank (2011a).
4
concentration.3
Slow job creation is a key risk if the growth of other sectors such as
manufacturing and services is constrained.
Figure 1: Mining and electricity are
increasingly dominating annual exports
Figure 2: Exporters show lower productivity
compared to non-exporters
Source: World Bank (2012a) Source: World Bank (2011b)
10. There is growing evidence that export competitiveness in non-natural resource sectors
is being eroded as the natural resources boom gets underway. Lao export flows in non-
natural resource-based sectors tend to be short-lived and rarely in sub-sectors offering scope for
significant value addition (Figure 1). Similarly, exporting firms demonstrate substantially lower
productivity compared to firms serving the domestic market4 (Figure 2). As in many other LDCs,
a not insignificant share of non-natural resource-based exports is dependent on trade preferences
associated with Lao PDR’s Least Developed Country status. There are also increasing signs that
the kip, Lao PDR’s currency, is overvalued. Small and medium sized enterprises struggle to
access finance and develop the skills necessary to became larger and more efficient. Finally,
evidence from a recent Investment Climate Assessment suggests that the natural resource boom
has also concealed the costs of inadequate workforce education and skills, which lag behind
those of comparator countries, and have emerged as the main constraints to private sector
expansion in Lao PDR.
11. Increased trade and integration have the potential to act as powerful drivers of pro-
poor growth and shared prosperity. Whereas the relationship between trade and poverty is
complex and the transmission channel between the two is not direct, consistent with cross-
country evidence, increased trade and in particular trade-related job creation at the low end of the
skills spectrum hold great potential for delivering welfare improvements to poorer households.
Data from the Lao Expenditure and Consumption Survey indicates that a key determinant of
poverty reduction in Lao PDR has been the extent to which communities are linked to markets
and services.5 Given Lao PDR’s relatively high female labor force participation rate, and the
3 Lederman and Maloney (2009). 4 See World Bank (2011b) for more on the relatively poor productivity of exporting firms vis-à-vis firms exclusively serving the
Lao domestic market. 5 A fuller discussion of poverty trends is included in background papers to the Lao PDR Development Report 2010.

5
predominance of women in tradable sectors such as garment manufacturing, tourism and
agribusiness, trade can be a catalyst for increased women’s economic empowerment, with
positive externalities for household welfare and human capital investment.
12. Surrounded by some of the fastest growing economies in the world, Lao PDR has
deepened its integration with the regional market. Growing regional demand for Lao PDR’s
natural resources, coupled with trade policy reforms both multilaterally and in the context of
ASEAN, have boosted cross-border trade and investment between Lao PDR and its neighbors.
Goods trade is concentrated by destination with Thailand, accounting for more than half of Lao
PDR’s exports, followed by Vietnam, Australia and China. Thailand also supplies three-quarters
of the country’s imports, followed by China, Vietnam and Japan.
13. To meet its goal of graduating from Least Developed Country status by 2020, Lao PDR will
need to focus not only on continuing to expand exports both regionally and globally, but also to
increasing the returns of expanded trade to workers through higher employment and incomes.
The analysis that follows examines the extent to which workers have participated in and benefit
from the recent trade growth.

6
Chapter 2. Lao PDR’s Labor Market and Recent Employment Trends
2.1. Characteristics of the Labor Force
14. The labor market in Lao PDR is characterized by very high and increasing labor force
participation and extremely low and declining unemployment. Labor force participation rates
increased from 85 percent in 2007/08 to nearly 94 percent in 2012/13, with increases observed in
both urban and rural areas (see Figure 3 and Annex 1 Table 1.1). Unemployment fell over the
same time period, from 0.4 percent to 0.2 percent. Rural residents have relatively higher
participation rates and lower unemployment (Figure 4), explained in part by the high share of
labor engaged in farming activities. Urban participation rates grew slightly faster than rural rates,
and women’s LFP grew faster than men’s. By 2013, participation rates were nearly identical for
men and women. The capital city of Vientiane, which had the lowest LFP rate in 2007/08,
experienced the greatest increase, reaching 96 percent in 2012/13, while unemployment fell to
0.1 percent. Champasak also experienced rapid growth in labor force participation and a
concurrent decline in unemployment to zero. These results jointly translate into strong job
growth.
Figure 3: Rising LFP, falling unemployment Figure 4: Signs of queuing for good jobs
Source: 2007/08 and 2012/13 Lao PDR Earnings and Consumption Survey.
15. Unemployment is slightly higher among more educated workers and those in urban
areas, suggesting a degree of voluntary unemployment as some workers prefer to remain
unemployed while waiting for high-paying job offers in line with their qualifications or
expectations. In 2012/13 the unemployment rate was the lowest for the population with no
formal schooling – 0.1 percent – and highest for the population with a tertiary education – 0.3
percent. Given that labor force participation rates are similarly high across all levels of
schooling, the higher unemployment rate for tertiary graduates suggests that more skilled job
seekers may choose voluntary unemployment while waiting – or “queuing” – for a good job in
the formal sector. This pattern of queuing is very common, and can be explained by a range of
possible factors, including the need to spend time and effort searching for a good job, or the

7
relatively higher reservation wages of more educated workers, who themselves may live in
higher income households that can afford to support their unemployment spells.
16. Overall, schooling outcomes are low in Lao PDR. In 2012/13, the population had on
average 4.7 years of schooling (5.4 for men compared to 4.1 for women) – the equivalent of less
than a primary education. According to the coding in the LECS datasets, there are five grades in
primary school, four grades in lower secondary, three grades of upper secondary, two grades of
low vocational school, three years of middle technical school, and nine years of college / high
technical school (because lower secondary school in Lao PDR is only three years, the fourth year
was treated as the same as the first year of upper secondary / low vocational school for
comparison purposes).6 Close to 20 percent of the population has not completed primary school,
and another 37 percent has completed only primary schooling. About 15 percent of the
workforce has completed upper secondary or vocational training, and another 6 percent has
obtained tertiary degrees (see Annex 1, Table 1.2). Education quality is also very low, even at the
foundational level; a 2012 early grade reading assessment found that 30 percent of 2nd
graders
could not read, and only 60 percent of 4th
graders had achieved reading fluency (World Bank
2014c). As stressed in World Bank (2014b), low literacy rates have persistent negative effects on
the productivity levels of Lao workers because basic literacy is the foundation for acquiring other
skills.
17. Schooling rates are rising, especially for women, but women remain much more likely
to have less than a primary degree compared to men. The percentage of females with an
incomplete primary education fell from 34 percent in 2007/08 to 27 percent in 2012/13 (Annex
1, Table 1.2). Nevertheless, males are more likely to have completed primary school (19 percent
of males had no schooling in 2012/13, compared to 27 percent of females). And among those
who complete primary, women are less likely to continue their education.
18. The time trends in educational attainment are positive. Between 2007/08 and 2012/13,
the share of tertiary degrees more than doubled from 2 percent to 5 percent (admittedly from a
very low base) and vocational education also rose (Figure 5). We observe a significant
improvement at the lower end, as the share of workers with less than a primary degree fell from
39 percent to 25 percent, with most upgrading to a completed primary education. At the same
time, however, drop-out rates increased (World Bank 2013).
6 In Lao PDR, the schooling levels (and corresponding grades) are: primary (grades 1-5); lower secondary (grades 6-
8/9); and upper secondary (grades 9-11), which could be completed as either general education or vocational).
Students then progress to either technical training – which could be either first level for 2 years (grades 12-13) or
middle level for 3 years (grades 12-14) – or to tertiary (grades 12-20). The highest level attained is based on highest
grade attained. Less than primary corresponds to no schooling or completing grades 1-4, primary corresponds to
completing grades 5-7, lower secondary corresponds to completing grades 8-10, etc. In the LECS we cannot
determine if individuals attained either first or middle level technical training; we therefore considered those who
have attained two or three years there to have completed technical training.

8
Figure 5: Shifts in educational attainment
Source: 2007/08 and 2012/13 Lao PDR Earnings and Consumption Survey.
19. We observe a strong urban-rural divide in educational attainment as well. About three-
fourths of rural residents have a primary education or less, compared to about a third for urban
residents (in 2012/13). This result may stem partly from more limited access to schools in remote
rural areas, but may also be a function of the nature of available jobs in rural labor markets. Most
farming, for example, is conducted on small family farms and therefore does not require formal
education. As shown in Annex 1 Table 1.2, three-fourths of agriculture workers have only a
primary education or less. Residents of the capital Vientiane have significantly higher rates of
upper secondary, vocational and tertiary education compared to all other regions. It is interesting
to note that vocational attainment actually fell by 2 percentage points in Vientiane between
2007/08 and 2012/13, while tertiary rates concurrently increased by 6 percentage points.
Otherwise, we do not observe significant regional differences in educational attainment.
20. Garment sector workers are only moderately more skilled than farmers. On average, 60
percent of workers in the garment sector had a primary education or less in 2012/13, up from 44
percent in 2007/08. This shift to a less educated workforce is consistent with reported high
turnover rates and increasing competition from migration, in response to which garment
manufacturers are increasingly recruiting young women from remote areas.
21. According to the 2012/13 survey, public sector jobs, and among those, civil service jobs,
are dominated by workers with post-secondary education (Figure 6). One-third of civil
servants have vocational degrees, and another 41 percent have tertiary degrees. This high
concentration of the most educated workers in government jobs helps explain the queuing
behavior noted above. Employees of state-owned enterprises exhibit a more even distribution of
education levels. The public sector skills bias stands in stark contrast to private sector workers,
most of whom have only a primary education. In the analysis below, we explore the extent to
which higher education levels are remunerated by higher wages.
39%
32%
15%
8%4%
2%
Educational attainment
Less than primary Primary Lower secondaryUpper secondary Vocational Tertiary
2013
25%
37%
17%
10%
6%5%
2007

9
Figure 6: Public employees have disproportionately higher education
Source: 2012/13 Lao PDR Earnings and Consumption Survey.
2.2. Sectoral Employment Trends
22. Employment in Lao PDR is dominated by agriculture, although we observe a
significant structural transformation toward services. In 2012/13, 60 percent of workers were
engaged in agriculture, down from 71 percent in 2007/08 (see Annex 1, Table 1.3). The services
share of employment, meanwhile, increased from one fifth to one quarter during the same period,
driven by an increase in private sector service jobs, particularly in wholesale and retail trade,
accommodation and food services, construction, and financial and insurance activities. For
example, the number of net jobs added to the wholesale and retail trade sector between 2007/08
and 2012/13 was 31 thousand, compared to 21 thousand net jobs added in accommodation and
food services, 15 thousand in construction, and nearly 13 thousand in financial and insurance
activities.7 The remaining sectors account for very small shares of total employment: less than 1
percent of workers are employed in mining, 1.5 percent in garment manufacturing, and about 5
percent in other manufacturing. Garment manufacturing employment is predominantly female,
accounting for 3.1 percent of total female employment, compared to 0.4 percent of male
employment. Gender differences are quite small for all other sectors.
23. The shift toward non-farm activities was not accompanied by a significant shift from
rural to urban employment. About 29 percent of the workforce were located in urban areas in
2012/13, the same as in 2007/08, and only 12 percent resided in Vientiane capital (also
unchanged between 2007/08 and 2012/13; Figure 7). This means that rural workers are finding
non-farm employment without migrating to urban centers – or at least without permanently
migrating to cities. Anecdotal evidence based on private sector consultations suggests that
garment factories mostly hire young women from rural areas where there are few alternative job
7 Note that the weights used to derive employment levels are at the household level.
0%
20%
40%
60%
80%
100%
Private Public SOE Civil servant Urban Rural
Pe
rce
nt
Educational attainment by population groups, 2013
Less than primary Primary Lower-secondary
Upper secondary Vocational Tertiary

10
prospects beyond agriculture or migrating to Thailand. Moreover, rural areas closest to the Thai
border are much more dependent on permanent and temporary outmigration because of the
significantly higher wages in Thailand compared to local jobs. The wage gap is large even when
comparing unskilled work in Thailand to relatively attractive jobs in Vientiane. In the largest
garment firms, workers tend to live on site and work for a limited period (averaging less than one
year) before returning to their villages.
Figure 7: Shift out of agriculture toward services, but little shift from rural to urban
Source: 2007/08 and 2012/13 Lao PDR Earnings and Consumption Survey.
24. Net job creation has been driven by the services sector, more than offsetting the large
net job losses in agriculture and manufacturing (Table 1). Between 2007/08 and 2012/13,
over 90 thousand jobs were created in Lao PDR. This is in spite of the agriculture, forestry and
fishing sector contracting by 97 thousand jobs, and the net loss of 11 thousand manufacturing
jobs (despite strong job gains in beverages, wearing apparel, furniture, and repair and installation
of machinery and equipment). Manufacturing job losses occurred primarily in textiles (-10,408),
leather and related products (-3,082), wood and wood products (-12,294), and fabricated metal
products (-4,274). Construction, trade, hotels and restaurants and public administration were all
important for job creation, and other services were the most important job creator.
25. The small share of manufacturing jobs and their relative stagnation since 2007/08
suggests a lack of investment to increase the number of firms or to expand employment in
existing manufacturing firms. Whereas labor regulations in Lao PDR do not seem to act as a
binding constraint on hiring, there is anecdotal evidence of confusion surrounding the
implementation of the new minimum wage regulation which could diminish labor demand. This
suggests an important role for the Ministry of Labor for outreach and clarification for employers.
There may be other business climate challenges that present larger impediments to firm creation
and expansion, but these are not addressed here (see for example World Bank (2011b), World
Bank (2014a), World Bank (2014b) and World Bank (2015)).

11
Table 1: Net job creation at the sectoral level, 2007/08-2012/13
Sector
Job creation
2007/08-12/13
Agriculture, Forestry and Fishing -96,849
Mining and Quarrying 5,657
Manufacturing -11,238
o/w Garments 6,187
Construction 15,032
o/w Construction of building 24,662
o/w Civil engineering 6,836
Specialized construction activities -16,467
Wholesale and Retail Trade; Repair of Motor Vehicles and
Motorcycles 31,102
Accommodation and Food Services Activities 21,390
Public Administration and Defense, Compulsory Social Security 25,092
Other Services 101,703
Total 91,889
Source: Authors’ calculations from the 2007/08 and 2012/13 LECS
26. Although the survey data do not allow us to measure the extent of informality using the
traditional definition (i.e., employees with access to social security or employers or own
account workers in a registered business), the predominance of farming and services jobs –
both low productivity – suggests that a significant share of employment is informal.
Disaggregating by employment status, over 40 percent of employed workers are in unpaid family
work, and another 40 percent are own-account workers (Figure 8). About 9 percent of Lao
PDR’s labor force are private wage employees (which could be formal employment in registered
firms, or informal wage work), and 8 percent are employed by the public sector (1 percent in
state owned enterprises, 7 percent as civil servants), with men and women equally represented.
Figure 8: Employment is predominantly informal
Source: 2010 Lao PDR Labor Force and Child Labor Survey;
2012/13 Lao PDR Earnings and Consumption Survey.

12
2.3. Productivity and Average Wages
27. The sectoral distribution of employment stands in stark contrast to the sectoral
decomposition of GDP (and value added) and the composition of exports, suggesting that
labor is not optimally allocated to the most productive or export-oriented sectors. As
discussed in detail in Chapter 3 below, Lao’s exports are mainly concentrated in mineral
products and base metals, neither of which is labor intensive, reflected in the high labor
productivity of the mining sector. Mining value added per worker is 19 times higher than that of
the economy at large (i.e., aggregate VA per worker), and increased in real terms by 3.4 percent
on average between 2007/08 and 2012/13 (Table 2). Electricity, gas and water supply come a
close second, with sectoral labor productivity 17 times higher than the average of the economy,
and growing 8.2 percent per year between 2007/8 and 2012/13. Agriculture, forestry and fishing
has the lowest labor productivity in the Lao economy while employing the largest share of
workers who provide more than half of the economy’s total work hours (World Bank 2014b).
Education and other social services and hotels and restaurants also have very low productivity.
Textiles and garments account for a tenth of exports, but employ an even smaller share of the
labor force. According to the LECS 4 and 5 survey data, the number of garment jobs (textiles
and wearing apparel) declined from 66,746 in 2007/08 to 62,526 in 2012/13, but this decline was
due to negative job growth in textiles, contracting by 10,408 workers, while jobs in the wearing
apparel sector increased by 6,187.
28. Manufacturing productivity increased significantly since 2007/08 as sectoral
employment contracted. The national accounts value-added data do not allow us to
disaggregate between garment and other manufacturing output, but the wage and employment
data suggest that gains in value-added per worker were likely driven by other
manufacturing, where employment contracted concurrent with a 7.1 percent increase in
the average real wage. Garment wages grew relatively slower, averaging 2.6 percent per
year in real terms. Whereas this translates into significant welfare gains for garment workers,
the relative gains are weak compared to other sectors. Garment workers at the upper end of the
education distribution benefited more than their unskilled counterparts, however, as wage growth
for garment workers with a vocational degree averaged 14 percent per year. Although these wage
trends are consistent with reported shortages of skilled labor in garments, they also raise
questions about why garment employers struggle to retain new sector entrants, reflected by high
turnover rates. New entrants generally lack a secondary or vocational degree, and require
employer-provided training. If firms want to retain their trained workers, they could offer higher
wages but do not. One potential explanation is that recruiting and training costs are low, and
employers would rather bear these costs than offer higher wages. Alternatively, if profit margins
are very small, it may not be feasible for firms to raise wages adequately to compete with
alternatives (e.g., higher wages in Thailand) or to compensate for the unpleasant nature of
factory work. Limited career mobility prospects and/or minimal knowledge spillovers to other
occupations also act as impediments to attracting and retaining productive workers.8
8 See World Bank (2012b).

13
Table 2: Real output per worker and real wages experienced robust growth, but varied by sector Sector Real
Labor Productivity
(Value Added/Worker)
Annual Average
Growth
2007/08-2012/13
2007/08
(2002 Kip)
2012/13
(2002 Kip)
Real (2002)
VA/
Worker
Real
(2002)
Wages
Agriculture, Forestry and Fishing 3,746,871 4,558,711 4.0 10.2
Mining and Quarrying 183,992,736 217,009,633 3.4 18.4
Manufacturinga 10,511,264 17,052,103 10.2 6.3
Electricity, Gas and Air-conditioning Supply; Water
Supply; Sewage, Waste Management and Remediation
Activities 124,264,782 184,290,557 8.2 4.8
Construction 10,581,651 22,867,669 16.7 7.9
Wholesale and Retail Trade; Repair of Motor Vehicles
and Motorcycles; Other Services 15,852,896 19,431,128 4.2 7.4
Accommodation and Food Services Activities 14,336,576 8,060,957 -10.9 -0.7
Transportation and Storage; Information and
Communications 24,177,380 32,816,684 6.3 3.2
Financial and Insurance Activities 158,851,651 80,276,992 -12.8 11.4 Real Estate Activities; Professional, Scientific and
Technical Activities; Administrative and Support Service
Activities 16,948,958 21,476,844 4.8 5.2 Public Administration and Defense, Compulsory Social
Security 22,150,428 30,354,205 6.5 Education; Human Health and Social Work Activities;
Arts, Entertainment and Recreation 7,280,585 6,005,364 -3.8
Activities of Households as Employers 21,690,873 12,723,531 -10.1 6.9
TOTAL 8,051,122 11,445,514 7.3 7.3 a Note that real garment wages grew by 2.6 percent between 2007/08 and 2012/13, while real other manufacturing
wages grew by 5.9 percent. Real labor productivity growth is the annual average change in sector value added per
worker denominated in real 2002 Kip; wage growth is the change in the sector average wage denominated in real
2002 Kip. Value-added for 2007/08 is averaged over 2007 and 2008, and value-added for 2012/13 is averaged over
2012 and 2013.
Source: 2012/13 Lao PDR Earnings and Consumption Survey and United Nations National Accounts.
29. The low proportion of manufacturing jobs and their relative stagnation since 2007/08
suggests that Lao producers have not succeeded in attracting FDI to expand garment and
other manufacturing operations, and existing Lao manufacturing firms have not expanded
production or created jobs as fast as other segments of the economy. Attracting new
investment could help shift garment production toward higher value products and markets,
requiring more skilled labor in better and more remunerative jobs. The potential reasons why
such investment has not materialized could be the subject of future research in order to
understand which sectors are better performing and may offer more opportunities to compete in
the future. In the next chapter, we explore the competitiveness of Lao manufacturing in the
international context.

14
30. Real wages have largely experienced strong growth over time, averaging 7.3 percent
annual growth between 2007/08 and 2012/13 (Table 2).9 The data
10 show that real mining
wages grew fastest, averaging 18 percent annual growth, although real agriculture wage growth
was not far behind at 10 percent. Service sector and other manufacturing wages grew in the
range of 5-7 percent annually in real terms, but garment sector wage growth was weaker, and
hotels and restaurant wages experienced negative real growth. The cross-sector variations in
wage and productivity growth provide a mixed picture. Real value added growth was highest in
construction, averaging 20 percent per year between 2007/08 and 2012/13, with real wage
growth only 7 percent per year. Real value added growth in the agriculture, forestry and fishing
sector instead was only 3.1 percent per year, partly explained by the reduction in agricultural
employment, but agriculture wages grew by 10 percent per year. Real rural wage growth
exceeded urban wage growth, although urban workers still earn relatively more (64 percent on
average).
31. Comparing wage levels across sectors and skill profiles, workers employed in mining
earn the highest wages, in particular workers with a tertiary education. In 2012/13, the
mining sector paid on average 3.1 million Kip in weekly nominal wages, while mining workers
with a tertiary education were receiving on average 9.7 million Kip weekly. Agriculture wage
workers (i.e., laborers employed by other farmers, not self-employed) and garment workers
earned the least, with weekly wages averaging 1.3 million Kip in 2012/13, followed by service
sector workers (1.5 million Kip) and other manufacturing workers (1.9 million Kip).
32. Women earn less than men across education levels. In 2007/08, for example, the average
male wage was 32 percent higher than the average female wage, but by 2012/13 the disparity
was 22 percent. Although this suggests a narrowing of the gender wage gap, the regression
analysis below shows that, controlling for other factors, the gap actually widened. The gender
gap is largest at the low end of the education distribution (e.g., 76 percent for workers with a
primary degree) but declines for more educated workers (e.g., 27 percent for tertiary graduates).
33. The average earnings of vocational graduates have grown over time compared to upper
secondary and tertiary graduates. In 2007/08 female workers who completed upper secondary
school earned higher wages than those who completed vocational school, but the premium
effectively disappeared by 2012/13. Similar trends were observed in mining (where the premium
went from 185 percent to 2 percent) and services (where it went from +17 percent to -7 percent).
This switch suggests that productive activities in these sectors may have become more skill-
intensive as they shifted to higher value or quality of outputs, generating greater demand for
vocational graduates. An alternative explanation – that the relative quality of the vocational and
secondary education streams changed – is also possible although unlikely in the short period of
time. A third possible explanation is that the returns to secondary education declined due to the
increased supply of secondary graduates. The data do not allow us to identify the main
explanatory factor. In the garment sector, the value of vocational skills has increased
9 Note that survey data on the incomes of farmers and own-account workers tends to be incomplete or unreliable,
limiting the extent to which the analysis can address income challenges for a large segment of the labor market. The
wage analysis herein necessarily focuses on wage earners in sectors dominated by wage jobs. 10
Nominal wage data from the LECS 2007/08 and 2012/13 are converted to real 2002 wages using the World
Development Indicators’ CPI. Note that non-wage agriculture income is excluded, as is income earned by own-
account workers.

15
significantly, as mentioned above, growing faster than other education categories. Annex 2
Tables 2.1-2.3 report real weekly wages by sector and region for the different survey periods.
34. Workers employed in state owned enterprises (SOEs)11
earn substantially higher wages
than other public sector (i.e., civil servants) and private sector employees (Table 3). This
may or may not reflect differences in productivity however, as public wages are not necessarily
market driven.12
Whereas the average public sector wage is close to that of private sector wage
employees (the latter was 1.6 million Kip per week in 2012/13), the wage premium for SOE
workers is very high compared to civil servants (SOE employees earn 2.3 million Kip per week
on average, compared to 1.3 million Kip for civil servants), and this trend holds across sectors
(with the exception of agriculture). The premium is especially high for those in other
manufacturing, and for those with a tertiary degree. Private sector wages increase linearly with
educational attainment: private employees with a tertiary degree earn over three-quarters more
on average than a worker with a primary education.
Table 3: SOEs pay more on average and attract more educated workers (2012/13)
Average
nominal wage
(non-SOE)
Average
nominal wage
(SOE)
Share of
employees in
SOEs (%)
Sectoral
distribution of
SOE
employees (%)
Average
years of
schooling
(non-
SOE)
Average
years of
schooling
(SOE)
Agriculturea
1,247,430
1,200,000 0.24 6.90 4.5 3.9
Garment
1,205,463
1,454,974 1.87 2.37 6.2 8.0
Mining
2,462,344
2,750,000 4.28 1.47 7.0 9.3
Other
manufacturing
1,370,358
3,208,001 3.84 13.98 6.6 9.6
Services
1,433,563
1,794,501 3.40 75.28 9.0 10.1
a Agriculture wage employees, excludes farmers.
Source: 2012/13 Lao PDR Earnings and Consumption Survey.
35. Given the lower wages of civil servants, but higher likelihood of having received a tertiary
education, this may dampen the returns to a tertiary education in Lao PDR. In the analysis that
follows, we estimate the size of wage premia for different sectors of work and different levels of
education using regression analysis.
11
Examples of SOEs in Lao PDR: Lao Airlines, Electricite du Laos (Electricity company), Nam Pa Pa (Water
supply company), ETL Public Company (Telecom company). 12
In fact, civil servant salaries experienced two consecutive years of 35-40 percent nominal increases in FY2013
and FY2014 (World Bank 2014b).

16
2.4. Determinants of Earnings
36. Our regression analysis on the determinants of earnings uses Mincer-type specifications to
test for the factors driving wage differences for wages reported in the 2007/08 and 2012/13 Lao
PDR Earnings and Consumption Surveys (LECS waves 4 and 5) and the 2010 Lao PDR Labor
Force and Child Labor Survey (see Annex 3 for details). We estimate each year separately, and
note that differences in the survey questionnaires and sampling will affect comparability. There
are four categories of wage earners: civil servants, employee of public and private work13
;
employee of a private business, and employee of a state enterprise. We exclude self-employed,
unpaid family workers, and employees not paid a wage (i.e., we exclude earnings from
household production and own-account workers and farmers).14
37. There are positive returns to years of schooling, but these seem to have declined since
2007/08 (see tables in Annex 3 for the regression results). We also note a large but declining
urban bias in wages, about 72 percent higher in 2007/08, 23 percent in 2010, but falling to only
4 percent in 2012/13, and losing statistical significance (controlling for other factors such as
sector, gender, years of schooling and enterprise type (i.e., public vs. private)). Wages in
Vientiane Capital are statistically higher than wages elsewhere – 15 percent higher in 2012/13 –
all else being equal.
38. When considering levels of education completed rather than years of education
attended, higher levels of education are compensated with higher wages. In each survey
year, returns to education are significant at all levels above primary and increase linearly, such
that each level of education is compensated more than the one below it, and tertiary education
has the highest returns. The time trends are difficult to ascertain because of changes in the
questionnaires and the different sample frames used in the household and labor force surveys.
The best comparison is regression 2 in Tables 3.4-3.6 in Annex 3, which controls for sector of
work; the results indicate that the returns to each level of education declined between 2007/08
and 2012/13.15
Whereas in 2007/08 the lower and upper secondary degrees were equally
remunerated (equivalent to 34 percent higher than a worker with less than a primary degree), in
2012/13 there was a wider wage differential (lower secondary earned 16 percent more than less
than primary, while upper secondary earned 21 percent more). The point estimate on the
vocational degree did not change much (25 to 27 percent) but became significant in 2012/13.
And for those with a tertiary degree, the premium relative to less than primary fell from 58
percent in 2007/08 to 39 percent in 2012/13, which is consistent with an increasing supply of
skilled labor to meet current demand. The education data do not allow us to determine which
types of tertiary degrees have the highest returns (e.g., an engineering degree versus a business
degree).
13
Note that this category may reflect workers who hold at least 2 jobs, one in the public sector and one in the private
sector. The survey questionnaire does not enable a disaggregation by job. 14
Excluding non-wage earners may bias the returns to education, although the direction of the bias is likely to be
mixed (unskilled farmers may have very low earnings, while employers or self-employed workers may have very
high earnings, despite low levels of education). The regressions also exclude individuals who work more than one
job, because we cannot disaggregate wages by activity. Workers with missing observations for key variables such as
years of education are also excluded from the sample. 15
The returns are higher across the board for the 2010 labor force survey data.

17
39. The gender wage gap actually increased between 2007/08 and 2012/13, controlling for
other factors, in contrast to the nominal average wage trends reported above. In the regressions
that control for sector but exclude urban, province or public-private controls (column 2 in Annex
3 Tables 3.1 and 3.4) we find that in 2007/08 women earned 14-15 percent less than men with
identical education and sector of work, and this gap widened to 18-19 percent in 2012/13. When
other controls are introduced (last column of Table 3.6), the gender wage gap is estimated to be
20 percent in 2012/13.
40. The marginal negative returns to working in the garment sector (relative to mining)
have remained steady since 2007/08. In 2012/13, a garment sector worker with an otherwise
identical profile in terms of education, gender and place of work earned 72 percent less
compared to a miner. The returns to agricultural work are even lower, albeit much improved
from 2007/08 (86 percent lower than mining in 2012/13).
41. Civil servants earn significantly less than their SOE counterparts. Whereas public
employees earn about one-fourth less than private sector workers, controlling for sector and all
other factors (last column of Table 3.6), the positive wage premium for SOE employees is over
20 percent, whereas civil servants earn a negative wage premium of 40 percent.
42. These wage regressions point to important earnings differences across sectors, education
levels, firm type and location. The main conclusions point to mining as the best remunerated
sector, the importance of education at all levels, particularly at the tertiary level, the higher
wages in Vientiane Capital, and the disproportionate advantages to working in an SOE.

18
Chapter 3. Labor Sophistication and Competitiveness in Export Markets
3.1. Snapshot of Lao PDR’s Export Basket
43. According to mirror UN Comtrade data, Lao PDR’s goods exports (manufacturing plus
non-manufacturing) are dominated by mineral products, base metals and wood and pulp,
none of which is particularly labor intensive. Textile and garment exports, by contrast,
rank fourth, accounting for only 10 percent of total exports in 2012. The value of textile and
garment exports has increased steadily over the last decade, driven by exports to the EU.
Disaggregating Lao exports by destination market shows that garments, vegetables and
foodstuffs are the main exports to the EU, mineral products (mostly copper ores and
concentrates) are destined to China, and base metals, mineral products and wood are the main
exports to EAP countries (see Figure 9). Mirror data are used to describe the sectoral
composition of Lao PDR’s export (using import data of formal imports reported by trading
partners). Especially for wood exports, these figures will cover exports leaving Lao PDR
informally due to the ban on logging and timber exports but which are declared as imports in
neighboring EAP countries. But they do not cover goods that are secretly moved across borders.
Figure 9: Sectoral composition of Lao PDR’s export basket over time and by destination market,
in USD million

19
Notes: EU28 includes Austria, Belgium, Bulgaria, Cyprus, Croatia, Czech Republic, Denmark, Estonia, Finland,
France, Germany, Greece, Hungary, Ireland, Italy, Latvia, Lithuania, Luxembourg, Malta, Netherlands, Poland,
Portugal, Romania, Slovakia, Slovenia, Spain, Sweden, and United Kingdom. EAP* includes Samoa, American
Samoa, Cambodia, Fiji, Indonesia, Kiribati, Malaysia, Marshall Islands, Micronesia, Mongolia, Myanmar, Palau,
Papua New Guinea, Philippines, Solomon Islands, Thailand, East Timor, Tonga, Tuvalu, Vanuatu, Vietnam, Hong
Kong, Japan, South Korea, Macao, and Brunei.
Base metal export growth in 2005, 2006, 2007 and 2008 is being driven by exports of refined copper (HS 740311) to
Thailand and a lesser extent Vietnam. Mineral products export growth in 2009, 2010 and 2012 is being driven by
exports of electrical energy (HS 271600) to Thailand and copper ores and concentrates (HS 260300) to China.
Source: World Bank Staff calculations based on mirror data from UN Comtrade.
3.2. Measuring the Labor Content of Exports
44. Empirical studies show that what a country exports and where it exports affect the level and
composition of labor demand in the exporting country and its economic growth performance.
The structure of a country's exports – that is, what types of products it exports, in which sectors
and with what levels of value-added – affects the types of labor needed to produce these exports.
Moreover, the export structure tends to vary by destination market. Exporting to high-income
countries, where consumers have a relatively high preference for quality, stimulates the
production of high quality goods, and increases the demand for skilled labor (Brambilla et al.
2012). Hausmann, Hwang and Rodrik (2007) provide evidence that the types of products
countries export matter for economic growth. And Verhoogen (2008) shows that more
productive plants produce and export higher-quality goods than less productive plants, and they
pay higher wages to maintain a higher-quality workforce.
45. The evolution of Lao PDR’s export basket in terms of product mix, product sophistication
and destination markets is assessed to estimate its labor content and the implication for job
creation and job quality. Understanding the position of Lao exports vis-à-vis competing
exporters and how this has changed over time helps shed light on the challenges to diversifying
Lao export markets and products with a view to increasing export-driven labor demand.
Adapting the Hausmann, Hwang and Rodrick (2007) measure of export sophistication, and in
line with Shirotori, Tumurchudur and Cadot (2010), we develop indirect measures of the labor-

20
related sophistication of Lao PDR’s export basket. We construct five indices or "EXPYs"16
that
measure the following aspects of labor sophistication: (i) median wage, (ii) median value added
per worker, (iii) ratio of skilled to total workers, (iv) years of schooling, or “human capital”, and
(v) capital stock per worker. These EXPYs reflect the global trade-weighted average labor
content of the exports that appear in Lao PDR’s export basket. The logic behind these measures
is that labor market and other characteristics of the economies that intensively export a given
product provide information about the implications of specializing in certain products exported
to certain markets, and will determine how export growth will contribute to job creation, wages
and skill mix. Based on these observations, it is possible to draw inferences about how product
and regional trade patterns can impact employment, wages and skill demand in Lao PDR within
the regional competitive context.
46. For each of the five EXPY indices, we compare the time trends of their levels, both in the
aggregate (i.e., for all exports) but also separated by destination market (i.e., calculating
destination-specific EXPYs to reflect the export baskets to particular destination markets). We
compare Lao exports destined to the European Union (EU2817
), the US, China, India and EAP.18
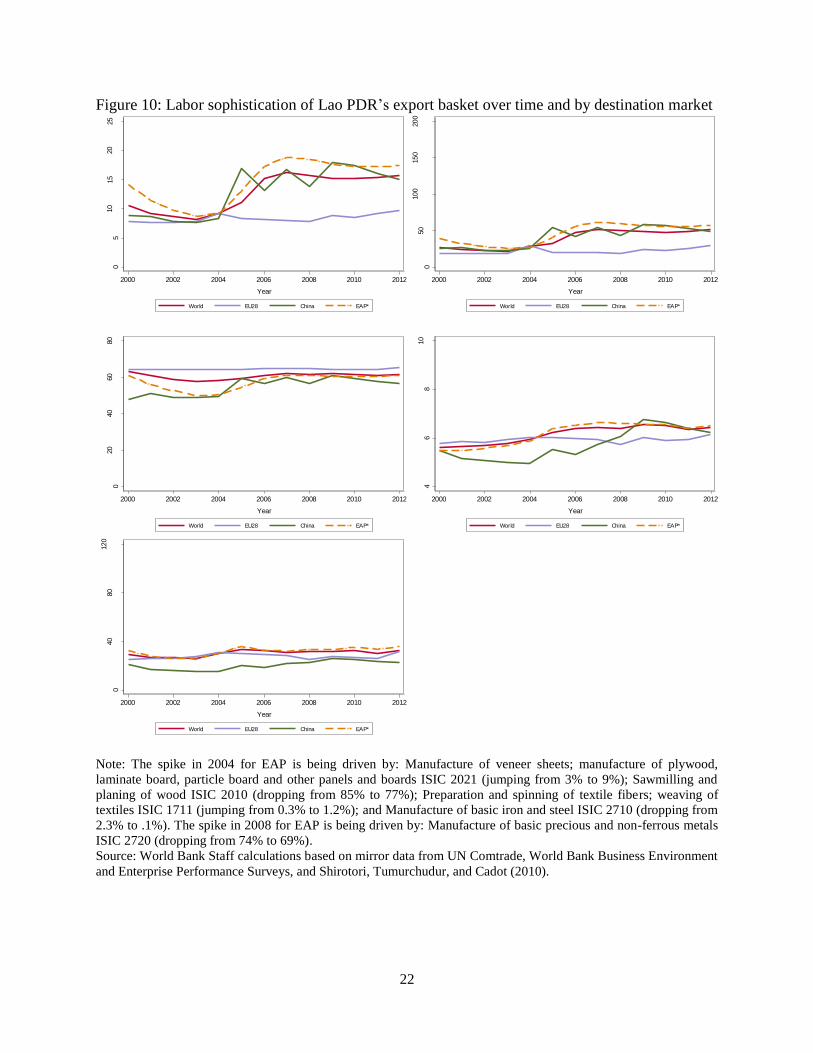
The results for each of the five EXPYs for Lao PDR are shown in separate panels in Figure 10.
By comparing the export-share-weighted EXPYs over time and to different destination markets,
we gain insight into recent trends in the labor sophistication of Lao’s total merchandise exports,
including manufactured exports. And comparing these time trends with exports from similar
emerging economies such as Senegal, Cambodia, Indonesia, Bangladesh and the Philippines (in
Figure 11) allows us to make bilateral comparisons of labor content and product sophistication.
47. The trends in Figure 10 indicate that the level of labor sophistication – as measured by the
wage, value-added, share of skilled workers, and human capital – embedded in Lao exports
to the world (solid red line) has changed little since 2006, although there was some
improvement between 2003 and 2006. Lao exports to EAP reflect higher wage content, value-
added and skill content compared to the basket of Lao exports to other markets, and Lao exports
to India have relatively higher wage content and value added compared to exports to the EU and
US. Lao exports to China, by contrast, tend to have a lower embedded skill content (measured by
a lower ratio of skilled workers and by lower average years of schooling), as well as a low
physical capital content, explained by the predominance of mineral and base metal exports. We
observe the least improvement in labor sophistication – for all five measures – in exports
destined to the EU, which are mostly garments (recall from Figure 9).
16
EXPYs can be interpreted as the export share-weighted average labor market outcome associated with Lao PDR’s
export basket, and are calculated using two-steps. The first step uses Comtrade data on global exports and assigns to
each product a PRODY value for the five indices, namely a wage PRODY reflecting the average international wage
associated with that export, a value-added PRODY reflecting the average value added for that product, and so on for
the average skill share, the average years of schooling and the average capital content. Each of these PRODYs is the
global trade-weighted average, covering all countries in the world that export the product. The second step then
weights the PRODYs appearing in Lao PDR’s export basket by the share of each product in Lao PDR’s total
exports, denoted EXPY. 17
EU28 includes Austria, Belgium, Bulgaria, Cyprus, Croatia, Czech Republic, Denmark, Estonia, Finland, France,
Germany, Greece, Hungary, Ireland, Italy, Latvia, Lithuania, Luxembourg, Malta, Netherlands, Poland, Portugal,
Romania, Slovakia, Slovenia, Spain, Sweden, and United Kingdom. 18
EAP* includes Samoa, American Samoa, Cambodia, Fiji, Indonesia, Kiribati, Malaysia, Marshall Islands,
Micronesia, Mongolia, Myanmar, Palau, Papua New Guinea, Philippines, Solomon Islands, Thailand, East Timor,
Tonga, Tuvalu, Vanuatu, Vietnam, Hong Kong, Japan, South Korea, Macao, and Brunei.

21
48. Comparing the labor content of Lao PDR’s export basket to the export baskets of comparator
countries Senegal, Cambodia, Indonesia, Bangladesh and the Philippines (as measured by the
EXPYs in Figure 11), we observe that Indonesian and Philippine exports are more sophisticated,
reflected by higher embedded wage, value-added and skill content than Lao exports, and higher
physical capital content. Senegalese exports also compare favorably to Lao exports, at least in
terms of wages, value-added and physical capital content. Lao’s export basket is more
sophisticated than those of Bangladesh and Cambodia, however, although this is not the case
when we consider only textile and apparel products, which show very similar (low) levels of
sophistication. In terms of skill content, Lao exports have the lowest average ratio of skilled
workers relative to all the other comparator countries. These estimates of labor sophistication
suggest that Lao PDR has maintained its relative ranking of competitiveness over the past
decade, but is showing little progress in terms of closing the competitiveness gap.
22
Figure 10: Labor sophistication of Lao PDR’s export basket over time and by destination market
Note: The spike in 2004 for EAP is being driven by: Manufacture of veneer sheets; manufacture of plywood,
laminate board, particle board and other panels and boards ISIC 2021 (jumping from 3% to 9%); Sawmilling and
planing of wood ISIC 2010 (dropping from 85% to 77%); Preparation and spinning of textile fibers; weaving of
textiles ISIC 1711 (jumping from 0.3% to 1.2%); and Manufacture of basic iron and steel ISIC 2710 (dropping from
2.3% to .1%). The spike in 2008 for EAP is being driven by: Manufacture of basic precious and non-ferrous metals
ISIC 2720 (dropping from 74% to 69%).
Source: World Bank Staff calculations based on mirror data from UN Comtrade, World Bank Business Environment
and Enterprise Performance Surveys, and Shirotori, Tumurchudur, and Cadot (2010).
05
10
15
20
25
EX
PY
media
n W
AG
E (
PP
P t
housands)
2000 2002 2004 2006 2008 2010 2012
Year
World EU28 China EAP*
050
100
150
200
EX
PY
media
n v
alu
e a
dded (
PP
P t
housands)
2000 2002 2004 2006 2008 2010 2012
Year
World EU28 China EAP*
020
40
60
80
EX
PY
skill
ed w
ork
ers
(share
of
work
forc
e)
2000 2002 2004 2006 2008 2010 2012
Year
World EU28 China EAP*
46
810
EX
PY
hum
an c
apital (y
ears
of
school)
2000 2002 2004 2006 2008 2010 2012
Year
World EU28 China EAP*
040
80
120
EX
PY
physic
al capital per
work
er
(US
D t
housands)
2000 2002 2004 2006 2008 2010 2012
Year
World EU28 China EAP*

23
Figure 11: Labor sophistication of Lao PDR’s export basket to the world over time compared to
other emerging markets
Note: SEN indicates Senegal, KHM is Cambodia, IDN is Indonesia, BGD is Bangladesh and PHL is the Philippines.
Source: World Bank Staff calculations based on mirror data from UN Comtrade, World Bank Business Environment
and Enterprise Performance Surveys, and Shirotori, Tumurchudur, and Cadot (2010).
49. The above-described trends in the labor sophistication of Lao PDR’s export basket compared
to other countries’ exports and by destination markets do not point to particular products or
markets that have the potential to spur labor demand in Lao PDR. Whereas the preceding
analysis compares the weighted average values of these export-labor indicators, the next step is
to examine the distribution of these same indicators across the entire range of products that Lao
PDR exports, in order to differentiate quality differences across product lines. We therefore shift
05
10
15
20
25
EX
PY
media
n w
age (
PP
P t
housands)
2000 2002 2004 2006 2008 2010 2012
Year
LAO KHM IDN BGD PHL
050
100
150
200
EX
PY
media
n v
alu
e a
dded (
PP
P t
housands)
2000 2002 2004 2006 2008 2010 2012
Year
LAO KHM IDN BGD PHL
020
40
60
80
EX
PY
skill
ed w
ork
ers
(share
of
work
forc
e)
2000 2002 2004 2006 2008 2010 2012
Year
LAO KHM IDN BGD PHL
46
810
EX
PY
hum
an c
apital (y
ears
of
school)
2000 2002 2004 2006 2008 2010 2012
Year
LAO KHM IDN BGD PHL
040
80
120
EX
PY
physic
al capital per
work
er
(US
D t
housands)
2000 2002 2004 2006 2008 2010 2012
Year
LAO KHM IDN BGD PHL

24
our attention to the labor content of Lao PDR’s export basket across the entire distribution of
exports, measured for each EXPY characteristic (i.e., median wage, value added, skill share,
human capital and physical capital), which better reflects heterogeneity in the export basket mix.
To do this, we use cumulative distribution functions to plot the PRODY indicators across all
products (rather than the weighted average of all PRODY indicators – i.e. the EXPYs – used
above). This allows us to compare the evolution of the labor sophistication of the entire basket
between two points in time, and we can differentiate differences at the lower or upper ends of the
distribution.
50. Between 2000 and 2012, we observe that Lao exports became more sophisticated,
reflected in relatively higher wages, value-added and human capital content across the
entire distribution of exports (Figure 12). The entire distribution of PRODYs in 2012 lies to
the right of the distribution in 2000, which implies that a greater share of Lao PDR’s exports are
in products associated with higher wages, value-added and human capital content. For example,
in 2000, about 80 percent of Lao PDR’s exports were associated with products that paid at most
an annual wage equivalent to USD10,000. In 2012, this share had fallen to 60 percent, meaning
that a greater share of Lao PDR’s exports were associated with countries that pay higher wages.
The ratio of skilled workers decreased, however, except at the top end of the distribution. Lao PDR is not increasing its exports of goods that are produced with more skilled workforces.
The physical capital content of the Lao export basket experienced some increase, but in the lower
portion of the distribution only.
Figure 12: Cumulative distribution of Lao PDR’s export basket to the world in 2000 and 2012
0.2
.4.6
.81
Cum
ula
tive d
istr
ibution
8 9 10 11 12 13
PRODY median wage (PPP thousands)
2000 2012
0.2
.4.6
.81
Cum
ula
tive d
istr
ibution
8 9 10 11 12 13
PRODY median value added (PPP thousands)
2000 2012

25
Source: World Bank Staff calculations based on mirror data from UN Comtrade, World Bank Business Environment
and Enterprise Performance Surveys, and Shirotori, Tumurchudur, and Cadot (2010).
51. Looking at the 2012 data for Lao exports to the EU28, China and EAP, Figure 13 illustrates
that across most products in the distribution, Lao exports to the EU (dominated by garments)
are similar to those produced by countries that pay lower wages and have lower value-
added compared to Lao exports to China and EAP (dominated by mineral and base metal
exports). For example, 80 percent of Lao exports to the EU are products associated with average
wages around $9,000 per year or less. On the other hand, 90 percent of exports to EAP are
products associated with average wages of $10,300 per year. Lao exports to the EU also embody
a higher level of skill. Lao exports to EAP rank highest in labor sophistication, reflected by
higher wages, value-added and human as well as physical capital for most exports.
0.2
.4.6
.81
Cum
ula
tive d
istr
ibution
0 .2 .4 .6 .8 1
PRODY skilled workers (share of workforce)
2000 2012
0.2
.4.6
.81
Cum
ula
tive d
istr
ibution
2 4 6 8 10 12
PRODY human capital (years of school)
2000 2012
0.2
.4.6
.81
Cum
ula
tive d
istr
ibution
8 9 10 11 12 13
PRODY physical capital per worker (USD thousands)
2000 2012
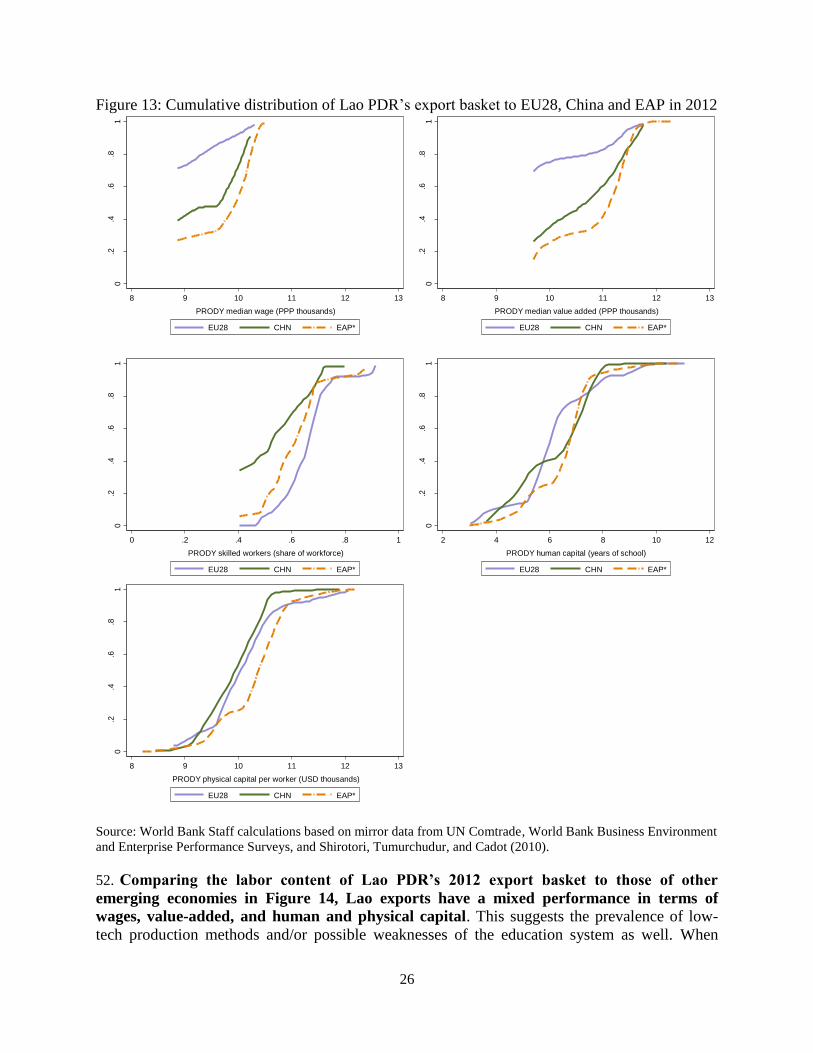
26
Figure 13: Cumulative distribution of Lao PDR’s export basket to EU28, China and EAP in 2012
Source: World Bank Staff calculations based on mirror data from UN Comtrade, World Bank Business Environment
and Enterprise Performance Surveys, and Shirotori, Tumurchudur, and Cadot (2010).
52. Comparing the labor content of Lao PDR’s 2012 export basket to those of other
emerging economies in Figure 14, Lao exports have a mixed performance in terms of
wages, value-added, and human and physical capital. This suggests the prevalence of low-
tech production methods and/or possible weaknesses of the education system as well. When
0.2
.4.6
.81
Cum
ula
tive d
istr
ibution
8 9 10 11 12 13
PRODY median wage (PPP thousands)
EU28 CHN EAP*
0.2
.4.6
.81
Cum
ula
tive d
istr
ibution
8 9 10 11 12 13
PRODY median value added (PPP thousands)
EU28 CHN EAP*
0.2
.4.6
.81
Cum
ula
tive d
istr
ibution
0 .2 .4 .6 .8 1
PRODY skilled workers (share of workforce)
EU28 CHN EAP*
0.2
.4.6
.81
Cum
ula
tive d
istr
ibution
2 4 6 8 10 12
PRODY human capital (years of school)
EU28 CHN EAP*
0.2
.4.6
.81
Cum
ula
tive d
istr
ibution
8 9 10 11 12 13
PRODY physical capital per worker (USD thousands)
EU28 CHN EAP*

27
considering the subset of textile and apparel exports separately, Lao’s exports are even less well
positioned vis-à-vis comparator countries than the basket as a whole.
Figure 14: Cumulative distribution of Lao PDR’s export basket to the world compared to other
emerging markets in 2012
Source: World Bank Staff calculations based on mirror data from UN Comtrade, World Bank Business Environment
and Enterprise Performance Surveys, and Shirotori, Tumurchudur, and Cadot (2010).
0.2
.4.6
.81
Cum
ula
tive d
istr
ibution
8 9 10 11 12 13
PRODY median wage (PPP thousands)
LAO SEN KHM IDN BGD PHL
0.2
.4.6
.81
Cum
ula
tive d
istr
ibution
8 9 10 11 12 13
PRODY median value added (PPP thousands)
LAO SEN KHM IDN BGD PHL
0.2
.4.6
.81
Cum
ula
tive d
istr
ibution
0 .2 .4 .6 .8 1
PRODY skilled workers (share of workforce)
LAO SEN KHM IDN BGD PHL
0.2
.4.6
.81
Cum
ula
tive d
istr
ibution
2 4 6 8 10 12
PRODY human capital (years of school)
LAO SEN KHM IDN BGD PHL
0.2
.4.6
.81
Cum
ula
tive d
istr
ibution
8 9 10 11 12 13
PRODY physical capital per worker (USD thousands)
LAO SEN KHM IDN BGD PHL

28
53. Mediocre education outcomes – whether due to inadequate quality, misalignment with labor
demand, or limited access to education services – can limit the potential sophistication of Lao
exports if exporting firms cannot recruit labor with appropriate skills, which in turn dissuades
investment in more productive technologies. Whereas Lao’s entry into the global marketplace
led to some rapid gains in the early 2000s, more recent export performance has been
lackluster and potentially reflects a weakening competitive position, at least regarding labor-
intensive exports.
54. The small profit margins in the low-value garments subsector mean that Lao producers have
little room for finding productivity gains vis-à-vis competitors such as Bangladesh and
Cambodia. Vietnam’s ongoing shift to higher value production could create space in the market
for Lao producers. A more promising strategy would focus on creating more attractive
niches or garment product lines for high income economies through e.g., upgrading labor
standards and environmental standards, helping big brand retailers and buyers to meet
their corporate social responsibility objectives. The Government has recently undertaken a
standards upgrading program with technical assistance from the World Bank and ILO to the
Labor Inspectorate of the Ministry of Labor under the auspices of the 2nd
Trade Development
Facility. This technical assistance focuses on the garment manufacturing sector.
55. Beyond garment manufacturing, Lao’s relatively low-tech export basket limits its capacity
to access higher income consumers seeking higher quality goods and services. Even within
the regional context, Lao has new opportunities to provide duty-free goods and services to its
ASEAN partners. Government policies should therefore focus on facilitating access to
technology and higher value production through for example more favorable (but still non-
distortionary) investment incentives, or more generally by easing access to formal finance such
as through banks or SME-targeted credit institutions but in the context of a level playing field.
56. The fact that over two-thirds of Lao PDR’s manufacturing workers are employed in the
garment subsector, where both wages and technology content are relatively low, implies the
need to diversify production into higher value manufacturing as well as higher value
services. Increasing productivity and job quality in both requires enhancing the quality of the
labor force. This means policies to increase educational attainment, more support for basic
education, curricula reform necessary to meet market demand including soft skills and
entrepreneurial skills, and aligning vocational training to private sector demand,
particularly export-oriented private sector demand. A large pool of skilled and competitive
labor is an essential component both for attracting investment in higher-value activities, and for
enabling firms to upgrade the quality of their goods and services.

29
Chapter 4. Export-Employment Elasticity
4.1. Comparing Exporting Behavior and Labor Demand
57. Exporting firms tend to employ more workers than non-exporters in the manufacturing
sector, according to evidence from World Bank Enterprise Surveys; this holds true in Lao
PDR as well as in a sample of comparator countries (see Annex 4 Table 4.1).19
In fact, Lao
exporting firms are about five times larger than non-exporters, and employ both skilled workers
and unskilled workers (based on number of full-time employees). The share of skilled employees
in exporting firms has increased over time, accounting for more than half of total workers in
2012. But this higher skills ratio does not seem to reflect higher product quality (based on the
preceding results). Non-exporters, by contrast, employ relatively more unskilled workers, a trend
that holds in the sample of comparator countries as well.
58. Comparing Lao PDR to its larger neighbors Vietnam and Cambodia, both of which pursued
development policies based on industrialization with particular focus on garment manufacturing
exports, we see that firm sizes are much larger in both Vietnam and especially Cambodia,
and that exporters rely disproportionately on skilled rather than unskilled labor (Annex 4
Table 4.2).
59. The findings of the 2012 and 2013 World Bank enterprise surveys indicate that Lao PDR
has a higher-than-average share of manufacturing firms that export (43 percent of Lao
PDR’s manufacturing firms export, compared to 35 percent of manufacturing firms in the full
sample; see Annex 4 Table 4.3). The manufacturing sub-sectors that are most engaged in
exporting are chemicals, electronics and garments. For example, all chemical and electronics
manufacturers and 77 percent of garment manufacturers in Lao PDR export, and most of these
firms’ production is for external markets. About half of garment manufacturers export, and
among these, they export over three-fourths of their output. This reliance on exports contrasts
with other countries in the sample, where about one-third of manufacturers export, and among
those exporters, only half of their production is destined outside the country, the other half
destined for domestic consumption. This implies a lower degree of market diversification for Lao
manufacturing production. Vietnam’s garment sector is similarly export-intensive, while
Cambodian producers demonstrate the highest degree of export orientation, particularly in the
textile and garment subsectors, but in food and other manufacturing as well (see Annex 4 Table
4.4).
60. For the World Bank Enterprise Survey sample, more than two-thirds of Lao PDR’s
manufacturing workers are employed in the garment sector, in contrast to the more
diversified distribution of manufacturing employment across subsectors in the rest of the world
19
Comparator countries are China, Belarus, Nepal, West Bank and Gaza, Georgia, Azerbaijan, Kyrgyz Republic,
Kazakhstan, Bangladesh, Armenia, Uganda, Ukraine, Uzbekistan, Mongolia, Moldova, Tanzania, Kenya, Bulgaria,
Serbia, Zambia, Bosnia and Herzegovina, Albania, Kosovo, Croatia, FYR of Macedonia, Slovenia, Montenegro,
Djibouti, Jordan, Romania, Latvia, Democratic Republic of the Congo, Tajikistan, Estonia, Hungary, Lithuania,
Poland, Slovak Republic, Turkey, Ghana and Madagascar.

30
(Table 4). How good are these jobs? Based on the wage data in the World Bank Enterprise
Survey, Lao garment workers earn more than those in the food, wood and textile subsectors, but
significantly less than in more skilled/higher value-added sectors such as chemicals and
electronics. The data also indicate that exporting firms pay more: Lao garment workers in
exporting firms earn 70 percent more on average than garment workers in non-exporting firms.20
This wage disparity is not observed in the full sample, although exporting firms do tend to pay
higher wages than non-exporting firms, and this holds for most sectors (columns 5 and 6 of
Table 4).
Table 4: Labor market characteristics of exporting vs. non-exporting manufacturing firms Lao PDR Full Sample
1 2 3 4 5 6
Total
% o/w in
Non-Exporters
% o/w in
Exporters Total
% o/w in
Non-Exporters
% o/w in
Exporters
Employment share (%)
Food 5 54 46 15 53 47
Wood products & furniture 5 44 56 3 44 56 Non-metallic and plastic
materials 8 11 52 48
Metals and machinery 1 17 52 48
Leather 1 73 27
Textiles 2 57 43 14 24 76
Garments 69 2 98 18 12 88
Electronics 3 5 37 63
Chemicals and pharmaceuticals 0 9 40 60
Auto and auto components 7 4 35 65
Other manufacturing 4 33 67
Median wage (current USD) Total Non-Exporters Exporters Total Non-Exporters Exporters
Food 3,199 2,724 3,548 4,863 4,630 5,664
Wood products & furniture 2,008 2,042 1,692 4,270 3,005 8,016 Non-metallic and plastic
materials 4,737 4,737 7,716 6,539 10,087
Metals and machinery 5,559 5,559 8,310 6,557 10,957
Leather 5,641 5,545 6,203
Textiles 3,007 4,895 1,716 5,427 4,812 6,559
Garments 4,339 2,632 4,512 5,137 5,013 5,273
Electronics 35,483 35,483 9,190 8,514 10,958
Chemicals and pharmaceuticals 7,802 7,802 7,563 5,342 10,175
Auto and auto components 5,797 5,797 7,934 7,272 9,442
Other manufacturing 8,384 7,982 10,715 Source: World Bank Staff calculations based on data from World Bank enterprise surveys for 2012 and 2013. Full
sample of countries includes China, Belarus, Nepal, West Bank and Gaza, Georgia, Azerbaijan, Kyrgyz Republic,
Kazakhstan, Bangladesh, Armenia, Uganda, Ukraine, Uzbekistan, Mongolia, Moldova, Tanzania, Kenya, Bulgaria,
Serbia, Zambia, Bosnia and Herzegovina, Albania, Kosovo, Croatia, FYR of Macedonia, Slovenia, Montenegro,
Djibouti, Jordan, Romania, Latvia, Democratic Republic of the Congo, Tajikistan, Estonia, Hungary, Lithuania,
Poland, Slovak Republic, Turkey, Ghana and Madagascar. Data for China and Lao PDR are for 2012.
20
This is likely driven in part by longer working hours; moreover, the calculation reflects no controls for worker
characteristics such as education.

31
61. When we consider the sectoral distribution of skilled and unskilled workers in Lao PDR, we
find that most skilled workers in Lao PDR’s manufacturing sector are employed in the
garment sub-sector, but so are most unskilled manufacturing workers (see Figure 15). The
sectoral ratios of skilled-to-unskilled workers is highest in metals and machinery (82 percent are
skilled), followed by the chemicals sector (59 percent), and garments (56 percent). Cambodian
manufacturing employment is even more concentrated in garment production, which accounts
for 93 percent of all manufacturing employment and 77 percent of all skilled manufacturing
employment (see Table 5). Despite Vietnam’s more diversified production, the largest share of
its skilled manufacturing workers – 23 percent – are engaged in garment production.
Figure 15: Distribution of Lao Manufacturing Workers by Skill Level, 2012
Source: World Bank Staff calculations based on data from World Bank enterprise surveys for 2012 for Lao PDR.
Note: Skilled and unskilled shares of manufacturing labor are measured on the left axis; percent of sectoral labor
that is skilled is measured on the right axis.

32
Table 5: Labor shares in skilled and unskilled manufacturing in Lao PDR, Vietnam and
Cambodia Lao PDR (2012) Vietnam (2009) Cambodia (2007)
Total
% o/w
Skilled
% o/w
Unskilled Total
% o/w
Skilled
% o/w
Unskilled Total
% o/w
Skilled
% o/w
Unskilled
Employment share
Food 5 37 63 11 41 59 1 45 55 Non-metallic and
plastic materials 8 22 78 12 56 44 1 63 37
Metals and machinery 1 82 18 8 56 44 0 27 73
Textiles 2 53 47 8 62 38 4 59 41
Garments 69 56 44 36 64 36 93 83 17
Electronics 3 48 52 4 76 24 Chemicals and
pharmaceuticals 0 59 41 3 39 61
Other manufacturing 12 47 53 18 45 55 1 55 45
Source: World Bank Staff calculations based on data from World Bank enterprise surveys for 2012 for Lao PDR,
2009 for Vietnam and 2007 for Cambodia.
4.2. Estimating the Employment Elasticity of Exporting
62. We test empirically for a correlation between exporting and labor outcomes, and
whether there is evidence of causality. We use firm-level data to estimate the quasi-elasticity
of employment and wages with respect to the share of exports in total sales for Lao PDR, as well
as a global sample of countries (see Annex 5 for a description of the methodology and data).
Recent literature has shown that exporters achieve better labor market outcomes than non-
exporters by employing more labor and paying higher wages (Bambrilla, Lederman and Porto
2012). Cebeci, Lederman and Rojas (2013) attempt to identify a causal effect using an
instrumental variable approach, and find that increases in Turkish firms’ export shares of total
sales are associated with increases in employment levels within firms, but a higher export share
generates no observed impact on wages.
63. Following this methodology, we use the panel component of the 2009 and 2012 World Bank
Enterprise Surveys to test for a causal effect between firm-level changes in export share and firm
employment and average wages (see Annex 5, Tables 5.1-5.3 for OLS (non-causal) and IV
(causal) results). The regression analysis finds insignificant effects for the Lao PDR sample
(likely due to its small size), and statistically significant but small positive correlations
between export share and employment (for total, skilled and unskilled) for the global
sample of firms. The point estimates are very small: a 1 percentage point increase in the share of
a firm’s sales that are exported is associated with only a 0.002 percent increase in total
employment. The effect is mildly stronger for unskilled employment. These results suggest that
globally, firms that are becoming more export intensive tend to hire more workers, with a
preference for unskilled over skilled workers, but the effect is very small. The correlation
with female employment and wages, on the other hand, is insignificant. The regressions testing
for a causal relationship also yield insignificant results, although the magnitudes of the point

33
estimates are notably higher. Moreover, there appears to be no significant “Lao-specific
effect”.21
64. Given Lao PDR’s high export-orientation, and the small but positive correlation
between exporting and firm size, policies that help producers access new external markets
may help foster some increased labor demand. A range of pro-trade policies should be
considered, including joining knowledge platforms such as international exporters’ associations
and fora, particularly electronic networks that are easier to access and facilitate knowledge
sharing, improving standards compliance and certification within Lao PDR in line with
international standards, reducing trading costs through measures to improve trade facilitation
systems and logistics, and providing enterprises with support for marketing assistance and
training, for example.
4.3. Impact of the Business Environment on the Export-Employment Elasticity
65. How does the business climate affect the size of the export-employment elasticity? Does the
business environment jointly affect firms’ exporting and employment decisions? Seker (2010)
finds evidence that in countries where firms face more constraints to creating jobs, a smaller
fraction of firms participate in export markets, and among firms that export, those that find it
more costly to create new jobs export less intensively. If exporting rather than selling to the
domestic market is linked to greater job creation, then inefficiencies in the business environment
are expected to limit the positive impact of exporting on labor market outcomes. We test this
hypothesis using the World Bank Business Environment and Enterprise Performance Survey’s
60-country dataset (surveys were conducted between 2002 and 2013)22
and following the
methodology in Lopez and Shankar (2011) to build a panel that includes countries where
variation in competiveness indicators is observed (see Annex 5 for details of the methodology).23
Competitiveness indicators include institutions, macroeconomic environment, higher education
and training, market efficiency, and business sophistication (taken from the World Economic
Forum’s Global Competiveness Report).
66. When we consider the role of competitiveness indicators24
on firms’ employment and wage
responses to exporting, we find evidence that firms that increase their export share tend to
21
The interaction of a dummy variable for firms from Lao PDR with the export share variable yields insignificant
results (Annex 5 Table 5.3). 22
Sample of countries includes: Afghanistan, Albania, Angola, Argentina, Armenia, Azerbaijan, Bangladesh,
Belarus, Bolivia, Bosnia and Herzegovina, Botswana, Bulgaria, Burkina Faso, Cape Verde, Cameroon, Chile,
Colombia, Democratic Republic of the Congo, Croatia, Czech Republic, Ecuador, El Salvador, Estonia, Georgia,
Guatemala, Honduras, Hungary, Kazakhstan, Kenya, Kyrgyz Republic, Lao PDR, Latvia, Lithuania, FYR of
Macedonia, Malawi, Mali, Mexico, Moldova, Morocco, Nepal, Pakistan, Panama, Paraguay, Peru, Poland, Romania,
Russian Federation, Rwanda, Senegal, Serbia, Slovak Republic, Tajikistan, Tanzania, Turkey, Uganda, Ukraine,
Uruguay, Uzbekistan, Venezuela, and Zambia. 23
In other words, the impact of exports on employment will be allowed to depend on the level of the competiveness
indicators in each country by also interacting exports with these indicators in the model’s specification. It will then
be possible to assess the employment response to changes in exports conditional on different levels of
competiveness. 24
Both aggregated into a composite competitiveness indicator and as separate competitiveness indicators.

34
have higher employment levels (as noted above), but the effect is more muted in economies
with better overall competitiveness and macroeconomic environments, decreasing the
elasticity by 0.25 percent and 0.37 percent, respectively (Annex 5 Table 5.4). This could be
interpreted to mean that in countries with more competitive environments, exporting firms tend
to shift to less labor-intensive exports. The regression coefficient magnitudes are not enough to
make the overall relationship negative. The business sophistication indicator is significantly and
positively correlated with skilled employment, but with a small coefficient value; for a given
level of market efficiency, firms that increase the share of exports in total sales by 1 percentage
point also have lower levels of skilled employment by 0.022 percent. But the presence of
enhanced market efficiency partly offsets the effect (as reflected by the positive coefficient on
the interaction term); increasing the market efficiency index by 1 unit is associated with an
increased elasticity of -0.016. With respect to female employment and wages, the presence of
different aspects of competitiveness in an economy appears to have no correlation.
67. The causal regression analysis suggests that the degree of competitiveness has an impact
on skilled and female employment and wages (reported in Annex 5 Table 5.5). Increasing the
share of exports in total sales by 1 percentage point causes firms in countries with a given level
of macroeconomic competitiveness to employ fewer female workers by about 0.34 percent,
while an improvement in the macroeconomic environment leads to net lower female employment
by 0.26 percent (due to the positive coefficient on the interaction term). This is also the case for
the higher education and training indicator, albeit with a smaller effect on the elasticity estimates
and interaction term. Controlling for the level of institutions, improving the institutional
environment reduces the positive relationship between exporting and skilled employment.
But we observe no statistically significant effect on total and unskilled employment or
wages.
68. Taken together, the elasticity analysis generates some evidence that exporting rather than
selling to the domestic market is positively associated with employment levels (both skilled and
unskilled). We also find evidence that competitiveness can affect the skilled employment levels
of exporters, albeit negatively for countries with better institutions, and positively for countries
with higher education and training. We find no evidence that these results do not extend to Lao
PDR, suggesting that for firms in Lao PDR, increasing exports should lead to increased
labor demand, but the skills mix of this increased demand will be affected by the
competitiveness of institutions and the business environment.

35
Chapter 5: Labor Mobility and Adjustment Costs
69. Open economies are subject to a variety of external shocks. Changes in a country’s trade
policies (such as a reduction in tariffs as a result of WTO accession or joining a regional trade
agreement) or changes in prices in global markets can affect the relative prices faced by domestic
firms that consume or produce traded goods, which in turn affects the relative demand for labor
across industries. The resulting labor reallocation between sectors in response to these types of
trade-related shocks has wage implications as well. Whereas the destruction and creation of jobs
is fundamental to the efficient allocation of resources, the speed with which labor markets can
adjust in response to trade-related shocks depends on labor mobility and the associated mobility
costs. If labor reallocations across industries and employers are costly, the labor adjustment will
take more time or will be more muted than expected. Idle labor or labor stuck in lower
productivity firms and industries implies lost incomes and diminished output gains. Frictions to
labor mobility, therefore, can translate into significant labor adjustment costs by reducing the
potential gains to trade. Evidence suggests that the forgone gains to trade due to frictions in labor
mobility can be substantial (Davidson and Matusz 2010).
70. This chapter analyzes the circumstances under which a trade shock can benefit or harm
workers through changing labor demand and the resulting impact on employment and wages. It
applies a recently developed model – the World Bank’s Trade and Labor Adjustment Costs
Toolkit25
– to assess the potential distributional effects of future trade-related shocks. The impact
will depend on the distribution of employment, skill sets and wages across sectors, and the
relative impact of a trade shock on particular sectors. Even for a favorable shock, not all workers
will benefit equally, and some workers may lose, in the case of liberalization that harms a
sector’s competitiveness and leads to diminished labor demand and a fall in sectoral wages.
5.1 Defining Labor Mobility Costs and Labor Adjustment Costs
71. The analysis distinguishes between two key labor market concepts to analyze the costs of
labor reallocations that follow shocks, the ways in which mobility frictions affect workers’
employment decisions, and the collective impact of worker responses in terms of net
employment, wage and welfare gains. The analysis considers permanent shocks that result in
economy-wide reallocations in the long run, rather than transitory and other short-run business
cycle shocks.
Labor mobility costs are defined as the costs perceived by a worker to move to a different
firm or industry, independent of the reason for the move. Labor mobility refers to the ability
of workers to move between firms and industries in search of alternative employment
opportunities, such as in response to wage differences. Because workers incur a cost to move,
25
To better understand the tension between trade openness and employment, the Trade Group in the World Bank
developed a toolkit to analyze the transmission channels from trade policies to labor markets, and the magnitudes of
their impact. Understanding the tension between trade openness and employment is increasingly important to
development. After two decades of global trade liberalization and other structural reforms, most developing
countries today are open and well integrated into the global economy. While openness helps diversify risk and is
linked to growth and poverty reduction, it can also have destabilizing effects. See Hollweg et al. (2014).

36
this “labor mobility cost” reflects what a worker perceives to be his or her welfare cost of
finding alternative employment. Typical impediments to job switching are skills mismatches
(wages forgone because of lower productivity), limitations to geographic mobility
(administrative procedures for internal migration26
and direct relocation costs), and severance
and hiring costs (including those imposed by law or convention). Other factors may be
location preferences, job search costs, and even the psychological costs of changing jobs.
Labor adjustment costs are the total costs incurred by workers and the economy as a result of
a shock when labor mobility is costly. These adjustment costs depend on the magnitude of
labor mobility costs, as mobility frictions affect workers’ labor reallocation decisions. Large
mobility costs mean sluggish reallocation of labor in response to a trade-related shock,
reducing the potential benefits to workers and the economy as a whole. Labor mobility costs,
by contrast, can exist without any adjustment-inducing shock.
72. As a first step, the toolkit estimates labor mobility costs using panel data on workers’ sector
of employment, average sectoral wages, and individual worker characteristics to assess worker
transitions between or into and out of jobs over time. The toolkit then simulates the economy-
wide responses to a trade shock in the presence of costly labor mobility vis-à-vis the impact on
employment and wages. These estimates are used to compute labor adjustment costs as the
difference between optimal (without mobility costs) and actual worker welfare. Annex 6
provides details of the methodology and data.
5.2. Worker Transitions in Lao PDR
73. Transition matrices provide the basis for estimating labor mobility costs, and we estimate
worker transitions between sectors using panel data from LECS-4 and LECS-5 on gross labor
flows between sectors and different states of work (including unemployed and out of the labor
market). 27
We distinguish the effects for different worker-types, disaggregating by skill level and
gender, and we include the entire labor force including self-employed and own account workers.
See Annex 6 Tables 6.1-6.3 for summary statistics on sectoral labor shares and average wages by
type of worker.
74. The Lao labor market is relatively fluid. Each cell in Table 6 reports the share of workers
transitioning from each origin sector (row) to all other destination sectors (column). (Annex 6
Table 6.4 contains the number of workers transitioning between each category.) The cells on the
diagonal indicate the shares of workers remaining in their current work/sector status; these
“stayers” represent the largest shares. The transition statistics give a sense of the fluidity of the
Lao labor market, even during a relatively short timeframe, that is, between 2007/08 and
2012/13. In fact, the share of “stayers” in Lao PDR is noticeably smaller than in other countries,
suggesting more labor market fluidity. Agriculture has the highest incidence of “stayers”,
suggesting it is hardest for agriculture workers to find alternative employment in other
sectors of the economy.
26
See World Bank (2014b) Box 3.2 for a description of the bureaucratic barriers facing Lao workers wanting to
move to a different province. 27
Although the LECS survey was not designed as a panel (at either the household or individual level), it is possible
to track households over the 2007/08 and 2012/13 waves, and subsequently individuals within those households
based on demographic characteristics.

37
75. Agriculture also acts as the residual or “last resort” sector, absorbing workers unable
to find alternative employment. The agriculture sector absorbed most unemployed or inactive
workers (48 percent of those exiting unemployment and 33 percent of new labor force entrants
flowed into agriculture). Only one quarter of those unemployed at the beginning of the period
remained unemployed in the 2012/13, and nearly all inactive workers had entered into some type
of employment by 2012/13 (Table 6).
Table 6: Worker transitions across sectors and into and out of labor force status between 2007/08
and 2012/13 (%)
Un
emp
loy
ed
Ou
t o
f la
bor
forc
e
Ag
ricu
ltu
re
Min
ing
Gar
men
t
Oth
er m
anufa
ctu
rin
g
Ser
vic
es
Unemployed 4.35 17.39 47.83 0.00 0.00 0.00 30.43 Out of labor force 1.09 38.04 33.45 0.12 2.66 2.78 21.86 Agriculture 0.19 11.33 73.00 0.16 1.13 2.94 11.25 Mining 0.00 0.00 70.00 0.00 0.00 0.00 30.00 Garment 0.00 11.67 37.50 0.83 30.83 2.50 16.67 Other manufacturing 0.33 9.27 34.44 0.33 1.32 28.81 25.50 Services 0.73 7.98 22.88 0.48 1.21 4.51 62.21 Source: 2007/08 and 2012/13 Lao PDR Earnings and Consumption Survey.
76. Public sector service jobs have a low share of exits, and a low rate of entry, suggesting
that these jobs are highly desirable despite lower wages, but are also difficult to obtain. We
observe the largest number of transitions out of financial services work in Lao.
77. Wholesale and retail trade, and hotels and restaurants are important stepping stone
sectors out of agriculture. In Lao PDR, workers exiting the agriculture, forestry and fishing
sector are more likely to find jobs in commercial trade, hotels and restaurants than other sectors
of the economy. And for workers exiting the wholesale and retail trade, hotels and restaurants
sectors, they are most likely remain in services, the majority switching to community, social and
individual services.
78. If leaving a sector (other than agriculture) in Lao PDR, workers were more likely to
enter agriculture than unemployment. This is not generally the case in other countries, where
workers were more likely to drop into unemployment or out of the labor force if leaving the
manufacturing, trade, finance or public service sectors than become agriculture workers, for
example.
79. Skilled workers have a higher propensity to find jobs in the services sector, whereas
unskilled workers are more likely to enter the agriculture sector (Table 7). This is true for
the unemployed and the newly active in the labor market, but it is also true for workers switching
sectors of work. For example, 51 percent of skilled workers exiting agriculture find services jobs,

38
as do 73 percent of skilled workers exiting garments, and 48 percent of those exiting other
manufacturing. For unskilled workers, these numbers are significantly lower. In addition, fewer
skilled services workers exit services, whereas unskilled services workers were almost as likely
to exit as to remain in the sector.
Table 7: Worker transitions across sectors and into and out of labor force status between 2007/08
and 2012/13 (%), skilled vs. unskilled
Skilled Unskilled
Un
emp
loy
ed
Ou
t o
f la
bo
r fo
rce
Ag
ricu
ltu
re
Min
ing
Gar
men
t
Oth
er m
anu
fact
uri
ng
Ser
vic
es
Un
emp
loy
ed
Ou
t o
f la
bo
r fo
rce
Ag
ricu
ltu
re
Min
ing
Gar
men
t
Oth
er m
anu
fact
uri
ng
Ser
vic
es
Unemployed 0.00 0.00 0.00 0.00 0.00 0.00 100.00 0.00 22.22 50.00 0.00 0.00 0.00 27.78
Out of labor force 4.17 16.67 6.25 1.04 1.04 5.21 65.63 0.90 27.87 43.60 0.00 3.37 3.15 21.12
Agriculture 1.52 4.55 37.12 1.52 0.00 4.55 50.76 0.15 8.67 75.85 0.11 1.21 2.90 11.10
Mining 0.00 0.00 66.67 0.00 0.00 0.00 33.33
Garment 0.00 9.09 9.09 0.00 9.09 0.00 72.73 0.00 10.00 37.78 1.11 34.44 3.33 13.33
Other manufacturing 0.00 17.39 8.70 0.00 0.00 26.09 47.83 0.40 6.72 34.78 0.40 1.58 31.23 24.90
Services 1.85 4.31 8.00 0.00 0.31 3.38 82.15 0.37 8.60 28.13 0.74 1.60 5.16 55.41
Source: 2007/08 and 2012/13 Lao PDR Earnings and Consumption Survey.
80. Female workers entering the garment sector are most likely to come from out of the
labor force or agricultural work (Table 8). The high number of exits from garment work is
even higher than those having ‘stayed’ in the garment sector, confirming very high job turnover.
However, garments do not appear to be a stepping stone sector; workers exiting garments are
most likely to return to agriculture (even more likely than to stay in garments). This points to
the need for a change in the incentive structure of garment jobs (such as compensation
policies, working conditions, or career development) to entice workers to remain in
relatively productive work rather than returning to the farm or migrating. Policies could
center on skill acquisition and upgrading to facilitate the shift to higher value-added activities, or
support for career development, inter alia.
81. Despite the highly feminized work force in garments, more female workers enter other
manufacturing or service sectors, which are significant employers of women. Female workers
exiting agriculture are least likely to enter mining, and are in fact more likely to exit the labor
force or enter services or other manufacturing rather than the garment sector, implying that
garment jobs mostly attract workers who lack other options.

39
Table 8: Worker transitions across sectors and into and out of labor force status between 2007/08
and 2012/13 (%), male vs. female
Male Female
Un
emp
loy
ed
Ou
t o
f la
bo
r fo
rce
Ag
ricu
ltu
re
Min
ing
Gar
men
t
Oth
er m
anu
fact
uri
ng
Ser
vic
es
Un
emp
loy
ed
Ou
t o
f la
bo
r fo
rce
Ag
ricu
ltu
re
Min
ing
Gar
men
t
Oth
er m
anu
fact
uri
ng
Ser
vic
es
Unemployed 0.00 0.00 57.14 0.00 0.00 0.00 42.86 6.25 25.00 43.75 0.00 0.00 0.00 25.00
Out of labor force 1.96 36.93 35.62 0.00 0.33 3.59 21.57 0.57 38.70 32.18 0.19 4.02 2.30 22.03
Agriculture 0.26 8.58 74.66 0.26 0.15 3.37 12.72 0.11 14.39 71.16 0.06 2.23 2.46 9.59
Mining 0.00 0.00 40.00 0.00 0.00 0.00 60.00 0.00 0.00 100.00 0.00 0.00 0.00 0.00
Garment 0.00 0.00 0.00 12.50 37.50 0.00 50.00 0.00 12.50 40.18 0.00 30.36 2.68 14.29
Other
manufacturing 0.53 5.88 37.97 0.53 1.07 28.34 25.67 0.00 14.78 28.70 0.00 1.74 29.57 25.22
Services 0.73 6.46 27.46 0.73 0.15 4.85 59.62 0.71 9.82 17.32 0.18 2.50 4.11 65.36
Source: 2007/08 and 2012/13 Lao PDR Earnings and Consumption Survey.
5.3. Labor Mobility Costs
82. It is not possible to measure labor mobility costs directly, because they are not readily
observable. Instead, we use an indirect method that combines the observed worker transitions
between sectors with the inter-sectoral wage gaps to estimate the “labor mobility cost” to explain
why workers do not transition into higher wage sectors to the extent that wage gaps are
eliminated.28
The methodology of this model differs from standard models of trade, which
assume no frictions in the adjustment of labor. For example, workers are assumed to move
without frictions from import-competing sectors to export-expanding sectors, after an economy
opens to trade. But in reality, workers respond slowly to trade-related shocks. We estimate the
welfare costs for a worker to switch industries/jobs using a dynamic rational-expectations model
of costly labor adjustment. In each period, a worker can choose to move from her current
industry to another one, but must pay a cost in doing so. The decision for a worker to move
depends on her expected welfare gain, net of the cost of moving. When there are low transition
rates across sectors of the economy despite high wage gaps, we interpret this to mean that it is
costly for workers to move. So for a sector that is difficult to access, we would assign a high
labor mobility cost for entering that type of job. Combining the transition data with the observed
wage gaps between sectors leads to estimates of labor mobility costs for entering each sector,
expressed as a ratio of the annual average wage.29
These transition costs are estimated for all
workers, as well as for skilled and unskilled workers, and for men and women (see Table 9).30
28
Note that there may be multiple reasons why wage gaps persist, e.g., on the labor supply side (when it is
physically or technically difficult due to skills mismatch to obtain a job in a certain sector), or on the labor demand
side (such as a lack of new public sector job openings). Both are obstacles to matching labor supply with labor
demand at a market clearing wage, and both therefore imply a high cost of transitioning to said job. 29
The cost has a common component, which does not vary across similar type workers in an industry, and an
idiosyncratic component. By solving the dynamic rational-expectations model of costly labor adjustment, it is

40
83. Understanding which sectors are the least costly to enter, and for different types of workers,
will shed light on which sectors may provide opportunities following a trade shock. The
methodology used here is sensitive to the level of disaggregation: the higher degree of sectoral
disaggregation, the fewer the observed transitions, the higher the estimated mobility costs. It is
therefore crucial to exercise caution when interpreting the results. This type of exercise is most
useful for comparing the relative mobility costs across different sectors of an economy –
particularly those most closely affected by trade shocks – and different types of workers.
Table 9. Labor mobility costs (as a share of variance of the idiosyncratic component, expressed
as a ratio of the average annual wage) Total Skilled Unskilled Male Female
Unemployed / out of labor force 0.879 0.865 0.695 1.213 0.549 Agriculture / mining 1.169 1.652 1.140 1.082 1.282 Garment 2.855 3.028 2.914 5.002 2.181 Other manufacturing 1.878 1.821 1.970 1.698 2.114 Services 1.586 0.503 1.341 1.378 1.837 Source: 2007/08 and 2012/13 Lao PDR Earnings and Consumption Survey.
Note: To estimate labor mobility costs, it was necessary to combine mining with agriculture due to too many zeros
in the transition matrix and non-convergence in the estimates. For robustness, estimates were re-calculated
excluding the mining sector altogether. Overall, the rankings across sectors remain the same, and the point estimates
change only slightly in value. For example, the residual sector of unemployed / out of labor force is still the least
costly sector for total, unskilled and females to enter, while agriculture is the least costly sector for male workers to
enter, and services is the least costly sector for skilled workers to enter.
84. Labor mobility costs are significant in Lao PDR, averaging 1.28 times the average
annual wage. Labor mobility costs in Lao PDR range from 1.17 times the average annual wage
to enter agriculture or mining, to 2.8 times the average annual wage to enter garment
manufacturing.31
These are however lower than in other ASEAN countries, where labor mobility
costs range upwards of six times the average wage for some sectors. These results are consistent
with more churning in the Lao labor market, relatively low unemployment rates, and a much
lower incidence if “stayers”. Workers faced with these welfare costs will certainly weigh the
decision to change jobs very carefully, even when the incentives – such as higher wages – are
strong.
85. High labor mobility costs are typical for countries with a large share of primary
employment. Arias et al. (2013) find evidence of a positive correlation between labor mobility
costs and the employment share in the agriculture sector, suggesting that for countries in which
employment opportunities are more diversified away from primary sectors, workers encounter
lower mobility costs. They also find evidence that although educational attainment at the primary
possible to derive an equilibrium condition that is a kind of Euler-equation, which lends itself to estimation. The
structural model identifies workers’ transitions across sectors of an economy that depend on the wage gaps between
those sectors and the mobility costs of entering a sector. From observed data on sectoral transitions and sectoral
wage gaps, we are able to estimate the labor mobility cost using GMM-type estimations. 30
Note that we do not capture workers switching jobs within sectors, nor do we capture workers changing jobs
multiple times between 2007/08 and 2012/13. 31
We include all individuals engaged in the agricultural sector in the transitions, regardless of whether they are
wage workers, own-account farmers, or non-wage family farm workers. However, the average agricultural wage is
calculated for wage earners only. This could bias the average agricultural wage either upward or downward, which
may in turn bias the labor mobility cost estimate for entering agriculture.

41
and secondary levels does not seem to matter for mobility costs, countries with higher levels of
tertiary education tend to have lower mobility costs.
86. Skilled workers face lower costs to transition across sectors compared to unskilled
workers, although the results vary by sector. In Lao PDR, unskilled workers face higher labor
mobility costs to enter other manufacturing and services. This suggests that employers may
prefer workers with sector-specific knowledge, creating obstacles for agriculture workers trying
to switch into more productive sectors, for example.
87. Female workers face greater costs to transition across sectors compared to male
workers, although this is not true for garment factory work. In general, labor mobility costs
are higher for female than male workers, consistent with the observed low number of worker
transitions by women. But the very low share of men in garment work yields a very high
mobility cost for men to enter this particular sector.
88. Leaving employment either by becoming unemployed or exiting the labor force involves
the lowest transition cost for women, but not for men. For example, female workers face a
labor mobility cost equivalent 0.55 times the average annual wage to exit employment – less than
half the cost of entering any other sector. For male workers, however, it is less costly to enter
agriculture and mining sector than to become unemployed or exit the labor force; this result
arises from the fact that very few men choose unemployment or exit the labor force.
89. The (combined) agriculture and mining sector is one of the least costly to enter for all
groups, and particularly for males and the unskilled. In Lao PDR, workers entering
agriculture incur a cost equivalent to 1.17 times the annual average wage – driven up by mining
and quarrying which are more costly for workers to enter. The labor mobility cost for unskilled
workers to enter agriculture is 1.14 times the annual average wage, versus 1.65 for skilled
workers; and the labor mobility cost for male workers is 1.08 times the annual average wage,
compared to 1.28 for female workers. (Table 6.3 in Annex 6 reports the average sectoral wages
for 2012/13 for different worker types.)
90. Workers in Lao PDR face the highest labor mobility costs to enter garment work; this
counterintuitive result is explained by the very small share of total employment in garment
manufacturing. Even though we observe high-frequency turnover rates, the number of
transitions is very small compared to the worker flows into and out of other sectors or work
status. Moreover, the panel data measures whether a worker has transitioned between two points
in time, 2007/08 and 2012/13, and does not capture high-frequency transitions. In other
countries, skilled labor usually incurs a lower labor mobility cost to entering manufacturing jobs,
and this is also the case in Lao PDR for other manufacturing (excluding garments).
91. Some services sectors are more costly for workers to access than others. Social and
public sector service jobs, for example, have high mobility costs, especially among unskilled
workers, and this is consistent with the very low observed turnover in public sector jobs.
Financial, real estate, insurance and business services are also costly to enter, but more so for
unskilled workers than skilled workers.
42
5.4. Labor Adjustment Costs
92. The presence of high labor mobility costs dissuades labor supply to certain sectors, but these
sectors may be the most productive and with the highest wages. The resulting sub-optimal
labor supply decisions by workers can add up to significant welfare losses for the economy
at large. Policies to reduce labor mobility costs – such as labor market information or
matching services, or cost-share training that is demand-driven32
– would reduce
distortions affecting labor supply decisions, increase worker mobility, and in the case of a
shock or other change in market signals, boost and accelerate the labor market response.
93. Using estimates of labor mobility costs, the analytical framework allows us to quantify the
potential employment and wage effects of a hypothetical trade shock to a specific sector. This
type of simulation of post-shock adjustment dynamics can be useful to policymakers and policy
designs for mitigating or offsetting large anticipated labor adjustment costs of worker transitions
between sectors over time when labor mobility is costly.33
In this simulation analysis, we
model an exogenous trade shock that translates into a 20 percent increase in the price of
garments emanating from international markets.34
This could result from liberalizing the Lao
garment sector through expanded access to global markets where global prices are 20 percent
higher than Lao prices. This equilibrium analysis illustrates how such a shock could affect jobs
and wages not only in the garment sector but in the rest of the economy due to shifts in relative
labor demand and supply.35
The analysis also allows for movements in and out of unemployment
or the labor force. Figure 16 illustrates the impact of the shock for the total economy over time;
the graphs show the change in relative wages (the average sector’s wage relative to the average
economy-wide wage), employment and welfare for each sector (services, garments, other
manufacturing, agriculture/mining, and the residual sector which comprises unemployment and
out of the labor force).36
94. Workers in the garment sector would see real wage increases immediately after the
shock, while wages of workers in all other sectors remain relatively unchanged. The
simulation of a 20 percent increase in the price of garments increases the profitability of the
garment sector, which translates immediately into higher nominal wages in year 1 of the shock.
The change in the economy’s price index is proportional to the garment share; because the share
32
Note that a garment skills development center was established by the Government under the World Bank-led
Trade Development Facility precisely to provide skills training to garment factory employees covering both
technical and management skills. The cost-sharing program was initially embraced by a significant number of
employers, but demand subsequently fell, and the center has been unable to transition to financial independence
following the initial subsidy period, despite diversifying its course offerings. 33
The analysis uses an equilibrium model in which the structure of the economy is specified using assumptions
about the production function in each sector as well as demand functions and their parameters. Parameters are
calculated using data on relative wages, labor and consumption shares, and labor’s share of output across sectors of
the economy. The production and demand functions are then used to calibrate the initial steady state of the economy.
Refer to Annex 6 and to Hollweg et al. (2014) for additional information on the methodology. 34
Note that a negative price shock of the same magnitude would lead to the opposite signed effects on sectoral
wages and employment. 35
Note that the model does not assume any change in the capital-labor elasticity, such that we are not modeling
increased investment or re-investment of capital that might occur following a trade policy shock. 36
For robustness, separate simulations were performed excluding the mining sector. Only minor differences
emerged, and therefore are not presented. The results are available from the authors upon request.

43
of garments in household consumption is low in Lao PDR, the impact of the garment price rise
on real purchasing power is very small. And because of constant nominal wages elsewhere, real
wages in other sectors do not experience significant changes (as reflected by flat real wages
outside the garment sector in Figure 16).
Figure 16: Post-shock wages, utility and labor shares, total economy
Note: Sector 1 is agriculture/mining; sector 2 is garments; sector 3 is other manufacturing; sector 4 is services; and
sector 5 is unemployed or out of the labor force. The y-axis measures the average relative wage/level of
utility/working age population share, and the x-axis shows time measured in years (the price shock occurs at time 0).
Relative wages reflect embedded labor mobility costs and therefore do not average 1. Utility is the sectoral average
of workers’ lifetime expected utility (see Annex 6 for more detail).
Source: 2007/08 and 2012/13 Lao PDR Earnings and Consumption Survey and Global Trade Analysis Project
(GTAP).
95. The real wage rise in garments incentivizes workers to reallocate to garments, due to the
change in intersectoral wage differentials. The relative rise in garment wages compared to other
sectors creates incentives for workers to move into garments, both from other sectors of the
economy as well as from unemployment or out of the labor force. Workers are most likely to
enter from the agriculture/mining sector as well as the residual sector, although the predicted
outflows are very small given that all other sectors of the economy have much larger labor shares
than the garment sector (which is why Figure 16 shows little or no visible impact). Recall that
labor mobility costs for entering garments are high, which may also be preventing workers from
0.2
.4.6
.81
Re
lative
ave
rag
e w
ag
e
0 5 10 15 20 25Time
W1 W2 W3
W4 W5
Wages
24.5
25
25.5
26
26.5
Wo
rke
r u
tilit
y le
ve
l
0 5 10 15 20 25Time
V1 V2 V3
V4 V5
Utility
0.1
.2.3
.4
Sh
are
of
wo
rkin
g a
ge
po
pu
latio
n
0 5 10 15 20 25Time
L1 L2 L3
L4 L5
Labor

44
entering the sector at optimal levels. The predicted outflow of labor from other sectors would
also lead to modest wage increases in those sectors due to the diminished relative labor supply.
96. The predicted labor reallocation has implications for wages in the garment sector,
which decline slightly as workers move in over time. In the new steady state, however, real
wages of garment workers are higher than in the initial steady state. The larger labor shares
of the other sectors mean that any labor outflows in general would have minimal additional
effects on those sectors’ equilibrium wages.
97. The welfare – or utility – of all workers is predicted to increase under the simulated
scenario, most notably for those in the garment sector. This is because of higher real wages,
which increases the purchasing power of all workers, albeit modestly. In addition, garment
workers also receive higher nominal wages.
98. The adjustment period is predicted to be very short in the simulation, due to Lao PDR’s
relatively low labor mobility costs. It takes only about two years to reach the new steady state.
Simulations of trade-related price shocks in other countries suggests that the average adjustment
period can be much longer – six years on average for developing countries. The shorter
adjustment period reflects the fluidity of the Lao labor market.
99. The results of the above simulations are similar when disaggregated between skilled and
unskilled workers and between men and women, with a few notable differences (see Annex 6
Figures 6.1-6.4). Unskilled workers in the garment sector experience a larger relative
nominal wage increase immediately following the shock compared to skilled garment
workers, and this translates into relatively larger utility gains for unskilled garment
workers. And with respect to gender differences, the positive effects of the higher price of
garments accrues primarily to female workers, since it is primarily women who move into
the garment sector, consistent with actual employment trends in garments. This gender
difference stems from the very high estimated labor mobility cost for males to enter the sector,
itself a function of the small current share of men in garment work. Females are predicted to
move into garments from all other sectors except services, including from unemployment and
from out of the labor force. Whereas female labor shares in other sectors except services decline
following the price shock, the sectoral labor shares for men are not affected.
100. Labor mobility costs reduce both the speed of transition to the new steady state and
the gains from trade. The welfare losses resulting from this slower and smaller adjustment,
referred to as labor adjustment costs, are calculated as the difference in aggregate worker welfare
between optimal labor allocations after a trade shock (with instantaneous adjustment when
mobility costs are zero) and actual labor allocations (when labor mobility costs are positive).37
101. The magnitudes of the actual and potential welfare gains from the trade shock to garment
prices (respectively reported in Tables 10 and 11) vary by sector and worker type. The actual
welfare gains are greatest for female workers, averaging around 1 percent of initial welfare
37
Labor adjustment costs are calculated using the simulated adjustment dynamics after the trade-related shock to the
garments sector. The adjustment dynamics of the transition from the pre-shock to post-shock steady states produce
levels of worker welfare associated with predicted labor market outcomes. Labor adjustment costs are calculated by
solving for this welfare when there are mobility costs and comparing it to welfare when mobility costs are zero.
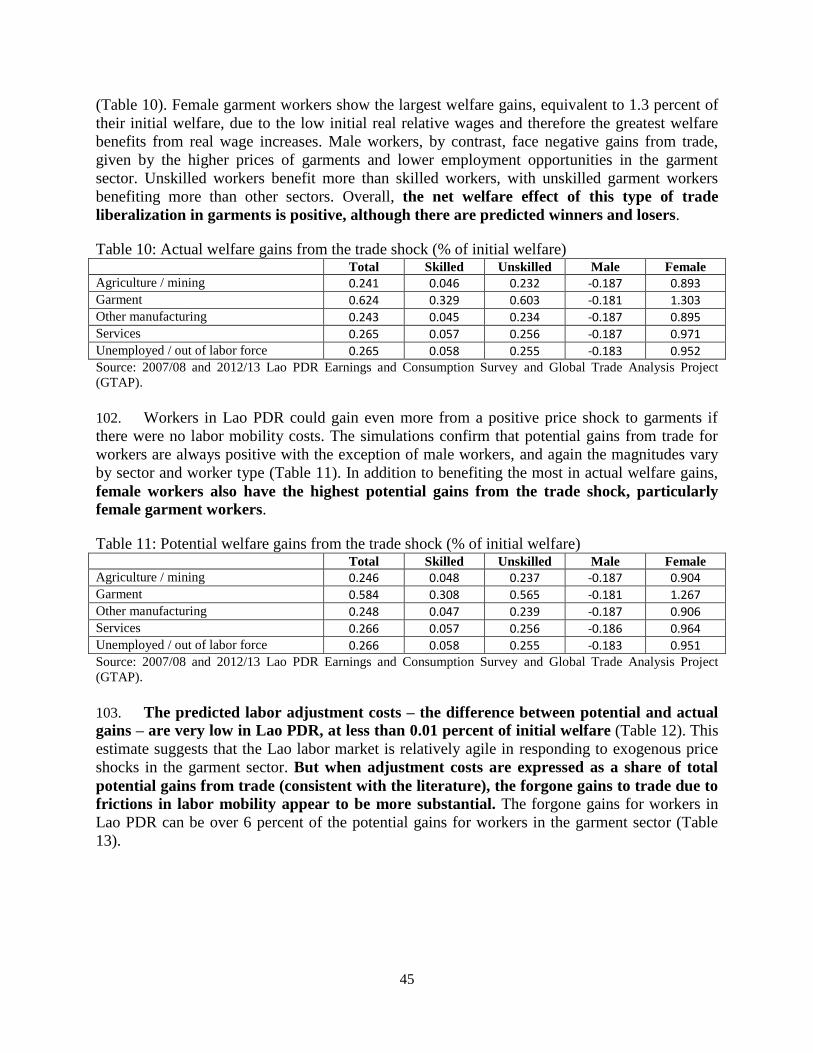
45
(Table 10). Female garment workers show the largest welfare gains, equivalent to 1.3 percent of
their initial welfare, due to the low initial real relative wages and therefore the greatest welfare
benefits from real wage increases. Male workers, by contrast, face negative gains from trade,
given by the higher prices of garments and lower employment opportunities in the garment
sector. Unskilled workers benefit more than skilled workers, with unskilled garment workers
benefiting more than other sectors. Overall, the net welfare effect of this type of trade
liberalization in garments is positive, although there are predicted winners and losers.
Table 10: Actual welfare gains from the trade shock (% of initial welfare) Total Skilled Unskilled Male Female
Agriculture / mining 0.241 0.046 0.232 -0.187 0.893 Garment 0.624 0.329 0.603 -0.181 1.303 Other manufacturing 0.243 0.045 0.234 -0.187 0.895 Services 0.265 0.057 0.256 -0.187 0.971 Unemployed / out of labor force 0.265 0.058 0.255 -0.183 0.952 Source: 2007/08 and 2012/13 Lao PDR Earnings and Consumption Survey and Global Trade Analysis Project
(GTAP).
102. Workers in Lao PDR could gain even more from a positive price shock to garments if
there were no labor mobility costs. The simulations confirm that potential gains from trade for
workers are always positive with the exception of male workers, and again the magnitudes vary
by sector and worker type (Table 11). In addition to benefiting the most in actual welfare gains,
female workers also have the highest potential gains from the trade shock, particularly
female garment workers.
Table 11: Potential welfare gains from the trade shock (% of initial welfare) Total Skilled Unskilled Male Female
Agriculture / mining 0.246 0.048 0.237 -0.187 0.904 Garment 0.584 0.308 0.565 -0.181 1.267 Other manufacturing 0.248 0.047 0.239 -0.187 0.906 Services 0.266 0.057 0.256 -0.186 0.964 Unemployed / out of labor force 0.266 0.058 0.255 -0.183 0.951 Source: 2007/08 and 2012/13 Lao PDR Earnings and Consumption Survey and Global Trade Analysis Project
(GTAP).
103. The predicted labor adjustment costs – the difference between potential and actual
gains – are very low in Lao PDR, at less than 0.01 percent of initial welfare (Table 12). This
estimate suggests that the Lao labor market is relatively agile in responding to exogenous price
shocks in the garment sector. But when adjustment costs are expressed as a share of total
potential gains from trade (consistent with the literature), the forgone gains to trade due to
frictions in labor mobility appear to be more substantial. The forgone gains for workers in
Lao PDR can be over 6 percent of the potential gains for workers in the garment sector (Table
13).

46
Table 12: Labor adjustment costs (% of initial welfare) Total Skilled Unskilled Male Female
Agriculture / mining 0.005 0.002 0.005 0.000 0.012 Garment -0.040 -0.021 -0.038 0.000 -0.036 Other manufacturing 0.005 0.003 0.004 0.000 0.011 Services 0.001 0.000 0.001 0.000 -0.007 Unemployed / out of labor force 0.001 0.000 0.001 0.000 -0.001
Table 13: Forgone gains from trade (labor adjustment costs as a % of potential gains to trade) Total Skilled Unskilled Male Female
Agriculture / mining 2.221 4.454 2.075 -0.090 1.283 Garment -6.791 -6.757 -6.777 -0.043 -2.843 Other manufacturing 2.021 6.234 1.820 0.047 1.204 Services 0.268 -0.419 0.223 -0.173 -0.693 Unemployed / out of labor force 0.253 0.263 0.208 -0.047 -0.084
104. Diversifying production and employment away from the primary sector toward
industry and services could also reduce labor mobility costs by enabling workers to
transition more easily to better jobs. This, in turn, would result in a more efficient
allocation of labor across the Lao economy. Moreover, policies to facilitate labor mobility –
such as labor information and job matching services – would also contribute to allocative
efficiency.
105. These types of policies targeting labor mobility costs could be further complemented
by reforms that address distortionary public employment policies such as hiring,
compensation, and human resource management within the civil service and SOEs, and
revisiting the role of SOEs. If public sector and private sector jobs become equally attractive to
workers, this could potentially free up more educated workers to enter the private sector and
boost private sector productivity.
106. The various limitations of Lao PDR’s manufacturing sector documented throughout this
report – both in terms of size and quality – mean that any positive policy impacts are likely to
have only modest effects on aggregate welfare and inclusive growth. To generate bigger bang
for the buck, policies will need to move beyond the manufacturing sector to address the
limited employment and demand spillovers of mining production, and the limited market
integration and value addition in agricultural production. Policies to enhance agricultural
productivity, job quality and economic opportunities in rural areas will not only foster
greater equity, but will also reduce urban-rural distortions and the associated labor
mobility costs, and dampen incentives to migrate.

47
References
Arias, J., E. Artuç, D. Lederman, and D. Rojas (2013). “Trade, Informal Employment and Labor
Adjustment Costs: Theory and Evidence from Brazil, Mexico, and Morocco.” World
Bank, Washington, DC.
Artuç, E., D. Lederman, and G. Porto (2013). “A Mapping of Labor Mobility Costs in the
Developing World”, Policy Research Working Paper 6556, World Bank, Washington,
DC.
Brambilla, I., D. Lederman, and G. Porto (2012). “Exports, Export Destinations, and Skills.”
American Economic Review, 102(7): 3406-38.
Bernard, A., and B. Jensen (1995). “Exporters, Jobs and Wages in US Manufacturing, 1976-
1987.” Brookings Papers on Economic Activity: Microeconomics, 67-112.
Bernard, A., and B. Jensen (1999). “Exceptional Export Performance: Cause, Effect, or Both?”
Journal of International Economics, 47(1): 1-25.
Bernard, A., B. Jensen, S. Redding and P. Schott (2007). “Firms in International Trade.” Journal
of Economic Perspectives, 21(3): 105-30.
Calderón, C., and V. Poggio (2011). “Trade and Economic Growth: Evidence on the role of
complementarities for CAFTA-DR countries.” In J. H. Lopez and R. Shankar (Eds.),
Getting the Most out of Free Trade Agreements in Central America. Washington, DC:
The International Bank for Reconstruction and Development / The World Bank, pp. 83-
122.
Cebeci, T., D. Lederman, and D. Rojas (2013). “The Structure of Exports across Destinations
and Labor-Market Outcomes: An Empirical Case Study of Turkey.” Unpublished.
Clerides, S., S. Lach and J. Tybout (1998). “Is Learning by Exporting Important? Micro-dynamic
evidence from Colombia, Mexico, and Morocco.” The Quarterly Journal of Economics,
113 (3): 903-47.
Darvas (2012). “Real Effective Exchange Rates for 178 Countries: A New Database.” Bruegel
Working Paper No. 06, Bruegel, Brussels.
Davidson, C. and S. J. Matusz (2010). International Trade with Equilibrium Unemployment.
Princeton, NJ: Princeton University Press.
Hausmann, R., J. Hwang and D. Rodrik (2007). “What You Export Matters”, Journal of
Economic Growth, Spring vol. 12(1), pp. 1-25.

48
Hollweg, C., D. Lederman, D. Rojas and E. Ruppert Bulmer (2014). Sticky Feet: How Labor
Market Frictions Shape the Impact of International Trade on Jobs and Wages. Directions
in Development: Trade, The World Bank, Washington, D.C.
Lederman, D. and W. Maloney (2009) ‘Does Diversification Matter?’ in Newfarmer, Shaw and
Walkenhorst, eds. Breaking Into New Market – Emerging Lessons for Export
Diversification, Washington, DC: The World Bank.
Lopez, J. and R. Shankar, eds. (2011). Getting the Most Out of Free Trade Agreements in
Central America. Directions in Development: Trade, The World Bank, Washington, DC.
Seker, M. (2010). “Difficulties in Job Creation and Exporting.” Enterprise Note Series No. 12,
Enterprise Surveys, The World Bank, Washington, DC.
Shirotori, M., B. Tumurchudur, and O. Cadot (2010). “Revealed Factor Intensity Indices at the
Product Level”, UNCTAD Policy Issues in International Trade and Commodities Study
Series No. 44, United Nations, Geneva.
Verhoogen, E. (2008). “Trade, Quality Upgrading, and Wage Inequality in the Mexican
Manufacturing Sector”, The Quarterly Journal of Economics, 123 (2):489-530.
World Bank (2011a). Lao PDR Development Report 2010 – Natural Resource Management for
Sustainable Development, World Bank: Washington, DC.
World Bank (2011b). Lao PDR: Investment Climate Assessment – Polices to Promote Growth in
the Non Resource Sectors, World Bank: Washington, DC.
World Bank (2012a). “Lao Economic Monitor”, World Bank: Vientiane, Lao PDR.
World Bank (2012b). “Lao PDR Labor Standards and Productivity in the Garments Export
Sector: A Survey of Managers and Workers”, PREM Department, East Asia and Pacific
Region, World Bank: Washington, DC.
World Bank (2013). “Skills and Knowledge for Greater Growth and Competitiveness in Lao
PDR: Skills for Quality Jobs and Development in Lao PDR”, Report no. ACS6593,
Human Development Department, Social Protection and Labor Unit, East Asia and
Pacific Region, World Bank: Washington, DC.
World Bank (2014a). “Lao PDR: Investment Climate Assessment 2014 – Policy Uncertainty in
the Midst of a Natural Resources Boom”, Report no. 90960-LA, Trade and
Competitiveness Global Practice, East Asia and Pacific Region, World Bank Group:
Washington, DC.
49
World Bank (2014b). “Lao Development Report 2014: Expanding Productive Employment for
Broad-Based Growth”, Report no. ACS9577, World Bank Group: Washington, DC.
World Bank (2014c). “2012 Lao PDR EGRA Survey Report” [mimeo].World Bank (2015). “A
Comparative Overview of the Incidence of Non-Tariff Measures on Trade in Lao PDR”,
Trade and Competitiveness Global Practice, World Bank: Washington, DC.
World Economic Forum (2015). The Global Competiveness Report 2014-2015.
http://www.weforum.org/reports/global-competitiveness-report-2014-2015

50
Annexes

51
Annex 1
Table 1.1: Lao PDR’s labor force participation and unemployment rates (%) 2007/08 (ECS) 2010 (LFS) 2012/13 (ECS)
LFP rate Unemployment rate LFP rate Unemployment rate LFP rate Unemployment rate
Total 85.1 0.4 84.3 0.6 93.5 0.2
Male 87.9 0.4 85.1 0.6 94.0 0.2
Female 82.5 0.5 83.5 0.5 93.0 0.1
Less than primary 88.9 0.2 94.5 0.4 97.0 0.2
Primary 86.7 0.4 95.3 0.5 97.3 0.3
Lower secondary 78.7 0.4 95.3 0.8 97.7 0.3
Upper secondary 80.7 0.6 94.4 0.9 96.7 0.1
Vocational 90.2 1.2 94.8 1.4 95.4 0.1
Tertiary 80.7 1.4 95.6 2.6 98.1 0.3
Urban 79.1 0.7 77.3 1.1 92.0 0.2
Rural 88.0 0.3 87.6 0.4 94.2 0.2
Vientiane Capital 76.4 0.6 77.9 1.8 96.2 0.1
Vientiane 83.5 0.5 85.5 0.4 89.8 0.3
Savannakhet 81.5 0.5 88.2 0.3 91.5 0.3
Champasak 89.3 0.5 86.0 1.1 96.8 0.0
Khammuane 84.3 0.1 84.7 0.3 97.2 0.1
Luangprabang 86.6 0.1 85.5 0.5 91.0 0.0
Xayabury 87.5 0.8 86.0 0.2 91.7 0.8
Other regions 88.5 0.3 83.6 0.3 93.6 0.2
Source: 2007/08 and 2012/13 data are from the Lao PDR Earnings and Consumption Survey, and 2010 data are
from the Lao PDR Labor Force and Child Labor Survey.

52
Table 1.2: Distribution of educational attainment38
for different population groups
2007/08
Less than primary
Primary Lower-secondary
Upper secondary
Vocational Tertiary
Male 27.8 35.0 17.5 10.6 6.2 2.9 Female 33.7 36.2 15.2 8.4 4.6 1.9 Agriculture 38.2 39.7 14.6 5.2 1.8 0.5 Mining 18.2 59.9 10.1 3.7 8.1 Garment 16.3 31.2 28.2 17.0 6.0 1.2 Other manuf. 24.7 32.6 20.8 13.6 6.3 2.0 Services 12.5 25.1 19.6 19.9 15.1 7.9 Urban 16.1 29.2 20.1 17.7 11.0 6.0 Rural 37.5 38.5 14.8 5.7 2.8 0.7 Vientiane Capital 11.0 24.3 18.3 23.1 13.0 10.4 Vientiane 19.8 38.4 22.3 10.3 6.9 2.4 Savannakhet 31.4 32.0 16.5 10.3 6.4 3.3 Champasak 29.0 40.8 17.9 7.2 4.6 0.5 Khammuane 38.4 36.0 14.8 7.6 2.7 0.5 Luangprabang 35.4 36.1 13.3 9.2 5.2 0.8 Xayabury 17.1 50.3 19.9 8.7 3.2 0.9 Other regions 41.7 35.4 14.1 5.2 3.0 0.6
2012/13
Less than primary
Primary Lower-secondary
Upper secondary
Vocational Tertiary
Male 18.6 37.5 20.0 10.6 6.7 6.5 Female 26.7 38.6 15.8 8.8 5.1 5.1 Agriculture 30.1 45.8 16.4 4.9 1.8 0.9 Mining 17.5 33.9 28.7 8.3 2.3 9.2 Garment 16.0 44.9 18.2 15.9 4.3 0.7 Other manufacturing 13.6 35.8 27.1 13.6 6.4 3.4 Services 9.6 23.2 19.5 17.9 13.8 16.1 Public 3.2 4.7 10.3 14.5 28.8 38.5 SOE 6.5 17.4 19.9 19.2 16.8 20.1 Civil servant 2.7 2.9 8.9 13.9 30.5 41.1 Private 21.4 39.8 20.4 10.5 4.5 3.4 Urban 10.9 26.0 20.2 18.1 11.2 13.5 Rural 28.0 44.0 17.1 5.6 3.3 2.1 Vientiane Capital 7.1 23.2 16.1 26.1 10.9 16.5 Vientiane 14.8 34.9 25.4 11.6 8.4 5.0 Savannakhet 25.9 37.6 17.5 8.4 5.4 5.1 Champasak 22.3 43.4 19.2 6.4 5.1 3.5 Khammuane 24.0 43.3 19.2 6.5 4.1 2.8 Luangprabang 31.0 39.3 14.5 6.4 5.8 3.0 Xayabury 12.7 48.6 23.7 7.2 4.5 3.3 Other regions 30.5 40.2 15.7 5.3 4.0 4.2
Source: 2007/08 and 2012/13 Lao PDR Earnings and Consumption Surveys.
Note: The large shifts in educational attainment between the two survey periods suggests that the variable may have
been coded differently in 2007/08 compared to 2012/13. The 2012/13 education results are very similar to the 2010
Labor Force Survey results.
38
Highest level completed.

53
Table 1.3: Descriptive statistics 2007/08 2010 2012/13
Total Male Female Total Male Female Total Male Female
Weekly wage 790,969 865,763 648,830 898,053 957,683 783,632 1,522,206 1,643,325 1,319,593
Weekly hrs. worked 36.977 36.939 37.017 44.387 44.810 43.965 33.941 34.395 33.485 Part-time 0.473 0.470 0.476 0.261 0.246 0.275 0.524 0.510 0.539 Years of schooling 5.432 5.603 5.239 5.183 5.936 4.477 4.744 5.445 4.104 Less than primary 0.392 0.372 0.414 0.213 0.184 0.244 0.249 0.210 0.291 Primary 0.313 0.307 0.320 0.379 0.365 0.395 0.374 0.370 0.379 Lower secondary 0.149 0.158 0.140 0.203 0.214 0.190 0.171 0.190 0.150 Upper secondary 0.083 0.090 0.075 0.084 0.094 0.073 0.095 0.103 0.086 Vocational 0.042 0.049 0.035 0.067 0.076 0.057 0.057 0.065 0.048 Tertiary 0.021 0.024 0.017 0.054 0.067 0.041 0.054 0.063 0.045 Agriculture 0.710 0.700 0.719 0.714 0.693 0.735 0.606 0.606 0.605 Mining 0.002 0.003 0.001 0.005 0.008 0.003 0.003 0.005 0.002 Garment 0.021 0.004 0.038 0.014 0.004 0.025 0.017 0.004 0.031 Other manuf. 0.053 0.063 0.042 0.036 0.039 0.034 0.045 0.052 0.037 Services 0.215 0.230 0.200 0.230 0.257 0.203 0.246 0.257 0.234 Public - - - 0.126 0.146 0.099 0.138 0.137 0.139 SOE - - - 0.012 0.016 0.008 0.018 0.019 0.015 Civil servant - - - 0.114 0.130 0.091 0.120 0.118 0.123 Urban 0.288 0.286 0.291 0.321 0.316 0.326 0.288 0.283 0.294 Vientiane Capital 0.115 0.112 0.118 0.134 0.131 0.137 0.120 0.118 0.123 Vientiane 0.075 0.076 0.075 0.095 0.100 0.090 0.082 0.083 0.081 Savannakhet 0.140 0.142 0.138 0.141 0.139 0.143 0.143 0.145 0.141 Champasak 0.107 0.106 0.107 0.104 0.103 0.105 0.110 0.110 0.110 Khammuane 0.060 0.059 0.060 0.061 0.060 0.062 0.050 0.050 0.050 Luangprabang 0.073 0.070 0.075 0.067 0.066 0.069 0.071 0.071 0.071 Xayabury 0.060 0.061 0.058 0.061 0.062 0.059 0.059 0.058 0.059
Sources: 2007/08 and 2012/13 Lao PDR Earnings and Consumption Survey and 2010 Lao PDR Labor Force and
Child Labor Survey.

54
Annex 2
Table 2.1: Real weekly wage by education level, 2007/08 Less than
primary Primary Lower-
secondary Upper
secondary Vocational Tertiary Total
Male 414,020 645,940 542,668 533,889 540,903 649,514 562,053 Female 335,861 330,879 625,515 460,343 355,335 528,877 425,584 Agriculture 274,292 406,332 432,028 287,046 385,298 447,793 370,834 Mining 693,989 793,024 1,101,136 510,085 178,914 678,620 Garment 233,344 410,940 758,517 373,430 480,680 398,380 521,657 Other manufacturing 369,504 331,307 463,054 703,902 768,412 556,702 485,959 Services 549,875 691,862 639,460 548,483 468,153 628,528 579,557 Urban 547,292 615,754 633,502 568,699 499,917 646,194 583,847 Rural 257,424 436,285 437,579 344,027 385,918 378,658 381,081 Vientiane Capital 568,316 417,988 579,819 456,504 494,032 725,935 535,290 Vientiane 252,606 385,259 460,777 316,778 475,211 371,132 399,005 Savannakhet 403,585 947,365 673,812 754,130 513,848 436,246 645,266 Champasak 506,690 660,699 518,946 308,921 438,773 445,513 495,819 Khammuane 274,149 950,251 418,984 770,521 469,574 623,835 Luangprabang 272,240 242,314 358,982 372,446 410,153 224,610 325,407 Xayabury 124,042 241,203 633,033 343,238 394,444 663,847 347,951 Other regions 317,186 389,172 536,049 467,436 415,095 455,877 420,152 Total 385,554 531,540 569,004 512,503 470,916 609,389 515,403
Notes: Nominal wages deflated to 2010 LCU using the CPI from the World Bank World Development Indicators.
Excludes income from agricultural production or household businesses.
Source: 2007/08 Lao PDR Earnings and Consumption Survey.
Table 2.2: Real weekly wage by education level, 2010 Less than
primary Primary Lower-
secondary Upper
secondary Vocational Tertiary Total
Male 426,844 381,088 549,024 626,822 494,336 721,431 551,565 Female 284,099 317,799 421,082 394,274 446,832 687,581 454,421 Agriculture 107,546 188,546 171,547 200,897 898,053 836,038 210,394 Mining 523,418 594,915 1,086,009 775,270 937,911 1,757,071 874,342 Garment 446,286 388,219 412,158 475,179 644,946 1,427,154 461,540 Other manufacturing 471,842 479,987 552,364 882,691 848,527 1,003,675 635,774 Services 456,473 373,092 505,539 510,850 456,981 681,358 520,974 Public 503,374 360,907 415,813 516,242 440,279 575,431 487,637 SOE 1,087,535 563,255 714,339 909,010 1,249,277 1,110,248 965,740 Civil servant 383,621 311,194 376,742 453,599 389,388 520,269 434,372 Private 347,697 358,195 563,880 598,825 656,767 1,171,720 555,679 Urban 479,419 377,565 482,941 548,879 497,902 742,301 555,118 Rural 291,623 340,699 565,579 552,144 443,758 559,229 456,548 Vientiane Capital 453,925 413,474 486,717 642,019 625,729 897,991 634,271 Vientiane 448,458 746,453 592,119 779,795 424,867 564,004 579,206 Savannakhet 238,437 243,459 434,695 336,904 458,550 565,499 400,565 Champasak 290,908 296,396 417,263 587,957 466,217 721,013 474,097 Khammuane 520,895 351,095 342,930 362,918 406,038 408,881 392,958 Luangprabang 306,136 280,192 533,539 392,287 527,471 768,053 478,684 Xayabury 61,779 178,955 611,272 452,448 361,107 308,793 336,223 Other regions 539,744 402,852 670,914 540,043 397,748 494,434 494,087 Total 372,597 358,749 514,199 550,047 476,762 709,930 518,872
Notes: Nominal wages deflated to 2010 LCU using the CPI from the World Bank World Development Indicators.
Excludes income from agricultural production or household businesses.
Source: 2010 Lao PDR Labor Force and Child Labor Survey.

55
Table 2.3: Real weekly wage by education level, 2012/13 Less than
primary Primary Lower-
secondary Upper
secondary Vocational Tertiary Total
Male 831,298 724,972 791,698 756,120 786,028 868,001 795,568 Feale 479,045 412,682 493,412 588,729 597,342 685,505 581,596 Agriculture 902,954 418,242 760,491 696,137 481,240 796,938 630,474 Mining 1,195,624 853,035 911,535 1,670,133 1,634,772 4,654,609 1,506,455 Garment 239,496 584,053 479,853 815,016 383,587 609,746 Other manufacturing 565,526 626,975 523,247 949,496 912,743 1,813,106 742,013 Services 628,613 703,903 738,642 651,463 704,293 734,866 706,490 Public 659,389 642,771 627,613 616,680 685,527 677,210 663,772 SOE 1,046,569 810,613 849,611 1,108,327 1,039,545 1,516,239 1,084,583 Civil servant 553,978 482,673 559,827 518,953 650,571 617,185 603,231 Private 736,561 623,567 734,795 766,385 782,416 1,126,539 776,308 Urban 953,872 659,570 715,019 714,185 708,501 797,230 744,137 Rural 517,012 600,177 675,737 659,773 703,200 765,834 661,017 Vientiane Capital 546,364 765,543 625,762 783,401 798,213 873,822 785,534 Vientiane 394,148 517,621 985,980 694,527 894,728 1,084,411 867,604 Savannakhet 2,123,647 448,688 664,779 659,291 606,477 743,476 711,487 Champasak 705,470 915,217 664,912 618,457 750,756 730,229 731,324 Khammuane 529,642 636,322 555,845 591,256 603,359 655,516 597,862 Luangprabang 632,913 538,346 815,695 687,216 575,049 950,439 701,149 Xayabury 482,870 563,231 833,614 514,052 475,228 377,382 552,334 Other regions 535,771 486,967 747,257 567,939 666,097 652,312 627,110 Total 708,991 627,450 699,339 699,499 706,832 791,297 716,638
Notes: Nominal wages deflated to 2010 LCU using the CPI from the World Bank World Development Indicators.
Excludes income from agricultural production or household businesses.
Source: 2012/13 Lao PDR Earnings and Consumption Survey.

56
Annex 3: Estimating the Returns to Education
Methodology
Returns to investment in schooling in Lao PDR are estimated using the human capital earnings function
method separately across different years (2007/08, 2010 and 2012/13). Two specifications are considered
to measure first the returns for years of schooling and second the returns for levels of schooling.
The earnings function with years of schooling is:
ln 𝑌𝑖 = 𝛼 + 𝛽𝑆𝑖 + 𝛾1𝐸𝑥𝑝𝑖 + 𝛾2𝐸𝑥𝑝𝑖2 + 𝜑𝐺𝑖 + 𝑢𝑖
where ln 𝑌𝑖 is the natural log of earnings of individual 𝑖, 𝑆 is the number of years of schooling, 𝐸𝑋𝑃 and
𝐸𝑋𝑃2 are years of experience and its square, and 𝐺 is a dummy variable equal to 1 for females (added as
a compensatory factor). The coefficient of interest, 𝛽, measures the average private rate of return to one
additional year of schooling, regardless of the level of schooling.
The earnings function method can also be used to estimate average private returns to different levels of
schooling by converting the continuous years of schooling variable, 𝑆, into a series of dummy variables
representing different levels of schooling achieved. The earnings function with levels of schooling is:
ln 𝑌𝑖 = 𝛼 + 𝛽1𝑃𝑖 + 𝛽2𝐿𝑆𝑖 + 𝛽3𝑈𝑆𝑉𝑖 + 𝛽4𝑇𝑖 + 𝛾1𝐸𝑥𝑝𝑖 + 𝛾2𝐸𝑥𝑝𝑖2 + 𝜑𝐺𝑖 + 𝑢𝑖
where 𝑃, 𝐿𝑆, 𝑈𝑆𝑉, and 𝑇 are dummy variables indicating primary, lower secondary, upper secondary or
vocational, and tertiary education (university or middle/high training) as the highest level achieved (and
in another specification as level completed).
Different stratifications are used by including controls to consider the returns to education by sector,
enterprise type, region, and province. Dummy variables are defined by sector (agriculture, mining,
garments, other manufacturing, and services), enterprise type (SOE and non-SOE), region (urban and
rural), and province (Vientiane capital, Vientiane, Savannakhet, Champasak, Khammuane,
Luangprabang, Xayabury, and other).
Data and variable definitions
The Impact of education on earnings is estimated for 2007/08 and 2012/13 using the Lao PDR Earnings
and Consumption Survey (LECS waves 4 and 5) and for 2010 using the Lao PDR Labor Force and Child
Labor Survey.
Data definitions for the 2010 Lao PDR Labor Force and Child Labor Survey are as follows: Weekly
wages are defined as the amount of money in KIP earned for the last seven days. Weekly hours worked
are total hours worked in the last seven days, summed across individuals’ primary job and other jobs.
Part-time work is defined as less than 40 hours a week (based on total weekly hours worked). Years of
experience is calculated as age minus years of schooling minus 6. Less than primary is defined as

57
individuals who have not completed primary school. Years of schooling is defined as highest grade
achieved.39
Level of schooling is a dummy variable of whether a student has completed that level, based
on highest level achieved (less than primary, primary, lower secondary, upper secondary, vocational, and
tertiary). Industry of employment relates to the main occupation in the past seven days, defined at the 2-
digit ISIC level. Agriculture covers 01-03, mining 05-09, garments 13-14, manufacturing 10-33, and
services are the remaining activities. Individuals with economic activity or employment status in the past
seven days as a civil servant, employee of public and private work, employee of private business,
employee of state enterprise, employer or self-employed are included in the sample. SOE or civil servant
are those whose economic activity or employment status in the past seven days was an employee of a
state enterprise or civil servant respectively, and public are those whose economic activity or
employment status in the past seven days was SOE or civil servant. Urban are those whose village type is
urban, while rural are those whose village type is rural with or without a road. Seven out of 17 provinces
were selected based on having more than 5 percent of the sample population.
Data definitions for the 2007/08 and 2012/13 Lao PDR Earnings and Consumption Survey (LECS) are as
follows: Weekly wages are defined as wages in cash from the previous week (excluding income from
agricultural production or household business). Because the questionnaire does not distinguish wages by
activity, we only include individuals with one job. Years of experience is calculated as age minus years
of schooling minus 6. Years of schooling is defined as highest grade achieved.40
Level of schooling is a
dummy variable of whether a student has completed that level (less than primary, primary, lower
secondary, upper secondary, vocational, and tertiary). Note that SOE, civil servant and public sector
categories are not available in the 2007/08 LECS.
Regression results
Note that wages include only four categories of earners: civil servants, employee of public and private
work; employee of private business, employee of state enterprise. As such, they exclude self-employed,
unpaid family workers, and employees not paid a wage. They also exclude business and agricultural
income. They also exclude individuals who work more than one job, because we cannot split wages per
activity.
39
According to the coding of the question, there are five grades in primary school, four grades in lower secondary,
three grades of upper secondary, two grades of low vocational school, three years of middle technical school, and
nine years of college / high technical school. Because lower secondary school is Lao PDR is only three years, the
fourth year was treated as the same as the first year of upper secondary / low vocational school. Individuals
reporting non-standard curriculum are excluded from the analysis. 40
According to the coding of the question, there are five grades in primary school, three grades in lower secondary,
three grades of upper secondary, three grades of vocational school, and five years of university / institute.

58
Table 3.1: Lao PDR earnings functions with year of schooling, 2007/08 No controls Sector Urban Province All controls
Years of schooling 0.083*** 0.044*** 0.046*** 0.065*** 0.032***
(0.007) (0.007) (0.007) (0.008) (0.008)
Years of experience 0.024*** 0.029*** 0.025*** 0.026*** 0.028***
(0.006) (0.006) (0.006) (0.006) (0.006)
Experience-squared -0.000*** -0.001*** -0.001*** -0.000*** -0.001***
(0.000) (0.000) (0.000) (0.000) (0.000)
Female -0.077 -0.146*** -0.184*** -0.114** -0.191***
(0.058) (0.055) (0.056) (0.058) (0.055)
Agriculture -1.594*** -1.282***
(0.216) (0.217)
Other manufacturing -0.826*** -0.686***
(0.226) (0.227)
Garment -0.519** -0.404
(0.247) (0.249)
Services -0.691*** -0.553**
(0.216) (0.216)
Urban 0.715*** 0.375***
(0.055) (0.061)
Vientiane capital 0.327*** -0.062
(0.072) (0.073)
Savannakhet 0.159* 0.059
(0.090) (0.084)
Champasak 0.424*** 0.219*
(0.119) (0.112)
Luangprabang -0.318** -0.421***
(0.147) (0.139)
Khammuane 0.212* 0.053
(0.119) (0.113)
Vientiane 0.189 -0.053
(0.119) (0.113)
Xayabury -0.446*** -0.346***
(0.105) (0.099)
Constant 12.054*** 13.354*** 12.014*** 12.095*** 13.133***
(0.104) (0.222) (0.100) (0.106) (0.222)
Observations 1,860 1,860 1,860 1,860 1,860
R-squared 0.08 0.20 0.16 0.12 0.24
Source: 2007/08 Lao PDR Earnings and Consumption Survey.
Notes: Standard errors in parentheses. *10 percent; **5 percent; ***1 percent significance level.

59
Table 3.2: Lao PDR earnings functions with year of schooling, 2010 No controls Sector Public SOE/Civil
servant Urban Province All controls
Years of schooling 0.086*** 0.071*** 0.091*** 0.094*** 0.080*** 0.081*** 0.068*** (0.003) (0.004) (0.004) (0.004) (0.004) (0.003) (0.004) Years of experience 0.007** 0.010*** 0.008** 0.010*** 0.008** 0.010*** 0.011*** (0.004) (0.003) (0.004) (0.004) (0.004) (0.004) (0.003) Experience-squared -0.000 -0.000 -0.000 -0.000 -0.000 -0.000 -0.000 (0.000) (0.000) (0.000) (0.000) (0.000) (0.000) (0.000) Female -0.133*** -0.100*** -0.131*** -0.114*** -0.143*** -0.138*** -0.100*** (0.034) (0.032) (0.034) (0.033) (0.034) (0.033) (0.032) Agriculture -1.959*** -1.802*** (0.108) (0.107) Other manufacturing -0.508*** -0.493*** (0.105) (0.104) Garment -0.367*** -0.521*** (0.124) (0.123) Services -0.788*** -0.780*** (0.095) (0.095) Public -0.077** -0.005 (0.038) (0.039) SOE 0.611*** (0.073) Civil servant -0.173*** (0.038) Urban 0.227*** 0.049 (0.034) (0.033) Vientiane capital 0.235*** 0.139*** (0.043) (0.044) Savannakhet -0.420*** -0.388*** (0.055) (0.053) Champasak -0.131** -0.073 (0.061) (0.058) Luangprabang -0.093 -0.144** (0.067) (0.064) Khammuane -0.057 -0.170** (0.075) (0.072) Vientiane 0.247*** 0.138** (0.072) (0.070) Xayabury -0.651*** -0.488*** (0.072) (0.070) Constant 12.229*** 13.170*** 12.207*** 12.150*** 12.163*** 12.279*** 13.199*** (0.059) (0.104) (0.060) (0.060) (0.060) (0.065) (0.107) Observations 4,345 4,337 4,345 4,345 4,345 4,345 4,337 R-squared 0.14 0.24 0.14 0.16 0.15 0.19 0.27
Source: 2010 Lao PDR Labor Force and Child Labor Survey.
Notes: Standard errors in parentheses. *10 percent; **5 percent; ***1 percent significance level.

60
Table 3.3: Lao PDR earnings functions with year of schooling, 2012/13 No controls Sector Public SOE/Civil
servant Urban Province All controls
Years of schooling 0.035*** 0.035*** 0.052*** 0.059*** 0.033*** 0.032*** 0.045*** (0.004) (0.004) (0.005) (0.005) (0.004) (0.004) (0.005) Years of experience 0.028*** 0.029*** 0.030*** 0.030*** 0.027*** 0.027*** 0.030*** (0.005) (0.004) (0.004) (0.004) (0.005) (0.004) (0.004) Experience-squared -0.000*** -0.000*** -0.000*** -0.000*** -0.000*** -0.000*** -0.000*** (0.000) (0.000) (0.000) (0.000) (0.000) (0.000) (0.000) Female -0.196*** -0.178*** -0.187*** -0.182*** -0.202*** -0.224*** -0.182*** (0.037) (0.037) (0.036) (0.036) (0.037) (0.037) (0.037) Agriculture -0.894*** -0.924*** (0.125) (0.126) Other manufacturing -0.544*** -0.592*** (0.124) (0.124) Garment -0.620*** -0.740*** (0.161) (0.163) Services -0.678*** -0.656*** (0.115) (0.118) Public -0.285*** -0.235*** (0.039) (0.043) SOE 0.231*** (0.072) Civil servant -0.390*** (0.040) Urban 0.043 -0.041 (0.037) (0.037) Vientiane capital 0.255*** 0.146*** (0.044) (0.047) Savannakhet 0.123* 0.041 (0.071) (0.070) Champasak 0.225*** 0.171*** (0.066) (0.065) Luangprabang 0.168** 0.089 (0.082) (0.082) Khammuane 0.085 -0.043 (0.070) (0.070) Vientiane 0.271*** 0.130* (0.075) (0.076) Xayabury -0.133* -0.230*** (0.069) (0.068) Constant 13.301*** 13.948*** 13.220*** 13.163*** 13.298*** 13.235*** 13.906*** (0.071) (0.128) (0.071) (0.070) (0.071) (0.075) (0.134) Observations 1,912 1,912 1,912 1,912 1,912 1,912 1,912 R-squared 0.07 0.10 0.10 0.13 0.07 0.10 0.14
Source: 2012/13 Lao PDR Earnings and Consumption Survey.
Notes: Standard errors in parentheses. *10 percent; **5 percent; ***1 percent significance level.

61
Table 3.4: Lao PDR earnings functions with levels of schooling completed, 2007/08 No controls Sector Urban Province All controls
Primary 0.174** 0.066 0.074 0.182** 0.056
(0.083) (0.077) (0.080) (0.082) (0.077)
Lower secondary 0.566*** 0.341*** 0.326*** 0.487*** 0.245***
(0.091) (0.086) (0.089) (0.090) (0.086)
Upper secondary 0.727*** 0.347*** 0.388*** 0.593*** 0.245***
(0.094) (0.091) (0.094) (0.095) (0.092)
Vocational 0.725*** 0.249 0.342* 0.655*** 0.185
(0.183) (0.174) (0.178) (0.182) (0.173)
Tertiary 1.041*** 0.576*** 0.590*** 0.838*** 0.440***
(0.105) (0.105) (0.107) (0.111) (0.109)
Years of experience 0.022*** 0.027*** 0.024*** 0.024*** 0.027***
(0.006) (0.006) (0.006) (0.006) (0.006)
Experience-squared -0.000*** -0.000*** -0.000*** -0.000*** -0.001***
(0.000) (0.000) (0.000) (0.000) (0.000)
Female -0.076 -0.142** -0.181*** -0.114** -0.189***
(0.058) (0.055) (0.056) (0.058) (0.055)
Agriculture -1.631*** -1.310***
(0.216) (0.218)
Other manufacturing -0.874*** -0.716***
(0.227) (0.228)
Garment -0.587** -0.449*
(0.249) (0.251)
Services -0.727*** -0.577***
(0.217) (0.217)
Urban 0.709*** 0.369***
(0.055) (0.061)
Vientiane capital 0.331*** -0.059
(0.072) (0.074)
Savannakhet 0.152* 0.053
(0.090) (0.085)
Champasak 0.414*** 0.210*
(0.119) (0.113)
Luangprabang -0.314** -0.412***
(0.147) (0.139)
Khammuane 0.197* 0.042
(0.119) (0.113)
Vientiane 0.173 -0.064
(0.119) (0.113)
Xayabury -0.441*** -0.341***
(0.105) (0.099)
Constant 12.297*** 13.533*** 12.161*** 12.253*** 13.263***
(0.103) (0.225) (0.099) (0.106) (0.226)
Observations 1,860 1,860 1,860 1,860 1,860
R-squared 0.09 0.21 0.16 0.12 0.24
Source: 2007/08 Lao PDR Earnings and Consumption Survey.
Notes: Standard errors in parentheses. *10 percent; **5 percent; ***1 percent significance level.

62
Table 3.5: Lao PDR earnings functions with levels of schooling completed, 2010 No controls Sector Public SOE/Civil
servant Urban Province All controls
Primary 0.283*** 0.236*** 0.293*** 0.288*** 0.265*** 0.241*** 0.199*** (0.077) (0.074) (0.077) (0.076) (0.077) (0.076) (0.073) Lower secondary 0.814*** 0.581*** 0.841*** 0.851*** 0.764*** 0.720*** 0.524*** (0.077) (0.075) (0.078) (0.077) (0.078) (0.076) (0.075) Upper secondary 1.001*** 0.764*** 1.060*** 1.068*** 0.948*** 0.901*** 0.698*** (0.080) (0.079) (0.083) (0.082) (0.081) (0.079) (0.080) Vocational 1.034*** 0.849*** 1.115*** 1.167*** 0.991*** 0.996*** 0.827*** (0.076) (0.076) (0.081) (0.080) (0.076) (0.075) (0.079) Tertiary 1.346*** 1.162*** 1.426*** 1.455*** 1.259*** 1.226*** 1.071*** (0.078) (0.077) (0.082) (0.081) (0.079) (0.076) (0.081) Years of experience 0.014*** 0.016*** 0.015*** 0.016*** 0.014*** 0.014*** 0.016*** (0.004) (0.004) (0.004) (0.004) (0.004) (0.004) (0.004) Experience-squared -0.000** -0.000** -0.000* -0.000** -0.000** -0.000* -0.000** (0.000) (0.000) (0.000) (0.000) (0.000) (0.000) (0.000) Female -0.082** -0.076** -0.081** -0.067** -0.095*** -0.098*** -0.082** (0.034) (0.033) (0.034) (0.033) (0.034) (0.033) (0.032) Agriculture -1.961*** -1.810*** (0.113) (0.113) Other manufacturing -0.468*** -0.450*** (0.107) (0.106) Garment -0.377*** -0.510*** (0.125) (0.125) Services -0.798*** -0.776*** (0.097) (0.097) Public -0.109*** -0.015 (0.038) (0.039) SOE 0.562*** (0.072) Civil servant -0.204*** (0.038) Urban 0.194*** 0.051 (0.034) (0.033) Vientiane capital 0.264*** 0.178*** (0.043) (0.044) Savannakhet -0.286*** -0.281*** (0.056) (0.055) Champasak -0.066 0.002 (0.061) (0.058) Luangprabang -0.018 -0.061 (0.067) (0.064) Khammuane -0.109 -0.196*** (0.077) (0.074) Vientiane 0.309*** 0.198*** (0.072) (0.070) Xayabury -0.570*** -0.401*** (0.072) (0.070) Constant 12.254*** 13.211*** 12.247*** 12.216*** 12.191*** 12.301*** 13.214*** (0.082) (0.117) (0.082) (0.081) (0.082) (0.086) (0.121) Observations 4,178 4,170 4,178 4,178 4,178 4,178 4,170 R-squared 0.13 0.22 0.13 0.16 0.14 0.18 0.25
Source: 2010 Lao PDR Labor Force and Child Labor Survey.
Notes: Standard errors in parentheses. *10 percent; **5 percent; ***1 percent significance level.

63
Table 3.6: Lao PDR earnings functions with levels of schooling completed, 2012/13 No controls Sector Public SOE/Civil
servant Urban Province All controls
Primary 0.011 -0.001 -0.004 -0.022 0.009 0.037 0.020 (0.078) (0.078) (0.077) (0.076) (0.078) (0.078) (0.076) Lower secondary 0.174** 0.156** 0.216*** 0.222*** 0.166** 0.169** 0.190** (0.078) (0.078) (0.077) (0.076) (0.079) (0.078) (0.077) Upper secondary 0.216*** 0.212*** 0.326*** 0.353*** 0.203** 0.191** 0.280*** (0.080) (0.081) (0.080) (0.079) (0.081) (0.080) (0.082) Vocational 0.248** 0.268** 0.442*** 0.479*** 0.239** 0.256** 0.417*** (0.118) (0.118) (0.119) (0.117) (0.118) (0.117) (0.118) Tertiary 0.375*** 0.386*** 0.572*** 0.642*** 0.355*** 0.361*** 0.524*** (0.077) (0.080) (0.081) (0.079) (0.079) (0.078) (0.084) Years of experience 0.024*** 0.026*** 0.026*** 0.026*** 0.024*** 0.024*** 0.027*** (0.005) (0.005) (0.005) (0.004) (0.005) (0.005) (0.005) Experience-squared -0.000*** -0.000*** -0.000*** -0.000*** -0.000*** -0.000*** -0.000*** (0.000) (0.000) (0.000) (0.000) (0.000) (0.000) (0.000) Female -0.202*** -0.188*** -0.198*** -0.196*** -0.207*** -0.231*** -0.196*** (0.037) (0.037) (0.037) (0.036) (0.038) (0.037) (0.037) Agriculture -0.829*** -0.860*** (0.125) (0.127) Other manufacturing -0.559*** -0.606*** (0.124) (0.124) Garment -0.602*** -0.717*** (0.162) (0.163) Services -0.671*** -0.650*** (0.115) (0.117) Public -0.297*** -0.246*** (0.040) (0.043) SOE 0.212*** (0.072) Civil servant -0.403*** (0.041) Urban 0.041 -0.037 (0.037) (0.038) Vientiane capital 0.252*** 0.145*** (0.044) (0.047) Savannakhet 0.117 0.038 (0.072) (0.071) Champasak 0.217*** 0.158** (0.067) (0.067) Luangprabang 0.162* 0.090 (0.083) (0.082) Khammuane 0.084 -0.029 (0.071) (0.071) Vientiane 0.274*** 0.141* (0.076) (0.076) Xayabury -0.148** -0.245*** (0.069) (0.069) Constant 13.491*** 14.131*** 13.504*** 13.490*** 13.483*** 13.396*** 14.125*** (0.086) (0.137) (0.084) (0.083) (0.086) (0.090) (0.141) Observations 1,852 1,852 1,852 1,852 1,852 1,852 1,852 R-squared 0.06 0.08 0.09 0.12 0.06 0.09 0.13
Source: 2012/13 Lao PDR Earnings and Consumption Survey.
Notes: Standard errors in parentheses. *10 percent; **5 percent; ***1 percent significance level.

64
Annex 4
Table 4.1: Size of exporting vs. non-exporting manufacturing firms (average number of
full-time employees) Year Exporting
status Lao PDR Full sample
Employees Skilled
employees
Unskilled
employees
Employees Skilled
employees
Unskilled
employees
2006
non-exporter 20 11 8 n.a. n.a. n.a.
exporter 112 49 62 n.a. n.a. n.a.
2009
non-exporter 52 - - n.a. n.a. n.a.
exporter 262 - - n.a. n.a. n.a.
2012
non-exporter 46 20 27 84 32 55
exporter 202 109 93 249 125 126
Source: World Bank Staff calculations based on data from World Bank enterprise surveys. Full sample of countries
includes China, Belarus, Nepal, West Bank and Gaza, Georgia, Azerbaijan, Kyrgyz Republic, Kazakhstan,
Bangladesh, Armenia, Uganda, Ukraine, Uzbekistan, Mongolia, Moldova, Tanzania, Kenya, Bulgaria, Serbia,
Zambia, Bosnia and Herzegovina, Albania, Kosovo, Croatia, FYR of Macedonia, Slovenia, Montenegro, Djibouti,
Jordan, Romania, Latvia, Democratic Republic of the Congo, Tajikistan, Estonia, Hungary, Lithuania, Poland,
Slovak Republic, Turkey, Ghana and Madagascar. Data for China and Lao PDR are for 2012, and data for the rest of
the sample are for 2013.

65
Table 4.2: Size of exporting vs. non-exporting manufacturing firms: Comparing Lao PDR,
Vietnam and Cambodia (number of full-time employees) Year Export
ing
status
Lao PDR Vietnam Cambodia
Employe
es
Skilled
employe
es
Unskille
d
employe
es
Employe
es
Skilled
employe
es
Unskille
d
employe
es
Employe
es
Skilled
employe
es
Unskille
d
employe
es
2005
non-
export
er 137 87 49
export
er 584 416 164
2006
non-
export
er 20 11 8
export
er 112 49 62
2007
non-
export
er 90 48 42
export
er 1027 841 186
2009
non-
export
er 52 102 50 45
export
er 262 535 306 232
2012
non-
export
er 46 20 27
export
er 202 109 93
Source: World Bank Staff calculations based on data from World Bank enterprise surveys.

66
Table 4.3: Export intensity of manufacturing firms: Lao PDR and the rest of the World
Industry
Lao PDR (2012) Full sample (2013)
Percent of
exporting firms
Percent of exports in
total sales
Percent of
exporting firms
Percent of exports in
total sales
Total 42.7 87.5 35.0 49.2
Food 33.3 72.5 28.7 46.5
Wood products &
furniture 44.4 66.3 29.1 45.9
Non-metallic and plastic
materials 31.4 40.3
Metals and machinery 35.0 42.6
Leather 16.1 34.1
Textiles 50.0 77.5 48.1 54.3
Garments 76.9 94.5 47.8 70.9
Electronics 100.0 100.0 39.4 44.1
Chemicals and
pharmaceuticals 100.0 100.0 39.0 37.6
Auto and auto
components 32.9 48.6
Other manufacturing 29.5 47.0
Source: World Bank Staff calculations based on data from World Bank enterprise surveys for 2012 and 2013. Full
sample of countries includes China, Belarus, Nepal, West Bank and Gaza, Georgia, Azerbaijan, Kyrgyz Republic,
Kazakhstan, Bangladesh, Armenia, Uganda, Ukraine, Uzbekistan, Mongolia, Moldova, Tanzania, Kenya, Bulgaria,
Serbia, Zambia, Bosnia and Herzegovina, Albania, Kosovo, Croatia, FYR of Macedonia, Slovenia, Montenegro,
Djibouti, Jordan, Romania, Latvia, Democratic Republic of the Congo, Tajikistan, Estonia, Hungary, Lithuania,
Poland, Slovak Republic, Turkey, Ghana and Madagascar. Data for China and Lao PDR are for 2012.

67
Table 4.4: Lao PDR’s export intensity of manufacturing firms compared to Vietnam and
Cambodia
Industry
Lao PDR (2012) Vietnam (2009) Cambodia (2007)
Percent of
exporting
firms
Percent of
exports in
total sales
Percent of
exporting
firms
Percent of
exports in
total sales
Percent of
exporting
firms
Percent of
exports in
total sales
Total 42.7 87.5 47.2 63.0 34.1 97.2
Food 33.3 72.5 46.3 63.6 18.2 75.0
Non-metallic and
plastic materials 39.7 52.5 33.3 55.0
Metals and
machinery 31.3 47.2
Textiles 50.0 77.5 48.5 64.3 100.0 95.0
Garments 76.9 94.5 74.6 88.2 97.8 99.9
Electronics 100.0 100.0 63.6 29.4
Chemicals and
pharmaceuticals 100.0 100.0 44.0 15.4
Other
manufacturing 40.0 66.3 46.5 64.0 25.0 70.0
Source: World Bank Staff calculations based on data from World Bank enterprise surveys for 2012 for Lao PDR,
2009 for Vietnam and 2007 for Cambodia.

68
Annex 5: Testing the Link between Exporting and Labor-Market Outcomes in Lao PDR
and a Global Sample of Countries
Methodology
To identify the effect of firms’ sales structure on labor outcomes, we estimate the effect of within-firm
changes in the share of sales that are exported on the level of employment (total, skilled, unskilled,
female) and average wages (total, female) of the firm, the latter being a proxy for the quality of workers
employed in each firm. The analysis follows a methodology similar to Bambrilla, Lederman and Porto
(2012) and Cebeci, Lederman and Rojas (2013). The relationship between exporting and labor-market
outcomes is specified as:
𝑦𝑓,𝑖,𝑡 = 𝜂𝑓 + 𝜂𝑖 + 𝜂𝑡 + 𝛽1𝑥𝑓,𝑖,𝑡 + 𝛽2𝑠𝑓,𝑖,𝑡 + 𝜀𝑓,𝑖,𝑡
where 𝑦𝑓,𝑖,𝑡 stands for the log of firm 𝑓’s employment level or average wage in industry 𝑖 in year𝑡; 𝑥𝑓,𝑖,𝑡 is
the share of firm-level exports in total sales; 𝑠𝑓,𝑖,𝑡,𝑑 is the log of total firm-level sales; 𝜂 are firm-,
industry-, and year-specific effects to control for other factors that can affect firm size and sales; 𝛽1 is a
first parameter to be estimated, which is an export-sales elasticity of employment and wages; and the
error term 𝜀𝑓,𝑖,𝑡 is assumed to be white noise.
To control for firm-specific effects, the model is estimated in first-differences, which wipes out the
influence of time-invariant firm-specific characteristics. Industry and year dummy variables are included
to control for industry- and year-specific effects. Controlling for changes in total sales avoids potential
biases in the estimation of 𝛽1 due to exogenous changes in export conditions. For example, a positive
external shock that increases exports could possibly also increase domestic sales if firms invest part of the
money from increased exports to stimulate domestic sales as well. Such an effect would over-estimate the
quasi-elasticity of labor market outcomes vis-à-vis the share of exports in total sales. Alternatively, the
positive external shock could decrease domestic sales if the supply response is inelastic and the firm
decides to serve only the export market at the expense of the domestic market, in which case the bias
would go in the opposite direction. In practice, the econometric model that is estimated is:
∆𝑦𝑓,𝑖,𝑡 = 𝜂𝑖 + 𝜂𝑡 + 𝛽1∆𝑥𝑓,𝑖,𝑡 + 𝛽2∆𝑠𝑓,𝑖,𝑡 + ∆𝜀𝑓,𝑖,𝑡.
OLS estimates of the elasticities 𝛽1 may be biased due to reverse causality, as changes in firm size and
wages may affect the structure of firms’ sales (given that exporters are larger and more productive than
non-exporters). Following Brambilla, Lederman and Porto (2012) and Cebeci, Lederman and Rojas
(2013), our methodology will use exogenous fluctuations in exchange rates interacted with firms’ initial
exposure to external markets as instrumental variables to identify causal effects of export growth within a
firm (as a share of total sales) on a firm’s labor market outcomes. The first-stage regression specification
is:
∆𝑥𝑓,𝑖,𝑡 = 𝜂𝑖 + 𝜂𝑡 + 𝛼1𝑥𝑓,𝑖,𝑡=0 ∗ ∆𝑅𝐸𝐸𝑅𝑡 + 𝛼2∆𝑠𝑓,𝑖,𝑡 + 𝛾𝑓,𝑖,𝑡
where 𝑥𝑓,𝑖,𝑡=0 ∗ ∆𝑅𝐸𝐸𝑅𝑡 is the initial share of exports in total sales of each firm41
times the real effective
(trade weighted) exchange rate of the country. A valid instrument is one that is correlated with the
41
The first year a firm appears in the sample is when it first exported, such that the initial share of exports is not zero
for any firm.

69
endogenous regressor and uncorrelated with the error term. The choice of instruments is valid given that
(i) a change in a countries’ effective exchange rate affects export competitiveness of a firm, (ii) the initial
level of firms’ exposure to exports is pre-determined, and (iii) the assumption that a country’s trade-
weighted exchange rate is not influenced by any single firm. Because the specification in levels has firm-
level fixed effects, which control for time-invariant firm-specific factors, first differencing the model is
not necessary to remove the effect of such factors. However, estimating the specification in changes
arguably allows for a stronger instrument, given that changes in the effective exchange rate as opposed to
the level are a better exogenous correlate to export competitiveness. Moreover, while the effective
exchange rate is common to all firms within a country at a point in time, the interaction with a firms’
initial export or destination-market share allows the instrument to vary over time and across firms (so it
can explain variation in changes in export shares over time and across firms).42
We test the model using firm-level survey data. After the preceding relationship has been estimated for
Lao PDR, we build a panel dataset of firms across a large number of countries worldwide. This dataset
enables us to estimate the average elasticity in the world as a baseline for comparison. The first and
second stages of the estimation therefore become:
∆𝑥𝑓,𝑖,𝑐,𝑡 = 𝜂𝑖 + 𝜂𝑐 + 𝜂𝑡 + 𝛼1𝑥𝑓,𝑖,𝑐,𝑡=0 ∗ ∆𝑅𝐸𝐸𝑅𝑐,𝑡 + 𝛼2∆𝑠𝑓,𝑖,𝑐,𝑡 + 𝛾𝑓,𝑖,𝑐,𝑡
∆𝑦𝑓,𝑖,𝑐,𝑡 = 𝜂𝑖 + 𝜂𝑐 + 𝜂𝑡 + 𝛽1∆𝑥𝑓,𝑖,𝑐,𝑡 + 𝛽2∆𝑠𝑓,𝑖,𝑐,𝑡 + ∆𝜀𝑓,𝑖,𝑐,𝑡
where 𝜂𝑐 is the fixed effect for country 𝑐.
Finally, the analysis considers whether a country’s level of competitiveness affects the magnitude of the
elasticity; that is, whether the level of competitiveness affects the employment and wage responses to
within-firm changes in sales structure. We use a panel dataset of firms across countries worldwide where
variation in competitiveness indicators can be observed. The impact of exports on employment is allowed
to depend on the level of the competitiveness indicator in each country by also interacting the firm’s
change in export shares with these indicators in the model’s specification. The methodology is based on
that of Calderón and Poggio (2011) and the second-stage estimation model is:
∆𝑦𝑓,𝑖,𝑐,𝑡 = 𝜂𝑖 + 𝜂𝑐 + 𝜂𝑡 + 𝛽1∆𝑥𝑓,𝑖,𝑐,𝑡 + 𝛽2∆𝑥𝑓,𝑖,𝑐,𝑡 ∗ 𝑍𝑐,𝑡 + 𝛽3∆𝑠𝑓,𝑖,𝑐,𝑡 + ∆𝜀𝑓,𝑖,𝑐,𝑡
where 𝑍𝑐,𝑡 represents a competiveness indicator for country 𝑐 in year 𝑡. The competitiveness indicators
that we test relate to institutions, macroeconomy, higher education and training, market efficiency,
business sophistication, and an index combining all of these. As there are now two endogenous variables,
we use two instruments so the coefficients are exactly identified, where the second instrument is equal to
the first instrument interacted with the competitiveness indicator. The first-stage estimation model is:
∆𝑥𝑓,𝑖,𝑐,𝑡 = 𝜂𝑖 + 𝜂𝑐 + 𝜂𝑡 + 𝛼1𝑥𝑓,𝑖,𝑐,𝑡=0 ∗ ∆𝑅𝐸𝐸𝑅𝑐,𝑡 + 𝛼2𝑥𝑓,𝑖,𝑐,𝑡=0 ∗ 𝑍𝑐,𝑡 ∗ ∆𝑅𝐸𝐸𝑅𝑐,𝑡 + 𝛼3∆𝑠𝑓,𝑖,𝑐,𝑡 + 𝛾𝑓,𝑖,𝑐,𝑡
∆𝑥𝑓,𝑖,𝑐,𝑡 ∗ 𝑍𝑐,𝑡 = 𝜂𝑖 + 𝜂𝑐 + 𝜂𝑡 + 𝛼1𝑥𝑓,𝑖,𝑐,𝑡=0 ∗ ∆𝑅𝐸𝐸𝑅𝑐,𝑡 + 𝛼2𝑥𝑓,𝑖,𝑐,𝑡=0 ∗ 𝑍𝑐,𝑡 ∗ ∆𝑅𝐸𝐸𝑅𝑐,𝑡 + 𝛼3∆𝑠𝑓,𝑖,𝑐,𝑡 +
𝛾𝑓,𝑖,𝑐,𝑡.
42
Changes in firms’ sales may also be endogenous to the specification, for example if firm size is correlated with
unobservable firm characteristics that change over time. Notwithstanding, because we are less interested in
estimating this coefficient, and because not including it potentially biases the coefficient we are interested in
estimating, we maintain the specification.
70
Variable definitions and data sources
We utilize firm-level data to estimate the effects of within-firm changes in sales structure on firm-level
employment and average wages. The datasets include firm-level employment (total, skilled, unskilled,
and female workers), firm-level average wage (total), the share of exports in firm-level total sales, and
total sales.
For the country-specific analysis for Lao PDR as well as the cross-country analysis we use World Bank
Business Environment and Enterprise Performance Surveys for 60 countries43
conducted intermittently
during the years 2002-2013. Data on effective exchange rates is collected from Darvas (2012). Data on
indicators of competiveness is collected from the World Economic Forum’s Global Competiveness
Report.
Export share: Percentage of establishment’s sales that are exported. Firm-level export shares are
collected from World Bank enterprise surveys, which includes direct or indirect exports (sold
domestically to a third party that exports products). Note that because a panel dimension is necessary to
conduct the analysis of changes in export shares and changes in labor market outcomes, the selection of
firms was limited to those observed in the data across multiple years. A firm was included in the sample if
it was observed in any two consecutive sample years, had exported in one of those years, and had non-
zero exports in the first year or a previous year.
Real sales: Firms’ total turnover. Sales are collected from the World Bank enterprise surveys, then
adjusted to real 2005 international currency units using the consumer price index and the PPP conversion
factor reported by the World Bank World Development Indicators.
Employment: Number of persons employed. Firm-level employment is collected from World Bank
enterprise surveys, and measures the number of permanent, full-time employees at the end of last fiscal
year plus number of full-time seasonal/temporary workers employed at the end of last fiscal year.44
Permanent, full-time employees are defined in the World Bank enterprise survey questionnaire as all paid
employees that are contracted for a term of one or more fiscal years and/or have a guaranteed renewal of
their employment contract and that work eight or more hours per day. Full-time, temporary workers are
defined as all paid short-term (i.e., for less than a fiscal year) employees with no guarantee of renewal of
their employment contract and work eight or more hours per day.45
Female employment: Number of female persons employed. Firm-level female employment is collected
from World Bank enterprise surveys.
43
Sample of countries includes: Afghanistan, Albania, Angola, Argentina, Armenia, Azerbaijan, Bangladesh,
Belarus, Bolivia, Bosnia and Herzegovina, Botswana, Bulgaria, Burkina Faso, Cape Verde, Cameroon, Chile,
Colombia, Democratic Republic of the Congo, Croatia, Czech Republic, Ecuador, El Salvador, Estonia, Georgia,
Guatemala, Honduras, Hungary, Kazakhstan, Kenya, Kyrgyz Republic, Lao PDR, Latvia, Lithuania, FYR of
Macedonia, Malawi, Mali, Mexico, Moldova, Morocco, Nepal, Pakistan, Panama, Paraguay, Peru, Poland, Romania,
Russian Federation, Rwanda, Senegal, Serbia, Slovak Republic, Tajikistan, Tanzania, Turkey, Uganda, Ukraine,
Uruguay, Uzbekistan, Venezuela, and Zambia. 44
It is possible that our ability to only measure full-time workers (permanent or temporary) may be driving our
results. 45
Whereas the World Bank enterprise survey questionnaire asks for the average length of employment of all full-
time temporary employees in the fiscal year, data on this variable is missing for most firms.
71
Skilled employment: Number of full-time employees who were skilled production workers at the end of
the fiscal year. Firm-level skilled employment is collected from World Bank enterprise surveys. Unskilled
employment is total employment minus skilled employment.46
Real wages: Total annual cost of labor or remuneration (including wage, salary, premium, bonus, social
payments, etc. of both permanent and temporary employees) which was accrued or paid in kind to
employees (including income tax) during the year divided by employment. Firm-level average wages are
calculated from the World Bank enterprise surveys, then adjusted to real 2005 international currency units
using the consumer price index and the PPP conversion factor reported by the World Bank World
Development Indicators.
Real effective exchange rate: The nominal effective exchange rate (a measure of the value of a currency
against a weighted average of several foreign currencies) divided by a price deflator or index of costs,
where 2007=100. The real effective exchange rate was collected from the IMF’s International Financial
Statistics, country-specific sources and Darvas (2012).
Indicators of competiveness: National indicators of competitiveness capture factors that affect
productivity and competiveness, and are grouped into different pillars. The six indicators used in the
analysis relate to institutions, macro economy, higher education and training, market efficiency, business
sophistication, and overall competitiveness (which combines these five factors). Data is collected from
the World Economic Forum’s Global Competiveness Report.
46
The World Bank enterprise survey questionnaire asks what percent of the establishment’s labor force employed at
the end of the fiscal year had a university degree, but this data is not available in the panel surveys.

72
Regression results
Table 5.1: Lao PDR’s elasticity of labor market outcomes with respect to exporting
OLS IV
Employment Female employment Wages Employment Female employment Wages
Export share -0.0008 (0.004)
-0.0021 (0.004)
-0.0041 (0.006)
0.0125933 (0.015)
0.0076 (0.014)
-0.0365 (0.030)
Observations 38 33 35 38 33 35
Note: * Significant at the 15 % level, ** at the 10 % level, *** at the 5% level. Standard errors are in parentheses.
Source: World Bank Staff calculations based on data from World Bank enterprise surveys.
Table 5.2: Global elasticity of labor market outcomes with respect to exporting
OLS IV
Employment
Skilled employment
Unskilled employment
Female employment
Wages Employment Skilled employment
Unskilled employment
Female employment
Wages
Export share 0.0021*** (0.000)
0.0014* (0.001)
0.0022*** (0.001)
0.0011 (0.002)
-0.0003 (0.001)
-0.0015 (0.025)
0.0503 (0.046)
-0.0100 (0.021)
-0.0167 (0.022)
-0.0263 (0.035)
Observations 2,299 1,661 1,516 241 1,628 2,299 1,661 1,516 241 1,628
Note: * Significant at the 20 % level, ** at the 10 % level, *** at the 5% level. Standard errors are in parentheses.
Source: World Bank Staff calculations based on data from World Bank enterprise surveys.
Table 5.3: Global elasticity of labor market outcomes with respect to exporting, Lao PDR-specific effect
OLS IV
Employment Female employment Wages Employment Female employment Wages
Export share 0.0020*** (0.0005148)
0.0013 (0.0019254)
-0.0002 (0.0009826)
-0.0014 (0.0258677)
-0.0076 (0.0195538)
-0.0273 (0.0371537)
Export share*LaoPDR
0.0013586 (0.002)
-0.000925 (0.004)
-0.0009287 (0.003)
-0.0007436 (0.027)
0.0336622 (0.047)
-0.0388899 (0.061)
Observations 2,299 241 1,628 2,299 241 1,628
Note: * Significant at the 15 % level, ** at the 10 % level, *** at the 5% level. Standard errors are in parentheses.
Source: World Bank Staff calculations based on data from World Bank enterprise surveys.

73
Table 5.4: Impact of export share on employment and wages, conditional on competitive
indicators, OLS estimates
OLS
Overall competitivenes
s
Institutions
Macroeconomic environment
Higher educatio
n and training
Market efficienc
y
Business sophisticatio
n
Employment
Export share 0.0116** (0.007)
0.0030 (0.004)
0.0187*** (0.006)
0.0050** (0.003)
0.0028 (0.005)
-0.0005 (0.007)
Export share*Competiveness indicator
-0.0025* (0.002)
-0.0003 (0.001)
-0.0037*** (0.001)
-0.0009 (0.001)
-0.0002 (0.001)
0.0006 (0.002)
Skilled employment
Export share -0.0110 (0.013)
-0.0028 (0.009)
0.0039 (0.012)
-0.0029 (0.005)
-0.0103 (0.011)
-0.0217** (0.013)
Export share*Competiveness indicator
0.0031 (0.003)
0.0011 (0.002)
-0.0006 (0.003)
0.0012 (0.001)
0.0030 (0.003)
0.0057** (0.003)
Unskilled employment
Export share 0.0102 (0.012)
0.0109* (0.008)
0.0097 (0.010)
0.0079* (0.005)
0.0021 (0.010)
0.0050 (0.012)
Export share*Competiveness indicator
-0.0021 (0.003)
-0.0025 (0.002)
-0.0017 (0.002)
-0.0017 (0.001)
-0.0001 (0.003)
-0.0008 (0.003)
Female employment
Export share 0.0324 (0.042)
0.0016 (0.029)
0.0217 (0.057)
0.0223 (0.018)
0.0037 (0.041)
-0.0002 (0.049)
Export share*Competiveness indicator
-0.0079 (0.011)
-0.0002 (0.007)
-0.0047 (0.013)
-0.0063 (0.005)
-0.0007 (0.011)
0.0003 (0.012)
Wages Export share -0.0086 (0.013)
0.0030 (0.008)
-0.0096 (0.012)
-0.0031 (0.005)
-0.0053 (0.011)
-0.0001 (0.015)
Export share*Competiveness indicator
0.0021 (0.003)
-0.0009 (0.002)
0.0020 (0.002)
0.0008 (0.001)
0.0013 (0.003)
-0.0001 (0.004)
Note: * Significant at the 15 % level, ** at the 10 % level, *** at the 5% level. Standard errors are in parentheses.
Industry fixed effects are defined at the 2-digit level of the ISIC classification.
Source: World Bank Staff calculations based on data from World Bank enterprise surveys and World Economic
Forum’s Global Competiveness Report.

74
Table 5.5: Impact of export share on employment and wages, conditional on competitive
indicators, IV estimates
IV
Overall competitivenes
s
Institutions
Macroeconomic environment
Higher educatio
n and training
Market efficienc
y
Business sophisticatio
n
Employment
Export share 0.0333 (0.084)
-0.0040 (0.077)
0.2106 (0.469)
0.0334 (0.046)
0.0647 (0.122)
0.0532 (0.125)
Export share*Competiveness indicator
-0.0049 (0.021)
0.0031 (0.017)
-0.0388 (0.096)
-0.0042 (0.012)
-0.0122 (0.032)
-0.0095 (0.032)
Skilled employment
Export share -4.0524 (21.111)
0.1753** (0.093)
-0.0439 (0.188)
-0.2506* (0.194)
1.1256 (1.965)
-3.4719 (12.078)
Export share*Competiveness indicator
0.9373 (4.881)
-0.0388* (0.026)
0.0185 (0.041)
0.0590* (0.045)
-0.2645 (0.464)
0.8203 (2.848)
Unskilled employment
Export share 0.2408 (0.349)
0.0032 (0.061)
-0.1357 (0.113)
0.0584 (0.074)
0.8418 (3.014)
0.3708 (0.594)
Export share*Competiveness indicator
-0.0540 (0.082)
-0.0010 (0.016)
0.0291 (0.024)
-0.0118 (0.017)
-0.2006 (0.727)
-0.0859 (0.141)
Female employment
Export share 0.0143 (0.194)
-0.6811 (1.179)
-0.3392* (0.214)
-0.0893 (0.153)
-0.0130 (0.196)
0.1355 (0.369)
Export share*Competiveness indicator
-0.0084 (0.048)
0.1668 (0.301)
0.0775* (0.052)
0.0233 (0.043)
-0.0010 (0.051)
-0.0394 (0.091)
Wages Export share 0.0027 (0.117)
0.0236 (0.115)
0.0229 (0.229)
-0.0015 (0.071)
-0.0224 (0.167)
-0.0691 (0.284)
Export share*Competiveness indicator
-0.0056 (0.031)
-0.0140 (0.036)
-0.0089 (0.048)
-0.0043 (0.018)
-0.0003 (0.045)
0.0104 (0.071)
Note: * Significant at the 15 % level, ** at the 10 % level, *** at the 5% level. Standard errors are in parentheses.
Industry fixed effects are defined at the 2-digit level of the ISIC classification.
Source: World Bank Staff calculations based on data from World Bank enterprise surveys and World Economic
Forum’s Global Competiveness Report.

75
Annex 6: Labor mobility and labor adjustment costs in Lao PDR
Methodology
The Trade and Labor Adjustment Costs toolkit was designed to analyze how labor markets in developing
countries adjust to permanent trade-related shocks. Examples of such shocks are changes in trade policy,
whether at home or abroad, and enduring changes in international trade patterns that affect prices in
global markets. These are distinguished from transitory shocks and other short-run business cycle
fluctuations in that the shocks that result from economy-wide reallocations of labor are not temporary but
permanent.
Economic Model underpinning the Trade and Labor Adjustment Costs Toolkit
Labor Mobility Costs are estimated based on observed worker transitions between sectors in response
to differences in sectoral wages. Using a structural model of workers’ choice of employment sector, a
worker employed in sector 𝑖 chooses to remain employed in sector 𝑖 or move to sector 𝑗 but by
incurring a cost (for simplicity we assume the economy has only two sectors). This cost has a fixed
component 𝐶 (average mobility cost caused by labor market frictions), and a worker-specific
component 𝜀𝑖,𝑗 (the idiosyncratic cost of moving from sector 𝑖 to sector 𝑗 ) that captures personal
circumstances such as family constraints or other preferences.
The worker’s expected welfare in sector 𝑖, 𝐸𝑉𝑖, is the present discounted value of her real wage, a
sector-specific fixed non-pecuniary benefit, and an option value reflecting the possibility of moving to
a different sector with a higher wage. If the wage in sector 𝑗 rises, a worker in sector 𝑖 will experience
an increase in welfare due to the higher option value even if she never actually moves. None of the
components (wage, sector-specific non-pecuniary benefit, and option value) is specific to the worker,
only the sector, whereas the idiosyncratic moving cost is particular to the worker.
In each period, the worker decides whether or not to move, based on which sector offers a higher
expected welfare net of moving costs. The expected welfare benefit of moving from sector i to sector j,
(𝐸𝑉𝑗 − 𝐸𝑉𝑖), depends on the wage differential between sectors. The worker will move from sector 𝑖 to
sector 𝑗 if the expected welfare benefit of moving (𝐸𝑉𝑗 − 𝐸𝑉𝑖) exceeds the cost of doing so (𝐶 + 𝜀𝑖,𝑗),
namely if:
𝐸𝑉𝑗 − 𝐸𝑉𝑖 ≥ 𝐶 + 𝜀𝑖,𝑗.
Labor mobility costs can be estimated from the model using data on observed employment flows and
wage differentials between sectors. The model of sectoral employment choices generates flows of
workers across sectors of the economy, where the solution to the model is the employment allocation.
The flows of workers across sectors depend on the model’s parameters, inclusive of the mobility costs
𝐶. It is then possible to estimate these parameters by matching the predicted flows of workers simulated
by the model with the observed flows of workers in the data. Different estimation methodologies are
used, depending on the data available.
The resulting mobility cost estimates represent a key input variable for simulating the dynamic
adjustment paths to the new equilibrium employment-wage outcomes in the affected sector and the
remaining sectors of the economy following an exogenous trade-related shock. The market-clearing
employment and wage path solutions reflect workers’ optimization of their utility dependent on
expected wages and costs to change sectors.

76
Labor Adjustment Costs are estimated for each country facing a hypothetical trade-related sectoral
shock, and are calculated as the difference in workers’ welfare between the potential post-shock
equilibrium outcome with zero labor mobility costs and the actual post-shock equilibrium in the
presence of labor mobility costs.
The change in relative prices and real wages following the shock will induce some workers to
reallocate their labor across sectors. The magnitude of this reallocation depends on the size of the labor
mobility costs. The new resulting equilibrium welfare of a worker, 𝑉, is compared to her initial pre-
shock welfare, 𝑉𝑝𝑟𝑒 , and her potential maximum welfare, 𝑉𝑚𝑎𝑥 , if mobility costs were zero. The
maximum potential gains to trade (PG) are therefore 𝑉𝑚𝑎𝑥 − 𝑉𝑝𝑟𝑒, and actual gains to trade (G) are
𝑉 − 𝑉𝑝𝑟𝑒. Labor adjustment costs (LAC) representing the forgone welfare gains to trade due to labor
mobility costs are therefore:
LAC = PG – G = Vmax – V.
Source: Artuç, Lederman, and Porto (2013)
Data
Estimation of labor mobility costs requires panel data on workers’ sector of employment, average sectoral
wages, and individual worker characteristics over at least two time periods. Such data was obtained from
the Lao PDR Expenditure and Consumption Survey (LECS). The LECS is a household survey conducted
over five rounds, the latest two in 2007/08 and 2012/13. Although the survey was not designed as a panel
survey (at either the household or individual level), the household-level identifier was kept constant
between the last two rounds, making it possible to track households over the 2007/08 and 2012/13 waves,
and subsequently individuals within those households based on demographic characteristics (gender and
year of birth). Within the households that could be matched over time (32 percent of the sample), about
30 percent of the individuals could be tracked. While this creates possible attrition bias within the sample,
this is a caveat to the analysis, as this data is the only source available in Lao PDR that meets the
requirements. In addition, labor mobility costs were estimated first for the whole population, and
subsequently by skilled versus unskilled workers, and male versus female workers.
Labor adjustment costs are subsequently backed out from simulations of trade-related shocks with costly
labor mobility, which requires additional information on sectoral consumption shares and the sectoral
wage bill as a share of value added. Ideally, such data would be obtained from country-level national
accounts (which was not available for Lao PDR). Instead, the needed data was obtained from the data
underlying the GTAP database for 2011.
Given the reduced sample size, sectors of employment were chosen to be as disaggregated as possible,
while ensuring enough degrees of freedom for the estimations. The sectors of employment were based on
the ISIC Rev. 3 industrial classification. They include: agriculture, forestry, fishing (1-3); mining and
quarrying (5-9); garment (13 and 14); other manufacturing (10-12, 15-33); and services (35-99)47
. The
sample includes individuals aged 15 and older, to be consistent with the standard international definition
47
Services include: electricity, gas and water supply; construction; trade, restaurants and accommodation services;
transport, storage and communications; financial institutions, real estate, leasing and services companies; and
community, social and individual services.

77
of the labor force. For individuals reporting multiple sectors of employment, the sector in which the most
hours were worked was used.
In addition, the methodology allows for individuals to flow in and out of unemployment and the labor
force, by including a residual sector. Unemployed individuals were identified as those that were inactive
(had not worked during the past seven days, and did not have a permanent job if had not worked) but had
searched for work in the past seven days. Out of labor force were identified as those that were inactive
and had not searched for work in the past seven days.
Average sectoral wages were determined by using the individual-level income data recorded in the LECS
and calculating the average income at the sectoral level of the sample. It considers wages in cash during
the last month, but excludes household business income and income from agricultural production.
Because the survey does not ask for wages by source of income (just total wages last month), only
individuals who report one activity are included. Unemployed and out of the labor force are assumed to
earn no income.
The skill level of a worker is based on educational attainment. An individual was considered skilled if she
had obtained/completed a level of education higher than upper-secondary (vocational or
university/institute).
Table 6.1. Sectoral employment share (%), 2007/08
Total Skilled Unskilled Male Female
Agriculture 73.5 1.9 66.5 36.4 37.2
Mining 0.3 0.0 0.3 0.2 0.1
Garment 1.8 0.2 1.9 0.1 1.7
Other manufacturing 4.9 0.5 5.2 3.1 1.8
Services 19.4 6.0 17.6 10.6 8.8
Source: 2007/08 Lao PDR Earnings and Consumption Survey.
Table 6.2. Sectoral employment share (%), 2012/13
Total Skilled Unskilled Male Female
Agriculture 68.6 1.7 61.6 34.3 34.3
Mining 0.4 0.1 0.4 0.3 0.1
Garment 1.7 0.1 1.7 0.2 1.5
Other manufacturing 4.6 0.4 4.7 2.7 1.9
Services 24.7 9.2 20.1 13.3 11.4
Source: 2007/08 Lao PDR Earnings and Consumption Survey.
Table 6.3. Average weekly sectoral wages (Kip), 2012/13
Total Skilled Unskilled Male Female
Agriculture 827,890 983,987 857,810 980,399 562,034
Mining 3,181,510 8,478,571 2,310,369 3,692,105 1,417,636
Garment 1,016,258 1,162,500 1,029,611 1,075,385 1,006,145
Other manufacturing 1,904,433 5,077,188 1,512,014 2,214,654 1,249,865
Services 1,658,153 1,536,658 1,847,048 1,672,816 1,633,123
Source: 2007/08 Lao PDR Earnings and Consumption Survey.
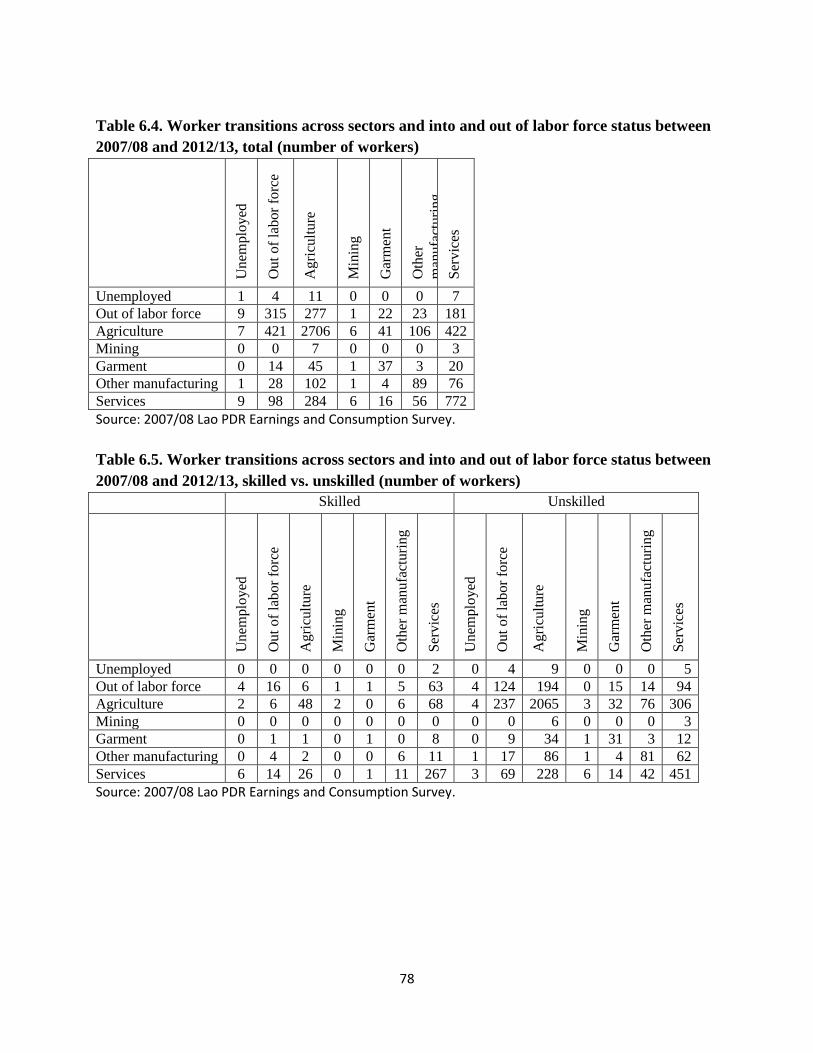
78
Table 6.4. Worker transitions across sectors and into and out of labor force status between
2007/08 and 2012/13, total (number of workers)
Un
emplo
yed
Ou
t o
f la
bor
forc
e
Ag
ricu
ltu
re
Min
ing
Gar
men
t
Oth
er
man
ufa
cturi
ng
Ser
vic
es
Unemployed 1 4 11 0 0 0 7
Out of labor force 9 315 277 1 22 23 181
Agriculture 7 421 2706 6 41 106 422
Mining 0 0 7 0 0 0 3
Garment 0 14 45 1 37 3 20
Other manufacturing 1 28 102 1 4 89 76
Services 9 98 284 6 16 56 772
Source: 2007/08 Lao PDR Earnings and Consumption Survey.
Table 6.5. Worker transitions across sectors and into and out of labor force status between
2007/08 and 2012/13, skilled vs. unskilled (number of workers)
Skilled Unskilled
Unem
plo
yed
Out
of
labor
forc
e
Agri
cult
ure
Min
ing
Gar
men
t
Oth
er m
anufa
cturi
ng
Ser
vic
es
Unem
plo
yed
Out
of
labor
forc
e
Agri
cult
ure
Min
ing
Gar
men
t
Oth
er m
anufa
cturi
ng
Ser
vic
es
Unemployed 0 0 0 0 0 0 2 0 4 9 0 0 0 5
Out of labor force 4 16 6 1 1 5 63 4 124 194 0 15 14 94
Agriculture 2 6 48 2 0 6 68 4 237 2065 3 32 76 306
Mining 0 0 0 0 0 0 0 0 0 6 0 0 0 3
Garment 0 1 1 0 1 0 8 0 9 34 1 31 3 12
Other manufacturing 0 4 2 0 0 6 11 1 17 86 1 4 81 62
Services 6 14 26 0 1 11 267 3 69 228 6 14 42 451
Source: 2007/08 Lao PDR Earnings and Consumption Survey.
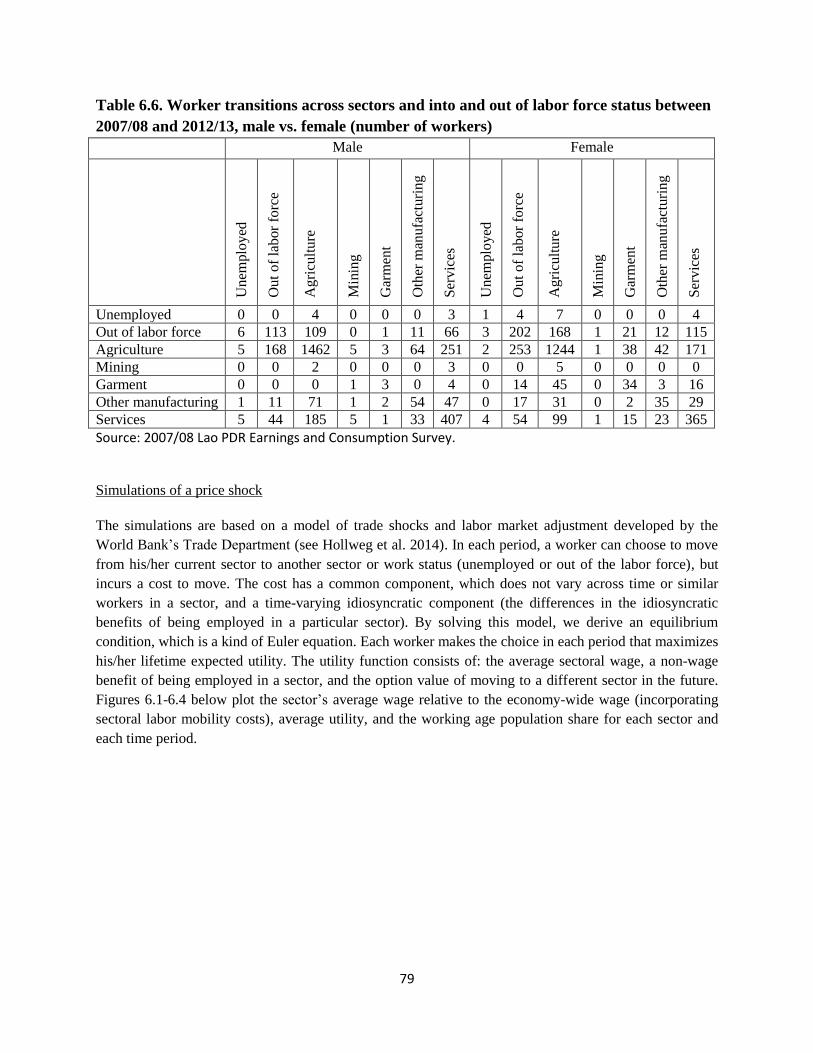
79
Table 6.6. Worker transitions across sectors and into and out of labor force status between
2007/08 and 2012/13, male vs. female (number of workers)
Male Female
Un
emplo
yed
Ou
t o
f la
bor
forc
e
Ag
ricu
ltu
re
Min
ing
Gar
men
t
Oth
er m
anu
fact
uri
ng
Ser
vic
es
Un
emplo
yed
Ou
t o
f la
bor
forc
e
Ag
ricu
ltu
re
Min
ing
Gar
men
t
Oth
er m
anu
fact
uri
ng
Ser
vic
es
Unemployed 0 0 4 0 0 0 3 1 4 7 0 0 0 4
Out of labor force 6 113 109 0 1 11 66 3 202 168 1 21 12 115
Agriculture 5 168 1462 5 3 64 251 2 253 1244 1 38 42 171
Mining 0 0 2 0 0 0 3 0 0 5 0 0 0 0
Garment 0 0 0 1 3 0 4 0 14 45 0 34 3 16
Other manufacturing 1 11 71 1 2 54 47 0 17 31 0 2 35 29
Services 5 44 185 5 1 33 407 4 54 99 1 15 23 365
Source: 2007/08 Lao PDR Earnings and Consumption Survey.
Simulations of a price shock
The simulations are based on a model of trade shocks and labor market adjustment developed by the
World Bank’s Trade Department (see Hollweg et al. 2014). In each period, a worker can choose to move
from his/her current sector to another sector or work status (unemployed or out of the labor force), but
incurs a cost to move. The cost has a common component, which does not vary across time or similar
workers in a sector, and a time-varying idiosyncratic component (the differences in the idiosyncratic
benefits of being employed in a particular sector). By solving this model, we derive an equilibrium
condition, which is a kind of Euler equation. Each worker makes the choice in each period that maximizes
his/her lifetime expected utility. The utility function consists of: the average sectoral wage, a non-wage
benefit of being employed in a sector, and the option value of moving to a different sector in the future.
Figures 6.1-6.4 below plot the sector’s average wage relative to the economy-wide wage (incorporating
sectoral labor mobility costs), average utility, and the working age population share for each sector and
each time period.

80
Figure 6.1: Post-shock wages, utility and labor shares, skilled workers
Figure 6.2: Post-shock wages, utility and labor shares, unskilled workers
Source: 2007/08 and 2012/13 Lao PDR Earnings and Consumption Survey and Global Trade Analysis Project (GTAP).
Note: Sector 1 is agriculture/mining; sector 2 is garments; sector 3 is other manufacturing; sector 4 is services; and sector 5 is unemployed or out of the labor
force. The y-axis measures the relative average wage/level of utility/working age population share, and the x-axis shows time measured in years (the price shock
occurs at time 0). Relative wages reflect embedded labor mobility costs and therefore do not average 1.
0.5
11.5
Re
lative
ave
rag
e w
ag
e
0 5 10 15 20 25Time
W1 W2 W3
W4 W5
Wages
32.5
33
33.5
34
Wo
rke
r u
tilit
y le
ve
l
0 5 10 15 20 25Time
V1 V2 V3
V4 V5
Utility
0.1
.2.3
.4.5
Sh
are
of
wo
rkin
g a
ge
po
pu
latio
n
0 5 10 15 20 25Time
L1 L2 L3
L4 L5
Labor
0.2
.4.6
.81
Re
lative
ave
rag
e w
ag
e
0 5 10 15 20 25Time
W1 W2 W3
W4 W5
Wages
26
26.5
27
27.5
28
Wo
rke
r u
tilit
y le
ve
l
0 5 10 15 20 25Time
V1 V2 V3
V4 V5
Utility
0.1
.2.3
.4
Sh
are
of
wo
rkin
g a
ge
po
pu
latio
n0 5 10 15 20 25
Time
L1 L2 L3
L4 L5
Labor

81
Figure 6.3: Post-shock wages, utility and labor shares, male workers
Figure 6.4: Post-shock wages, utility and labor shares, female workers
Source: 2007/08 and 2012/13 Lao PDR Earnings and Consumption Survey and Global Trade Analysis Project (GTAP).
Note: Sector 1 is agriculture/mining; sector 2 is garments; sector 3 is other manufacturing; sector 4 is services; and sector 5 is unemployed or out of the labor
force. The y-axis measures the relative average wage/level of utility/working age population share, and the x-axis shows time measured in years (the price shock
occurs at time 0). Relative wages reflect embedded labor mobility costs and therefore do not average 1.
0.2
.4.6
.81
Re
lative
ave
rag
e w
ag
e
0 5 10 15 20 25Time
W1 W2 W3
W4 W5
Wages
26.5
27
27.5
28
28.5
Wo
rke
r u
tilit
y le
ve
l0 5 10 15 20 25
Time
V1 V2 V3
V4 V5
Utility
0.1
.2.3
.4
Sh
are
of
wo
rkin
g a
ge
po
pu
latio
n
0 5 10 15 20 25Time
L1 L2 L3
L4 L5
Labor
0.2
.4.6
.8
Re
lative
ave
rag
e w
ag
e
0 5 10 15 20 25Time
W1 W2 W3
W4 W5
Wages22
22.5
23
23.5
24
Wo
rke
r u
tilit
y le
ve
l
0 5 10 15 20 25Time
V1 V2 V3
V4 V5
Utility
.1.2
.3.4
Sh
are
of
wo
rkin
g a
ge
po
pu
latio
n
0 5 10 15 20 25Time
L1 L2 L3
L4 L5
Labor

82
The World Bank Lao PDR
Patouxay Nehru Road
P.O Box: 345
Tel: +856 (21) 266 200
Fax: +856 (21) 266 299
Website: www.worldbank.org/lao
The World Bank
1818 H Street, NW
Washington, D.C. 20433, USA
Tel: +1 (202) 4731000
Fax: +1 (202) 4776391
Website: www.worldbank.org