the kpmg green tax index...foreword and about the kpmg green tax index why the index increasingly,...
TRANSCRIPT

July 2017
kpmg.com
An exploration of green tax incentives and penalties
The KPMG Green Tax Index

© 2017 KPMG LLP, a Delaware limited liability partnership and the U.S. member firm of the KPMG network of independent member firms affiliated with KPMG International Cooperative (“KPMG International”), a Swiss entity. All rights reserved. The KPMG name and logo are registered trademarks or trademarks of KPMG International. NDPPS 655445

ContentsForeword and About the KPMG Green Tax Index 04
The Index: country rankings 06
Indicator sources 12
Key findings 13
Appendices 104
Contact information 110
© 2017 KPMG LLP, a Delaware limited liability partnership and the U.S. member firm of the KPMG network of independent member firms affiliated with KPMG International Cooperative (“KPMG International”), a Swiss entity. All rights reserved. The KPMG name and logo are registered trademarks or trademarks of KPMG International. NDPPS 655445
The following information is not intended to be “written advice concerning one or more Federal tax matters” subject to the requirements of section 10.37(a)(2) of Treasury Department Circular 230.
The information contained herein is of a general nature and based on authorities that are subject to change. Applicability of the information to specific situations should be determined through consultation with your tax adviser.
3The KPMG Green Tax Index

Foreword and About the KPMG Green Tax IndexWhy the IndexIncreasingly, climate change pervades tax policy decisions. In fact, the use of tax policy to drive green behavior continues to grow throughout the world. As of July 2017, 155 out of 197 parties ratified the Paris Agreement which chartered new grounds, bringing many nations into a common cause to undertake ambitious efforts to combat climate change.1 In addition, the Paris Agreement provides enhanced support to assist developing countries to participate in the fight against climate change. In 2018, and every five years thereafter, the participating parties will review their collective efforts related to the goals set forth in the Paris Agreement.
Whether due to the Paris Agreement or other factors, there has been an increasing number of tax policy changes in the sustainability space. KPMG has created the second Green Tax Index to further increase awareness of the evolving and complex global tax policy landscape. Similar to the initial Index, this version strives to encourage companies to explore the opportunities of green tax incentives and to reduce exposure to green tax penalties. Different from the first Index, this report uses various data sources, such as Organisation for Economic Co-Operation and Development (OECD), World Bank,
and others, to provide a picture of the effectiveness of various governmental regulations on behavior, the scope of environmental policies, the degree to which environmental policies affect environmentally harmful behavior, and the revenue generated from environment-related policies.
What did we findSeveral regions of the world that did not previously focus on green tax policy are now increasing investments in this space. Of note, as of 2014, the countries of Latin America produced 53 percent of their electricity from renewable sources, compared with a world average of 22 percent.2
Colombia, in 2015, established an action plan with strategies, including incentives, to achieve reduced environmental impacts, improving quality of life and access to clean and renewable energy sources.3 Chile established a carbon tax in 2014, as part of its government’s Tax Reform initiative. In addition, in 2016, Chile implemented a green tax on all new vehicles sold. Mexico, which in 2013 had little focus on environmental protection, has recently addressed the issue. In 2016, Mexico passed the General Law for Environmental Protection (“Ley General de Equilibrio Ecológico y la Protección al Ambiente”), which imposes penalties on entities that create environmental
damage (not just as a result of carbon emissions). Mexico also passed the General Law for Climate Change (“Ley General de Cambio Climático”). This law establishes an additional National Registry of Emissions (RENE) where entities with yearly emissions greater than 25,000 tons of CO2 equivalents are required to report annual emissions.
Also, in 2016, Argentina’s President Mauricio Macri launched Plan RenovAr, focusing on the development of clean energy, in particular solar and wind power,4 as well as long-standing tax policies to ensure the success of renewables. The plan allows tax incentives for businesses that develop clean energy projects.
These examples are some of the many reasons that Latin America is rising to the top of the renewable energy market.
None of these Latin American countries have an Environmental Performance Index rating, which indicates large and well-implemented programs and policies. All have lower Environmental Policy Stringency rankings, which indicate stricter policies, such as taxes and penalties. This makes sense as typically the programs in these countries are newer and less likely to yet have made an impact.
1 See http://unfccc.int/paris_agreement/items/9485.php.2 See “Latin America is set to become a leader in alternative energy,” The Economist, http://www.economist.com/news/
americas/21711307-power- andean-sun-latin-america-set-become- leader-alternative-energy3 See National Programme for the Rational and Efficient Use of Energy.4 See “President Macri Launches Renewable Energy Plan ‘RenovAr,’ The Argentina Independent, May 18, 2016.”
© 2017 KPMG LLP, a Delaware limited liability partnership and the U.S. member firm of the KPMG network of independent member firms affiliated with KPMG International Cooperative (“KPMG International”), a Swiss entity. All rights reserved. The KPMG name and logo are registered trademarks or trademarks of KPMG International. NDPPS 655445

Other areas of the world, such as the Nordic and other European countries, continue to rank extremely high in the effectiveness of their regulatory policies. Many of these countries have the environmental resources (such as wind power) and long-standing tax policy to ensure the success of renewable energy. Denmark, Finland, Germany, the Netherlands, and Sweden rank in the top ten of the Environmental Performance Index rating. Sweden and Finland rank in the top ten for environmental policy stringency. In addition, Denmark, Finland, and Sweden rank as the top three countries, evaluated as part of this review, in environmental tax revenues, which provides a measure of how much revenue the government receives from environment-related policies.
Environmental policy began as far back as the 1970s. At that time, Denmark introduced a packaging tax to reduce waste and increase the reuse and recycle rate of packaging. In the early 1990s, Denmark introduced a carbon tax. Finland taxes coal, natural gas, fuel peat, tall oil, and liquid fuels. Sulfur-free light fuel oil used in heating and machinery is taxed at a lower rate than fuel containing sulfur. Sweden taxes many fuels used for transportation and heating, while some renewable fuels are
completely exempt. In addition, investment subsidies are provided for the purchase of photovoltaic-panels as well as for production of electricity from wind or solar sources. The Netherlands and Germany also post high results. Germany provides a value-added-tax (VAT) refund for the purchase of renewable energy equipment, as well as an energy tax exemption for the production of electricity from renewable sources. In the Netherlands, depreciation is available for qualifying environmentally friendly assets under the Willekeurige Afschrijving Milieu-Investeringen program.
On June 1, 2017, the United States withdrew from the Paris Agreement. It is still uncertain what steps the United States government under the new administration will take to encourage behavior, or whether sweeping changes to its income tax system will be enacted, either of which could change behavior.
About the IndexThis Index is organized by country, providing various indices, as well as a summary of various incentives or penalties in effect, organized by the following nine policy areas:
— Carbon and climate change
— Renewable energy and fuels
— Green vehicles
— Green buildings
— Water
— Material resources and waste
— Pollution and ecosystems
— Innovation
— Food
Who may be interestedEvery country listed on the Index has a green tax system that warrants attention. Countries with no green tax incentives or penalties are not included in the sample of countries reviewed here. Companies that operate or plan to operate in these markets, particularly in those with a significant number of incentives or penalties, are advised to fully evaluate such policies, as well as the before and after tax effects, to create a complete business model.
© 2017 KPMG LLP, a Delaware limited liability partnership and the U.S. member firm of the KPMG network of independent member firms affiliated with KPMG International Cooperative (“KPMG International”), a Swiss entity. All rights reserved. The KPMG name and logo are registered trademarks or trademarks of KPMG International. NDPPS 655445
5The KPMG Green Tax Index

The Index: country rankingsCountry Rank
Development of environment-related technologies, % all technologies
Rank
Environmentally related government R&D budget, % total government R&D
RankEnergy public RD&D budget, % GDP
RankRelative advantage in environment-related technology
Rank
Development of environment-related technologies, % inventions worldwide
Rank
Diffusion of environment-related technologies, % all technologies
Argentina 36 6.22% 5 4.26% - - 36 0.62 16 0.62% 17 10.49%
Australia 22 9.16% 4 4.34% 14 0.02% 22 0.92 16 0.62% 24 9.30%
Brazil 17 9.85% - - - - 17 0.99 21 0.18% 25 9.25%
Canada 15 10.12% 7 3.90% 8 0.03% 15 1.01 7 2.14% - -
Chile 1 19.36% 14 2.25% - - 1 1.94 28 0.07% 16 10.69%
Colombia 34 6.61% - - - - 34 0.66 35 0.02% 22 9.49%
Czech Republic 9 12.14% 17 1.87% 14 0.02% 9 1.21 22 0.15% 18 10.40%
Denmark 2 18.36% 15 2.11% 4 0.05% 2 1.84 12 0.98% 1 21.60%
Finland 13 10.72% 20 1.09% 1 0.11% 13 1.07 15 0.67% 2 15.13%
France 8 12.24% 10 3.00% 3 0.05% 8 1.23 5 4.48% 4 14.67%
Germany 7 12.44% 9 3.11% 8 0.03% 7 1.25 3 12.69% 5 14.52%
India 25 8.84% - - - - 25 0.88 10 1.21% 32 4.88%
Indonesia 5 12.87% - - - - 5 1.29 32 0.03% - -
Ireland 35 6.40% 21 0.97% 13 0.02% 35 0.64 25 0.13% 6 14.29%
Italy 21 9.21% 11 2.91% 8 0.03% 22 0.92 8 1.68% 26 8.75%
Japan 16 10.06% 16 1.94% 2 0.06% 15 1.01 1 23.53% 23 9.46%
Malaysia 29 8.35% - - - - 28 0.84 26 0.09% 6 14.29%
Mexico 22 9.16% 18 1.59% - - 19 0.96 26 0.09% 14 11.23%
Netherlands 27 8.46% 22 0.58% 8 0.03% 27 0.85 11 1.13% - -
New Zealand 28 8.41% 1 9.41% 19 0.01% 28 0.84 23 0.14% 8 13.80%
Poland 4 13.13% 2 5.89% 14 0.02% 4 1.31 20 0.25% 10 12.12%
Portugal 26 8.73% 6 4.04% 20 0.00% 26 0.87 29 0.06% 11 11.98%
Romania 20 9.55% 3 4.92% - - 19 0.96 31 0.04% 9 13.16%
Russia 11 11.12% 25 0.14% - - 11 1.11 18 0.32% 30 6.82%
Singapore 24 9.13% - - - - 24 0.91 19 0.29% 27 8.53%
South Africa 18 9.71% - - - - 18 0.97 24 0.13% 3 14.70%
South Korea 19 9.59% 12 2.35% 4 0.05% 19 0.96 4 9.32% 19 9.88%
Spain 3 13.28% 8 3.50% 18 0.01% 3 1.33 14 0.72% 12 11.71%
Sweden 10 11.37% 19 1.48% 7 0.04% 10 1.14 9 1.22% 13 11.51%
Switzerland 32 7.39% 24 0.22% 4 0.05% 32 0.74 13 0.83% 21 9.51%
Taiwan - - - - - - - - - - 29 7.66%
Thailand 30 8.00% - - - - 30 0.80 32 0.03% - -
Ukraine 31 7.45% - - - - 31 0.75 30 0.05% 31 6.73%
United Arab Emirates 6 12.67% - - - - 6 1.27 32 0.03% - -
United Kingdom 12 11.02% 13 2.34% 17 0.02% 12 1.10 6 3.17% 15 10.94%
United States 14 10.40% 23 0.38% 8 0.03% 14 1.04 1 23.53% 28 8.41%
Vietnam 33 7.19% - - - - 33 0.72 36 0.01% 20 9.52%
The following rankings can be evaluated against each economy’s tax policy to determine the effectiveness of their actions.
© 2017 KPMG LLP, a Delaware limited liability partnership and the U.S. member firm of the KPMG network of independent member firms affiliated with KPMG International Cooperative (“KPMG International”), a Swiss entity. All rights reserved. The KPMG name and logo are registered trademarks or trademarks of KPMG International. NDPPS 655445
© 2017 KPMG LLP, a Delaware limited liability partnership and the U.S. member firm of the KPMG network of independent member firms affiliated with KPMG International Cooperative (“KPMG International”), a Swiss entity. All rights reserved. The KPMG name and logo are registered trademarks or trademarks of KPMG International. NDPPS 655445
7The KPMG Green Tax Index

Country Rank
Environmental Tax Revenue (% of total tax revenue)
Rank EPI Rank EPS RankCO2 Emissions (% YoY)
Rank
Renewable Energy Consumption (% of total consumption)
RankGDP per Unit of Energy Use
Rank GDP per Capita Rank CPI yr/yr
Argentina 23 4.0% 23 79.84 - - 22 -1.3% 24 8.8% - - 24 12502.82 - -
Australia 8 7.8% 9 87.22 7 3.12 24 0.7% 25 8.4% 27 7.67 6 51850.27 19 1.48%
Brazil 26 1.9% 25 78.90 22 0.78 36 7.2% 2 43.6% 14 10.63 29 8726.90 3 6.29%
Canada 24 3.7% 13 85.06 11 2.84 17 -1.2% 15 20.6% 33 5.86 10 42210.13 20 1.36%
Chile 14 6.1% 26 77.67 - - 32 2.7% 8 30.3% 17 9.88 23 13576.00 10 2.75%
Colombia 20 4.9% 27 75.93 - - 38 12.2% 10 26.3% 2 18.39 32 5792.18 4 5.75%
Czech Republic 7 7.9% 15 84.67 16 2.30 11 -2.4% 22 10.9% 30 7.05 22 18286.33 12 2.01%
Denmark 6 8.2% 3 89.21 1 4.18 34 4.6% 9 27.6% 6 13.79 4 53743.97 30 0.50%
Finland 11 6.6% 1 90.68 3 3.35 8 -5.2% 3 39.1% 31 6.42 9 43169.22 25 1.10%
France 21 4.4% 6 88.20 6 3.19 21 0.1% 18 12.6% 19 9.70 15 38127.65 28 0.66%
Germany 17 5.4% 17 84.26 9 3.01 31 2.4% 19 12.4% 13 10.93 11 41902.28 16 1.70%
India 1 13.4% 37 53.58 20 1.15 26 0.8% 4 39.0% 22 8.40 37 1723.30 6 4.94%
Indonesia - - 35 65.85 21 1.10 1 -20.0% 5 37.1% 12 11.38 34 3604.29 9 3.03%
Ireland 9 7.6% 12 86.60 19 2.05 12 -2.1% 27 7.0% 4 16.26 2 62562.27 35 -0.20%
Italy 4 8.8% 16 84.48 12 2.77 6 -6.7% 20 12.1% 7 13.09 17 30507.18 31 0.50%
Japan 19 5.1% 22 80.59 14 2.63 27 1.1% 30 4.5% 16 9.95 13 38917.29 32 0.34%
Malaysia 27 1.5% 29 74.23 - - 37 8.1% 28 6.8% 24 7.76 27 9360.47 13 1.83%
Mexico 28 -1.8% 30 73.59 - - 30 1.6% 23 9.4% 15 10.45 30 8554.62 8 3.36%
Netherlands 3 9.3% 20 82.03 2 3.63 22 0.4% 29 4.7% 18 9.85 8 45282.63 29 0.52%
New Zealand 22 4.2% 7 88.00 - - 15 -1.6% 7 30.8% 25 7.68 14 38345.40 22 1.34%
Poland 15 6.0% 21 81.26 10 2.99 25 0.8% 21 11.1% 20 9.03 25 12315.65 27 0.80%
Portugal 13 6.4% 5 88.63 18 2.13 23 0.4% 11 25.6% 10 12.39 21 19831.61 26 0.88%
Romania - - 19 83.24 - - 2 -13.4% 14 21.7% 11 11.63 26 9465.42 36 -0.53%
Russia - - 18 83.52 24 0.60 10 -2.5% 32 3.3% 34 4.94 28 8928.70 5 5.37%
Singapore - - 10 87.04 - - 5 -7.5% 35 0.5% 5 16.15 5 52960.73 33 0.03%
South Africa 5 8.2% 32 70.52 22 0.78 19 -0.2% 16 16.9% 35 4.69 33 5260.90 2 6.72%
South Korea 2 10.3% 31 70.61 13 2.63 29 1.4% 34 1.6% 32 6.22 18 27538.81 21 1.34%
Spain 16 5.6% 4 88.91 17 2.22 3 -10.5% 17 15.8% 9 12.47 19 26608.87 18 1.57%
Sweden 18 5.2% 2 90.43 8 3.10 7 -5.8% 1 49.9% 21 8.46 7 51164.51 15 1.73%
Switzerland 12 6.6% 11 86.93 5 3.29 35 6.9% 13 22.7% 3 16.62 1 79242.28 34 -0.02%
Taiwan - - 28 74.88 - - 20 0.0% 37 0.0% 37 0.00 20 22453.43 17 1.70%
Thailand - - 33 69.54 - - 18 -0.7% 12 23.0% 28 7.50 31 5899.42 24 1.13%
Ukraine - - 24 79.69 - - 4 -8.3% 33 2.8% 36 3.27 35 2194.36 1 12.36%
United Arab Emirates
- - 34 69.35 - - 14 -1.9% 36 0.1% 23 8.07 16 37677.91 14 1.77%
United Kingdom 10 7.2% 8 87.38 4 3.33 13 -2.1% 31 4.4% 8 12.53 12 40095.95 23 1.20%
United States 25 2.8% 14 84.72 15 2.55 28 1.4% 26 7.9% 29 7.36 3 57436.41 11 2.20%
Vietnam - - 36 58.50 - - 9 -3.5% 6 35.6% 26 7.67 36 2173.27 7 4.74%
© 2017 KPMG LLP, a Delaware limited liability partnership and the U.S. member firm of the KPMG network of independent member firms affiliated with KPMG International Cooperative (“KPMG International”), a Swiss entity. All rights reserved. The KPMG name and logo are registered trademarks or trademarks of KPMG International. NDPPS 655445
© 2017 KPMG LLP, a Delaware limited liability partnership and the U.S. member firm of the KPMG network of independent member firms affiliated with KPMG International Cooperative (“KPMG International”), a Swiss entity. All rights reserved. The KPMG name and logo are registered trademarks or trademarks of KPMG International. NDPPS 655445
9The KPMG Green Tax Index

Country RankReal GDP growth
RankWorking age pop (% of total)
RankCO2 emissions (kt)
RankCO2 emissions per capita (metric tons)
RankIndustrial production YoY
Rank
CO2 emissions (10yr % change)
EPI global rank
CO2 emission global rank
CO2 emission per capita global rank
Argentina 36 -2.3 31 63.9% 13 377906 3 16.4 14 1.6% 22 12.4% 43rd 27th 75th
Australia 14 2.5 21 66.3% 21 189819 29 4.5 27 -1.9% 27 40.5% 13th 16th 10th
Brazil 37 -3.6 10 69.1% 7 503677 33 2.5 32 -8.2% 32 56.6% 46th 10th 105th
Canada 25 1.4 14 67.9% 10 475735 4 13.5 22 -0.8% 12 -14.0% 25th 13th 16th
Chile 23 1.6 11 68.9% 27 83171 26 4.7 21 -0.6% 29 49.6% 52nd 43rd 72nd
Colombia 19 2.0 12 68.7% 26 89625 35 1.9 11 1.7% 31 56.1% 57th 41st 118th
Czech Republic 15 2.4 18 66.9% 25 98661 9 9.4 2 4.8% 8 -19.2% 27th 36th 26th
Denmark 31 1.1 31 64.2% 35 38067 19 6.8 12 1.7% 2 -32.0% 4th 70th 48th
Finland 25 1.4 34 63.2% 30 46300 13 8.5 24 -1.1% 1 -33.0% 1st 59th 33rd
France 30 1.2 36 62.4% 15 333191 24 5.1 15 1.5% 13 -12.4% 10th 18th 69th
Germany 21 1.8 23 65.9% 5 757313 11 9.2 16 1.2% 15 -8.0% 30th 6th 29th
India 1 6.8 25 65.6% 2 2034752 37 1.6 7 3.2% 35 85.0% 141st 3rd 128th
Indonesia 4 5.0 17 67.1% 9 479365 34 1.9 4 4.8% 30 51.3% 107th 12th 115th
Ireland 3 5.2 28 65.1% 36 34965 17 7.6 1 36.9% 10 -18.1% 19th 73rd 41st
Italy 33 0.9 33 63.9% 14 344768 22 5.7 18 0.9% 4 -26.4% 29th 17th 61st
Japan 32 1.0 37 60.8% 4 1243384 8 9.8 25 -1.4% 19 0.1% 39th 5th 25th
Malaysia 6 4.2 13 68.4% 20 236511 14 8.0 5 4.6% 28 49.4% 80th 8th 20th
Mexico 16 2.3 22 65.9% 8 488602 31 4.0 17 1.0% 24 20.4% 63rd 25th 37th
Netherlands 18 2.1 26 65.2% 22 169973 7 10.1 30 -3.3% 16 -2.8% 67th 11th 83rd
New Zealand 7 4.0 29 64.9% 37 33960 16 7.7 13 1.6% 17 -0.4% 36th 29th 23th
Poland 11 2.8 9 69.5% 17 302333 15 8.0 3 4.8% 18 0.0% 11th 74th 40th
Portugal 25 1.4 27 65.2% 31 46263 30 4.4 10 1.7% 6 -24.4% 38th 21st 39th
Romania 5 4.8 16 67.2% 28 70736 32 3.5 8 3.0% 3 -30.0% 7th 60th 76th
Russia 35 -0.2 7 69.9% 3 1789074 5 12.5 29 -3.1% 21 11.5% 34th 45th 88th
Singapore 19 2.0 4 72.8% 29 50557 10 9.4 31 -5.0% 34 62.4% 32nd 4th 18th
South Africa 34 0.3 24 65.7% 11 471239 12 8.9 19 0.8% 23 16.5% 14th 56th 27th
South Korea 11 2.8 3 72.9% 6 592499 6 11.8 23 -0.9% 25 27.1% 81st 14th 30th
Spain 9 3.2 19 66.3% 19 236969 23 5.1 6 3.3% 5 -26.2% 6th 24th 68th
Sweden 8 3.3 35 62.8% 33 44327 27 4.6 9 2.3% 9 -19.1% 3rd 63rd 73rd
Switzerland 29 1.3 15 67.2% 34 40348 25 5.0 28 -2.4% 20 0.4% 16th 67th 70th
Taiwan 25 1.4 - - - - - - 26 -1.7% - - 60th - -
Thailand 9 3.2 5 71.8% 16 303118 28 4.5 20 0.3% 26 35.0% 91st 20th 74th
Ukraine 16 2.3 8 69.8% 23 169122 1 18.7 33 -13.2% 33 58.3% 44th 22nd 58th
United Arab Emirates
13 2.7 1 84.9% 12 457473 18 7.1 - - 11 -15.3% 92nd 30th 6th
United Kingdom 21 1.8 30 64.5% 1 5186168 2 16.4 - - 14 -8.7% 12th 15th 45th
United States 23 1.6 20 66.3% 18 271101 21 6.0 - - 7 -23.1% 26th 2nd 9th
Vietnam 2 6.2 6 70.2% 24 152624 36 1.7 - - 36 93.8% 131st 33rd 125th
© 2017 KPMG LLP, a Delaware limited liability partnership and the U.S. member firm of the KPMG network of independent member firms affiliated with KPMG International Cooperative (“KPMG International”), a Swiss entity. All rights reserved. The KPMG name and logo are registered trademarks or trademarks of KPMG International. NDPPS 655445
© 2017 KPMG LLP, a Delaware limited liability partnership and the U.S. member firm of the KPMG network of independent member firms affiliated with KPMG International Cooperative (“KPMG International”), a Swiss entity. All rights reserved. The KPMG name and logo are registered trademarks or trademarks of KPMG International. NDPPS 655445
11The KPMG Green Tax Index
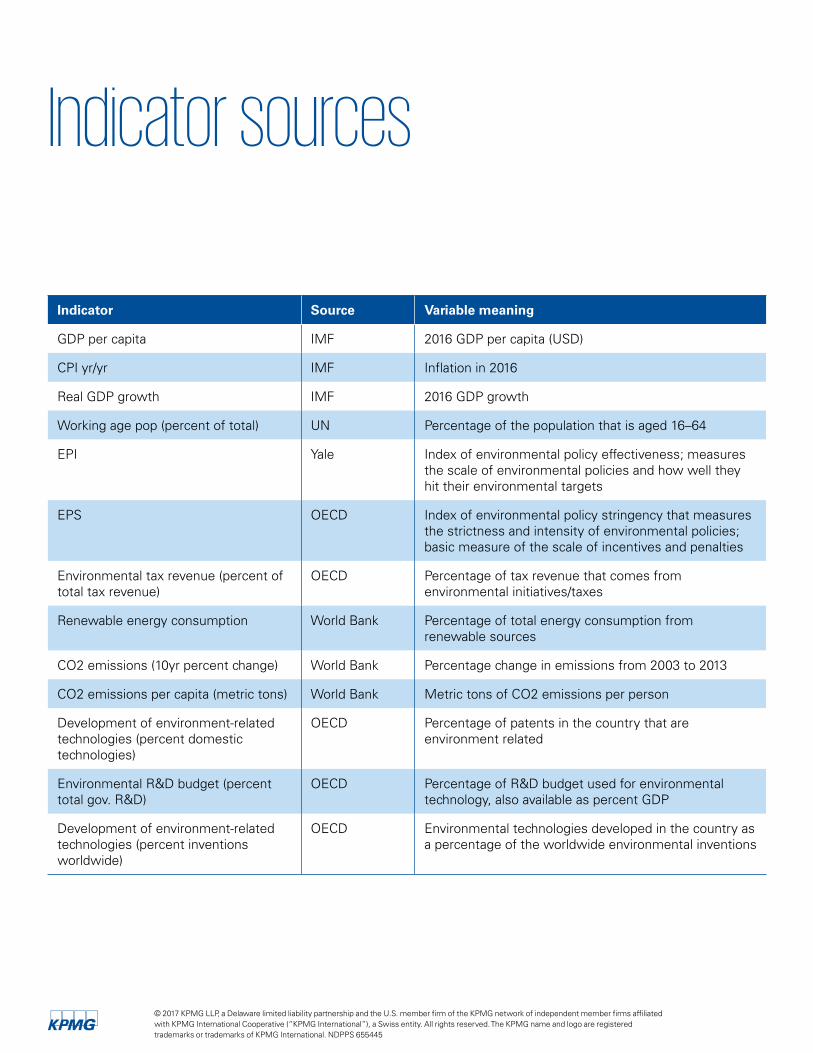
Indicator sources
Indicator Source Variable meaning
GDP per capita IMF 2016 GDP per capita (USD)
CPI yr/yr IMF Inflation in 2016
Real GDP growth IMF 2016 GDP growth
Working age pop (percent of total) UN Percentage of the population that is aged 16–64
EPI Yale Index of environmental policy effectiveness; measures the scale of environmental policies and how well they hit their environmental targets
EPS OECD Index of environmental policy stringency that measures the strictness and intensity of environmental policies; basic measure of the scale of incentives and penalties
Environmental tax revenue (percent of total tax revenue)
OECD Percentage of tax revenue that comes from environmental initiatives/taxes
Renewable energy consumption World Bank Percentage of total energy consumption from renewable sources
CO2 emissions (10yr percent change) World Bank Percentage change in emissions from 2003 to 2013
CO2 emissions per capita (metric tons) World Bank Metric tons of CO2 emissions per person
Development of environment-related technologies (percent domestic technologies)
OECD Percentage of patents in the country that are environment related
Environmental R&D budget (percent total gov. R&D)
OECD Percentage of R&D budget used for environmental technology, also available as percent GDP
Development of environment-related technologies (percent inventions worldwide)
OECD Environmental technologies developed in the country as a percentage of the worldwide environmental inventions
© 2017 KPMG LLP, a Delaware limited liability partnership and the U.S. member firm of the KPMG network of independent member firms affiliated with KPMG International Cooperative (“KPMG International”), a Swiss entity. All rights reserved. The KPMG name and logo are registered trademarks or trademarks of KPMG International. NDPPS 655445

Key findings
© 2017 KPMG LLP, a Delaware limited liability partnership and the U.S. member firm of the KPMG network of independent member firms affiliated with KPMG International Cooperative (“KPMG International”), a Swiss entity. All rights reserved. Printed in the U.S.A. The KPMG name and logo are registered trademarks or trademarks of KPMG International. NDPPS 655445
13The KPMG Green Tax Index
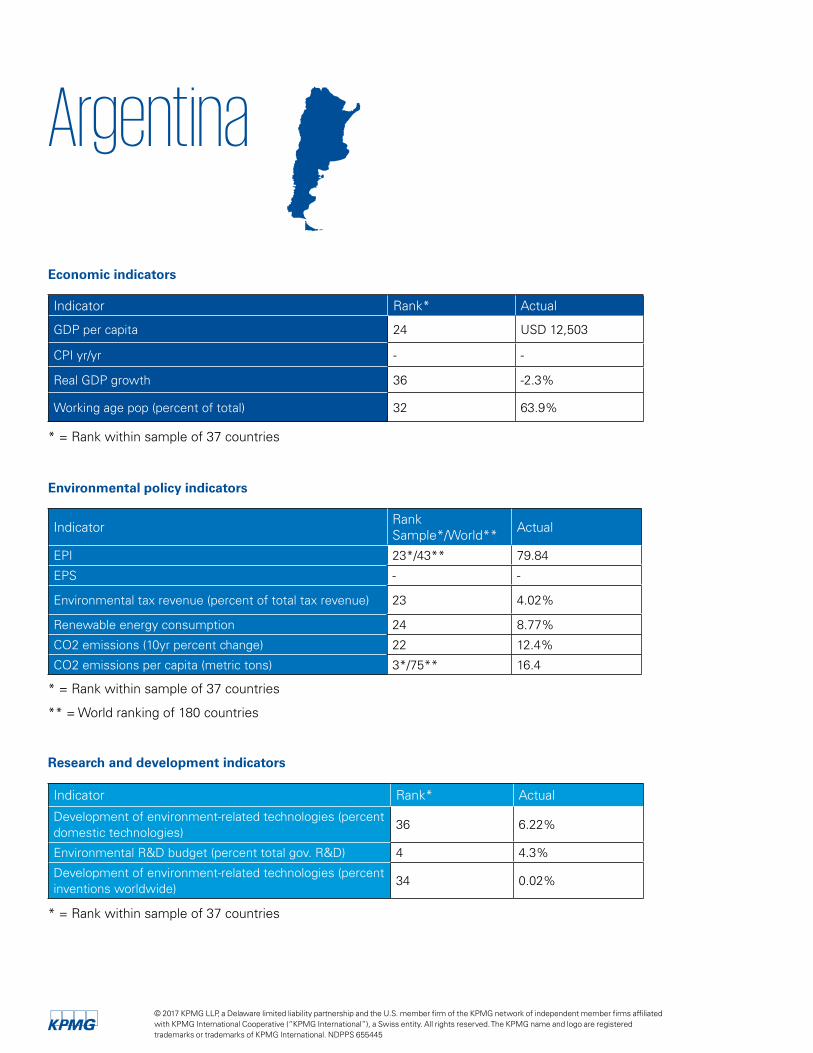
Argentina
Economic indicators
Indicator Rank* Actual
GDP per capita 24 USD 12,503
CPI yr/yr - -
Real GDP growth 36 -2.3%
Working age pop (percent of total) 32 63.9%
* = Rank within sample of 37 countries
Research and development indicators
Indicator Rank* Actual
Development of environment-related technologies (percent domestic technologies)
36 6.22%
Environmental R&D budget (percent total gov. R&D) 4 4.3%
Development of environment-related technologies (percent inventions worldwide)
34 0.02%
* = Rank within sample of 37 countries
Environmental policy indicators
Indicator RankSample*/World** Actual
EPI 23*/43** 79.84
EPS - -
Environmental tax revenue (percent of total tax revenue) 23 4.02%
Renewable energy consumption 24 8.77%
CO2 emissions (10yr percent change) 22 12.4%
CO2 emissions per capita (metric tons) 3*/75** 16.4
* = Rank within sample of 37 countries
** = World ranking of 180 countries
© 2017 KPMG LLP, a Delaware limited liability partnership and the U.S. member firm of the KPMG network of independent member firms affiliated with KPMG International Cooperative (“KPMG International”), a Swiss entity. All rights reserved. The KPMG name and logo are registered trademarks or trademarks of KPMG International. NDPPS 655445
Carbon and climate change Argentina does not have a formal carbon tax.
Renewable energy and fuelsArgentina strives to increase consumption of electricity from renewables to 20 percent by the end of year 2025, from the current 1.8 percent. To assist in reaching this goal, the Argentine Congress amended the “National Promotion Regime for the use of Renewable Energy Sources for Electric Power Production” to offer various benefits for compliance, such as:
— VAT: Early refund of the tax in the construction stage
— Income tax:
– Accelerated depreciation of personal property and infrastructure assets
– Expiration period to offset tax losses has been extended to 10 years
— Minimum presumed income tax exemption up to the eighth year subsequent to start-up on property involved in the renewable energy project subject to the promotion regime (Law 27260: it repeals the tax as from 01/01/2019)
— Import duty exemption for the renewable energy project and the manufacturer of capital assets related to the project
In addition, short-term loans may be granted at a special interest rate to finance the payment of VAT by the
beneficiaries of the regime during the development of the project until it becomes operative. These loans are granted by the Banco de la Nación Argentina. An exemption for bioethanol and biodiesel fuels is also available.
Argentina also has numerous provincial-level programs encouraging research, development, generation, and production of energy from nonconventional renewable sources.
Material resources and waste Each province has jurisdiction over its own territory. For instance, Buenos Aires applies a tax to any kind of waste generated in private homes similar to those generated in shops, offices, and services industries, among others, capable of being subjected to organic recycling.
Pollution and ecosystemsIn Argentina, pollution is regulated, though not through taxes or incentives. Violation of the regulations may trigger fines, suspension, or revocation of licenses/termination of activity. In addition, certain activities, such as mining and oil, are subject to special canons.
InnovationPrograms to encourage innovation and development in Argentina include FONARSEC (Fondo Argentino Sectorial), which supports the development of high-technology-intensive enterprises that generate sustained growth through export diversification and increased value-added production
and PROFIET (Programa de Fomento de la Inversion Emprendedora en Tecnologia), which supports the development and creation of technology-based companies or R&D projects of existing ones, among others.
Also at the national level, the Software Promotion Law establishes a variety of tax benefits for companies that develop software technology solutions in which renewable energy could apply.
© 2017 KPMG LLP, a Delaware limited liability partnership and the U.S. member firm of the KPMG network of independent member firms affiliated with KPMG International Cooperative (“KPMG International”), a Swiss entity. All rights reserved. The KPMG name and logo are registered trademarks or trademarks of KPMG International. NDPPS 655445
15The KPMG Green Tax Index
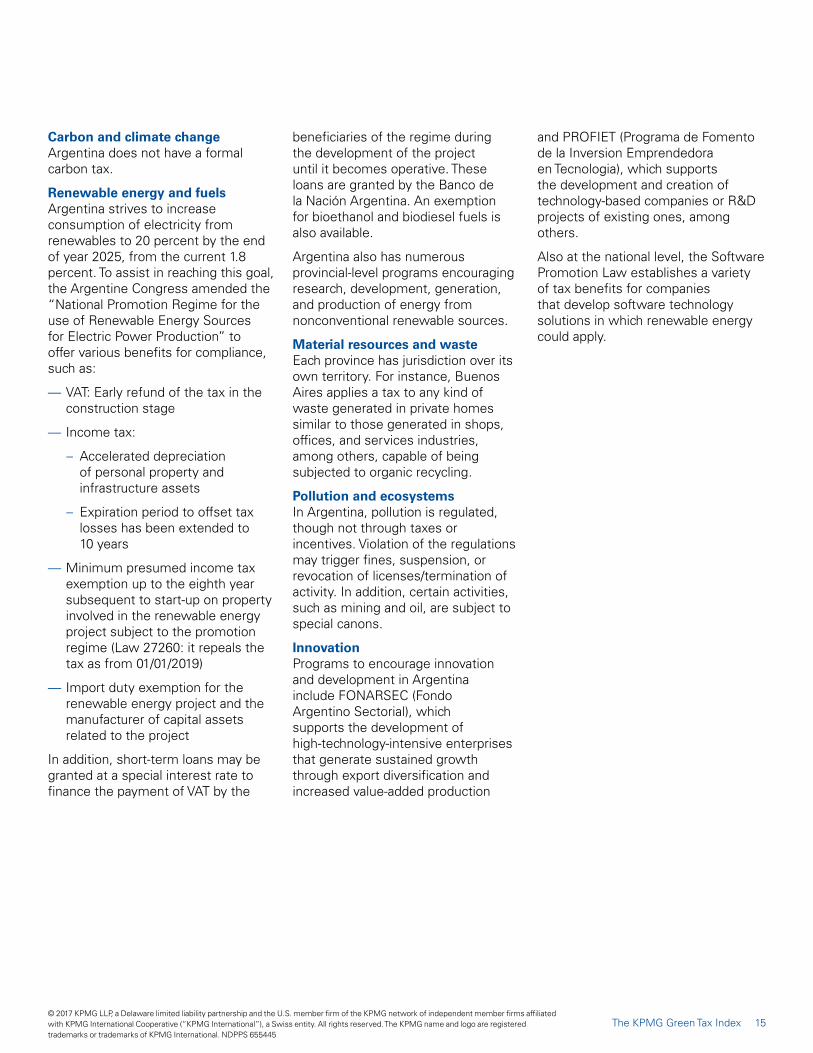
Australia
Economic indicators
Indicator Rank* Actual
GDP per capita 6 USD 51,850
CPI yr/yr 19 1.5%
Real GDP growth 14 2.5%
Working age pop (percent of total) 21 66.3%
* = Rank within sample of 37 countries
Research and development indicators
Indicator Rank* Actual
Development of environment-related technologies (percent domestic technologies)
22 9.16%
Environmental R&D budget (percent total gov. R&D) 4 4.3%
Development of environment-related technologies (percent inventions worldwide)
16 0.62%
* = Rank within sample of 37 countries
Environmental policy indicators
Indicator RankSample*/World** Actual
EPI 9*/13** 87.22
EPS 7 3.12
Environmental tax revenue (percent of total tax revenue) 8 7.77%
Renewable energy consumption 25 8.44%
CO2 emissions (10yr percent change) 27 40.5%
CO2 emissions per capita (metric tons) 29*/10** 4.5
* = Rank within sample of 37 countries
** = World ranking of 180 countries
© 2017 KPMG LLP, a Delaware limited liability partnership and the U.S. member firm of the KPMG network of independent member firms affiliated with KPMG International Cooperative (“KPMG International”), a Swiss entity. All rights reserved. The KPMG name and logo are registered trademarks or trademarks of KPMG International. NDPPS 655445

Carbon and climate changeIn 2013, Australia’s Carbon Pricing Mechanism, which was expected to drive innovation, investment in clean tech/clean energy R&D, demonstration, deployment, and uptake, was terminated by the incoming Coalition government and replaced by the Direct Action Policy. The centerpiece of Direct Action, the Emissions Reduction Fund, replaced the Carbon Farming Initiative.
Renewable energy and fuels Currently, Australia’s Renewable Energy Target of 33,000 GWh (by 2020) applies to the national grid. Several states have set their own targets. For example, Victoria has stated that, by 2020, 25 percent of electricity generated in the state will come from renewable energy. By 2025, that will rise to 40 percent.
The Emissions Reduction Fund (ERF) encourages the use of renewable energy as well as fuel and energy efficiency by allocating Australian Carbon Credit Units (ACCUs) to approved projects by way of a reverse auction process. In order to ensure net emissions reduction across the economy, baselines are established for facilities that emit more than 100,000 tons of CO2-e (the Safeguard Mechanism). If a facility exceeds its baseline for an extended period, it must offset this by purchasing ACCUs from accredited ERF projects. For electricity generators, the baseline applies to the national grid. Carbon sequestration is an approved methodology under the ERF.
The government also taxes a variety of fossil fuels, including crude oil and condensate, natural gas, liquefied
petroleum gas, ethane, compressed natural gas, and refined petroleum products such as petrol and diesel.
A large number of products are subject to excise duty of AUD 0.395 per liter (e.g., petroleum, diesel). LNG and CNG are taxed at AUD 0.270 per kilogram.
The Clean Energy Finance Corporation seeks to act as a financial catalyst to support the commercialization of clean energy technology. The Australian Renewable Energy Agency (ARENA) aims to improve the competitiveness of renewable energy technologies and increase the supply of renewable energy in Australia and provides funding grants for a range of projects ranging from R&D to demonstration and pre-commercial.5
Green vehiclesA luxury car tax is imposed on cars based on a cost threshold. However, for fuel-efficient cars, the threshold is increased. A diesel fuel tax credit is also available if certain environmental criteria are satisfied.
Green buildingsAs of 2016, Australia has no national tax incentives specifically related to green buildings, though it does have a voluntary Green Star program, which provides a rating system for buildings and communities. Research has found that, on average, Green Star certified buildings produce 62 percent fewer greenhouse gas emissions and use 66 percent less electricity than average Australian buildings. Green Star buildings use 51 percent less potable water than average buildings. Green Star certified buildings also have been
found to recycle 96 percent of their construction and demolition waste, compared to the average 58 percent for new construction projects.
WaterApart from regional water restrictions and water allocations trading, state-based efficiency programs, national grant, and financing opportunities, Australia has a few national programs to encourage water efficiencies and management. Examples include accelerated depreciation for water and fodder infrastructure and fencing for farmers, providing deductions over shorter time frames than required under the general tax deduction rules. In addition, immediate deductions are allowable for certain capital expenditures incurred primarily and principally for conserving or conveying water for use in a primary production business on land in Australia.
Material resources and waste Initiatives to promote recycling and resource recovery, such as container deposit schemes and restricted sale of plastic bags, are either in place or are being introduced at the state and territory level. In New South Wales, a levy applies to each ton of coal washery rejects (coal fines and ash from the coal washing process). Cofunding opportunities for waste reduction initiatives (e.g., waste food composting) exist at the state level.
Mining site rehabilitation For corporate tax purposes, an immediate tax deduction is available for expenditures incurred for rehabilitating sites used for mining and quarrying operations (including petroleum).
5 See http://arena.gov.au/funding/
© 2017 KPMG LLP, a Delaware limited liability partnership and the U.S. member firm of the KPMG network of independent member firms affiliated with KPMG International Cooperative (“KPMG International”), a Swiss entity. All rights reserved. The KPMG name and logo are registered trademarks or trademarks of KPMG International. NDPPS 655445
17The KPMG Green Tax Index

Pollution and ecosystemsAn immediate tax deduction for corporate tax purposes is available for expenditures on certain environmental protection activities. Specific tax deductions are also available for expenditures incurred in establishing trees in a carbon sink forest for the principal purpose of carbon sequestration.
In addition, there are government grant programs that will invest money to help drive sustainable agriculture, management of natural resources, and reforestation. The ERF includes certain reforestation and conservation activities as allowable projects (see above).
InnovationAustralia’s R&D Tax Incentive program provides tax offset for eligible R&D activities.
While expenditures incurred on R&D activities are deductible under Section 8-1 of ITAA 1997, Australian companies could also be eligible for additional benefits by way of a tax offset under the R&D Tax Incentive program. This is a broad-based program accessible to all industry sectors. Activities conducted as a part of renewable energy development may be eligible for the R&D tax incentive. The program offers the following two incentives: a 43.5 percent refundable tax offset for eligible
entities with an aggregated turnover of less than AUD 20 million per annum, provided they are not controlled by income-tax-exempt entities, and, a non-refundable 38.5 percent tax offset for all other eligible entities. Unused nonrefundable offset amounts may be carried forward to future income years.
© 2017 KPMG LLP, a Delaware limited liability partnership and the U.S. member firm of the KPMG network of independent member firms affiliated with KPMG International Cooperative (“KPMG International”), a Swiss entity. All rights reserved. The KPMG name and logo are registered trademarks or trademarks of KPMG International. NDPPS 655445

Brazil
Economic indicators
Indicator Rank* Actual
GDP per capita 29 USD 8,727
CPI yr/yr 3 6.3%
Real GDP growth 37 -3.6%
Working age pop (percent of total) 10 69.1%
* = Rank within sample of 37 countries
Environmental policy indicators
Indicator RankSample*/World** Actual
EPI 25*/46** 78.9
EPS 22 0.78
Environmental tax revenue (percent of total tax revenue) 26 1.94%
Renewable energy consumption 2 43.63%
CO2 emissions (10yr percent change) 32 56.6%
CO2 emissions per capita (metric tons) 33*/105** 2.5
* = Rank within sample of 37 countries
** = World ranking of 180 countries
Indicator Rank* Actual
Development of environment-related technologies (percent domestic technologies)
17 9.85%
Environmental R&D budget (percent total gov. R&D) - -
Development of environment-related technologies (percent inventions worldwide)
20 0.18%
Research and development indicators
* = Rank within sample of 37 countries
© 2017 KPMG LLP, a Delaware limited liability partnership and the U.S. member firm of the KPMG network of independent member firms affiliated with KPMG International Cooperative (“KPMG International”), a Swiss entity. All rights reserved. The KPMG name and logo are registered trademarks or trademarks of KPMG International. NDPPS 655445
19The KPMG Green Tax Index

Carbon and climate changeAs of 2016, Brazil does not have a national or subnational carbon tax or an Emission Trading Scheme (ETS). It ratified the Paris Agreement in September 2016 and has pledged to reduce its green-house gas emissions by 37 percent by 2025 and by 43 percent by 2030 from its 2005 emissions level.
Renewable energy and fuelsNearly 40 percent of Brazil’s primary energy supply comes from renewable energy sources. Brazil has announced a goal of 45 percent by 2030.
Several subnational tax incentives exist, including a solar investment incentive in Ceara and a tax exemption on microgeneration of renewable energy for self-consumption in Rio Grande do Sul.
The Brazilian Development Bank (Banco Nacional de Desenvolvimento Econômico e Social – BNDES) is one of the world’s largest development banks. In Brazil, it is the main instrument of the federal government for long-term financing and investment in all segments of the Brazilian economy, including renewable energy. The financing conditions are variable, and in the renewable energy segment the financing can be up to 80 percent of the total amount. Transactions involving conventional fuels are taxed in Brazil.
Green vehiclesSubnational penalties exist on vehicular pollution. Also, pending legislation would provide tax exemptions for transactions involving production of green vehicles.6
WaterWhile there is no national or subnational tax or tax incentive relating to water usage or contamination, there are numerous penalties at both levels. Also, at the national level, there is pending legislation that would provide tax exemptions for transactions involving equipment designed for the filtration, treatment, and reuse of rainwater or brackish water.7
Material resources and waste Since 2011, Brazil has provided a tax credit for acquisitions of recycled materials to be used in production processes.8
Pollution and ecosystemsIn 2009, the Brazilian government established the National Policy on Climate Change,9 which establishes capital subsidies and tax benefits to accomplish the main goals of the policy:
— Protection of the climate system while allowing for economic and social development
— Reduction of greenhouse gas emissions
— Preservation, conservation and restoration of environmental resources
— Consolidation and expansion of legally protected areas
— Encouragement of reforestation and restoration of vegetation in degraded areas
— Stimulation of the Brazilian Market of Emissions Reduction (where negotiations for securities representing certified avoided greenhouse gas emissions shall take place).
InnovationBrazil allows certain R&D expense deductions. Eligible projects qualify for an additional deduction of 60 percent of expenditures in technological innovation from the income tax calculation (income tax and social contribution on net profit)—the deduction may reach 80 percent of R&D expenditures, plus an additional 5 percent of researchers that are hired as regular employees or moved from a different internal area (if the innovative project results in IP, the additional deduction is 20 percent); full depreciation of the assets acquired to be exclusively used in the R&D activities; and accelerated amortization for intangibles assets used in R&D.
In addition, Brazil offers as an R&D tax credit a 50 percent reduction of federal excise tax (tax on manufactured products), which is available for equipment, machinery, instruments, accessories, spare parts, and tools that accompany manufactured goods used in research and technological innovation development. No tax withholding applies on overseas remittances for the registration and maintenance of trademarks and IP (patents and cultivars).
A bill10 that would incentivize water desalination is pending approval.
6 Brazil Bill 174/20147 Brazil PL 2297/20158 Brazil Decree n. 7,619/20119 Law n. 12,187/200910 PLS 259/2015
© 2017 KPMG LLP, a Delaware limited liability partnership and the U.S. member firm of the KPMG network of independent member firms affiliated with KPMG International Cooperative (“KPMG International”), a Swiss entity. All rights reserved. The KPMG name and logo are registered trademarks or trademarks of KPMG International. NDPPS 655445

Canada
Economic indicators
Indicator Rank* Actual
GDP per capita 10 USD 42,210
CPI yr/yr 20 1.4%
Real GDP growth 25 1.4%
Working age pop (percent of total) 14 67.9%
* = Rank within sample of 37 countries
Research and development indicators
Indicator Rank* Actual
Development of environment-related technologies (percent domestic technologies)
15 10.12%
Environmental R&D budget (percent total gov. R&D) 7 3.90%
Development of environment-related technologies (percent inventions worldwide)
7 2.14%
* = Rank within sample of 37 countries
Environmental policy indicators
Indicator RankSample*/World** Actual
EPI 13*/25** 85.06
EPS 11 2.84
Environmental tax revenue (percent of total tax revenue) 24 3.70%
Renewable energy consumption 15 20.60%
CO2 emissions (10yr percent change) 12 -14.0%
CO2 emissions per capita (metric tons) 4*/16** 13.5
* = Rank within sample of 37 countries
** = World ranking of 180 countries
© 2017 KPMG LLP, a Delaware limited liability partnership and the U.S. member firm of the KPMG network of independent member firms affiliated with KPMG International Cooperative (“KPMG International”), a Swiss entity. All rights reserved. The KPMG name and logo are registered trademarks or trademarks of KPMG International. NDPPS 655445
21The KPMG Green Tax Index

Carbon and climate change As of 2016, there is no federal carbon tax system in Canada; however, certain provinces have imposed carbon taxes on certain fuels. For example, Québec (2013) and Ontario (2017) have implemented a carbon cap and trade system for companies that emit 25,000 tons of CO2 eq. or more annually (e.g., aluminum smelters, cement factories, electricity producers), as well as fossil fuel distributors that must cover greenhouse gas (GHG) emissions associated with all products they distribute in Québec (gasoline, diesel fuels, propane, natural gas, and heating oil). Further to this, British Columbia, Manitoba, Ontario, Québec, and California belong to the Western Climate Initiative (WCI).
Renewable energy and fuelsCanada has various incentives specific to the use of renewable energy. Canada’s Clean Energy Fund (CEF)supports clean energy research, development, and demonstration (RD&D) projects, including carbon capture and storage. The objective of the CEF is to support the development of new, cutting-edge energy technologies that are essential for reducing GHG and other air emissions in energy production, transmission, distribution, and use.
The Energy Innovation Program is a new development, receiving funding in budget 2016. The income tax legislation allows for certain capital property to be claimed as “Renewable and Conservation Expenses.” This
expenditure pool can be fully deducted in the year incurred, rather than expensed over the asset’s estimated useful life. In addition, the Accelerated Capital Cost Allowance for “Efficient Equipment” and “Renewable Energy Generation Equipment” provides an accelerated rate of write-off (30 percent and 50 percent per year, respectively, on a declining balance basis).
The ecoENERGY for Renewable Power program was launched in April 2007 to encourage the generation of electricity from renewable energy sources such as wind, low-impact hydro, biomass, photovoltaic, and geothermal energy. Although no new contribution agreements have been signed after March 31, 2011, projects with contribution agreements receive a one cent per kilowatt-hour (kWh) incentive for eligible production during their first 10 years of operation. The program itself will end on March 31, 2021.
As of March 31, 2011, 104 projects qualified for funding under the program representing investments of about CAD 1.4 billion over 14 years and almost 4,500 megawatts of renewable power capacity.11
The ecoENERGY for Biofuels Initiative program started in April 2008 to invest CAD 1.5 billion over nine years to boost Canada’s production of biofuels. This is aimed at helping producers of renewable alternative(s) to gasoline and/or diesel (e.g., biofuels, including ethanol and biodiesel) by providing financial incentives based on production/sales levels.
Canada’s excise tax of CAD 0.10/liter applies to unleaded gasoline, and CAD 0.04/liter applies to diesel fuel.
As of 2016, various provinces provide financial incentives for businesses to assess the feasibility and/or installation of energy-efficient equipment in their facilities.
Green vehiclesThe Energy Innovation Program has received CAD 46.1 million in funding over two years through Budget 2016 to support innovation in the clean energy sector by providing funding for RD&D projects, including next-generation electric vehicle charging infrastructure in Canada. In addition, the ecoENERGY Innovation Initiative (ecoEII) received funding for a comprehensive suite of RD&D projects within five strategic priority areas, including the electrification of transportation.
Green buildingsCanada has no national green building incentive programs as of 2016. However, regional programs have been put in place, such as the City of Hamilton’s provision of a tax break of up to 75 percent of the property tax expected to accrue on a new green building.
WaterGenerally, there are no water-specific incentive programs on a national level in Canada.
11 http://www.nrcan.gc.ca/ecoaction/14145
© 2017 KPMG LLP, a Delaware limited liability partnership and the U.S. member firm of the KPMG network of independent member firms affiliated with KPMG International Cooperative (“KPMG International”), a Swiss entity. All rights reserved. The KPMG name and logo are registered trademarks or trademarks of KPMG International. NDPPS 655445

Material resources and waste Material resources and waste management is managed at the provincial level.
Pollution and ecosystemsNo national tax incentive programs exist as of 2016, though regional programs are available.
InnovationCanada’s Scientific Research & Experimental Development Program
is a federal and provincial tax incentive program that provides cash refunds and/or tax credits for money spent on eligible R&D work done in Canada (returning as much as a 35 percent federal cash refund and 10 percent provincial cash refunds). Though this incentive is not specifically tied to green R&D, it is applicable. In addition, provincial incentives are available.
Other funding initiatives are also
available, including Canada’s Sustainable Development Technology program, the Energy Innovation Program to support development of cleaner oil and gas technologies, smart grid and storage systems, and other efficiency initiatives.
© 2017 KPMG LLP, a Delaware limited liability partnership and the U.S. member firm of the KPMG network of independent member firms affiliated with KPMG International Cooperative (“KPMG International”), a Swiss entity. All rights reserved. The KPMG name and logo are registered trademarks or trademarks of KPMG International. NDPPS 655445
23The KPMG Green Tax Index

Chile
Indicator Rank* Actual
GDP per capita 23 USD 13,576
CPI yr/yr 10 2.8%
Real GDP growth 23 1.6%
Working age pop (percent of total) 11 68.9%
* = Rank within sample of 37 countries
Indicator Rank* Actual
Development of environment-related technologies (percent domestic technologies)
1 19.36%
Environmental R&D budget (percent total gov. R&D) 14 2.3%
Development of environment-related technologies (percent inventions worldwide)
27 0.07%
* = Rank within sample of 37 countries
Environmental policy indicators
Indicator RankSample*/World** Actual
EPI 26*/52** 77.67
EPS - -
Environmental tax revenue (percent of total tax revenue) 14 6.09%
Renewable energy consumption 8 30.27%
CO2 emissions (10yr percent change) 29 49.6%
CO2 emissions per capita (metric tons) 26*/72** 4.7
* = Rank within sample of 37 countries
** = World ranking of 180 countries
Research and development indicators
Economic indicators
© 2017 KPMG LLP, a Delaware limited liability partnership and the U.S. member firm of the KPMG network of independent member firms affiliated with KPMG International Cooperative (“KPMG International”), a Swiss entity. All rights reserved. The KPMG name and logo are registered trademarks or trademarks of KPMG International. NDPPS 655445
Carbon and climate changeA carbon tax was established by the government as part of the 2014 tax reform legislation, which covers power plants with 50 thermal MW or higher of installed capacity.
Renewable energy and fuelsThere is national legislation that obligates power companies to produce renewable energy reaching a peak of 20 percent by 2025. (This complements prior legislation that required production of 5 percent from renewables during 2010–2014.)
Green vehiclesA “green tax” has been implemented on all new vehicles sold in Chile beginning in 2016. The tax is calculated based on various factors, including fuel consumption efficiency, cost of vehicles, and NOx emissions.
WaterUnder the National Water Direction agency, Chile imposes penalties related to the non-use of the water rights given by the government and the overuse of water related to withdrawal amounts higher than the one established in the water rights/environmental license.
Pollution and ecosystemsA pollution tax was established as part of the government’s 2014 tax reform legislation. This tax applies to power plants with 50 thermal MW or higher of installed capacity.
InnovationThere are indirect R&D incentives in the case of the carbon tax. All power plants covered by the tax (higher than 50 thermic MW) working with biomass are not subject to the carbon tax.
© 2017 KPMG LLP, a Delaware limited liability partnership and the U.S. member firm of the KPMG network of independent member firms affiliated with KPMG International Cooperative (“KPMG International”), a Swiss entity. All rights reserved. Printed in the U.S.A. The KPMG name and logo are registered trademarks or trademarks of KPMG International. NDPPS 655445
25The KPMG Green Tax Index

Colombia
Indicator Rank* Actual
GDP per capita 32 USD 5,792
CPI yr/yr 4 5.7%
Real GDP growth 19 2.0%
Working age pop (percent of total) 12 68.7%
* = Rank within sample of 37 countries
Indicator Rank* Actual
Development of environment-related technologies (percent domestic technologies)
34 6.61%
Environmental R&D budget (percent total gov. R&D) - -
Development of environment-related technologies (percent inventions worldwide)
34 0.02%
* = Rank within sample of 37 countries
Environmental policy indicators
Indicator RankSample*/World** Actual
EPI 27*/57** 75.93
EPS - -
Environmental tax revenue (percent of total tax revenue) 20 4.94%
Renewable energy consumption 10 26.27%
CO2 emissions (10yr percent change) 31 56.1%
CO2 emissions per capita (metric tons) 35*/118** 1.9
* = Rank within sample of 37 countries
** = World ranking of 180 countries
Research and development indicators
Economic indicators
© 2017 KPMG LLP, a Delaware limited liability partnership and the U.S. member firm of the KPMG network of independent member firms affiliated with KPMG International Cooperative (“KPMG International”), a Swiss entity. All rights reserved. The KPMG name and logo are registered trademarks or trademarks of KPMG International. NDPPS 655445
Carbon and climate change Colombia’s Emissions Trading Scheme (MVC Colombia) established a technological and institutional platform that could be used as a basis for the adoption of a Voluntary Emissions Reduction (VER) market mechanism and to facilitate voluntary greenhouse gases emission reduction activities in Colombia.
There are no incentives for the general carbon sequestration/capture and storage; however, two incentives, the Forestry Incentive Certificate for Reforestation (CIFrh) and Forestry Incentive Certificate for Conservation (CIFc), include 5- or 10-year economic benefits for certain tree plantation owners helping to conserve or reforest land that can be used as a carbon sink.
Renewable energy and fuelsThe National Programme for the Rational and Efficient Use of Energy (PROURE) established an action plan in 2015 with a vision to 2020, with strategies and commitments from public and private sectors, to achieve expected impacts on productivity, including competitiveness, reduction of environmental impacts, improving quality of life, and access to clean and renewable sources for all citizens.
Included in the plan are strategic subprograms for promoting the use of nonconventional energy sources and incentives for the generation of energy from nonconventional sources. These subprograms include exclusion from VAT for equipment, components, and machinery for projects, activities for reducing energy consumption and/or increasing energy efficiency that correspond to developing strategies, and plans and national programs for cleaner production, savings, and
energy efficiency. There is also an income tax deduction for goods, equipment, or machinery for projects and programs or activities that correspond to these activities.
Incentives are also available for the generation of nonconventional renewable energies for the national energy system, specifically, a 50 percent income tax deduction of the investment (for the next five years) and exclusion from VAT for the equipment, elements, machinery, and services designated for this specific purpose.
Also, some national funds have been established to provide economical resources to the projects where nonconventional renewable energy is involved.
Green vehiclesColombia has several incentives related to the purchase of green vehicles, including a reduction in taxes from 35 percent to 0 percent for certain vehicles and chassis with an electric motor, a hybrid engine or an engine operating on only natural gas, and several deductions related to developing strategies, plans, and programs for cleaner production, savings, and energy efficiency established by the Ministry of Mines and Energy.
The exclusion from VAT (described above) applies to the technological conversion of vehicles.
Green buildingsColombia has established minimum rates of water and energy savings per year that new construction has to achieve according to location. Municipalities and districts are also encouraged to establish incentives for increasing those minimum rates
of water and energy savings. There is also a project to establish guidelines for the National Policy for Sustainable Construction to give economic benefits and financial incentives and other kinds of incentives that can be created to promote sustainable construction in Colombia.
WaterColombian Environmental Law ordered the government to create a charge for water use, promoting efficient use. In addition, due to the weather variability presented in Colombia during the ”El Niño” phenomena, which results in water scarcity in some areas of the country, the Water Regulation Commission in Colombia regulates water use.
Material resources and waste There are some penalties regarding the disposal of certain waste, including material construction, biological wastes, and industrial and commercial waste.
Pollution and ecosystems Colombian Environmental Law ordered the government to create a charge for water pollution. In cases of noncompliance, sanctions include tax penalties, suspension of activities, or even closure of certain sites.
InnovationColombia has financial resources available through COLCIENCIAS, the Science, Technology, and Innovation Management Department, to promote research, technological development, and innovation projects, such as green technology, carbon capture and storage, and energy efficiency, that provide a deduction of income tax for 175 percent of the investment made in R&D.
© 2017 KPMG LLP, a Delaware limited liability partnership and the U.S. member firm of the KPMG network of independent member firms affiliated with KPMG International Cooperative (“KPMG International”), a Swiss entity. All rights reserved. The KPMG name and logo are registered trademarks or trademarks of KPMG International. NDPPS 655445
27The KPMG Green Tax Index

Czech Republic
Economic indicators
Indicator Rank* Actual
GDP per capita 22 USD 18,286
CPI yr/yr 12 2.0%
Real GDP growth 15 2.4%
Working age pop (percent of total) 18 66.9%
* = Rank within sample of 37 countries
Research and development indicators
Indicator Rank* Actual
Development of environment-related technologies (percent domestic technologies)
9 12.14%
Environmental R&D budget (percent total gov. R&D) 17 1.9%
Development of environment-related technologies (percent inventions worldwide)
21 0.15%
* = Rank within sample of 37 countries
Environmental policy indicators
Indicator RankSample*/World** Actual
EPI 15*/27** 84.67
EPS 16 2.30
Environmental tax revenue (percent of total tax revenue) 7 7.93%
Renewable energy consumption 22 10.93%
CO2 emissions (10yr percent change) 8 -19.2%
CO2 emissions per capita (metric tons) 9*/26** 9.4
* = Rank within sample of 37 countries
** = World ranking of 180 countries
© 2017 KPMG LLP, a Delaware limited liability partnership and the U.S. member firm of the KPMG network of independent member firms affiliated with KPMG International Cooperative (“KPMG International”), a Swiss entity. All rights reserved. The KPMG name and logo are registered trademarks or trademarks of KPMG International. NDPPS 655445

Carbon and climate changeThe Czech Republic participates in the EU Emissions Trading Scheme.
Renewable energy and fuels The Czech Republic has various incentives and duties specific to energy and fuel use. For example, excise taxes are payable on hydrocarbon fuels, while certain exemptions may apply. In addition, the price of electricity produced by solar energy power stations, wind power stations, and biogas power stations is guaranteed above the normal market price of traded electricity (governed by the Energy Regulatory Office).
Green buildingsGreen building incentives are limited to the residential and public sector only.
WaterThough no tax incentives are currently enacted, it is expected that in 2017 specific subsidies will be available for water retention and reuse activities. Such incentives will be regulated by the Ministry of the Environment.
Material resources and waste The Ministry of Industry and Trade provides subsidies to small and medium-sized businesses for the purchase of new energy-efficient equipment and machinery. In addition, certain scarce commodities, such as oil and coal, are taxed as a percentage of sales revenue from such commodity. Various local jurisdictions also impose taxes and fees on waste.
Pollution and ecosystemsThere are no specific tax penalties imposed for pollution. However, the Ministry of Environment imposes a penalty for pollution exceeding certain limits (e.g., power plants, iron mills), while the Ministry of Agriculture provides incentives for reforestation.
InnovationR&D activities may be claimed as a tax deduction. This is common for all R&D projects and is not limited to green initiatives. Generally, R&D expenses are tax deductible twice (e.g., R&D expense = 100, tax-deductible expense = 200).
© 2017 KPMG LLP, a Delaware limited liability partnership and the U.S. member firm of the KPMG network of independent member firms affiliated with KPMG International Cooperative (“KPMG International”), a Swiss entity. All rights reserved. The KPMG name and logo are registered trademarks or trademarks of KPMG International. NDPPS 655445
29The KPMG Green Tax Index

Denmark
Indicator Rank* Actual
GDP per capita 4 USD 53,744
CPI yr/yr 30 0.5%
Real GDP growth 31 1.1%
Working age pop (percent of total) 31 64.2%
* = Rank within sample of 37 countries
* = Rank within sample of 37 countries
Indicator Rank* Actual
Development of environment-related technologies (percent domestic technologies)
2 18.36%
Environmental R&D budget (percent total gov. R&D) 15 2.1%
Development of environment-related technologies (percent inventions worldwide)
12 0.98%
Environmental policy indicators
* = Rank within sample of 37 countries
Economic indicators
Research and development indicators
Indicator RankSample*/World** Actual
EPI 3*/4** 89.21
EPS 1 4.18
Environmental tax revenue (percent of total tax revenue) 6 8.18%
Renewable energy consumption 9 27.56%
CO2 emissions (10yr percent change) 2 -32.0%
CO2 emissions per capita (metric tons) 19*/48** 6.8
© 2017 KPMG LLP, a Delaware limited liability partnership and the U.S. member firm of the KPMG network of independent member firms affiliated with KPMG International Cooperative (“KPMG International”), a Swiss entity. All rights reserved. The KPMG name and logo are registered trademarks or trademarks of KPMG International. NDPPS 655445

Carbon and climate change According to the EU Climate and Energy Package Effort Sharing targets for 2013–2020, Denmark has set the goal to decrease its CO2 emissions by 20 percent below the 2005 level. In addition, Denmark has a target to become 100 percent fossil fuels free by 2050. The country is also one of the few countries that has managed to cut carbon emissions from energy combustion below 1990 levels.
The Danish carbon tax system, which started in 1991, covers all consumption of fossil fuels (natural gas, oil, and coal), with partial exemption and refund provisions for sectors covered by the EU-Emissions Trading Scheme (EU-ETS), energy-intensive processes, exported goods, fuels in refineries, and many transport-related activities. Fuels used for electricity production are also not subject to the carbon tax (only applicable to producers covered by the EU-ETS), but instead, a tax on electricity production applies.
The Danish government provides incentives for companies to put in place more sustainable practices similar to a cap and trade program on carbon dioxide (e.g., an incentive tax to encourage Danish enterprises to invest in environmental innovation or sign an energy savings agreement with the Ministry of Transportation and Energy).
Denmark implemented the world’s first carbon trading scheme in 2001.
The Danish government also imposes both SO2 and NOx taxes.
Under special circumstances, companies may be entitled to a reduction of the SO2 and NOx taxes.
Renewable energy and fuelsSince 1977, successive Danish governments have been using energy taxes and incentives to encourage energy efficiency and to raise revenue. In March 2012, a new Energy Agreement was finalized. The expansion of renewables in electricity production was to be financed through the Public Service Obligation (PSO) schemes, which are a supplement to the price of electricity paid by the consumers. The PSO tax will gradually be abolished during the period 2017–2022, and by January 1, 2022 it will be fully abolished.
In addition, a new act, Act 70, was adopted in January 2013. The Act introduced a security of supply tax on all fuels—such as biomass and fossil—used for space heating.
Incentives and grants also exist. As an example, in 2012, an investment scheme was designed to bridge the price gap between renewable and fossil fuels. The subsidy supports industries to convert to renewable energy sources (such as wind, solar, biogas, or biomass to power manufacturing processes) or district heating. In addition, in 2013, subsidies were made available for energy optimization projects that support the country’s energy targets.
In addition, the Green Investment Fund provides loans on reasonable terms for investments by companies in energy savings, renewable energy, and resource efficiency.
Green vehiclesAs of 2016, two types of taxes related to vehicles are imposed in Denmark. One is a registration purchase tax.
In addition, there is currently a green owner tax, which provides a benefit to use smaller, energy-efficient vehicles. The amount of tax is based on how energy efficient the motor vehicle is, providing an incentive to choose smaller and more energy-efficient cars.
WaterDenmark imposes various water taxes on drinking water, piped water, and water charges for high water consumers (industries).
Material resources and wasteDenmark has enacted both incentives and penalties specific to material resources and waste.
As far back as 1978, the country introduced a packaging tax to reduce waste and increase the reuse and recycle rate of packaging.
In 1990, Denmark introduced a tax on extracted raw materials (sand, gravel, stones, peat, clay, and limestone) in conjunction with a waste tax to reduce the use of natural materials and to promote the use of recycled products.
Denmark also bans landfill waste suitable for incineration. Only waste that cannot be reused, recycled, or incinerated may be landfilled. Incineration of waste is covered by an energy tax, while there is a waste tax on landfilled waste.
Pollution and ecosystemsThere are no national pollution and ecosystem taxes, though regional taxes and incentives do exist.
In addition, there are grant programs, such as the program available to incentivize the transformation of privately owned cultivated forest areas into “untouched” forest areas.
© 2017 KPMG LLP, a Delaware limited liability partnership and the U.S. member firm of the KPMG network of independent member firms affiliated with KPMG International Cooperative (“KPMG International”), a Swiss entity. All rights reserved. The KPMG name and logo are registered trademarks or trademarks of KPMG International. NDPPS 655445
31The KPMG Green Tax Index

InnovationDenmark’s focus on innovation tends to be in the form of grants and incentive programs governed by the private sector or universities. Examples include the Danish Programme for Eco-innovation
(MUDP) (supports Danish companies in development and demonstration of new eco-efficient solutions in order to meet Danish and global environmental challenges with a general focus on
water), climate change adaptation, circular economy and recycling of waste, cleaner air, less noise, fewer hazardous chemicals, the industry’s environmental performance, and ecological and sustainable construction.
Another example, the Energy Technology Development and Demonstration Programme, provides opportunities for companies connected to the energy sector
or those having a desire to enter into the industry. The company or consortium must be undertaking a project focused on resolving an energy technological problem.
© 2017 KPMG LLP, a Delaware limited liability partnership and the U.S. member firm of the KPMG network of independent member firms affiliated with KPMG International Cooperative (“KPMG International”), a Swiss entity. All rights reserved. The KPMG name and logo are registered trademarks or trademarks of KPMG International. NDPPS 655445

Finland
Indicator Rank* Actual
GDP per capita 9 USD 43,169
CPI yr/yr 25 1.1%
Real GDP growth 25 1.4%
Working age pop (percent of total) 34 63.2%
* = Rank within sample of 37 countries
Indicator Rank* Actual
Development of environment-related technologies (percent domestic technologies)
13 10.72%
Environmental R&D budget (percent total gov. R&D) 20 1.1%
Development of environment-related technologies (percent inventions worldwide)
15 0.67%
* = Rank within sample of 37 countries
Environmental policy indicators
Indicator RankSample*/World** Actual
EPI 1*/1** 90.68
EPS 3 3.35
Environmental tax revenue (percent of total tax revenue) 11 6.58%
Renewable energy consumption 3 39.12%
CO2 emissions (10yr percent change) 1 -33.0%
CO2 emissions per capita (metric tons) 13*/33** 8.5
* = Rank within sample of 37 countries
** = World ranking of 180 countries
Research and development indicators
Economic indicators
© 2017 KPMG LLP, a Delaware limited liability partnership and the U.S. member firm of the KPMG network of independent member firms affiliated with KPMG International Cooperative (“KPMG International”), a Swiss entity. All rights reserved. The KPMG name and logo are registered trademarks or trademarks of KPMG International. NDPPS 655445
33The KPMG Green Tax Index

Carbon and climate changeIn Finland, energy taxes are levied on coal, natural gas, fuel peat, tall oil, and liquid fuels. Since January 2011, the taxation of liquid fuels is carried out as taxation of fuel components referred to in the tax rate table. The energy tax consists of (1) energy content tax, (2) CO2 tax, and (3) stockpile fee. Liquid biofuels are to comply with the criteria of sustainable development prescribed by the EU Directive 2009/28/EC (RES Directive). Also since 2011, carbon dioxide levies for fossil fuels used in combined electricity and heat production were lowered by 50 percent.
As an EU Member State, Finland is part of the EU Emission Trading Scheme. Finland’s goal for its long-term climate and energy strategy is to reduce carbon (CO2) emissions from transport by 15 percent by 2020 (compared to 2005 emissions level—about 4 million tons of CO2). Finland has set a target for the share of renewable energy in the transport sector more stringent than the EU aiming to reach a 20 percent share in 2020.
Finland’s Energy Authority awards emission permits and keeps an Emission Trading Register, monitoring the responsibilities resulting from emissions trading and approval of emissions trading verifiers. The emissions trading scheme covers CO2 emissions of large industrial installations and combustion installations with a rated thermal input exceeding 20 MW. In Finland, the scheme also includes installations that produce district heat at less than 20 MW. The emissions trading scheme covers more than 40 percent of greenhouse gas emissions within the EU and approximately half of the greenhouse gas emissions within
Finland. Businesses are penalized if they do not surrender enough allowances to cover their emissions and have to buy allowances to make up the shortfall, are “named and shamed” by having their names published, and pay a dissuasive fine (EUR 100 per ton of CO2 in 2013–2020 period) for each excess ton of greenhouse gas emitted.
Renewable energy and fuels Within the EU, the energy efficiency of products is enhanced by setting requirements concerning their production and by steering consumers to opt for energy-efficient products (e.g., energy labeling, Energy Star program).
Investments in renewable energy sources are supported through state subsidies. Production of renewable energy and fuels is considered in national Energy Support (granting system) and Investment aid for key energy projects. For example, the 2014 Cabinet Budget Framework session reserved EUR 20 million for a demonstration project for offshore wind power. Finland also has a specific feed-in tariff for renewable energy.
Green vehiclesFinland has a national car tax, collected upon registration, that is scaled on the basis of the CO2 emissions corresponding to the specific fuel consumption of the car. The car tax for cars leased temporarily from outside Finland is similarly assessed.
There is also a national vehicle tax, collected annually, which consists of a basic tax and a tax on driving power. A vehicle tax must be paid for passenger cars, vans, buses, and lorries that have been entered in the Vehicular and Driver Data Register (vehicles belonging to classes M and N).
The basic tax for passenger cars and vans is based on the levels of CO2 emissions reported by the vehicle manufacturer.
There are no incentives for production of electric vehicles, but the Finnish government supports owners of electric vehicles by giving them a certain amount of money (available until the end of 2017 with some qualifications).
Green buildingsFinland has several laws that regulate buildings, housing, and related issues. The Act on Energy Certificates for buildings oversees the energy certificate program, which requires owners to obtain an energy certificate in conjunction with the building permit proceedings for new buildings.
Finland is an internationally appreciated pioneer with regard to energy auditing and has shared its experiences and know-how with other countries establishing energy audit programs. (Finland coordinated two large European Commission SAVE II program projects and in 2006 organized an international AUDIT ‘06 conference.)
Finland’s long-term objective is to be a carbon-neutral society. Currently, Finland is one of the world’s leading users of renewable sources of energy, especially bioenergy. Renewable energy sources provide one-fourth of Finland’s total energy consumption and account for more than one-fourth of its power generation.
© 2017 KPMG LLP, a Delaware limited liability partnership and the U.S. member firm of the KPMG network of independent member firms affiliated with KPMG International Cooperative (“KPMG International”), a Swiss entity. All rights reserved. The KPMG name and logo are registered trademarks or trademarks of KPMG International. NDPPS 655445

Innovation is one of the core areas of The Ministry of Employment and Economy in Finland.
Finland’s innovation policy has four focus areas for spurring renewal and growth in the Finnish business and industry: bioeconomy, clean tech, digitalization, and the health sector. The government is also increasing emphasis on the importance of service and creative sectors (including marketing, design, branding, and other consumer-focused, value-creating activities and business models as sources for economic growth) and increasing competences in utilizing the IP rights.
Public funding for research, development, and innovation activity is being targeted accordingly.
The public sector tries to motivate companies to engage and invest in innovation activity through various measures, e.g., public research funding and other incentives, legislation, access to international markets, and the functioning of the EU’s internal market. Such incentive systems, and the institutions planning and implementing them, constitute the Finnish national innovation system, which has been ranked among the best in the world.
A certificate must also be obtained when a building, or part thereof, is sold or rented out. In the future, an energy certificate will also be required when selling or renting out an old small residential building, as is the case with other buildings. In addition, the Land Use and Building Act ensures that the use of land and water areas, and building activities on them, creates preconditions for favorable living environments and promotes ecologically, economically, socially, and culturally sustainable development.
WaterOwners of real property are liable to pay a wastewater fee when wastewater of the real property is led to a sewer system operated by a municipality. The wastewater fee varies depending on the operator.
Industrial operations with wastewater that has a significant impact on municipal wastewater treatment (i.e., wastewater that is not in compliance with certain threshold value) are subject to penalty fees from the municipal operators.
Material resources and wasteThere are no taxes in the strict sense directed at the use of material
resources; however, conducting business in some industries may require a permit/license subject to a charge (e.g., mining permit).
A national excise duty is levied on retail containers of alcoholic beverages and soft drinks, and there is a container deposit system that has incentives for consumers to recycle drink containers. There are no direct taxes targeted at consumption other than the VAT. However, water consumption, electricity, and waste are subject to general charges/fees.
The waste tax is levied from authorized landfill operators on certain types of waste. A tax liability is generated when the landfill operates as the final placement for the waste. For 2016, the tax was EUR 70 per received ton.
Pollution and ecosystemsOil waste duty, comparable to excise duty, is levied on lubricating oils and preparations to cover the expenses of treating oil waste. Oil damage duty is levied on oil that is imported into or transported through Finland and subject to the duty. The Finnish Oil Pollution Compensation Fund assesses the duties that are used
to reimburse the costs of oil spill response on land and at sea, when the cause of the incident is unknown or the culpable party is unable to pay the compensation in question. Land planning and building are subject to permits/licenses from different authorities, depending on the purpose of the land use. If the purpose of the land use changes from one where a permit was previously granted, a new permit must be obtained. Permits may cause additional expenses, and acting without the respective permit/license may result in fines/restitution. When the change of land use includes the sale of the land, a transfer tax (4 percent of the purchase price) becomes due.
InnovationInvestments in R&D activity totaled almost EUR 6.68 billion in 2013; in 2012–2014, public funding addressed to R&D amounted to EUR 2 billion, and in 2016, EUR 129.3 million was budgeted to energy research.
© 2017 KPMG LLP, a Delaware limited liability partnership and the U.S. member firm of the KPMG network of independent member firms affiliated with KPMG International Cooperative (“KPMG International”), a Swiss entity. All rights reserved. The KPMG name and logo are registered trademarks or trademarks of KPMG International. NDPPS 655445
35The KPMG Green Tax Index

France
Indicator Rank* Actual
GDP per capita 15 USD 38,128
CPI yr/yr 28 0.7%
Real GDP growth 30 1.2%
Working age pop (percent of total) 36 62.4%
* = Rank within sample of 37 countries
Indicator Rank* Actual
Development of environment-related technologies (percent domestic technologies)
8 12.24%
Environmental R&D budget (percent total gov. R&D) 10 3.0%
Development of environment-related technologies (percent inventions worldwide)
5 4.48%
* = Rank within sample of 37 countries
Environmental policy indicators
Indicator RankSample*/World** Actual
EPI 6*/10** 88.2
EPS 6 3.19
Environmental tax revenue (percent of total tax revenue) 21 4.36%
Renewable energy consumption 18 12.59%
CO2 emissions (10yr percent change) 13 -12.4%
CO2 emissions per capita (metric tons) 24*/69** 5.1
* = Rank within sample of 37 countries
** = World ranking of 180 countries
Research and development indicators
Economic indicators
© 2017 KPMG LLP, a Delaware limited liability partnership and the U.S. member firm of the KPMG network of independent member firms affiliated with KPMG International Cooperative (“KPMG International”), a Swiss entity. All rights reserved. The KPMG name and logo are registered trademarks or trademarks of KPMG International. NDPPS 655445

Carbon and climate change France participates in the EU Emissions Trading Scheme.
Renewable energy and fuels France has an objective to have 23 percent of renewable energies in its total consumption in 2020 (heat 30 percent, electricity 27 percent, and transport 10.5 percent). To reach this goal, various incentives are available specific to renewable energy. Examples include the Tax Credit for Energy Transition (Crédit d’impôt transition énergétique), which provides a 30 percent credit on the amount of expenditures on equipment or renovation work for improving the energy performance of buildings. In addition, the Certificates of Energy Savings (Certificats d’économie d’énergie) program provides certificates proving that an energy savings action has been undertaken by a company, an individual, or a local authority.
As well as incentives, France imposes a tax on consumption of energy products (taxe intérieure de consommation sur les produits énergétiques, TICPE). Petroleum products are subject to this tax. This tax targets a certain number of products, a list of which is common to all the member states of the EU.
Green vehiclesIncentives specific to the purchase of green vehicles are also available. For example, as of 2016, France provides a bonus for the purchase of electric and hybrid vehicles issuing less than 110g of CO2/km, as well as a penalty
applicable to new vehicles issuing more than 130g of CO2/km.
A conversion bonus for the replacement of a diesel vehicle placed into circulation before 2001 by a clean vehicle is cumulative with the bonus.
Company cars are also taxed. The taxe sur les véhicules de sociétés (TVTS) is an annual tax payable by companies that have their registered headquarters in France or an establishment in France. The tax is calculated based on the vehicle’s CO2 emission rates (g/km) and the level of pollution according to the type of combustion.
Green buildingsA few incentives exist in France specific to green construction. Buildings that have received a Building Low Energy Consumption label (bâtiment basse consommation énergétique, BBC 2005) are partially or wholly exempt from property tax. Such exemption applies up to 50 percent or 100 percent, depending upon the decision of local authorities, which also determines the period of exemption.
WaterFrench municipalities tax potable water, while the national government provides a reduced VAT rate for the purchase of rain water recuperation systems (reduced from 20 to 10 percent).
Material resources and wasteFrance imposes various penalties on the use of material resources and waste. As an example, the French law Articles 197 and 199 of Grenelle II provides that companies that
introduce commercial packaging on the market pay an “eco-contribution” based on the type of material, total weight, and number of units.
In addition, industrial waste removal and elimination is subject to the TGAP (general tax on polluting activities).
Waste from electric and electronic equipment, printed paper, tires, light bulbs, furniture, medical waste and drugs, and batteries is also taxed.
Pollution and ecosystemsFrance imposes penalties on certain polluting activities. As an example, the general tax on polluting activities (taxe générale sur les activités polluantes) applies to waste, emitting pollutants, lubricating oils, washing powder, extracting materials, classified installations, papers, and biofuels. The amount of the tax is obtained by applying a specific rate (depending on the activity) per ton of polluting substance produced/processed.
InnovationFrance provides a credit equal to 30 percent of the eligible research expenses that do not exceed EUR 100 million and to 5 percent for the eligible R&D expenses exceeding EUR 100 million. Though the credit is not specifically applicable to sustainable development, it may apply to such activities.
© 2017 KPMG LLP, a Delaware limited liability partnership and the U.S. member firm of the KPMG network of independent member firms affiliated with KPMG International Cooperative (“KPMG International”), a Swiss entity. All rights reserved. The KPMG name and logo are registered trademarks or trademarks of KPMG International. NDPPS 655445
37The KPMG Green Tax Index

Germany
Indicator Rank* Actual
GDP per capita 11 USD 41,902
CPI yr/yr 16 1.7%
Real GDP growth 21 1.8%
Working age pop (percent of total) 23 65.9%
* = Rank within sample of 37 countries
Indicator Rank* Actual
Development of environment-related technologies (percent domestic technologies)
7 12.44%
Environmental R&D budget (percent total gov. R&D) 9 3.1%
Development of environment-related technologies (percent inventions worldwide)
3 12.69%
* = Rank within sample of 37 countries
Environmental policy indicators
Indicator RankSample*/World** Actual
EPI 17*/30** 84.26
EPS 9 3.01
Environmental tax revenue (percent of total tax revenue) 17 5.38%
Renewable energy consumption 19 12.38%
CO2 emissions (10yr percent change) 15 -8.0%
CO2 emissions per capita (metric tons) 11*/29** 9.2
* = Rank within sample of 37 countries
** = World ranking of 180 countries
Research and development indicators
Economic indicators
© 2017 KPMG LLP, a Delaware limited liability partnership and the U.S. member firm of the KPMG network of independent member firms affiliated with KPMG International Cooperative (“KPMG International”), a Swiss entity. All rights reserved. The KPMG name and logo are registered trademarks or trademarks of KPMG International. NDPPS 655445

Carbon and climate change Germany’s cap and trade system is based on the European Union directive, and implemented into German law in 2004. The system includes operators of installations of all large combustion plants (with more than 20 megawatts of thermal output) and large installations of energy-intensive industries, such as steelworks, refineries, and cement works. In 2012, air traffic was added to the emissions trading scheme.
Renewable energy and fuels Entrepreneurs or small companies that provide at least 10 percent of electricity from renewable energy equipment into the national grid are eligible for deduction of Germany’s input tax. The VAT for the purchase of the equipment will also be refunded by the tax authority.
Additionally, the purchase price of a renewable energy source can be subject to degressive depreciation for a period of 20 years (instead of linear depreciation), providing a tax benefit (e.g., buyers can claim 20 percent of the acquisition cost as a tax loss and offset it against earnings in a financial year leading to lower taxable income).
The extraction of electricity from renewable energy sources is fully tax exempt if the electricity stems from a power supply or a power supply line exclusively fed with renewable energy. Renewable energy in this case is defined as hydro, wind, solar, geothermal, landfill gas, sewage gas, and biomass energy.
Companies in energy-intensive productive sectors can apply for tax relief if they meet certain requirements, such as the establishment of an environmental management system (in accordance with German law or a registered organization of the EU) and the improvement of their energy efficiency. Smaller companies can establish a system to improve their energy efficiency without an environmental management system.
Finally, fossil energy resources are taxed at different rates, depending on the source.
Green vehiclesGermany’s vehicle tax is a variable value depending on the CO2 emission of each registered car. Vehicle types with a high CO2 emission are taxed more heavily than car types with a lower CO2 emission (applicable to cars registered in 2009 or later).
In addition, the purchase of environmentally friendly vehicles is rewarded with a premium of EUR 4,000 for electric vehicles and EUR 3,000 for hybrid vehicles with a net listed price under EUR 60,000. The funding pool is supported by the state (50 percent) and by the car manufacturers (50 percent) and is offered to persons purchasing a car from one of the participating manufacturers.
Electric vehicles also benefit from an exemption from the vehicle tax. Electric vehicles first-time registered before May 17, 2011 or between
January 1, 2016 and December 31, 2020 have a 5-year exemption, whereas electric vehicles first-time registered between May 18, 2011 and December 31, 2015 are exempt from the vehicle tax for 10 years. After the exemption period, the vehicle tax is reduced by 50 percent. This exemption does not apply to hybrid vehicles.
WaterThirteen of the sixteen German states impose charges on the extraction of water, called the “Watercent.”
© 2017 KPMG LLP, a Delaware limited liability partnership and the U.S. member firm of the KPMG network of independent member firms affiliated with KPMG International Cooperative (“KPMG International”), a Swiss entity. All rights reserved. The KPMG name and logo are registered trademarks or trademarks of KPMG International. NDPPS 655445
39The KPMG Green Tax Index

India
Indicator Rank* Actual
GDP per capita 37 USD 1,723
CPI yr/yr 6 4.9%
Real GDP growth 1 6.8%
Working age pop (percent of total) 25 65.6%
* = Rank within sample of 37 countries
Indicator Rank* Actual
Development of environment-related technologies (percent domestic technologies)
25 8.84%
Environmental R&D budget (percent total gov. R&D) - -
Development of environment-related technologies (percent inventions worldwide)
10 1.21%
* = Rank within sample of 37 countries
Environmental policy indicators
Indicator RankSample*/World** Actual
EPI 37*/141** 53.58
EPS 20 1.15
Environmental tax revenue (percent of total tax revenue) 1 13.37%
Renewable energy consumption 4 38.99%
CO2 emissions (10yr percent change) 35 85.0%
CO2 emissions per capita (metric tons) 37*/128** 1.6
* = Rank within sample of 37 countries
** = World ranking of 180 countries
Research and development indicators
Economic indicators
© 2017 KPMG LLP, a Delaware limited liability partnership and the U.S. member firm of the KPMG network of independent member firms affiliated with KPMG International Cooperative (“KPMG International”), a Swiss entity. All rights reserved. The KPMG name and logo are registered trademarks or trademarks of KPMG International. NDPPS 655445

Carbon and climate changeIndia has several carbon and climate change taxes/incentives in place.
The clean environment “cess” (a tax levied by the government for a specific purpose) is applied to all goods specified in chapter 2701, 2702, and 2703 except coal, lignite, and peat subject to the condition that cess has been paid at the stage of raw coal, raw lignite, and raw peat from which such goods are produced or manufactured.
Additional taxes include a cess on coal and coke (INR 10 per ton) under the Coal Mines Conservation and Development Act, 1974 and an oil industry development cess on crude oil (INR 2500 per ton) and natural gas (INR 300 per thousand cubic meters) under the Oil Industry (Development) Act, 1974. Additionally, there is an excise duty on petrol and high-speed diesel oil.
In addition to these taxes, India has a market-based trading scheme (Perform Achieve Trade) that aims to improve energy efficiency in industries by trading in energy efficiency certificates in energy-intensive sectors. Participation in the scheme is mandatory for Designated Consumers under the Energy Conservation Act.
The Bureau of Energy Efficiency sets mandatory, specific targets for energy consumption for larger, energy-intensive facilities. The scheme is being implemented in three phases. Phase one ran from 2012 to 2015 and covered 478 facilities from eight energy-intensive sectors (such as aluminum, cement, chor-alkali, fertilizer). It targets energy consumption reductions of 6.886 million tons of oil equivalent in the covered facilities. Facilities making greater reductions than their targets receive “EsCerts” (energy saving certificates), which can be traded
with facilities that are having trouble meeting their targets, or banked for future use.
Renewable Energy Certificates are provided when a generator has produced a certain amount of electricity from a renewable energy resource. These can be traded in the market to meet a company’s “Renewable Purchase Obligation.”
Renewable energy and fuels India continues to offer many incentives/deductions to encourage the use and innovation of renewable energy and fuels. Incentives include accelerated depreciation rates of up to 100 percent for new machinery or plants that are acquired and installed after March 31, 2005 by a power generator or distributor on certain energy-saving devices, such as specialized boilers and furnaces, instrumentation and monitoring systems for monitoring energy flows, waste heat recovery equipment, cogeneration systems, electrical equipment, burners, and other equipment. An 80 percent depreciation rate also applies to many renewable energy devices, such as flat plate solar collectors, concentrating and pipe type solar collectors, solar cookers, and solar water heaters and systems.
There is an additional 20 percent depreciation on any new plant and machinery (acquired and installed after March 31, 2005) for businesses that manufacture components to generate/distribute power. Total depreciation allowance is halved if the asset is used for less than 180 days in the year of acquisition.
Also, concessional excise duties at the rate of 6 percent are applicable with CENVAT (Central VAT tax) credit in areas such as biogas lights, manufacture of goods required for substitution of ozone-depleting substances (ODS), and
setting up of new projects with non-ODS technologies (a basic customs duty exemption is also available on the same).
In addition, India has implemented a Generation-Based Incentive scheme, offering wind electricity producers INR 0.50 per unit of electricity fed into the grid for a period of not less than 4 years and not more than 10 years (capping at INR 100 lakhs per MW) with some limitations.
In addition, the Ministry of New and Renewable Energy provides financial support for costs related to grid-connected rooftop solar and small solar power plants.
An income tax holiday of 10 years is offered for businesses engaged in the generation and/or distribution of power if generation begins before March 31, 2017 (solar included).
India also has various customs duty and VAT exemptions and reduced rates specific to the import of renewable energy equipment.
Green vehiclesIndia uses both incentives and penalties to encourage the use of green vehicles. In 2012, India provided reduced excise and customs duty rates and customs duty reductions for specified parts of hybrid vehicles and for lithium-ion battery packs for supply to electric vehicle or hybrid vehicle manufacturers.
In addition, the Faster Adoption and Manufacturing of Hybrid and Electric (FAME) program was recently launched, offering incentives on hybrid and electric vehicles.
Under the scheme, the government will offer incentives on hybrid and electric vehicles of up to INR 29,000 for two-wheelers and INR 1.38 lakh for cars. The government will spend INR 795 crore in the first two fiscal years under this scheme.
© 2017 KPMG LLP, a Delaware limited liability partnership and the U.S. member firm of the KPMG network of independent member firms affiliated with KPMG International Cooperative (“KPMG International”), a Swiss entity. All rights reserved. The KPMG name and logo are registered trademarks or trademarks of KPMG International. NDPPS 655445
41The KPMG Green Tax Index

Generally, India as a country is discouraging use of old vehicles and diesel vehicles and levies penalties on certain nongreen vehicles. These penalties include an infrastructure cess in the form of excise duty (payable on the transaction value of goods as per excise laws in India) of 1 percent applied to owners of small petrol, LPG, and CNG cars (less than 4 meters in size with engines up to 1200c), 2.5 percent on diesel cars of certain capacity vehicles (length not exceeding 4 meters and engine capacity not exceeding 1500cc), and 4 percent on other higher engine capacity vehicles and SUVs.
WaterIndia has numerous incentives specific to water. Depreciation on such equipment is allowed at the rate of 40 percent of written-down value. It is allowed from the year in which the asset is put to use. Depreciation allowance is halved (i.e., allowed at rate of 20 percent of WDV) in cases where the asset is used for less than 180 days in the year of acquisition. In addition, there is an exemption from excise duties on all items of machinery, including instruments, apparatus and appliances or parts, and pipes and fittings required for setting up of certain water treatment plants.
Other incentives include 100 percent depreciation (40 percent w.e.f. April 1, 2017) on machinery installed as part of a water supply project/water treatment system and used for the purpose of providing infrastructure facilities. Depreciation allowance is halved in cases where the asset is
put to use for less than 180 days in the year of acquisition.
An income tax holiday of 10 years (out of 20 years) was provided for any operation started before March 31, 2017 for (i) developing or (ii) operating and maintaining or (iii) developing, operating, and maintaining any infrastructure facility water supply project, water treatment system, and irrigation project.
Material resources and wasteIndia has numerous incentives related to material resources and waste. Not only are income tax holidays available for undertakings related to sanitation and sewage system or solid waste management system facilities, but they are also available for businesses that derive profits from the business of collecting and processing or treating of biodegradable waste for generating power or producing biofertilizers, biopesticides, or other biological agents, or for producing biogas or making pellets or briquettes for fuel or organic manure. The tax holiday is not available for enterprises that start the development/operation/maintenance after March 31, 2017. However, under section 35AD, a 100 percent deduction of capital expenditure is allowed for business of infrastructure facility. Infrastructure facility includes a sanitation and sewage system or solid waste management system.
Another incentive example is 40 percent (w.e.f. April 1, 2017) depreciation for solid waste control equipment (caustic/lime/chrome/mineral/cryolite recovery systems) and solid waste recycling and resource
recovery systems. Depreciation allowance is halved (i.e., allowed at rate of 20 percent of WDV) if the asset is put to use for less than 180 days in the year of acquisition.
Pollution and ecosystemsA 100 percent depreciation (40 percent w.e.f. April 1, 2017) is available for air pollution control equipment, such as electrostatic precipitation systems, felt-filter systems, dust collector systems, scrubber-counter current/venturi/packed bed/cyclonic scrubbers, and ash handling and evacuation systems. Depreciation allowance is halved (i.e., allowed at a rate of 20 percent of WDV) in cases where the asset is put to use for less than 180 days in the year of acquisition.
InnovationIndia provides a 100 percent deduction for revenue and capital expenditures (other than land) incurred by a company on scientific research related to the business of the company.
In addition, a weighted deduction of 200 percent (150 percent from April 1, 2017 and after April 1, 2020, 100 percent of expenditure incurred) of expense incurred on in-house R&D (except expense incurred on land and building) is available to a company engaged in the business of biotechnology or in any business of manufacture or production of any article or thing.
© 2017 KPMG LLP, a Delaware limited liability partnership and the U.S. member firm of the KPMG network of independent member firms affiliated with KPMG International Cooperative (“KPMG International”), a Swiss entity. All rights reserved. The KPMG name and logo are registered trademarks or trademarks of KPMG International. NDPPS 655445

Indonesia
Indicator Rank* Actual
GDP per capita 34 USD 3,604
CPI yr/yr 9 3.0%
Real GDP growth 4 5.0%
Working age pop (percent of total) 17 67.1%
* = Rank within sample of 37 countries
Indicator Rank* Actual
Development of environment-related technologies (percent domestic technologies)
5 12.87%
Environmental R&D budget (percent total gov. R&D) - -
Development of environment-related technologies (percent inventions worldwide)
31 0.03%
* = Rank within sample of 37 countries
Environmental policy indicators
Indicator RankSample*/World** Actual
EPI 35*/107** 65.85
EPS 21 1.10
Environmental tax revenue (percent of total tax revenue) - -
Renewable energy consumption 5 37.06%
CO2 emissions (10yr percent change) 30 51.3%
CO2 emissions per capita (metric tons) 34*/115** 1.9
* = Rank within sample of 37 countries
** = World ranking of 180 countries
Research and development indicators
Economic indicators
© 2017 KPMG LLP, a Delaware limited liability partnership and the U.S. member firm of the KPMG network of independent member firms affiliated with KPMG International Cooperative (“KPMG International”), a Swiss entity. All rights reserved. The KPMG name and logo are registered trademarks or trademarks of KPMG International. NDPPS 655445
43The KPMG Green Tax Index
Renewable energy and fuels Various incentives are available in Indonesia specific to the purchase, use, and production of energy-efficient equipment. Incentives range from duty exemptions, accelerated depreciation, and tax reductions.
Finance Regulation No. 3/2012 provides the framework and support for the use of geothermal energy, while a solar auction program is also available under Ministerial Regulation No. 17/2013 for the purchase of electricity from solar PV power plants.
Green vehiclesIndonesia provides a luxury goods sales tax exemption for the purchase of green vehicles.
Green buildingsA 2011 Indonesian Presidential Instruction provided that leaders of government institutions in the central and local governments save water and energy within their institutional domain. It provides reduction targets for electricity of 20 percent, fuel of 10 percent, and water use of 10 percent.
WaterIndonesia imposes taxes on the use of water, both surface and underground. Both taxes are levied by the subnational governments.
Pollution and ecosystemsThough Indonesia does not have a tax penalty specific to pollution, it does have a reputational incentive whereby companies/factories’ performance
against the environmental regulatory standards are ranked. An import duty exemption is also available for the purchase of equipment and material used in the prevention of environmental pollution.
© 2017 KPMG LLP, a Delaware limited liability partnership and the U.S. member firm of the KPMG network of independent member firms affiliated with KPMG International Cooperative (“KPMG International”), a Swiss entity. All rights reserved. The KPMG name and logo are registered trademarks or trademarks of KPMG International. NDPPS 655445

Ireland
Indicator Rank* Actual
GDP per capita 2 USD 62,562
CPI yr/yr 35 -0.2%
Real GDP growth 3 5.2%
Working age pop (percent of total) 28 65.1%
* = Rank within sample of 37 countries
Indicator Rank* Actual
Development of environment-related technologies (percent domestic technologies)
35 6.4%
Environmental R&D budget ( percent total gov. R&D) 21 1%
Development of environment-related technologies (percent inventions worldwide)
24 0.13%
* = Rank within sample of 37 countries
Environmental policy indicators
Indicator RankSample*/World** Actual
EPI 12*/19** 86.6
EPS 19 2.05
Environmental tax revenue (percent of total tax revenue) 9 7.61%
Renewable energy consumption 27 6.96%
CO2 emissions (10yr percent change) 10 -18.1%
CO2 Emissions per capita (metric tons) 17*/41** 7.6
* = Rank within sample of 37 countries
** = World ranking of 180 countries
Research and development indicators
Economic indicators
© 2017 KPMG LLP, a Delaware limited liability partnership and the U.S. member firm of the KPMG network of independent member firms affiliated with KPMG International Cooperative (“KPMG International”), a Swiss entity. All rights reserved. The KPMG name and logo are registered trademarks or trademarks of KPMG International. NDPPS 655445
45The KPMG Green Tax Index

Carbon and climate change Ireland participates in the EU Emissions Trading Scheme, which allows for the trading of emission allowances designed to limit industrial GHG emissions.
Solid Fuel Carbon Tax (SFCT) is a self-assessment tax on the first supply of solid fuel into Ireland. It applies to peat and coal and is charged at a rate of EUR 20 per ton of CO2 emitted (effective May 1, 2014). Certain relieves are available from the charge, including full relief for fuels used solely for the generation of electricity and peat used in installations covered by an EPA-issued GHG emissions permit, and partial relief for coal used in an installation covered by a GHG permit.
Renewable energy and fuelsThe tax on consumption of electricity continues, and the rate for industrial and commercial use of electricity is half the rate for residential use. Fuels used to generate electricity are exempt.
Accelerated cap allowances (100 percent in the year of the expense) are available to companies for purchases of certain energy-efficient equipment, including certain lighting; efficient HVAC systems; efficient motors; certain refrigeration and cooling systems; electromechanical systems; and solar, wind, and biomass systems, which are used in the trade of the company. This scheme has been extended until December 31, 2017.
Individuals can claim relief against their income tax liability for certain investments in companies engaged in energy activities under the Employment and Investment Incentive Scheme (EIIS). The legislation includes some helpful provisions designed to ensure that renewable energy projects meet the qualifying criteria.
A separate relief for expenditures incurred by companies in acquiring new ordinary shares of Irish companies engaged solely in renewable energy projects expired on December 31, 2014, and investments made after this date will not qualify for the relief.
Carbon tax is levied on petrol and auto diesel at the rate of EUR 20 per ton of CO2 emitted. There is also a solid fuel carbon tax levied at the rate of EUR 20 per ton of CO2 emitted.
Green vehiclesIreland allows an accelerated capital allowance regime (100 percent in the year of the expense) for companies that purchase equipment to manufacture certain vehicles and purchase certain types of vehicles (electric, plug-in, lean burn, hybrid). Vehicle Registration Tax (VRT) applies on first registration to all motor vehicles in Ireland. There is a reduced VRT rate for certain vehicles based on CO2 emissions. The rates for cars are based on CO2 emissions of vehicles such that lower level of emissions have less VRT liability.
In addition, hybrid and plug-in hybrid electric vehicles may qualify for a repayment of VRT of up to EUR 1,500/EUR 2,500, respectively.
A company’s maximum claim for capital allowances for owned vehicles is linked to the emissions of the car (e.g., cars with lower emissions have higher maximum values for capital allowance purposes).
WaterWater charges were introduced in 2014 for residential customers at a rate of EUR 1.85 per cubic meter. Due to political pressure, charges were subsequently capped at a maximum of EUR 260 per year until the end of 2018.
Further political pressure resulted in the suspension of the charges at least until mid-2017 and may be suspended further. These charges are not imposed by the Irish Revenue Commissioners, but rather by a separate body.
Material resources and waste Ireland introduced a carbon tax in 2010. This tax applies to certain fuels that are burned for heating (natural gas and heating oil) and for transport purposes (petrol and diesel).
Mineral tax applies to transport and heating and process use industries (includes coal). The carbon tax above for fuels also applies to kerosene. A higher rate of corporation tax (25 percent) applies to developments on mineral extractions (including petroleum).
The Department of Housing, Planning, Community and Local Government regulates plastic bags, and a levy is collected from retailers where plastic bags are used. Local authorities ensure compliance with this levy, which currently stands at 22c per bag. A reduced VAT rate (13.5 percent instead of 23 percent) applies on charges by a recycling company, including collection of waste.
InnovationThere is a 25 percent tax credit for qualifying R&D expenditures (those incurred wholly and exclusively in carrying out R&D activities), which include R&D activities on green technologies. There are no credits tied directly to specific green technologies.
© 2017 KPMG LLP, a Delaware limited liability partnership and the U.S. member firm of the KPMG network of independent member firms affiliated with KPMG International Cooperative (“KPMG International”), a Swiss entity. All rights reserved. The KPMG name and logo are registered trademarks or trademarks of KPMG International. NDPPS 655445

Italy
Indicator Rank* Actual
GDP per capita 17 USD 30,507
CPI yr/yr 31 0.5%
Real GDP growth 33 0.9%
Working age pop (percent of total) 33 63.9%
* = Rank within sample of 37 countries
Indicator Rank* Actual
Development of environment-related technologies (percent domestic technologies)
21 9.21%
Environmental R&D budget (percent total gov. R&D) 11 2.9%
Development of environment-related technologies (percent inventions worldwide)
8 1.68%
* = Rank within sample of 37 countries
Environmental policy indicators
Indicator RankSample*/World** Actual
EPI 16*/29** 84.48
EPS 12 2.77
Environmental tax revenue (percent of total tax revenue) 4 8.80%
Renewable energy consumption 20 12.09%
CO2 emissions (10yr percent change) 4 -26.4%
CO2 emissions per capita (metric tons) 22*/61** 5.7
* = Rank within sample of 37 countries
** = World ranking of 180 countries
Research and development indicators
Economic indicators
© 2017 KPMG LLP, a Delaware limited liability partnership and the U.S. member firm of the KPMG network of independent member firms affiliated with KPMG International Cooperative (“KPMG International”), a Swiss entity. All rights reserved. The KPMG name and logo are registered trademarks or trademarks of KPMG International. NDPPS 655445
47The KPMG Green Tax Index

Carbon and climate change Italy participates in the EU Emission Trading Scheme.
Renewable energy and fuelsItalian incentives specific to renewable energy and fuels include those applied to solar electric energy production and general energy efficiency initiatives.
First, Italian regulators have developed an “Eco Bonus” program to support the installment of energy efficiency equipment, such as the installation of efficient refrigeration, air conditioning, and heating. The Eco Bonus is redefined/refinanced each year.
Also recently introduced (October 2016) is an incentive program for the production of electricity by photovoltaic solar panels installed in renovated buildings.
In addition, and in compliance with EU directives, the Italian Regulator has introduced a minimum annual quantity of biofuels that gasoline suppliers (“obligated persons”) must introduce into consumption.
Green vehiclesDifferent incentives have been enacted to purchase and manage hybrid, electric, and biofuel vehicles, such as tax exemption and financial support. These incentives are regulated by different local authorities.
WaterItaly has a national water tariff that is applied by local authorities. Also, incentives exist with regard to energy efficiencies for hot water production.
Material resources and waste Packaging is regulated by the national waste packaging collecting system, which defines a taxation rate for every package produced or imported in Italy.
Producers and users must bear (a) the cost of collecting used packaging and waste packaging, (b) extra costs associated with the separated collection of waste packaging, (c) the cost of reusing used packaging, (d) the cost of recycling and salvaging waste packaging, and (e) the cost of disposing of waste packaging.
In addition, every commercial waste activity is subject to VAT taxation, and in the case of hazardous waste, every producer, carrier, and disposal operator must register with the Italian monitoring system.
Pollution and ecosystemsItaly has a national tariff method for pollution and ecosystems that is applied by local authorities. There are also diversified incentives at EU, national, and local levels.
InnovationItaly offers R&D incentives through the Horizon 2020 program (the largest EU research and innovation program with close to EUR 80 billion in funding which is applied by national, regional, and local authorities.
Horizon 2020 is the financial instrument implementing the Innovation Union, a Europe 2020 flagship initiative aimed at securing Europe’s global competitiveness. Seen as a means to drive economic growth and create jobs, Horizon 2020 has the political backing of Europe’s leaders and the members of the European Parliament who agree that research is an investment in our future and put it at the heart of the EU’s blueprint for smart, sustainable, and inclusive growth and jobs.
Horizon 2020 couples research and innovation to ensure Europe produces world-class science, removes barriers to innovation, and makes it easier for the public and private sectors to work together in delivering innovation.12
12 See https://ec.europa.eu/programmes/horizon2020/en/what-horizon-2020.
© 2017 KPMG LLP, a Delaware limited liability partnership and the U.S. member firm of the KPMG network of independent member firms affiliated with KPMG International Cooperative (“KPMG International”), a Swiss entity. All rights reserved. The KPMG name and logo are registered trademarks or trademarks of KPMG International. NDPPS 655445

Japan
Indicator Rank* Actual
GDP per capita 13 USD 38,917
CPI yr/yr 32 0.3%
Real GDP growth 32 1.0%
Working age pop (percent of total) 37 60.8%
* = Rank within sample of 37 countries
Indicator Rank* Actual
Development of environment-related technologies (percent domestic technologies)
16 10.06%
Environmental R&D budget (percent total gov. R&D) 16 1.9%
Development of environment-related technologies (percent inventions worldwide)
1 23.53%
* = Rank within sample of 37 countries
Environmental policy indicators
Indicator RankSample*/World** Actual
EPI 22*/39** 80.59
EPS 14 2.63
Environmental tax revenue (percent of total tax revenue) 19 5.09%
Renewable energy consumption 30 4.48%
CO2 emissions (10yr percent change) 19 0.1%
CO2 emissions per capita (metric tons) 8*/25** 9.8
* = Rank within sample of 37 countries
** = World ranking of 180 countries
Research and development indicators
Economic indicators
© 2017 KPMG LLP, a Delaware limited liability partnership and the U.S. member firm of the KPMG network of independent member firms affiliated with KPMG International Cooperative (“KPMG International”), a Swiss entity. All rights reserved. The KPMG name and logo are registered trademarks or trademarks of KPMG International. NDPPS 655445
49The KPMG Green Tax Index

Carbon and climate changeThe Ministry of the Environment (MOE) introduced the Japan Voluntary Emissions Trading Scheme (JVETS) in 2005 to support cost-effective greenhouse gas emission reductions and emissions trading. Voluntary participants setting emission reduction targets may obtain subsidies for their facilities for CO2 reduction and earn profits from transferring originally assigned emission allowances (Japan Allowances or JPA) when they achieve the targets. In 2008, an integrated domestic market for emissions trading was introduced as an experiment to facilitate technology development and emission reduction efforts.
The government is developing a Joint Crediting Mechanism/Bilateral Offset Credit Mechanism (JCM/BOCM) program to incentivize carbon mitigation projects, such as utilizing leading low-carbon technologies and infrastructure.
The scheme aims to achieve its objectives with simplicity and practicality compared with the CDM scheme under the Kyoto Protocol, but to maintain environmental integrity and transparency as well.
A petroleum and coal tax is applied to those who ship crude oil, petroleum products, gaseous hydrocarbons, or coal from extracting stations or withdraw crude oil, petroleum products, gaseous hydrocarbons, or coal from bonded areas. In addition, there is a special provision/rate for climate change (additional tax) for crude oil, petroleum products, gaseous hydrocarbons, or coal based on the 2012 introduction of “Carbon Dioxide Tax of Global Warming Countermeasure,” which aims to control the emission of energy-originated CO2.
Regional cap and trade programs also exist. As an example, the Tokyo Metropolitan Government Cap-and-Trade Program (Tokyo-ETS) was introduced in April 2010. Participants to the scheme, such as large office buildings and factories, have to achieve targets (cap setting) by reducing their CO2 emissions, and if necessary, offsetting the excess emissions with credits purchased from other participants, credits obtained from small to medium-sized facilities in Tokyo, credits obtained from entities outside Tokyo, or renewable energy certificates. If a participant successfully reduces its emissions and the reduction exceeds the yearly target, it is entitled to carbon credits certified by Tokyo metropolitan government.
Renewable energy and fuelsBoth incentives and penalties exist specific to the renewable energy and fuel space.
As an example, a company may claim increased initial depreciation of 30 percent of the acquisition cost of certain new assets such as new energy utilization equipment and CO2 discharge control equipment meeting certain conditions.
Taxes are imposed on gasoline collected from manufacturing facilities or picked up from the bonded areas, oil and gas (for cars) collected from the filled fields or picked up from the bonded areas, and diesel oil picked up from the primary distributors or exclusive agencies.
Green vehiclesA company may claim increased initial depreciation of 30 percent of the acquisition cost of certain new assets such as new energy utilization equipment and CO2 discharge control
equipment (including plug-in hybrid motor vehicles, energy regenerative type hybrid motor vehicles, and electric-powered vehicles), meeting certain conditions.
The automobile tax, imposed on standard-sized cars and trucks every year, is reduced by 50–75 percent for the first year on environmentally friendly vehicles. The light vehicle tax, also imposed yearly, is reduced by 25–75 percent for the first year on environmentally friendly vehicles. The motor vehicle weight tax, imposed when a motor vehicle inspection certificate is obtained or a registration number for a light motor vehicle is obtained, is reduced by 25–100 percent on environmentally friendly vehicles. The automobile acquisition tax, imposed when a car is acquired, is reduced by 20–100 percent on environmentally friendly vehicles.
Material resources and wasteSome local governments have introduced an industrial waste tax with the aim of reducing industrial waste and improving waste recycling.
InnovationCompanies are eligible for R&D tax credits, the amount of which depends on several factors including total R&D expenditure for a fiscal year, R&D ratio (calculated by statute), and size of company. The R&D credit is not limited to “green” specific activities but must be technological and scientific in nature to qualify.
© 2017 KPMG LLP, a Delaware limited liability partnership and the U.S. member firm of the KPMG network of independent member firms affiliated with KPMG International Cooperative (“KPMG International”), a Swiss entity. All rights reserved. The KPMG name and logo are registered trademarks or trademarks of KPMG International. NDPPS 655445

Malaysia
Indicator Rank* Actual
GDP per capita 27 USD 9,360
CPI yr/yr 13 1.8%
Real GDP growth 6 4.2%
Working age pop (percent of total) 13 68.4%
* = Rank within sample of 37 countries
Indicator Rank* Actual
Development of environment-related technologies (percent domestic technologies)
29 8.35%
Environmental R&D budget ( percent total gov. R&D) - -
Development of environment-related technologies (percent inventions worldwide)
25 0.09%
* = Rank within sample of 37 countries
Environmental policy indicators
Indicator RankSample*/World** Actual
EPI 29*/63** 74.23
EPS - -
Environmental tax revenue (percent of total tax revenue) 27 1.45%
Renewable energy consumption 28 6.80%
CO2 emissions (10yr percent change) 28 49.4%
CO2 emissions per capita (metric tons) 14*/37** 8.0
* = Rank within sample of 37 countries
** = World ranking of 180 countries
Research and development indicators
Economic indicators
© 2017 KPMG LLP, a Delaware limited liability partnership and the U.S. member firm of the KPMG network of independent member firms affiliated with KPMG International Cooperative (“KPMG International”), a Swiss entity. All rights reserved. The KPMG name and logo are registered trademarks or trademarks of KPMG International. NDPPS 655445
51The KPMG Green Tax Index

Renewable energy and fuels Malaysia offers various incentives related to renewable energy. As an example, an Investment Tax Allowance of 100 percent of qualifying capital expenditures incurred for certain activities/projects, including green technology assets (for calendar year 2013–2020), is available. The allowance can be offset against 70 percent of statutory income. Green technology assets are defined in the MyHijau Directory (which is approved by the Minister of Finance) as a green technology product, equipment, or system used to conserve the natural environment and resources that minimize and reduce the negative impact of human activities. Unutilized allowances can be carried forward to subsequent years until fully utilized.
In addition, companies undertaking generation of energy from renewable resources are eligible for Pioneer Status incentives, which provide income tax exemption of 100 percent of statutory income for 10 years (unabsorbed capital allowances as well as accumulated losses incurred during the pioneer period can be carried forward and deducted from the post-pioneer income of the company) or Investment Tax Allowances of 100 percent on qualifying capital expenditures incurred within a period of 5 years (which can offset 100 percent of the statutory income for the year of assessment).
In addition, certain locally and nonlocally produced machinery and equipment purchased for the generation of energy using biomass are exempt from import duty and sales tax.
Material resources and wasteTo reduce operation costs and promote environmental preservation, companies providing energy conservation services are eligible for various incentives including the Pioneer Status and Investment Tax Allowance described above.
In addition, incentives are available to Waste Eco Parks (WEP) developers in the form of an income tax exemption of 70 percent on statutory income derived from rental of buildings, fees received from the usage of waste receiving and separation facilities, and wastewater treatment facilities located in WEP from 2016 until 2025, if developers design/develop the infrastructure within the WEP incorporating certain criteria project.
There is also an incentive for WEP managers (70 percent tax exemption on statutory income derived from services activities related to management, maintenance, supervision, and marketing of WEP) and an incentive for WEP operators (100 percent tax exemption on statutory income for a period of 5 years, derived from qualifying activities undertaken in WEP or
income tax exemption equivalent to 100 percent of qualifying capital expenditures (Investment Tax Allowance) incurred within a period of 5 years). The allowance can be offset against 70 percent of statutory income for each year of assessment for companies located in WEP and undertaking qualifying activities. Any unutilized allowances can be carried forward to subsequent years until fully utilized.
Pollution and ecosystems Companies that undertake forest plantation projects are eligible for Pioneer Status and Investment Tax Allowance incentives under the Promotion of Investments Acts of 1986. Also, companies that undertake forest plantation projects can apply for incentives, such as a tax deduction equivalent to the amount invested in a company that undertakes an approved forest plantation project.
© 2017 KPMG LLP, a Delaware limited liability partnership and the U.S. member firm of the KPMG network of independent member firms affiliated with KPMG International Cooperative (“KPMG International”), a Swiss entity. All rights reserved. The KPMG name and logo are registered trademarks or trademarks of KPMG International. NDPPS 655445

Mexico
Indicator Rank* Actual
GDP per capita 30 USD 8,555
CPI yr/yr 8 3.4%
Real GDP growth 16 2.3%
Working age pop (percent of total) 22 65.9%
* = Rank within sample of 37 countries
Indicator Rank* Actual
Development of environment-related technologies (percent domestic technologies)
22 9.16%
Environmental R&D budget (percent total gov. R&D) 18 1.6%
Development of environment-related technologies (percent inventions worldwide)
25 0.09%
* = Rank within sample of 37 countries
Environmental policy indicators
Indicator RankSample*/World** Actual
EPI 30*/67** 73.59
EPS - -
Environmental tax revenue (percent of total tax revenue) 28 -1.78%
Renewable energy consumption 23 9.35%
CO2 emissions (10yr percent change) 24 20.4%
CO2 emissions per capita (metric tons) 31*/83** 4.0
* = Rank within sample of 37 countries
** = World ranking of 180 countries
Research and development indicators
Economic indicators
© 2017 KPMG LLP, a Delaware limited liability partnership and the U.S. member firm of the KPMG network of independent member firms affiliated with KPMG International Cooperative (“KPMG International”), a Swiss entity. All rights reserved. The KPMG name and logo are registered trademarks or trademarks of KPMG International. NDPPS 655445
53The KPMG Green Tax Index

Carbon and climate changeMexico has recently refocused its attention on environmental protection. First, in 2016, Mexico passed the General Law for Environmental Protection (“Ley General de Equilibrio Ecológico y la Protección al Ambiente” or “LGEEPA”), which established a National Emission and Pollution Agents Transfer Registry (RETC) and imposes penalties on entities that create environmental damage (not just as a result of carbon emissions). Second, the General Law for Climate Change (“Ley General de Cambio Climático” or “LGCC”) was enacted. This law establishes an additional National Registry of Emissions (RENE) where entities with yearly emissions greater than 25,000 tons of CO2 equivalents report annual emissions.
In addition, Mexico established a Clean Energy Certificate Program (“Certificados de Energía Limpia” or “CELs”). This cap and trade program provides that entities dedicated to the generation of electricity will be able to obtain CELs, while a market will be established for those CELs, which would provide entities with additional revenues to produce efficient forms of energy generation. The market is expected to be launched in 2018.
Renewable energy and fuels Mexican Income Tax Law provides a 100 percent immediate deduction for investment in renewable energy equipment. Examples of renewable energy sources include solar power, wind power, hydro power
(whether kinetic or potential, from any natural or manmade body of water), ocean power in its various forms, geothermal power, and power from biomass or waste.
In addition, Mexico imposes an excise tax on the commercialization of fossil fuel derivatives.
Green vehiclesThe federal government published new provisions providing a credit for investments in power supply units for electric vehicles. Also, in the new income tax provisions, deducibility limits were increased for green vehicles for acquisition and leasing, compared to the limits on standard vehicles. Furthermore, state vehicle tenure tax is usually imposed for both the acquisition and ownership of vehicles. The rates and mechanics for calculation vary from state to state. Hybrids and plug-in vehicles are usually exempt from this state tax.
Green buildingsThere are no national tax incentives in the green building space, though local incentives do exist. As an example, Mexico City offers real estate tax reductions for certified sustainable buildings.
WaterWater service is the responsibility of each Mexican state. As such, there are no federal tax penalties on water use.
Material resources and wasteMexico provides a limitation on the deductibility of perishable goods for income tax purposes.
Pollution and ecosystems Though no national tax revenue incentives and penalties exist, municipal programs are available. As an example, Mexico City provides corporations that have a certified agenda to mitigate their environmental impact with payroll tax reductions. In addition, tax credits are available to corporations that recycle or reprocess part of their solid waste.
InnovationMexican agencies, such as the National Council of Science and Technology (CONACYT), provide grants for various R&D projects, some specific to green technology. As an example, the CONACYT and the Ministry of Energy established a sectorial fund, allocated each year through tender bids, which specifies the required specific activities for that particular year. The subjects covered by these tender bids are, among others, renewable sources of energy, energy efficiency, use of clean technologies, and diversification of primary sources of energy.
© 2017 KPMG LLP, a Delaware limited liability partnership and the U.S. member firm of the KPMG network of independent member firms affiliated with KPMG International Cooperative (“KPMG International”), a Swiss entity. All rights reserved. The KPMG name and logo are registered trademarks or trademarks of KPMG International. NDPPS 655445

The Netherlands
Indicator Rank* Actual
GDP per capita 8 USD 45,283
CPI yr/yr 29 0.5%
Real GDP growth 18 2.1%
Working age pop (percent of total) 26 65.2%
* = Rank within sample of 37 countries
Indicator Rank* Actual
Development of environment-related technologies (percent domestic technologies)
27 8.46%
Environmental R&D budget (percent total gov. R&D) 22 0.6%
Development of environment-related technologies (percent inventions worldwide)
11 1.13%
* = Rank within sample of 37 countries
Environmental policy indicators
Indicator RankSample*/World** Actual
EPI 20*/36** 82.03
EPS 2 3.63
Environmental tax revenue (percent of total tax revenue) 3 9.30%
Renewable energy consumption 29 4.65%
CO2 emissions (10yr percent change) 16 -2.8%
CO2 emissions per capita (metric tons) 7*/23** 10.1
* = Rank within sample of 37 countries
** = World ranking of 180 countries
Research and development indicators
Economic indicators
© 2017 KPMG LLP, a Delaware limited liability partnership and the U.S. member firm of the KPMG network of independent member firms affiliated with KPMG International Cooperative (“KPMG International”), a Swiss entity. All rights reserved. The KPMG name and logo are registered trademarks or trademarks of KPMG International. NDPPS 655445
55The KPMG Green Tax Index

Carbon and climate change The Netherlands continues to participate in the EU Emissions Trading Scheme.
Renewable energy and fuels The Environmental Investment Deduction scheme (MIA) and the Random Deductions for Environmental Investments (VAMIL) programs are intended to stimulate environmentally friendly investments by businesses and entrepreneurs through providing incentives to choose the least polluting alternative when an investment is made. All businesses and entrepreneurs paying income tax or corporate income tax in the Netherlands are eligible to participate in the MIA and/or VAMIL schemes. Eligible technologies are listed on the “Environmental List” drawn up by the Ministry of Infrastructure and Environment, which is updated annually.
MIA offers a tax deduction of 36 percent of the amount invested in qualifying environmentally friendly assets, and VAMIL provides voluntary depreciation on environmentally friendly investments. In doing so, MIA and VAMIL allow the investor to decide when to write off the investment costs, offering liquidity (cash flow) and interest advantages to investors.
To be eligible for the VAMIL scheme, assets must be included on the “Environmental List”. This list has qualified assets (now 270 investments). A request to include an eco-friendly technology on this list can also be submitted. Qualifying assets generally are business assets aimed at more efficient production, less emissions, less pollution, efficient material use,
electrical machines, improved safety of storage of chemicals, biodiversity, recycling, and waste. They should also be more expensive than the less eco-friendly alternatives. Voluntary depreciation through VAMIL is not limited, and 100 percent of the cost of the qualifying asset (the maximum investment costs that are taken into account are EUR 25 million/qualifying asset) can be depreciated, provided that no prior use of the asset has occurred, and certain formal conditions that are not directly applicable to renewable energy are met. Note that assets for which this tax incentive is applicable can be used as part of the production of energy from renewable sources.
An additional 58 percent deduction (up from 41.5 percent in 2013) for the amount invested in qualifying assets is available under the energy investment allowance (Energie-investeringsaftrek, EIA) if certain criteria are met, including (i) investments must be included on the “energy list”; (ii) the maximum amount of investment for which EIA can be claimed per calendar year per taxpayer is EUR 120 million (pro rata calculation applies in the case of transparent entities); and (iii) the total amount of qualifying investments must be more than EUR 2,500 per calendar year.
Also, the additional 36 percent deduction of the amount invested in qualifying environmentally friendly assets under the MIA has similar criteria as the EIA. The EIA and the MIA cannot be applied to the same asset simultaneously.
The Netherlands also offers an Early Adopter Project (EAP) for companies adopting an energy efficiency technology provided by either small or medium-size enterprises or for a consortium with a research organization adopting an energy efficiency technology. The program is aimed at improving industrial energy efficiency.
Other incentive programs available include the Stimulering Duurzame Energieproductie/Encouraging Sustainable Energy Production (SDE+), which consists of an operating grant, subsidizing renewable energy projects based on energy prices for 15 years, as well as a tax incentive to invest in “green funds” available to individuals and private investors. Private investors are not taxed on capital invested in green funds, and the maximum amount of invested capital exempted on an individual basis is EUR 57,213.
The Netherlands also levies various taxes, such as an energy tax on energy providers of natural gas and electricity (since 1996).
The 2016 energy tax rates are different for natural gas and electricity and vary for consumer/industrial/vehicle use. The yearly energy tax is reduced by EUR 310.81 per electricity connection for homes and offices since energy consumption is viewed as a basic need.
A coal tax is levied on producers and importers of coal, and a tax on transportation fuels is also levied.
© 2017 KPMG LLP, a Delaware limited liability partnership and the U.S. member firm of the KPMG network of independent member firms affiliated with KPMG International Cooperative (“KPMG International”), a Swiss entity. All rights reserved. The KPMG name and logo are registered trademarks or trademarks of KPMG International. NDPPS 655445

Green vehiclesThe Netherlands has several tax benefits in place for electric/green vehicles. The MIA can be used by companies to invest in electric or hybrid vehicles, or a charging station.
In addition, vehicles emitting 0 CO2 per kilometer are exempted from motorway tax in 2016. Vehicles emitting 1 to 50 grams per kilometer (mostly plug-in hybrids or semielectric) pay half of the normal motorway taxes due in 2016. In addition, leased electric vehicles have a reduced tax rate that is based on CO2 emissions per km and the year in which the license plate is registered in the Netherlands. The rate is 4 percent of the catalog price for electric vehicles, 15 percent for vehicles emitting 1 to 50 grams (and registered in 2016), and goes up to 25 percent for vehicles emitting more than 106 CO2/km. There is no BPM (tax on new car purchases) for electric vehicles in 2016 and 2017. The tax for other types of vehicles depends on the CO2 emissions per km.
Local governments (provinces or municipalities) have different subsidy schemes in place for companies purchasing electric vehicles. For instance, Amsterdam provides up to EUR 5,000 for electric passenger cars (used for business), vans, and taxis, and also up to EUR 40,000 for plug-in trucks or buses.
Green buildingsDepreciation is granted on qualifying environmentally friendly assets under the VAMIL program.
WaterVarious subnational water levies exist.
Material resources and wastePackaging waste control levy The packaging tax was abolished in 2013 and replaced by a packaging waste control levy. Companies that introduce more than 50,000 kilos of packaging on the Dutch market need to pay a certain amount p/kg to the Waste Fund Packaging depending on the packaging material.
Municipal waste levyThere are municipal levies for the collection and processing of waste. The rates differ for individuals and businesses and per municipality. For example, the 2016 rate in Amsterdam for individuals is EUR 235 (single occupant) and EUR 313 (multiple occupants), and for businesses is EUR 312 (small businesses, <176 liters) and EUR 662 (large businesses, up to 396 liters).
FoodThe Verduurzamen voedselproductie (SBIR) is a sustainable food production program aimed at more efficient use of resources and use of residual streams for more sustainable food production. It encourages more efficient use by implementing innovations in systems and processes, countering the amount of waste and more efficient use of residual streams within the agri-food chain. Companies involved in this program receive an initial subsidy of EUR 50,000 to perform a feasibility study. If their project seems feasible, a further subsidy could be granted.
InnovationA special regime, referred to as the “innovation box” (formerly known as the patents box), was introduced in 2007, largely designed to stimulate R&D activity by Dutch businesses. The regime, which does not apply to trademarks and logos, was extended in 2008 to cover intangible assets generally derived from R&D that benefit from the R&D incentive regime for payroll tax. Under the innovation box regime, income attributable to qualifying assets in excess of development costs benefit from an effective tax rate of approximately 5 percent. Even if part of the development activity is outsourced, it may still be possible to tax the results at the low 5 percent tax rate. Currently there are plans to change the innovation box in order to meet international standards. However, taxpayers may be limited in the use of the innovation box due to the introduction of the nexus approach and potential exclusion of certain innovations.
There are several other R&D incentives, such as the Demonstration Energy-Innovation (DEI) program, which targets energy innovation investment projects that have surpassed the prototype phase and are applied into the market just before the large-scale market introduction.
The Green Deal program allows organizations to work together with the government upon successfully implementing a sustainability project, alleviating barriers for companies and citizens to cooperate to stimulate transition to a sustainable economy.
© 2017 KPMG LLP, a Delaware limited liability partnership and the U.S. member firm of the KPMG network of independent member firms affiliated with KPMG International Cooperative (“KPMG International”), a Swiss entity. All rights reserved. The KPMG name and logo are registered trademarks or trademarks of KPMG International. NDPPS 655445
57The KPMG Green Tax Index

New Zealand
Economic indicators
Indicator Rank* Actual
GDP per capita 14 USD 38,345
CPI yr/yr 22 1.3%
Real GDP growth 7 4.0%
Working age pop (percent of total) 29 64.9%
* = Rank within sample of 37 countries
Research and development indicators
Indicator Rank* Actual
Development of environment-related technologies (percent domestic technologies)
28 8.41%
Environmental R&D budget (percent total gov. R&D) 1 9.4%
Development of environment-related technologies (percent inventions worldwide)
22 0.14%
* = Rank within sample of 37 countries
Environmental policy indicators
Indicator RankSample*/World** Actual
EPI 7*/11** 88
EPS - -
Environmental tax revenue (percent of total tax revenue) 22 4.19%
Renewable energy consumption 7 30.78%
CO2 emissions (10yr percent change) 17 -0.4%
CO2 emissions per capita (metric tons) 16*/40** 7.7
* = Rank within sample of 37 countries
** = World ranking of 180 countries
© 2017 KPMG LLP, a Delaware limited liability partnership and the U.S. member firm of the KPMG network of independent member firms affiliated with KPMG International Cooperative (“KPMG International”), a Swiss entity. All rights reserved. The KPMG name and logo are registered trademarks or trademarks of KPMG International. NDPPS 655445
Carbon and climate changeThe New Zealand Emissions Trading Scheme (NZ ETS) is the government’s principal policy response to climate change.
It supports global efforts to reduce greenhouse gas emissions while maintaining economic productivity. The scheme is in its early phases and the government is looking for ways to improve it. The NZ ETS puts a price on greenhouse gas emissions, providing an incentive for people to reduce emissions and plant forests to absorb carbon dioxide. The forestry industry was the first to enter into the scheme in 2008, followed by energy, fishing, industry, and liquid fossil fuels in 2010 and, finally, synthetic gases and waste in 2013. The Environmental Projection Authority (EPA) ensures compliance under the Climate Change Response Act 2002.
Certain sectors are required to acquire and surrender emission units to account for their direct greenhouse gas emissions or the emissions associated with their products.
An emission unit represents one metric ton of carbon dioxide, or the equivalent of any other greenhouse gas (carbon dioxide equivalent).
Renewable energy and fuels There are no central government incentives to assist consumers or businesses in New Zealand to implement solar or other on-site renewable generation technologies. The majority of NZ’s energy is already sourced by renewable energy from hydro, geothermal, and wind power.
Kiwibank, a state-owned bank, officially launched its Sustainable Energy Loan Program in November 2012—a first in New Zealand. Designed to assist consumers to install and implement their own
systems, the program uses SEANZ installer/system integrator members only, who can analyze profiles and needs, design, supply, install, and commission systems.
In addition, the Energy Efficiency and Conservation Authority (EECA) is the government agency that works to improve the energy efficiency of New Zealand homes and businesses and encourage the uptake of renewable energy. The program encourages people to be more energy efficient, reduce carbon emissions, and switch to renewable energy at home, at work, and on the road. Grants are available through Warm Up New Zealand: Healthy Homes, for ceiling and underfloor insulation for rental properties occupied by low-income tenants.
Green vehiclesNew Zealand does not manufacture vehicles, but the government announced in May 2016 its electric vehicles (EVs) program, aimed at increasing the uptake of EVs in New Zealand. The program includes a review of tax depreciation rates and the method for calculating fringe benefit tax for EVs to ensure EVs are not being unfairly disadvantaged.
In addition, a Low Emission Vehicles Contestable Fund was established as part of the government’s ambitious EVs program announced in May 2016 to help accelerate the uptake of EVs in New Zealand. The fund will provide up to NZD 6 million per year (up to NZD 4 million in 2016/17) to cofund, up to 50 percent, projects with private and public sector partners in areas where commercial returns are not strong enough yet to justify full private investment. These projects will need to contribute to at least one of the following objectives: increasing the variety and supply of EVs available, improving the availability of servicing
or charging infrastructure in areas where demand is not fully developed, increasing demand for EVs, or developing innovative products or systems to take advantage of growing EV usage.
Green buildingsThere are no central government incentives for building or occupying green buildings in New Zealand.
Local governments must take a “sustainable approach” to town planning and buildings; however, there is no further guidance or structure. The NZ Building Council provides resources and rating schemes rather than incentives.
WaterThere are local charges for water use and wastewater. In addition, the New Zealand Water Efficiency Labeling Scheme (WELS) is designed to provide information, through labeling at the point of sale, to consumers buying products that use water. The labeling provides clear information on a product’s water efficiency and water consumption in a standardized form. The WELS applies to washing machines, dishwashers, lavatories, showers, taps, and urinals.
Material resources and wasteThe Waste Minimisation Act encourages a reduction in the amount of waste generated and disposed of, and is aimed at reducing the environmental harm of waste and providing economic, social, and cultural benefits for New Zealand. The Act also allows for regulations controlling the disposal of certain products. Other local initiatives include free household waste and recycling collection, free recycling drop-off facilities, and free inorganic and e-waste collections.
© 2017 KPMG LLP, a Delaware limited liability partnership and the U.S. member firm of the KPMG network of independent member firms affiliated with KPMG International Cooperative (“KPMG International”), a Swiss entity. All rights reserved. The KPMG name and logo are registered trademarks or trademarks of KPMG International. NDPPS 655445
59The KPMG Green Tax Index

FoodSome local governments have set up waste minimization plans, which include goals around organic waste; however, there are no penalties or taxes built into these plans.
Pollution and ecosystemsThe Resource Management Act 1991 promotes the sustainable management of natural and physical resources. In addition, the Environmental Restoration Account
(ERA) scheme allows businesses that cause environmental damage when they discharge a contaminant to set money aside to cover their monitoring or restoration costs.
© 2017 KPMG LLP, a Delaware limited liability partnership and the U.S. member firm of the KPMG network of independent member firms affiliated with KPMG International Cooperative (“KPMG International”), a Swiss entity. All rights reserved. The KPMG name and logo are registered trademarks or trademarks of KPMG International. NDPPS 655445

Poland
Indicator Rank* Actual
GDP per capita 25 USD 12,316
CPI yr/yr 27 0.8%
Real GDP growth 11 2.8%
Working age pop (percent of total) 9 69.5%
* = Rank within sample of 37 countries
Indicator Rank* Actual
Development of environment-related technologies (percent domestic technologies)
4 13.13%
Environmental R&D budget (percent total gov. R&D) 3 6.1%
Development of environment-related technologies (percent inventions worldwide)
19 0.25%
* = Rank within sample of 37 countries
Environmental policy indicators
Indicator RankSample*/World** Actual
EPI 21*/38** 81.26
EPS 10 2.99
Environmental tax revenue (percent of total tax revenue) 15 6.01%
Renewable energy consumption 21 11.08%
CO2 emissions (10yr percent change) 18 0.0%
CO2 emissions per capita (metric tons) 15*/39** 8.0
* = Rank within sample of 37 countries
** = World ranking of 180 countries
Research and development indicators
Economic indicators
© 2017 KPMG LLP, a Delaware limited liability partnership and the U.S. member firm of the KPMG network of independent member firms affiliated with KPMG International Cooperative (“KPMG International”), a Swiss entity. All rights reserved. The KPMG name and logo are registered trademarks or trademarks of KPMG International. NDPPS 655445
61The KPMG Green Tax Index

Carbon and climate changePoland has no explicit carbon tax, but as a member of the EU, it participates in the EU Emissions Trading Scheme.
Renewable energy and fuels Poland’s program, maintained by the National Fund for Environmental Protection and Water Management, grants subsidies for entrepreneurs in the construction, expansion or reconstruction, or the installation of renewable energy projects (e.g., wind farms, small hydro power plants, and solar). In addition, the country taxes the extraction of certain minerals, such as copper, silver, natural gas, and crude oil, and imposes an excise duty on operations (e.g., purchase and sale) connected with gas and coal products.
Green vehiclesThe National Fund for Environmental Protection and Water Management offers low-emission urban public transport subsidies for the purchase of new trolleybuses, trams, or buses with hybrid electric or gas drives.
Green buildings Incentive/Subsidy programs for building energy-efficient homes or buying energy-efficient flats are offered by National Fund for Environmental Protection and Water Management. The subsidies are in the form of partial repayment of the bank loan for the construction/purchase of a house or an apartment. There are also incentives for the construction of new energy-efficient public buildings and collective residence, as well as thermal efficiency improvement and energy-saving investments.
WaterThe Polish government plans to implement new water regulations (similar to EU regulations) that will require everyone (including power plants) to pay a fee for water.
Currently, there is a national program for Environmental Protection and Water Management. Wastewater is managed under the National Programme of Municipal Sewage Treatment, which aims to improve the status of surface water and ground water by sewage treatment. There are grants available for the construction, expansion, or modernization of municipal wastewater treatment plants.
Operational Programme Infrastructure and Environment is another national program to support a low-carbon economy, environment protection, prevention and adaptation to climate change, and transport and energy security. There are also funds available for the efficient use of water projects, such as for the construction, reconstruction, or repair of water equipment to help reduce the effects of floods and drought, implementation of rainwater management systems, and construction or modernization of sewage treatment plants.
Material resources and waste Poland imposes taxes on entities involved with the mineral extraction of copper, silver, oil, or natural gas.
Another example of taxes on waste is Poland’s product fee, which is an environmental fee placed on domestic market packaged products. The need to pay a product fee arises when an introductory (i.e., manufacturer) package does not comply with the statutory requirement of recovery and
recycling of packaging waste. The fee is charged by municipalities and regulated at the national level.
Incentives are also available, such as the National Fund for Environmental Protection and Water Management Rational waste management or Rational recycling management (Racjonalna Gospodarka Odpadami) programs, which offer incentives in the form of loans and grants for various uses, such as the construction of new and modernized facilities related to recovery and recycling.
FoodThe Polish parliament is currently drafting a law that aims to prevent local retailers from discarding unsold food that is still fit for consumption. Under the plan, owners of certain retail outlets will be required to donate such food to charity organizations, with intentional discards punishable by financial penalties.
Pollution and ecosystemsEnterprises with the status of an R&D center are exempt from Poland’s forest tax if the forest is used for purposes of R&D. Also, taxpayers may be exempt from some personal income tax on the basis of thermo-modernization bonus of buildings (repaying part of the loan taken for thermal modernization if energy consumption is reduced). In addition, if an investment in renewable energy sources is made, an agricultural tax deduction may be available.
InnovationSeveral national programs encourage R&D in Poland, such as the GreenEvo project, which promotes innovative environmental technologies (green technologies).
© 2017 KPMG LLP, a Delaware limited liability partnership and the U.S. member firm of the KPMG network of independent member firms affiliated with KPMG International Cooperative (“KPMG International”), a Swiss entity. All rights reserved. The KPMG name and logo are registered trademarks or trademarks of KPMG International. NDPPS 655445

Portugal
Indicator Rank* Actual
GDP per capita 21 USD 19,832
CPI yr/yr 26 0.9%
Real GDP growth 25 1.4%
Working age pop (percent of total) 27 65.2%
* = Rank within sample of 37 countries
Indicator Rank* Actual
Development of environment-related technologies (percent domestic technologies)
26 8.73%
Environmental R&D budget (percent total gov. R&D) 6 4.0%
Development of environment-related technologies (percent inventions worldwide)
28 0.06%
* = Rank within sample of 37 countries
Environmental policy indicators
Indicator RankSample*/World** Actual
EPI 5*/7** 88.63
EPS 18 2.13
Environmental tax revenue (percent of total tax revenue) 13 6.41%
Renewable energy consumption 11 25.56%
CO2 emissions (10yr percent change) 6 -24.4%
CO2 emissions per capita (metric tons) 30*/76** 4.4
* = Rank within sample of 37 countries
** = World ranking of 180 countries
Research and development indicators
Economic indicators
© 2017 KPMG LLP, a Delaware limited liability partnership and the U.S. member firm of the KPMG network of independent member firms affiliated with KPMG International Cooperative (“KPMG International”), a Swiss entity. All rights reserved. The KPMG name and logo are registered trademarks or trademarks of KPMG International. NDPPS 655445
63The KPMG Green Tax Index

Carbon and climate changePortugal participates in the EU Emission Trading Scheme (EU-ETS). Portugal also has a carbon tax that applies to sectors that are not covered by the EU-ETS.
Renewable energy and fuelsPortugal encourages renewable energy and fuel reduction programs through various incentives, such as a 50 percent reduction of the municipal property tax rate applicable to buildings used for the production of renewable energy and for rustic buildings located in classified areas (ecosystem services). Also, there is an exemption from the Special Contribution on the Energy Sector for companies operating wind, solar, and small hydro power plants.
Penalties are also imposed, such as a tax on oil products used as fuel or carburant in any type of nonstationary engine, and on the other hydrocarbons destined to be used, sold, or to be consumed in use as fuel (with the exception of peat and natural gas). Since 2015, an additional contribution is due relating to CO2 emissions. This contribution is levied on gasoline, oil, diesel, liquefied petroleum gas (LPG), natural gas, fuel oil, coke and coal.
Green vehiclesVarious incentives and penalties are available specific to use of vehicles in Portugal. As an example, a vehicle tax, based on engine capacity and level of CO2 emissions, is levied on vehicles. In addition, an annual circulation tax, an ownership-based tax, is applied to vehicles, including passenger vehicles, vehicles used for passenger and goods transport, for private transport of goods and for transport services, motorcycles, boats, and private aircrafts. The tax amount varies depending on the engine capacity and the level of the CO2 emissions.
Green buildingsReal estate transfer taxes may be exempted if building energy efficiency is updated in certain urban properties.
Municipalities may also apply a reduction to the municipal property tax rate applicable to urban properties considered “green” or “energy efficient,” based on energy consumption.
Material resources and wastePortugal applies a special contribution (not a tax) to lightweight plastic bags (EUR 0.08/bag).
Pollution and ecosystemsPortugal imposes a waste management tax specific to waste management facilities.
The government also provides an exemption from income tax for real estate investment funds that invest a specific portion of their funds in forestry assets, as well as a reduced income tax rate for the investors in those funds. Municipal property tax and real estate transfer taxes may also be exempt, if certain buildings are classified as forest intervention areas (zif), or buildings are integrated in land exchange programs or used for agricultural, forestry, or forestry-grazing purposes.
© 2017 KPMG LLP, a Delaware limited liability partnership and the U.S. member firm of the KPMG network of independent member firms affiliated with KPMG International Cooperative (“KPMG International”), a Swiss entity. All rights reserved. The KPMG name and logo are registered trademarks or trademarks of KPMG International. NDPPS 655445

Romania
Indicator Rank* Actual
GDP per capita 26 USD 9,465
CPI yr/yr 36 -0.5%
Real GDP growth 5 4.8%
Working age pop (percent of total) 16 67.2%
* = Rank within sample of 37 countries
Indicator Rank* Actual
Development of environment-related technologies (percent domestic technologies)
20 9.55%
Environmental R&D budget (percent total gov. R&D) 3 4.9%
Development of environment-related technologies (percent inventions worldwide)
30 0.04%
* = Rank within sample of 37 countries
Environmental policy indicators
Indicator RankSample*/World** Actual
EPI 19*/34** 83.24
EPS - -
Environmental tax revenue (percent of total tax revenue) - -
Renewable energy consumption 14 21.68%
CO2 emissions (10yr percent change) 3 -30.0%
CO2 emissions per capita (metric tons) 32*/88** 3.5
* = Rank within sample of 37 countries
** = World ranking of 180 countries
Research and development indicators
Economic indicators
© 2017 KPMG LLP, a Delaware limited liability partnership and the U.S. member firm of the KPMG network of independent member firms affiliated with KPMG International Cooperative (“KPMG International”), a Swiss entity. All rights reserved. The KPMG name and logo are registered trademarks or trademarks of KPMG International. NDPPS 655445
65The KPMG Green Tax Index
Carbon and climate change Romania does not currently have a carbon tax. Draft regulations proposing such a tax did not pass. Romania participates in the EU cap and trade program.
Renewable energy and fuels One of the two major sources of funding for purchasing energy-efficient equipment in Romania is the Structural and Cohesion Funds 2014–2020 (SCF).
With respect to the SCF, there is a wide range of intervention topics (e.g., R&D projects and projects that increase production capacity) that, indirectly, have a focus on sustainable development represented also by the acquisition of energy-efficient equipment as a horizontal objective of the Structural Funds available in Romania for 2014–2020.
Renewable energy production is also stimulated in Romania. The national target set for Romania is 24 percent renewable share in total energy consumption for 2020 (without including large hydro plants), which includes electricity, heating, cooling, and transport. Accordingly, the National Renewable Action Plan for the period 2007–2020 sets the following targets: 35 percent by 2015 and 38 percent by 2020. A number of green certificates are granted for each MWh delivered into the system by renewable energy generators.
Also, there is a support mechanism for high-efficiency Combined Heat and Power Plant (CHPP) producers, for electricity produced in high-efficiency CHPPs. Producers must sell the entire electricity produced to be eligible. CHPP producers using renewable sources have the right to choose between benefiting from the above mentioned scheme or the incentives granted for producing energy from renewable sources.
In addition, there are incentives for biofuels.
Green vehiclesThe other major Romanian funding source for green projects is the Environment Fund Administration (EFA). The nonreimbursable funds managed by EFA cover:
— Incentives for acquisition of electric vehicles
— Incentives for acquisition of new vehicles.
An “environmental stamp” tax is payable to the EFA at the time a vehicle is registered for the first time to circulate in Romania. The value of the “green stamp” is calculated taking into account the CO2 emissions (g/km), engine cylindrical capacity (ccm), and pollution norm of the vehicle. Currently, draft regulation proposing cancelation of this tax starting January 1, 2017 was discussed and apparently approved by the Romanian Parliament, but not enacted by the Romanian president, and is not yet published in the Official Journal.
In addition, the EFA implements the “Program for reduction of greenhouse gases emissions in transport, by promoting non-polluting and efficient from energetic point of view transport vehicles.” The purpose of the program is to support the purchase of new electric or hybrid transport vehicles with incentives.
WaterRomania’s environmental fund can be used for financing projects specific to protection of water resources, such as integrated water supply systems, water treatment plants, and wastewater treatment plants.
Material resources and wasteFor stimulating reduction of natural resources consumption, a contribution
of 2 percent of income resulting from selling wood mass (excepting the ones used for household heating and ornamental trees) is payable by the forestry administrator or owner to the EFA.
Producers of packaging and packed products, as well as importers of packed products, are required to reach annual recovery and recycling targets for packaging waste. If the targets are not reached, a tax is applied to the not reached target and paid to the EFA.
In addition, a contribution of 3 percent of the income/earnings from ferrous and non-ferrous metallic waste, including the dismantled goods, should be directed to the Environmental Fund by the related waste generator.
Pollution and ecosystems Penalties are imposed on pollutants discharged into the atmosphere and water, though they are not governed by the EFA.
InnovationRomania provides funding via financing at special rates for various R&D projects. The rates depend mainly on type of project and applicant size category. Specifically identified green projects relate to the following smart specialization areas:
1. Bioenergy – biogas, biomass, biofuel
2. Biotechnologies
3. Energy
4. Increasing energy efficiency in generation, transmission, distribution, and consumer usage
5. Conventional, unconventional, and renewable energy resources
6. Clean technologies for producing energy from fossil fuels
7. New generation energy systems
© 2017 KPMG LLP, a Delaware limited liability partnership and the U.S. member firm of the KPMG network of independent member firms affiliated with KPMG International Cooperative (“KPMG International”), a Swiss entity. All rights reserved. The KPMG name and logo are registered trademarks or trademarks of KPMG International. NDPPS 655445

8. Environment and climate change
9. Optimal use of conventional and unconventional water resources
10. Managing the risk induced by climate change upon resources
11. Transport equipment (next-generation vehicles and green and energy-efficient technologies)
12. Equipment for the production of bio-resources (technologies, equipment, and technical systems for the production of bio-resources)
13. Remediation technologies (technologies for remediation and waste recovery).
The Environmental Fund can also be used for the following types of projects:
— Reduction of impact on atmosphere, water, and soil, including air quality monitoring
— Reduction of noise level
— Waste management
— Biodiversity conservation
— Reforestations
— Increase of public awareness on environmental protection
— Renewable energy
— Clean technologies
— R&D on environmental protection and climate change
— Others (e.g., clean transport, greenhouse, bicycles runway).
© 2017 KPMG LLP, a Delaware limited liability partnership and the U.S. member firm of the KPMG network of independent member firms affiliated with KPMG International Cooperative (“KPMG International”), a Swiss entity. All rights reserved. The KPMG name and logo are registered trademarks or trademarks of KPMG International. NDPPS 655445
67The KPMG Green Tax Index
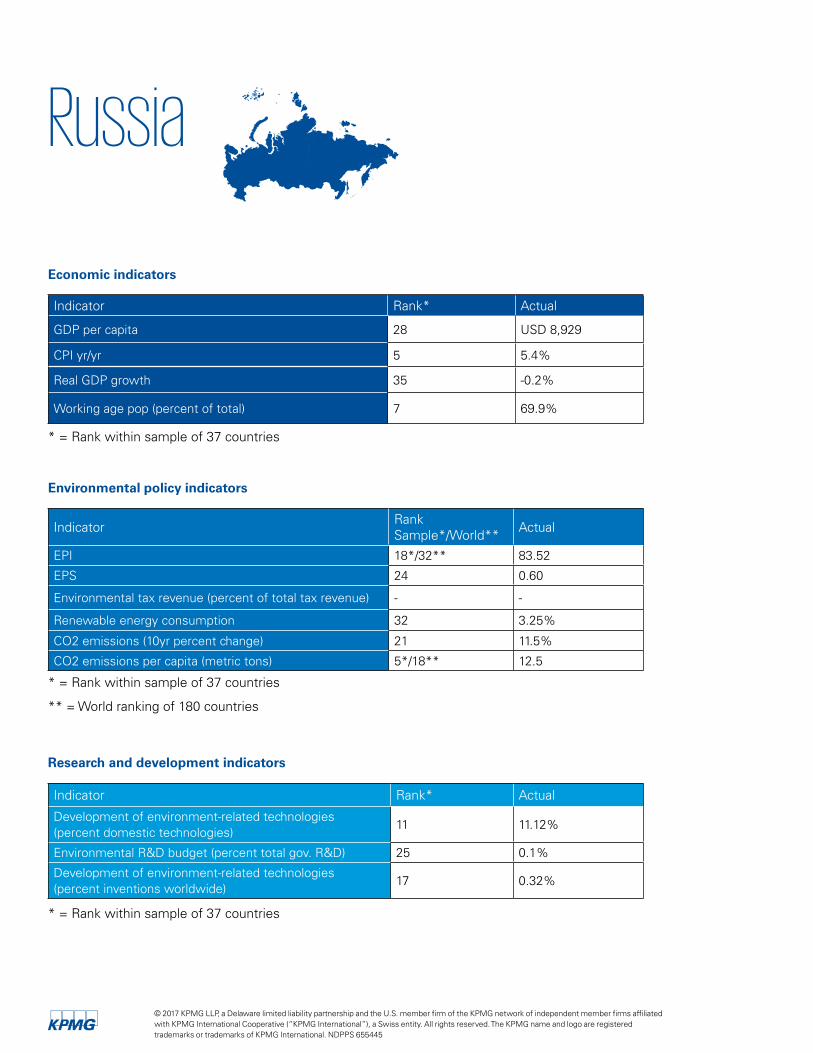
Russia
Indicator Rank* Actual
GDP per capita 28 USD 8,929
CPI yr/yr 5 5.4%
Real GDP growth 35 -0.2%
Working age pop (percent of total) 7 69.9%
* = Rank within sample of 37 countries
Indicator Rank* Actual
Development of environment-related technologies (percent domestic technologies)
11 11.12%
Environmental R&D budget (percent total gov. R&D) 25 0.1%
Development of environment-related technologies (percent inventions worldwide)
17 0.32%
* = Rank within sample of 37 countries
Environmental policy indicators
Indicator RankSample*/World** Actual
EPI 18*/32** 83.52
EPS 24 0.60
Environmental tax revenue (percent of total tax revenue) - -
Renewable energy consumption 32 3.25%
CO2 emissions (10yr percent change) 21 11.5%
CO2 emissions per capita (metric tons) 5*/18** 12.5
* = Rank within sample of 37 countries
** = World ranking of 180 countries
Research and development indicators
Economic indicators
© 2017 KPMG LLP, a Delaware limited liability partnership and the U.S. member firm of the KPMG network of independent member firms affiliated with KPMG International Cooperative (“KPMG International”), a Swiss entity. All rights reserved. The KPMG name and logo are registered trademarks or trademarks of KPMG International. NDPPS 655445

Carbon and climate change In Russia, carbon emissions are subject to the payment of fees for each ton of carbon emitted into the atmosphere or water (pollutant charge). This obligation to pay the pollutant charge arises in accordance with the Federal Act on environmental protection.
Renewable energy and fuels Russia provides various incentives to encourage the use of energy-efficient assets. For example, accelerated depreciation for certain assets, including energy-efficient assets approved by the government of the Russian Federation (RF), is available. In addition, these assets may be exempt from property tax.
Nontax policy is also used to encourage the production of renewable energy in Russia. Incentives for the generation of renewable energy include grant subsidies from the federal budget to compensate the costs of technological connection; the use of a system of green certificates, which confirm the value of the generation of renewable energy; and grants of a share of the costs from capacity payments on the wholesale electricity market.
Conventional fuels are taxed in Russia through the mineral extraction tax.
According to the Tax Code of the RF, coal, gas, and petroleum products are deemed minerals subject to the mineral extraction tax, together with natural salt and nonmetallic raw materials.
Green vehiclesThe owners of environmentally unfriendly vehicles may be subject to a higher rate of transport tax if stipulated by the constituent subjects of the RF in their regional legislation. The RF Tax Code delegates them with the power to establish different transport tax rates, depending on the class of energy efficiency (also called ecological class) of the vehicle.
WaterThe tax for water use is governed by the RF Water Code and penalties are governed by the RF Code of Administrative Violations. The water tax is levied differently depending on the type of use, which can assume one of the following forms: (1) water intake, (2) use of water area, (3) use of water for hydroelectric power production, and (4) rafting. Moreover, the RF Water Code provides collection of separate nontax payment for the usage of pools and conclusion of water use agreement. The tax rates vary depending on the types of water use and particular river basin.
Material resources and waste Packaging in Russia may be subject to an ecological fee. Similar nontax initiatives are in place for consumption waste and production waste. The Federal Act on consumption and production waste constitutes the duty of manufacturers and/or importers of goods to guarantee the utilization of goods after their consumption qualities have expired.
The ecological fee, a novelty of Russian legislation, which came into effect January 1, 2016, is paid by those manufacturers and/or importers that are not able to utilize waste on their own.
Subnational regions have also implemented various incentives. For example, the Republic of Tatarstan established a property tax exemption for assets used in the recycling of waste.
Pollution and ecosystemsRussia’s Act on Environment Protection, not its revenue agency, penalizes pollution activities.
© 2017 KPMG LLP, a Delaware limited liability partnership and the U.S. member firm of the KPMG network of independent member firms affiliated with KPMG International Cooperative (“KPMG International”), a Swiss entity. All rights reserved. The KPMG name and logo are registered trademarks or trademarks of KPMG International. NDPPS 655445
69The KPMG Green Tax Index

Singapore
Indicator Rank* Actual
GDP per capita 5 USD 52,961
CPI yr/yr 33 0.0%
Real GDP growth 19 2.0%
Working age pop (percent of total) 4 72.8%
* = Rank within sample of 37 countries
Indicator Rank* Actual
Development of environment-related technologies (percent domestic technologies)
24 9.13%
Environmental R&D budget (percent total gov. R&D) - -
Development of environment-related technologies (percent inventions worldwide)
18 0.29%
* = Rank within sample of 37 countries
Environmental policy indicators
Indicator RankSample*/World** Actual
EPI 10*/14** 87.04
EPS - -
Environmental tax revenue (percent of total tax revenue) - -
Renewable energy consumption 35 0.52%
CO2 emissions (10yr percent change) 34 62.4%
CO2 emissions per capita (metric tons) 10*/27** 9.4
* = Rank within sample of 37 countries
** = World ranking of 180 countries
Research and development indicators
Economic indicators
© 2017 KPMG LLP, a Delaware limited liability partnership and the U.S. member firm of the KPMG network of independent member firms affiliated with KPMG International Cooperative (“KPMG International”), a Swiss entity. All rights reserved. The KPMG name and logo are registered trademarks or trademarks of KPMG International. NDPPS 655445

Carbon and climate changeParis agreementSingapore ratified the Paris Agreement on September 21, 2016, formalizing its pledge to reduce its emissions intensity by 36 percent from 2005 levels by 2030 and to stabilize emissions with the aim of peaking around 2030. This pledge builds on the existing commitment to reduce, by 2020, greenhouse gas emissions by 16 percent from the business-as-usual level, which Singapore is on track to meet.
Carbon taxIn the 2017 Budget, the government announced that it intends to implement a carbon tax on the emission of greenhouse gases from year 2019. The tax will generally be applied upstream, for example, on power stations and other large direct emitters, rather than electricity users. The tax rate currently being evaluated is between SGD 10 to SGD 20 per ton of greenhouse gas emissions.
Renewable energy and fuelsThe Economic Development Board (EDB) has initiated the SolarNova program, which encourages all government agencies to come together to use solar power, so
as to spur the growth of the solar industry in Singapore and contribute to Singapore’s aim of adopting 350 Mega-Watt-peak of solar power by 2020.
Investment in renewable energy companiesThe Merger and Acquisition scheme provides an allowance of 25 percent of the value of acquisitions, subject to a maximum of SGD 10 million for each year of assessment. It also provides deductibility of transaction cost and stamp duty relief. This is a general scheme that applies to industries including but not limited to renewable energy.
Tax incentives for renewable energy companiesUnder the Pioneer Incentive and Development and Expansion Incentive Schemes, the EDB provides tax incentives that provide for concessionary tax rates of 0, 5, 10, or 15 percent on qualifying income for multinationals, including renewable energy groups, that set up their regional and global headquarters in Singapore. The incentive is subject to negotiation with the EDB and meeting substantive economic conditions.
WaterThe Water Tariff covers the costs incurred in various stages of water production process—collection of rainwater, treatment of raw water, and distribution of treated potable water to customers through an extensive nationwide water pipe network. The Water Tariff is charged based on the amount of water consumed. A water conservation tax is also imposed for certain levels of water consumption.
A Waterborne Fee (WBF) and the Sanitary Appliance Fee (SAF) are levied to offset the cost of treating used water and to operate and maintain the used water network.
Green vehiclesUnder the revised Carbon Emissions-based Vehicle Scheme (CEVS), all new cars and imported used cars registered from July 1, 2015 with low carbon emissions of less than or equal to 135g of carbon emissions per kilometer (CO2/km) will qualify for rebates of between SGD 5,000 and SGD 30,000, which will be offset against the vehicle’s Additional Registration Fee (ARF). Cars with high carbon emissions equal to or more than 186g CO2/km will incur
Energy efficiencyIncentives and schemes that are available for promoting initiatives in improving energy efficiency include:
The Investment Allowance for Energy Efficiency (IA-EE), valid until March 31, 2021, encourages companies to invest in green or sustainable initiatives to reduce their energy consumption.
The Grant for Energy Efficient Technologies (GREET) encourages owners and operators to invest in energy-efficient equipment or technologies.
Accelerated Depreciation Allowance for Energy Efficient Equipment and Technology (ADAS) encourages companies to replace old, energy-consuming equipment with more energy-efficient ones.
The Energy Efficiency Improvement Assistance Scheme (EASe) encourages companies in the manufacturing and building sectors to carry out detailed studies on their energy consumption and energy assessment to identify potential areas for energy efficiency improvement.
The Building Retrofit Energy Efficiency Financing scheme (BREEF) was launched to help building owners with the high up-front capital required for energy efficiency retrofits.
The Finance Programme for Energy Efficiency Projects is a pilot financing scheme by the EDB whereby a third-party financier pays for the cost of energy efficiency projects, and the energy savings are shared between the various stakeholders.
© 2017 KPMG LLP, a Delaware limited liability partnership and the U.S. member firm of the KPMG network of independent member firms affiliated with KPMG International Cooperative (“KPMG International”), a Swiss entity. All rights reserved. The KPMG name and logo are registered trademarks or trademarks of KPMG International. NDPPS 655445
71The KPMG Green Tax Index

a registration surcharge of between SGD 5,000 and SGD 30,000. As taxis generally clock higher mileage than cars, the revised CEVS rebate and surcharge for taxis will be higher by 50 percent to encourage taxi companies to adopt lower carbon emission models for their fleets.
From January 1, 2018 the new Vehicular Emissions Scheme (VES) will include nitrogen oxides, hydrocarbons, particulate matter, and carbon monoxide, in addition to CO2.
Pilot-scale trials with electric vehicles are in progress in some areas. Currently, there are no penalties on the use of conventional fuels in Singapore. However, new applications to set up non-natural-gas fossil fuels will not be approved.
With effect from February 20, 2017, the diesel duty on automotive diesel, industrial diesel, and diesel components in biodiesel is SGD 0.10 per liter.
Green buildingsThe Building and Construction Authority (BCA) Green Mark Scheme was launched in January 2005 as an initiative to drive Singapore’s construction industry towards more environmentally friendly buildings. It is intended to promote sustainability in the building environment and raise environmental awareness among developers, designers, and builders when they start project conceptualization and design, as well as during construction.
To encourage the private sector to develop buildings that attain higher tier Green Mark ratings (i.e., Green Mark Platinum or Green Mark GoldPlus), BCA and the Urban Redevelopment Authority (URA) have introduced a set
of Gross Floor Area (GFA) incentives on April 29, 2009.
The Green Mark Incentive Scheme for Existing Buildings and Premises (GMIS-EBP) aims to encourage building owners and tenants to undertake Energy Improvement Works involving the installation of energy efficient equipment approved by BCA to achieve substantial improvements in energy-efficiency. It provides a cash incentive amounting to up to 50 percent of the qualifying costs incurred solely for the purposes of energy efficiency improvements in existing buildings and premises various stakeholders.
Pollution and ecosystemsIn 2013, the NEA and Inland Revenue Authority of Singapore (IRAS) enacted a year accelerated capital allowance for approved efficient pollution control equipment or devices.
The Land Intensification Allowance (LIA) grants qualifying firms a first-time allowance of 25 percent, then 5 percent annually for qualifying expenditures on the construction of buildings for certain sectors.
Material resources and waste The 3R Fund by the National Environment Agency (NEA) is a co funding scheme to encourage organizations to implement waste minimization and recycling projects. Funding is provided for up to 80 percent of the qualifying costs and subject to a cap of SGD 1 million per project or per applicant, and depends on the quantity and type of waste reduced or recycled.
InnovationThe Productivity and Innovation Credit scheme continues to encourage Singapore companies to invest in innovative-related activities, such
as R&D, investment in automation, training of employees, acquisition of intellectual property rights (IPR), registration of IPR, and investment in design. The incentive currently provides 400 percent tax deduction on the first SGD 1,200,000 of qualifying expenditure for each year of assessment (YA) from 2016 to 2018.
For R&D activities, the qualifying expenditure in excess of SGD 1,200,000 is entitled to 150 percent tax deduction.
In addition, the Design for Efficiency Scheme encourages investors to invest in new facilities in Singapore and to integrate energy and resource efficiency improvements into manufacturing development plans early in the design stage.
Similarly, the Fast-Track Environmental and Water Technologies Incubator Scheme or Fast-Tech scheme is designed for entrepreneurs looking to set up start-ups in the environmental and water technology sector and offers qualified start-ups with up to SGD 300,000 or as much as 85 percent support level of funding assistance over two years, depending on which is lower.
The Green Buildings Innovation Cluster Energy Efficiency R&D (GBIC-R&D) focuses on developing innovative solutions with significant impact in building energy efficiency and with high market adoption potential.
The EDB also provides R&D grants under the Research Incentive Scheme for Companies to encourage multinationals, including renewable energy groups, to set up R&D centers in Singapore.
© 2017 KPMG LLP, a Delaware limited liability partnership and the U.S. member firm of the KPMG network of independent member firms affiliated with KPMG International Cooperative (“KPMG International”), a Swiss entity. All rights reserved. The KPMG name and logo are registered trademarks or trademarks of KPMG International. NDPPS 655445

© 2017 KPMG LLP, a Delaware limited liability partnership and the U.S. member firm of the KPMG network of independent member firms affiliated with KPMG International Cooperative (“KPMG International”), a Swiss entity. All rights reserved. Printed in the U.S.A. The KPMG name and logo are registered trademarks or trademarks of KPMG International. NDPPS 655445
73The KPMG Green Tax Index

South Africa
Indicator Rank* Actual
GDP per capita 33 USD 5,261
CPI yr/yr 2 6.7%
Real GDP growth 34 0.3%
Working age pop (percent of total) 24 65.7%
* = Rank within sample of 37 countries
Indicator Rank* Actual
Development of environment-related technologies (percent domestic technologies)
18 9.71%
Environmental R&D budget (percent total gov. R&D) N/A** N/A**
Development of environment-related technologies (percent inventions worldwide)
23 0.13%
* = Rank within sample of 37 countries
** = Data is not available
Environmental policy indicators
Indicator RankSample*/World** Actual
EPI 32*/81** 70.52
EPS 22 0.78
Environmental tax revenue (percent of total tax revenue) 5 8.22%
Renewable energy consumption 16 16.93%
CO2 emissions (10yr percent change) 23 16.5%
CO2 emissions per capita (metric tons) 12*/30** 8.9
* = Rank within sample of 37 countries
** = World ranking of 180 countries
Research and development indicators
Economic indicators
© 2017 KPMG LLP, a Delaware limited liability partnership and the U.S. member firm of the KPMG network of independent member firms affiliated with KPMG International Cooperative (“KPMG International”), a Swiss entity. All rights reserved. The KPMG name and logo are registered trademarks or trademarks of KPMG International. NDPPS 655445

Carbon and climate changeIn November 2015, a draft Carbon Tax Bill was published, which continues to be proposed, although an update is anticipated and requires approval by Parliament and then by the presidency before it is enacted into law.
The South African Department of Environmental Affairs is in the process of implementing a company-level and sector-level Carbon Budget (cap) program to be applied to a short-list of entities emitting more than 100,000 tons of CO2 annually. The Carbon Budgets program is proposed to be implemented in two phases: an initial test phase from 2016 to 2020 without penalties for exceeding the budget, and a second phase from 2021 to 2025, which may require adjustment of budgets, extension to a larger pool of emitters, and implementation of compliance requirements and penalties.
Renewable energy and fuelsA tax allowance relating to the generation of renewable energy is available, providing a deduction of 50 percent of the cost in the first year, 30 percent in the second year, and 20 percent in the third year.
The Renewable Energy Independent Power Producer Program (REIPPP) requests bids from independent power producers to provide electricity, including electricity from renewable energy, to the national grid. Successful bids commit to local content objectives, small to medium-size enterprise development objectives, socio economic development objectives, and construction and operational employment objectives.
Levies are charged on electric filament lights (i.e., non-energy-saving light bulbs) if used in South Africa. The levy is applied to the manufacturer of the products and is currently charged at ZAR/lamp.
Energy efficiency Industrial tax incentives are available primarily for manufacturing-related projects with a minimum 10 percent energy demand reduction. Savings must be sustained for a period of four years thereafter and only projects of certain sizes qualify. Measurement and verification (M&V) of energy efficiency savings are required to verify that savings are sustained over the period. Projects that have already received incentives or grants under other types of schemes are excluded. There is an additional allowance (in addition to any other tax allowance available) on assets (new and unused), used in a project that qualifies as an Industrial Policy Project (IPP) as defined. The allowance is only available for assets used in the manufacturing sector, and the project must be approved by the Minister of Trade and Industry as an IPP before the project commences.
The Energy Efficiency Savings Tax Allowance gives a deduction for energy efficiency savings by the taxpayer with regard to the year of assessment (95C for each kilowatt hour energy and energy equivalent saved). In addition, the Certified Emission Reduction (CER) Allowance provides an income tax exemption on any amount accrued in respect of the disposal of any certified emission reduction credit derived in the furtherance of a qualifying clean development mechanism. The credit has been extended to December 31, 2020 (in line with the adoption of the second commitment period of the Kyoto Protocol).
Green vehiclesA fuel levy currently exists on petrol, diesel, biodiesel, unmarked aliphatic hydrocarbon solvents, and unmarked illuminating kerosene. This is not specifically an environmental levy on fossil fuels, but a revenue collection mechanism intended
to fund the government’s general expenditure programs.
The South African Department of Trade and Industry (DTI) launched in 2013, but has not yet finalized, an electric vehicle (EV) industry road map to incentivize (in part) local manufacture of EVs.
An ad valorem tax for CO2 emissions above a certain threshold has been charged on all new passenger cars and light commercial vehicles since 2011.
Green buildingsThere continue to be no direct financial incentives/taxes related to building or occupying green buildings. In 2011, national building regulations introduced requirements for energy usage in new buildings and new extensions focused principally on energy-efficient design and the incorporation of water heating.
Requirements for Energy Performance Certificates (EPC) for rented properties and publicly accessible buildings in the public and commercial sectors, as well as a proposal to announce a trajectory for the successive tightening of energy performance components of residential buildings and related standards, were proposed (but not yet adopted) in December 2016.
WaterAllowances for the cost incurred in acquiring a new and unused environmental treatment and recycling asset (40 percent of cost/year one; 20 percent for the subsequent three years) or environmental waste disposal asset are available (5 percent per annum).
© 2017 KPMG LLP, a Delaware limited liability partnership and the U.S. member firm of the KPMG network of independent member firms affiliated with KPMG International Cooperative (“KPMG International”), a Swiss entity. All rights reserved. The KPMG name and logo are registered trademarks or trademarks of KPMG International. NDPPS 655445
75The KPMG Green Tax Index

An environmental levy may be introduced on water to recoup costs for the treatment of acid mine drainage (AMD) water basin issues in the Witwatersrand area of South Africa. However, this has caused public criticism and has not been finalized.
In general, water use and discharge costs are assessed according to tariff structures by water supply and utility entities.
Depending on water uses, the entity may be subject to registration of use or licensing, some of which carry licensing costs.
A revision of the water pricing strategy and a revision to the norms and standards for setting water services tariffs is under consideration and stakeholder participation and comment has been invited. The revised strategy considers various water charges and differentiates types of water users.
Material resources and wasteA plastic bags levy is imposed on certain types of plastic carriers and flat bags in the form of an environmental levy on these bags for payment by manufacturing facilities. There are no direct financial incentives for efficient use of material resources.
There are no direct financial penalties or incentives for waste. Waste management is highly regulated, and a national waste management strategy exists with the aim of driving the “waste hierarchy” (avoid, reduce, reuse, recycle, treat, and dispose), including sector plans (taking the form of Extended Producer Responsibility Plans). Waste management costs are market related and licensing fees may apply.
Pollution and ecosystems Environmental impact (including land use) is highly legislated and regulated. Noncompliance is subject to fines according to the environmental legal framework, rather than any specific taxes or tax penalties.
There are government-run ecosystem preservation and rehabilitation programs (focused on alien vegetation eradication), but no widely applicable incentive mechanism.
Environmental rehabilitation obligations for mining operations have been in effect since 2013, though aspects of the regulations are currently being contested by mining companies.
InnovationThe 150 percent deduction of capital expenditures (applicable to all industries) incurred in eligible R&D activities continues. The following may also qualify for this incentive: green technology, carbon capture and storage, energy efficiency, water-efficient technologies, renewable energy and fuels, green vehicles, material resources, waste recycling, green buildings, and green innovation. The R&D tax incentive is an effective additional 50 percent “super” tax deduction on eligible R&D expenditures incurred in South Africa.
© 2017 KPMG LLP, a Delaware limited liability partnership and the U.S. member firm of the KPMG network of independent member firms affiliated with KPMG International Cooperative (“KPMG International”), a Swiss entity. All rights reserved. The KPMG name and logo are registered trademarks or trademarks of KPMG International. NDPPS 655445

South Korea
Indicator Rank* Actual
GDP per capita 18 USD 27,539
CPI yr/yr 21 1.3%
Real GDP growth 11 2.8%
Working age pop (percent of total) 3 72.9%
* = Rank within sample of 37 countries
Indicator Rank* Actual
Development of environment-related technologies (percent domestic technologies)
19 9.59%
Environmental R&D budget (percent total gov. R&D) 12 2.4%
Development of environment-related technologies (percent inventions worldwide)
4 9.32%
* = Rank within sample of 37 countries
Environmental policy indicators
Indicator RankSample*/World** Actual
EPI 31*/80** 70.61
EPS 13 2.63
Environmental tax revenue (percent of total tax revenue) 2 10.34%
Renewable energy consumption 34 1.60%
CO2 Emissions (10yr percent change) 26 27.1%
CO2 Emissions per capita (metric tons) 6*/20** 11.8
* = Rank within sample of 37 countries
** = World ranking of 180 countries
Research and development indicators
Economic indicators
© 2017 KPMG LLP, a Delaware limited liability partnership and the U.S. member firm of the KPMG network of independent member firms affiliated with KPMG International Cooperative (“KPMG International”), a Swiss entity. All rights reserved. The KPMG name and logo are registered trademarks or trademarks of KPMG International. NDPPS 655445
77The KPMG Green Tax Index

During the initial period (2015–2017), the government distributed emission rights free of charge. During the second period (2018–2020), 3 percent of total emission rights will be distributed through the national auction system with prices charged for the purchase.
Carbon and climate change South Korea has traded carbon since January 2015.
Renewable energy and fuelsThe government has implemented Feed-in Tariffs for New and Renewable Energy (2002–2030) that compensate the difference between the base price of electricity notified by the Ministry of Industry, Trade and Energy and traded power prices in order to encourage investment in the renewable energy sector.
Green vehiclesA subsidy from the central government for a purchase of an electric vehicle is currently available. Municipal governments may also provide such subsidies.
WaterA tax credit may be available for wastewater reuse and recycling.
Municipal governments may support the expense required by anyone who needs to install rainwater utilization facility, gray water, and sewage/wastewater treatment reuse system, and local governments may also reduce the tap water fees or sewage use fees for owners of similar facilities.
Material resources and wasteSouth Korean companies that do not meet recycling responsibilities may pay a fee under the Extended Producer Responsibility Policy.
South Korea is planning to implement several measures regarding the resource circulation of electrical and electronic equipment and vehicles in 2018, including a policy to help companies that produce a large amount of waste regularly to set plans for resource circulation and monitor and manage the process. Incentives will be provided to companies that succeed. Also proposed for 2018 is a waste disposal fee policy that will charge anyone who adds waste to incineration or landfill. Details of the incentives are not open to the public yet.
InnovationTax deductions are available for R&D of green technology in South Korea.
For example, the following incentives are available:
1. A general research and personnel development tax credit (40 percent for large companies and 50 percent to small and medium-sized entities (SMEs))
2. A deduction for research test facilities, vocational facilities, and new technology commercialization investments (3 percent for large companies, 5 percent for medium-sized firms, and 10 percent for SMEs)
3. A 7 percent deduction (from income tax) for acquired patent rights
4. A 25 percent reduction on income tax or corporation tax on profits generated when SMEs rent patent rights
5. A tax reduction (100 percent for the first three years and then 50 percent for two years) on profits generated by any high-tech enterprise or research institute in the research development zone.
© 2017 KPMG LLP, a Delaware limited liability partnership and the U.S. member firm of the KPMG network of independent member firms affiliated with KPMG International Cooperative (“KPMG International”), a Swiss entity. All rights reserved. The KPMG name and logo are registered trademarks or trademarks of KPMG International. NDPPS 655445

Spain
Indicator Rank* Actual
GDP per capita 19 USD 26,609
CPI yr/yr
Real GDP growth
18 1.6%
9 3.2%
Working age pop (percent of total) 19 66.3%
* = Rank within sample of 37 countries
Indicator Rank* Actual
Development of environment-related technologies (percent domestic technologies)
3 13.28%
Environmental R&D budget (percent total gov. R&D) 8 3.5%
Development of environment-related technologies (percent inventions worldwide)
14 0.72%
* = Rank within sample of 37 countries
Environmental policy indicators
Indicator RankSample*/World** Actual
EPI 4*/6** 88.91
EPS 17 2.22
Environmental tax revenue (percent of total tax revenue) 16 5.59%
Renewable energy consumption 17 15.75%
CO2 Emissions (10yr percent change) 5 -26.2%
CO2 Emissions per capita (metric tons) 23*/68** 5.1
* = Rank within sample of 37 countries
** = World ranking of 180 countries
Research and development indicators
Economic indicators
© 2017 KPMG LLP, a Delaware limited liability partnership and the U.S. member firm of the KPMG network of independent member firms affiliated with KPMG International Cooperative (“KPMG International”), a Swiss entity. All rights reserved. The KPMG name and logo are registered trademarks or trademarks of KPMG International. NDPPS 655445
79The KPMG Green Tax Index

Carbon and climate changeSpain, a member of the EU, participates in the EU Emissions Trading Scheme, which is the cornerstone policy to combat climate change and key tool for reducing industrial greenhouse gas emissions cost-effectively. The EU also adopted a carbon capture and storage directive that Spain transposed into its legal system.
Renewable energy and fuelsSpain’s national renewable energy action plan 2011–2020 contains measures to promote the use of energy from renewable resources, and specifically regulates the new remuneration system for facilities producing electricity from renewable energy sources, cogeneration, and waste. Power plants producing electricity from renewable energy sources, cogeneration, and waste may also receive a specific remuneration, in addition to the electricity market price.
Green vehiclesTaxes for vehicles using mechanical traction are imposed by and paid to the local government. The tax rate is based on several factors including horsepower (cars), number of seats (buses), load (trucks), and cubic centimeters (motorcycles). In addition, local governments can approve reductions related to environment, such as vehicles with electric engines, natural, or petrol gas. A one-time registration tax is paid based on engine size. The rate depends on CO2 emissions.
The Spanish government, in common with many other countries, offers preferential registration tax rates on lower emission vehicles (vehicle registration tax). Local governments can also set lower rates regarding the mechanical traction tax depending on the fuel consumed by the vehicles and the impact of the fuel combustion on the environment.
Green buildingsGreen building incentives are regulated by the Spanish government and also regionally. Grants and loans are available for new building and building restoration to energy efficiency measures. New building codes in Spain are mandating solar hot water for new and remodeled private residences, and photovoltaics to offset some power requirements for all new and remodeled commercial buildings. The new laws also reflect increased awareness of the importance of better building insulation and the use of daylighting.
WaterNational legislation requires that taxes are paid related to use and quality of water discharge. The level of taxes is set by municipal authorities and is mainly related to scarcity and necessity of water management. The consumption of water is taxed according to the volume of consumption and also the volume and quality of water discharge. At the regional or subnational level, water is taxed to encourage its efficient use and to stimulate the reduction of the highest consumption. Tax revenue is used to finance the entire water cycle from catchment to distribution, including water recycling. Also, at the regional or subnational level, various regulations incentivize the recycling of water. For example, in some regions, all golf courses are irrigated with recycled water. At the regional/local level, incentives are used to reduce consumption and the amount of tax.
Material resources and waste There are no taxes associated with waste production. However, there are obligations with regard to reuse/recycling that are connected to the price of landfill use. Packaging is regulated according to the European packaging waste system, though there are no specific incentives or penalties related to efficiency.
FoodThere are no national specific tax/credits related to food waste. However, some municipalities have adopted taxes regarding domestic waste.
Pollution and ecosystemsThe Spanish government and the local governments impose tax and tax penalties related to pollution in all environmental sectors. Where certain polluting discharges and emissions are permitted, there is a cost for companies. In addition, there are deductible incentives available through nongovernmental organizations to collaborate in the restoration of habitats and polluted areas.
InnovationSpanish legislation sets out a number of incentives for R&D activities, including technological innovation (TI), such as environmental and efficiency measures. The R&D tax incentives applicable to Spanish companies or permanent establishments include (i) Spanish R&D and TI tax credits (RDTC), (ii) Reduction of social security contribution for R&D dedicated staff, (iii) Spanish “patent box” regime, and (iv) free depreciation for R&D activities. These incentives are also open to R&D projects that focus on environmental technologies and benefits (for development of new products or new processes, but not for pure investments).
The corporate income tax sets forth generally free depreciation for assets used in R&D (except real estate). This incentive is applied in the tax base (the investment made in the tax period is considered as an expense for tax purposes and the accounting depreciation of the following year is recaptured for tax purposes, as a positive adjustment).
© 2017 KPMG LLP, a Delaware limited liability partnership and the U.S. member firm of the KPMG network of independent member firms affiliated with KPMG International Cooperative (“KPMG International”), a Swiss entity. All rights reserved. The KPMG name and logo are registered trademarks or trademarks of KPMG International. NDPPS 655445
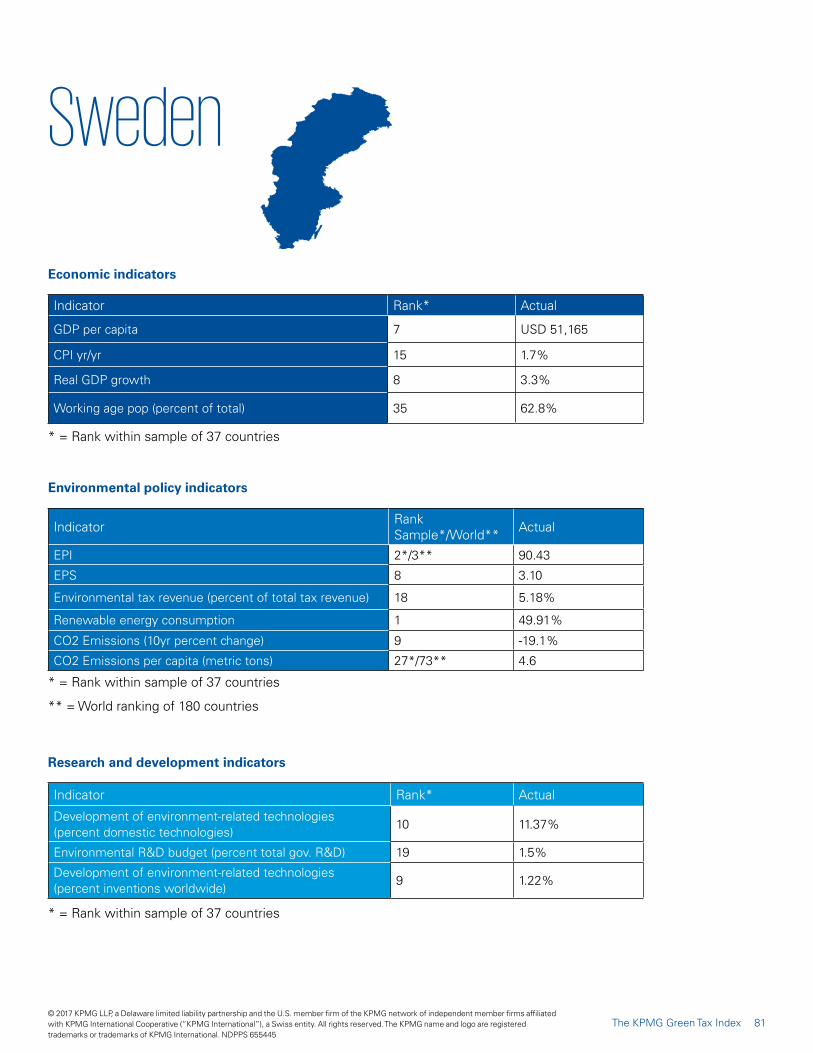
Sweden
Indicator Rank* Actual
GDP per capita 7 USD 51,165
CPI yr/yr 15 1.7%
Real GDP growth 8 3.3%
Working age pop (percent of total) 35 62.8%
* = Rank within sample of 37 countries
Indicator Rank* Actual
Development of environment-related technologies (percent domestic technologies)
10 11.37%
Environmental R&D budget (percent total gov. R&D) 19 1.5%
Development of environment-related technologies (percent inventions worldwide)
9 1.22%
* = Rank within sample of 37 countries
Environmental policy indicators
Indicator RankSample*/World** Actual
EPI 2*/3** 90.43
EPS 8 3.10
Environmental tax revenue (percent of total tax revenue) 18 5.18%
Renewable energy consumption 1 49.91%
CO2 Emissions (10yr percent change) 9 -19.1%
CO2 Emissions per capita (metric tons) 27*/73** 4.6
* = Rank within sample of 37 countries
** = World ranking of 180 countries
Research and development indicators
Economic indicators
© 2017 KPMG LLP, a Delaware limited liability partnership and the U.S. member firm of the KPMG network of independent member firms affiliated with KPMG International Cooperative (“KPMG International”), a Swiss entity. All rights reserved. The KPMG name and logo are registered trademarks or trademarks of KPMG International. NDPPS 655445
81The KPMG Green Tax Index
Carbon and climate changeAs part of the EU, Sweden is covered by the EU Emission Trading Scheme (EU-ETS). The country also taxes fossil fuels based on carbon content. Fuels subject to this energy tax are gasoline, diesel oil, heating oil, LPG, and natural gas.
Renewable energy and fuelsAs described above, many fuels used for transportation and heating are associated with an energy tax.
However, some renewable fuels are completely exempt, or have a reduced tax rate. Fuels used for a number of industrial purposes, such as production of electricity or operation of mining vehicles, have a reduced tax rate. There is also an energy tax levied on the use of electricity, which differs slightly between regions in Sweden and for what purpose the electricity is used.
In order to encourage production and use of renewable fuels, Sweden provides a number of tax incentives. These include an investment subsidy for PV panels of up to 30 percent of the investment cost for companies, and 20 percent for other parties.
Small producers of electricity from wind or solar (<30,000 kWh/year) meeting certain criteria are entitled to a tax deduction for electricity sold back to the grid. The highest amount deductible is 30,000 * 0.6 = 18,000 SEK/year.
Withdrawal of electricity from the grid must exceed the amount sold to the grid (if a producer buys 20,000 kWh and sells 25,000 kWh, only 20,000 kWh is eligible for deduction), and the electrical fuse for the grid connection can be 100 ampere at most.
In addition, noncommercial producers of electricity from wind (i.e., those
using the electricity solely for their own operations) are exempt from paying energy taxes on the produced electricity. This exemption also applies to smaller producers (<50 kW generation).
Though not enforced by a revenue agency, Sweden has implemented an electricity certificate system that provides electricity producers with one certificate per MWh of electricity produced from renewable sources or peat. The certificates are traded on an open market with the price being determined by supply and demand. The purpose of this system is to provide an incentive for electricity producers to produce renewable electricity, as they will receive additional income from selling the certificates. This system is enforced by the Swedish Energy Agency.
Green vehiclesSweden imposes both tax penalties and incentives with respect to green vehicles. As an example of a penalty, the country imposes a vehicle tax, calculated based partially on the vehicle’s CO2 emissions. If the car vehicle is a 2006 model or later, the tax is calculated based on CO2 emissions. Older car models are taxed based on vehicle weight. Light trucks, light buses, and RVs generally follow the same rule, though vehicle models from 2011 or later are taxed based on CO2 emissions, while older vehicles are taxed based on weight.
Vehicles with emissions that fall below certain thresholds (meeting emission standards Euro 5/6 or being plug-in hybrids or electric hybrids) are exempt from paying vehicle tax for five years from the date the vehicle is taken into service. In addition, cars fulfilling the emission requirements of Euro 5 or Euro 6 and CO2 emissions below 50 g/km are eligible for a
premium (40,000 SEK for an electric vehicle and 20,000 SEK for a plug-in hybrid). The premium is administered by the Transport Agency, and is paid at purchase.
Green vehicles are incentivized with a reduced taxable value of fringe benefits as they are generally more expensive than other cars.
Many municipalities also incentivize the purchase of green vehicles. For example, green vehicles may be exempt from parking fees. Note, however, that the definition of a green vehicle will vary among municipalities.
WaterSweden does not have any national tax incentives specific to water. However, there are various government agencies and local governments that provide grants related to water efficiency.
Material resources and wasteThe extraction of gravel from natural sites in Sweden is taxed at a rate of 15 SEK/ton. In addition, waste sent to a landfill is taxed at 500 SEK/ton. Other agencies, such as the Geological Survey of Sweden, impose fees related to the extraction of minerals in mines.
Pollution and ecosystemsSweden penalizes numerous polluting activities. For example, under its sulfur tax, solid and gaseous fuels containing sulfur are taxed with 30 SEK/kg sulfur in the fuel. Liquid fuels are taxed with 27 SEK/m3 per tenth weight percent of sulfur content. Liquid and gaseous fuels with a sulfur content <0.05 weight percent are exempt from this tax. In addition, Sweden imposes a fee on NOx emissions for power generation facilities using incinerators with an annual power production of 25 GWh or more.
© 2017 KPMG LLP, a Delaware limited liability partnership and the U.S. member firm of the KPMG network of independent member firms affiliated with KPMG International Cooperative (“KPMG International”), a Swiss entity. All rights reserved. The KPMG name and logo are registered trademarks or trademarks of KPMG International. NDPPS 655445
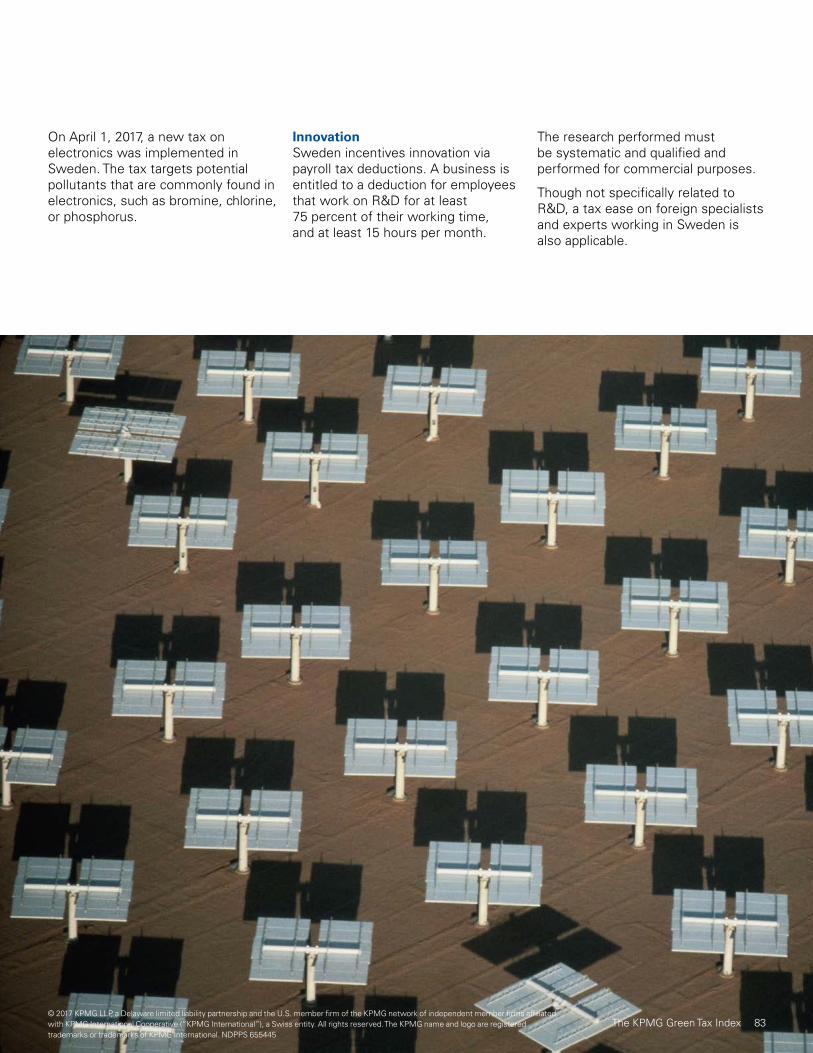
On April 1, 2017, a new tax on electronics was implemented in Sweden. The tax targets potential pollutants that are commonly found in electronics, such as bromine, chlorine, or phosphorus.
InnovationSweden incentives innovation via payroll tax deductions. A business is entitled to a deduction for employees that work on R&D for at least 75 percent of their working time, and at least 15 hours per month.
The research performed must be systematic and qualified and performed for commercial purposes.
Though not specifically related to R&D, a tax ease on foreign specialists and experts working in Sweden is also applicable.
© 2017 KPMG LLP, a Delaware limited liability partnership and the U.S. member firm of the KPMG network of independent member firms affiliated with KPMG International Cooperative (“KPMG International”), a Swiss entity. All rights reserved. The KPMG name and logo are registered trademarks or trademarks of KPMG International. NDPPS 655445
83The KPMG Green Tax Index

Switzerland
Indicator Rank* Actual
GDP per capita 1 USD 79,242
CPI yr/yr 34 0.0%
Real GDP growth 29 1.3%
Working age pop (percent of total) 15 67.2%
* = Rank within sample of 37 countries
Indicator Rank* Actual
Development of environment-related technologies (percent domestic technologies)
32 7.39%
Environmental R&D budget (percent total gov. R&D) 24 0.2%
Development of environment-related technologies (percent inventions worldwide)
13 0.83%
* = Rank within sample of 37 countries
Environmental policy indicators
Indicator RankSample*/World** Actual
EPI 11*/16** 86.93
EPS 5 3.29
Environmental tax revenue (percent of total tax revenue) 12 6.57%
Renewable energy consumption 13 22.68%
CO2 Emissions (10yr percent change) 20 0.4%
CO2 Emissions per capita (metric tons) 25*/70** 5.0
* = Rank within sample of 37 countries
** = World ranking of 180 countries
Research and development indicators
Economic indicators
© 2017 KPMG LLP, a Delaware limited liability partnership and the U.S. member firm of the KPMG network of independent member firms affiliated with KPMG International Cooperative (“KPMG International”), a Swiss entity. All rights reserved. The KPMG name and logo are registered trademarks or trademarks of KPMG International. NDPPS 655445

Carbon and climate change Switzerland has had a carbon tax (CO2 levy) in place since 2008 that covers fossil combustible fuels (such as heating oil and natural gas).
The Swiss emissions trading scheme is built according to the “cap-and-trade” principle, and the quantity of emission allowances available is limited. The cap has been reduced each year by 1.74 percent of the initial 2010 quantity. Large, greenhouse gas intensive companies are required to participate in emissions trading, while medium-sized companies may voluntarily participate in the scheme.
Though Switzerland is not part of the European Union (EU), which operates its own emissions trading schemes, it is in the process of trying to link both systems and create a joint CO2 market. (Technical negotiations have concluded, and the treaty must be signed and ratified by both sides to be effective.)
Renewable energy and fuels The main goals of Switzerland’s energy strategy are to (i) phase out nuclear energy, (ii) reduce electricity consumption, (iii) increase renewables, and (iv) reduce GHG emissions.
Switzerland is considering a move from a subvention-based system to a more levy-based incentive system and is also planning to introduce a levy on electricity and transportation fuels in the 2020s.
Switzerland has a feed-in tariff, developed by the federal government for the purpose of promoting electricity production from renewable energy sources. It covers the
difference between the production cost and the market price, and guarantees producers of electricity from renewable sources a price that corresponds to their production costs.
Switzerland’s petroleum tax is an excise tax encompassing crude oil, other mineral oils, natural gas, their processed products, and engine fuels, and includes a surtax on engine fuels. The petroleum tax varies significantly depending on the product and the use of the product (engine fuel, heating fuel, technical purposes).
Green vehiclesSince July 2012, CO2 emission regulations for new passenger cars in Switzerland are similar to those of the EU: emissions of new car fleets may not exceed a maximum of 130 grams of CO2 per kilometer on average by the end of 2015. Swiss car importers are subject to this requirement and pay fines if they do not meet their individual CO2 targets.
Personal cars are taxed, depending on the power of engines and weight of the car. A distance-related heavy vehicle fee (HVF) has been levied in Switzerland since 2001, replacing the previous flat-rate heavy vehicle fee. The switch to a distance-related fee system was aimed at limiting the increase in heavy vehicles on the road, encouraging the shipment of freight by rail (road-to-rail policy), and relieving the strain on the environment.
Green buildingsSwitzerland’s “Building Program” incentivizes the renovation of houses with a goal of increasing insulation around windows, walls, roofs, and floors.
WaterWater as a source of energy (hydropower) is taxed depending on the power of the station. Only hydropower stations with a gross output bigger than 1000 kW are affected by the tax.
Pollution and ecosystemsSince 1997, VOCs (e.g., benzene, butanes, ethers, oil) have been taxed in Switzerland. The tax is levied on importers, manufacturers, and wholesalers and on Swiss producers of VOCs. There is an exemption for VOCs that are exported, products whose VOC content does not exceed 3 percent, and for VOCs in products not included in the positive list.
InnovationSwitzerland has incentives to develop equipment and processes that reduce the environmental pollution/burden of the Swiss society and improve the general conditions for applying ecological innovations (in particular, an increase of the competitiveness of the Swiss Environmental sector and improve the eco-efficiency of the Swiss economy). Beneficiaries can be universities, companies, NGOs (nonprofits), associations, or communities. Requirements are that 50 percent of the project costs must be covered by the beneficiary and that some of the incentives need to be paid back in case of commercial success.
© 2017 KPMG LLP, a Delaware limited liability partnership and the U.S. member firm of the KPMG network of independent member firms affiliated with KPMG International Cooperative (“KPMG International”), a Swiss entity. All rights reserved. The KPMG name and logo are registered trademarks or trademarks of KPMG International. NDPPS 655445
85The KPMG Green Tax Index

Taiwan
Indicator Rank* Actual
GDP per capita 20 USD 22,453
CPI yr/yr 17 1.7%
Real GDP growth 25 1.4%
Working age pop (percent of total) - -
* = Rank within sample of 37 countries
Indicator Rank* Actual
Development of environment-related technologies (percent domestic technologies)
N/A** N/A**
Environmental R&D budget (percent total gov. R&D) N/A** N/A**
Development of environment-related technologies (percent inventions worldwide)
N/A** N/A**
* = Rank within sample of 37 countries
** = Data is not available
Environmental policy indicators
Indicator RankSample*/World** Actual
EPI 28*/60** 74.88
EPS - -
Environmental tax revenue (percent of total tax revenue) - -
Renewable energy consumption - -
CO2 Emissions (10yr percent change) - -
CO2 Emissions per capita (metric tons) - -
* = Rank within sample of 37 countries
** = World ranking of 180 countries
Research and development indicators
Economic indicators
© 2017 KPMG LLP, a Delaware limited liability partnership and the U.S. member firm of the KPMG network of independent member firms affiliated with KPMG International Cooperative (“KPMG International”), a Swiss entity. All rights reserved. The KPMG name and logo are registered trademarks or trademarks of KPMG International. NDPPS 655445

Carbon and climate changeTaiwan enacted a “Greenhouse Gas Reduction and Management Act” in 2015, which includes carbon disclosure/verification stages and a cap and trade scheme. The cap and trade scheme is still under planning while the compulsory carbon disclosure and regular verification have been initiated. Taiwan launched a greenhouse gas offset project as a trial-run measurement for the cap and trade program. In addition to the countrywide cap and trade scheme, Taichung City has implemented a regional cap and trade program requiring certain public or private sites/areas to set the reduction targets as self GHG-emission management. Taiwan imposes penalties for emission sources that exceed the regulated target or provide incorrect emission inventory information.
Green vehiclesAutomobile users are charged fees based on engine displacement calculation and air pollution control. Vehicles failing to comply with the standards of permissible energy consumption are not imported or sold in the domestic market. In-use motor vehicles undergo regular air pollutant emissions testing and owners of motor vehicles failing to comply with the emissions standards are fined. Owners of motor vehicles that have not undergone regular testing or fail to comply may be prohibited from renewing their vehicle license.
To encourage industry to develop green vehicles, the Taiwanese government launched a pilot project for intelligent electric vehicles and subsidizes the electric scooter industry and the establishment of power stations.
WaterWater tax in Taiwan is collected in conservation and hot springs areas. A water right, which requires a fee, is needed for general water consumption.
The taking or obstruction of the use, or discharge of water without permission, is subject to fines and possible imprisonment. Interference with water conservation or circulation, or pollution of water in a water quality and quantity protection area, also subjects the violator to fines/imprisonment.
The government sets the water conservation label standard for water-savings products to identify water use efficiency levels and encourages the public and private sectors to purchase water-saving equipment through several subsidies. In the public sector, water-saving equipment is on the priority list of procurement. In the private sector, there are subsidies and incentives for applying water conservation technology and for water recycling facilities.
Low interest loans are available for the purchase of pollution control equipment in the private sector. Imports of pollution protection
equipment are exempt from customs duties.
The reuse, recycling, or treatment of wastewater is also promoted under countrywide award activities.
Material resources and waste Material resources usage, such as mining rights and fishery access, and consumption of resources such as sand and gravel, are subject to fees. A packaging tax is collected as recycling, clearance, and disposal fees. Only specific packaging that produces general waste and possesses certain characteristics causing serious pollution to the environment are subject to the fees.
Commercial waste is classified as general and industrial and is subject to a disposal fee. There is an additional fee for industrial waste. Violation of waste disposal regulations subjects the violator to imprisonment or fine. Incentives for waste recycling and reuse include prioritizing recycle products on the procurement list in the public sector, a subsidy for recycling waste and waste recycling organizations, and a subsidy for waste recycling related research.
Renewable energy and fuelsTaiwan has launched several programs/incentives to encourage the purchase of energy-efficient equipment, granting subsidies in both the public and private sector for using or purchasing energy-efficient equipment, such as washing machines and air conditioners. In addition, there are many other subsidies available, including ones for the implementation of waste heat recovery facility, loans for purchase of energy-saving equipment, and for municipalities to replace mercury lights with LED. There is priority bidding for energy-efficient equipment and energy-saving products in government procurement. Subsidies are also available to develop renewable energy facilities, power generated from renewable power facilities, and renewable energies including solar, wind, marsh gas, and geothermal.
© 2017 KPMG LLP, a Delaware limited liability partnership and the U.S. member firm of the KPMG network of independent member firms affiliated with KPMG International Cooperative (“KPMG International”), a Swiss entity. All rights reserved. The KPMG name and logo are registered trademarks or trademarks of KPMG International. NDPPS 655445
87The KPMG Green Tax Index
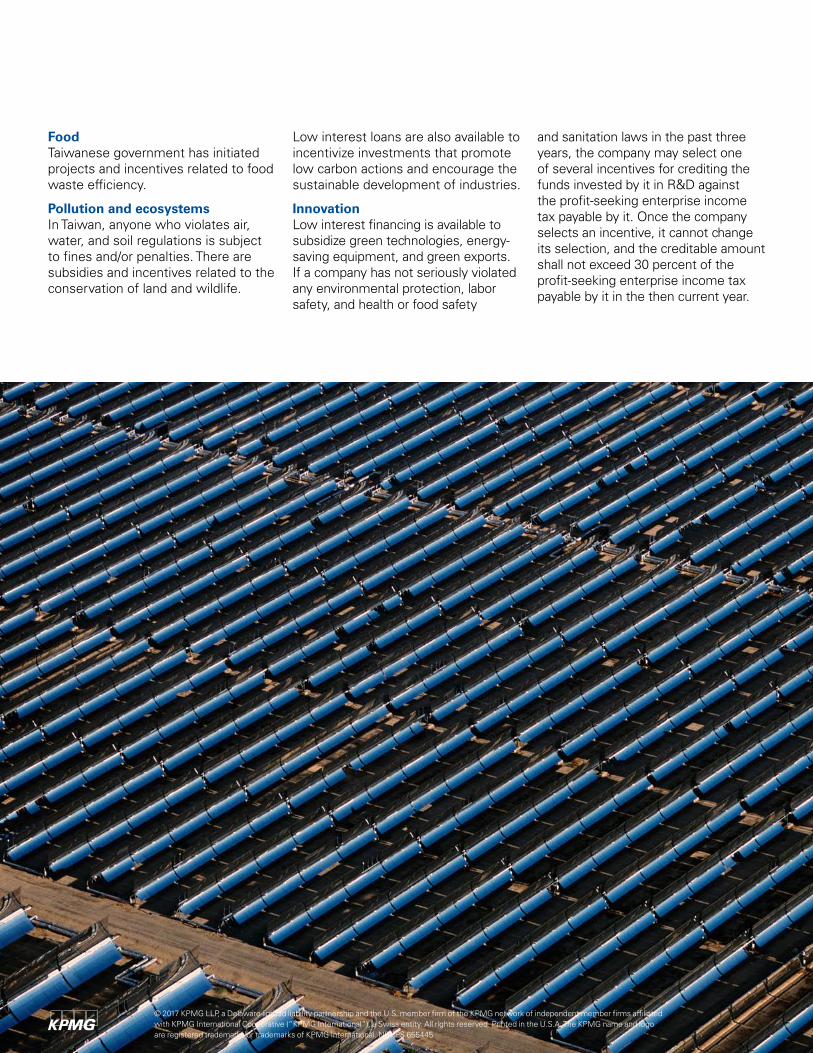
FoodTaiwanese government has initiated projects and incentives related to food waste efficiency.
Pollution and ecosystemsIn Taiwan, anyone who violates air, water, and soil regulations is subject to fines and/or penalties. There are subsidies and incentives related to the conservation of land and wildlife.
Low interest loans are also available to incentivize investments that promote low carbon actions and encourage the sustainable development of industries.
InnovationLow interest financing is available to subsidize green technologies, energy-saving equipment, and green exports. If a company has not seriously violated any environmental protection, labor safety, and health or food safety
and sanitation laws in the past three years, the company may select one of several incentives for crediting the funds invested by it in R&D against the profit-seeking enterprise income tax payable by it. Once the company selects an incentive, it cannot change its selection, and the creditable amount shall not exceed 30 percent of the profit-seeking enterprise income tax payable by it in the then current year.
© 2017 KPMG LLP, a Delaware limited liability partnership and the U.S. member firm of the KPMG network of independent member firms affiliated with KPMG International Cooperative (“KPMG International”), a Swiss entity. All rights reserved. Printed in the U.S.A. The KPMG name and logo are registered trademarks or trademarks of KPMG International. NDPPS 655445

Thailand
Indicator Rank* Actual
GDP per capita 31 USD 5,899
CPI yr/yr 24 1.1%
Real GDP growth 9 3.2%
Working age pop (percent of total) 5 71.8%
* = Rank within sample of 37 countries
Indicator Rank* Actual
Development of environment-related technologies (percent domestic technologies)
30 8.00%
Environmental R&D budget (percent total gov. R&D) - -
Development of environment-related technologies (percent inventions worldwide)
31 0.03%
* = Rank within sample of 37 countries
Environmental policy indicators
Indicator RankSample*/World** Actual
EPI 33*/91** 69.54
EPS - -
Environmental tax revenue (percent of total tax revenue) - -
Renewable energy consumption 12 23.02%
CO2 Emissions (10yr percent change) 26 35.0%
CO2 Emissions per capita (metric tons) 28*/74** 4.5
* = Rank within sample of 37 countries
** = World ranking of 180 countries
Research and development indicators
Economic indicators
© 2017 KPMG LLP, a Delaware limited liability partnership and the U.S. member firm of the KPMG network of independent member firms affiliated with KPMG International Cooperative (“KPMG International”), a Swiss entity. All rights reserved. The KPMG name and logo are registered trademarks or trademarks of KPMG International. NDPPS 655445
89The KPMG Green Tax Index

Carbon and climate change There are no taxes on carbon emissions; however, as of January 2016, an excise tax is imposed on cars based on their carbon emission rate. Thailand established the Thailand Greenhouse Gas Management Organization (TGO) in 2007 as an implementing agency on greenhouse gas (GHG) emission reductions and is currently considering whether the operation of carbon trading is appropriate.
Renewable energy and fuels The Thai Board of Investment (BOI) grants tax and nontax incentives to existing projects that invest in upgrading machinery to reduce energy consumption. Tax benefits include a three-year corporate income tax (CIT) exemption on the revenue from an existing project (capped at 50 percent of the investment) and exemption of import duty on machinery.
Green vehiclesThe BOI also offers several tax and nontax incentives for certain activities relating to both renewable energy and green vehicles.
The Enhancement and Conservation of National Environment Quality Act (Environment Act) limits air pollution emissions from cars and motorcycles (applying to both personal and commercial vehicles) and subjects violators to fines and/or imprisonment.
Green buildingsThailand does not offer incentives for green buildings, but the Energy Conservation Promotion Act (ECP Act) sets out duties and responsibilities (e.g., construction or modification criteria) for certain types of
buildings having an aggregate area of 2,000 square meters or more, including hospitals, schools, offices, condominiums, convention centers, theaters, hotels, entertainment places, and department stores. In addition, certain types of buildings have additional obligations where failure to comply can lead to special electricity fees and criminal fines.
WaterThere are no national penalties or taxes imposed on the use of water; however, the Environment Act imposes a duty on owners of certain sources of pollution to install facilities to deal with wastewater treatment or waste disposal. In addition, local authorities can designate localities as pollution control areas if affected by pollution problems that may cause public health hazards. In those cases, authorities can take measures to control, reduce, and eliminate pollution and also set special standards for emissions in the designated locality.
Material resources and wasteThailand imposes a petroleum income tax on petroleum concessionaire companies that generate income from petroleum operations at the rate of 50 percent of their annual net profit.
There are no taxes or penalties on commercial waste; however, local authorities charge waste collection fees. The BOI recently announced the granting of incentives to businesses involved in waste treatment or waste disposal.
FoodThe BOI offers tax and nontax incentives to the agricultural industry where modern technologies are used.
These incentives apply to activities, such as the manufacture of biological fertilizers; organic fertilizers; plant or animal breeding; deep sea fishery; grading, packaging, and storage of plants, vegetables, fruits, or flowers; manufacture of oil or fat from plants or animals; and manufacture or preservation of food, beverages, food additives, or ingredients using modern technology.
Pollution and ecosystemsThailand has no taxes or tax penalties relating to air, water, and ground pollution. However, the Environment Act prescribes emission standards for the control of wastewater discharge, polluted air emissions, and the discharge of other wastes. Violators may be subject to civil and criminal liabilities.
InnovationCompanies can apply for general incentives from two government authorities in relation to R&D activities. The Revenue Department offers tax incentives/deductions for expenses paid to a governmental agency or private operator to conduct R&D (effective from January 1, 2015 to December 31, 2019). The BOI offers incentives for various R&D activities, including basic research, applied research or pilot development, biotechnology, health, agriculture, food, and the environment. Certain activities, such as the manufacture or production of renewable energy and/or fuels or the recycling/reusing of unwanted materials, may also qualify for incentives. The Revenue Department R&D incentives cannot be enjoyed together with the R&D incentives provided by the BOI.
© 2017 KPMG LLP, a Delaware limited liability partnership and the U.S. member firm of the KPMG network of independent member firms affiliated with KPMG International Cooperative (“KPMG International”), a Swiss entity. All rights reserved. The KPMG name and logo are registered trademarks or trademarks of KPMG International. NDPPS 655445

Ukraine
Indicator Rank* Actual
GDP per capita 35 USD 2,194
CPI yr/yr 1 12.4%
Real GDP growth 16 2.3%
Working age pop (percent of total) 8 69.8%
* = Rank within sample of 37 countries
Indicator Rank* Actual
Development of environment-related technologies (percent domestic technologies)
31 7.45%
Environmental R&D budget (percent total gov. R&D) - -
Development of environment-related technologies (percent inventions worldwide)
29 0.03%
* = Rank within sample of 37 countries
Environmental policy indicators
Indicator RankSample*/World** Actual
EPI 24*/44** 79.69
EPS - -
Environmental tax revenue (percent of total tax revenue) - -
Renewable energy consumption 33 2.83%
CO2 Emissions (10yr percent change) 33 58.3%
CO2 Emissions per capita (metric tons) 1*/58** 18.7
* = Rank within sample of 37 countries
** = World ranking of 180 countries
Research and development indicators
Economic indicators
© 2017 KPMG LLP, a Delaware limited liability partnership and the U.S. member firm of the KPMG network of independent member firms affiliated with KPMG International Cooperative (“KPMG International”), a Swiss entity. All rights reserved. The KPMG name and logo are registered trademarks or trademarks of KPMG International. NDPPS 655445
91The KPMG Green Tax Index

Carbon and climate changeCarbon emissions and other pollutions of the environment are taxed as a part of ecological tax (eco tax) that is imposed on CO2 and other emissions and pollutions of the environment by legal entities, production facilities, aggregates, and other real estate objects. Local tax authorities administer the eco tax.
Renewable energy and fuels Ukraine exempts the import of energy-efficient equipment, materials and components, and green vehicles (as specified by the decisions of the government of Ukraine) (energy equipment) from import VAT and import duty if similar energy equipment is not produced in Ukraine and the energy equipment is used for the taxpayer’s own production purposes. The sale of fuel is subject to an excise tax.
Alternative fuelsTemporarily, until January 1, 2019, the following business operations are exempt from VAT:
a. Supply within Ukraine of machinery, equipment, and technical devices set out in Article 7 of the Law of Ukraine ”On alternative fuels”
b. Imports under codes of UKT ZED set out in Article 7 of the Law of Ukraine ”On alternative fuel” of machinery, equipment, and technical devices used for reconstruction of existing and construction of new enterprises for the production of biofuels and for
the production and reconstruction of equipment and machinery for the purpose of biofuel, if such goods are not produced and have no analogues in Ukraine, as well as machinery and vehicles, including self-propelled agricultural machines that run on biofuel if such goods are not produced in Ukraine. The government of Ukraine adopts the procedure for the mentioned import of machinery, equipment, technical devices, and vehicles.
Green vehiclesImport of green vehicles (electric cars) is not subject to import duty and individuals may credit costs for reequipment of their conventional vehicles to green vehicles against their personal income tax.
WaterA rent payment is charged, the rate of which varies depending on the river basin, region, and the type of business activity.
Material resources and waste Import, export, and supply within Ukraine of waste and scrap of ferrous and nonferrous metals, as well as paper and cardboard of the Ukrainian code of goods classification (UKT ZED) 4707 for utilization, is VAT exempt until January 1, 2019.
National climate policy frameworkThe Law of Ukraine “On Basics (strategy) of the State Environmental Policy of Ukraine until 2020” (adopted on December 21, 2010):
— Optimizing the energy sector of the national economy by increasing the use of energy sources with low carbon dioxide emissions by 2015 for 10 percent and by 2020 for 20 percent
— Developing the basic policy framework for adaptation to climate change by 2015, development and phased implementation of a national action plan to mitigate climate change for the period to 2030
— Raising of energy efficiency by 25 percent up to 2015 and by 50 percent up to 2020 relative to the base year by implementing energy and resource conservation in energy-consuming sectors
— Increasing the use of renewable and alternative energy sources.
© 2017 KPMG LLP, a Delaware limited liability partnership and the U.S. member firm of the KPMG network of independent member firms affiliated with KPMG International Cooperative (“KPMG International”), a Swiss entity. All rights reserved. The KPMG name and logo are registered trademarks or trademarks of KPMG International. NDPPS 655445

United Arab Emirates
Indicator Rank* Actual
GDP per capita 16 USD 37,678
CPI yr/yr 14 1.8%
Real GDP growth 13 2.7%
Working age pop (percent of total) 1 84.9%
* = Rank within sample of 37 countries
Indicator Rank* Actual
Development of environment-related technologies (percent domestic technologies)
6 12.67%
Environmental R&D budget (percent total gov. R&D) N/A** N/A**
Development of environment-related technologies (percent inventions worldwide)
31 0.03%
* = Rank within sample of 37 countries
** = Data is not available
Environmental policy indicators
Indicator RankSample*/World** Actual
EPI 34*/92** 69.35
EPS - -
Environmental tax revenue (percent of total tax revenue) - -
Renewable energy consumption 36 0.13%
CO2 Emissions (10yr percent change) 11 -15.3%
CO2 Emissions per capita (metric tons) 18*/6** 7.1
* = Rank within sample of 37 countries
** = World ranking of 180 countries
Research and development indicators
Economic indicators
© 2017 KPMG LLP, a Delaware limited liability partnership and the U.S. member firm of the KPMG network of independent member firms affiliated with KPMG International Cooperative (“KPMG International”), a Swiss entity. All rights reserved. The KPMG name and logo are registered trademarks or trademarks of KPMG International. NDPPS 655445
93The KPMG Green Tax Index

Carbon and climate changeThe United Arab Emirates does not currently participate in a cap and trade program, nor does it have a carbon tax. However, it recently created an Energy & Climate Change Directorate (ECC) within the Ministry of Foreign Affairs (MoFA) as the best solution to build the required capacity for managing UAE’s climate change and renewable energy agenda.
Renewable energy and fuels The nationwide “I LED the way” campaign was launched on May 22, 2016 by the Emirates Authority for Standardisation and Metrology (ESMA), Dubai Electricity and Water Authority (Dewa), and Abu Dhabi Commercial Bank (ADCB).
The 12-month eco-program will use awareness campaigns, community engagement, and green initiatives to achieve its objectives, according to a statement by its organizers.
During the Efficient Lighting Campaign, all high-efficiency LED lighting products, as certified by ESMA, will be discounted by 25 percent for a week at select Dubai retailers. Residents will also be offered environmentally friendly disposal solutions for their old light bulbs, which can contain harmful levels of toxic mercury.
Green vehiclesThe UAE recently approved a low emission vehicle strategy to:
1. Raise awareness and educate the target audience through campaigns that encourage the use of more sustainable transportation
2. Develop and support convenient infrastructure
3. Empower participants through several supporting measures and incentives.
Green buildingsGreen Building Regulations were issued by the Dubai Municipality in 2011 and were made immediately mandatory for government bodies and optional for private developers.
WaterOverall water tariffs for villas and flats have been increasing, with rates differing for expats and nationals, to encourage residents (particularly expats) to reduce water consumption. There are also sharp recent increases in water tariffs for government entities.15
FoodNo incentives or penalties currently exist specific to food. However, the UAE imports more than 90 percent of its food. With continuing population growth and an environment with scarce renewable water and agriculture potential, food imports are expected to more than double by 2030. In an effort to improve food security, the UAE has been diversifying its sources of food and investing in agriculture projects and
technologies. The UAE also strongly encourages food security research and development, such as modeling to assess the impact of climate change on the agricultural productivity of the major food exporting countries on which the UAE currently relies, and incentivizes technology to increase productivity and resilience.16
Pollution and ecosystemsThough incentives are not currently available, the UAE has developed and implemented a number of strategies and plans, including carbon sequestration, that aim to improve understanding of wetlands, coastal carbon systems, and habitats.
The Intended National Determined Contribution (INDC), submitted by the UAE before COP21, emphasized its target to increase its share of clean energy from 0.2 percent in 2014 to 24 percent of the total energy mix by 2021. However, during COP22, the UAE raised this target to 27 percent, to generate energy from sources like nuclear and solar energy, which will considerably help minimize carbon emissions.13 Carbon capture and storage (CCS) also has a huge potential impact on carbon emissions reduction, and the Intergovernmental Panel on Climate Change says CCS could contribute between 10 percent and 55 percent to the cumulative worldwide carbon mitigation effort over the next 90 years. With this in mind, the UAE is developing a major CCS project through a joint venture between Masdar and Abu Dhabi National Oil Company (ADNOC) under Al Reyadah. The facility will sequester up to 800,000 tons of CO2 annually.14
13 See http://gulfnews.com/news/uae/environment/uae-raises-clean-energy-target-to-27-by-2021-1.1917569 14 See http://mofa.gov.ae/EN/TheUAE/Pages/Energy-and-Climate-Change-.aspx, http://www.masdar.ae/en 15 See http://energy/detail/carbon-capture-and-storage-ccs 16 See http://www4.unfccc.int/submissions/INDC/Published%20Documents/United%20Arab%20Emirates/1/UAE%20INDC%20-%2022%20October.pdf
© 2017 KPMG LLP, a Delaware limited liability partnership and the U.S. member firm of the KPMG network of independent member firms affiliated with KPMG International Cooperative (“KPMG International”), a Swiss entity. All rights reserved. The KPMG name and logo are registered trademarks or trademarks of KPMG International. NDPPS 655445

Between October 2020 and April 2021, Dubai will host the next World Expo, bringing together more than 180 nations and an international audience of 25 million visitors. The theme for the Expo is “Connecting Minds, Creating the Future”, recognizing that generating sustainable solutions to global problems demands collaboration across cultures, nations, and regions. Opportunity, Mobility, and Sustainability are the three subthemes. Specifically, the Sustainability theme will focus on ways to pursue progress without compromising the fundamental needs of future generations, examining the role of natural and built habitats in ensuring human well-being and community resilience. Recycled materials will be used in 30 percent of the construction, and 50 percent of the Expo’s operational energy requirements will come from
renewable sources on site. Other initiatives include plans to recycle wastewater, reuse materials, and monitor the carbon footprint of the site.
The UAE Vision 2021 defines sustainability areas and targets for 2021, focusing on improving the quality of air, preserving water resources, increasing the contribution of clean energy, and implementing green growth plans. The UAE aims to be a world leader in the green economy for sustainable development and a center for the export and reexport of green products and technologies. Initiatives include programs and policies in the areas of energy, agriculture, investment, and sustainable transport, in addition to environmental policies and new urban schemes to raise the quality of life in the state.
© 2017 KPMG LLP, a Delaware limited liability partnership and the U.S. member firm of the KPMG network of independent member firms affiliated with KPMG International Cooperative (“KPMG International”), a Swiss entity. All rights reserved. The KPMG name and logo are registered trademarks or trademarks of KPMG International. NDPPS 655445
95The KPMG Green Tax Index
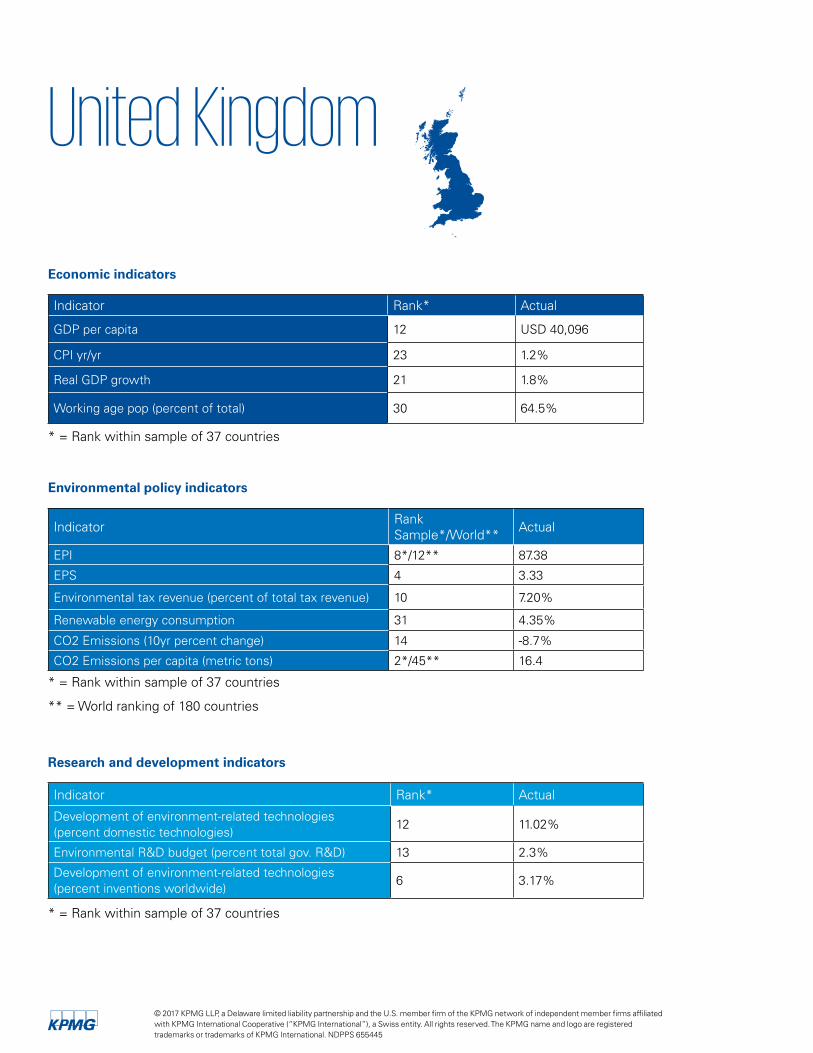
United Kingdom
Indicator Rank* Actual
GDP per capita 12 USD 40,096
CPI yr/yr 23 1.2%
Real GDP growth 21 1.8%
Working age pop (percent of total) 30 64.5%
* = Rank within sample of 37 countries
Indicator Rank* Actual
Development of environment-related technologies (percent domestic technologies)
12 11.02%
Environmental R&D budget (percent total gov. R&D) 13 2.3%
Development of environment-related technologies (percent inventions worldwide)
6 3.17%
* = Rank within sample of 37 countries
Environmental policy indicators
Indicator RankSample*/World** Actual
EPI 8*/12** 87.38
EPS 4 3.33
Environmental tax revenue (percent of total tax revenue) 10 7.20%
Renewable energy consumption 31 4.35%
CO2 Emissions (10yr percent change) 14 -8.7%
CO2 Emissions per capita (metric tons) 2*/45** 16.4
* = Rank within sample of 37 countries
** = World ranking of 180 countries
Research and development indicators
Economic indicators
© 2017 KPMG LLP, a Delaware limited liability partnership and the U.S. member firm of the KPMG network of independent member firms affiliated with KPMG International Cooperative (“KPMG International”), a Swiss entity. All rights reserved. The KPMG name and logo are registered trademarks or trademarks of KPMG International. NDPPS 655445

Carbon and climate changeThe United Kingdom currently participates in the EU Emissions Trading Scheme. It is unknown how and if this may change, depending on its relationship with the EU post-Brexit.
Organizations, businesses, and public bodies are required to participate in the CRC Energy Efficiency Scheme (CRC Scheme) if they use a certain amount of electricity per year. This scheme requires the organization to buy carbon allowances in respect of the energy the organization uses (electricity and natural gas). Penalties for noncompliance are large, including a penalty for failure to register/account for the allowances. Additional penalties are imposed for each day of noncompliance following the relevant deadline up to a maximum amount. An additional penalty per ton of CO2 emitted may also be payable. The CRC Scheme is due to be phased out in 2019, with a corresponding increase in the Climate Change Levy (CCL).
In 2011, a GBP 250 million (USD 406 million) Energy Intensive Industries Package (EIIP) was introduced to compensate energy-intensive industries for additional costs associated with the Carbon Price Floor (CPF) and EU Emissions Trading Scheme.
The CCL is an environmental tax levied on taxable commodities supplied to businesses and the public sector. The taxable commodities are electricity, gas, solid fuels, and liquefied petroleum gas (LPG). The levy is designed to encourage energy efficiency to help the United Kingdom meet targets for cutting greenhouse gases, including CO2 emissions. The levy rates are based on the energy content of each commodity.
The levy does not apply to diesel, petrol, LPG, and compressed natural
gas (CNG) used as fuel in road vehicles, as these are subject to road fuel duties. There are additional tax rules for oil and gas businesses, but not on the products themselves. Other mineral oils, such as gas oil, fuel oil, and kerosene, are not subject to the levy because they are within the scope of excise duties. There are certain exclusions, exemptions, and reduced rates on certain supplies (e.g., all supplies for domestic use and nonbusiness use by charities are excluded from the levy). Climate Change Agreements (CCAs) allow eligible energy-intensive businesses to receive the discount from the CCL in return for meeting energy efficiency or carbon-saving targets. Some supplies to energy-intensive users are exempt from the CCL. Electricity generated from renewable sources was exempt until August 2015. This electricity is now subject to standard rates of CCL.
Renewable energy and fuelsThe United Kingdom offers capital allowances of 18 percent for capital expenditures on plant and machinery (reduced to 8 percent if the asset’s expected economic useful life exceeds 25 years), an enhanced capital allowance (a 100 percent first year allowance for specified energy-saving plant and machinery), and a 19 percent tax cash credit is available for loss-making companies up to GBP 250,000 or the company’s PAYE and NICs liabilities, whichever is less.
There is also a reduced rate of VAT on supplies of services for installing energy-saving materials, and supplies of energy-saving materials by a person who installs those materials in a residential building or a building to be used for a charitable purpose.
The generation of heat from renewable sources, such as some heat pumps, solar thermal, and some biomass boilers, and the injection of biogas into the supply network from anaerobic digestion, gasification, or pyrolysis, is encouraged by the Renewable Heat Incentive (RHI). RHI is paid on the heat generated. The tariff rates are changed quarterly.
Green vehiclesBeginning in March 2011, the U.K. duty rate for road fuels (unleaded petrol, diesel, biodiesel, and bioethanol) is GBP 0.5795 per liter. Cars also pay the vehicle excise duty (based on CO2 per km). There is increasing use of road pricing (aka congestion charge) from which low-emissions vehicles are often exempt. Company car taxation also penalizes high-emitting cars and incentives low-emission cars. The United Kingdom also imposes an annual car tax calculated on CO2 emissions and fuel type.
A 100 percent first-year capital allowance is offered for vehicles with low emissions and covers expenditures on a new electric car, or new, unused car with CO2 emissions of not more than 75gm per km driven. The CO2 threshold changes each year.
Some non-EU countries (Norway, Iceland, and Liechtenstein) participate in the EU-ETS while some EU countries (Switzerland) have their own ETS.
The CPF was introduced in 2013 at GBP 15.70/tCO2 (USD 25.51/tCO2) and was expected to increase at a linear rate to GBP 30/tCO2 (USD 48.74/tCO2) in 2020, and to GBP 70/tCO2 (USD 113.74/tCO2) in 2030. The rate of increase has slowed and is now GBP 18/tCO2.
© 2017 KPMG LLP, a Delaware limited liability partnership and the U.S. member firm of the KPMG network of independent member firms affiliated with KPMG International Cooperative (“KPMG International”), a Swiss entity. All rights reserved. The KPMG name and logo are registered trademarks or trademarks of KPMG International. NDPPS 655445
97The KPMG Green Tax Index

Green buildingsThe enhanced capital allowance scheme allows a deduction of 100 percent of the cost of investment in qualifying energy-saving technology, though there are no incentives specific to the building itself.
WaterThere is a 100 percent first-year capital allowance for water-efficient technologies and some water reuse technologies. The allowances are available for expenditures on plant and machinery that are designed to improve H2o quality and/or reduce water use. For example, water-efficient showers and taps, and vehicle wash water reclaim units, are included as qualifying technologies or products as specified by the Department of Environment, Food and Rural Affairs.
Material resources and waste The aggregates levy, introduced on April 1, 2002, is a U.K.-wide tax on the commercial exploitation of virgin aggregate materials (e.g., rock, sand, and gravel). The levy uses the price mechanism to encourage efficient use of virgin aggregate materials and increased use of untaxed alternative construction materials (e.g., recycled construction and demolition waste). The levy is charged on a per ton basis and is a one-stage, nondeductible tax. Exemptions from the levy include slate, china clay, mining waste, and “dimension” stone. Also there are certain reliefs available for exports and taxable materials that are used for a nonaggregate purpose (e.g., sand used for glass manufacture).
Packaging Waste Regulations oblige larger producers of packaging to purchase Packaging Recovery Notes (PRNs) from accredited reprocessors.
This system demands that PRNs are accounted for by all obligated companies in the supply chain, including the manufacturer of the raw material, the converter of the raw material to packaging, the filler of the packaging, and the seller of the packaged supplies to the end user. PRNs are purchased directly, or through an intermediary, from companies accredited to reprocess the packaging. A certain percentage of packaging is accounted for by each stage in the supply chain.
Companies supplying waste electrical and electronic equipment are obligated to demonstrate that material is reused and recycled and that waste batteries have been disposed of correctly by buying evidence notes. These regulations are led by European Directives and may also change following Brexit.
A Landfill Tax (LFT) was introduced in 1996 and is levied on approximately 160 landfill site operators registered in the United Kingdom covering c.700 sites. The LFT was introduced as a way of adhering to the government’s environmental objectives by diverting waste away from landfills, covering external costs of landfills, and encouraging sustainable waste technologies such as recycling. The tax is charged per ton of most types of waste deposited into U.K. landfills. There are certain exemptions from the tax, such as dredging, mining, and quarrying wastes.
Pollution and ecosystems Incentives include land remediation relief from corporate tax only, providing a deduction of 100 percent, plus an additional deduction of 50 percent, for qualifying expenditures incurred by companies in cleaning up
land acquired from a third party in a contaminated state.
The landfill tax community fund enables landfill site operators to claim a credit in respect of contributions made to fund local community and environmental projects. The amount of credit claimable is capped at 90 percent of the contribution and must be no more than 4.2 percent of the operator’s annual landfill tax.
InnovationThe United Kingdom offers R&D tax relief in the form of an enhanced tax deduction of 130 percent (230 percent for small and medium-sized entities from April 1, 2015) for revenue expenditures on qualifying projects seeking to achieve an advance through the resolution of scientific or technological uncertainty. The U.K. government is currently consulting on the detail of an “above the line” R&D credit for large companies that do not have a current corporation tax liability, providing for a 100 percent allowance on capital expenditure on R&D in the year of the expenditure. R&D deductions are not limited to green technologies.
In addition, the Patent Box enables companies to apply a lower rate of corporation tax to profits earned after April 1, 2013 for patented inventions and certain other innovations, also not limited to green technologies.
© 2017 KPMG LLP, a Delaware limited liability partnership and the U.S. member firm of the KPMG network of independent member firms affiliated with KPMG International Cooperative (“KPMG International”), a Swiss entity. All rights reserved. The KPMG name and logo are registered trademarks or trademarks of KPMG International. NDPPS 655445

United States
Indicator Rank* Actual
GDP per capita 3 USD 57,436
CPI yr/yr 11 2.2%
Real GDP growth 23 1.6%
Working age pop (percent of total) 20 66.3%
* = Rank within sample of 37 countries
Indicator Rank* Actual
Development of environment-related technologies (percent domestic technologies)
14 10.40%
Environmental R&D budget (percent total gov. R&D) 23 0.4%
Development of environment-related technologies (percent inventions worldwide)
1 25.53%
* = Rank within sample of 37 countries
Environmental policy indicators
Indicator RankSample*/World** Actual
EPI 14*/26** 84.72
EPS 15 2.55
Environmental tax revenue (percent of total tax revenue) 25 2.77%
Renewable energy consumption 26 7.92%
CO2 Emissions (10yr percent change) 7 -23.1%
CO2 Emissions per capita (metric tons) 21*/9** 6.0
* = Rank within sample of 37 countries
** = World ranking of 180 countries
Research and development indicators
Economic indicators
© 2017 KPMG LLP, a Delaware limited liability partnership and the U.S. member firm of the KPMG network of independent member firms affiliated with KPMG International Cooperative (“KPMG International”), a Swiss entity. All rights reserved. The KPMG name and logo are registered trademarks or trademarks of KPMG International. NDPPS 655445
99The KPMG Green Tax Index

Carbon and climate changeThe United States offers a carbon dioxide sequestration incentive in the form of a credit for the sequestration of industrial source CO2 produced at qualified U.S. facilities, which must capture at least 500,000 metric tons of CO2 per year. The credit is inflation-adjusted each year. In 2016, it was USD 11.07 per metric ton for CO2 used as a tertiary injectant and then permanently sequestered and USD 22.14 for CO2 permanently sequestered without first being used as a tertiary injectant. The credit expires at the end of the year in which the government determines that 75 million metric tons of CO2 have been captured and sequestered.
The United States does not have national carbon taxes, but does have subnational taxes in certain jurisdictions. California, for example, as part of its independent goal to slash greenhouse gas emissions to 40 percent below 1990 levels, has a carbon cap and trade program, under which polluters must buy permits to exceed state emissions thresholds. At the last auction, in 2016, this translated to almost USD 13 per ton of carbon. This cost is passed on to consumers through higher fuel taxes.
Renewable energy and fuelsThe U.S. Tax Code offers taxpayers investing in wind, biomass, geothermal, municipal solid waste, qualified hydropower, and marine and hydrokinetic energy property a choice between a production tax credit and a 30 percent investment tax credit. The production tax credit is generally available for the first 10 years after a facility has been placed in service. The credit rate, which is adjusted annually
for inflation, in 2016 was USD 00.023 per kilowatt-hour for electricity generated through wind, closed-loop biomass, or geothermal energy, and USD 00.012 per kilowatt-hour for electricity generated through open- loop biomass, geothermal, municipal solid waste, qualified hydropower, or marine/hydrokinetic energy. To qualify for the production tax credit or the investment tax credit, all facilities except for wind were required to begin construction by December 31, 2016; wind facilities must begin construction by December 31, 2019, although the amount of the credit is reduced by 20 percent annually for facilities that begin construction after 2016.
The United States offers an investment tax credit of 10 percent of the cost of equipment to produce energy from a geothermal deposit. For solar electric or solar hot water property, there is a 30 percent investment tax credit for property for which construction begins prior to 2020. The credit rate decreases to 26 percent for construction beginning in 2020, to 22 percent for construction beginning in 2021, and to 10 percent for construction beginning thereafter or not completed construction until after 2023. The 10 percent credit for investments in geothermal or solar property have no expiration date.
The United States also offers accelerated depreciation periods of five years for renewable energy property, including solar and wind energy generating equipment and biomass equipment. If placed in service prior to 2020, this property is also eligible for an accelerated first-year depreciation deduction. This accelerated deduction is equal
to 50 percent of the cost basis for property placed in service in 2017, 40 percent for property placed in service in 2018, and 30 percent for property placed in service in 2020.
In the wake of the 2017 election and the subsequent change in the administration and the composition of Congress, major tax reform in the United States is being widely discussed. The impact of this reform on renewable energy and other green tax incentives is currently unknown but expected to be significant.
Federal excise tax incentives on alcohol fuels, second-generation biofuels, biodiesel (including renewable diesel), and other specified alternative and renewable fuels, generally ranging from USD 00.50 per gallon to USD 1.00 per gallon, are currently expired as of December 31, 2016.
The United States imposes fuel excise taxes on “taxable fuel” (gasoline, diesel fuel, and kerosene). Currently, the federal tax on gasoline is USD 00.184 per gallon and the tax on diesel fuel and kerosene is USD 00.244 per gallon. The rate of tax includes the Leaking Underground Storage Tank (LUST) Trust Fund tax rate of USD 00.001 per gallon. Special rates apply in the case of certain uses of aviation fuel.
The United States also imposes a retail fuel excise tax on any other liquid fuel sold for use or used as a fuel in a motor vehicle or motorboat at a specified rate of either USD 00.184 or USD 00.244 per gallon, including LUST tax. LPG and CNG are taxed at USD 00.184 per energy equivalent of a gallon (EEG) of gasoline, and LNG is taxed at USD 00.244 per EEG of diesel.
© 2017 KPMG LLP, a Delaware limited liability partnership and the U.S. member firm of the KPMG network of independent member firms affiliated with KPMG International Cooperative (“KPMG International”), a Swiss entity. All rights reserved. The KPMG name and logo are registered trademarks or trademarks of KPMG International. NDPPS 655445

Green vehiclesThe United States taxes large vehicles (i.e., “gas guzzlers”). The United States established its Gas Guzzler Tax as part of the energy tax of 1978 to discourage the production and purchase of fuel-inefficient vehicles. The Gas Guzzler Tax is assessed on new cars that do not meet required fuel economy levels, currently 22.5 miles per gallon. These taxes apply only to passenger cars. Trucks, minivans, and sport utility vehicles (SUVs) are not covered because these vehicles were not widely available in 1978 and were rarely used for noncommercial purposes. The U.S. Internal Revenue Service is responsible for administering the Gas Guzzler program and collecting the taxes from car manufacturers or importers. The amount of tax is posted on the window stickers of new cars—the lower the fuel economy, the higher the tax.
The Gas Guzzler Tax for each vehicle is based on its combined city and highway fuel economy value. Fuel economy values are calculated before sales begin for the model year. The total amount of the tax is determined later and is based on the total number of “gas guzzler” vehicles sold that year. The tax is assessed after production has ended for the model year and is paid by the vehicle manufacturer or importer.
Pollution and ecosystemsU.S. companies can choose to write off certain certified pollution control assets over 60 or 84 months, depending on the type of facility. This allowance has no expiration date, but facilities must be certified to take advantage of the incentive. To fund the Oil Spill Liability Trust Fund, the United States imposes a USD 00.09 per barrel excise tax on crude oil received at a U.S. refinery and imported petroleum products.
To fund the Sport Fish Restoration and Boating Trust Fund, the United States generally imposes a 10 percent excise tax on the sale price of specified sport fishing equipment.
To fund the Inland Waterways Trust Fund, the United States imposes a USD 00.29 per gallon tax on liquid fuel used in a vessel in commercial waterway transportation. An additional LUST tax of USD 00.001 per gallon is also imposed on fuel that is not taxable fuel or previously taxed alternative fuel.
The United States also imposes an ozone depleting chemicals (ODC) excise tax on manufacturers and importers of ODCs who sell or use the ODCs and on the importer of specified taxable products that sells or uses those products. The rate of tax is based on the weight of the ODCs used in the manufacture of the product (e.g., the 2017 rate of tax per pound of CFC-
11 is USD 15.25 and of Halon-1301 is USD 152.50). In the alternative, for imported taxable products, the rate of tax is 1 percent of the entry value of the product.
InnovationCompanies are entitled to both an R&D deduction and an R&D credit if engaging in product or process development and improvement.
An R&D deduction is available for research and experimental costs incurred in the development or improvement of a product, which includes a pilot model, process, formula, invention, technique, patent, or similar property.
An additional R&D tax credit of approximately 6 percent of expenses is also available for taxpayers that engage in certain activities related to product development and improvement and manufacturing process improvements. Generally, the credit is based on the R&D expenditures (wages, raw materials, and contract research) incurred for increasing research activities. If a company invests in an energy research consortium for energy research, the R&D tax credit is 20 percent of such investment without regard to any increase in research activities.
© 2017 KPMG LLP, a Delaware limited liability partnership and the U.S. member firm of the KPMG network of independent member firms affiliated with KPMG International Cooperative (“KPMG International”), a Swiss entity. All rights reserved. The KPMG name and logo are registered trademarks or trademarks of KPMG International. NDPPS 655445
101The KPMG Green Tax Index

Vietnam
Indicator Rank* Actual
GDP per capita 36 USD 2,173
CPI yr/yr 7 4.7%
Real GDP growth 2 6.2%
Working age pop (percent of total) 6 70.2%
* = Rank within sample of 37 countries
Indicator Rank* Actual
Development of environment-related technologies (percent domestic technologies)
33 7.19%
Environmental R&D budget (percent total gov. R&D) N/A** N/A**
Development of environment-related technologies (percent inventions worldwide)
36 0.01%
* = Rank within sample of 37 countries
Environmental policy indicators
Indicator RankSample*/World** Actual
EPI 36*/131** 58.5
EPS - -
Environmental tax revenue (percent of total tax revenue) - -
Renewable energy consumption 6 35.58%
CO2 Emissions (10yr percent change) 36 93.8%
CO2 Emissions per capita (metric tons) 36*/125** 1.7
* = Rank within sample of 37 countries
** = World ranking of 180 countries
Research and development indicators
Economic indicators
** = Data is not available
© 2017 KPMG LLP, a Delaware limited liability partnership and the U.S. member firm of the KPMG network of independent member firms affiliated with KPMG International Cooperative (“KPMG International”), a Swiss entity. All rights reserved. The KPMG name and logo are registered trademarks or trademarks of KPMG International. NDPPS 655445

Renewable energy and fuelsVietnam has a corporate income tax incentive package for projects related to energy and fuels in certain sectors and locations. There is also a flat-rate (10 percent) special consumption tax and a flat-rate environment protection tax (10,00VND/liter) that applies to most conventional fuels.
Green vehiclesImported vehicles that do not conform to environmental standards are subject to penalties, the amount of which depends on the act of violation. In addition, hybrid cars purchases are entitled to a special consumption tax incentive.
WaterVietnam has a natural resources tax that is based on the volume of water used for production/business purposes.
Depending on types of water, the tax varies from 1 percent to 8 percent. There are also incentives for wastewater treatment projects, exemptions from import duties for machinery and equipment related to such projects, and exemptions from duties when exporting recycling products.
Material resources and wasteThe Ministry of Finance has established an environment protection tax on nylon bags and an environment protection fee for water waste.
Pollution and ecosystemsVietnam imposes various penalties for violations of regulations relating to environment protection, including administrative penalties and business license revocations. Land use fees are applied when the use of land is changed, such as from agricultural
to residential. The government also supports forest protection activities, such as planting or rehabilitating a forest.
InnovationGeneral R&D tax reductions are available for certain activities, but are subject to a number of required conditions. The incentives include reduction in the corporate income tax rate and complete deductibility of R&D expenses.
© 2017 KPMG LLP, a Delaware limited liability partnership and the U.S. member firm of the KPMG network of independent member firms affiliated with KPMG International Cooperative (“KPMG International”), a Swiss entity. All rights reserved. The KPMG name and logo are registered trademarks or trademarks of KPMG International. NDPPS 655445
103The KPMG Green Tax Index

Appendices
© 2017 KPMG LLP, a Delaware limited liability partnership and the U.S. member firm of the KPMG network of independent member firms affiliated with KPMG International Cooperative (“KPMG International”), a Swiss entity. All rights reserved. The KPMG name and logo are registered trademarks or trademarks of KPMG International. NDPPS 655445
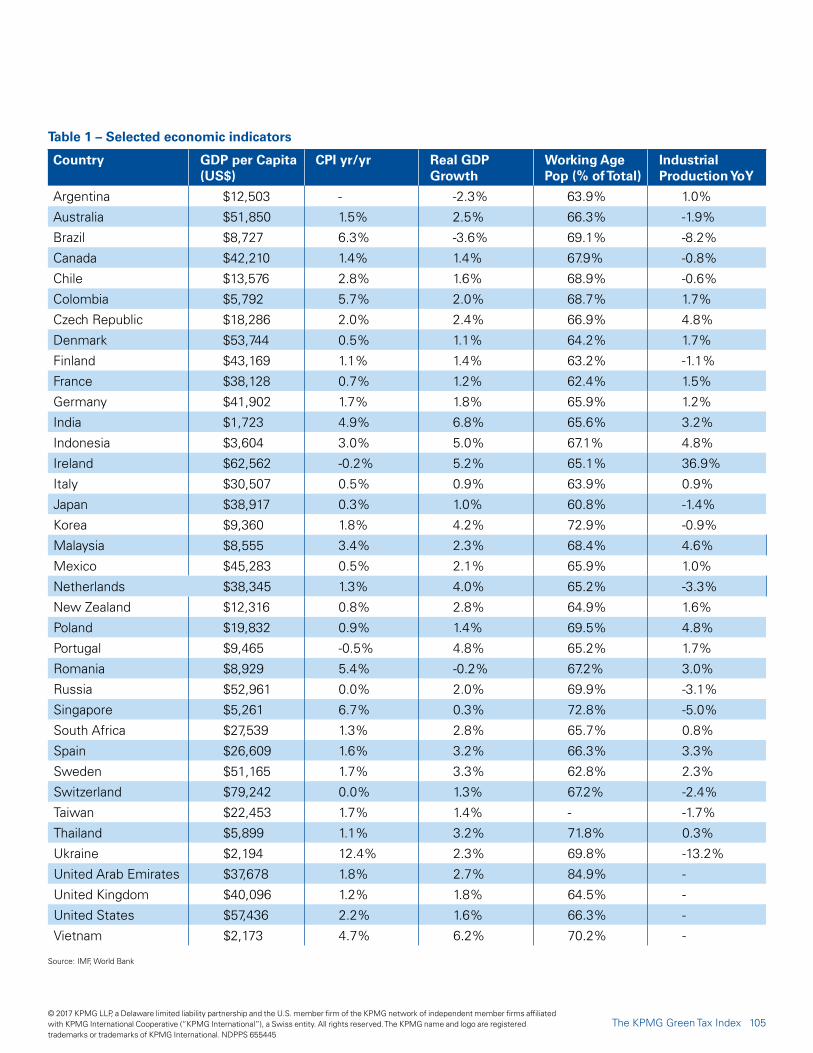
Table 1 – Selected economic indicators
Country GDP per Capita (US$)
CPI yr/yr Real GDP Growth
Working Age Pop (% of Total)
Industrial Production YoY
Argentina $12,503 - -2.3% 63.9% 1.0%
Australia $51,850 1.5% 2.5% 66.3% -1.9%
Brazil $8,727 6.3% -3.6% 69.1% -8.2%
Canada $42,210 1.4% 1.4% 67.9% -0.8%
Chile $13,576 2.8% 1.6% 68.9% -0.6%
Colombia $5,792 5.7% 2.0% 68.7% 1.7%
Czech Republic $18,286 2.0% 2.4% 66.9% 4.8%
Denmark $53,744 0.5% 1.1% 64.2% 1.7%
Finland $43,169 1.1% 1.4% 63.2% -1.1%
France $38,128 0.7% 1.2% 62.4% 1.5%
Germany $41,902 1.7% 1.8% 65.9% 1.2%
India $1,723 4.9% 6.8% 65.6% 3.2%
Indonesia $3,604 3.0% 5.0% 67.1% 4.8%
Ireland $62,562 -0.2% 5.2% 65.1% 36.9%
Italy $30,507 0.5% 0.9% 63.9% 0.9%
Japan $38,917 0.3% 1.0% 60.8% -1.4%
Korea $9,360 1.8% 4.2% 72.9% -0.9%
Malaysia $8,555 3.4% 2.3% 68.4% 4.6%
Mexico $45,283 0.5% 2.1% 65.9% 1.0%
Netherlands $38,345 1.3% 4.0% 65.2% -3.3%
New Zealand $12,316 0.8% 2.8% 64.9% 1.6%
Poland $19,832 0.9% 1.4% 69.5% 4.8%
Portugal $9,465 -0.5% 4.8% 65.2% 1.7%
Romania $8,929 5.4% -0.2% 67.2% 3.0%
Russia $52,961 0.0% 2.0% 69.9% -3.1%
Singapore $5,261 6.7% 0.3% 72.8% -5.0%
South Africa $27,539 1.3% 2.8% 65.7% 0.8%
Spain $26,609 1.6% 3.2% 66.3% 3.3%
Sweden $51,165 1.7% 3.3% 62.8% 2.3%
Switzerland $79,242 0.0% 1.3% 67.2% -2.4%
Taiwan $22,453 1.7% 1.4% - -1.7%
Thailand $5,899 1.1% 3.2% 71.8% 0.3%
Ukraine $2,194 12.4% 2.3% 69.8% -13.2%
United Arab Emirates $37,678 1.8% 2.7% 84.9% -
United Kingdom $40,096 1.2% 1.8% 64.5% -
United States $57,436 2.2% 1.6% 66.3% -
Vietnam $2,173 4.7% 6.2% 70.2% -
Source: IMF, World Bank
© 2017 KPMG LLP, a Delaware limited liability partnership and the U.S. member firm of the KPMG network of independent member firms affiliated with KPMG International Cooperative (“KPMG International”), a Swiss entity. All rights reserved. The KPMG name and logo are registered trademarks or trademarks of KPMG International. NDPPS 655445
105The KPMG Green Tax Index

CountryEnvironmental Tax Revenue (% of total tax revenue)
EPI EPSCO2 Emissions (% YoY)
Renewable Energy Consumption (% of total consumption)
GDP per Unit of Energy Use
CO2 Emissions (kt)
CO2 Emissions per Capita (metric tons)
CO2 Emissions 10yr Change
EPI Global RankCO2 emission global rank
CO2 emission per capita global rank
Argentina 4.0% 79.84 - -1.3% 8.8% - 377906 16.4 12.4% 43rd 27th 75thAustralia 7.8% 87.22 3.12 0.7% 8.4% 7.67 189819 4.5 40.5% 13th 16th 10thBrazil 1.9% 78.90 0.78 7.2% 43.6% 10.63 503677 2.5 56.6% 46th 10th 105thCanada 3.7% 85.06 2.84 -1.2% 20.6% 5.86 475735 13.5 -14.0% 25th 13th 16thChile 6.1% 77.67 - 2.7% 30.3% 9.88 83171 4.7 49.6% 52nd 43rd 72ndColombia 4.9% 75.93 - 12.2% 26.3% 18.39 89625 1.9 56.1% 57th 41st 118thCzech Republic 7.9% 84.67 2.30 -2.4% 10.9% 7.05 98661 9.4 -19.2% 27th 36th 26th
Denmark 8.2% 89.21 4.18 4.6% 27.6% 13.79 38067 6.8 -32.0% 4th 70th 48thFinland 6.6% 90.68 3.35 -5.2% 39.1% 6.42 46300 8.5 -33.0% 1st 59th 33rdFrance 4.4% 88.20 3.19 0.1% 12.6% 9.70 333191 5.1 -12.4% 10th 18th 69thGermany 5.4% 3.01 2.4% 12.4% 10.93 757313 9.2 -8.0% 30th 6th 29thIndia 13.4% 53.58 1.15 0.8% 39.0% 8.40 2034752 1.6 85.0% 141st 3rd 128thIndonesia - 65.85 1.10 -20.0% 37.1% 11.38 479365 1.9 51.3% 107th 12th 115thIreland 7.6% 86.60 2.05 -2.1% 7.0% 16.26 34965 7.6 -18.1% 19th 73rd 41stItaly 8.8% 84.48 2.77 -6.7% 12.1% 13.09 344768 5.7 -26.4% 29th 17th 61stJapan 5.1% 80.59 2.63 1.1% 4.5% 9.95 1243384 9.8 0.1% 39th 5th 25thKorea 10.3% 70.61 2.63 1.4% 1.6% 6.22 592499 11.8 27.1% 80th 8th 20thMalaysia 1.5% 74.23 - 8.1% 6.8% 7.76 236511 8.0 49.4% 63rd 25th 37thMexico -1.8% 73.59 - 1.6% 9.4% 10.45 488602 4.0 20.4% 67th 11th 83rdNetherlands 9.3% 82.03 3.63 0.4% 4.7% 9.85 169973 10.1 -2.8% 36th 29th 23thNew Zealand 4.2% 88.00 - -1.6% 30.8% 7.68 33960 7.7 -0.4% 11th 74th 40thPoland 6.0% 81.26 2.99 0.8% 11.1% 9.03 302333 8.0 0.0% 38th 21st 39thPortugal 6.4% 88.63 2.13 0.4% 25.6% 12.39 46263 4.4 -24.4% 7th 60th 76thRomania - 83.24 - -13.4% 21.7% 11.63 70736 3.5 -30.0% 34th 45th 88thRussia - 83.52 0.60 -2.5% 3.3% 4.94 1789074 12.5 11.5% 32nd 4th 18thSingapore - 87.04 - -7.5% 0.5% 16.15 50557 9.4 62.4% 14th 56th 27thSouth Africa 8.2% 70.52 0.78 -0.2% 16.9% 4.69 471239 8.9 16.5% 81st 14th 30thSpain 5.6% 88.91 2.22 -10.5% 15.8% 12.47 236969 5.1 -26.2% 6th 24th 68thSweden 5.2% 90.43 3.10 -5.8% 49.9% 8.46 44327 4.6 -19.1% 3rd 63rd 73rdSwitzerland 6.6% 86.93 3.29 6.9% 22.7% 16.62 40348 5.0 0.4% 16th 67th 70thTaiwan - 74.88 - 0.0% 0.0% 0.00 - - - 60th - -Thailand - 69.54 - -0.7% 23.0% 7.50 303118 4.5 35.0% 91st 20th 74thUkraine - 79.69 - -8.3% 2.8% 3.27 169122 18.7 58.3% 44th 22nd 58thUnited Arab Emirates
- 69.35 - -1.9% 0.1% 8.07 457473 7.1 -15.3% 92nd 30th 6th
United Kingdom 7.2% 87.38 3.33 -2.1% 4.4% 12.53 5186168 16.4 -8.7% 12th 15th 45thUnited States 2.8% 84.72 2.55 1.4% 7.9% 7.36 271101 6.0 -23.1% 26th 2nd 9thVietnam - 58.50 - -3.5% 35.6% 7.67 152624 1.7 93.8% 131st 33rd 125th
Source: OECD, World Bank
Table 2 – Selected environmental policy indicators
© 2017 KPMG LLP, a Delaware limited liability partnership and the U.S. member firm of the KPMG network of independent member firms affiliated with KPMG International Cooperative (“KPMG International”), a Swiss entity. All rights reserved. The KPMG name and logo are registered trademarks or trademarks of KPMG International. NDPPS 655445

CountryEnvironmental Tax Revenue (% of total tax revenue)
EPI EPSCO2 Emissions (% YoY)
Renewable Energy Consumption (% of total consumption)
GDP per Unit of Energy Use
CO2 Emissions (kt)
CO2 Emissions per Capita (metric tons)
CO2 Emissions 10yr Change
EPI Global RankCO2 emission global rank
CO2 emission per capita global rank
Argentina 4.0% 79.84 - -1.3% 8.8% - 377906 16.4 12.4% 43rd 27th 75thAustralia 7.8% 87.22 3.12 0.7% 8.4% 7.67 189819 4.5 40.5% 13th 16th 10thBrazil 1.9% 78.90 0.78 7.2% 43.6% 10.63 503677 2.5 56.6% 46th 10th 105thCanada 3.7% 85.06 2.84 -1.2% 20.6% 5.86 475735 13.5 -14.0% 25th 13th 16thChile 6.1% 77.67 - 2.7% 30.3% 9.88 83171 4.7 49.6% 52nd 43rd 72ndColombia 4.9% 75.93 - 12.2% 26.3% 18.39 89625 1.9 56.1% 57th 41st 118thCzech Republic 7.9% 84.67 2.30 -2.4% 10.9% 7.05 98661 9.4 -19.2% 27th 36th 26th
Denmark 8.2% 89.21 4.18 4.6% 27.6% 13.79 38067 6.8 -32.0% 4th 70th 48thFinland 6.6% 90.68 3.35 -5.2% 39.1% 6.42 46300 8.5 -33.0% 1st 59th 33rdFrance 4.4% 88.20 3.19 0.1% 12.6% 9.70 333191 5.1 -12.4% 10th 18th 69thGermany 5.4% 3.01 2.4% 12.4% 10.93 757313 9.2 -8.0% 30th 6th 29thIndia 13.4% 53.58 1.15 0.8% 39.0% 8.40 2034752 1.6 85.0% 141st 3rd 128thIndonesia - 65.85 1.10 -20.0% 37.1% 11.38 479365 1.9 51.3% 107th 12th 115thIreland 7.6% 86.60 2.05 -2.1% 7.0% 16.26 34965 7.6 -18.1% 19th 73rd 41stItaly 8.8% 84.48 2.77 -6.7% 12.1% 13.09 344768 5.7 -26.4% 29th 17th 61stJapan 5.1% 80.59 2.63 1.1% 4.5% 9.95 1243384 9.8 0.1% 39th 5th 25thKorea 10.3% 70.61 2.63 1.4% 1.6% 6.22 592499 11.8 27.1% 80th 8th 20thMalaysia 1.5% 74.23 - 8.1% 6.8% 7.76 236511 8.0 49.4% 63rd 25th 37thMexico -1.8% 73.59 - 1.6% 9.4% 10.45 488602 4.0 20.4% 67th 11th 83rdNetherlands 9.3% 82.03 3.63 0.4% 4.7% 9.85 169973 10.1 -2.8% 36th 29th 23thNew Zealand 4.2% 88.00 - -1.6% 30.8% 7.68 33960 7.7 -0.4% 11th 74th 40thPoland 6.0% 81.26 2.99 0.8% 11.1% 9.03 302333 8.0 0.0% 38th 21st 39thPortugal 6.4% 88.63 2.13 0.4% 25.6% 12.39 46263 4.4 -24.4% 7th 60th 76thRomania - 83.24 - -13.4% 21.7% 11.63 70736 3.5 -30.0% 34th 45th 88thRussia - 83.52 0.60 -2.5% 3.3% 4.94 1789074 12.5 11.5% 32nd 4th 18thSingapore - 87.04 - -7.5% 0.5% 16.15 50557 9.4 62.4% 14th 56th 27thSouth Africa 8.2% 70.52 0.78 -0.2% 16.9% 4.69 471239 8.9 16.5% 81st 14th 30thSpain 5.6% 88.91 2.22 -10.5% 15.8% 12.47 236969 5.1 -26.2% 6th 24th 68thSweden 5.2% 90.43 3.10 -5.8% 49.9% 8.46 44327 4.6 -19.1% 3rd 63rd 73rdSwitzerland 6.6% 86.93 3.29 6.9% 22.7% 16.62 40348 5.0 0.4% 16th 67th 70thTaiwan - 74.88 - 0.0% 0.0% 0.00 - - - 60th - -Thailand - 69.54 - -0.7% 23.0% 7.50 303118 4.5 35.0% 91st 20th 74thUkraine - 79.69 - -8.3% 2.8% 3.27 169122 18.7 58.3% 44th 22nd 58thUnited Arab Emirates
- 69.35 - -1.9% 0.1% 8.07 457473 7.1 -15.3% 92nd 30th 6th
United Kingdom 7.2% 87.38 3.33 -2.1% 4.4% 12.53 5186168 16.4 -8.7% 12th 15th 45thUnited States 2.8% 84.72 2.55 1.4% 7.9% 7.36 271101 6.0 -23.1% 26th 2nd 9thVietnam - 58.50 - -3.5% 35.6% 7.67 152624 1.7 93.8% 131st 33rd 125th
© 2017 KPMG LLP, a Delaware limited liability partnership and the U.S. member firm of the KPMG network of independent member firms affiliated with KPMG International Cooperative (“KPMG International”), a Swiss entity. All rights reserved. The KPMG name and logo are registered trademarks or trademarks of KPMG International. NDPPS 655445
107The KPMG Green Tax Index
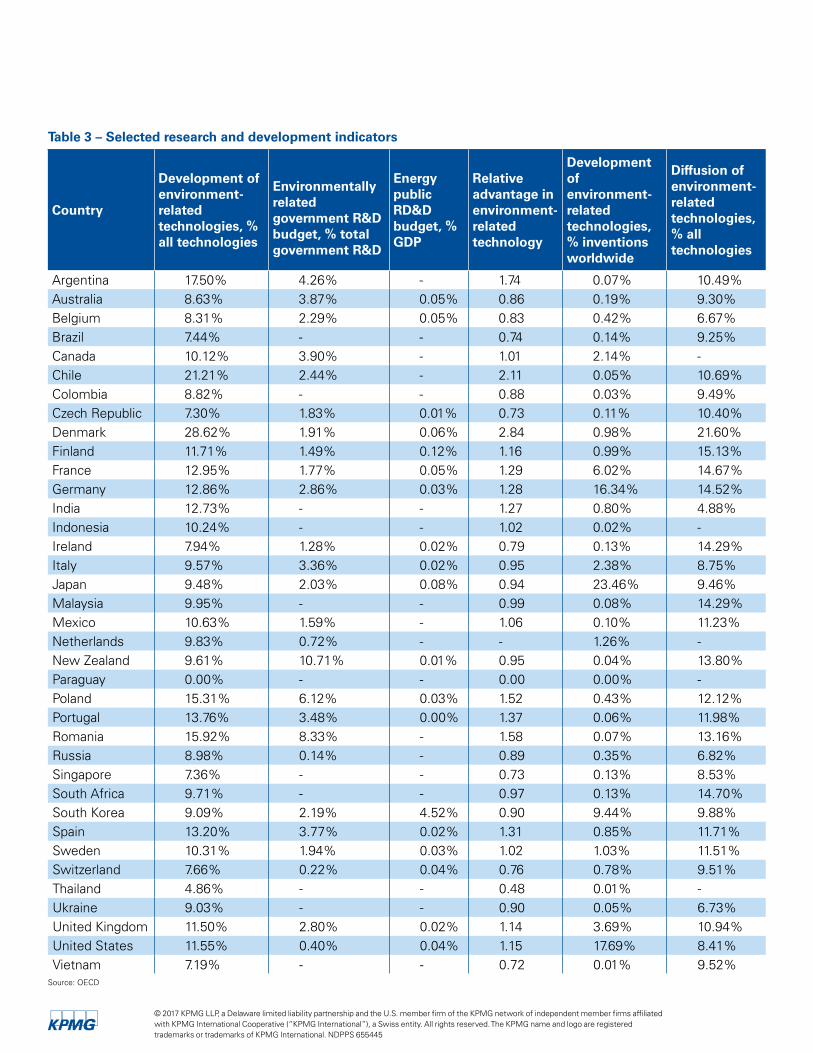
Table 3 – Selected research and development indicators
Country
Development of environment-related technologies, % all technologies
Environmentally related government R&D budget, % total government R&D
Energy public RD&D budget, % GDP
Relative advantage in environment-related technology
Development of environment-related technologies, % inventions worldwide
Diffusion of environment-related technologies, % all technologies
Argentina 17.50% 4.26% - 1.74 0.07% 10.49%Australia 8.63% 3.87% 0.05% 0.86 0.19% 9.30%Belgium 8.31% 2.29% 0.05% 0.83 0.42% 6.67%Brazil 7.44% - - 0.74 0.14% 9.25%Canada 10.12% 3.90% - 1.01 2.14% -Chile 21.21% 2.44% - 2.11 0.05% 10.69%Colombia 8.82% - - 0.88 0.03% 9.49%Czech Republic 7.30% 1.83% 0.01% 0.73 0.11% 10.40%Denmark 28.62% 1.91% 0.06% 2.84 0.98% 21.60%Finland 11.71% 1.49% 0.12% 1.16 0.99% 15.13%France 12.95% 1.77% 0.05% 1.29 6.02% 14.67%Germany 12.86% 2.86% 0.03% 1.28 16.34% 14.52%India 12.73% - - 1.27 0.80% 4.88%Indonesia 10.24% - - 1.02 0.02% -Ireland 7.94% 1.28% 0.02% 0.79 0.13% 14.29%Italy 9.57% 3.36% 0.02% 0.95 2.38% 8.75%Japan 9.48% 2.03% 0.08% 0.94 23.46% 9.46%Malaysia 9.95% - - 0.99 0.08% 14.29%Mexico 10.63% 1.59% - 1.06 0.10% 11.23%Netherlands 9.83% 0.72% - - 1.26% -New Zealand 9.61% 10.71% 0.01% 0.95 0.04% 13.80%Paraguay 0.00% - - 0.00 0.00% -Poland 15.31% 6.12% 0.03% 1.52 0.43% 12.12%Portugal 13.76% 3.48% 0.00% 1.37 0.06% 11.98%Romania 15.92% 8.33% - 1.58 0.07% 13.16%Russia 8.98% 0.14% - 0.89 0.35% 6.82%Singapore 7.36% - - 0.73 0.13% 8.53%South Africa 9.71% - - 0.97 0.13% 14.70%South Korea 9.09% 2.19% 4.52% 0.90 9.44% 9.88%Spain 13.20% 3.77% 0.02% 1.31 0.85% 11.71%Sweden 10.31% 1.94% 0.03% 1.02 1.03% 11.51%Switzerland 7.66% 0.22% 0.04% 0.76 0.78% 9.51%Thailand 4.86% - - 0.48 0.01% -Ukraine 9.03% - - 0.90 0.05% 6.73%United Kingdom 11.50% 2.80% 0.02% 1.14 3.69% 10.94%United States 11.55% 0.40% 0.04% 1.15 17.69% 8.41%Vietnam 7.19% - - 0.72 0.01% 9.52%
Source: OECD
© 2017 KPMG LLP, a Delaware limited liability partnership and the U.S. member firm of the KPMG network of independent member firms affiliated with KPMG International Cooperative (“KPMG International”), a Swiss entity. All rights reserved. The KPMG name and logo are registered trademarks or trademarks of KPMG International. NDPPS 655445

© 2017 KPMG LLP, a Delaware limited liability partnership and the U.S. member firm of the KPMG network of independent member firms affiliated with KPMG International Cooperative (“KPMG International”), a Swiss entity. All rights reserved. The KPMG name and logo are registered trademarks or trademarks of KPMG International. NDPPS 655445
109The KPMG Green Tax Index

ArgentinaOmar D. DíazSocio Líder de Energías RenovablesT: +54 11 4316 5865 E: [email protected]
AustraliaDavid GelbPartnerT: +61 3 9288 6160E: [email protected]
BrazilRicardo ZibasSócio D, SP Risk Consulting SustentabilidadeT: +551139401795E: [email protected]
CanadaGeorge KondopulosPartner, TX – Corporate TaxT: +1 604 646 6350E: [email protected]
ChileRicardo JimenezGerente Senior Sustainability, SustainabilityT: +56227981502E: [email protected]
ColombiaMaria AgudeloVicepresidente, Risk ConsultingT: +5743556060E: [email protected]
Czech RepublicLucie PrajzlerovaAssociate ManagerT: +420 222 123 360E: [email protected]
DenmarkNiels VendelboPartner, AssuranceT: +4525543658E: [email protected]
FinlandTomas OtterströmPartner, AdvisoryT: +358207603665E: [email protected]
Matti AlpuaSenior Manager, Tax & LegalT: +358207603922E: [email protected]
FrancePhilippe ArnaudPartner, Audit IGHT: +33155686477E: [email protected]
GermanyLars BehrendtTax ServicesT: +49 40 32015 5855E: [email protected]
IndiaNabin BallodiaPartner – International Tax and RegulatoryT: +911243074321
+919810113710E: [email protected]
Sourav JainManager, Tax-CBT-IGH-DELT: +911203868000E: [email protected]
IndonesiaSanty DermawiAssistant Manager, DAT: +62215740877E: [email protected]
IrelandMichael HayesPartnerT: +353 1 410 1656E: [email protected]
ItalyPierMario BarzaghiPartner in Charge in Climate Change ServicesT: +3902676431E: [email protected]
JapanKazuhiko SaitoAssociate Partner, SUS-AssuranceT: +81335485303E: [email protected]
MalaysiaLianseng SohPartnerT: +603 7721 3388E: [email protected]
Emily Shiau Li WongDirectorT: +603 7721 3388E: [email protected]
MexicoDavid EscalanteEnergy Tax PartnerT: +52 81 8122 1884E: [email protected]
The NetherlandsSander DerksenSenior Tax ManagerT: +31 88 909 1046E: [email protected]
Contact information
© 2017 KPMG LLP, a Delaware limited liability partnership and the U.S. member firm of the KPMG network of independent member firms affiliated with KPMG International Cooperative (“KPMG International”), a Swiss entity. All rights reserved. The KPMG name and logo are registered trademarks or trademarks of KPMG International. NDPPS 655445

New ZealandErica MilesDirectorT: +64 9 363 3664E: [email protected]
PolandMarcin KawaManager, MCT: +48225281846E: [email protected]
PortugalRaquel PereiraManagerT: +351212487382E: [email protected]
Michael SantosPartnerE: [email protected]
Ricardo GirãoDirectorE: [email protected]
RomaniaGheorghita DiaconuDirector, EnvironmentalT: +40372377776E: [email protected]
RussiaNina GoulisPartner T: + 7 495 9374444E: [email protected]
Andrey ErmolaevDirectorT: + 7 (495) 9374444E: [email protected]
SingaporeHarvey KoenigPartner, TaxT: +65 6213 7383E: [email protected]
South AfricaMelanie Le RouxAssociate DirectorCorporate TaxT: +27 11 647 8813E: [email protected]
South KoreaOk-su LeeSenior ManagerT: +82 2 2112 3457E: [email protected]
SpainPatricia Reverter GuillotDirector, RC-IARCS-SustainabilityT: +34932532965E: [email protected]
SwedenIda LjungkvistManager, Tax Transparency and SustainabilityT: +46 70 850 97 83E: [email protected]
SwitzerlandLeopold EggersdorferConsultantT: +41 58 249 42 99E: [email protected]
TaiwanToy C.H. WangManager, Climate Change and SustainabilityT: +886281016666E: [email protected]
ThailandJohn AndesPartner, International Tax T: +66 2677 2430E: [email protected]
UkraineTaras KovalSenior Manager, Attorney at Law, Tax and LegalKPMG-Ukraine Ltd.T: +380 44 490 5507 Ext. 35293E: [email protected]
United Arab EmiratesRaajeev B. BatraPartner KPMG Lower GulfT: +971 565205375E: [email protected]
Rahul AroraSenior Consultant KPMG Lower GulfT: +971 43569790E: [email protected]
United KingdomDaniel WaltersAssistant Manager, NM Indirect North 1T: +44 121 3352499E: [email protected]
United StatesRichard BlumenreichPrincipal, TaxT: +1 202 533 3032E: [email protected]
Lynn AfemanManaging Director, TaxT: +1 202 533 3839E: [email protected]
VietnamThu Huong NguyenPartnerT: +8 44 3946 1600E: [email protected]
© 2017 KPMG LLP, a Delaware limited liability partnership and the U.S. member firm of the KPMG network of independent member firms affiliated with KPMG International Cooperative (“KPMG International”), a Swiss entity. All rights reserved. The KPMG name and logo are registered trademarks or trademarks of KPMG International. NDPPS 655445
111The KPMG Green Tax Index

kpmg.com/socialmedia
© 2017 KPMG LLP, a Delaware limited liability partnership and the U.S. member firm of the KPMG network of independent member firms affiliated with KPMG International Cooperative (“KPMG International”), a Swiss entity. All rights reserved. The KPMG name and logo are registered trademarks or trademarks of KPMG International. NDPPS 655445
© 2017 KPMG LLP, a Delaware limited liability partnership and the U.S. member firm of the KPMG network of independent member firms affiliated with KPMG International Cooperative (“KPMG International”), a Swiss entity. All rights reserved. Printed in the U.S.A. The KPMG name and logo are registered trademarks or trademarks of KPMG International. NDPPS 655445