the kidney in acromegaly: renal structure and function in ... · the kidney in acromegaly: renal...
TRANSCRIPT

The Kidney in Acromegaly: renal structure and function in patients
with acromegaly during active disease and one year after disease
remission.
RENATA S. AURIEMMA, MARIANO GALDIERO, MARIA C. DE MARTINO, MONICA DE LEO, LUDOVICA F.S. GRASSO, PASQUALE VITALE, ALESSIA COZZOLINO, GAETANO LOMBARDI, ANNAMARIA COLAO & ROSARIO PIVONELLO.
Department of Molecular and Clinical Endocrinology and Oncology (R.S.A., M.G., M.C.D.M., M.D.L.,
L.M.S.G., G.L., A.C., R.P.), University “Federico II”, Naples
Short Title
Renal Structure and Function in Acromegaly
Key Words
Acromegaly, GH, IGF-I, kidney, renal structure, renal function, creatinine clearance, calcium,
phosphorus, nephrolithiasis
Address for Correspondence:
Rosario Pivonello, MD, PhD Department of Molecular and Clinical Endocrinology and Oncology,
“Federico II” University via S. Pansini 5, 80131 Napoli, Italy �: +39-081-7464285 fax: +39-081-5465443 email [email protected]
ABBREVIATIONS: BMI= body mass index; SBP= systolic blood pressure; DBP= diastolic blood pressure; CrC= creatinine clearance; UFE= urea fractional excretion; NaFE= sodium fractional excretion; KFE= potassium fractional excretion; CaFE= calcium fractional excretion; PhFE= phosphorus fractional excretion; UAFE= uric acid fractional excretion; UCa= urinary calcium; UPh= urinary phosphorus; UOx= urinary oxalates; UHyd= urinary hydroxyproline; UBc= urinary bicarbonate; UCit= urinary citrate; mA= microalbuminuriA; NL= overt nephrolithiasis; µNL= micronephrolithiasis.
Page 1 of 25 Accepted Preprint first posted on 31 March 2010 as Manuscript EJE-10-0007
Copyright © 2010 European Society of Endocrinology.

1
ABSTRACT
Background: The GH/IGF-I axis is physiologically involved in regulation of electrolytes and water
homeostasis by kidneys and influences glomerular filtration and tubular reabsorption processes. The
aim of the study was to investigate renal structure and function in acromegalic patients during
active disease and disease remission.
Patients: Thirty acromegalic patients (15 males, 15 females), aged 32-70 years, entered the study.
Ten de novo patients had active disease whereas twenty patients showed disease remission 1 year
after medical treatment with SA (10 patients) or surgery (10 patients). Thirty healthy subjects,
matched for age, gender and body surface area (BSA) were enrolled as controls.
Results: Both in active (A) and controlled (C) patients, creatinine clearance (p<0.001), citrate
(p<0.05) and oxalate levels (p<0.001) were higher and whereas filtered sodium (p<0.001) and
potassium (p<0.001) fractional excretions were lower than in controls. Urinary calcium (p<0.001)
and phosphorus (p<0.05) levels were significantly increased compared to controls, and in patients
with disease control, urinary calcium (p<0.001) levels were significantly reduced compared to
active patients. Microalbuminuria was significantly increased in active patients (p<0.05) compared
to controlled patients and healthy control subjects. The longitudinal (p<0.05) and transverse
(p<0.05) diameters of kidneys were significantly higher than in controls. In all patients the
prevalence of micronephrolithiasis was higher than in controls (p<0.001) and was significantly
correlated to disease duration (r=0.871, p<0.001) and hydroxyproline values (r=0.639, p<0.001).
Conclusions: The results of the current study demonstrated that acromegaly affects both renal
structure and function. The observed changes are not completely reversible after disease remission.
Page 2 of 25

2
INTRODUCTION
GH and IGF-I are physiologically involved in the regulation of renal growth and function (1). GH
receptors, as well as IGF-I, IGF-II, IGF binding proteins (IGFBPs) and IGF receptors, are expressed
in adult rat kidney (2), where the GH/IGF-I system seem to exert an antidiuretic and antinatriuretic
effect together with a decrease of potassium excretion, as mainly demonstrated after acute
administration of recombinant GH (rGH) (2). In adult rats, GH, IGF-I and IGF-II receptors as well
as IGFBPs have been detected both in glomerular and tubular structures (2, 3), and chronic
administration of GH is associated with an increase in glomerular filtration rate (GFR), probably
mediated by IGF-I, and a transient decrease in urinary sodium and potassium excretion (4).
Distinctly from the cardio-respiratory and the gastrointestinal systems, kidney has been only
superficially investigated in acromegalic patients, so that little data are today available on renal
structure and function in acromegaly. In acromegalic patients, the exposure to chronic GH and IGF-
I levels have been found to induce an increase in renal plasma flow (RPF), glomerular filtration rate
(GFR) and renal size, with the effects on RPF and GFR being mediated by IGF-I (5). Recently,
Baldelli et al. reported a high prevalence of microalbuminuria in patients with acromegaly,
particularly those with diabetes mellitus or impaired glucose tolerance, finding a significant
correlation of urinary albumin excretion with disease duration and insulin sensitivity and of urinary
albumin/creatinine ratio with GH levels (6). No further study has investigated the effect of GH and
IGF-I excess on kidney.
This cross-sectional study aimed at investigating renal structure and function in acromegalic
patients during active disease and one year after disease remission, achieved by medical and/or
surgical treatment.
Page 3 of 25

3
PATIENTS
Fifty-eight consecutive acromegalic patients (33 males and 25 females, aged 31-70 years, mean
48.7±11.4 yrs) were admitted to our Department from January 1st 2005 to December 31st 2007. The
diagnosis of acromegaly was performed on the basis of the following criteria: 1) mean integrated
24-h GH was > 2.5 µg/L; 2) GH nadir was > 1.0 µg/L after an oral glucose tolerance test (oGTT); 3)
IGF-I was above the normal range adjusted for gender and age (7). Similarly, the achievement of
biochemical control of acromegaly was considered when: 1) mean integrated 24-h GH was < 2.5
µg/L; 2) GH nadir was < 1.0 µg/L after oGTT; 3) IGF-I was in the normal range adjusted for gender
and age (7). Systemic arterial hypertension and diabetes mellitus were diagnosed in 22 (37.9%) and
6 (10.3%) patients respectively in line with the International Guidelines Criteria (8, 9). Inclusion
criteria included: written informed consent, age > 18 years, diagnosis of active and/or controlled or
cured acromegaly in line with the international criteria proposed by Giustina et al (7). Treatment for
arterial hypertension and diabetes mellitus (10, 11) was considered an exclusion criteria, because it
might interfere with renal filtration and reabsorption processes, so that all hypertensive and
diabetics patients (28 pts, 48.3%) were excluded from the study. Acute or chronic renal disease was
also considered as an exclusion criterion.
The remaining 30 patients were enrolled in the study. The patient’s profile at the study entry is
reported in Table 1. Ten patients (33.3%) had active disease whereas twenty patients (66.6%)
showed clinical and biochemical control of acromegaly. All patients with active disease were
evaluated at diagnosis; among patients with controlled disease, 10 pts were evaluated 12 months
after transsphenoidal selective adenomectomy and 10 pts 12 months after the achievement of
disease control with SA treatment, so that they were defined responders to medical therapy with
SA. The characteristics of patients in each subgroup are reported in Table 2. None of the patients
showed secondary hormonal deficiencies or abnormal parathormone (PTH) or calcitonin (CT)
levels.
Page 4 of 25

4
Thirty healthy subjects, matched for gender (15 males and 15 females), age (47.2 ±11.3 years), and
BSA (1.91±0.10 m2) were considered as controls group. In all patients the spontaneous GH
secretion (as 6 blood samples at 30 minutes intervals) and IGF-I levels were measured.
All subjects were enrolled in the study after their written informed consent had been obtained. The
study was conducted in line with the Helsinki Declaration for studies in human subjects.
STUDY PROTOCOL
This is a case control cross-sectional study. All patients with acromegaly who were consecutively
admitted to our department and meet the inclusion criteria were enrolled in the study. All
parameters were recorded at diagnosis in 10 de novo patients, 12 months after the achievement of
disease control by surgery in 10 patients and 12 months after the achievement of disease control by
medical treatment with SA in 10 patients. At study entry, in both active and controlled patients
clinical parameters, including age, disease duration, height, weight and BMI, and hemodynamic
parameters, such as heart rate, SBP and DBP, were recorded. The standard urine analysis, as well as
the measurement of serum and urinary creatinine (Cr), urea (Ur), uric acid (UA), sodium (Na),
potassium (K), calcium (Ca) and phosphorus (Ph) levels were performed. Urinary hydroxyproline
(UHyd), citrate (UCit), bicarbonate (UBic) and oxalate (UOx), and microalbuminuria (mA) were
also evaluated. To investigate the glomerular filtration and tubular reabsorption function, creatinine
(CrC) clearance and renal fractional excretion (FE) of electrolytes, urea and uric acid were also
measured. In all patients, renal ultrasonography (US) was performed to evaluate kidney size and to
investigate the prevalence of nephrolithiasis (NL) and/or microlithiasis (mNL).
METHODS
Assays
In all patients and control subjects, body surface area (BSA) was calculated in line with DuBois
formula :BSA=0.007184 * (Height (cm) 0.725* Weight (kg)0.425. Both serum GH and IGF-I levels
Page 5 of 25

5
were measured by chemiluminescent immunometric assay using commercially available kits
(Immulite, DPC, Llamberis, UK). For GH assay, the sensitivity was 0.05 µg/L; the intra-assay and
inter-assay coefficient of variation (CV) were 5.3-6.5 % and 5.5-6.2% respectively. For IGF-I
assay, the sensitivity was 20 µg/L; the intra-assay and inter-assay CV were 3.1-6.1 % and 3.2-6.0 %
respectively.
The urine analysis, serum and urinary creatinine, electrolytes, uric acid and urea, as well as UCit
and Uox, and mA were measured by standard available procedures.
In order to guarantee an unique and repeatable method of urine collection and to minimize any
possible interference of water and dietary protein intake, both patients and controls have been
accurately trained. According to literature (12, 13) and taking into account that in acromegalic
patients body composition and lean/fat mass ratio are different from healthy subjects (14),
creatinine clearance was calculated by the following formula: [urinary creatinine (mg/dl) x 24 h
urinary volume (ml/min) / serum creatinine (mg/dl)]. In line with previous studies (15), electrolytes
fractional excretions were calculated by the following formula: [UV (mmol/L) x serum creatinine
(mg/dl)/ SV (mmol/L) x urinary creatinine (mg/dl)] x 100, where UV indicates the urinary values
and SV the serum values. Similarly, urea and uric acid excretion fraction was calculated by the
following formula: [UV (mg/dl) x serum creatinine (mg/dl)/ SV (mg/dl) x urinary creatinine
(mg/dl)] x 100.
Ultrasonographic study
Renal US was performed by a commercially available real-time machine. Scans were obtained by a
standard abdominal 7.5 MHz transducer. Multiple anatomic approaches, including supine and
decubitus views obtained in transverse and longitudinal planes, were used to study kidney structure.
The images were registered on magnetic supports and analyzed later. All US exams were performed
by the a single operator, blinded in respect to patient or control study. According to Middleton et al
Page 6 of 25

6
(16), overt NL and mNL was revealed by the presence of respectively hyperechoic areas ≥2.5 mm
and hyperechoic spots, detected in renal pelvis or calyces.
STATISTICAL ANALYSIS
Data were analyzed using SPSS Software for Windows, version 13.0 (SPSS, Inc., Cary, NC
package). Data are reported as Mean±SD. The comparison between the numerical data was made by
Kruskal-Wallis H test followed by Dunn’s test for the adjustment of multiple comparison. The
comparison between prevalence was performed by �2 test corrected by Fisher exact test when
necessary. The correlation study was done by calculating the Spearman’s correlation coefficients.
Significance was set at 5%.
RESULTS
The results of the present study are shown in Table 3.
Patients with active disease. CrC (p<0.001) was significantly increased, whereas sodium (NaFE,
p<0.001) and potassium (KFE, p<0.01) fractional excretions were significantly decreased compared
to controls (Fig. 1). UCa (p<0.001) and UPh (p<0.05) were significantly increased compared to
control subjects. UOx (p<0.001), UCit (p<0.05) and mA (p<0.05) levels were significantly
increased compared to controls. No significant difference was found in the remaining parameters
between active patients and controls. The US exams showed increased longitudinal (p<0.05) and
transverse (p<0.05) renal diameters (Fig. 2), and an increased prevalence of mNL (p<0.001, Fig. 3)
compared to controls.
Patients with controlled disease. Compared to healthy control subjects, CrC (p<0.001, Fig. 1),
UCa (p<0.05), UPh (p<0.001) and UOx (p<0.001) were significantly higher; NaFE (p<0.05) and
KFE (p<0.001) were significantly lower in patients with controlled disease (Fig. 1) whereas UCit
Page 7 of 25

7
and mA levels were similar in the two groups of subjects. Compared to active patients, UCa
(p<0.001), UPh (p<0.01), UCit (p<0.05) and mA (p<0.05) were significantly lower, whereas CrC
was only slightly but not significantly reduced whereas NaFe and KFE were slightly but not
significantly higher in patients with controlled disease. UOx levels were similar in the two groups
of subjects. Among patients with controlled disease, no significant difference was found in any
kidney function parameters between those treated by surgery and those treated by medical therapy
with somatostatin analogues. The US exams showed increased longitudinal (p<0.05) and transverse
(p<0.05) renal diameters (Fig. 2), as well as an increased prevalence of mNL (p<0.001, Fig. 3)
compared to controls., and not significant difference with the patients with active disease.
Correlations: In both active and controlled patients, the prevalence of µNL was significantly
correlated with disease duration (r=0.871, p<0.001) and UHyd values (r=0.639, p<0.001).
DISCUSSION
The main result of this study is that acromegaly is characterized by significant modifications of
renal structure and function.
As for the cardio-respiratory and gastrointestinal systems, the kidney is a target organ in
acromegaly. Kidneys have been reported to be heavier in acromegalic patients than in healthy
control subjects (2). Moreover, the administration of recombinant human (rh) IGF-I to rats has been
reported to induce selective hypertrophy of kidney, whereas elevated levels of circulating GH also
cause renal growth, inducing a gain in renal mass mediated by IGF-I (2). Many evidences in
literature have clearly demonstrated in human and rodents models that the exposure to endogenous
Page 8 of 25

8
or exogenous GH and IGF-I excess induces renal hypertrophy (17), causing the progressive
enlargement of glomeruli until glomerulosclerosis (18) and modulating cellular growth in proximal
tubule epithelia (19).
As expected, in patients with active disease renal size was significantly increased and persisted
increased also in patients with controlled disease. Together with the morphological changes, in
patients with active acromegaly several alterations, only partially reversible after disease remission,
were found in functional parameters. This observation confirms that the morphological and
functional abnormalities of kidney are only partially reversible after one year remission of
acromegaly. However, it is noteworthy that this short time of observation after disease remission
represents a clear limitation of the present study and could explain the partial reversibility described
in renal morphological and functional alterations. We cannot exclude that a longer time of
observation after the achievement of disease control might be associated to a more significant
reversibility of these changes in renal structure and function.
In the past, only few authors have investigated on the effects of the increase in GH and IGF-I levels
on the kidney. In previous studies, creatinine clearance has been found to be increased in patients
with acromegaly and decreased in patients with GH deficiency compared to healthy subjects (20,
21). In line with these previous reports, the results of the present study demonstrated a significant
increase in creatinine clearance, in both active and controlled patients compared to healthy subjects.
We hypothesized that the increase in kidney size might induce consequently an increase also in
renal plasma flow and glomerular filtration rate and tubular re-absorption, and so that to enhance
renal filtration and re-absorption processes. These data could also explain the alterations observed
in renal clearance and in electrolytes fractional excretions.
In particular, it is noteworthy that NaFE and KFE were found to be significantly reduced in both
active and controlled patients compared to controls. Two different theories have been proposed in
Page 9 of 25

9
the literature to explain the role of GH/IGF-I system in renal re-absorption regulation and water
homeostasis. Exposure to GH (22, 23) has shown in rats and human liver, brain and kidney to
increase the activity of Na-K-ATPase, which is the main responsible for the transepithelial NaCl
reabsorption. Recent studies (24, 25) have demonstrated in rats that the acute administration of rGH
induces the phosphorylation-mediated activation of the kidney specific Na, K and Cl co-transporter.
Due to this phenomenon, a greater NaCl and K re-absorption into the interstitium was described
(24, 25). In line with these studies, we found a significant decrease in NaFE and KFE in active
patients compared to controls. A role of the documented effect of GH and IGF-I on Na and K
transporters cannot be ruled out. However, interestingly, also controlled patients showed a
significant reduction in NaFE and KFE compared to control subjects. The reasons are not clear, but
we hypothesized that the persistently increased renal size and probably of glomerular and tubular
size may also explain the persistence of most electrolyte excretion, despite normalization of GH and
IGF-I levels in patients wit controlled disease. Alternatively, chronic exposure to GH and IGF-I
excess and prolonged disease duration might have altered the response of kidney to GH stimulation
and dissociate it from the physiological mechanisms. Finally, the possibility that a longer period of
time is necessary to observe a complete recovery of the physiological Na and K excretion cannot be
completely ruled out.
Hypercalciuria and hyperphosphaturia were also observed in active patients and partially persisted
in controlled patients. It is well known that acromegaly is associated with disturbances of calcium
and phosphorus metabolism and consequently with an increased risk of calcium stones (26, 27). In
the general population, the risk of nephrolithiasis is related to hypercalciuria, hyperoxalaturia and
hyperuricosuria but also to hypocitraturia (28). In acromegaly, both direct GH and indirect IGF-I
effects, PTH and vitamin D actions on bone have been described to be involved in the stimulation
of bone turnover, determining hypercalciuria and hyperphosphoremia (29). In our series, in active
patients, increased urinary calcium and phosphorus levels were associated with hyperoxaluria and
Page 10 of 25

10
hypercitraturia. Previous studies have demonstrated that hyperoxaluria is associated with an
increased predisposition to nephrolithiasis (30), whereas hypercitraturia seems to prevent it (31).
The simultaneous presence of hyperoxalaturia and hypercitraturia in our patients probably justified
the low prevalence of overt nephrolithiasis and the significant increase in the prevalence of
micronephrolithiasis that we observed in both active and controlled patients. Moreover, the results
of the present study demonstrated that in all patients microlithiasis was significantly correlated with
disease duration and urinary hydroxyproline levels. Lepszy et al (32) reported a significantly higher
urinary output of hydroxyproline in active acromegalic patients compared to healthy subjects. We
also found increased, although not significantly, levels of UHyd in active patients, whereas
controlled patients showed UHyd values similar to controls. Anyhow, the results of the current
study demonstrated that the changes if calcium and phosphorus excretion is significantly improved
and almost recovered in patients with controlled disease, probably because mainly dependent on
metabolic changes which revert with the normalization of GH and IGF-I after disease remission. Of
course, a higher prevalence of microlithiasis persists also in patients with controlled disease.
A significant increase in microalbuminuria was found in active patients. Microalbuminuria is
defined as 30-300 mg/day albumin excretion in urine (33) and is known to be related to endothelial
dysfunction (33) and associated with higher risk of cardiovascular disease morbidity and mortality
(34) in patients with metabolic syndrome. Previous literature reported a relationship between
microalbuminuria and renal injury in the presence of arterial hypertension (35) and/or insulin
resistance (36, 37). However, several studies in the literature (38-42) have described
microalbuminuria as an independent cardiovascular risk factor not only in diabetic and hypertensive
patients, but also in subjects without arterial hypertension, diabetes mellitus, ischemic heart disease
and renal injury so that to be defined “low risk” individuals. Furthermore, in USA and Europe
microalbuminuria has been described as a common finding respectively in at least 5% and 7% of
healthy general population (43). The precise pathophysiology associated with microalbuminuria is
Page 11 of 25

11
still unclear, although it may reflect the renal manifestation of a global abnormality of endothelial
function (43). In acromegaly, endothelial dysfunction has been reported as a common condition in
patients with and without metabolic complications (44). The presence of microalbuminuria has been
already associated with acromegaly, especially if complicated with glucose intolerance or diabetes,
and has been also described to normalize with disease remission (5) in line with the results of the
current study. In our series, prevalence of microalbuminuria was 13%. Moreover, the reason of the
significant increase microalbuminuria in our series is not clear, considering that all hypertensive and
diabetics patients have been excluded from statistical analysis. However, it could be interpreted as a
further consequence of renal functional and/or morphological changes observed in acromegalic
patients.
In conclusion, acromegaly is responsible for structure abnormalities and renal function impairment
because it induces increase in renal size together with increase in creatinine clearance, decrease in
sodium and potassium fractional excretion, hypercalciuria, hyperphosphaturia, increase in
microalbuminuria levels and high prevalence of micronephrolithiasis. These alterations seem to
revert only partially after the correction GH and IGF-I excess by treatment, independently on
medical or surgical therapy. Further studies on the effects of acromegalic disease treatment and
renal performance are mandatory.
ACKNOWLEDGEMENTS
This study did not receive any specific grant from any funding agency in the public, commercial or
not-for-profit sector
The authors declare that there is no conflict of interest that could be perceived as prejudicing the
impartiality of the research reported.
Page 12 of 25

12
REFERENCES
1. Cingel-Ristic V, Flyvbjerg A, Drop SL. The physiological and pathophysiological roles of the
GH/IGF-I-axis in the kidney: lessons from experimental rodent models. Growth Hormone and IGF
Research 2004 14(6) 418-30.
2. Feld S, Hirschgerg R. Growth Hormone, the insulin-like growth factor system, and the kidney.
Journal of Clinical Endocrinoogy and Metabolism 1996 5 423-80.
3. Reddy GR, Pushpanathan MJ, Ransom RF, Holzman LB, Brosius FC 3rd, Diakonova M, Mathieson
P, Saleem MA, List EO, Kopchick JJ, Frank SJ, Menon RK. Identification of the glomerular
podocyte as a target for growth hormone action. Endocrinology 2007 148 2045-55.
4. Dimke H, Flyvbjerg A, Frische S. Acute and chronic effects of growth hormone on renal regulation
of electrolyte and water homeostasis. Growth Hormone and IGF Research 2007 17 353-68.
5. Hirschberg R, Kopple JD. Effects of growth hormone and IGF-I on renal function. Kidney
International Supplement 1989 27 S20-6.
6. Baldelli R, De Marinis L, Bianchi A, Pivonello R, Gasco V, Auriemma RS, Pasimeni G, Cimino V,
Appetecchia M, Maccario M, Lombardi G, Pontecorvi A, Colao A, Grottoli S. Microalbuminuria in
insulin sensitivity in patients with growth hormone-secreting pituitary tumor. Journal of Clinical
Endocrinology and Metabolism 2008 93 710-14.
7. Giustina A, Barkan A, Casanueva FF, Cavagnini F, Frohman L, Ho K, Veldhuis J, Wass J, von
Werder K, Melmed S Criteria for cure of acromegaly: a consensus statement. Journal of Clinical
Endocrinology and Metabolism 2000 85 526-29.
8. Seventh Report of the Joint National Committee on Prevention, Detection, Evaluation, and
Treatment of High Blood Pressure. Hypertension (J Am Heart Ass) 2003 42 1206-52.
9. Global Guideline for Type 2 Diabetes: recommendations for standard, comprehensive, and minimal
care. Diabetic Medicine 2006 23(6) 579-93.
Page 13 of 25

13
10. Salcedo-Alejos M, Banda-Espinoza F, Rodriguez-Moràn M, Guerrero-Romero F. Irbesartan
reduces creatinine clearance in type 1 diabetic children with renal hyperfunction: a randomized,
double-blind, placebo-controlled trial. Nephrology Dialysis Transplantation 2005 20 2120-25.
11. Segura J, Praga M, Campo C, Rodicio JL, Ruilope LM. Combination is better than monotherapy
with ACE inhibitor or angiotensin receptor antagonist at recommended doses. Journal of Renin
Angiotensin Aldosterone System 2003 4 43-7.
12. Bauer JH, Brooks CS, Burch RN. Clinical appraisal of creatinine clearance as a measurement of
glomerular filtration rate. American Journal of Kidney Disease 1982 2 337-46.
13. Delanaye P, Cavalier E, Mariat C, Maillard N, Dubois BE, Krzesinski JM. Detection and estimation
of chronic kidney disease. Rev Med Liege 2009 64 73-8.
14. Moller N, Vendelbo MH, Kampmann U, Christensen B, Madsen M, Norrelund H, Jorgensen JO.
Growth hormone and protein metabolism. Clinical Nutrition 2009 28 597-603.
15. Swärd K, Valsson F, Sellgren J, Ricksten SE Differential effects of human natriuretic peptide and
furosemide on glomerular filtration rate and renal oxygen consumption in humans. Intensive Care
Medicine 2005 31 79-85.
16. Middleton WD, Dodds WJ, Lawson TL, Foley WD. Renal calculi: sensitivity for detection with US.
Radiology 1988 167 239-44.
17. Hammerman MR, Miller SB. Renal cellular biology of growth hormone and insulin-like growth
factor I. Paediatric Nephrology 1991 5 505-8.
18. Kawaguchi H, Itoh K, Mori H, Hayashi Y, Makino S. Renal pathology in rats bearing tumor-
secreting growth hormone. Paediatric Nephrology 1991 5 533-8
19. Blazer-Yost BL, Watanabe M, Haverty TP, Ziyadeh FN. Role of insulin and IGF-I receptors in
proliferation of cultured renal proximal tubule cells. Biochim Biophys Acta 1992 1133 329-35.
20. Hoogenberg K, Sluiter WJ, Dullaart RP. Effect of growth hormone and insuline-like growth factor I
on urinary albumin excretion: studies in acromegaly and growth hormone deficiency. Acta
Endocrinologica 1993 129 151-7.
Page 14 of 25

14
21. Manelli F, Bossoni S, Burattin A, Doga M, Solerte SB, Romanelli G, Giustina A Exercise-induced
microalbuminuria in patients with active acromegaly: acute effects of slow-release lanreotide, a
long-acting somatostatin analog. Metabolism 2000 49 634-9.
22. Ng LL, Evans DJ. Leucocyte sodium transport in acromegaly. Clinical Endocrinology (Oxf) 1987
26 471-80.
23. Shimomura Y, Lee M, Oku J, Bray GA, Glick Z Sodium potassium dependent ATPase in
hypophysectomized rats: response to growth hormone, triiodothyronine, and cortisone. Metabolism
1982 31 213-6.
24. Dimke H, Flyvbjerg A, Bourgeois S, Thomsen K, Frokiaer J, Houillier P, Nielsen S, Frische S
Acute growth hormone administration induces antidiuretic and antinatriuretic effects and increases
phosphorylation of NKCC2. The American Journal of Physiology - Renal Physiology 2007 292
723-35.
25. Kamenicky P, Viengchareun S, Blanchard A, Meduri G, Zizzari P, Imbert-Teboul M, Doucet A,
Chanson P, Lombès M. Epithelial sodium channel is a key mediator of growth hormone-induced
sodium retention in acromegaly. Endocrinology 2008 149 3294-305.
26. Pines A, Olchovsky D. Urolithiasis in acromegaly. Urology 1985 26 240-2.
27. Hielberg IP, Czepielewski MA, Ajzen H, Ramos OL, Schor N. Metabolic factors for urolithiasis in
acromegalic patients. Brazilian Journal of Medical Research 1991 24 687-96.
28. Park S, Pearle MS. Pathophysiology and management of calcium stones. Urologic Clinics of North
America 2007 34 323-34.
29. Parkinson C, Kassem M, Heickendorff L, Flyvbjerg A, Trainer PJ. Pegvisomant-induced serum
insulin-like growth factor-I normalization in patients with acromegaly returns elevated markers of
bone turnover to normal. Journal of Clinical Endocrinology and Metabolism 2003 88 5650-5.
30. Pak CY, Adams-Huet B, Pinodexter JR. Rapid communication: relative effect of urinary calcium
and oxalate on saturation of calcium oxalate. Kidney International 2004 66 2032-7.
Page 15 of 25
15
31. Caudarella R, Vescini F, Buffa A, Stefoni S Citrate and mineral metabolism: kidney stones and
bone disease. Frontiers in Biosciences 2003 8 1084-106.
32. Lepszy H, Irmscher K, Wiegelmann W, Solbach HG, Krüskemper HL. Urinary excretion of
hydroxyproline in acromegaly. Dtsch Med Wochenschr 1976 101 857-61.
33. Özkurt H. Frequency of microalbuminuria and its relationship with other atherosclerotic risk factors
in nondiabetic hypertensive patients. Anadolu Kardiyol Dergisi, 2007 7 224-6.
34. Klausen KP, Parving HH, Scharling H, Jensen JS. The association between metabolic syndrome,
microalbuminuria and impaired renal function in the general population: impact on cardiovascular
disease and mortality. Journal of Internal Medicine 2007 262 470-8.
35. Mangrum A, Bakris GL. Predictors of renal and cardiovascular mortality in patients with non-
insulin-dependent diabetes: a brief overview of microalbuminuria and insulin resistence. Journal of
Diabetes Complications 1997 11 352-7.
36. Reaven GM, Lithell H, Landsberg L. Hypertension and associated metabolic abnormalities – the
role of insulin resistance and the sympathoadrenal system. New England Journal of Medicine 1996
334 374-81.
37. El-Atat FA, Stas SN, McFarlane SI, Sowers JR. The relationship between hyperinsulinemia,
hypertension and progressive renal disease. Journal of American Society of Nephrology 2004 15
2816-27.
38. Yuyun MF, Khaw KT, Luben R, Welch A, Bingham S, Day NE, Wareham NJ. A prospective study
of microalbuminuria and incident coronary heart disease and its prognostic significance in a British
population: the EPIC-Norfolk study. American Journal of Epidemiology 2004 159 284-93.
39. Borch-Johnsen K, Feldt-Rasmussen B, Strandgaard S, Schroll M, Jensen JS. Urinary albumin
excretion. An independent predictor of ischemic heart disease. Arteriosclerotic and Thrombotic
Vascular Biology 1999 19 1992-7.
Page 16 of 25

16
40. Romundstad S, Holmen J, Kvenild K, Hallan H, Ellekjaer H. Microalbuminuria and all-cause
mortality in 2,089 apparently healthy individuals: a 4.4-year follow-up study. The Nord-Trøndelag
Health Study (HUNT), Norway. American Journal of Kidney Disease 2003 42 466-73.
41. Hillege HL, Fidler V, Diercks GF, van Gilst WH, de Zeeuw D, van Veldhuisen DJ, Gans RO,
Janssen WM, Grobbee DE, de Jong PE; Prevention of Renal and Vascular End Stage Disease
(PREVEND) Study Group. Urinary albumin excretion predicts cardiovascular and
noncardiovascular mortality in general population. Circulation 2002 106 1777-82.
42. Arnlöv J, Evans JC, Meigs JB, Wang TJ, Fox CS, Levy D, Benjamin EJ, D'Agostino RB, Vasan
RS. Framingham Heart Study, National Heart, Lung and Blood Institute, Bethesda, MD, USA.
Low-grade albuminuria and incidence of cardiovascular disease events in nonhypertensive and
nondiabetic individuals: the Framingham Heart Study. Circulation 2005 112 969-75.
43. Schmieder RE, Schrader J, Zidek W, Tibbe U, Paar WD, Bramlage P, Pittrow D, Bönm M. Low-
grade albuminuria and cardiovascular risk. What is the evidence? Clinical Research of Cardiology
2007 96 247-57.
44. Colao A, Ferone D, Marzullo P, Lombardi G. Systemic complications of acromegaly:
epidemiology, pathogenesis, and management. Endocrine Reviews 2004 25 102-52.
Page 17 of 25
17
LEGEND TO FIGURES
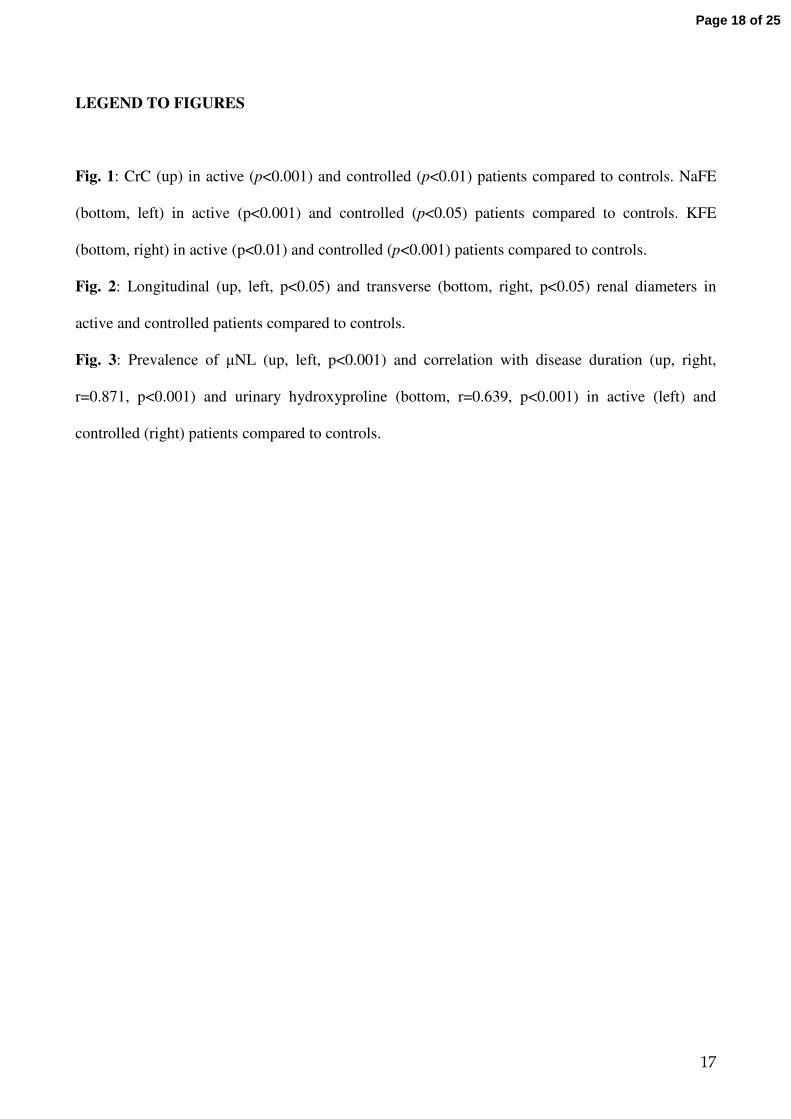
Fig. 1: CrC (up) in active (p<0.001) and controlled (p<0.01) patients compared to controls. NaFE
(bottom, left) in active (p<0.001) and controlled (p<0.05) patients compared to controls. KFE
(bottom, right) in active (p<0.01) and controlled (p<0.001) patients compared to controls.
Fig. 2: Longitudinal (up, left, p<0.05) and transverse (bottom, right, p<0.05) renal diameters in
active and controlled patients compared to controls.
Fig. 3: Prevalence of µNL (up, left, p<0.001) and correlation with disease duration (up, right,
r=0.871, p<0.001) and urinary hydroxyproline (bottom, r=0.639, p<0.001) in active (left) and
controlled (right) patients compared to controls.
Page 18 of 25

ACTIVE CONTROLLEDCONTROLS0
25
50
75
100
125
150
175
200
225 * *
Cre
ati
nin
e C
leara
nce (
ml/m
in)
Figure 1 Auriemma RS et al
ACTIVE CONTROLLEDCONTROLS0.0
0.2
0.4
0.6
0.8
1.0
1.2
* *NaEF
ACTIVE CONTROLLEDCONTROLS0
5
10
15
*
*KEF
Page 19 of 25

ACTIVE CONTROLLEDCONTROLS0
25
50
75
100
125
150
175
**
Lo
ng
itu
din
al
dia
me
ter
(mm
)
ACTIVE CONTROLLED CONTROLS0
25
50
75
100
125 * *
Tra
nsv
erse
dia
met
er (m
m)
Figure 2
Auriemma RS et al
Page 20 of 25

ACTIVE CONTROLLEDCONTROLS0
3
6
9
12
15
18 **
NL NO NL0
100
200
300
*
Dis
ease d
ura
tio
n (
mo
nth
s)
Figure 3
NL NO NL0
25
50
75*
IXP
NL NO NL0
10
20
30
40
50
60*
IXP
ACTIVE PTS CONTROLLED PTS
Auriemma RS et al
Prevalence of μNL
Page 21 of 25

Table 1: Patients and controls profile at the study entry1
PARAMETERS ACTIVE PATIENTS (A) CONTROLLED PATIENTS (B) CONTROLS (C) P-VALUE (A,B) P-VALUE (A,C) P-VALUE (B,C)
NUMBER OF PATIENTS 10 20 30 --- --- ---
AGE (years) 44.35±9.93 47.90±12.82 47.20±11.30 NS NS NS
WEIGHT (kg) 82.59±15.59 82.33±30.47 82.30±18.72 NS NS NS
BSA (m2) 2.01±0.30 1.98±0.26 1.96±0.10 NS NS NS
DISEASE DURATION (months) 124.86±47.9 152.88±42.89 --- <0.05 --- ---
SBP (mmHg) 127.06±14.01 122.28±15.86 121.33±22.23 NS NS NS
DBP (mmHg) 68.80±10.99 68.14±9.63 67.33±7.98 NS NS NS
HEART RATE (bpm) 71.03±8.97 69.15±7.36 75.80±9.86 NS NS NS
FASTING GLUCOSE (mg/dl) 91.07±19.14 89.95±26.81 88.13±21.98 NS NS NS
SERUM CREATININE (mg/dl) 0.76±0.19 0.83±0.26 0.80±0.10 NS NS NS
BMI= body mass index; SBP= systolic blood pressure; DBP= diastolic blood pressure.
Page 22 of 25

Table 2: Profile of patients in each subgroup at the study entry 1
PARAMETERS DE NOVO PTS (A)
OPERATED PTS
(B)
SA-RESPONDER PTS
(C)
P-VALUE
(A,B)
P-VALUE
(A,C)
P-VALUE
(B,C)
NUMBER OF PTS 10 10 10 --- --- ---
AGE (years) 42.26±8.44 42.85±8.82 52.45±9.39 NS NS NS
WEIGHT (kg) 85.01±16.18 85.50±17.34 78±10.89 NS NS NS
BSA (m2) 2.01±0.30 2.01±0.31 1.97±0.21 NS NS NS
DISEASE DURATION (months) 101.76±35.88 126.84±56.16 178.92±29.64 <0.05 <0.05 <0.05
SBP (mmHg) 129.26±15.13 124.0±15.16 126.0±11.73 NS NS NS
DBP (mmHg) 81.17±11.97 78.8±7.56 80.0±7.45 NS NS NS
HEART RATE (bpm) 71.3±9.28 75.2±9.54 67.5±6.02 NS NS NS
FASTING GLUCOSE (mg/dl) 98.56±16.45 84.80±9.98 98.8±13.83 0.01 NS 0.01
SERUM CREATININE (mg/dl) 0.76±0.18 0.81±0.17 0.72±0.17 NS NS NS
BMI= body mass index; SBP= systolic blood pressure; DBP= diastolic blood pressure.
Page 23 of 25
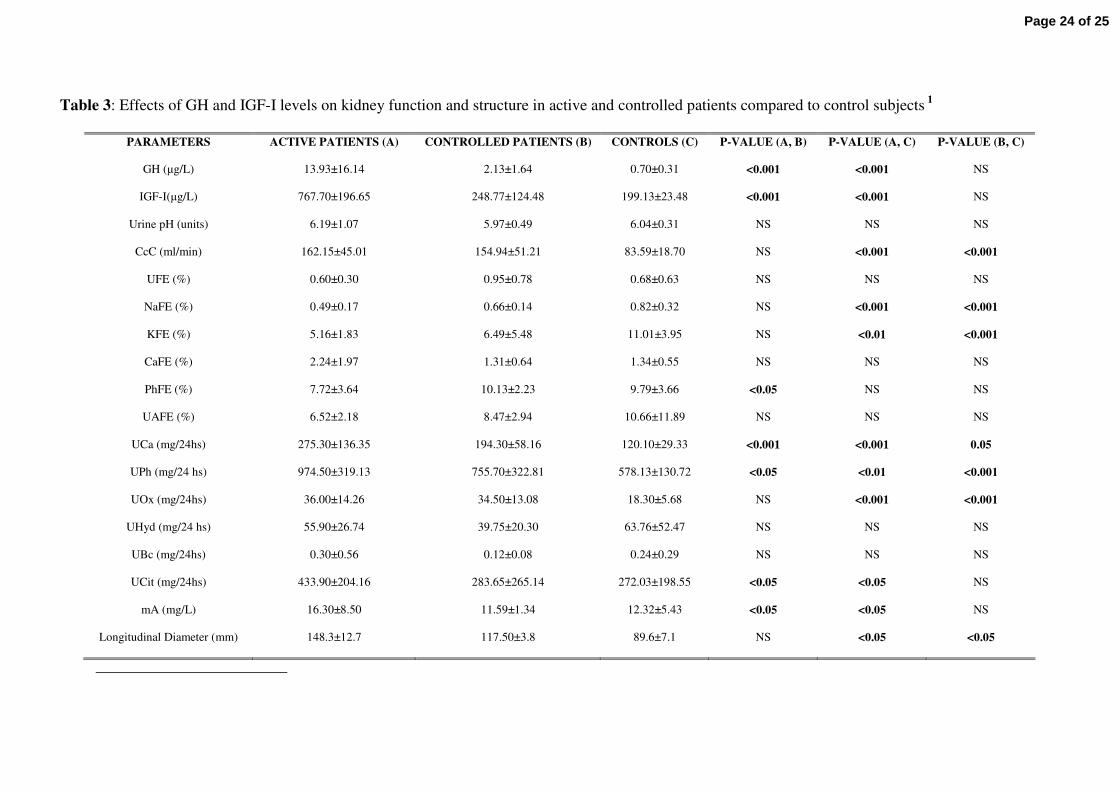
Table 3: Effects of GH and IGF-I levels on kidney function and structure in active and controlled patients compared to control subjects 1
PARAMETERS ACTIVE PATIENTS (A) CONTROLLED PATIENTS (B) CONTROLS (C) P-VALUE (A, B) P-VALUE (A, C) P-VALUE (B, C)
GH (µg/L) 13.93±16.14 2.13±1.64 0.70±0.31 <0.001 <0.001 NS
IGF-I(µg/L) 767.70±196.65 248.77±124.48 199.13±23.48 <0.001 <0.001 NS
Urine pH (units) 6.19±1.07 5.97±0.49 6.04±0.31 NS NS NS
CcC (ml/min) 162.15±45.01 154.94±51.21 83.59±18.70 NS <0.001 <0.001
UFE (%) 0.60±0.30 0.95±0.78 0.68±0.63 NS NS NS
NaFE (%) 0.49±0.17 0.66±0.14 0.82±0.32 NS <0.001 <0.001
KFE (%) 5.16±1.83 6.49±5.48 11.01±3.95 NS <0.01 <0.001
CaFE (%) 2.24±1.97 1.31±0.64 1.34±0.55 NS NS NS
PhFE (%) 7.72±3.64 10.13±2.23 9.79±3.66 <0.05 NS NS
UAFE (%) 6.52±2.18 8.47±2.94 10.66±11.89 NS NS NS
UCa (mg/24hs) 275.30±136.35 194.30±58.16 120.10±29.33 <0.001 <0.001 0.05
UPh (mg/24 hs) 974.50±319.13 755.70±322.81 578.13±130.72 <0.05 <0.01 <0.001
UOx (mg/24hs) 36.00±14.26 34.50±13.08 18.30±5.68 NS <0.001 <0.001
UHyd (mg/24 hs) 55.90±26.74 39.75±20.30 63.76±52.47 NS NS NS
UBc (mg/24hs) 0.30±0.56 0.12±0.08 0.24±0.29 NS NS NS
UCit (mg/24hs) 433.90±204.16 283.65±265.14 272.03±198.55 <0.05 <0.05 NS
mA (mg/L) 16.30±8.50 11.59±1.34 12.32±5.43 <0.05 <0.05 NS
Longitudinal Diameter (mm) 148.3±12.7 117.50±3.8 89.6±7.1 NS <0.05 <0.05
Page 24 of 25

Transverse Diameter (mm) 112.6±8.9 108.1±7.1 74.2±8.1 NS <0.05 <0.05
Prevalence of NL (%, nr) 10 (1/10) 10 (2/20) 16.6(5/30) NS NS NS
Prevalence of mNL (%, nr) 50 (5/10) 50 (10/20) 10 (3/30) NS <0.001 <0.001
CrC= creatinine clearance; UFE=urea fractional excretion; NaFE= sodium fractional excretion; KFE=potassium fractional excretion; CaFE= calcium fractional excretion; PhFE=phosphorus
fractional excretion; UAFE= uric acid fractional excretion; UCa= urinary calcium; UPh= urinary phosphorus; UOx= urinary oxalates; UHyd= urinary hydroxyproline; UBc= urinary
bicarbonate; UCit= urinary citrate; mA= microalbuminuriA; NL= overt nephrolithiasis; µNL= micronephrolithiasis.
IGF-I NORMAL RANGE
In < 25, 26-30, 31-35, 36-40, 41-45, 46-50, 51-55, 56-60, 61-65, 66-70 and > 70 yr old males and females IGF-I is 116-358, 117-329, 115-307, 109-284, 101-267, 94-252, 87-238, 81-225, 75-
212, 69-200, 64-166 µg/L, respectively.
Page 25 of 25