the journal of biological chemistry vol … · department of biological chemistry, johns hopkins...
TRANSCRIPT

THE JOURNAL OF BIOLOGICAL CHEMISTRY 0 1991 by The American Society for Biochemistry and Molecular Biology, Inc.
Vol . 266, No. 31, Issue of November .5, PP . 21197-21201,1991 Printed in U. S A .
Mitochondrial ATP Synthase QUATERNARY STRUCTURE OF THE F1 MOIETY AT 3.6 A DETERMINED BY X-RAY DIFFRACTION ANALYSIS*
(Received for publication, July 22, 1991)
Mario Bianchet, Xavier Ysern, Joanne Hullihen, Peter L. Pedersen, and L. Mario AmzelS From the Department of Biophysics and Biophysical Chemistry and the Laboratory for Molecular and Cellular Bioenergetics, Department of Biological Chemistry, Johns Hopkins University School of Medicine, Baltimore, Maryland 21205
The F1 moiety of the mitochondrial ATP synthase is composed of five different subunits with stoichiometry a&&c and exhibits the capacity to synthesize ATP from ADP and Pi. We have previously crygtallized rat liver F1 and described its structure at 9-A resolution (Amzel, L. M., McKinney, M., Narayanan, P., and Ped- ersen, P. L. (1982) Proc. Natl. Acad. Sci. U. s. A. 79, 5852-5856). Here we present an x-ray map of this complex enzyme at 3.6 A, which provides a much more informative description of its quaternary structure.
The overall pimensions of the F1 molecule are 120 di X 120 di X 74 A. The enzyme exhibits %fold symmetry relating the three copies of each of the two major subunits, a and 8. As the a subunits (but not the #? subunits) contain cysteine residues, it has been possible to identify the a subunits by heavy atom labeling with mersalyl and to relate their positions in the F1 molecule to the #? subunits. Significantly, the a and /3 subunits each exist as trimeric arrays which are organized in two slightly offset, interdigitated layers along the 3- fold axis. In one trimeric layer the a subunits are located close to the axis with homologous subunits in- teracting with each other; in the other trimeric layer the B subunits are far from the axis, and they interact only with a subunits and not with one another. At one end of the structure, part of the interface between each a and #? subunit encloses a space or “pocket” that is accessible to the solvent; at the other end the interfaces between the subunits are more open and exposed.
The present work represents the highest resolution map reported to date for the F1 moiety of an ATP synthase complex.
The membranes of bacteria, chloroplasts, and mitochondria contain ATP synthases that utilize the electrochemical H’ gradients generated across their membranes for the formation of ATP (for reviews see Refs. 1-6). ATP synthases from all such systems are composed of two main sectors: the integral membrane portion Fo and the membrane-associated portion F1; the Fl portion contains all the catalytic and nucleotide- binding sites. The lack of atomic structural information about the ATP synthase has become one of the major roadblocks in
* This work was supported by National Institutes of Health Grants GM 25432 (to L. M. A.) and CA 10951 (to P. L. P.). The costs of publication of this article were defrayed in part by the payment of page charges. This article must therefore be hereby marked “aduer-
this fact. tisement” in accordance with 18 U.S.C. Section 1734 solely to indicate
$ TO whom correspondence should be addressed: Dept. of Biophys- ics and Biophysical Chemistry, Johns Hopkins University School of Medicine, 725 N. Wolfe St., Baltimore, MD 21205-2185.
understanding ATP synthesis. Both the Fo and the Fl are multisubunit proteins, and the sequences of all subunits of both have been determined in many species. In all species studied, F1 has five different subunits with stoichiometry as&@. The total number of residues in each subunit is: a, 509-513; p, 459-480; y, 272-286; 6,177-190; and t, 132-146.
Since the identification of the Fl portion as a structure protruding from the inner mitochondrial membrane, numer- ous studies utilizing electron microscopy have been reported (7-13). In addition, cryoelectron microscopy has provided excellent images of unstained molecules, as well as of com- plexes of F1 with monoclonal antibodies to individual subunits (14, 29). However, detailed atomic information about the complex structure of the ATP synthase necessary for mech- anistic understanding can only be obtained by x-ray crystal- lography. In previous studies, we have reported tbe crystalli- zation of rat liver Fl (15) and an x-ray model at 9-A resolution (16). In this papFr we present a revised model based on the extension to 3.6-A resolution of our previous work.
MATERIALS AND METHODS
Purification and Crystallization-The F, moiety of the ATP syn- thase was purified from rat liver mitochmdria as described previously (17). Crystals were obtained by ammonium sulfate precipitation in the presence of ATP (15). Crystals approximatly 0.5 mm in size were obtained in some experiments. The crystals used in this paper were described previously (15) and belong to space group R32 with hexag- onal cell dimensions of a = b = 146 A; c = 368 A.
Data Collection-Data sets in this study were collected utilizing a variety of sources and detection media. The data contain mainly reflections measured with the multiwire area detector system of the facility of the University of California at S?n Diego. This data set, however, contains few reflections past 3.9 A. Data between 3.9 and 3.6 A were measured from films recorded at CHESS (Cornell High Energy Synchrotron Source). Films were digitized with an Optronics microdensitometer and processed with the package Scan 12 (18). Post-refinement was carried out with the program POSTREF (19). Structure factors from the two sources were scaled using reflections of intermediate resolution. In the final set, the reflections from the area detector set were used unmerged to 3.9-A Tesolution, and the synchrotron data were used between 3.9 and 3.6 A.
Heauy Atoms-Heavy atoms were prepared as described previously, by soaking preformed F, crystals in solutions of mother liquor con- taining from 0.1 to 1 mM of the selected compounds. Screening of promising compounds was done using precession photographs. Data for the heavy atoms were collected and processed by one of the methods described above, then carefully scaled to the native data; the average values of 1 A F I = I FHp - F p I were analyzed as a function of their position in reciprocal space, and, when necessary, local scaling (20) was performed either by the methods suggested by Hendrickson and Teeter (21) or by algorithms developed by us.’ The AF Patterson functions were analyzed manually or using automatic procedures. The heavy atom parameters were refined by least-squares procedures first using centric data and then using all the observed reflections.
L. M. Amzel, unpublished data.
21197
21198 Structure of the ATP Synthase Fl Moiety ut 3.6 A Location of Additional Heavy Atom Sites-To locate additional
heavy atom sites when less than 50% of the heavy atom scattering power was known, we implemented a method based on a suggestion.’ The structure factor of a structure for which only some of the atoms are known can be considered as the contribution of the known (k) and the unknown (u) atoms. That is,
Nk Fh = f , exp2nihxj + Cf, exp2nihq
N u
J= 1 j=l
where N k is the number of known and Nu the number of unknown atoms. For reflections with very small observed F,
Fh 2 0
and, therefore, for these reflections with small observed Fs ( U s for heavy atoms),
Nu f , exp2nihxj P - f , exp2nihxj.
Nk
J=1 j=1
A Fourier map computed with the negative of the calculated phased Fs of those reflections having small observed F should have as the main peaks the positions of the unknown atoms. These maps can be analyzed directly, or they can be combined with the map of the known part to give the known and the unknown portion of the structure.
Phase Calculation and Phase Improvement-Initial phases were calculated by the method of Blow and Crick (22) using three heavy atom derivatives: mersalyl, platinum, and gold. The phases were improved using alternate cycles of heavy atom parameter refinement and phase calculation. Further phase improvement was achieved by solvent flattening/negative truncation using the procedure described by B. C. Wang (BCW procedure (23)). For the first cycle, the mask calculated as part of the BCW procedure was replaced by a mask based on packing considerations (see below).
Generation of the Packing Mask-In these hexagonal crystals, two F, molecules can be inscribed in a 146-A diameter sphere located at the intersection of the 3-fold and the 2-fold axes. This information was used in two ways: to confirm the heavy atom solutions and to introduce the initial solvent regions in the BCW procedure (23). A mask was generated containing “protein” inside 146-A spheres cen- tered at all the lattice points of the hexagonal cell, (O,O,O), (1/3, 2/3, 1/3), and (2/3, 1/3, 2/3), and “solvent” outside the spheres. The Fourier transform of the packing mask was calculated using a modi- fication of the BCW package.
Model Building and Phase Improvement-Atomic models were built using the program FRODO ((24) Rice version) on an Evans & Sutherland PS390. Initial fitting was performed using main chain atoms and only the Cp of the side chains so that the regions built had a polyalanine sequence. Many helices (distinctly visible in the electron density) were built first, followed by some regions of less defined secondary structure. After more than 400 alanine residues had been built, the coordinates were refined using PROLSQ (28), and the calculated phases were combined with those from the BCW procedure using the program SIGMAA (25). SIGMAA was explicitly designed to give the appropriate weights to calculated phases even in cases where less than 50% of the atoms are included in the structure factor calculations. Maps calculated with the new phases were then used for model building, and the process was repeated through several cycles of model building, positional refinement, structure factor cal- culation, and phase combination.
Refinement of Atomic Coordinates-All intermediate coordinate sets as well as that of the final model were refined using the program PROLSQ. The weights of the geometrical constraints were similar to those we used previously (26). The weights for the structure factors were derived from the adjustment of ( (Fo - FJ’) versus sin(O)/A to the expression provided by the program. No constraints were applied to maintain the geometry of secondary structure elements.
RESULTS AND DISCUSSION
The heavy atom solutions obtainet at low resolution gave poor statistics when extended to 3.6 A. Even if the extension was performed gradually, it was very difficult to find satisfying solutions when all the data were included. Following a sug- gestion of J. Karle,’ we utilized a procedure (described above)
J. Karle, personal communication.
that allowed us to find all the heavy atom sites starting with the major site of the low resolution solutions. The procedure indicated the presence of several additional sites in each derivative that significantly improved the heavy atom statis- tics. Although this procedure worked remarkably well, heavy atom positions were accepted only after thorough least- squares refinement minimizing the differences between 1 (FHp
- FP) I and IfH I, the calculated heavy atom structure factor. The final solutions of all the heavy atoms used are presented in Table I. The phases calculated with these positions had an average figure of merit of 0.57. The electron density map calculated with these phases had many features that could be readily interpreted as helices, but it had very poorly defined boundaries between protein and solvent. In addition, we found it difficult to obtain an acceptable mask from this map using the BCW procedure and programs. These difficulties were overcome using packing considerations. The lattice of the F1 crystals is very nearly a close packed face-centered cubic lattice ( X ) , such that at each lattice point (at the intersection of three 2-fold axes with a 3-fold axis) two F1 molecules can be circumscribed in a sphere of 146 A in diameter. We decided to use such a sphere as the initial definition of protein and solvent areas.
Before the mask based on the packing of spheres was used, its compatibility with the heavy atom solutions was tested. The Fourier transform of the mask was computed, and the phases were used to calculate a heavy atom difference map with coefficients (FHp - Fp). The difference maps calculated for the mersalyl derivative showed several peaks of high electron density that could be interpreted as the positions of the major heavy atom sites and their enantiomorph. (The presence of the enantiomorph is a consequence of the centro- symmetric nature of the phases calculated with a sphere at the origin of the cell.) After this test the mask was used only in real space, as the initial filter of the electron density map calculated with the heavy atom phases.
The procedure of BCW (23) was used with the following modifications for the initial phase improvement. 1) The first electron density map was calculated with phases obtained with multiple heavy atom derivatives; 2) the first mask used was obtained from packing considerations; and 3) the phases obtained by transforming the initial masked map were com- bined with the single isomorphous replacement phases of the mersalyl derivative and the procedure continued in the usual way. This protocol was judged to give the best results following extensive experimentation. Before using the packing mask,
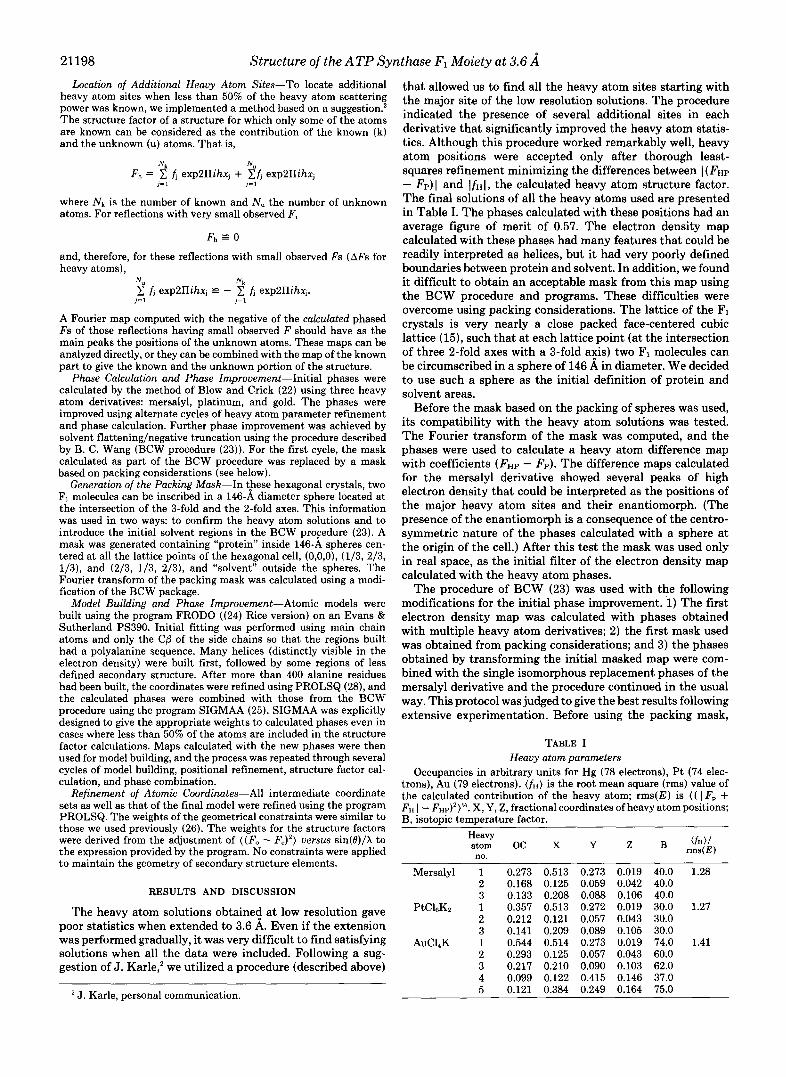
TABLE I Heavy atom parameters
Occupancies in arbitrary units for Hg (78 electrons), Pt (74 elec- trons), Au (79 electrons). ( f ~ ) is the root mean square (rms) value of the calculated contribution of the heavy atom; rms(E) is ( ( I Fp + FH I - FHp)’)“. X, Y, Z, fractional coordinates of heavy atom positions; B, isotopic temperature factor.
Heavy atom OC X Y no.
( f H ) / rms(E)
Mersalyl 1 2 3
PtC16Kz 1 2 3
AuCllK 1 2 3 4 5
0.273 0.168 0.133 0.357 0.212 0.141 0.544 0.293 0.217 0.099 0.121
0.513 0.125 0.208 0.513 0.121 0.209 0.514 0.125 0.210 0.122 0.384
0.273 0.059 0.088 0.272 0.057 0.089 0.273 0.057 0.090 0.415 0.249
0.019 0.042 0.106 0.019 0.043 0.105 0.019 0.043 0.103 0.146 0.164
40.0 1.28 40.0 40.0 30.0 1.27 30.0 30.0 74.0 1.41 60.0 62.0 37.0 75.0
Structure of the ATP Synthase Fl Moiety at 3.6 A 21199
we attempted to generate masks using the standard procedure proposed and implemented by Wang (23); the minimum value of the density, the solvent content, the radius of averaging, and the number of passes were tested in several combinations. In all cases, the masks were too “choppy,” containing islands of solvent inside regions that were clearly protein; the use of the packing mask for only one cycle solved this problem. We tested the packing mask with SIR maps based on the mersalyl derivative as well as with multiple isomorphous replacement maps based on all the heavy atom derivatives; the results using the multiple isomorphous replacement map were clearly superior. The distribution of density values inside and outside the mask indicated that the multiple isomorphous replace- ment map had better discrimination between protein and solvent. However, for further cycles of phase improvement and mask calculation, the single isomorphous replacement phases appeared to converge faster, as suggested by Wang (23). For these cycles we paid special attention to the param- eter that establishes the ratio between the average solvent density and the maximum protein density. This parameter determines the value of Fooo/V and, more importantly, deter- mines which density points within the protein have negative density and so are set to zero by the program. Having too few points in this class lessens the improvement that results from the density modification, while having too many points in this class renders the procedure unstable. For the F1 crystals, values that modify between 12 and 18% of the points in the protein region give the best results.
After the parameters for density modification were opti- mized, five cycles of phase improvement were carried out for each of 15 successive masks. The final phases used for the calculation of the electron density map have an average figure of merit of 0.77. It should be emphasized that these phases are (as is the case in the straightforward application of the BCW procedure) strongly dominated by the bimodal proba- bility distributions of the heavy atom phases. Wang (23) suggests that the density modification procedure has mainly the effect of choosing between the two phases in the heavy atom distribution. The procedure we utilized in no way changes this characteristic of the algorithm; it simply utilized a modified mask for the first density modification cycle. The final map contains all the interpretable portions of the origi- nal heavy atom map, but it is cleaner and easier to interpret.
A rhombohedral cell with hexagonal cell dimensions such that c/a = J 6 corresponds to a face-center cubic lattice with acubic = J 2 ahex. Such a lattice is found in the face-center cubic close packed arrangement of spheres of diameter equal to ahex
(15,16, 27). The ratio between the hexagonal cell dimensions c and a in the F1 crystals is 2.52, very close to 2.45, the value of J6. The packing in the Fl crystals can then be approxi- mated by spheres of 146 A in diameter located at the lattice points of a face-center cubic cell with & h i c = 207 A. Each approximate sphere is centered at the intersection of a 3-fold with three 2-fold axes and contains two F1 molecules related by the %fold axes of symmetry. Both molecules sit on the 3- fold, one above and one below the plane formed by the 2-fold axes; since Fl has stoichiometry a3P3y6t the asymmetric unit of the crystal must contain one a, one 8, and one-third of each of the minor subunits y, 6 , and t. The sequences of the minor subunits do not show triplicate internal repeats leaving only one possible explanation: these subunits must be disor- dered in the Fl crystals. Packing and other considerations suggest that these subunits are located at the center of the spheres, close to the intersection of the 3- and the 2-fold axes. In this location, once two F1 molecules interact to form one of the packing spheres (a dimer of F1 molecules) the disordered
minor subunits would be on the inside and would not partic- ipate in any further packing contacts.
About 400 residues belonging to a-helical structures were easily identified in the electron density and were built using main chain atoms plus the @carbons (polyalanine sequences). Although the map contained many additional interpretable regions, the building was interrupted, and coordinates of these 400 residues were refined using PROLSQ (28); phases calcu- lated with the resulting coordinates were combined with the heavy atom phases using the program SIGMAA (25). The new, improved map was used to build additional chain. After approximately 100 additional residues were built, all the co- ordinates were refined and the procedure repeated until the backbone of 900 amino acids had been built. The crystallo- graphic R factor for these residues was 37%.
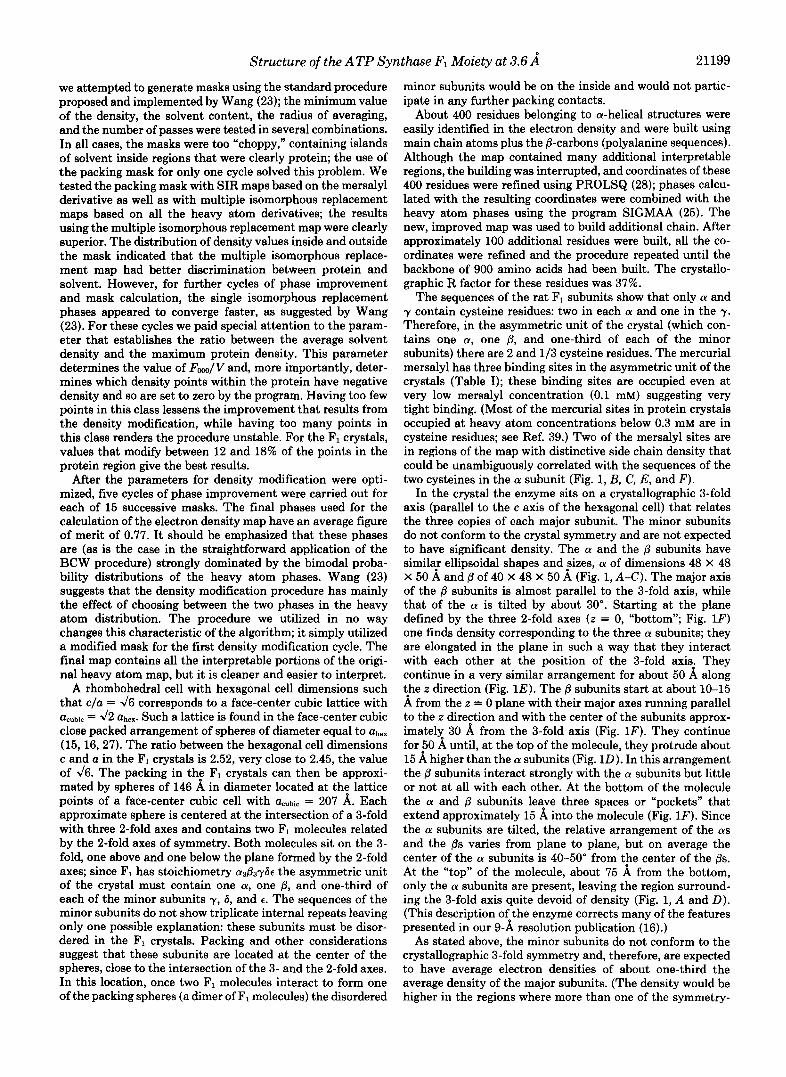
The sequences of the rat F1 subunits show that only a and y contain cysteine residues: two in each a and one in the y. Therefore, in the asymmetric unit of the crystal (which con- tains one a, one /3, and one-third of each of the minor subunits) there are 2 and 1/3 cysteine residues. The mercurial mersalyl has three binding sites in the asymmetric unit of the crystals (Table I); these binding sites are occupied even at very low mersalyl concentration (0.1 mM) suggesting very tight binding. (Most of the mercurial sites in protein crystals occupied at heavy atom concentrations below 0.3 mM are in cysteine residues; see Ref. 39.) Two of the mersalyl sites are in regions of the map with distinctive side chain density that could be unambiguously correlated with the sequences of the two cysteines in the a subunit (Fig. 1, B, C, E, and F ) .
In the crystal the enzyme sits on a crystallographic %fold axis (parallel to the c axis of the hexagonal cell) that relates the three copies of each major subunit. The minor subunits do not conform to the crystal symmetry and are not expected to have significant density. The a and the /3 subunits have similar ellipsoidal shapes and :izes, a of dimensions 48 X 48 X 50 A and /3 of 40 x 48 x 50 A (Fig. 1, A X ) . The major axis of the /3 subunits is almost parallel to the 3-fold axis, while that of the a is tilted by about 30”. Starting at the plane defined by the three %fold axes ( z = 0, “bottom”; Fig. 13’) one finds density corresponding to the three a subunits; they are elongated in the plane in such a way that they interact with each other at the position of the %fold axis. They continue in a very similar arrangement for about 50 8, along the z direction (Fig. 1E). The ,8 subunits start at about 10-15 8, from the z = 0 plane with their major axes running parallel to the z direction and with the center of the subunits approx- imately 30 A from the %fold axis (Fig. 1F). They continue for !O A until, at the top of the molecule, they protrude about 15 A higher than the a subunits (Fig. 1D). In this arrangement the /3 subunits interact strongly with the a subunits but little or not at all with each other. At the bottom of the molecule the a and /3 subunits lefve three spaces or “pockets” that extend approximately 15 A into the molecule (Fig. 1F). Since the a subunits are tilted, the relative arrangement of the as and the /3s varies from plane to plane, but on average the center of the a subunits is 40-50” from t$e center of the ps. At the “top” of the molecule, about 75 A from the bottom, only the a subunits are present, leaving the region surround- ing the 3-fold axis quite devoid of density (Fig. 1, A and D). (This description otthe enzyme corrects many of the features presented in our 9-A resolution publication (16).)
As stated above, the minor subunits do not conform to the crystallographic %fold symmetry and, therefore, are expected to have average electron densities of about one-third the average density of the major subunits. (The density would be higher in the regions where more than one of the symmetry-

2 1200
FIG. 1. Overall views of the qua- ternary structure of the rat liver Fa- ATPase. Ca atoms are representeg by the dot surface of a sphere 3.5 A in radius; the molecules are viewed with the /3 subunits at the “top.” A and C, p and a subunits, respectively, as present in the complex. B, the complete complex combining the f l subunits on to of the a subunits; D-F, three slices (30 thick) through the F1 molecule. On the top (D), mostly the f i subunits are present. In the middle ( E ) , the a and subunits com- pletely fill a region with a 60 A radius. At the “bottom” (F), the a subunits ra- diate from the center while the 0s are only present at the top of the slice and occupy the spaces between the as. Three “pockets” are formed between the a and /3 subunits. The positions of the sites occupied by the mercurials are indicated by smaller spheres of a different color.
Structure of the ATP Synthase Fl Moiety at 3.6 A I
I
generated images overlap.) We analyzed very carefully the regions of the map where the subunits are most likely to occur (close to the intersection of the %fold and the 2-fold axis) looking for indications of low or discontinuous density. This region (assigned presently as part of the a subunit) contains very significant density that can be interpreted with portions of chain that are contiguous with other parts of the molecule. I t appears unlikely, although possible, that this portion of the a subunit (the regions containing heavy atom site 2 and at the center of the molecule in Fig. IF) is actually a part of the minor subunits.
Comparison of the amino acid sequences of the a and the /3 subunits shows weak but significant homology (3, 30). In addition, the sequences of both the a and 0 subunits show similarities with adenylate kinase, including the two consen- sus regions A and B thought to be involved in nucleotide binding (3, 30, 31). Many of the previous proposals for the quaternary structure of the Fl emphasize a hexagonal arrange- ment of the a and j3 subunits (7-14). The implied 6-fold symmetry in these proposals is such that equivalent regions (ie. consensus motifs) of a and 0 subunits can only be
spatially close at the center of the molecule. Therefore, in this type of hexagonal model direct interaction of nucleotide- binding domains of a and the /3 subunits, assuming they occur, could only exist close to the %fold axis. In contrast, in the model we report here the F, molecule is formed by the $fold repetition of one a//3 pair. The relation between the a and the 0 subunits in each pair is such that equivalent regions of the two subunits (perhaps the nucleotide-binding sites of a and 0) can be close to each other in the structure. Such an interaction could result in the formation of a combined cata- lytic site (32) or may involve cooperation of a regulatory site in the a subunit with a catalytic site in (33).
One of the cysteine residues identified (corresponding to mercurial site 1 in Table I and in Fig. 2) is close, both spatially and in sequence, to the glycine-rich loop that is thought to be involved in binding one or more of the ATP phosphates. That cysteine is on the surface of the a subunit and is close to the interface with a 0 subunit (Fig. 2). Titration of this cysteine with mercurials may be responsible for the inhibitory effects of mercurials on the bicarbonate-stimulated catalytic activity of the liver enzyme (34).

Structure of the ATP Synthase Fl Moiety ut 3.6 A 21201
68, Biochemical Society Publishers, London 8. Tiedge, H., Schafer, G., and Mayer, F. (1983) Eur. J. Biochem.
9. Tsuprun, V. L., Mesyanzhinova, I. V., Koslov, I. A., and Orlova,
10. Boekema, E. J., Berden, J. A., and van Heel, M. G. (1986)
11. Wakabayashi, T., Kubota, M., Yoshida, M., and Kagawa, Y.
12. Gogol, E. P., Lucken, U., Bork, T., and Capaldi, R. A. (1989)
13. Yoshimura, H., Endo, S., Matsumoto, M., Nagayama, K., and
2. Simp1ified representation Of the F1 ATPase. The 14. Gogol, E. P., Aggeler, R., Sagermann, M., and Capaldi, R. A. important features of the present model are schematically repre- sented; the correct overall shape, the arrangement of as and Os, and 15. L. M., and pedersen, p. L. (1978) J. ~ i ~ l . chm. 253 , the positions of the heavy atoms (I, 2, and 3 refer to the numbers of the heavy atom positions in Table I). 16. Amzel, L. M., McKinney, M., Narayanan, P., and Pedersen, P.
L. (1982) Proc. Natl. Acad, Sci. U. S. A. 79,5852-5856 Finally, it should be noted that many other important 17. Catterall, W. A., and Pedersen, P. L. (1971) J. Biol. Chem. 2 4 6 ,
132,37-45
E. V. (1984) FEBS Lett. 167 , 285-289
Biochim. Biophys. Acta 8 6 1 , 353-360
(1977) J. Mol. Biol. 117 , 515-519
Biochemistry 28,4709-4716
Kagawa, Y. (1989) J. Biol. Chem. 106,958-960
(1989) Biochemistry 28,4717-4724
2067-2069
ATPases Or ATP-dependent enzymes have two ATP- 18. Crawford, J. (1977) Ph.D. thesis, Harvard University
tures. These include all other F-type ATPases, all V-type ATPases, the multidrug-resistant protein, many mukidrug- 20. Matthews, B. S., and Czeminski, E. W. (1975) Acta Crystallogr.
Crystallogr. A36.901-911
resistant-like bacterial transporters, the UvrA ATPase in- A 3 1,480-487 valved in DNA repair, and cystic fibrosis transmembrane 21. Henhickson, w. A., and Teeter, M. M. (1981) Nature 290,107-
conductance (see 35-38)* It is particularly 22. Blow, D. M., and Crick, F. H. C. (1959) Acta Crystallogr. A21, important to establish whether a direct interaction between the two ATP domains in these proteins is required for optimal 23. Wang, B.-c. (1985) Methods ~ ~ ~ ~ ~ l , 115,90-112 function. The results reported here for the FI moiety of the 24. Jones, T. A. (1978) J. Appl. Crystallogr. 11,268-272 ATP synthase and more detailed future studies on this system 25. Read, R. J. (1986) Acta Crystallogr. A42,140-149
enzymes involved in energy coupling.
4987-4994
binding domains in different regions Of their primary strut- 19. Winkler, F, K., Schutt, C. E., and Harrison, S. C. (1979) Acta
110
794-802
may have relevance to the mechanism of action of numerous 26. Bryant, S- H.7 Amzel, L. M.9 PhyzackerleY, R. P.9 and Poljak, R.
27. Guinier, A. (1952) in X-ray Crystallographic Techrwlogy, pp. 74- J. (1985) Acta Crystaallogr. B 4 1 , 362-368
87, Hilger and Watts, London Acknowledgments-We thank the Cornell High Energy Synchro- 28. Hendrickson, W. A. (1985) Methods Enzymol. 116 , 252-270
tron Source (CHESS) for beam time and the X-ray Diffraction 29. Lunsdorfi H., Ehrig, K., Friedl, P., and Schairer, H. U. (1984) J. Facility a t UC San Diego for data collection. The computing facilities Mol. Biol. 173, 131-136 of the National Cancer Institute (Frederick, MD) were used for part 30. Cozens, A. L., and Walker, J. E. (1987) J. Mol. Biol. 194 , 359- of the computations. Major x-ray and computing equipment were 383 funded by the National Science Foundation and the Keck Foundation. 31. Fry, D. C., Kuby, S. A., and Mildvan, A. S. (1986) Proc. Natl. We are grateful to Starlene Murray for her help in processing this Acad. Sci. U. S. A. 8 3 , 907-911 manuscript for publication. 32. Williams, N., and Coleman, P. (1982) J. Biol. Chem. 263,5569-
REFERENCES 33. Verburg, J. G., and Allison, W. S. (1990) J. Bwl. Chem. 2 6 6 ,
1. Cross, R. L. (1981) Annu. Rev. Biochem. 60, 681-714 2. Amzel, L. M., and Pedersen, P. L. (1983) Annu. Rev. Biochem.
34. Pedersen, P. L. (1976) Biochem. Biophys. Res. Commun. 7 1 ,
3. Ysern, X., Amzel, L. M., and Pedersen, P. L. (1988) J. Bioenerg. 35. Pedersen, P. L., and Carafoli, E. (1987) Trends Biochem. Sci. 12 ,
4. Senior, A. E. (1988) Physiol. Rev. 6 8 , 177-231 36. Mimura, C. S., Holbrook, S. R., and Ames, G. F.-L. (1991) Proc.
5. Futai, M., Noumi, T., and Maeda, M. (1989) A m u . Rev. Biochem. 37. Thiagalingam, S., and Grossman, L. (1991) J. Biol. Chem. 266 ,
6. Fillingame, R. H. (1990) in The Bacteria, PP. 345-391, Academic, 38. Thomas, P. J., Shenbagamurthi, P., Ysern, X., and Pedersen, P.
7. Catterall, W. A., and Pedersen, P. L. (1974) in Membrane AT- 39. Blundell, T. L., and Johnson, L. N., (1976) Protein Crystallogm-
5573
8065-8074
62,801-824 1182-1188
Biomembr. 20,423-450 146-150
Natl. Acad. Sci. U. S. A. 88,84-88
68,111-136 11395-11403
New York L. (1991) Science 261,555-557
Pases and Transport Process (Bronk, R. J., ed) Vol. 4, pp. 63- phy, pp. 212-219, Academic Press, Inc., London