the journal impact factor: a brief history, critique, and ... · information source provided a...
TRANSCRIPT

Forthcoming in Glänzel, W., Moed, H.F., Schmoch U., Thelwall, M. (2018). Springer Handbook of
Science and Technology Indicators. Cham (Switzerland): Springer International Publishing.
The Journal Impact Factor:
A brief history, critique, and discussion of adverse effects
Vincent Larivière1,2
& Cassidy R. Sugimoto3
1 École de bibliothéconomie et des sciences de l’information, Université de Montréal, Canada.
2 Observatoire des sciences et des technologies (OST), Centre interuniversitaire de recherche sur
la science et la technologie (CIRST), Université du Québec à Montréal, Canada. 3 School of Informatics and Computing, Indiana University Bloomington, USA.
Table of Contents
Abstract ........................................................................................................................................... 2
1. Introduction ................................................................................................................................. 2
2. Calculation and reproduction ...................................................................................................... 4
3. Critiques ...................................................................................................................................... 6
3.1 The numerator / denominator asymmetry ............................................................................. 6
3.2 Journal self-citations .............................................................................................................. 9
3.3 Length of citation window................................................................................................... 11
3.4 Skewness of citation distributions ....................................................................................... 12
3.5 Disciplinary comparison ...................................................................................................... 16
3.6 Journal Impact Factor inflation ........................................................................................... 17
4. Systemic Effects ........................................................................................................................ 18
4.1 Journal Impact Factor Engineering ..................................................................................... 19
4.2 Role of evaluation policies .................................................................................................. 21
4.3 Application at the individual level ...................................................................................... 22
4.4 Knock-off indicators ............................................................................................................ 23
5. What are the alternatives? ......................................................................................................... 24
6. The future of journal impact indicators ..................................................................................... 25

2
Abstract
The Journal Impact Factor (JIF) is, by far, the most discussed bibliometric indicator. Since its
introduction over 40 years ago, it has had enormous effects on the scientific ecosystem:
transforming the publishing industry, shaping hiring practices and the allocation of resources,
and, as a result, reorienting the research activities and dissemination practices of scholars. Given
both the ubiquity and impact of the indicator, the JIF has been widely dissected and debated by
scholars of every disciplinary orientation. Drawing on the existing literature as well as on original
research, this chapter provides a brief history of the indicator and highlights well-known
limitations—such as the asymmetry between the numerator and the denominator, differences
across disciplines, the insufficient citation window, and the skewness of the underlying citation
distributions. The inflation of the JIF and the weakening predictive power is discussed, as well as
the adverse effects on the behaviors of individual actors and the research enterprise. Alternative
journal-based indicators are described and the chapter concludes with a call for responsible
application and a commentary on future developments in journal indicators.
Index terms: Journal Impact Factor (JIF); Eugene Garfield; Journal Citation Reports (JCR);
Eigenfactor Score; Article Influence Score (AIS); CiteScore; SCImago Journal Rank (SJR);
Clarivate; self-citation; evaluation; citations; skewness; Institute for Scientific Information (ISI)
1. Introduction
In the 1975 version of the Science Citation Index (SCI), Eugene Garfield and the Institute for
Scientific Information (ISI) added a new component to their information products: the Journal
Citation Reports (JCR). While Garfield and Sher proposed the concept of an impact factor as
early as 1963—and tested it at a larger scale in 1972 (Garfield, 1972)—the 1975 JCR was ISI’s
first comprehensive reporting of their data at the journal level. Based on more than 4.2 million
references made in 1974 by 400,000 papers published in about 2,400 journals, this new
information source provided a detailed list of journal-to-journal citation linkages, as well as the
first iteration of what would become the most discussed and derided bibliometric indicator: the
Journal Impact Factor (JIF). (For a detailed history of the Journal Impact Factor see Archambault
and Larivière (2009).)
Garfield did not leave the community without a roadmap. In two short papers introducing the first
edition of the JCR—entitled I. Journals, References and Citations, and II. Why the Journal
Citation Reports—Garfield provides words of both caution and optimism. Replying to some of
the criticism leveled at the Science Citation Index from the scientific community, he provided a
justification for interpreting citations as indicators of the usage of scholarly literature: “The more
frequently a journal’s articles are cited, the more the world’s scientific community implies that it
finds the journal to be a carrier of useful information” (Garfield, 1976b, p. 1). Understanding
usage, wrote Garfield, would provide critical information on the economics of scholarly
publishing and help librarians “counteract the inertia that too often prevails with regard to journal
selection” (p. 1). Data contained in the JCR would, Garfield argued, provide objective indicators
for the use of journals so that librarians could make timely and informed decisions on collection
management. The report would provide at scale what had required painstakingly manual analyses
in previous decades (e.g., Gross & Gross, 1927). For researchers, Garfield imagined that the JCR

3
would help them to identify potential venues for publication. Garfield did not advocate for using
the JCR to identify elite journals. Rather, he suggested that researchers use the journal-to-journal
matrix to identify multidisciplinary venues at “the borders of their own fields”. Garfield (1976c,
p. 4-5) writes:
“… the JCR© can be very helpful in deciding where to publish to reach the audience you
want to reach. If, for example, you have a paper that deals with some interesting
mathematical aspects of biological problems but is nevertheless definitely a biological
paper, the JCR© show you which biological journals have the best ‘connections’ with
math, and which are most likely to welcome the paper.”
Furthermore, Garfield saw in these new reports the potential to uncover many important
dimensions about the nature of science itself. In the conclusion of the introduction to the JCR,
Garfield states (1976c, p. 5):
“The use of the JCR can be of far-ranging significance in a field about which I can say
least here--science--its planning, its evaluation, its sociology, its history. Citation analysis
can be used to identify and map research fronts; to define disciplines and emerging
specialties through journal relationships; to determine the interdisciplinary or
multidisciplinary character and impact of research programs and projects. I say least
about this, to me the most exciting aspect of its potential, because the JCR in its present
form is, for such advanced applications, only a sketch of that potential, providing little
more than suggestions for further and deeper examination of the massive data bank from
which its sections have been extracted.”
Garfield concludes with a statement of his hopes: that the JCR will “provide material for
innovative research”, prompting “imaginative analyses”, and stimulate “with every answer it
gives more questions that need answers” (Garfield, 1976c, p. 5). Along these lines, Garfield
writes in the preface of the first JCR:
“In the introduction I have tried to explain clearly what the JCR is, how it was compiled,
how it can be used for some simple purposes for which, I think, it is certainly needed. I
have tried also to suggest its usefulness in what I’ll call more advanced research. If I have
failed in the latter, it is because I have deliberately, and with some difficulty, restrained
my own enthusiasm about the value of what some may find at first sight to be merely
another handbook of data. Let me say only that the sociology of science is a relatively
new field. I believe that JCR will prove uniquely useful in exploring it” (1976a, p. I).
The JCR did indeed provoke a reaction within the research community. Spurred by Derek de
Solla Price’s call for a science of science (Price, 1963), scholars turned to the ISI for data. The
JCR and associated products became the backbone for the burgeoning field of scientometrics
which sought to address, quantitatively, the questions of science: “its planning, its evaluation, its
sociology, its history”. In addition to fueling science studies, the JCR found new application
alongside the growing emphasis on research evaluation as scholars, institutions, policy-makers,

4
and publishers sought to find ways to measure the success of the research enterprise. This, in turn,
had sizeable effects on the science system and scholarly publishing, orienting scholars’ research
topics and dissemination practices, as well as universities’ hiring practices (Monastersky, 2005;
Müller & De Rijcke, 2017).
The primary indicator of the JCR—the Journal Impact Factor (JIF)—has received global
attention. As of August 2017, the Core Collection of the Web of Science contained more than
5,800 articles that mention the JIF. These papers are not solely in the domain of information or
computing science; rather, the majority of papers dealing with JIF are published in scientific and
medical journals, demonstrating the pervasive interest in this indicator across scientific fields.
The goal of the present chapter is not to summarize this literature per se, but rather to focus on the
central limitations that have been raised in the literature and among members of the scientific
community.
Drawing on the existing literature as well as on original data, this chapter provides an overview of
the JIF and of its uses, as well as a detailed, empirically-based, discussion of common critiques.
These include technical critiques—such as the asymmetry between the numerator and the
denominator, the inclusion of journal self-citations, the length of the citation window, and the
skewness of citation distributions—and interpretative critiques—such as the field- and time-
dependency of the indicator. Adverse effects of the JIF are discussed and the chapter concludes
with an outlook on the future of journal-based measures of scientific impact.
2. Calculation and reproduction
The calculation of the JIF is relatively straightforward: the ratio between the number of citations
received in a given year by documents published a journal during the two previous years, divided
by the number of items published in that journal over the two previous years. More specifically,
the JIF of a given journal for the year 2016 will be obtained by the following calculation:
Number of citations received in 2016 by items published in the journal in 2014-2015
divided by
Number of citable items published in the journal in 2014-2015
Citable items are restricted, by document type, to articles and reviews in the denominator, but not
in the numerator (McVeigh & Mann, 2009); an issue we will discuss more in-depth later in the
chapter. Therefore, the JIF is generally interpreted as the mean number of citations received by
papers published in a given journal in the short term, despite not being exactly calculated as such.
Given its calculation, which uses one year of citation and two years of publication, it combines
citations to papers that have had nearly three years of potential citations (i.e., papers published in
early 2014) with citations to papers which have had slightly more than a year to receive citations
(i.e., papers published at the end of 2015). The JIF is presented with three decimals to avoid ties.
However, this has been argued as “false precision” (Hicks, et al., 2015) with critics advocating
for the use of only one decimal point.

5
Each journal indexed by Clarivate Analytics in the Science Citation Index Expanded (SCIE) and
the Social Science Citation Index (SSCI) receives an annual JIF. Given the long half-life of
citations (and references) of journals indexed in the Arts and Humanities Citation Index (AHCI),
these journals are not provided with a JIF (although some social history journals indexed in the
SSCI are included). There has been a steady increase in the number of journals for which JIFs are
compiled, in parallel with the increase in indexation. In 1997, 6,388 journals had JIFs. This
number nearly doubled 20 years later: in 2016, 11,430 received a JIF.
Despite the apparent simplicity of the calculation, JIFs are largely considered non-reproducible
(Anseel et al., 2004; Rossner, Van Epps, Hill, 2007). However, in order to better understand the
calculation of the JIF, we have attempted to recompile, using our licensed version of the Web of
Science Core Collection (which includes the Science Citation Index Expanded, Social Science
Citation Index, and Arts and Humanities Citation Index), the 2016 JIFs for four journals from the
field of biochemistry and molecular biology (Cell, Nature Chemical Biology, PLOS Biology, and
FASEB J).
We begin with a careful cleaning of journal names to identify citations that are not automatically
matched in WOS—that is, citations that bear the name of the journal, but contain a mistake in the
author name, volume, or number of pages. The inclusion of these unmatched citations provides
the opportunity to essentially reverse-engineer the JIFs presented in the JCR. This reduces the
opacity of the JCR, which many consider to be the results of calculations performed on a
“separate database” (Rossner, Van Epps, Hill, 2007).
Our empirical analysis (Table 1) shows that the inclusion of unmatched citations and the variants
under which journal names appear (WOS-derived JIF) provides results that are very similar to the
official JCR JIF. This suggests that there is no separate database and one can closely approximate
the JIF using only the three standard citation indexes contained the Core Collection. Furthermore,
our results suggest that papers indexed in Clarivate’s other indexes—e.g., the Conference
Proceedings Citation Index and Book Citation Index—are not included. The inclusion of these
databases would lead to an increase of the JIF for most journals, particularly those in disciplines
that publish a lower proportion of their work in journals. Most importantly, our analysis
demonstrates that with access to the data and careful cleaning, the JIF can be reproduced.

6
Table 1. Citations received, number of citable items, WOS-derived JIF, JCR JIF and proportion
of papers obtaining the JIF value, for four journals from the field of biochemistry and molecular
biology, 2014-2015 papers and 2016 citations
3. Critiques
The JIF has been called a “pox upon the land” (Monastersky, 2005), “a cancer that can no longer
be ignored” (Curry, 2012), and the “number that’s devouring science” (Monastersky, 2005).
Many scholars note the technical imperfections of the indicator—skewness, false precision,
absence of confidence intervals, and the asymmetry in the calculation. Considerable focus has
also been paid to the misapplication of the indicator—most specifically the use of the indicator at
the level of an individual paper or author (e.g., Campbell, 2008). We will not review this vast
literature here, much of which appears as anecdotes in editorial and comment pieces. Instead, we
provide original data to examine the most discussed technical and interpretive critiques of the JIF.
Furthermore, we provide new information on a previously understudied dimension of the JIF—
that is, the inflation of JIFs over time.
3.1 The numerator / denominator asymmetry
Scholarly journals publish several document types. In addition to research articles, which
represent the bulk of the scientific literature, scholarly journals also publish review articles, which
synthesize previous findings. These two document types, which are generally peer-reviewed,
account for the majority of citations received by journals and constitute what Clarivate labels as
“citable items”. Over the 1900-2016 period, 69.7% of documents in the Web of Science were
considered as citable items. This proportion is even more striking for recent years, with 76.0% of
documents published in 2016 labeled as citable items. Other documents published by scholarly
journals, such as editorials, letters to the editor, news items, and obituaries (often labelled as
“front material”), receive fewer citations, and are thus considered “non-citable items”. There is,
however, an asymmetry in how these document types are incorporated into the calculation of the
Journal Impact Factor (JIF): while citations received by all document types—citable and non-
citable—are counted in the numerator, only citable items are counted in the denominator. This
counting mechanism is not an intentional asymmetry, but rather an artifact of method for
obtaining citation counts. As mentioned above, to account for mistakes in cited references and to
try to be as comprehensive as possible, Clarivate focuses retrieval on all citations with the journal
name or common variant (Hubbard & McVeigh, 2011) rather than using a paper-based approach
to calculating citations. This has the effect of inflating the JIF: citations are counted for
documents which are not considered in the denominator. The variations in document types (i.e.,
Citations
Matched
items
Unmatched
items
Cell 24,554 2,016 26,570 869 30.575 30.410
Nat. Chem. Biol. 3,858 356 4,214 268 15.724 15.066
PLOS Biol. 3,331 290 3,621 384 9.430 9.797
FASEB J. 4,088 802 4,890 881 5.551 5.498
Journal
WOS-
derived
JIF
JCR
JIF
All
Citations
N.
Citable
Items

7
reduction of the number of citable items in the denominator) has also been argued as the main
reason for JIF increases (Kiesslich, Weineck, Koelblinger, 2016).
To better understand the effects of document types on the calculation of the JIF, we compiled, for
the sample of four journals from the field of biochemistry and molecular biology, as well as for
Science and Nature—both of which publish a high percentage of front material— citations
received by citable items, non-citable items, as well as unmatched citations (Table 2). Following
Moed and van Leeuwen (1995a, 1995b), our results show that non-citable items and unmatched
citations account for a sizeable proportion of total citations received, from 9.8% in the case of
Cell to 20.6% in the case of FASEB Journal. For the four journals from biochemistry and
molecular biology, unmatched citations account for a larger proportion of citations than non-
citable items. Given that these unmatched citations are likely to be made to citable items, this
suggests that, at least in the case of disciplinary journals which do not typically have a large
proportion of front material, the asymmetry between the numerator and the denominator does not
inflate JIFs in a sizeable manner. The effect of non-citable items is much greater for
interdisciplinary journals such as Science and Nature. As shown in Table 2, for both Nature and
Science, more than 5,000 citations are received in 2016 by non-citable items published in the
journal in 2014-2015. This accounts for 7.2% and 9.0% of citations, respectively, which is greater
than the percentages obtained by the sample of disciplinary journals [2.3%-6.5%]. Results also
show that the difference in the “symmetric” JIF—with only citable items in the numerator and
denominator—and JCR JIF is greater for Nature and Science than Cell or Nat. Chem. Biol.,
mostly because of citations to non-source items. However, at scale—i.e., all journals having a JIF
in 2016—the relationship between the JIF and the symmetric Impact Factor is quite strong, with
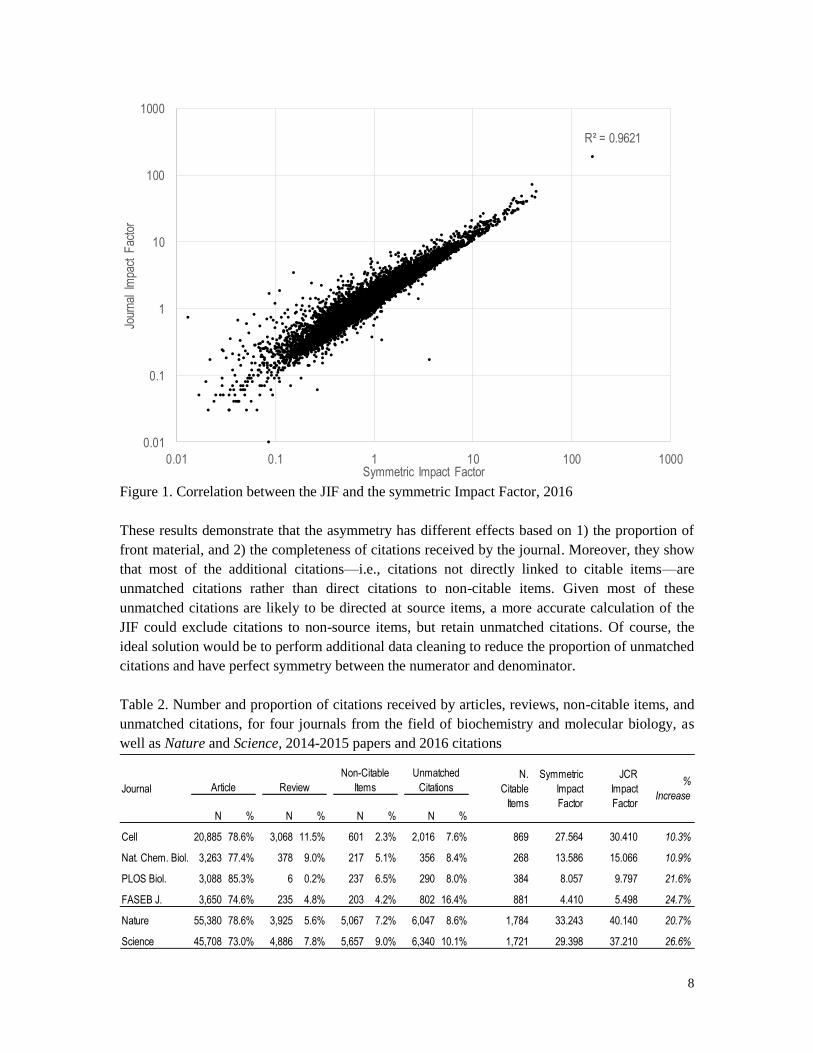
an R2 of 0.96 (Figure 1).
8
Figure 1. Correlation between the JIF and the symmetric Impact Factor, 2016
These results demonstrate that the asymmetry has different effects based on 1) the proportion of
front material, and 2) the completeness of citations received by the journal. Moreover, they show
that most of the additional citations—i.e., citations not directly linked to citable items—are
unmatched citations rather than direct citations to non-citable items. Given most of these
unmatched citations are likely to be directed at source items, a more accurate calculation of the
JIF could exclude citations to non-source items, but retain unmatched citations. Of course, the
ideal solution would be to perform additional data cleaning to reduce the proportion of unmatched
citations and have perfect symmetry between the numerator and denominator.
Table 2. Number and proportion of citations received by articles, reviews, non-citable items, and
unmatched citations, for four journals from the field of biochemistry and molecular biology, as
well as Nature and Science, 2014-2015 papers and 2016 citations
R² = 0.9621
0.01
0.1
1
10
100
1000
0.01 0.1 1 10 100 1000
Jour
nal
Impa
ct F
acto
r
Symmetric Impact Factor
Article Review
Non-Citable
Items
Unmatched
Citations
N % N % N % N %
Cell 20,885 78.6% 3,068 11.5% 601 2.3% 2,016 7.6% 869 27.564 30.410 10.3%
Nat. Chem. Biol. 3,263 77.4% 378 9.0% 217 5.1% 356 8.4% 268 13.586 15.066 10.9%
PLOS Biol. 3,088 85.3% 6 0.2% 237 6.5% 290 8.0% 384 8.057 9.797 21.6%
FASEB J. 3,650 74.6% 235 4.8% 203 4.2% 802 16.4% 881 4.410 5.498 24.7%
Nature 55,380 78.6% 3,925 5.6% 5,067 7.2% 6,047 8.6% 1,784 33.243 40.140 20.7%
Science 45,708 73.0% 4,886 7.8% 5,657 9.0% 6,340 10.1% 1,721 29.398 37.210 26.6%
Journal
N.
Citable
Items
JCR
Impact
Factor
Symmetric
Impact
Factor
%
Increase

9
3.2 Journal self-citations
The inclusion of journal self-citations in the calculation of the Journal Impact Factor (JIF) has
been a cause for concern, as it opens the door for editorial manipulations of citations (Arnold &
Fowler, 2011; Reedijk & Moed, 2008; Martin, 2013). Journal self-citations are those citations
received by the journal that were made by other papers within that same journal. This should not
be conflated with self-references, which is the proportion of references made in the articles to that
journal. This is a subtle, but important difference: the proportion of self-citations is an indication
of the relative impact of the work on the broader community, whereas the proportion of self-
references provides an indication of the foundation of work upon which that journal is built. From
a technical standpoint, the main concern in the construction of the JIF is the degree to which self-
citations can be used to inflate the indicator. Given that self-citations are directly under the
control of the authors (and, indirectly, the editors), this has been seen as a potential flaw that can
be exploited by malicious authors and editors.
There are many myths and misunderstandings in this area. For example, it has been argued that
authors in high impact journals are more likely to self-cite than those in low-impact journals
because “the former authors in general are more experienced and more successful” (Anseel et al.,
2004, p. 50). However, this is a conflation of self-citations and self-references. Authors with
longer publication histories are, indeed, more likely to have material to self-reference. However,
successful authors are likely to have lower self-citation rates, as they are likely to generate
citations from a broader audience. Furthermore, this conflates the practices of an individual
author (who publishes in many journals) to the self-citation of a journal, which is much more
dependent upon the specialization of the journal, among other factors (Rousseau, 1999). There is
also a distinction to made between the number and proportion of self-citations. As ISI observed in
internal analyses, “a high number of self-citations does not always result in a high rate of self-
citation” (McVeigh, 2002, par. 15). For example, a study of psychology journals found that
articles in high-impact journals tend to receive a higher number of self-citations than articles in
lower-impact journals; however, the ratio of self-citations to total citations tends to be lower for
high-impact journals (Anseel et al., 2004).
Producers of the JIF thus face a Cornelian dilemma when it comes to self-citations: while
including them can lead to manipulation, excluding them penalizes niche journals and certain
specialties. In response to these concerns, ISI undertook an analysis of the prevalence and effect
of journal self-citations (McVeigh, 2002). In an analysis of 5,876 journals in the 2002 Science
Edition of the JCR, ISI found that the mean self-citation rate was around 12%. Our analysis of
2016 citation data for papers published in 2014-2015 reinforces this: we find that the percentage
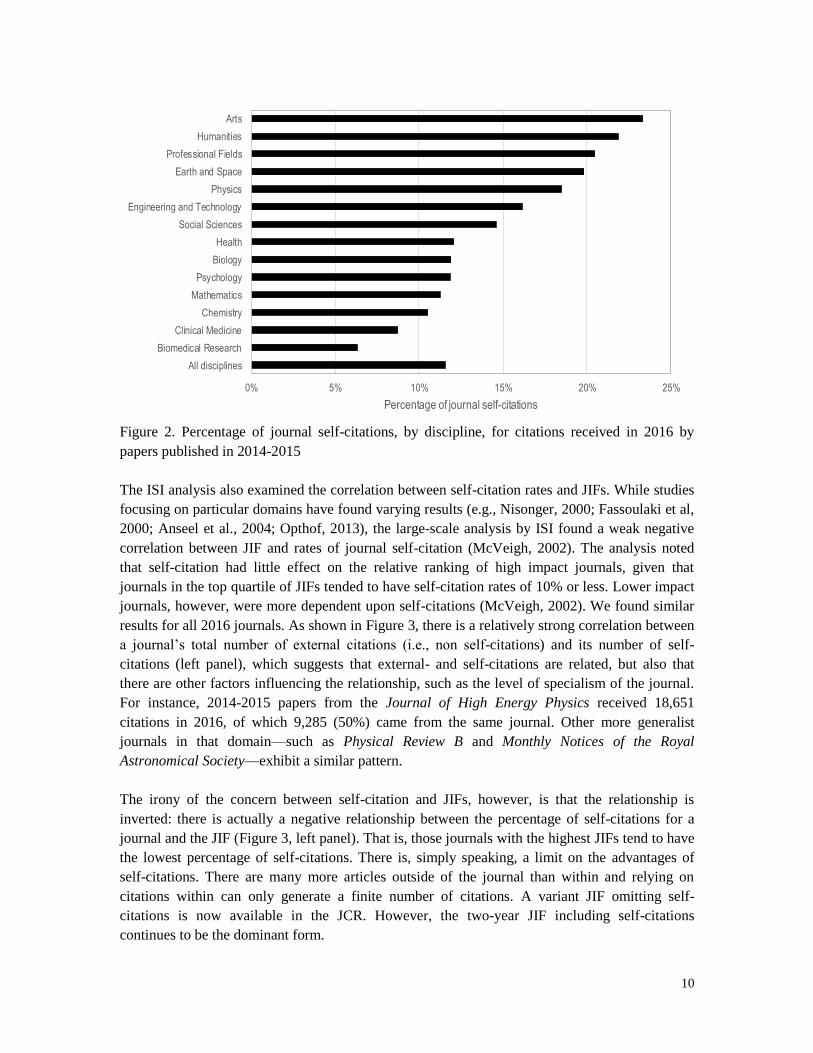
of self-citations across all disciplines remains around 12% (Figure 2). However, the percentage
varies widely by discipline, with Arts and Humanities having far higher degrees of self-citation
than Clinical and Biomedical research. This suggests that, on average, the majority of citations do
not come in the form of self-citations and makes abuses easier to identify.
10
Figure 2. Percentage of journal self-citations, by discipline, for citations received in 2016 by
papers published in 2014-2015
The ISI analysis also examined the correlation between self-citation rates and JIFs. While studies
focusing on particular domains have found varying results (e.g., Nisonger, 2000; Fassoulaki et al,
2000; Anseel et al., 2004; Opthof, 2013), the large-scale analysis by ISI found a weak negative
correlation between JIF and rates of journal self-citation (McVeigh, 2002). The analysis noted
that self-citation had little effect on the relative ranking of high impact journals, given that
journals in the top quartile of JIFs tended to have self-citation rates of 10% or less. Lower impact
journals, however, were more dependent upon self-citations (McVeigh, 2002). We found similar
results for all 2016 journals. As shown in Figure 3, there is a relatively strong correlation between
a journal’s total number of external citations (i.e., non self-citations) and its number of self-
citations (left panel), which suggests that external- and self-citations are related, but also that
there are other factors influencing the relationship, such as the level of specialism of the journal.
For instance, 2014-2015 papers from the Journal of High Energy Physics received 18,651
citations in 2016, of which 9,285 (50%) came from the same journal. Other more generalist
journals in that domain—such as Physical Review B and Monthly Notices of the Royal
Astronomical Society—exhibit a similar pattern.
The irony of the concern between self-citation and JIFs, however, is that the relationship is
inverted: there is actually a negative relationship between the percentage of self-citations for a
journal and the JIF (Figure 3, left panel). That is, those journals with the highest JIFs tend to have
the lowest percentage of self-citations. There is, simply speaking, a limit on the advantages of
self-citations. There are many more articles outside of the journal than within and relying on
citations within can only generate a finite number of citations. A variant JIF omitting self-
citations is now available in the JCR. However, the two-year JIF including self-citations
continues to be the dominant form.
0% 5% 10% 15% 20% 25%
All disciplines
Biomedical Research
Clinical Medicine
Chemistry
Mathematics
Psychology
Biology
Health
Social Sciences
Engineering and Technology
Physics
Earth and Space
Professional Fields
Humanities
Arts
Percentage of journal self-citations

11
Figure 3. Correlation at the journal level between A) the number of journal “external” citations
and number of journal self-citations and B) the percentage of self-citations and the Impact Factor,
for year 2016. Only journals with at least 50 citations in 2016 to material published in 2014-2015
are shown.
3.3 Length of citation window
The Journal Impact Factor (JIF) includes citations received in a single year by papers published in
the journal over the two preceding years. As such, it is generally considered to cover citations
received by papers over a two-year window. This focus on the short-term impact of scholarly
documents is problematic as it favors disciplines that accumulate citations faster. For example,
comparing mean citation rates of papers published in the Lancet and in the American Sociological
Review (ASR)—two journals with very different JIFs (47.83 vs 4.4 in 2016)—Glänzel and Moed
(2002) have shown that while papers published in the Lancet had a higher mean citation rates for
two- and three-year citation windows, those published in ASR were more highly cited when a
longer citation window was used.
This trend can be observed at the macro-level: Figure 4 presents the annual number of citations
(left panel), cumulative number of citations (middle panel), and the cumulative proportion of
citations (right panel), for all papers published in 1985 across four disciplines (Biomedical
Research, Psychology, Physics, and Social Sciences). These data show that citations to
Biomedical Research and Physics peaks two years following publications, while citations are
relatively more stable following publication year in Psychology and the Social Sciences. It is
particularly revealing that Psychology papers receive, on average, more citations (cumulatively)
than Physics papers. While Physics papers generate more citations than Psychology papers within
the first five years, the reverse is true for the following 25 years.
Despite these disciplinary differences in the speed at which citations accumulate, the two-year
window appears to be ill-suited across all disciplines, as it covers only a small fraction of
citations received over time. For example, using a 30-year citation window, we find that the first
two years captures only 16% of citations for Physics papers, 15% for Biomedical Research, 8%
for Social Science papers, and 7% in Psychology. Figure 4 also shows that papers in Biomedical
Research accumulate citations faster than in the other three domains. For instance, they
R² = 0.4144
0
20,000
40,000
60,000
80,000
100,000
120,000
140,000
160,000
0 5,000 10,000 15,000
Num
ber
of e
xter
nal-c
itatio
ns
Number of self-citations
External citations and self-citations
R² = 0.0974
0%
10%
20%
30%
40%
50%
60%
70%
80%
90%
100%
0 1 10 100 1,000
Per
cent
age
of s
elf-c
itatio
ns
Journal Impact Factor
Percentage of self-citations and JIF

12
accumulate 50% of their citations in the first eight years following publication, while it takes nine
years for Physics papers, 13 years for Psychology papers, and 14 years for Social Science papers
to reach the same threshold. In order to take such differences into account, the JCR has provided,
since 2007, a 5-year JIF. Despite this improved citation window, which provides a more complete
measurement of the impact of papers and journals, the two-year JIF remains the gold standard.
Figure 4. Number of citations (left panel), cumulative number of citations (middle panel), and
cumulative proportion of citations (right panel), by year following publication for papers
published in 1985 in biomedical research, psychology, physics and social sciences (NSF
classification).
3.4 Skewness of citation distributions
Nearly a century of research has demonstrated that science is highly skewed (Lotka, 1926) and
that productivity and citedness are not equally distributed among scholars, articles, institutions, or
nations. It is perhaps of little surprise, therefore, that the citedness of articles within a journal is
also highly skewed. This was the main premise of an article published in 1992 by Per O. Seglen,
who produced a robust empirical analysis demonstrating that a minority of papers in a journal
accounted for the vast majority of citations. Given this skewness in the citation distribution,
Seglen (1992) argued that the JIF was unsuitable for research evaluation.
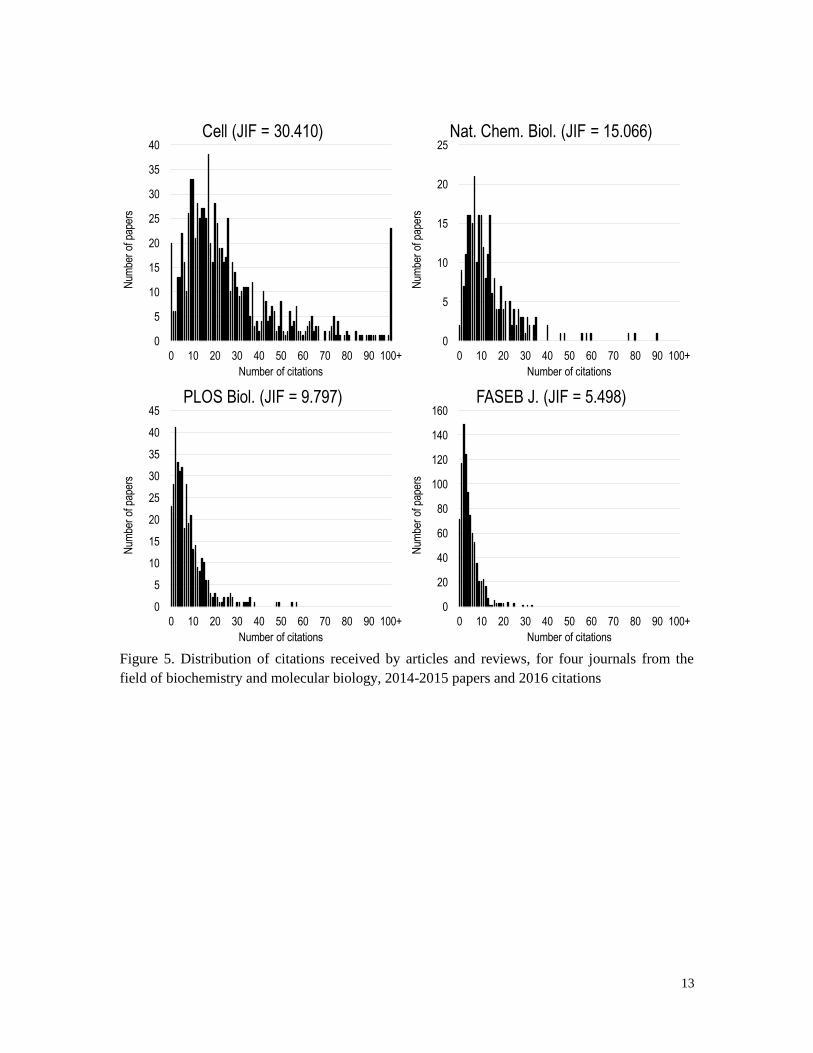
To illustrate this skewness, we provide—for the four biochemistry and molecular biology
journals mentioned above—the distribution of citations received in 2016 by papers published in
2014-2015, both as absolute values (Figure 5) and as percentages of papers (Figure 6). It shows
that, for all journals, most of the papers have a low number of citations and only a few obtain a
high number of citations. Of course, the distribution for Cell—with a JIF of 30.410—is more
right-skewed than FASEB J.—which has a JIF of 5.498—but despite this, their citation
distributions still have sizeable overlap, as shown in Figure 6. Also striking is the similarity of the
skewness: for all of these four journals, a nearly identical percentage of papers—28.2%-28.7%—
obtain a citation rate that is equal or greater to the JIF for that journal.
0
0.5
1
1.5
2
2.5
3
3.5
0 5 10 15 20 25 30
Cita
tions
Year following publication
Number of citations
0
5
10
15
20
25
30
35
40
45
0 5 10 15 20 25 30
Cita
tions
Year following publication
Cumulative citations
0%
10%
20%
30%
40%
50%
60%
70%
80%
90%
100%
0 5 10 15 20 25 30
Cita
tions
Year following publication
Cumulative % of citations
BiomedicalResearch
Psychology
Physics
SocialSciences
13
Figure 5. Distribution of citations received by articles and reviews, for four journals from the
field of biochemistry and molecular biology, 2014-2015 papers and 2016 citations
0
5
10
15
20
25
30
35
40
0 10 20 30 40 50 60 70 80 90 100+
Num
ber
of p
aper
s
Number of citations
Cell (JIF = 30.410)
0
5
10
15
20
25
0 10 20 30 40 50 60 70 80 90 100+
Num
ber
of p
aper
s
Number of citations
Nat. Chem. Biol. (JIF = 15.066)
0
5
10
15
20
25
30
35
40
45
0 10 20 30 40 50 60 70 80 90 100+
Num
ber
of p
aper
s
Number of citations
PLOS Biol. (JIF = 9.797)
0
20
40
60
80
100
120
140
160
0 10 20 30 40 50 60 70 80 90 100+
Num
ber
of p
aper
s
Number of citations
FASEB J. (JIF = 5.498)

14
Figure 6. Relative distribution of citations received by articles and reviews, for four journals from
the field of biochemistry and molecular biology, 2014-2015 papers and 2016 citations
Extending the analysis across all journals indexed in the 2016 JCR confirms this pattern (Figure
7). There is a fairly normal distribution when plotting journals by the percentage of their papers
that obtain the corresponding JIF value or above. As shown, the vast majority are around 30%.
Nearly 73% of the journals fall between 20-40%. Only in 1.3% of journals (n=141) do at least
50% of the articles reach the JIF value. This fundamental flaw in the calculation—to compile an
average on a non-parametric distribution—has been heavily discussed in the literature (Larivière
et al., 2016) as both a statistical aberration and also for the common misinterpretation: to use the
JIF as an indicator at the article or individual level. Our analysis demonstrates the fairly weak
predictive power of the JIF—that is, one cannot extrapolate from the impact factor of the journal
to the potential citedness of the article as only one-third of the articles are likely to obtain that
value.
It would be irresponsible here not to mention the Lucas Critique (Lucas, 1976), which argues
against predicting the effects of policy changes based on aggregated historical data. The Lucas
Critique was developed for economic data, but has wide applicability for the social sciences. In
bibliometrics, one should be wary of making predictions about future citations, based on the past
performance of scholarly objects. Referencing and citing patterns vary over time as do the socio-
political factors of scholarship. Furthermore, the construction of citation indicators changes
0%
2%
4%
6%
8%
10%
12%
14%
16%
18%
0 10 20 30 40 50 60 70 80 90 100+
Per
cent
age
of p
aper
s
Number of citations
FASEB J. (JIF = 5.498)
PLOS Biol. (JIF = 9.797)
Nat. Chem. Biol. (JIF = 15.066)
Cell (JIF = 30.410)

15
behavior (as we discuss later in this chapter). Therefore, we caution against making predictions
with citation data.
Figure 7. Distribution of the number of journals, by proportion of papers that obtained the JIF
value, 2014-2015 papers and 2016 citations
This is not to say, of course, that there is no relationship between JIF and future citedness. For
example, using identical papers published in journals with different JIFs, Larivière and Gingras
(2010) found that the mean number of citations of the paper published in the journal with the
highest JIF obtained twice as many citations as its twin published in the journal with the lowest
JIF. However, the relationship between the JIF and the citedness of the articles has weakened
over time: as shown by Lozano, Larivière and Gingras (2011) using Web of Science data—and
confirmed by Acharya (2014) using Google Scholar—the correlation between the JIF and article-
level citations has been decreasing since the mid-1990s. One potential explanation for this is the
changing referencing practices of scholars. Citations are less concentrated over time (Larivière,
Gingras, & Archambault, 2009) and scholars are citing increasingly older literature (Larivière,
Archambault, & Gingras, 2008) and, as they do, more of the citations fall out of the two-year
citation window of the JIF.
There have been many suggestions to account for the skewness, such as compiling a median-
based JIF (Sombatsompop, Markpin, & Premkamolnetr, 2004; Rousseau, 2005) or reporting
citation distributions (Larivière et al., 2016). However, contrary to other alternatives (such as the
5-year JIF and JIF exlcuding self-citations), no alternatives have been adopted by the JCR to
address this limitation.
0
100
200
300
400
500
600
0% 10% 20% 30% 40% 50% 60% 70% 80% 90% 100%
Nu
mb
er o
f jo
urn
als
Proportion of papers that obtained the JIF value

16
3.5 Disciplinary comparison
Field differences in citations are well established and field-normalized indicators have been the
norm for several decades (e.g., Schubert & Braun, 1986; Moed, De Bruin, & van Leeuwen,
1995). However, the JIF is not among these. The simplicity of the calculation fails to normalize
for the vast differences in citing practices across disciplines, such as the number of references per
document and age of references. As shown in Table 3, disciplines that publish papers with longer
cited reference lists—especially in terms of WOS-indexed papers—generally have higher JIFs
than those with shorter lists. Furthermore, disciplines that cite more recent material—which fall
in the JIF two-year citation window—are more likely to have higher JIFs than those which cite
older material.
These differences also highlight the importance of references to other WOS-indexed material
(source items), which are those that are taken into account in the compilation of the JIF. For
instance, while the mean number of references in Biology and Biomedical Research are almost
identical, the mean JIF of journals in Biology is less than half of those in Biomedical Research.
This difference is explained by the fact that a large proportion of references made by Biology
journals do not count in the calculation of JIF as they are made to non-WOS (and, thus, JCR)
material, while the vast majority of references of Biomedical Research journals are to WOS-
indexed journals.
Table 3. Mean and maximum JIF of journals, mean number of cited references per paper (all
material and only to WOS source items), and mean age of cited literature, by discipline, 2014-
2015 papers and 2016 citations
The same patterns are observed at the level of NSF specialities (Figure 8). Specialties that cite a
higher number of references per paper on average typically have higher JIFs (left panel), as are
specialities that cite younger material. Therefore, the indicator cannot be used to compare across
disciplines: medical researchers are much more likely to publish in journals with high JIFs than
mathematicians or social scientists, and this is strictly due to different disciplines’ publication and
referencing practices rather than anything that relates to the scholarly impact of the journal.
DisciplineMean
JCR JIF
Maximum
JCR JIF
Mean
N. Ref.
Mean N. refs. to
WOS source
items
Mean age of cited
literature
Biology 1.683 22.81 48.99 34.45 14.72
Biomedical Research 3.526 46.6 48.94 43.19 10.26
Chemistry 2.768 47.93 46.37 41.31 10.37
Clinical Medicine 2.976 187.04 41.94 34.78 9.77
Earth and Space 2.173 30.73 53.71 38.67 13.06
Engineering and Technology 1.989 39.74 36.35 24.77 10.44
Health 1.647 17.69 39.08 24.52 9.86
Mathematics 1.017 9.44 26.56 16.53 16.65
Physics 2.699 37.85 36.57 29.58 12.55
Professional Fields 1.565 11.12 53.51 27.68 13.09
Psychology 2.050 19.95 54.56 38.30 13.00
Social Sciences 1.199 6.66 49.09 21.74 15.12

17
Figure 8. Correlation between the Journal Impact Factor and number of cited references to WOS
source items (left panel) and age of references (right panel), by NSF speciality, 2014-2015 papers
and 2016 citations
3.6 Journal Impact Factor inflation
While the calculation of the JIF has remained stable, values obtained by journals have not. The
average JIF value has increased over time, both as a function of the number of papers in existence
and the increasing length of their reference lists (Larivière, Archambault, Gingras, 2008). In
1975, the journal with the highest JIF was the Journal of Experimental Medicine, with a JIF of
11.874. In the 2016 JCR edition, the highest JIF was 187.040 for CA: A Cancer Journal for
Clinicians. As shown by Figure 9, a general inflation of the JIF has been observed over the last 20
years. For instance, while only 49 journals (0.8% of total) had JIF above 10 in 1997, this
increased to 105 (1.3%) in 2007, and to 201 (1.8%) in 2016. Average JIF values have increased
from 1.125 in 1997, to 1.707 in 2007 and then to 2.178 in 2016. Of course, not all journals have
observed these increases. One notable example is PNAS, which has remained quite stable—the
1975 JIF was 8.989 and, despite some intermittent increases, was only slightly higher at 9.661 in
2016.
R² = 0.523
0
1
2
3
4
5
6
0 10 20 30 40 50 60
Mea
n Im
pact
Fac
tor
Number of references
JIF and cited references
R² = 0.4721
0
1
2
3
4
5
6
0 10 20 30 40
Mea
n Im
pact
Fac
tor
Age of references
JIF and age of references

18
Figure 9. Impact Factor by journal as a function of rank, for years 1997, 2007, and 2016
The inflation of the JIF across time is an important element for interpretation. Many editors wait
with baited breath for the release of the next JIF: increases are celebrated as an accomplishment
of the editor and the journal (e.g., Bolli, 2017; Govenir, 2016; Simren et al., 2015). Moreover,
publishers, such as Elsevier (2007), Springer (2016), and Wiley (2016), among others, publicize
their JIF increases with little to no conversation about the expected inflation rates. For example,
the Wiley press release boasts that 58% of Wiley journals increased their JIFs between 2014 and
2015. What the press release fails to note is that 56% of all journals in the JCR increased during
that same time period. Of course, reporting a relative increase is much less persuasive. As there is
no established mechanism for acknowledging inflation in reporting, editors and publishers
continue to valorize marginal increased in JIFs which have little relation to the performance of
the journal.
4. Systemic Effects
There is no doubt that a political economy that has emerged around citation indicators. Nearly
two decades ago, Sosteric (1999, p.13) commented on “the neoliberal need for surveillance, the
push for administrative measures of scholarly performance and productivity, [and] the growing
need for post-publication measures of scholarly impact.” He did not characterize scholars as
resisters of this panopticon, but rather as adaptive actors in the system. Adaptation for survival
and success is well-known across all fields of science: research evaluation is no different. Several
scholars have warned against the negative consequences of constructing indicators of social
activities (e.g., Campbell, 1979; Goodhart, 1975). As Cronin and Sugimoto summarized (2015,
p.751):
0.001
0.01
0.1
1
10
100
1000
1 10 100 1000 10000 100000
Impa
ct F
acto
r (lo
g sc
ale)
Rank of journal (log scale)
2016
2007
1997

19
“The use of metrics, whether to monitor, compare or reward scholarly performance, is
not a value-neutral activity. Metrics are shaped by, and in turn shape policy decisions;
they focus the institutional mind, influence the allocation of resources, promote
stratification and competition within science, encourage short-termism and, ultimately,
affect the ethos of the academy… As reliance on metrics grows, scholars, more or less
consciously, alter the way they go about their business; that is, their behaviors,
motivations and values change, incrementally and unwittingly perhaps, as they adapt to
the demands and perceived expectations of the prevailing system.”
While it would be beyond the scope of the chapter to detail all the systemic effects of scholarly
indicators, we focus on the negative and often intentionally malicious effects related to the use
and promotion of the JIF. Specifically, we discuss JIF engineering, its relationship with
institutional evaluation policies, the application of JIF for evaluating individual researchers and
papers, and the creation of imitation indicators.
4.1 Journal Impact Factor Engineering
In a context where the JIF determines the fate of a journal—from submission rates to pricing—
some editors and publishers have developed subterfuges to increase their JIF which, in turn,
decreases the validity of the indicator. Such stratagems aimed at “artificially” increasing impact
factors have been called “journal impact factor engineering” (Reedijk & Moed, 2008). One well-
documented tactic is to prey on the asymmetry in the calculation and to publish more “front
material”—such as editorials, letters to the editor, etc., which are considered by Clarivate as non-
citable items (Reedijk & Moed, 2008). Another similar approach is to cite the home journal
excessively in editorials and other front matter (Reedijk & Moed, 2008). For example, many
journals publish annual “highlights” or other documents with a high number of internal references
(Opthof, 2013). Whether malicious or not, these documents unduly inflate—and thereby
invalidate—the JIF.
A more subversive approach has been to engage in citation coercion or cartels (Smith, 1997;
Monastersky, 2005; Frandsen, 2007; Van Noorden, 2012; Martin, 2013). The expression “citation
cartel” is largely attributed to Franck (1999), who used it to refer to the ways in which monopoly
power is exercised by publishers and editors on authors in scientific publishing, and noted the
complicity of authors who act as “citation-maximizers” in the scholarly communication system.
This complicit behavior has been empirically demonstrated: in a study of nearly 7,000 scholars,
the majority reported that they would acquiesce to editorial coercion in order to get published
(Wilhite & Fong, 2012). The same study also showed that 20% of these scholars said they had
been subject to coercive self-citation—that is, requests from editors to add references to irrelevant
papers published within the journal (Wilhite & Fong, 2012). An expansion of this study—with
new disciplines added—placed this rate at 14.1%. Both the initial and follow-up studied
confirmed that coercion was more common among higher impact journals (Wilhite & Fong,
2012; Fong & Wilhite, 2017).
Faced with accusations of extortion (Monastersky, 2005), editors will often argue the innocence
of and scientific rationale for these citations (e.g., Cronin, 2012). However, several editors

20
themselves have been caught engaging in JIF boosting, by excessively citing their own journal in
editorials (Reedijk & Moed, 2008). There are also egregious examples of coercion. For example,
in 2017, the editor of the journal Land Degradation & Development—who sat on the board and
reviewed for other journals in the field—took advantage of his positions to increase the JIF of his
own journal. Among the 82 manuscripts he handled as an editor and reviewer for other journals,
he suggested 622 additional references, almost exclusively to the journal of which he was Editor-
in-Chief (Davis, 2017a). The result was an astronomic rise in the JIF of the journal he edited,
from 3.089 to 8.145 between 2014 and 2015. These flagrant abuses signal that editors are highly
aware of the benefits derived from these manipulations.
Coercive self-citation is easier to identify than citation-stacking, which has become synonymous
with the contemporary notion of “citation cartels”. There can be several legitimate explanations
for tightly coupled exchange of citations between journals, particularly in highly specialized
fields. However, when these exchanges are done with the explicit intent of increasing the
citedness of the journal, these are referred to as citation cartels. Although there have been a few
attempts to identify cartels (Davis, 2012; Mongeon, Waltman, de Rijcke, 2016; Heneberg, 2016),
detection is difficult on a number of fronts. Technically, the ability to identify cartels becomes
more difficult as the size of the cartel increases. Furthermore, the notion of a cartel implies
intentionality and premeditation—something that is impossible to prove using bibliometric data
alone.
Thomson Reuters (and, subsequently, Clarivate Analytics) has worked to police inappropriate
citation activity—though they note that they do not “assume motive on behalf of any party”
(Clarivate Analytics, 2017). Each year, Clarivate provides a report of titles suppressed due to
“anomalous citations patterns” and the reason for removal from the JCR (e.g., Thomson Reuters,
2016). Journals can be removed due to excessive self-citation or citation stacking, although
thresholds are considered to be “extremely high” (Davis, 2017b). For example, in an analysis in
2002, the Institute for Scientific Information (the precursor to Thomson Reuters and Clarivate)
found that for 82% of their titles, self-citation rates were at or below 20% (McVeigh, 2002). It is
assumed, therefore, that all journals will engage to some degree in self-citation. However, when
the proportional increase in the JIF is due largely to an increase in self-citation, the journal is
flagged for further analysis (Clarivate Analytics, 2017). This is not an entirely uncommon
practice and represents the dominant reason for suppression from the JCR. Perhaps as a result of
reporting, cases of citation stacking have decreased over time (Hubbard, 2016).
Other scholars have also sought to create indicators for identifying excessive self-citations:
Chorus and Waltman (2016) created the Impact Factor Biased Self-citation Practices (IFBSCP)
indicator to examine the relationship between the share of self-citations for the years included in
the impact factor to those in the preceding five years. To validate this as an indicator of coercive
self-citations, they examined the rates of IFBSCP for the 64 journals identified in Wilhite and
Fong (2012) as engaging in coercive citation behavior. They found that the named journals had
IFBSCP rates 25% higher than the average Social Science journal, which suggests that their
indicator measure is related with coercive behavior. This suggests that indicators may be
developed to help identify—and hopefully curb—inappropriate citation behavior.

21
4.2 Role of evaluation policies
Impact Factor engineering does not happen in a void: these actions are a consequence of
evaluation policies and practices. Institutions and individuals are complicit actors in promoting
the JIF in a research evaluation context. Although soft persuasions towards maximizing impact
can be seen across the scientific system, they are made most manifest in the cash-based reward
systems, such as those documented and publicized in China. Chinese policies offering financial
reward based on WOS-indexed publications began in earnest in the 1990s, to motivate production
and increase international visibility (Quan, Chen, Shu, 2017). However, as noted by other studies
(Butler, 2003), increasing national production does not necessarily equate to an increase in
citedness, and might actually lead to a decrease. Therefore, China has moved steadily away from
publication-based incentives in favor of citation-based indicators, particularly those based on
JCR-quartiles of JIFs (Quan, Chen, Shu, 2017). At face value, these policies seem well-
intentioned and even laudable—encouraging quality of quantity. However, given that the cash
award for a Nature or Science article can be 20 times an annual salary in China (Quan, Chen,
Shu, 2017), these rewards can create strong incentives for inappropriate behavior. Although one
cannot determine causality, the rise in fraudulent authorship, data falsification and data
fabrication in China (Qiu, 2010) in parallel with these rewards is disconcerting. There is even
evidence of an industry of authorship for sale in China, in which authorship is sold to scholars at
rates than often exceed salaries (Hvistendahl, 2013).
Furthermore, cash incentive programs have been correlated with increased submission, but not
with publication (Franzoni, Scellato, & Stephan, 2011). Although most authors are fairly efficient
at selecting appropriate journals, many authors tend to submit to higher impact factor journals
first and then resubmit down the JIF ladder until they find an acceptance (Calcagno et al., 2012;
Monastersky, 2005). Increasing the pressure to submit to high impact factor journals creates a
burden on the scientific system and slows the pace of science as editors and reviewers are tasked
with reviewing papers that are not submitted to the most appropriate venues. On a more
fundamental level, financial rewards for papers externalizes the incentive to do scientific work.
This contradicts central ideals of scholarship, in which scholars should be free from external
pressures (Merton, 1973). A reward more than 20 times an annual salary inverts the reward
system—prioritizing external (i.e., economic capital) over intrinsic (academic capital) rewards.
There is also a danger in tying rewards to publication in particular journals. The most appropriate
venue for many scholars—particularly those in the social sciences and humanities—may not be in
a WOS-indexed publication at all. By emphasizing JIFs, the coverage biases of the WOS become
prioritized (Jin & Rousseau, 2004); that is, journal articles in the natural and medical sciences
published in English are particularly incentivized. Some have argued that switching to English-
language journals increases the visibility of science produced in countries where English is not
the dominant language (e.g., Garfield, 1967; Cryanoski, 2010). However, others have expressed
concern about the effects of a monolingual scholarly publishing industry (e.g., Shao & Shen,
2011). For instance, Larivière (2014) has shown that Canadian scholars in the social sciences and
humanities were three times less likely to publish on Canada-related research topics when
publishing in US journals than in Canadian journals, which demonstrates how journal venues
directly affect the type of research performed.

22
4.3 Application at the individual level
As the JIF is based on a skewed distribution and, thus, is a weak predictor of individual papers’
citation rates, its use as an indicator of the “quality” of individual researchers and papers—
sometimes labelled as the ecological fallacy (Alberts, 2013)—is perhaps the most egregious
misappropriation of the indicator. As Anthony van Raan noted: “if there is one thing every
bibliometrician agrees, it is that you should never use the JIF to evaluate research performance for
an article or for an individual—that is a mortal sin” (quoted in Van Noorden, 2010, p. 864-865).
A less hyperbolic, but similarly unequivocal statement can be found from other bibliometricians:
Henk Moed noted that such measures “have no value in assessing individual scientists” (2002).
Despite these admonitions, the JIF is increasingly used as an indicator to evaluate individual
scholars (see, among others, Quan, Chen & Shu, 2017; Rushforth & de Rijcke, 2015). While
some might argue that publication in a high JIF is itself an achievement, given the relatively
lower acceptance rates of these journals, the concern is more about the equation of the value of an
article or individual with the past ranking of a journal (Brumback, 2012). This can lead to gross
goal displacement (Osterloh & Frey, 2014), in which scholars tailor their topics for certain
indicators.
Scholars are increasingly “thinking with indicators”—that is, allowing indicators to guide the
process of science-making (Müller & De Rijcke, 2017). Specifically, scholars choose topics and
dissemination venues not on scientific bases, but rather to meet certain incentive structures. In
doing so, scholars substitute a “taste for science” with a “taste for rankings” (Osterloh & Frey,
2014). This is not a particularly novel claim. As early as 1991, Holub and colleagues noted that
“WHERE a scientist published has become much more important than WHAT he is publishing”
(capitalization in original). However, the impact factor obsession (Hicks, et al., 2015) has grown
to the level where some scholars would rather destroy a paper than publish below a certain JIF
threshold (Shibayama & Baba, 2015). This has led to a complicated and cyclical relationship
between JIF, value, and reputation that is increasingly internalized into the process of scholarship
(Müller & De Rijcke, 2017).
Scholars are aware of these negative effects: several initiatives in recent years have sought to
disentangle journal rankings from individual rankings. At the 2012 annual meeting of the
American Society for Cell Biology, a group of editors and publishers produced the San Francisco
Declaration on Research Assessment, colloquially referred to as DORA (ASCB, 2012). The
declaration called for the elimination of the use of JIFs for assessment of individual scholars and
articles (ASCB, 2012), stating that the JIF was not appropriate “as a surrogate measure of the
quality of individual research articles, to assess an individual scientist’s contribution, or in hiring,
promotion or funding decisions” (2012, 2). As of July of 2017, the declaration had nearly 13,000
individual signers and nearly 900 organizational signers. Funding agencies have also responded:
the National Health and Medical Research Council in Australia produced a statement
unequivocally denouncing JIFs for evaluating individual papers (NHMRC, 2010) and
discontinued reporting of JIFs for evaluation. Nobel laureates and other high profile scholars have
also spoken out against JIFs (Doherty, 2015) and boycotted high impact factor journals (Sample,
2013). However, these are privileged boycotts and resistance is much more difficult for those who
are not well-established in the scientific system.

23
4.4 Knock-off indicators
The JIF has become a brand and, like any other luxury good, there is an industry of imitation. In
recent years, a cottage industry of fake impact factors has emerged, with strong ties to predatory
publishers. Librarian Geoffrey Beall—who for many years ran the well-known and controversial
list of predatory publishers—identified more than 50 organizations that provide “questionable” or
“misleading” metrics at the researcher, article, and journal level (Beall, 2017). The complicated
web of mimicry is difficult to disentangle: the names of the organizations often replicate the name
or acronym of the Institute for Scientific Information—e.g., the Institute for Science Information
(ISI), the Index Scientific Journals (ISJ), or the International Scientific Indexing (ISI)—or the
JIF—e.g., the Journal Influence Factor-JIF, the General Impact Factor, or the Science Impact
Factor. One organization even goes as far as to imitate both the name of the indicator and that of
the organization: journals can apply to the “Global Institute for Scientific Information” (GISI) to
obtain a “Journal Impact Factor” (Global Institute for Scientific Information, 2017). Several
journals seem to have either fallen prey or are complicit in this deceit: for instance, the list of
journals to which GISI has attributed a “Journal Impact Factor” increased from 24 in 2010 to a
high of 668 in 2011-2013. The numbers have been steadily dwindling, but there are still 153
journals listed in 2016. The listed journals come from both predatory and well-established
publishers.
The organizations often go to lengths to maintain their deceit. For example, one website includes
a red pop-up box warning editors and publishers that another company is scamming the original
predatory company. The text reads: “This is to inform you that somebody is using our name
(International Impact Factor Services) to deposit the fee for Impact Factor &he saying that he
show your impact factor in our website, but do not reply those mails. If you answer those mails
you will responsible for that” (International Impact Factor Services, 2017). This is not the only
bait and switch in the impact factor market. For example, one of the only published articles on
fake JIFs was published in Electronic Physician: Excellence in Constructive Peer Review
(Jalalian, 2015). This article provides an account of so-called “bogus” indicators such as the
Universal Impact Factor (UIF), Global Impact Factor (GIF), and Citefactor. The article describes
the threat of these indicators to reputable indicators such as Thomson Reuters and the Index
Copernicus metric value (ICV). However, the ICV, which is prominently displayed on the
website of the Electronic Physician, is itself under scrutiny for its association with predatory
journals (Beall, 2013). Therefore, this article seems to provide much the same function as the
pop-up box of the International Impact Factor Services: It is a classic redirect technique, wherein
the service attempts to legitimatize their own activities by delegitimizing others.
One of the biggest concerns with these products is the lack of transparency in the compilation of
the indicators. The Global Impact Factor obliquely combines some for of peer review with the
number of papers published (Global Impact Factor, 2017). Journals of the “Academy of IRMBR
International Research in Management and Business Realities”—contained in Beall’s list—rely
on GoogleScholar to generate indicators (Academy of IRMBR, 2017), which seems a common
approach for these fake JIFs. While one could argue that many of these indicators are legitimate
competitors, rather than exploitative knock-offs, the mimicry of the names and acronyms as well
as the cost structure begs caution. For example, the Global Impact Factor provides their indicator

24
for an annual fee of $40 (Global Impact Factor, 2017) and International Scientific Indexing
charges $100-130 per journal for the indicator and indexation on their platform (International
Scientific Indexing, 2017). While the deceptive character of these sites might be apparent to many
scholars, some have chosen to take a more neutral stance. For instance, a US university library
guide on journal indicators lists these indicators alongside the JIF and other established indicators
(Cal State East Bay, 2017). Other libraries have taken a more direct stance, urging their audience
caution with these indicators and predatory publishers (George Washington University, 2017).
5. What are the alternatives?
Knock-off indicators abound, but there are also several other indicators that have emerged as
complementary to or competitive with the JIF. This section examines four of the most
established: the group of Eigenfactor Metrics, Source Normalized Impact per Paper (SNIP),
CiteScore, and SCImago Journal Rank (SJR).
The Eigenfactor Metrics were introduced in 2010 as a new approach for ranking journals (West,
Bergstrom, & Bergstrom, 2010). The metrics include two related indicators—the Eigenfactor
Score and Article Influence Score—both based on the Eigenfactor algorithm, which leverages the
citation network to identify and weight citations from central journals. The underlying algorithm
is derived from Phillip Bonacich’s (1972) eigenvector centrality, which has been employed across
several domains, most notably as the foundation for Google’s PageRank algorithm. The
Eigenfactor Score depicts the “total value” of a journal and is thus size-dependent—as the size of
the journal increases, so too will the Eigenfactor Score. The Article Influence Score, however,
measures the average influence of articles in the journal, and is therefore more comparable to the
JIF. However, there are several important differences: the AIS is calculated over a five-year
(rather than two-year) time window, excludes self-citations, and uses weighted citations. Like the
JIF, both indicators rely on Web of Science (WoS) data and were added to the JCR in 2009. As
such, they represent a supplement to the JCR portfolio, rather than direct competition.
Scopus—the largest competitor to Web of Science—also has several associated journal
indicators. The Source Normalized Impact per Paper (SNIP) indicator was proposed in 2009 by
Henk F. Moed, then at the Centre for Science and Technology Studies (CWTS) of Leiden
University (Moed, 2010) and later revised by Waltman and colleagues (Waltman et al., 2013). As
discussed, one of the central interpretive critiques of the JIF is the inability to make cross-
disciplinary comparisons. SNIP was developed to account for the different “citation potential”
among fields. Rather than using an a priori journal-based classification, fields are defined
according to the set of citing papers. In this way, the indicator is based on “contextual”, rather
than absolute, citation impact. Furthermore, SNIP serves to address another limitation of the JIF:
by focusing on the set of citing papers, there is no concern about the asymmetries created by non-
citable items. However, like the JIF, self-citations are included, which can lead to distortions in
extreme cases. Furthermore, SNIP tends to be higher in journals with a large proportions of
review articles, which causes additional bias. SNIP uses a three-year citation window—one year
more than the JIF, but two less than the Article Influence Score.
25
Another indicator contained in “the Scopus basket of journal metrics” (Zijlstra & McCullough,
2016) is the SCImago Journal Rank (SJR), which was developed and continues to be updated by
the SCImago research group at the University of Granada (González-Pereira, Guerrero-Bote, &
Moya-Anegón, 2010). Like the Eigenfactor Score, the SJR employs Bonacich’s eigenvector
centrality to calculate the prestige of a journal, weighting the links according to the closeness of
co-citation relationships (on the basis of citable documents). The current version of the indicator
uses a three-year window, in keeping with the other Scopus journal indicators (Guerrero-Bote &
Moya-Anegón, 2012). Furthermore, several heuristics are applied to circumvent gaming and
distortions: in generating the prestige of the journal, there are thresholds on how much a single
journal and the journal itself can provide—protecting against citation cartels and self-citations—
and prestige is calculated on the basis of proportions rather than number of citable documents, to
control for size and the dynamicity of the database.
In 2016, Elsevier released a new journal impact indicator, by the name CiteScore (Zijlstra &
McCullough, 2016). The indicator is obtained by averaging, for a given journal, the number of
citations received in a single year by papers it published during the preceding three years. The
appeal is the simplicity—it is merely an average of citations received for all document types,
which removes concerns about asymmetries between cited and citing items. However, the
inclusion of all document types shifts the bias in another direction. While journals with a high
proportion of non-citable items (e.g., editorials, news items) tend to fare well in the JIF, they are
ranked lower in CiteScore. Critics of CiteScore have noted that this favorably biases Elsevier’s
own journals, which tend to publish a lower proportion of front matter than other journals (such
as Nature’s journals) (Bergstrom & West, 2016). Broader concerns have also been raised about
the conflict of interest inherent in vertically integrated companies: There is considerable concern
about the construction of indicators within a company that also publishes, indexes, and provides
analytic services for journals (Sugimoto & Larivière, 2018). The increasing monopoly of Elsevier
in this space has caused some to question the neutrality of the indicator.
However, none of these indicators have managed to displace the JIF’s role in scientific system.
The Eigenfactor Metrics are included in the JCR, but have not gained the marketing appeal of the
JIF and the Scopus indicators have also not gained widespread traction after nearly a decade of
existence. Part of this is the appeal of standardization: scholars working in research evaluation
(whether hiring, promoting, or granting) have internalized the value of the JIF. Despite the well-
known technical and interpretive concerns, the JIF remains the standard journal indicator.
6. The future of journal impact indicators
Building upon both original data and a review of the literature, this chapter provides a
background for the creation of the JIF, an overview of its limitations, and a discussion of some of
the most documented adverse effects. Several of the technical critiques can be or already are
addressed by Clarivate. For instance, asymmetries between the numerator and denominator could
be controlled by more careful analysis and cleaning of the data. Journal self-citation account for a
minority of citations and can (and are already) flagged when excessive. The two-year JIF could
be removed, in favor of a JIF with a longer citation window—which is already provided in more
recent editions of the JCR. However, rather than replacing the original JIF with new indicators,
26
these alternatives have merely been added to the JCR. This multiplicity of indicators is
problematic from the perspective of standardization. When every researcher, administrator,
evaluator, and policymaker is constructing tailor-made indicators, the indicators lose their central
function—to communicate globally and across disciplines in a standard fashion (Sugimoto &
Lariviere, 2018). Of course, bibliometrics is not alone in dedication to an imperfect indicator. For
example, despite heavy criticism and the creation of alternative indicators (e.g., Bagust & Walley,
2000; Lebiedowska et al., 2008), the Body Mass Index remains, as per the World Health
Organisation, the standard for the measurement of obesity.
However, some of the most disconcerting aspects are not purely technical, but rather due to the
misapplication of the indicator. For example, one common technical concern is the skewness of
citation distributions. Given that less than a third of articles are likely to achieve the citation value
of the JIF, the indicator is misleading for application at the individual level. Due to skewness of
citation distributions and the declining predictive power of the JIF, it is widely acknowledged that
the indicator should not be used to evaluate individual articles or scholars (though there remains
debate on this issue (Waltman & Traag, 2017)). Furthermore, the lack of normalization by
discipline and the continual inflation of the indicator over time means that the JIF can only be
used to rank contemporary journals within the same discipline.
It is also clear that it is not the indicator, but rather the application of the indicator that is causing
systemic disruptions in science. Several of the adverse effects observed are not directly linked to
JIF; rather, they are linked to the research evaluation system and, more specifically, to journals as
vectors of scientific capital. In other words, the JIF has become synonymous with academic
capital, and despite well-publicized criticisms (e.g., ASCB, 2012), it remains central to research
evaluation. It would, of course, be naïve to assume that, in a pre-JIF era, there was no relationship
between economic and scientific capital. Journals have long served at the heart of the race for
scientific discovery: the certification and dissemination of knowledge allowed scholars to make
priority claims, the traditional building blocks of scientific reputation (Dasgupta & David, 1994).
However, the direct relationship between cash rewards and JIF is a gross perversion of the reward
system in which economic incentives become the main objective of publishing. It is clear that
measure has become the target (Strathern, 1997), as evident by the explicit manipulations within
the system and the gross goal displacement in favor of high impact journals, whereby there is a
prioritization of metrics over ethics (Franck, 1999; Osterloh & Frey, 2014).
When he published the first iteration of the JCR, Garfield (1976c) hoped that it could “prove
itself indispensable to people who cannot rely on economic criteria alone in making basic
decisions about journals, since the law of supply and demand is not always allowed to prevail”
(p.1). The JIF became more than that: in many ways, it has become itself an economic item,
capitalizing upon academic capital and the need for its measurement. As such, it has been grossly
misapplied to make decisions about papers and authors, rather than journals, and caused
distortions within the scholarly system. And while Garfield foresaw the use of the JIF for research
evaluation, he also formulated recommendations for its proper use in his introduction of the first
JCR (Garfield, 1976b, p.1):
27
“Like any other tool, the JCR cannot be used indiscriminately. It is a source of highly
valuable information, but that information must be used within a total framework proper
to the decision to be made, the hypothesis to be examined, and rarely in isolation without
consideration of other factors, objective and subjective.”
Among these subjective factors, Garfield noted the reputation of the author, the controversial
nature of the subject, the circulation and cost of the journal, and the degree to which the work is
accessible. Garfield cautioned against comparing citation rates for journals in different disciplines
and noted the biases in accounting for journals which do not use the Roman alphabet. While those
factors remain quite relevant today, it seems they have been forgotten along the way. Moreover,
since Garfield made these recommendations, English has become the lingua franca of research
(Montgomery, 2013), which has led to a decline of the relative importance of non-English
journals in many disciplines and, thus, reinforced the Web of Science—and, by extension, the
JCR—as a measurement tool.
Despite these well-documented limitations and consequences, the JIF will likely remain part of
the research ecosystem and as long as journals remain the primary mechanism for diffusing new
knowledge, their reputation—as established by JIF or an alternative—will remain a marker of
capital. It is essential, therefore, that actors within this system are provided with the means to
interpret and apply the indicators responsibly, in full awareness of the consequences (Hicks et al.,
2015; Lawrence, 2003). Perhaps more importantly, the scientific community must collectively
ask: is the use of the Journal Impact Factor good for science?
Cited References
Academy of IRMBR. (2017). International Review of Social Sciences (IRSS). Retrieved from:
https://scholar.google.com.my/citations?user=k7ZMMxIAAAAJ&hl=en
Acharya, A., Verstak, A., Suzuki, H., Henderson, S., Iakhiaev, M., Lin, C. C. Y., & Shetty, N.
(2014). Rise of the rest: The growing impact of non-elite journals. arXiv:1410.2217.
Alberts, B. (2013). Impact factor distortions. Science, 340, 787–787. doi:
10.1126/science.1240319
Anseel, F., Duyck, W., De Baene, W., & Brysbaert, M. (2004). Journal impact factors and self-
citations: Implications for psychology journals. American Psychologist, 59, 49-51.
Archambault, É., Larivière, V. (2009). History of the journal impact factor: contingencies and
consequences. Scientometrics, 79(3), 639-653.
Arnold, D. N., & Fowler, K. K. (2011). Nefarious numbers. Notices of the AMS, 58(3), 434-437.
ASCB. (2012). San Francisco Declaration on Research Assessment. Retrieved from:
http://www.ascb.org/dora/
Bagust, A., & Walley, T. (2000). An alternative to body mass index for standardizing body
weight for stature. QJM: An International Journal of Medicine, 93(9), 589-596.
Beall, J. (2013). Index Copernicus has no value. Scholarly Open Access. Retrieved from :
https://web.archive.org/web/20140403010813/http://scholarlyoa.com/2013/11/21/index-
copernicus-has-no-value/
Beall, J. (2017). Beall’s list of predatory journals and publishers. Retrieved from:
http://beallslist.weebly.com/misleading-metrics.html
28
Bergstrom, C.T., & West, J. (2016). Comparing Impact Factor and Scopus CiteScore.
Eigenfactor.org. Retrieved from: http://eigenfactor.org/projects/posts/citescore.php
Bolli, R. (2017). The Impact Factor of Circulation Research Reaches a New High. Circulation,
121(3), 199.
Brumback, R.A. (2012). “3…2…1…Impact [Factor]: Target [Academic Career] Destroyed!”:
Just another statistical casualty. Journal of Child Neurology, 27(12), 1565-1576.
Butler, L. (2003). Explaining Australia’s increased share of ISI publications: the effects of a
funding formula based on publication counts. Research Policy, 32, 143–155.
Cal State East Bay. (2017). Analyzing scholarly research: Bibliometrics, altmetrics, journal
impact factors, citation analysis: Journal Impact Factors. Retrieved from:
http://library.csueastbay.edu/analyzingscholarlyresearch/journalimpactfactors
Calcagno, V., Demoinet, E., Gollner, K., Guidi, L., Ruths, D., de Mazancourt, C. (2012). Flows
of research manuscripts among scientific journals reveal hidden submission patterns.
Science, 338, 1065-1069.
Campbell, D.T. (1979). Assessing the impact of planned social change. Evaluation and Program
Planning, 2, 67-90.
Campbell, P. (2008) Escape from the impact factor. Ethics in Science and Environmental Politics,
8(1), 5-7.
Chorus, C. & Waltman, L. (2016). A large-scale analysis of impact factor biased journal self-
citations. PLoS ONE 11(8): e0161021. https://doi.org/10.1371/journal.pone.0161021
Clarivate Analytics. (2017). Title suppression from Journal Citation Reports. Retrieved from:
http://wokinfo.com/media/pdf/jcr-suppression.pdf
Cronin, B. (2012). Do me a favor. Journal of the American Society for Information Science and
Technology, 63(7), 1281.
Cryanoski, D. (2010). Strong medicine for China’s journals. Nature. Retrieved from:
http://www.nature.com/news/2010/100915/full/467261a.html
Dasgupta, P., & David, P. A. (1994). ‘Toward a New Economics of Science. Research Policy, 23,
487–521.
Davis, P. (2012). The emergence of a citation cartel. The Scholarly Kitchen. Retrieved from:
https://scholarlykitchen.sspnet.org/2012/04/10/emergence-of-a-citation-cartel/
Davis, P. (2017a). Citation cartel or editor gone rogue? The Scholarly Kitchen. Retrieved from :
https://scholarlykitchen.sspnet.org/2017/03/09/citation-cartel-or-editor-gone-rogue/
Davis, P. (2017b). Reverse Engineering JCR’s Self-Citation and Citation Stacking Thresholds.
The Scholarly Kitchen. Retrieved from :
https://scholarlykitchen.sspnet.org/2017/06/05/reverse-engineering-jcrs-self-citation-
citation-stacking-thresholds/
de Solla Price, D. (1963). Little Science, Big Science. New York: Columbia University Press.
Doherty, P. (2015). How important is a journal’s impact factor? Nobel Prize Inspiration
Initiative. Retrieved from : http://www.nobelprizeii.org/videos/important-journals-
impact-factor/
Elsevier. (2007). Elsevier announces significant increases in Impact Factors. Retrieved from:
https://www.elsevier.com/about/press-releases/research-and-journals/elsevier-announces-
significant-increases-in-impact-factors

29
Fong, E.A. & Wilhite, A.W. (2017). Authorship and citation manipulation in academic research.
PLoS ONE 12(12): e01897394. https://doi.org/10.1371/journal.pone.0187394
Franck, G. (1999). Scientific communication—a vanity fair? Science, 286, 53-56.
Franzoni, C., Scellato, G. & Stephan, P. (2011). Science policy. Changing incentives to publish.
Science, 333(6043), 702-703.
Garfield E. (1955). Citation indexes for science: a new dimension in documentation through
association of ideas. Science, 122, 108-111.
Garfield, E. (1967). English - an international language for science? Current Contents, 19-20.
Garfield, E. (1972). Citation analysis as a tool in journal evaluation. Science, 178(4060), 471-479.
Garfield, E. (1976a). Preface. In Garfield, E. (Ed.) Journal Citation Reports ® A Bibliometric
Analysis of References Processed for the 1974 Science Citation Index ®. Science Citation
Index, Volume 9, 1975 Annual.
Garfield, E. (1976b). Introduction I. Journals, References, and Citations. In Garfield, E. (Ed.)
Journal Citation Reports ® A Bibliometric Analysis of References Processed for the 1974
Science Citation Index ®. Science Citation Index, Volume 9, 1975 Annual.
Garfield, E. (1976c). Introduction II. Why the Journal Citation Reports? ®. In Garfield, E. (Ed.)
Journal Citation Reports ® A Bibliometric Analysis of References Processed for the 1974
Science Citation Index ®. Science Citation Index, Volume 9, 1975 Annual.
Garfield, E., & Sher, I. H. (1963). New factors in the evaluation of scientific literature through
citation indexing. American Documentation, 14(3), 195-201.
George Washington University. (2017). Himmelfarb Health Sciences Library: Scholarly
Publishing: Predatory Publishing. Retrieved from:
http://libguides.gwumc.edu/scholarlypub/predatory_publishing
Glänzel, W., & Moed, H. F. (2002). Journal impact measures in bibliometric research.
Scientometrics, 53(2), 171– 193.
Global Impact Factor. (2017). Evaluation Method. Retrieved from:
http://globalimpactfactor.com/evaluatiion-method/
Global Institute for Scientific Information. (2017). Journal Impact Factor (JIF). Retrieved from :
http://www.jifactor.com/index.asp
González-Pereira, B., Guerrero-Bote, V. P., & Moya-Anegón, F. (2010). A new approach to the
metric of journals scientific prestige: The SJR indicator. Journal of Informetrics, 4(3),
379–391. http://dx.doi.org/10.1016/j.joi.2010.03.002
Goodhart, C. (1975a). Monetary relationships: a view from Threadneedle Street. Papers of
Monetary Economics. Volume 1. Reserve Bank of Australia.
Goodhart, C. (1975b). Problems of monetary management: the UK experience. Papers of
Monetary Economics. Volume 1. Reserve Bank of Australia.
Govendir, M. (2016). Veterinary Quarterly 2015 Impact Factor increases to 1.047. The Veterinary
Quarterly, 36(3), 121.
Gross, P. L. K., & Gross, E. M. (1927). College libraries and chemical education. Science,
66(1713), 385–389.
Guerrero-Bote, V.P., & Moya- Anegón, F. (2012). A further step forward in measuring journals’
scientific prestige: The SJR2 indicator. Journal of Informetrics, 6, 674-688.
Hicks, D., Wouters, P., Waltman, L., De Rijcke, S., & Rafols, I. (2015). The Leiden Manifesto
for research metrics. Nature, 520(7548), 429-431.

30
Holub, H.W., Tappeiner, G., & Eberharter, V. (1991). The iron law of important articles.
Southern Economics Journal, 58, 317–328.
Hubbard, S. (2016). Journal suppressions in the 2015 JCR data—why so few? Clarivate.com.
Retrieved from: http://clarivate.com/journal-suppressions-in-the-2015-jcr-data-why-so-
few/
Hubbard, S.C., & McVeigh, M.E. (2011) Casting a wide net: the journal impact factor numerator.
Learned Publishing, 24, 133–137
Hvistendahl, M. (2013). China's publication bazaar. Science, 342(6162), 1035-1039.
International Impact Factor Services (2017). Homepage. Retrieved from:
http://impactfactorservice.com/
International Scientific Indexing. (2017). Payments. Retrieved from:
http://isindexing.com/isi/payment.php
Jin, B., & Rousseau, R. (2004). Evaluation of research performance and scientometric indicators
in China. in H. F. Moed, W. Glänzel and U. Schmoch (Ed.), Handbook of quantitative
science and technology research: the use of publication and patent statistics in studies of
S&T systems. Dordrecht; London, Kluwer Academic Publishers: 497-514.
Kiesslich, T., Weineck S. B., Koelblinger, D. (2016) Reasons for Journal Impact Factor Changes:
Influence of Changing Source Items. PLOS ONE, 11(4): e0154199.
doi:10.1371/journal.pone.0154199
Larivière, V. (2014). De l'importance des revues de recherche nationales. Découvrir, la revue de
l’ACFAS. Retrieved from: http://www.acfas.ca/publications/decouvrir/2014/09/l-
importance-revues-recherche-nationales
Larivière, V., & Gingras, Y. (2010). The impact factor's Matthew Effect: A natural experiment in
bibliometrics. Journal of the Association for Information Science and Technology, 61(2),
424-427.
Larivière, V., Archambault, É., & Gingras, Y. (2008). Long‐term variations in the aging of
scientific literature: From exponential growth to steady‐state science (1900–2004).
Journal of the Association for Information Science and Technology, 59(2), 288-296.
Larivière, V., Gingras, Y. (2010). The impact factor's Matthew effect: a natural experiment in
bibliometrics. Journal of the American Society for Information Science and Technology,
61(2), 424-427.
Larivière, V., Gingras, Y., Archambault, É. (2009) The decline in the concentration of citations,
1900-2007. Journal of the American Society for Information Science and Technology,
60(4), 858-862.
Larivière, V., Kiermer, V., MacCallum, C. J., McNutt, M., Patterson, M., Pulverer, B.,
Swaminathan, S., Taylor, S., Curry, S., 2016. A simple proposal for the publication of
journal citation distributions. Biorxiv, p.062109.
http://www.biorxiv.org/content/early/2016/07/05/062109
Lebiedowska, M. K., Alter, K. E., & Stanhope, S. J. (2008). Human body shape index based on
an experimentally derived model of human growth. The Journal of Pediatrics, 152(1),
45-49.
Lotka, A. J. (1926). The frequency distribution of scientific productivity. Journal of the
Washington Academy of Sciences, 16(12), 317-323.

31
Lozano, G. A., Larivière, V., & Gingras, Y. (2012). The weakening relationship between the
impact factor and papers' citations in the digital age. Journal of the Association for
Information Science and Technology, 63(11), 2140-2145.
Lucas, R. E. (1976). Econometric policy evaluation: a critique. In Brunner, K. and Meltzer,
A. The Phillips Curve and Labor Markets. Carnegie-Rochester Conference Series on
Public Policy. Volume 1. New York: American Elsevier. pp. 19–46.
Martin, B.R. (2013). Whither research integrity? Plagiarism, self-plagiarism, and coercive citation
in the age of research assessment. Research Policy, 42, 1005–14.
McVeigh, M.E. (2002). Journal self-citation in the Journal Citation Reports – Science Edition
(2002). Retrieved from: http://wokinfo.com/essays/journal-self-citation-jcr/
McVeigh, M.E., & Mann, S.J. (2009). The Journal Impact Factor Denominator. Defining Citable
(Counted) Items. Journal of the American Medical Association, 302 (10), 1107-1109.
Merton, R. K. (1973). The Sociology of Science: Theoretical and Empirical Investigation.
Chicago, IL: University of Chicago Press.
Moed, H.F. (2002). The impact-factors debate: the ISI’s uses and limits. Nature, 415, 731-732.
Moed, H. F., van Leeuwen, T. N. (1995a). Improving the accuracy of Institute for Scientific
Information’s journal impact factors. Journal of the American Society for Information
Science, 46(6), 461–467.
Moed, H. F., van Leeuwen, T. N. (1995b). Impact factors can mislead. Nature, 381(6579), 186.
Moed, H.F. (2010). Measuring contextual citation impact of scientific journals. Journal of
Informetrics, 4, 265-277.
Moed, H.F., De Bruin, R.E., & van Leeuwen, T.N. (1995). New bibliometric tools for the
assessment of national research performance: database description, overview of
indicators and first applications. Scientometrics, 33(3), 381–422.
Monastersky, R. (2005). The number that’s devouring science. The Chronicle of Higher
Education. Retrieved from: http://www.chronicle.com/article/The-Number-Thats-
Devouring/26481
Mongeon, P., Waltman, L. & de Rijcke, S. (2016). What do we know about journal citation
cartels? A call for information. CWTS Blog. Retrieved from:
https://www.cwts.nl/blog?article=n-q2w2b4
Montgomery, S. L. (2013). Does science need a global language?: English and the future of
research. Chicago: University of Chicago Press.
Müller, R. & De Rijcke, S. (2017). Thinking with indicators. Exploring the Epistemic Impacts of
Academic Performance Indicators in the Life Sciences. Research Evaluation. doi:
10.1093/reseval/rvx023
NHMRC. (2010). NHMRC removes journal impact factors from peer review of individual
research grant and fellowship applications. Retrieved from :
https://www.nhmrc.gov.au/_files_nhmrc/file/grants/peer/impact%20factors%20in%20pee
r%20review.pdf
Nisonger, T.E. (2000). Use of Journal Citation Reports for serials management in research
libraries: An investigation of the effect of self-citation on journal rankings in library and
information science and genetics. College & Research Libraries, 61, 263-275.
Opthof, T. (2013). Inflation of impact factors by journal self-citation in cardiovascular science.
Netherlands Heart Journal, 21(4), 163-165.
32
Osterloh, M., & Frey, B. S. (2014). Ranking Games. Evaluation Review, 39(1), 102-129.
Qiu, J. (2010). Publish or perish in China. Nature, 463(7278), 142-143.
Quan, W., Chen, B-C., & Shu, F (2017). Publish or poverish: An investigation of the monetary
reward system of science in China (1999-2016). Aslib Journal of Information
Management, 69(4).
Reedijk, J. & Moed, H.F. (2008). Is the impact of journal impact factors decreasing? Journal of
Documentation, 64(2), 183-192.
Roach, M., & Sauermann, H. (2010). A Taste for Science? PhD Scientists’ Academic Orientation
and Self-selection into Research Career in Industry. Research Policy, 39, 422–34.
Rossner, M., Van Epps, H., & Hill, E. (2007). Show me the data. Journal of Cell Biology, 179 (6)
1091-1092.
Rousseau, R. (1999). Temporal differences in self-citation rates of scientific journals.
Scientometrics, 44, 521–531.
Rousseau, R. (2005). Median and percentile impact factors: A set of new indicators.
Scientometrics, 63(3), 431-441.
Rushforth, A., & de Rijcke, S. (2015). Accounting for Impact? The Journal Impact Factor and the
Making of Biomedical Research in the Netherlands. Minerva, 53(2), 117–139
Sample, I. (2013). Nobel winner declares boycott of top science journals. The Guardian.
Retrieved from: https://www.theguardian.com/science/2013/dec/09/nobel-winner-
boycott-science-journals
Schubert, A., and Braun, T. (1986). Relative indicators and relational charts for comparative
assessment of publication output and citation impact. Scientometrics, 9(5–6), 281–291.
Seglen, P. O. (1992). The skewness of science. Journal of the American Society for Information
Science, 43(9), 628-638.
Seglen, P.O. (1997). Why the impact factor of journals should not be used for evaluating
research. British Medical Journal, 314(7079), 498-502.
Shao, J. & Shen, H. (2011). The outflow of academic papers from China: why is it happening and
can it be stemmed? Learned Publishing, 24, 95-97.
Shibayama, S., & Baba, Y. (2015). Impact-oriented science policies and scientific publication
practices: The case of life sciences in Japan. Research Policy, 44, 936–950.
Simren, M., Mawe, G., Galligan, J., Bradesi, S., & Bredenoord, A. (2015). Impact factor
increases to its highest level ever. Neurogastroenterology & Motility, 27(8), 1051.
Smith, R. (1997). Journal accused of manipulating impact factor. BMJ, 312, 461.
Sombatsompop, N., Markpin, T., Premkamolnetr, N. (2004), A modified method for calculating
the impact factors of journals in ISI Journal Citation Reports: polymer science category
in 1997-2001. Scientometrics, 60, 217-235.
Sosteric, M. (1999). Endowing mediocrity: neoliberalism, information technology, and the
decline of radical pedagogy. Radical Pedagogy, 1(1).
Springer. (2016). Impact factors of Springer and Palgrave Macmillan journals announced:
increased number of journals in JCR. Retrieved from:
https://www.springer.com/gp/about-springer/media/press-releases/corporate/impact-
factors-of-springer-and-palgrave-macmillan-journals-announced--increased-number-of-
journals-in-jcr/10286018

33
Strathern, M. (1997). Improving ratings: audit in the British university system. European Review,
5(3), 305-321.
Sugimoto, C.R., Larivière, V. (2018). Measuring research: what everyone needs to know.
Oxford: Oxford University Press.
Thomson Reuters. (2016). Title suppressions. Retrieved from: http://ipscience-
help.thomsonreuters.com/incitesLiveJCR/JCRGroup/titleSuppressions.html
Van Noorden, R. (2010). Metrics: A profusion of measures. Nature, 465, 864-866.
Van Noorden, R. (2012). Record number of journals banned for boosting impact factor with self-
citations. Nature News Blog. Retrieved from :
http://blogs.nature.com/news/2012/06/record-number-of-journals-banned-for-boosting-
impact-factor-with-self-citations.html
West, J.D., Bergstrom, T.C., & Bergstrom, C.T. (2010). The EigenfactorTM
Metrics: a network
approach to assessing scholarly journals. College & Research Libraries, 71, 236-244.
Waltman, L., & Traag, V. A. (2017). Use of the journal impact factor for assessing individual
articles need not be wrong. arXiv preprint arXiv:1703.02334.
Waltman, L. van Eck, N.J., van Leeuwen, T.N., & Visser, M.S. (2013). Some modifications to
the SNIP journal impact indicator. Journal of Informetrics, 7(2), 272-285.
Wilhite A.W., Fong, E.A. (2012). Coercive citation in academic publishing. Science, 335, 542–
543.
Wiley. (2016). Wiley journals increase Impact Factors in 2015 Journal Citation Reports.
Retrieved from: http://www.wiley.com/WileyCDA/PressRelease/pressReleaseId-
126482.html?campaign=jrpm
Zijlstra, H., & McCullough, R. (2016). CiteScore : a new metric to help you track journal
performance and make decisions. Elsevier. Retrieved from :
https://www.elsevier.com/editors-update/story/journal-metrics/citescore-a-new-metric-to-
help-you-choose-the-right-journal