the j biological c vol. 278, no. 46, issue of … · from the ‡department of cell biology and...
TRANSCRIPT

Adipocyte-selective Reduction of the Leptin Receptors Induced byAntisense RNA Leads to Increased Adiposity, Dyslipidemia, andInsulin Resistance*□S
Received for publication, April 21, 2003, and in revised form, August 8, 2003Published, JBC Papers in Press, August 18, 2003, DOI 10.1074/jbc.M304165200
Jing-Ning Huan‡, Ji Li‡, Yiping Han‡, Ke Chen‡, Nancy Wu§, and Allan Z. Zhao‡¶
From the ‡Department of Cell Biology and Physiology, University of Pittsburgh, Pittsburgh, Pennsylvania 15261and the §Department of Biochemistry, University of Southern California, Norris Cancer Research Institute,Los Angeles, California 90033
Although recent evidence suggests that leptin can di-rectly regulate a wide spectrum of peripheral functions,including fat metabolism, genetic examples are stillneeded to illustrate the physiological significance of di-rect actions of leptin in a given peripheral tissue. To thisend, we used a technical knock-out approach to reducethe expression of leptin receptors specifically in whiteadipose tissue. The evaluation of leptin receptor reduc-tion in adipocytes was based on real time PCR analysisof the mRNA levels, Western blot analysis of the pro-teins, and biochemical analysis of leptin signaling capa-bility. Despite a normal level of leptin receptors in thehypothalamus and normal food intake, mutant mice de-veloped increased adiposity, decreased body tempera-ture, hyperinsulinemia, hypertriglyceridemia, impairedglucose tolerance and insulin sensitivity, as well as ele-vated hepatic and skeletal muscle triglyceride levels. Inaddition, a variety of genes involved in regulating fatand glucose metabolism were dysregulated in white ad-ipose tissue. These include tumor necrosis factor-�, adi-ponectin, leptin, fatty acid synthase, sterol regulatoryelement-binding protein 1, glycerol kinase, and �3-adre-nergic receptor. Furthermore, the mutant mice are sig-nificantly more sensitive to high fat feeding with regardto developing obesity and severe insulin resistance.Thus, we provide a genetic model demonstrating thephysiological importance of a peripheral effect of leptinin vivo. Importantly, this suggests the possibility thatleptin resistance at the adipocyte level might be a mo-lecular link between obesity and type 2 diabetes.
Leptin deficiency in ob/ob mice and leptin receptor deficiencyin db/db mice lead to hyperphagia, sterility, obesity, and dia-betes (1–4). The ability of leptin to regulate food intake, bodyweight, adiposity, and insulin sensitivity has been demon-strated extensively (for review, see Refs. 1 and 5). These vitalfunctions of leptin have been attributed exclusively to its ac-tions in the hypothalamus (2). Accordingly, intracerebroven-
tricular injection of leptin in ob/ob mice can reduce food intakeand body weight and alleviate the diabetic phenotypes (6).However, when leptin is peripherally infused or overexpressedin vivo, only a portion of the leptin-induced weight loss can beattributed to a reduction in food intake in the leptin-treatedanimals compared with the control animals with matched ca-loric intake (7–10). Recent evidence at the cellular level furtherdemonstrates that leptin can directly modulate glycerol re-lease, insulin signaling, and gene expression in primary rodentadipocytes (11, 12). At a genetic level, Kowalski et al. (13) foundthat transgenic expression of the long form leptin receptor,OB-Rb, in the central nervous system could only partially cor-rect the obesity and diabetic phenotypes of db/db mice. Cohenet al. (14) demonstrated that mutant mice with brain-specificdeletion of the leptin receptors developed obesity, whereas mu-tant mice with liver-specific deletion of leptin receptors did notexhibit any weight-related phenotype. Interestingly, theweight gain of the mutant mice with brain-specific deletion ofleptin receptors was not as great as that of ob/ob and db/dbmice at equivalent ages (14). These studies point to the possi-bility of a peripheral effect of leptin on body weight regulation.Indeed, many recent studies have suggested that at the cellularlevel leptin can play important physiological roles in manysystems, such as adipocytes, hepatocytes, skeletal muscle, T-lymphocytes, pancreatic �-cells, and vascular endothelial cells(11, 15–21). In this study, we aim to create a genetic model toinvestigate whether leptin might play a role in regulating theperipheral functions (such as those of adipocytes) in vivo, inaddition to its actions in the central nervous system.
The technical knock-out (TKO)1 system has been deployedsuccessfully to reduce the expression of several signaling pro-teins relevant to glucose and lipid homeostasis, such as G�i2
and G�q (22–24). This technology takes advantage of the tissuespecificity of a rat phosphoenolpyruvate carboxykinase(PEPCK) promoter to drive and restrict the expression of shortantisense sequences of a given target gene in fat and liverwithout affecting other nontarget genes or nontarget tissues(22, 24). Because of the developmental regulatory nature ofPEPCK promoter, the transgene (with the antisense se-quences) is not expressed until after birth, thus eliminatingconcerns regarding any potential compensatory changes duringembryonic development. By taking advantage of the TKO sys-
* This work was supported by a career development award from theAmerican Diabetes Association, by a pilot and feasibility grant from theObesity and Nutrition Research Center, and by a competitive medicalresearch fund from the School of Medicine at the University of Pitts-burgh. The costs of publication of this article were defrayed in part bythe payment of page charges. This article must therefore be herebymarked “advertisement” in accordance with 18 U.S.C. Section 1734solely to indicate this fact.
□S The on-line version of this article (available at http://www.jbc.org)contains Supplemental Data Figs. 1–3.
¶ To whom correspondence should be addressed: Department of CellBiology and Physiology, University of Pittsburgh, S-326, 3500 TerraceSt., Pittsburgh, PA 15261. E-mail: [email protected].
1 The abbreviations used are: TKO, technical knock-out; MAPK, mi-togen-activated protein kinase; OBR, OB receptor; PEPCK, phos-phoenolpyruvate carboxykinase; PI3-kinase, phosphatidylinositol 3-ki-nase; PPAR-�, peroxisome proliferator-activated receptor; RT, reversetranscription; SREBP-1, sterol regulatory element-binding protein 1;STAT3, signal transducers and activators of transcription-3; TNF-�,tumor necrosis factor-�; WAT, white adipocyte tissue(s).
THE JOURNAL OF BIOLOGICAL CHEMISTRY Vol. 278, No. 46, Issue of November 14, pp. 45638–45650, 2003© 2003 by The American Society for Biochemistry and Molecular Biology, Inc. Printed in U.S.A.
This paper is available on line at http://www.jbc.org45638
by guest on August 30, 2018
http://ww
w.jbc.org/
Dow
nloaded from

tem, we can express a short stretch of antisense sequences ofleptin receptor gene in fat and liver and potentially createmutant mice with selective leptin receptor deficiency in thesetissues. The transgenic mice thus created are hereafter re-ferred to as TKO-OBR mice, short for technical knock-out of OBreceptor. Here, we describe our initial characterizations of suchmutant mice.
EXPERIMENTAL PROCEDURES
Transgenic Mice, Genotyping, and Determination of Transgene Ex-pression—An antisense sequence corresponding to a short stretch ofsequences (39 bp) immediately 5� to the ATG initiation codon of theleptin receptor mRNA was inserted into the TKO vector, which wasthen used to generate transgenic animals (Fig. 1A). A BLAST search inthe GenBank nucleotide data base indicated that this stretch of se-quence showed no significant homology to any other known mouse
genes. We used B6D2F1 hybrid strain for the initial production oftransgenic mice. Subsequently, three independent lines were back-crossed with C57BL/6 to the F4 generations. All phenotypic changes ofthe TKO-OBR mice were relative to their wild-type littermates. Theanimals were fed standard food and water ad libitum, housed undercontrolled temperature at 22 °C and a 12-h light-dark cycle with lightfrom 0630 to 1830 h. All animals were handled in accordance with theguidelines established by the Institutional Animal Care and Use Com-mittee at the University of Pittsburgh. The sequences of primers forgenotyping are as follows: P1, 5�-CGTTTAGTGAACCGTCAGA; P2, 5�-TTGCCAAACCTACAGGTGGG; P3, 5�-CCCTTCTCATGACCTTTGGC-CGTG; P4, 5�-CCAGGTGTACACCTCTGAAGAAAG. For determinationof transgene expression, the RNA samples (�100 ng each) from differ-ent tissues were subject to a RT-PCR (with P1 and P2 as primers)followed by a Southern blot with a probe generated from the regionflanked by P1 and P2. The specific primers for mouse glyceraldehyde-3-phosphate dehydrogenase gene are 5�-ACCACAGTCCATGCCATCAC
FIG. 1. Generation of TKO-OBR mice and expression of TKO-OBR transgene. A, the antisense sequences of leptin receptor (39 bp,corresponding to the region 5� to the ATG initiation codon) were inserted into the first exon of a rat PEPCK gene. B, genotyping of TKO-OBR micewas carried out with a PCR screening of the tail genomic DNA samples with two sets of specific primers (P1/P2 and P3/P4) engineered into thetransgene construct. Both primers are unique to the transgene construct. The appearance of both bands with expected sizes (�230 bp for P1/P2,�670 bp for P3/P4) indicates positive transgenic clones. In this case, the positive clones are 1, 2, 4, 5, and 7. Lane M, markers. C, tissue-specificexpression of TKO-OBR gene as determined by a virtual Northern blot assay. The RNA samples (�100 ng each) from different tissues weresubjected to a RT-PCR (with P1 and P2 as primers) followed by a Southern blot. Tissue samples (1–7 and 11–14 are from TKO-OBR mice, 9 and10 from wild-type littermates): lane 1, brown fat; lane 2, brain; lane 3, heart; lane 4, lung; lane 5, kidney; lane 6, skeletal muscle; lane 7, spleen;lane 8, ddH2O; lane 9, fat from wild-type littermates; lane 10, liver from wild-type littermates; lane 11, liver; lane 12, fat; lane 13, testis; lane 14,pancreas. A semiquantitative (�25 cycles) RT-PCR is also performed to determine the levels of 18 S ribosomal RNA expression, which served asa control of RNA quantity. D, an extensive RT-PCR amplification (40 cycles, with P1 and P2 as primers) detected no expression in the hypothalamicRNA samples of the transgenic mice (TKO-OBR). The three hypothalamic samples (Hyp.) were from three transgenic mice. The expression ofglyceraldehyde-3-phosphate dehydrogenase (GAPDH) was used as the control. The experiment was repeated twice. Lane M, markers.
Leptin Receptor Functions in Adipocytes 45639
by guest on August 30, 2018
http://ww
w.jbc.org/
Dow
nloaded from
and 5�-TCCACCACCCTGTTGCTGTA. The RNA samples were ex-tracted using a standard Trizol kit (Invitrogen).
Western Blot Assays—Protein samples were prepared by extractingtissues with an immunoprecipitation assay buffer described previously(25), separated on 8% or 10% SDS gels, and then blotted onto nitrocel-lulose membrane. The blots were incubated with appropriately dilutedprimary antibodies and horseradish peroxidase-conjugated secondarybefore being subjected to a chemiluminescent reaction for detection.The sources of antibodies are as follows: leptin, Peprotech, NJ; fattyacid synthase, BD Transduction Laboratory; tumor necrosis factor-�(TNF-�,) sterol regulatory element-binding protein 1 (SREBP-1), �3-adrenergic receptor, leptin receptor (K-20), and peroxisome prolifera-tor-activated receptor-� (PPAR-�), Santa Cruz Biotechnology, CA. Apreviously characterized rabbit polyclonal antibody against all variantsof murine leptin receptor (15) was used to characterize the expressionlevels of leptin receptors except where noted.
Measurement of Food Intake and Rectal Temperature—Transgenicmice and their wild-type littermates were caged individually, and foodwas weighed before and at the end of each day for 2 days. The foodcrumbs were collected and weighed at the end of the observations toprovide accurate assessment of food intake. The cumulative food intakein 48 h was divided by 2 to achieve the values of cumulative food intakein 24 h. The whole procedure was repeated three times for 6 days in arow. The temperature measurements were performed between 0930and 1030 with a rectal microprobe and a microprobe thermometer(BAT-12) (Harvard Apparatus, MA).
Analysis of Total Body Fat Content—The analysis of total body fatcontent was according to a previously published protocol (14). Mice at18–19 weeks of age were sacrificed, and carcasses were weighed andthen oven dried in a 90 °C oven until the weight was constant. Thecarcass was then homogenized in a blender, and duplicate aliquots wereextracted using a 3:1 mixture chloroform/methanol. The extracted ho-mogenate was dried overnight and weighed to calculate fat mass andlean mass.
Intraperitoneal Glucose Tolerance Test and Insulin Sensitivity Test—After overnight fasting, the mice were injected intraperitoneally withglucose at a dose of 2 g/kg of body weight, and the blood glucose levelswere monitored with Precision-Xtra strips (Medisense Products, MA)for 2 h through tail vein blood samples. For insulin sensitivity test, themice were fasted overnight before being injected with a bolus of insulin(0.3 unit/kg of body weight), and their blood glucose levels were moni-tored through tail vein blood.
Measurements of Triglyceride Levels in Serum and Tissues, SerumLevels of Insulin, Leptin, TNF-�, and Adiponectin—Hepatic and skele-tal muscle triglycerides were extracted with a protocol establishedpreviously (10). The levels of triglyceride were determined with anInfinity Triglyceride kit (Sigma). The serum insulin and adiponectinlevels were measured with radioimmunoassay kits from Linco Re-search, and the serum leptin level was determined with a radioimmu-noassay kit from Alpco. The serum TNF-� level was determined with anenzyme-linked immunosorbent assay kit from Assay Designs, Inc. (AnnArbor, MI). All comparisons were subjected to a two-tailed Student’s ttest with p � 0.05 considered statistically significant.
Determination of Leptin Signaling—Mice were fasted but given freeaccess to water, for 8 h before intraperitoneal injection of 1 mg/kg salineor leptin. The animals were sacrificed 30 min after injection, and thewhite adipose tissue (WAT) and liver were rapidly removed and frozenin liquid nitrogen. For in vitro analysis, primary adipocytes were iso-lated from epididymal fat pad of both transgenic and wild-type micebased on a previous protocol (25). The adipocytes were subsequentlytreated with leptin or insulin for 10 min before being harvested foranalysis of leptin signaling. The analysis of PI3-kinase was carried outwith a protocol described previously in which we used an anti-phospho-tyrosine (pY20) antibody (Transduction Laboratory) to precipitate thePI3-kinase activity (15). The analysis of phospho-STAT3 and phospho-MAPK was based on Western blot analysis with an anti-phospho-STAT3 (pY705) antibody and an anti-phospho-MAPK (pT202/pY204)antibody, respectively (Cell Signaling). Quantitative analysis wasachieved by scanning and quantifying the bands of interest with a NIHImage 6.0 program, and all comparisons were subjected to a two-tailedStudent’s t test with p � 0.05 considered statistically significant. Re-combinant mouse leptin (AFP376C) was obtained NHPP, NFDDK, andDr. A. F. Parlow.
RESULTS
Genotyping of TKO-OBR mice was performed using a stand-ard PCR screening of tail genomic DNA with two different pairs
of specific primers engineered into the transgene construct(P1/P2 and P3/P4, Fig. 1A). Transgenic clones were identifiedby the presence of P1/P2 and P3/P4 amplicons (examples shownin Fig. 1B). Tissue specificity of the transgene at the mRNAlevel was determined through a sensitive reverse transcription(RT)-PCR assay (Fig. 1, C and D). The transgene proved to beexpressed at high levels in the WAT and in the liver, and atmuch lower levels in the kidney (Fig. 1C, lanes 12, 11, and 5,respectively). Expression was not detectable either in thebrain, brown fat, heart, lung, pancreas, spleen, skeletal muscle,and testis, or in the fat and liver of wild-type mice (Fig. 1C). Toeliminate further the possibility that the transgene may beexpressed in the hypothalamus, we also performed RT-PCRanalysis on the hypothalamic samples from the transgenic micewith an extensive amplification (40 cycles). No expression ofthe transgene was detected in the hypothalamic RNA samplesof the TKO-OBR mice (example shown in Fig. 1D). This expres-sion pattern accurately reflects the tissue specificity of a tra-ditional PEPCK promoter as described before (26).
The loss of leptin receptor expression in WAT was evaluatedfrom three different aspects, which include Western analysis ofOBR protein levels, real time PCR analysis of OBR mRNAlevels, and examination of leptin signaling capability in WAT ofthe TKO-OBR mice. With a specific antibody recognizing sev-eral variants of leptin receptor (15), we analyzed OBR expres-sion at the protein level in different tissues of the TKO-OBRmice. Although this antibody has been characterized previously(15), we further demonstrated its specificity by comparing itsimmunoactivity with that of another leptin receptor antibodyrecognizing different epitopes (K20, Santa Cruz Biotechnology,CA). The results in Fig. 2A indicate that the two different leptinreceptor antibodies detected the same long and/or short formsof leptin receptors from the hypothalamic and WAT samples onWestern blot assays. The sizes of the long and short forms ofleptin receptors detected here are consistent with those ob-served in previous studies (21, 27–29). The identification ofOB-Rb was confirmed by further comparing the immunoreac-tive bands of the wild-type brain with those of db/db hypotha-lamic and brain extracts because the db/db mice do not expressOB-Rb but maintain the expression of short forms of OBR (4)(Fig. 2B).
The predominant forms of OBR in WAT are the short forms,but this result does not exclude the possibility of a minorpresence of OB-Rb playing important physiological roles. Infact, we were able to detect a low level of OB-Rb expression ina RT-PCR assay (Supplemental Data 1). As anticipated, in allthree independent lines of TKO-OBR mice, the transgene wasable to reduce the expression of leptin receptors substantiallyin the WAT with more than 80% reduction in one line andgreater than 90% reduction in the other two lines (n � 5 foreach genotype; p � 0.05; examples shown in Fig. 2C). Theextent of OBR reduction is essentially the same between themale and female transgenics. These three lines of TKO-OBRmice had very similar phenotypes, and the results describedbelow reflect the averages from all three transgenic lines. Al-though the transgene was highly expressed in the liver andmodestly in the kidney of TKO-OBR mice, it failed to reduce theexpression levels of the leptin receptors expressed in thesetissues (Fig. 2, C and E). Because of the dynamic regulations ofPEPCK gene expression, we also determined the hepatic ex-pression level of leptin receptors under a fasting conditionwhere the transgene was supposed to have the maximal effectbecause of its high expression levels. Even after an extensivefasting period (18 h), the hepatic levels of leptin receptors of theTKO-OBR mice were essentially the same as those of the wild-type littermates (data not shown). We further confirmed the
Leptin Receptor Functions in Adipocytes45640
by guest on August 30, 2018
http://ww
w.jbc.org/
Dow
nloaded from

FIG. 2. Expression levels of leptin receptors in different tissues of TKO-OBR mice. The protein expression levels of leptin receptors weredetermined by a Western blot assay with a specific antibody recognizing all variants of mouse leptin receptors (15). The arrows indicate detectedleptin receptors with the dashed ones indicating the long form of OBR. A, Western blot analysis comparing two different antibodies against theleptin receptors in the hypothalamic (Hypoth.) and WAT extracts. Antibody Ab1 (ours) was a rabbit polyclonal antibody made against a polypeptiderepresenting an extracellular portion of mouse leptin receptors (amino acids 634–784). Antibody Ab2 was a commercial goat polyclonal antibodymade against a peptide representing amino acids 32–51 of mouse leptin receptors (K-20). In each case, the blots were first probed with Ab1. Afterthe Western blot reactions, the blots were stripped and reprobed with Ab2. The two different leptin receptor antibodies clearly recognize the sameimmunoreactive bands. B, demonstration of the absence of OB-Rb in db/db mice with our OB antibody in a Western blot assay. The long form(OB-Rb) was absent in the hypothalamic and brain samples, whereas the short forms of OBR appear to be normal in the db/db mice. Br, brain; hyp,hypothalamus. WT, wild-type. C, the predominant leptin receptors in the liver and WAT are the short forms. In all three independent lines ofTKO-OBR mice, the leptin receptor levels were drastically reduced either �80% (one line) or �90% (two lines), whereas the hepatic expressionlevels of leptin receptors were unaffected. We used STAT3 as a control protein for loading. wt, wild-type. D, the central nervous system andhypothalamic expression of leptin receptors (both the long and the short forms) was not affected in the TKO-OBR mice. The molecular mass of thetop band (�150 kDa) is consistent with the predicted molecular mass of the OB-Rb. E, Western blot analysis of leptin receptor expression inmultiple tissues. The predominant variants of the leptin receptor expressed in the skeletal muscle (SM; lanes 1 and 2), heart (lanes 3 and 4), lung(lanes 5 and 6), kidney (lanes 7 and 8), spleen (lanes 9 and 10), testis (lanes 11 and 12), and brown fat (lanes 13 and 14) are the short forms. Thesizes of the short forms vary slightly from tissue to tissue (110–120 kDa), most likely reflecting tissue-specific post-translational modifications. Inskeletal muscle, brown fat, and to a less extent, the brain tissues, the bands with very high molecular mass (�200 kDa) are similar to the reportedglycosylated leptin receptors (48). The lanes with odd numbers represent the tissue samples from the wild-type littermates; the lanes with evennumbers represent the tissue samples from the TKO-OBR mice.
Leptin Receptor Functions in Adipocytes 45641
by guest on August 30, 2018
http://ww
w.jbc.org/
Dow
nloaded from

reduction of adipocyte leptin receptor expression at the mRNAlevel. We found that the OBR mRNA level in WAT of TKO-OBRmice was reduced by 80% relative to that of wild-type litter-mates (n � 5, p � 0.05), whereas the hepatic ORB mRNA levelwas essentially unchanged (n � 6), further demonstrating adifferential targeting of leptin receptor expression in thesetwo tissues.
Consistent with the RNA expression pattern of the trans-gene, the levels of leptin receptors in the TKO-OBR mice werenot affected in the brain, brown fat, heart, lung, spleen, kidney,skeletal muscle, and testis (Fig. 2, D and E). To eliminate theconcerns that the transgene might alter the levels of leptinreceptor in the hypothalamus, we also isolated hypothalamictissues of TKO-OBR mice and analyzed their expression levelof leptin receptor (examples shown in Fig. 2D). We found nodetectable difference in the hypothalamic expression of leptinreceptors between the TKO-OBR mice and their wild-type lit-termates (wild-type 100% versus TKO-OBR 107 � 10%, n � 4for each genotype). The results thus far indicate that TKO-OBRmice have adipocyte-selective deficiency of leptin receptors and
that they maintained normal levels of leptin receptors in thecentral nervous system, particularly in the hypothalamus.
To provide a functional proof that the leptin actions werereduced in WAT, we examined the ability of leptin to stimulateseveral signaling pathways in WAT. It has been well demon-strated that leptin can activate PI3-kinase, MAPK (p42/44),and STAT3 in a variety of tissues including WAT (30–32).Following the intraperitoneal injection of leptin (1 mg/kg ofbody weight), the STAT3, PI3-kinase, and MAPK were ana-lyzed through either direct measurement of kinase activity ordetection of specific phosphorylation. The injected dosage ofleptin was consistent with those in previous studies (32). Therepresentative samples are shown in Fig. 3. Compared withthose of saline-injected samples, the tyrosine phosphorylation(pY705) of STAT3, the PI3-kinase activity, and the MAPKphosphorylation were all significantly elevated (by 3-, 2.5-, and2.5-fold, respectively) in the WAT of wild-type mice (Fig. 3B).However, in parallel experiments, leptin failed to induce anydetectable activation of these signaling pathways in the WATof TKO-OBR mice (Fig. 3, A and B). In agreement with the
FIG. 3. Examination of leptin signaling in WAT. A, TKO-OBR mice (transgenic; Tg) and their wild-type (wt) littermates were fasted for 8 hbefore being injected with either saline or leptin (1 mg/kg body weight). The WAT were sampled 30 min after injection and analyzed forphosphorylation on STAT3 and MAPK (p42/44) as well as PI3-kinase activity as described under “Experimental Procedures.” B, quantitation ofleptin-induced activation of STAT3, MAPK (p42/44), and PI3-kinases in WAT through NIH Image 6.0. ERK, extracellular signal-regulated kinase.The values from saline-treated samples were arbitrarily set at 1.0. Each set of experiments was repeated twice. n � 4 for each condition in eachgenotype in the STAT3 experiment, n � 5 for the evaluation of PI3-kinase and MAPK. The asterisk (*) indicates p � 0.05 in a two-tailed Student’st test. C, the hepatic samples were also analyzed for leptin-induced activation of PI3-kinase and MAPK (p42/44). Representative samples are shownhere. Leptin activated PI3-kinase by 2.5- and 2.7-fold (p � 0.01) in the wild-type and transgenic samples, respectively. Similarly, MAPK wasactivated by 2.0- and 1.9-fold in the wild-type and transgenic samples, respectively (n � 4 for each condition in each genotype). D, isolated primaryadipocytes were treated with leptin for 10 min before being harvested for detection of leptin-stimulated phospho-MAPK and insulin-stimulatedphospho-Akt. Each lane represents the adipocytes from two different animals of the same genotype, and each set of experiment was repeated twice.E, the quantitative analysis of relative activation of MAPK by leptin and c-Akt by insulin was performed with NIH Image 6.0. The symbol #indicates p � 0.01 in a two-tailed Student’s t test.
Leptin Receptor Functions in Adipocytes45642
by guest on August 30, 2018
http://ww
w.jbc.org/
Dow
nloaded from
observation that the hepatic expression of leptin receptors wasnormal (Fig. 2C), leptin still maintained its hepatic signaling inthe liver of TKO-OBR mice, which was reflected in the activa-tion of PI3-kinase and MAPK (p42/44) (Fig. 3C). To confirmfurther the lack of leptin signaling in the adipocytes of TKO-OBR mice, we also isolated adipocytes from TKO-OBR miceand tested the ability of leptin to stimulate MAPK in vitro.After a 10-min incubation, 5 nM leptin was able to induceMAPK (p42/44) activation by 2.7-fold in the wild-type adipo-cytes (p � 0.01) but failed to do so in the TKO-OBR adipocytes(Fig. 3, D and E). The TKO-OBR adipocytes still maintainedthe signaling response to insulin as evaluated by the phospho-rylation of c-Akt at Ser-473 (Fig. 3D). However, insulin-inducedactivation of c-Akt was reduced significantly in the TKO-OBRadipocytes compared with that in the wild-type adipocytes (1.8-fold versus 3.3-fold in the wild-types) (Fig. 3, D and E), a resultconsistent with the phenotype of insulin resistance (see below).These results demonstrate that the residual OBR activities inWAT are incapable of mediating leptin signaling in the WAT ofTKO-OBR mice.
In agreement with the hypothalamic level of leptin receptorsnot being affected, we found that the TKO-OBR mice consumedthe same quantity of food as the wild-type littermates (Fig. 4A).However, despite comparable caloric intake, both the male andfemale TKO-OBR mice gradually developed significantlyhigher body weight than their wild-type littermates (Fig. 4B).This difference became significant by week 8 for the males andweek 10 for the females (Fig. 4B). By week 22, the body weightof both the male and the female TKO-OBR mice was on averagemore than 20% higher than that of wild-type littermates(37.9 � 2.2 versus 31.0 � 1.6 g, 30.1 � 2.3 versus 24.8 � 1.5 g,respectively; Fig. 4B). Virtually all of this body weight gain wasfrom fat tissue. At 18–19 weeks of age, the genital fat padweight of TKO-OBR mice was significantly greater than that ofwild-type littermates (Table I). A whole body composition anal-ysis also suggests that the TKO-OBR mice had significantlymore fat than their wild-type littermates (Table I). A histolog-ical analysis of the WAT revealed that the sizes of the adipo-cytes in the TKO-OBR mice were on average 2.3-fold of those inthe wild-type littermates (p � 0.0001) (Supplemental Data 2),suggesting that the increased adiposity was due at least in partto adipocyte hypertrophy. Interestingly, the TKO-OBR mice(male or female) also have �four times as much brown fatcompared with their wild-type littermates (Table I). It remainsto be determined histologically whether the increase in brownfat weight in TKO-OBR mice was caused by increased lipidcontent or a result of infiltration of white adipocytes.
The development of increased body weight and adiposity inthe context of normal food intake implies that the TKO-OBRmice should have lower metabolic rate, hence energy expendi-ture, than their wild-type littermates. As an initial test of thisconcept, we measured the body (rectal) temperature of thesemice because body temperature is proportional to energy ex-penditure. As shown in Fig. 4E, both the male and femaleTKO-OBR mice displayed significantly lower body temperaturethan their wild-type littermates. Specifically, the rectal tem-perature of the male transgenics was on average 1.5 °C lowerthan the wild-type males (35.5 � 0.5 versus 37.0 � 0.2 °C, p �0.0001). Similarly, the rectal temperature of the female trans-genics was about 1.4 °C lower than their wild-type counter-parts (35.3 � 0.5 versus 36.7 � 0.1 °C, p � 0.0001). As anadditional control, we also measured the rectal temperature ofseveral male ob/ob mice (of the same age as the other malemice) in these experiments. The average body temperature ofthe ob/ob mice was 34.5 °C, which is in complete agreementwith what had been reported before (33). These results sup-
ported our hypothesis that the TKO-OBR mice have lowerenergy expenditure than their wild-type littermates.
We explored the consequences of leptin receptor deficiency inthe WAT of TKO-OBR mice in more detail, specifically withregard to insulin sensitivity, glucose, and fat metabolism, andadipocyte gene expression. Using the intraperitoneal glucosetolerance test, we found that the male TKO-OBR mice dis-played impaired glucose tolerance as early as week 6–7 (Fig.5A) and that by week 13–14, both the male and female TKO-OBR mice became glucose-intolerant compared with the wild-type controls (Fig. 5B). Because at week 6–7, there was nodifference in body weight between the mutant and wild-typemice, the observed glucose intolerance is likely because of thereduction of leptin receptors in WAT rather than an increase inadiposity. Fasting glucose concentrations were elevated mod-estly in both the male and female TKO-OBR mice relative tothe wild-type littermates (see the zero time point, Fig. 5B),which was associated with a 4-fold elevation of serum insulinlevel (Fig. 5D). The serum leptin level in the TKO-OBR micewas also four times of that in the wild-type littermates (Fig.5D). Consistent with the glucose intolerance, the response ofblood glucose concentrations to an intraperitoneal injection ofinsulin was also impaired (Fig. 5C). These data demonstratethat loss of leptin receptors in WAT can result in insulinresistance.
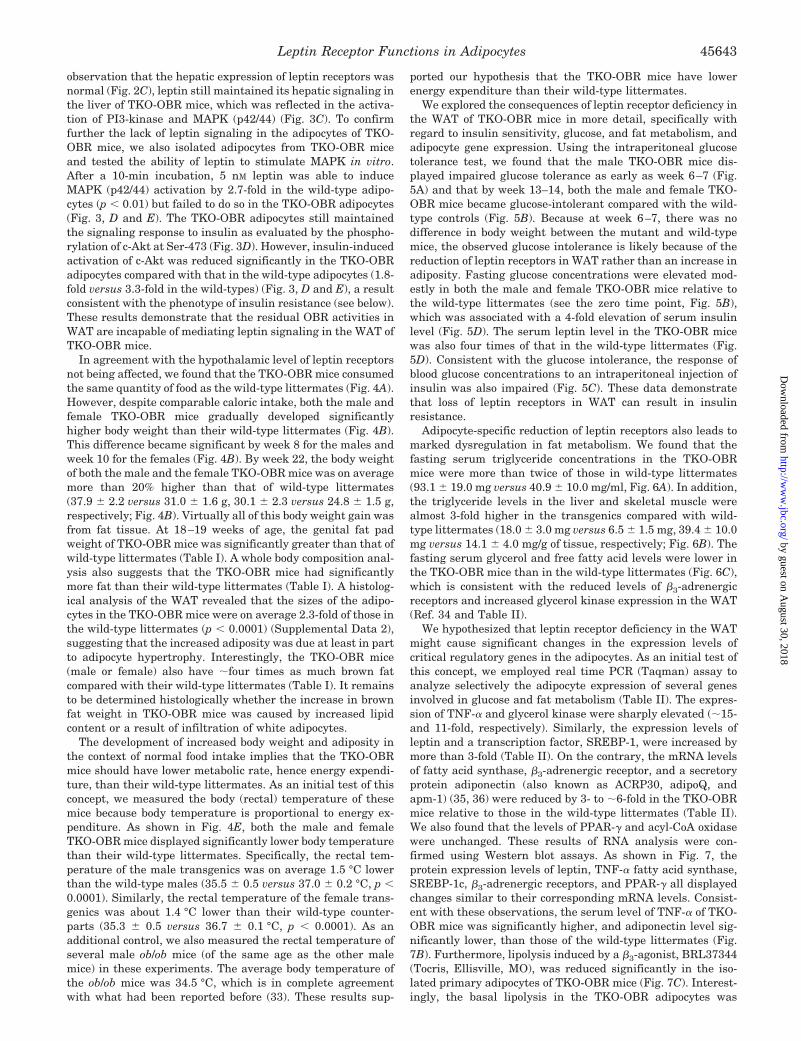
Adipocyte-specific reduction of leptin receptors also leads tomarked dysregulation in fat metabolism. We found that thefasting serum triglyceride concentrations in the TKO-OBRmice were more than twice of those in wild-type littermates(93.1 � 19.0 mg versus 40.9 � 10.0 mg/ml, Fig. 6A). In addition,the triglyceride levels in the liver and skeletal muscle werealmost 3-fold higher in the transgenics compared with wild-type littermates (18.0 � 3.0 mg versus 6.5 � 1.5 mg, 39.4 � 10.0mg versus 14.1 � 4.0 mg/g of tissue, respectively; Fig. 6B). Thefasting serum glycerol and free fatty acid levels were lower inthe TKO-OBR mice than in the wild-type littermates (Fig. 6C),which is consistent with the reduced levels of �3-adrenergicreceptors and increased glycerol kinase expression in the WAT(Ref. 34 and Table II).
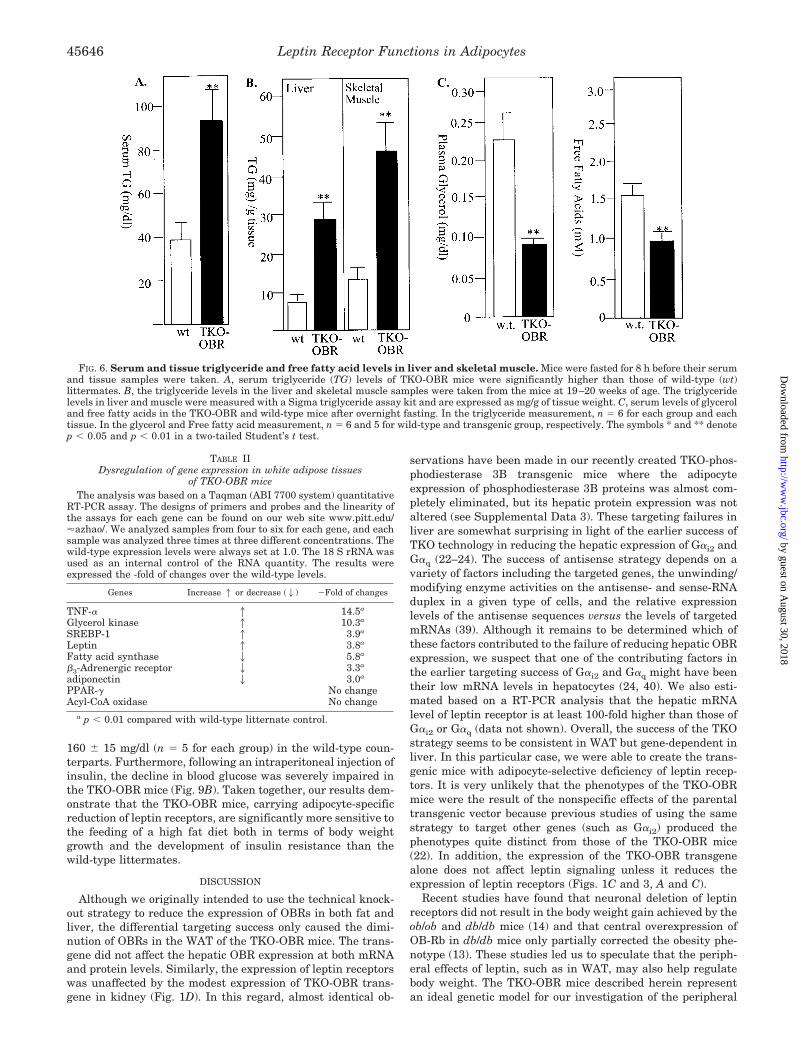
We hypothesized that leptin receptor deficiency in the WATmight cause significant changes in the expression levels ofcritical regulatory genes in the adipocytes. As an initial test ofthis concept, we employed real time PCR (Taqman) assay toanalyze selectively the adipocyte expression of several genesinvolved in glucose and fat metabolism (Table II). The expres-sion of TNF-� and glycerol kinase were sharply elevated (�15-and 11-fold, respectively). Similarly, the expression levels ofleptin and a transcription factor, SREBP-1, were increased bymore than 3-fold (Table II). On the contrary, the mRNA levelsof fatty acid synthase, �3-adrenergic receptor, and a secretoryprotein adiponectin (also known as ACRP30, adipoQ, andapm-1) (35, 36) were reduced by 3- to �6-fold in the TKO-OBRmice relative to those in the wild-type littermates (Table II).We also found that the levels of PPAR-� and acyl-CoA oxidasewere unchanged. These results of RNA analysis were con-firmed using Western blot assays. As shown in Fig. 7, theprotein expression levels of leptin, TNF-� fatty acid synthase,SREBP-1c, �3-adrenergic receptors, and PPAR-� all displayedchanges similar to their corresponding mRNA levels. Consist-ent with these observations, the serum level of TNF-� of TKO-OBR mice was significantly higher, and adiponectin level sig-nificantly lower, than those of the wild-type littermates (Fig.7B). Furthermore, lipolysis induced by a �3-agonist, BRL37344(Tocris, Ellisville, MO), was reduced significantly in the iso-lated primary adipocytes of TKO-OBR mice (Fig. 7C). Interest-ingly, the basal lipolysis in the TKO-OBR adipocytes was
Leptin Receptor Functions in Adipocytes 45643
by guest on August 30, 2018
http://ww
w.jbc.org/
Dow
nloaded from

FIG. 4. Measurement of food intake, body weight, adipocyte morphology, and rectal temperature. In all cases, the filled symbolsrepresent the TKO-OBR mice and the open symbols the wild-type mice. A, cumulative 24-h food intake was monitored for mice at 4, 10, and 20weeks of age. There was no significant difference in food consumption between TKO-OBR mice and their wild-type littermates. n � 8 for both theTKO-OBR males and the wild-type littermates; n � 11 for both the TKO-OBR and the wild-type females. B, the male and female TKO-OBR micedisplayed significantly greater body weight than their wild-type counterparts starting from week 8 and week 10, respectively. n � 9 for both theTKO-OBR and wild-type males; n � 7 for both the TKO-OBR and wild-type females. Each result is expressed as the mean � S.E. All correspondingcomparisons were subjected to Student’s t test. The symbols, *, **, and # denote p � 0.01, p � 0.005, and p � 0.05, respectively. C, measurementof rectal temperature. The number of animals/group (n) is indicated. All comparisons were subjected to a two-tailed Student’s t test. Thecomparisons of the wild-type versus the transgenic, the wild-type versus ob/ob mice, and the transgenic versus the ob/ob mice all reached statisticalsignificance. The symbols # and * indicate p � 0.0001 and �0.03, respectively, in a two-tailed Student’s t test.
Leptin Receptor Functions in Adipocytes45644
by guest on August 30, 2018
http://ww
w.jbc.org/
Dow
nloaded from

increased by �2-fold (p � 0.05) compared with that in thewild-type (Fig. 7C), which may potentially be the result of theelevated TNF-� expression as reported previously (37).
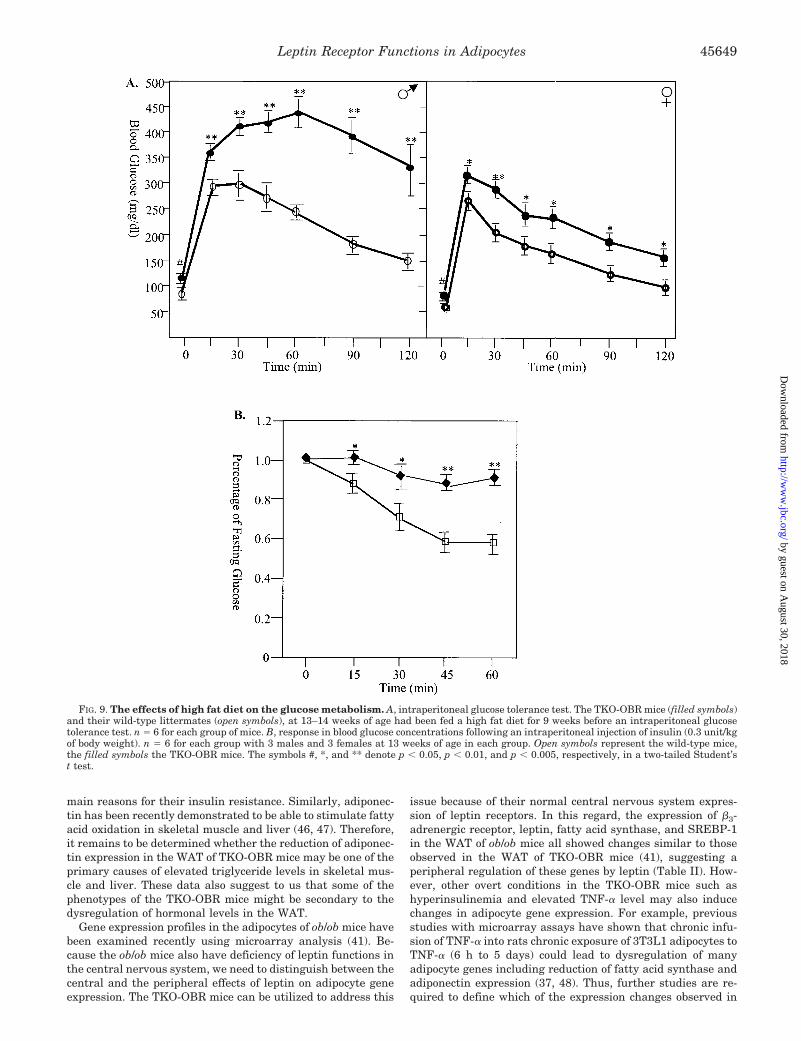
Rodents fed with a high fat diet often develop increased bodyweight and adiposity, insulin resistance, and hyperglycemia(10, 38). We challenged the TKO-OBR mice with a high fat dietstarting at week 5 of age to test whether high fat feeding mightfurther intensify the body weight growth and insulin resist-ance. As shown in Fig. 8, A and B, during high fat feeding, theTKO-OBR mice displayed a far more rapid body weight in-crease than their wild-type littermates. After 9 weeks of highfat feeding, the weight gain of male TKO-OBR mice was 25.5 �2.1 g versus 18.0 � 1.7 g in the wild-type male littermates,representing 161% versus 106% in body weight increase, re-spectively (Fig. 8B). The weight of female TKO-OBR increased
by 14.7 � 1.5 g versus 9.1 � 1.0 g in wild-type littermates (Fig.8B), representing 101% versus 61% increase in body weight,respectively. Concomitant with this rapid body weight in-crease, the high fat-fed TKO-OBR mice displayed severe glu-cose intolerance (Fig. 9A). This contrasted dramatically withwild-type mice on the same high fat diet. The wild-type micedisplayed a level of glucose intolerance similar to that observedin the TKO-OBR mice on standard chow diet (Figs. 9A and 5B).At the 2-h time point following glucose loading, the blood glu-cose level of the male TKO-OBR mice was still at 320 � 60mg/dl, compared with 150 � 15 mg/dl in the male wild-typelittermates (Fig. 9A). In the male TKO-OBR mice, fasting bloodglucose levels reached 110 � 10 mg/dl, well above the 85 � 9mg/dl level in the wild-type males (Fig. 9A), and the nonfastingblood glucose levels reached at 230 � 20 mg/dl, compared with
TABLE IBody weight, fat pad weight, brown fat, and total fat content
All mice were 18-19 weeks of age. For genital fat pad and brown fat analysis, n � 7 for each group; n � 5 for analysis of total body fat content.p, value are those compared with wild-type littermate control.
ParametersMale Female
Wild-type TKO-OBR Wild-type TKO-OBR
Body weight (g) 28.6 � 2.3 34.4 � 1.9a 22.2 � 0.6 25.2 � 1.6b
n 9 9 7 7Genital fat Pad weight (g) 0.51 � 0.03 1.40 � 0.31a 0.54 � 0.03 1.11 � 0.14a
Total body fat (g) 4.03 � 0.51 8.20 � 0.91c 2.35 � 0.42 5.51 � 0.59c
Brown fat (g) 0.07 � 0.02 0.30 � 0.09c 0.06 � 0.02 0.27 � 0.08c
a p � 0.01.b p � 0.05.c p � 0.001.
FIG. 5. Tests of intraperitoneal glu-cose tolerance and insulin. For theglucose tolerance test, the mice were in-jected intraperitoneally with glucose at adose of 2 g/kg of body weight, and theblood glucose levels were monitoredthrough tail vein blood samples. Thefilled symbols represent the TKO-OBRmice, and the open symbols represent thewild-type littermates. A, at 6–7 weeks ofage, although the females still displaynormal glucose tolerance, the male TKO-OBR mice have already become glucose-intolerant. B, at 13–14 weeks of age, boththe male and the female TKO mice wereglucose-intolerant. n � 7 for both theTKO-OBR and wild-type males; n � 8 forboth the TKO-OBR and wild-type fe-males. C, the response in blood glucosefollowing an intraperitoneal injection ofinsulin (0.3 unit/kg of body weight). Theblood glucose concentrations at differenttime points were expressed as a percent-age of the fasting blood glucose concentra-tions. n � 6 for each group, with 3 malesand 3 females at 13–14 weeks of age. Re-sults are expressed as mean � S.E. D,serum insulin and leptin levels of TKO-OBR mice (transgenic, Tg) and their wild-type (WT) littermates. The mice were at19–20 weeks of age when the blood sam-ples were taken. n � 8 for each measure-ment with 4 males and 4 females. Thesymbols *, **, and *** denote p � 0.05,p � 0.03, and p � 0.01, respectively, in atwo-tailed Student’s t test.
Leptin Receptor Functions in Adipocytes 45645
by guest on August 30, 2018
http://ww
w.jbc.org/
Dow
nloaded from
160 � 15 mg/dl (n � 5 for each group) in the wild-type coun-terparts. Furthermore, following an intraperitoneal injection ofinsulin, the decline in blood glucose was severely impaired inthe TKO-OBR mice (Fig. 9B). Taken together, our results dem-onstrate that the TKO-OBR mice, carrying adipocyte-specificreduction of leptin receptors, are significantly more sensitive tothe feeding of a high fat diet both in terms of body weightgrowth and the development of insulin resistance than thewild-type littermates.
DISCUSSION
Although we originally intended to use the technical knock-out strategy to reduce the expression of OBRs in both fat andliver, the differential targeting success only caused the dimi-nution of OBRs in the WAT of the TKO-OBR mice. The trans-gene did not affect the hepatic OBR expression at both mRNAand protein levels. Similarly, the expression of leptin receptorswas unaffected by the modest expression of TKO-OBR trans-gene in kidney (Fig. 1D). In this regard, almost identical ob-
servations have been made in our recently created TKO-phos-phodiesterase 3B transgenic mice where the adipocyteexpression of phosphodiesterase 3B proteins was almost com-pletely eliminated, but its hepatic protein expression was notaltered (see Supplemental Data 3). These targeting failures inliver are somewhat surprising in light of the earlier success ofTKO technology in reducing the hepatic expression of G�i2 andG�q (22–24). The success of antisense strategy depends on avariety of factors including the targeted genes, the unwinding/modifying enzyme activities on the antisense- and sense-RNAduplex in a given type of cells, and the relative expressionlevels of the antisense sequences versus the levels of targetedmRNAs (39). Although it remains to be determined which ofthese factors contributed to the failure of reducing hepatic OBRexpression, we suspect that one of the contributing factors inthe earlier targeting success of G�i2 and G�q might have beentheir low mRNA levels in hepatocytes (24, 40). We also esti-mated based on a RT-PCR analysis that the hepatic mRNAlevel of leptin receptor is at least 100-fold higher than those ofG�i2 or G�q (data not shown). Overall, the success of the TKOstrategy seems to be consistent in WAT but gene-dependent inliver. In this particular case, we were able to create the trans-genic mice with adipocyte-selective deficiency of leptin recep-tors. It is very unlikely that the phenotypes of the TKO-OBRmice were the result of the nonspecific effects of the parentaltransgenic vector because previous studies of using the samestrategy to target other genes (such as G�i2) produced thephenotypes quite distinct from those of the TKO-OBR mice(22). In addition, the expression of the TKO-OBR transgenealone does not affect leptin signaling unless it reduces theexpression of leptin receptors (Figs. 1C and 3, A and C).
Recent studies have found that neuronal deletion of leptinreceptors did not result in the body weight gain achieved by theob/ob and db/db mice (14) and that central overexpression ofOB-Rb in db/db mice only partially corrected the obesity phe-notype (13). These studies led us to speculate that the periph-eral effects of leptin, such as in WAT, may also help regulatebody weight. The TKO-OBR mice described herein representan ideal genetic model for our investigation of the peripheral
FIG. 6. Serum and tissue triglyceride and free fatty acid levels in liver and skeletal muscle. Mice were fasted for 8 h before their serumand tissue samples were taken. A, serum triglyceride (TG) levels of TKO-OBR mice were significantly higher than those of wild-type (wt)littermates. B, the triglyceride levels in the liver and skeletal muscle samples were taken from the mice at 19–20 weeks of age. The triglyceridelevels in liver and muscle were measured with a Sigma triglyceride assay kit and are expressed as mg/g of tissue weight. C, serum levels of glyceroland free fatty acids in the TKO-OBR and wild-type mice after overnight fasting. In the triglyceride measurement, n � 6 for each group and eachtissue. In the glycerol and Free fatty acid measurement, n � 6 and 5 for wild-type and transgenic group, respectively. The symbols * and ** denotep � 0.05 and p � 0.01 in a two-tailed Student’s t test.
TABLE IIDysregulation of gene expression in white adipose tissues
of TKO-OBR miceThe analysis was based on a Taqman (ABI 7700 system) quantitative
RT-PCR assay. The designs of primers and probes and the linearity ofthe assays for each gene can be found on our web site www.pitt.edu/�azhao/. We analyzed samples from four to six for each gene, and eachsample was analyzed three times at three different concentrations. Thewild-type expression levels were always set at 1.0. The 18 S rRNA wasused as an internal control of the RNA quantity. The results wereexpressed the -fold of changes over the wild-type levels.
Genes Increase 1 or decrease (2) �Fold of changes
TNF-� 1 14.5a
Glycerol kinase 1 10.3a
SREBP-1 1 3.9a
Leptin 1 3.8a
Fatty acid synthase 2 5.8a
�3-Adrenergic receptor 2 3.3a
adiponectin 2 3.0a
PPAR-� No changeAcyl-CoA oxidase No change
a p � 0.01 compared with wild-type litternate control.
Leptin Receptor Functions in Adipocytes45646
by guest on August 30, 2018
http://ww
w.jbc.org/
Dow
nloaded from
actions of leptin in WAT. The phenotypes of TKO-OBR mice,such as increased adiposity and increased sensitivity to highfat feeding, indicate that control of body weight by leptin re-quires not only its actions at the hypothalamus but also thedistinct autocrine/paracrine actions on the fat tissue. Further-more, because the majority of the leptin receptors in WAT arethe short forms, it remains to be seen which of the phenotypesof the TKO-OBR mice are mediated through the short formsof OBR.
The increased body weight and adiposity in TKO-OBR mice
occurred despite their normal food intake, suggesting de-creased energy expenditure in the TKO-OBR mice. In an initialtest of this concept, the TKO-OBR mice did show lower bodytemperature relative to the wild-type littermates, which sug-gests that leptin-regulated energy expenditure likely requiresits complementary actions in the hypothalamus and in theWAT. However, this concept needs to be validated further byother independent approaches such as measurement of oxygenconsumption. If eventually proven, the presumed reduction ofmetabolic rate in TKO-OBR mice can be tentatively linked to
FIG. 7. Analysis of adipocyte gene expression. A, confirmation of the results from the quantitative RT-PCR analysis with Western blotassays. The adipose tissue samples (three from the wild-type, three from the TKO-OBR mice) were homogenized in a protein extraction buffer, andthe resulting protein samples were subject to a standard Western blot assay with each specific primary antibody as indicated. B, determinationof serum TNF-� and adiponectin levels in the transgenic mice and their wild-type littermates. In the analysis of TNF-�, n � 18 (9 males and 9females) for the wild-type (wt); n � 13 for the transgenic (6 males and 7 females). In the analysis of adiponectin, n � 11 for the wild-type and thetransgenic (6 males and 5 females). The symbol # indicates p � 0.0001 in a two-tailed Student’s t test. C, determination of lipolysis (using mediumglycerol) stimulated by a �3-agonist, BRL37344, in isolated primary adipocytes from the TKO-OBR mice and their wild-type littermates. Theexperiment was repeated twice, and each condition was set in triplicates. The symbols * and # indicate p � 0.05 and 0.005, respectively, in atwo-tailed Student’s t test. When compared with the corresponding controls, the BRL37344-stimulated lipolysis was significantly attenuated in theTKO-OBR adipocytes (at 200 nM, 2.8-fold versus 7.9-fold in the wild-types; at 1,000 nM, 3.6-fold versus 11.7-fold in the wild-types; p � 0.01).
Leptin Receptor Functions in Adipocytes 45647
by guest on August 30, 2018
http://ww
w.jbc.org/
Dow
nloaded from

two potential mechanisms. Similar to the ob/ob mice, the TKO-OBR mice have reduced expression of �3-adrenergic receptorsin the WAT (Ref. 41, Table II, and Fig. 7A). The �3-adrenergicreceptor knock-out mice developed increased adiposity whilehaving normal food intake (34, 42), which was primarily theresult of decreased energy expenditure compared with the wild-type littermates. The decreased �3-adrenergic receptor expres-sion in WAT will presumably lead to reduced supply of meta-bolic fuel (i.e. free fatty acids) to other organs, such as liver andskeletal muscle in the TKO-OBR mice. Indeed, the fastingserum levels of glycerol and free fatty acids are lower in the
TKO-OBR mice than in the wild-type littermates (Fig. 6C).Alternatively, the significant increase of TNF-� expression inthe TKO-OBR mice (Table II and Fig. 7, A and B) might havesuppressed the expression of uncoupling protein-1 in the brownadipose tissue as shown before (43), which in turn could alsolead to decreased thermogenesis.
Selective deficiency of leptin receptors in WAT of TKO-OBRmice led to insulin resistance and dyslipidemia. Because TNF-�has been well established as an antagonist of insulin actionsboth in vitro and in vivo (44, 45), the significant increase ofTNF-� expression in the TKO-OBR mice might be one of the
FIG. 8. Comparison of body weight growth under high fat diet feeding. A, a male TKO-OBR mouse (on the right) and a male wild-typelittermate (on the left) at 13 weeks of age. Both have gone through 9 weeks of high fat diet (19% lard and 1% corn oil diet). When the picture wastaken, the TKO-OBR mouse weighed �43 g, and the wild-type counterpart weighed �32 g. B, cumulative body weight gain after 5 and 9 weeksof feeding with either a standard chow or a high fat diet. The TKO-OBR mice and the wild-type littermates were either fed with high fat diet orwere continued on standard chow. The results are expressed as the mean � S.E. n � 6 for each group. * denotes p � 0.01 in a two-tailed Student’st test.
Leptin Receptor Functions in Adipocytes45648
by guest on August 30, 2018
http://ww
w.jbc.org/
Dow
nloaded from
main reasons for their insulin resistance. Similarly, adiponec-tin has been recently demonstrated to be able to stimulate fattyacid oxidation in skeletal muscle and liver (46, 47). Therefore,it remains to be determined whether the reduction of adiponec-tin expression in the WAT of TKO-OBR mice may be one of theprimary causes of elevated triglyceride levels in skeletal mus-cle and liver. These data also suggest to us that some of thephenotypes of the TKO-OBR mice might be secondary to thedysregulation of hormonal levels in the WAT.
Gene expression profiles in the adipocytes of ob/ob mice havebeen examined recently using microarray analysis (41). Be-cause the ob/ob mice also have deficiency of leptin functions inthe central nervous system, we need to distinguish between thecentral and the peripheral effects of leptin on adipocyte geneexpression. The TKO-OBR mice can be utilized to address this
issue because of their normal central nervous system expres-sion of leptin receptors. In this regard, the expression of �3-adrenergic receptor, leptin, fatty acid synthase, and SREBP-1in the WAT of ob/ob mice all showed changes similar to thoseobserved in the WAT of TKO-OBR mice (41), suggesting aperipheral regulation of these genes by leptin (Table II). How-ever, other overt conditions in the TKO-OBR mice such ashyperinsulinemia and elevated TNF-� level may also inducechanges in adipocyte gene expression. For example, previousstudies with microarray assays have shown that chronic infu-sion of TNF-� into rats chronic exposure of 3T3L1 adipocytes toTNF-� (6 h to 5 days) could lead to dysregulation of manyadipocyte genes including reduction of fatty acid synthase andadiponectin expression (37, 48). Thus, further studies are re-quired to define which of the expression changes observed in
FIG. 9. The effects of high fat diet on the glucose metabolism. A, intraperitoneal glucose tolerance test. The TKO-OBR mice (filled symbols)and their wild-type littermates (open symbols), at 13–14 weeks of age had been fed a high fat diet for 9 weeks before an intraperitoneal glucosetolerance test. n � 6 for each group of mice. B, response in blood glucose concentrations following an intraperitoneal injection of insulin (0.3 unit/kgof body weight). n � 6 for each group with 3 males and 3 females at 13 weeks of age in each group. Open symbols represent the wild-type mice,the filled symbols the TKO-OBR mice. The symbols #, *, and ** denote p � 0.05, p � 0.01, and p � 0.005, respectively, in a two-tailed Student’st test.
Leptin Receptor Functions in Adipocytes 45649
by guest on August 30, 2018
http://ww
w.jbc.org/
Dow
nloaded from

the TKO-OBR adipocytes are directly the result of the leptinreceptor manipulation and which of the changes are secondary.Overall, our limited analysis of adipocyte gene expression sug-gests a peripheral regulatory effect of leptin on several adipo-cyte genes involved in glucose and lipid metabolism.
In summary, the TKO-OBR mice with adipocyte-specific de-ficiency of leptin receptors develop increased adiposity, de-creased energy expenditure, insulin resistance, dyslipidemia,and dysregulation of adipocyte gene expression. Our resultsraise the possibility that peripheral leptin resistance (not nec-essarily at the receptor level) may be a major contributingfactor to the insulin resistance observed in obese subjects.Based on the results seen in the TKO-OBR mice, the hypoth-esis that peripheral, particularly fat tissue-specific, leptin re-sistance may be one of the primary causes of insulin resistanceand type 2 diabetes merits further investigation.
Acknowledgments—We are very grateful to Dr. Craig Malbon forproviding the TKO construct and technical guidance and to Dr. Jing Hefor analyzing the morphology of WAT. We thank Drs. Andrew Stewart,Robert O’Doherty, Anthony Zeleznik, and Raymond Frizzell for supportand critical evaluations throughout this work.
REFERENCES
1. Friedman, J. M., and Halaas, J. L. (1998) Nature 395, 763–7702. Ahima, R. S., and Flier, J. S. (2000) Annu. Rev. Physiol. 62, 413–4373. Zhang, Y., Proenca, R., Maffei, M., Barone, M., Leopold, L., and Friedman,
J. M. (1994) Nature 372, 425–4324. Lee, G. H., Proenca, R., Montez, J. M., Carroll, K. M., Darvishzadeh, J. G., Lee,
J. I., and Friedman, J. M. (1996) Nature 379, 632–6355. Ahima, R. S., Prabakaran, D., Mantzoros, C., Qu, D., Lowell, B., Maratos-Flier,
E., and Flier, J. S. (1996) Nature 382, 250–2526. Campfield, L. A., Smith, F. J., Guisez, Y., Devos, R., and Burn, P. (1995)
Science 269, 546–5497. Levin, N., Nelson, C., Gurney, A., Vandlen, R., and de Sauvage, F. (1996) Proc.
Natl. Acad. Sci. U. S. A. 93, 1726–17308. Wang, Z. W., Zhou, Y. T., Kakuma, T., Lee, Y., Higa, M., Kalra, S. P., Dube,
M. G., Kalra, P. S., and Unger, R. H. (1999) Proc. Natl. Acad. Sci. U. S. A.96, 10373–10378
9. Chen, G., Koyama, K., Yuan, X., Lee, Y., Zhou, Y. T., O’Doherty, R., Newgard,C. B., and Unger, R. H. (1996) Proc. Natl. Acad. Sci. U. S. A. 93,14795–14799
10. Buettner, R., Newgard, C. B., Rhodes, C. J., and O’Doherty, R. M. (2000) Am. J.Physiol. Endocrinol. Metab. 278, E563–E569
11. Wang, M. Y., Lee, Y., and Unger, R. H. (1999) J. Biol. Chem. 274, 17541–1754412. Fruhbeck, G., Aguado, M., and Martinez, J. A. (1997) Biochem. Biophys. Res.
Commun. 240, 590–59413. Kowalski, T. J., Liu, S. M., Leibel, R. L., and Chua, S. C., Jr. (2001) Diabetes
50, 425–43514. Cohen, P., Zhao, C., Cai, X., Montez, J. M., Rohani, S. C., Feinstein, P.,
Mombaerts, P., and Friedman, J. M. (2001) J. Clin. Invest. 108, 1113–112115. Zhao, A. Z., Shinohara, M. M., Huang, D., Shimizu, M., Eldar-Finkelman, H.,
Krebs, E. G., Beavo, J. A., and Bornfeldt, K. E. (2000) J. Biol. Chem. 275,11348–11354
16. Minokoshi, Y., Kim, Y. B., Peroni, O. D., Fryer, L. G., Muller, C., Carling, D.,and Kahn, B. B. (2002) Nature 415, 339–343
17. Lord, G. M., Matarese, G., Howard, J. K., Baker, R. J., Bloom, S. R., andLechler, R. I. (1998) Nature 394, 897–901
18. Zhao, A. Z., Bornfeldt, K. E., and Beavo, J. A. (1998) J. Clin. Invest. 102,
869–87319. Kulkarni, R. N., Wang, Z. L., Wang, R. M., Hurley, J. D., Smith, D. M., Ghatei,
M. A., Withers, D. J., Gardiner, J. V., Bailey, C. J., and Bloom, S. R. (1997)J. Clin. Invest. 100, 2729–2736
20. Sierra-Honigmann, M. R., Nath, A. K., Murakami, C., Garcia-Cardena, G.,Papapetropoulos, A., Sessa, W. C., Madge, L. A., Schechner, J. S., Schwabb,M. B., Polverini, P. J., and Flores-Riveros, J. R. (1998) Science 281,1683–1686
21. Bouloumie, A., Drexler, H. C., Lafontan, M., and Busse, R. (1998) Circ. Res. 83,1059–1066
22. Moxham, C. M., Hod, Y., and Malbon, C. C. (1993) Science 260, 991–99523. Moxham, C. M., and Malbon, C. C. (1996) Nature 379, 840–84424. Galvin-Parton, P. A., Chen, X., Moxham, C. M., and Malbon, C. C. (1997)
J. Biol. Chem. 272, 4335–434125. Degerman, E., Landstrom, T. R., Wijkander, J., Holst, L. S., Ahmad, F.,
Belfrage, P., and Manganiello, V. (1998) Methods 14, 43–5326. Hanson, R. W., and Reshef, L. (1997) Annu. Rev. Biochem. 66, 581–61127. Baskin, D. G., Schwartz, M. W., Seeley, R. J., Woods, S. C., Porte, D., Jr.,
Breininger, J. F., Jonak, Z., Schaefer, J., Krouse, M., Burghardt, C., Camp-field, L. A., Burn, P., and Kochan, J. P. (1999) J. Histochem. Cytochem. 47,353–362
28. Matsuda, J., Yokota, I., Tsuruo, Y., Murakami, T., Ishimura, K., Shima, K.,and Kuroda, Y. (1999) Endocrinology 140, 5233–5238
29. Magni, P., Vettor, R., Pagano, C., Calcagno, A., Beretta, E., Messi, E., Zanisi,M., Martini, L., and Motta, M. (1999) Endocrinology 140, 1581–1585
30. Zhao, A. Z., Huan, J. N., Gupta, S., Pal, R., and Sahu, A. (2002) Nat. Neurosci.5, 727–728
31. Niswender, K. D., Morton, G. J., Stearns, W. H., Rhodes, C. J., Myers, M. G.,Jr., and Schwartz, M. W. (2001) Nature 413, 794–795
32. Kim, Y. B., Uotani, S., Pierroz, D. D., Flier, J. S., and Kahn, B. B. (2000)Endocrinology 141, 2328–2339
33. Pelleymounter, M. A., Cullen, M. J., Baker, M. B., Hecht, R., Winters, D.,Boone, T., and Collins, F. (1995) Science 269, 540–543
34. Susulic, V. S., Frederich, R. C., Lawitts, J., Tozzo, E., Kahn, B. B., Harper,M. E., Himms-Hagen, J., Flier, J. S., and Lowell, B. B. (1995) J. Biol. Chem.270, 29483–29492
35. Hu, E., Liang, P., and Spiegelman, B. M. (1996) J. Biol. Chem. 271,10697–10703
36. Fruebis, J., Tsao, T. S., Javorschi, S., Ebbets-Reed, D., Erickson, M. R., Yen,F. T., Bihain, B. E., and Lodish, H. F. (2001) Proc. Natl. Acad. Sci. U. S. A.98, 2005–2010
37. Ruan, H., Miles, P. D., Ladd, C. M., Ross, K., Golub, T. R., Olefsky, J. M., andLodish, H. F. (2002) Diabetes 51, 3176–3188
38. VanHeek, M., Compton, D. S., France, C. F., Tedesco, R. P., Fawzi, A. B.,Graziano, M. P., Sybertz, E. J., Strader, C. D., and Davis, H. R. (1997)J. Clin. Invest. 99, 385–390
39. Murray, J. A. H. (ed) (1992) Antisense RNA and DNA, Wiley-Liss, New York40. Wang, H. Y., and Malbon, C. C. (1996) Int. J. Obes. Relat. Metab. Disord. 20,
(Suppl. 3) S26–S3141. Soukas, A., Cohen, P., Socci, N. D., and Friedman, J. M. (2000) Genes Dev. 14,
963–98042. Lowell, B. B., and Flier, J. S. (1995) J. Clin. Invest. 95, 92343. Valladares, A., Roncero, C., Benito, M., and Porras, A. (2001) FEBS Lett. 493,
6–1144. Hotamisligil, G. S., and Spiegelman, B. M. (1994) Diabetes 43, 1271–127845. Hotamisligil, G. S. (1999) J. Intern. Med. 245, 621–62546. Hotta, K., Funahashi, T., Bodkin, N. L., Ortmeyer, H. K., Arita, Y., Hansen,
B. C., and Matsuzawa, Y. (2001) Diabetes 50, 1126–113347. Yamauchi, T., Kamon, J., Waki, H., Terauchi, Y., Kubota, N., Hara, K., Mori,
Y., Ide, T., Murakami, K., Tsuboyama-Kasaoka, N., Ezaki, O., Akanuma,Y., Gavrilova, O., Vinson, C., Reitman, M. L., Kagechika, H., Shudo, K.,Yoda, M., Nakano, Y., Tobe, K., Nagai, R., Kimura, S., Tomita, M., Froguel,P., and Kadowaki, T. (2001) Nat. Med. 7, 941–946
48. Ruan, H., Hacohen, N., Golub, T. R., Van Parijs, L., and Lodish, H. F. (2002)Diabetes 51, 1319–1336
Leptin Receptor Functions in Adipocytes45650
by guest on August 30, 2018
http://ww
w.jbc.org/
Dow
nloaded from
Jing-Ning Huan, Ji Li, Yiping Han, Ke Chen, Nancy Wu and Allan Z. ZhaoLeads to Increased Adiposity, Dyslipidemia, and Insulin Resistance
Adipocyte-selective Reduction of the Leptin Receptors Induced by Antisense RNA
doi: 10.1074/jbc.M304165200 originally published online August 18, 20032003, 278:45638-45650.J. Biol. Chem.
10.1074/jbc.M304165200Access the most updated version of this article at doi:
Alerts:
When a correction for this article is posted•
When this article is cited•
to choose from all of JBC's e-mail alertsClick here
Supplemental material:
http://www.jbc.org/content/suppl/2003/09/10/M304165200.DC1
http://www.jbc.org/content/278/46/45638.full.html#ref-list-1
This article cites 47 references, 20 of which can be accessed free at
by guest on August 30, 2018
http://ww
w.jbc.org/
Dow
nloaded from