the italian unlikely to pay market - pwc - pwc: audit … €324bn (gbv) at the end of 2016. after...
TRANSCRIPT

The Italian Unlikely
to Pay MarketReady to tackle the challenge?
www.pwc.com/it


Pier Paolo Masenza
Financial Services Deals LeaderM: +39 348 [email protected]
Vito RuscignoCo-Head of NPL M: +39 348 [email protected]
Fedele PascuzziBusiness Recovery Services LeaderM: +39 348 [email protected]
Alessandro BiondiCo-Head of NPLM: +39 348 [email protected]
Contacts

4 | The Italian Unlikely to Pay market | Ready to tackle the challenge?
Contents
The Italian Non Performing Exposure market and our view 05
The Unlikely to Pay segment 07
1 Unlikely to Pay distribution among Top 20 banks 08
3 Unlikely to Pay inflows and outflows from 2014 to 2016– Top 20 Italian banks
10
4 Unlikely to Pay coverage ratio – Top 10 and Top 20 Italian banks 11
5 UTP performance from 2014 to 2016 – collections and returns to performing 13
6 What should banks do to tackle the UTP challenge? 15
7 Which strategic options to fix the UTP issue? 16
9 How will the IFRS9 affect UTP?
10 Non Performing Exposures classifications
18
19
8 Forbearance as a relevant measure for the proactive management of UTP 17
11 Unlikely to Pay inflows and outflows from 2014 to 2016 – Top 10 Italian banks (breakdown by bank)
21
12 Outflows – Top 20 Italian banks 27
2 UTP ratio on NPE – Top 20 Italian banks 09
Disclaimer: PwC analysis are based on FY14, FY15, FY16 banks’ financial statements (tab. A.1.7 and A.1.8) and Data Provider dataset

PwC | 5
The Italian Non Performing Exposure market and our view

6 | The Italian Unlikely to Pay market | Ready to tackle the challenge?
Asset Quality
The NPE (“Non Performing Exposures”) volume in the Italian banking sector is the highest in the European market reaching the value of €324bn (GBV) at the end of 2016.
After reaching the peak at the end of 2015, totaling € 341bn, the NPE volume experienced a slight but firm decline during 2016 (-5%).
The declining trend of UTP, within the NPE, is mainly driven by lower inflows from performing and past due loans. At the end of 2016 the UTP reached €117bn vs previous year’s €127bn (GBV).
UTP provisioning resulted in €86bn of NBV at the end of 2016 (avg. coverage at 27%), higher than the bad loans’ NBV equal to €85bn (avg. coverage at 57%).
42 59
78 107
125 156
184 200 200
33
57
66
74
91
109
131 127 117
9
16
12
13
21
18
1214
7
2008 2009 2010 2011 2012 2013 2014 2015 2016
Past Due (€bn) Unlikely to Pay (€bn) Bad Loans (€ bn)
324341
326
283
237
194
157
132
85
NBV
86bn
NBV
85bn
Our view
The volume of UTP, lower than bad loans in terms of GBV (€117bn vs €200bn) but higher in terms of NBV (€86bn vs €85bn), will require the adoption and implementation of a renovated strategic management and deleveraging approach by the Italian banks.
ECB guidelines provide a great opportunity to renovate and improve the proactive management of NPE to address the issue of their massive stock.
Moreover IFRS9, in place from 1 January 2018, will lead to an «early warning» and «forward looking» approach, which could likely result in higher reclassification of performing loans to NPE/UTP and overall higher provisions.Only by focusing the efforts in the proactive management of their UTP exposures, the Italian banks could aim at deleveraging their UTP, through higher collection, higher cure rates to performing loans, lower danger rates to bad loans.
The proactive management of UTP should cover three main issues: (i) data quality and preliminary strategic portfolio segmentation, (ii) accurate analysis of the borrowers and integrated single names’ management and (iii) implementation of the most appropriate strategic option to identify among forbearance measures, cash injection (equity/ debt) even through third investors, loan sales and liquidation procedures.
In other words, the proactive management of UTP is without a doubt a complex issue entailing and requiring due diligence, data quality, restructuring, turnaround management and M&A/special situation expertise.
Thus, are the Italian banks ready to tackle the challenge?

PwC |7
The Unlikely to Pay segmentAn opportunity to not miss out
117.0
24.5
20.0
15.2
11.5 5.1
4.7 4.6
4.4 4.0
3.5
19.5
GRUPPOUNICREDIT
GRUPPOBANCARIO INTESA
SANPAOLO
GRUPPO MONTEDEI PASCHI DI
SIENA
GRUPPO BANCOPOPOLARE
GRUPPO UNIONEDI BANCHEITALIANE
GRUPPOBANCARIO BANCANAZIONALE DEL
LAVORO
GRUPPOBANCARIO BANCA
POPOLARE DIVICENZA
GRUPPOBANCARIO VENETO
BANCA
GRUPPO BANCAPOPOLAREDELL'EMILIAROMAGNA
GRUPPO CARIGE Other Total 2016
8 | The Italian Unlikely to Pay market | Ready to tackle the challenge?
1 Unlikely to Pay distribution among Top 20 banks
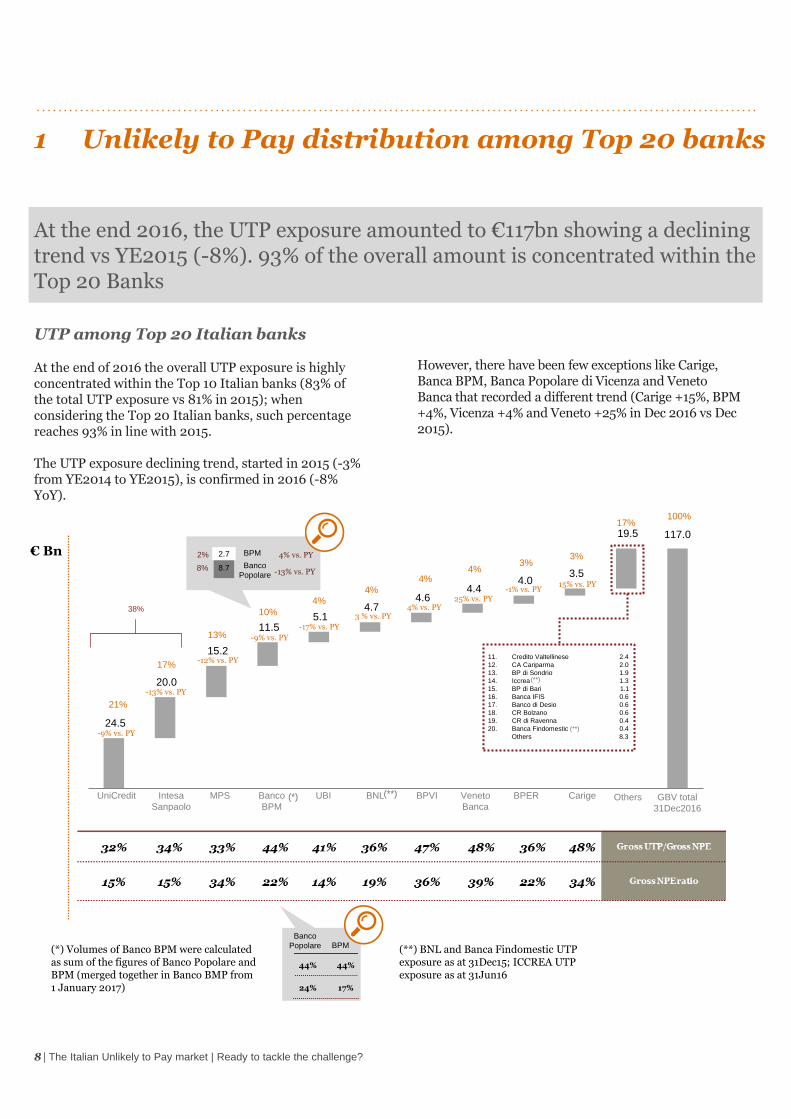
At the end 2016, the UTP exposure amounted to €117bn showing a declining trend vs YE2015 (-8%). 93% of the overall amount is concentrated within the Top 20 Banks
UTP among Top 20 Italian banks
At the end of 2016 the overall UTP exposure is highly concentrated within the Top 10 Italian banks (83% of the total UTP exposure vs 81% in 2015); when considering the Top 20 Italian banks, such percentage reaches 93% in line with 2015.
The UTP exposure declining trend, started in 2015 (-3% from YE2014 to YE2015), is confirmed in 2016 (-8% YoY).
However, there have been few exceptions like Carige, Banca BPM, Banca Popolare di Vicenza and Veneto Banca that recorded a different trend (Carige +15%, BPM +4%, Vicenza +4% and Veneto +25% in Dec 2016 vs Dec 2015).
8.7
2.7
Others GBV total
31Dec2016
UniCredit MPS Banco
BPM
UBI BNL BPVI BPERVeneto
Banca
CarigeIntesa
Sanpaolo
BPM
Banco
Popolare
BPM
-9% vs. PY
21%
17%
-13% vs. PY
13%
-12% vs. PY
10%
4%
-17% vs. PY
4%
4% vs. PY
4%
3 % vs. PY
4%
25% vs. PY
3%
-1% vs. PY
3%
15% vs. PY
17%100%
11. Credito Valtellinese 2.4
12. CA Cariparma 2.0
13. BP di Sondrio 1.9
14. Iccrea 1.3
15. BP di Bari 1.1
16. Banca IFIS 0.6
17. Banco di Desio 0.6
18. CR Bolzano 0.6
19. CR di Ravenna 0.4
20. Banca Findomestic (**) 0.4
Others 8.3
38%
-9% vs. PY
(**)
(**)
4% vs. PY
-13% vs. PY
2%
8%
Banco
Popolare
44% 44% Gross UTP/Gross NPE
24% 17% Gross NPE ratio
(*)
(**) BNL and Banca Findomestic UTP exposure as at 31Dec15; ICCREA UTP exposure as at 31Jun16
(*) Volumes of Banco BPM were calculatedas sum of the figures of Banco Popolare and BPM (merged together in Banco BMP from 1 January 2017)
€ Bn

48% 51% 51%
50%44%
48%
3% 4%2%
2014 2015 2016
52% 56%
47%
47%42%
52%
2%2%
1%
2014 2015 2016
58% 62%
37%36%
5% 2%
2014 2015 2016
51% 46%50%
41%
47%
48%9%
7%
2%
2014 2015 2016
Veneto Banca
+91%
2 UTP ratio on NPE – Top 20 Italian banks
UTP stock is an issue to be tackled promptly: 37% of the NPE of the Top 20 Italian banks are UTP as at 31Dec16, with several banks (#12) featuring UTP ratio on NPE over 40%
NPE breakdown from 2014 to 2016 by bank
(*) Ratios of Banco BPM were calculated as sum of the figures of Banco Popolare and BPM (merged together in Banco BMP from 1 January 2017)
48% 44% 48%
49%52%
49%
3%3%
2%
2014 2015 1H 2016
BNL
ICCREA
+3%
+26%
55%
56%
44%
44%
1%
BancoPopolare
BPM
50% 52% 58%
45% 46% 41%
4% 2%1%
2014 2015 2016
Past Due UTP Bad Loans
Gross UTP var.% from 2014 to 2016
FY16
Not
available
PwC |9
50% 52% 58%
45% 46% 41%
4% 2% 1%
2014 2015 2016
62% 64% 66%
35% 32% 32%
4% 3%2%
2014 2015 2016Unicredit Intesa Sanpaolo MPS Banco BPM* UBI
61% 62% 65%
37% 36% 34%
2% 2%1%
2014 2015 2016
54% 57% 64%
42% 37% 33%
4% 6%2%
2014 2015 2016
49% 51% 55%
49% 47% 44%
2% 1%1%
2014 2015 2016
-19% -15% -20% -15% -13%
BPER
59% 62% 63%
39%35% 36%
2%2% 1%
2014 2015 2016
-8%
BPVI Carige
53%49% 52%
42%
50%47%
6%
2%1%
2014 2015 2016
+70% +8%
Banca IFIS
66% 57%
59%28%
35%
33%
6%8%
8%
2014 2015 2016
+381%
Credito Valtellinese CA Cariparma BP Sondrio
49% 50% 52%
40%44% 44%
11%
6%4%
2014 2015 2016
53% 53% 58%
43% 45% 40%
4% 2% 2%
2014 2015 2016
43%45% 47%
45%
43%45%
12%
11% 8%
2014 2015 2016
56%58% 62%
40%
38%37%
4%4%
1%
2014 2015 2016
+18% -4% +22%
CR di Bolzano
-20%
Banco di Desio e Brianza
+11%
BP di Bari
CR di Ravenna Banca Findomestic
59% 59%52%
33%32%
40%
8%
9%
8%
2014 2015 2016
34% 36% 43%
63%60% 55%
4%4%
2%
2014 2015 2016
73% 68% 69%
22%29%
27%6%
3%3%
2014 2015 2016
+25%
-11% +42%

10 | The Italian Unlikely to Pay market | Ready to tackle the challenge?
3 Unlikely to Pay inflows and outflows from 2014to 2016 – Top 20 Italian banks
At the end of 2016, despite the decreased outflows to bad loans (-2%) and inflows from performing (-4%) compared to 2015, 57% of UTP remained as such. The UTP challenge lies in the management of their massive stock
Outflows and Inflows
In 2016, total outflows of the Top 20 Italian banks slightly decreased from €51.1bn to €50.1bn primarily driven by lower outflows to bad loans: 23% in 2015 vs 21% in 2016. (*)
The inflows in 2016 decreased as well (from € 52.1bn to 42.5bn) mainly due to the lower inflows from performing exposures. (*)
As for the outflows, the UTP gauged a firm decline of inflows from performing loans over the last 2-year period: 23% in 2015 vs 19% in 2016.
UTP which remained UTP during 2016 amounted to €66.8bn i.e. 57%, proving how the main issue for the Italian UTP lies mainly in their massive stock and a management not yet able to target deleveraging solutions.
In particular, according to Bank of Italy, 62.5% of the restructuring agreements (which qualify most of the UTP exposures) after 3 years are still in place (49% after 4 years) and did not result in a positive and conclusive outcome (i.e. after 4 years 40.9% of the restructuring agreements resulted in liquidation/bankruptcy procedures).
(*) Inflows and outflows in 2016 for BNL, ICCREA and Banca Findomestic were estimated equal to the flows occurred in 2015 (to date their financial statements as at 31Dec16 are not yet available)
(5%)
(13%)
(23%)(4%) 23%
13%
10% (5%)
(12%)
(21%)(4%) 19%
9%
9%
Exposure31Dec14
Toperforming
Collected To bad loans Others Fromperforming
From nonperforming
Other inflows Exposure31Dec15
Toperforming
Collected To bad loans Others Fromperforming
From nonperforming
Other inflows Exposure31Dec16
(1)
(51.1)
52.1(50.1)
42.5
Outflows
OutflowsInflowsInflows
Re
ma
in U
TP
Re
ma
in U
TP
115.9 116.9 109.3
57%56%
€ Bn
% flows =In/Outflow
Initial exposure

4 Unlikely to Pay coverage ratio – Top 10 and Top 20 Italian banks
The Top 10 Italian banks increased their provisions of UTP in 2016. Their average coverage ratio reached 30.8% while their ratio on total loans was 10.3%
UTP Coverage ratios vs. Gross UTP ratios
Top 10 Italian Banks featured general higher provisions of UTP in 2016 vs 2015, resulting in higher coverage ratios (average ratio equal to 30.8% in 2016).
MPS, third group in terms of UTP exposures, showed gross UTP ratio (11.5%) lower than in 2015 (12.9%) with an average UTP coverage of 40.3% in 2016 compared to 29.2% in 2015.
Ratios of Banco BPM (calculated as sum of the figures of the single entities, Banco Popolare and Banca BPM, merged together in Banco BPM from 1 January 2017) showed a reduction of the gross UTP ratio (9.5% in 2016 vs 10.4% in 2015) as well as the growth of the UTP coverage (27.4% in 2016 vs 24.8% in 2015).
Veneto Banca, Carige, Banca Popolare di Vicenza featured higher gross UTP ratio and UTP coverage in 2016 vs 2015.
In particular UniCredit and Intesa Sanpaolo, both below the average Gross UTP ratio (4.9% and 5.1% respectively), increased their UTP provisions reaching UTP coverage equal to 43.1% (UniCredit) and 26.7% (Intesa Sanpaolo) at the end of 2016.
(**)
(**) BNL UTP exposure as at 31Dec15 (*) Ratios of Banco BPM were calculated as sum of the figures of Banco Popolare and BPM (merged together in Banco BMP from 1 January 2017)
Banco Popolare
BPM
10%
15%
20%
25%
30%
35%
40%
45%
50%
2% 4% 6% 8% 10% 12% 14% 16% 18% 20%
PwC | 11
Top 10 Italian banks Bubble size: Unlikely to
Pay gross exposure 2016
Bubble size: Unlikely to
Pay gross exposure 2015
YoY shift (FY15-FY16)
Avg. 16 Top 10
(10.3%)
Avg. 16
Top 10
(30.8%)(*)
UniCredit
Intesa Sanpaolo
MPS
UBI
BNL
BPVIBPER
Veneto Banca
CARIGE
10%
15%
20%
25%
30%
35%
40%
45%
50%
2% 4% 6% 8% 10% 12% 14% 16% 18% 20%
UT
P C
ove
rag
e r
ati
o 3
1D
ec
16
Gross UTP ratio 31Dec16
Banco BPM (*)
UTP Coverage ratios vs. Gross UTP ratios
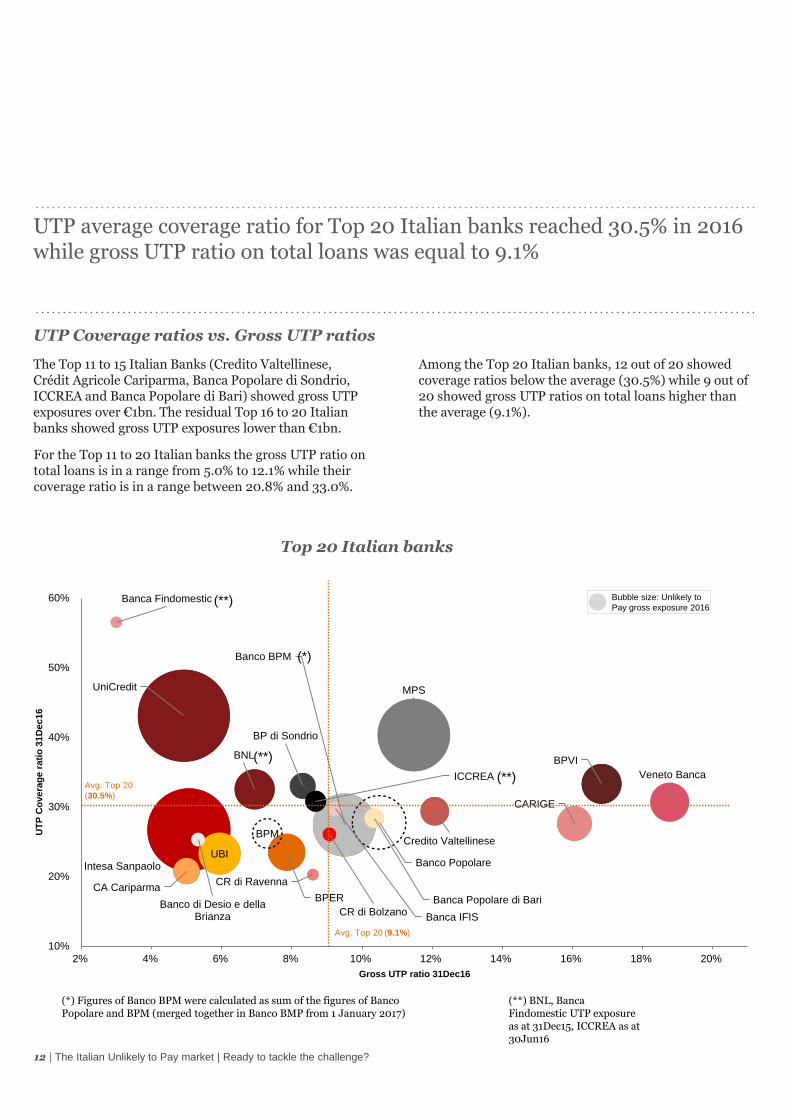
UTP average coverage ratio for Top 20 Italian banks reached 30.5% in 2016 while gross UTP ratio on total loans was equal to 9.1%
The Top 11 to 15 Italian Banks (Credito Valtellinese, Crédit Agricole Cariparma, Banca Popolare di Sondrio, ICCREA and Banca Popolare di Bari) showed gross UTP exposures over €1bn. The residual Top 16 to 20 Italian banks showed gross UTP exposures lower than €1bn.
For the Top 11 to 20 Italian banks the gross UTP ratio on total loans is in a range from 5.0% to 12.1% while their coverage ratio is in a range between 20.8% and 33.0%.
Among the Top 20 Italian banks, 12 out of 20 showed coverage ratios below the average (30.5%) while 9 out of 20 showed gross UTP ratios on total loans higher than the average (9.1%).
(**) BNL, Banca Findomestic UTP exposureas at 31Dec15, ICCREA as at30Jun16
12 | The Italian Unlikely to Pay market | Ready to tackle the challenge?
(*) Figures of Banco BPM were calculated as sum of the figures of Banco Popolare and BPM (merged together in Banco BMP from 1 January 2017)
UniCredit
Intesa Sanpaolo
MPS
Banco BPM
UBI
BNLBPVI
BPER
Veneto Banca
CARIGE
Credito Valtellinese
CA Cariparma
BP di Sondrio
ICCREA
Banca Popolare di BariCR di Bolzano
Banco di Desio e della Brianza Banca IFIS
CR di Ravenna
Banco Popolare
BPM
Banca Findomestic
10%
20%
30%
40%
50%
60%
2% 4% 6% 8% 10% 12% 14% 16% 18% 20%
UT
P C
ove
rag
e r
ati
o 3
1D
ec
16
Gross UTP ratio 31Dec16
Top 20 Italian banks
Avg. Top 20 (9.1%)
Avg. Top 20
(30.5%)
Bubble size: Unlikely to
Pay gross exposure 2016
(**)
(**)
(**)
(*)
3.8% 3.7% 3.8%
6.8%
8.7%
9.5%
3.6% 3.7%
6.8%
8.7%
10.6%
12.5%
13.3%
10.4%
12.4%
2014 2015 2016
% To Performing Top 20 % Collected Top 20 % To Performing market
% Collected market Total Top 20 % Total market %
Performance Top 20 and total Italian Market
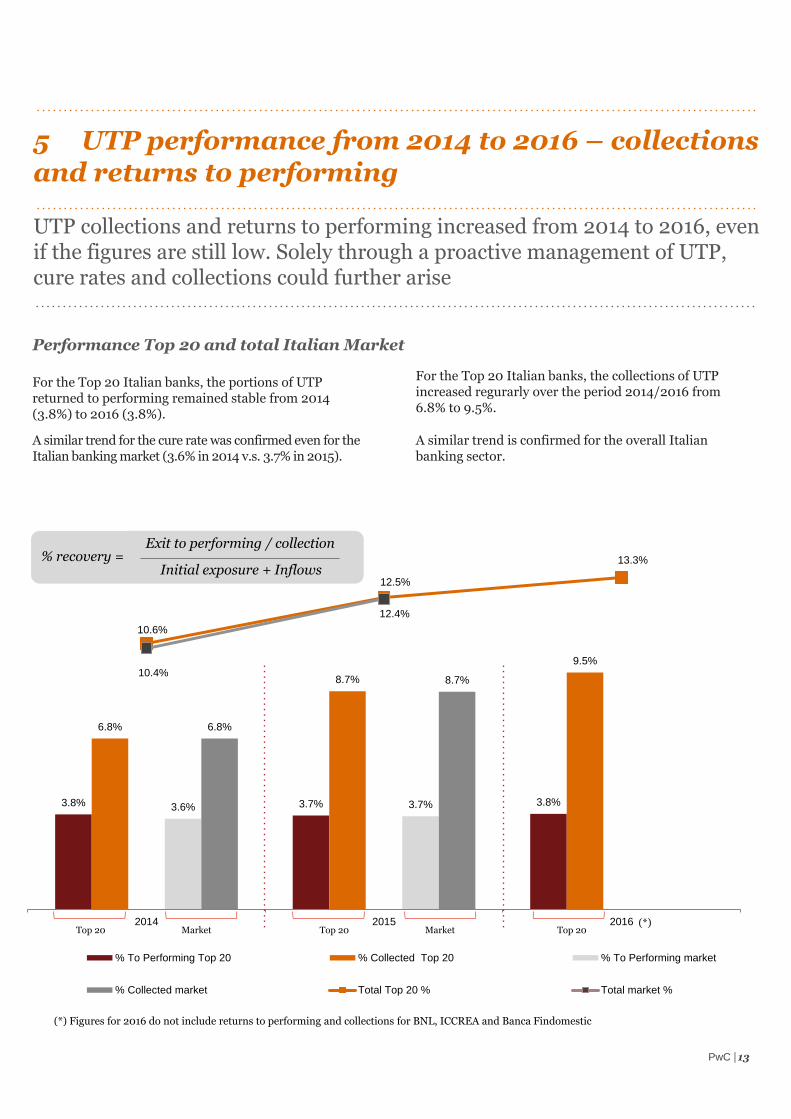
A similar trend for the cure rate was confirmed even for the Italian banking market (3.6% in 2014 v.s. 3.7% in 2015).
For the Top 20 Italian banks, the collections of UTP increased regurarly over the period 2014/2016 from 6.8% to 9.5%.
A similar trend is confirmed for the overall Italianbanking sector.
5 UTP performance from 2014 to 2016 – collectionsand returns to performing
UTP collections and returns to performing increased from 2014 to 2016, evenif the figures are still low. Solely through a proactive management of UTP, cure rates and collections could further arise
For the Top 20 Italian banks, the portions of UTP returned to performing remained stable from 2014 (3.8%) to 2016 (3.8%).
(*) Figures for 2016 do not include returns to performing and collections for BNL, ICCREA and Banca Findomestic
PwC | 13
Top 20 Market Top 20 Market Top 20(*)
% recovery =Exit to performing / collection
Initial exposure + Inflows

14 | The Italian Unlikely to Pay market | Ready to tackle the challenge?

6 What should banks do to tackle the UTP challenge?
UTP need to be moved out of their hybrid condition. Banks should carry on portfolio segmentation to better understand their UTP asset quality as well as implement a due diligence approach on a single name basis to identify the most effective and efficient deleveraging strategy for their UTP. Different options might be available and vary case by case
Our view about what banks should do for a proactive management of UTP
Market risks(external variables such as
those regarding the environment where the
borrowers operate)
Operational risks (risks concerning the
operational structure of the borrowers)
Financial risks (financial soundness of the
borrowers and / or relevant customers and /
or suppliers)
Carry on portfolio segmentations for (i) a better understanding of the asset quality of their UTP, (ii) a proper classification of the portfolio and(iii) a preliminary identification of management strategies
1
Regularly monitor the Central Credit Register to be informed on the total exposure to the system and relevant movements
(overdraft withdrew or decrease, bad loan classification)3
Use early warning indicators: from internal (companies and individuals) and external sources4
Produce and regularly update an overall rating on borrowers’ overall risk based upon info gathered from several sources5
Implement improved NPE operating model: dedicated workout units, procedures for classification and segmentation, tailor
made management strategies on a single name basis6
Perform analysis on borrowers’ financial statements/updated quarterly reports/ Business Plan, Budget and any further
financial documentation about the borrowers’ performance and financial position
2
PwC | 15
16 | The Italian Unlikely to Pay market | Ready to tackle the challenge?
7 Which strategic options to fix the UTP issue?
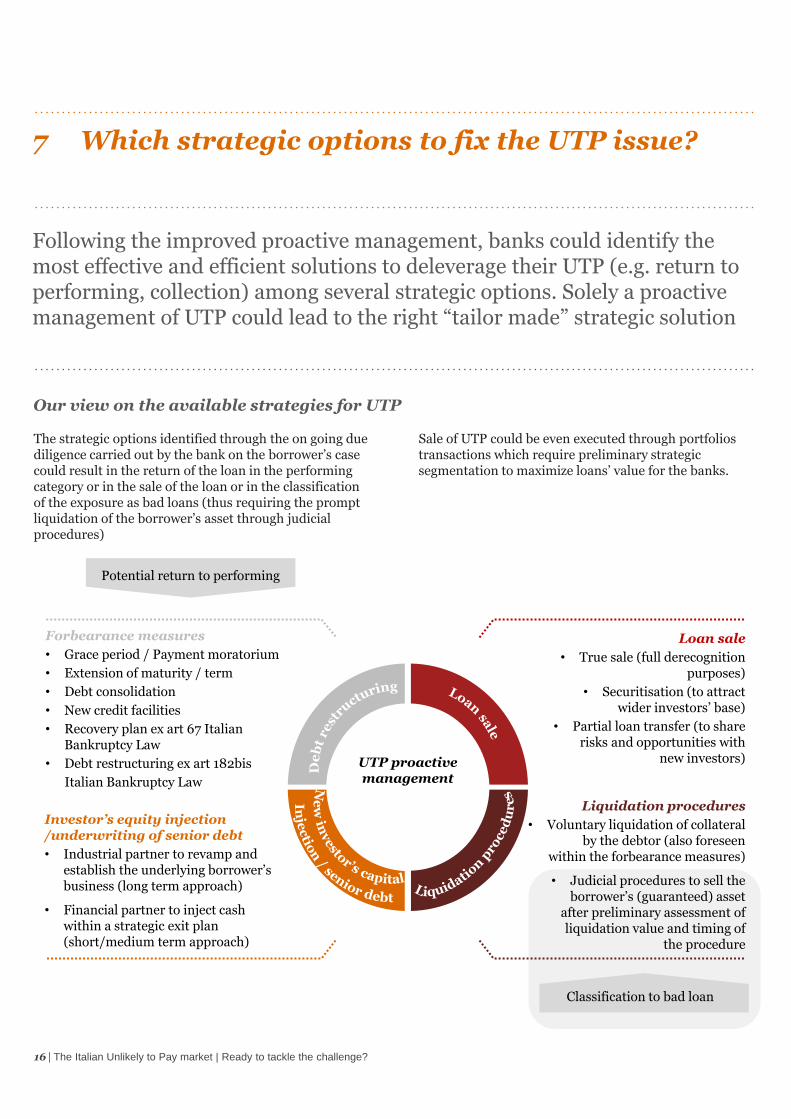
Following the improved proactive management, banks could identify the most effective and efficient solutions to deleverage their UTP (e.g. return to performing, collection) among several strategic options. Solely a proactive management of UTP could lead to the right “tailor made” strategic solution
Our view on the available strategies for UTP
Loan sale
• True sale (full derecognitionpurposes)
• Securitisation (to attract wider investors’ base)
• Partial loan transfer (to share risks and opportunities with
new investors)
Investor’s equity injection /underwriting of senior debt
• Industrial partner to revamp and establish the underlying borrower’s business (long term approach)
• Financial partner to inject cash within a strategic exit plan (short/medium term approach)
Forbearance measures
• Grace period / Payment moratorium
• Extension of maturity / term
• Debt consolidation
• New credit facilities
• Recovery plan ex art 67 Italian Bankruptcy Law
• Debt restructuring ex art 182bis
Italian Bankruptcy Law
Liquidation procedures
• Voluntary liquidation of collateral by the debtor (also foreseen
within the forbearance measures)
• Judicial procedures to sell the borrower’s (guaranteed) asset
after preliminary assessment of liquidation value and timing of
the procedure
UTP proactive management
Potential return to performing
Classification to bad loan
The strategic options identified through the on going due diligence carried out by the bank on the borrower’s case could result in the return of the loan in the performing category or in the sale of the loan or in the classification of the exposure as bad loans (thus requiring the prompt liquidation of the borrower’s asset through judicial procedures)
Sale of UTP could be even executed through portfolios transactions which require preliminary strategic segmentation to maximize loans’ value for the banks.

8 Forbearance as a relevant measure for the proactive management of UTP
Italian banks should improve their loans’ restructuring procedures throughout an appropriate and more effective “case by case” analysis of the financial difficulty of the borrower
The ECB guidance on Forbearance
The ECB guidance emphasizes that the main objective of forbearance measures is to allow debtors to exit their non-performing status or to prevent performing borrowers from reaching a non-performing status.
Therefore, the guidance actively addresses the theme, by guiding banks in the identification of the optimal balance of forbearance measures aimed at granting the exit from short- and long-term difficulty status of the debtor.
In particular, on the basis of the type of difficulty of the debtor, either short- or long-term forbearance measures (or a combination of the two) maximizing recoveries shall be identified, by granting, simultaneously, the sustainability of the adopted measures (e.g. debt service capacity).
Main forbearance measures(1) – Application examples
(1) In addition to debt forgiveness and/or arrears capitalisation options
Interventionarea
Interest
Instalments
Maturity
Collateral
Adoption of short-term measures Adoption of long-term measures
• Temporary payment of interest only (no capital reimbursement)
• Temporary reduction of instalment amount
• Full interest payment
• Rescheduling of amortization plan (e.g. partial, bullet, step-up)
• Permanent reduction of interest rates
• “Grace period” for the payment of interests and capital
• Voluntary disposal of collateral by the debtor
• Extension of debt maturity
• Misalignmentbetween repayment plan and reimbursement capacity of the debtor
• Excessively high interest rates for the debtor
• Permanent difficulty and good level of collateralization
• Excessively high instalments for the debtor
• Temporary financial difficulty of minorentity to be overcome within 24 months
• Temporary financial difficulty of moderate entity to be overcome within 24 months
• Temporary financial difficulty of moderate/ serious entity to be overcome within 24 mo.
In particular cases it is possible to adopt new credit facilities or debt
consolidation measures
= financial situation of the debtor = applicable forbearance measure
PwC | 17

18 | The Italian Unlikely to Pay market | Ready to tackle the challenge?
9 How will the IFRS9 affect UTP?
Starting from 2018, we expect that a higher portion of loans might be at risk to be reclassified in loans’ higher risk categories following the introduction of a different valuation approach (from “ex post” to “forward looking”)
Our view on the requirements arisen from the adoption of IFRS9 for the Italian banks
The transition to IFRS 9 (from IAS 39) will be critical as banks will be required to accrue provisions based on expected losses and not only upon the occurrence of specific events (e.g. “impairment tests”). Banks will be asked to adopt a “forward looking” approach and as such to anticipate losses at the first signals of deterioration.
As a result, specific instruments as well as right structure and skilled people to proactively monitor borrowers’ performances will be required.
Classification Impairment
New classification criteria will lead to 3 new classes of loans (“Hold to collect”, “Hold to collect and sale”, “Trading”). The need to properly classify theirexposures will require the bank to review and strategically refine their business model associated to the loans’ management:
• On the one hand, for the “portfolio to hold”, banksshould strenghten the internal credit monitoringfunctions in terms of expertise as well as of renovated tools of credit risk measurement (e.g. KPI, index, advanced CRM solutions)
• On the other hand, for the “portfolio to sell”, banksshould implement specialised units in charge of the structuring and execution of loans’ sale transactions(e.g. data preparation and remediation, securitisation)
• New impairment criteria, based on the “expectedloss” and “forward looking“ approach, will result in certain portions of the current portfolio classified in loans’ higher risk categories (e.g. from performing to UTP/bad loans)
• Higher impairment (by collective and analyticalprovisioning) will result through the “forwardlooking” approach which will move up losses to be incurred over the loans’ lifetime
• Need to foresee the lifetime losses will require the banks to implement proactive actions to preliminarlyassess borrowers’ likelyhood to pays their debtsalong with avoid further danger rate from performingto UTP and bad loans

PwC | 19
10 Non Performing Exposures classifications
How to define and what to include within the “Unlikely to Pay” category
Non-Performing Exposures
The commonly used term non-performing loans (“NPL”) is based on different definitions across Europe.To overcome problems, EBA has issued a commondefinition of Non-Performing Exposures (“NPE”) which is used for supervisory reporting purposes.
In Italy, banks are also required to distinguish amongdifferent classes of NPE: (i) Bad Loans, (ii) Unlikely toPay and (iii) Past Due; the sum of these 3 categoriescorresponds to the Non-Performing Exposures referred to in the EBA ITS.
Old New Definition of risk category
Past DueEsposizioniscadute> 90 giorni
Past Due more than90 days loans (debt)Esposizioni scadute
Including FNPE (*)
RestructuredCreditiristrutturati
Unlikely to PayInadempienzeprobabili
Including FNPE (*)Sub standardIncagli
Bad LoansSofferenze
Bad LoansSofferenze
Including FNPE (*)
NPE• Exposure to any borrower whose loans are not included in other
categories and who, at the date of the balance sheet closure, havePast Due amounts or unauthorized overdrawn positions of morethan 90 days.
• A sub-segment is now represented by the Forborne Non-Performing Exposures (“FNPE”), credits granted to a counterpartyin financial difficulty and which are not classified as Bad Loans and have been subject to the modification of the terms and conditions of the contract or refinancing.
• The classification of loans in this category is the result of the judgment of the bank about the debtors’ unlikelihood to fulfil its credit obligations. This category substitutes the old sub- standard loans (“Incagli”) and restructured loans (“Crediti Ristrutturati”).
• A sub-segment of the Unlikely to Pay is now represented by the FNPE.
• Exposure to a borrower in a position of insolvency (not necessarily recognised by a Court) or a substantially similar situation, irrespective of the presence of any collateral. Same as previous classification of Bad Loans or “Sofferenze”.
• A sub-segment of the Bad Loans is now represented by the FNPE.
(*)FNPE: Forborne Non-Performing Exposures Source: EBA, EBA/ITS/2013/03/rev1
24/7/2014
FNPE may become a Forborne Performing Exposure if:
• 12 months have passed from last allowance
• No past due from last allowance occurred
The unlikelihood judgement of UTP
The exposures are classified as Unlikely to Pay in light ofthe unlikelihood that relevant debtors will fulfil their credit obligations.
The unlikelihood judgement is made by the Bank based on a varied spectrum of signals and issues.
The range of signals and issues may be very wide anddiffers case by case but a common feature is that each of them is recoverable and / or is manageable if tackledproperly and timely. Time is of essence.

20 | The Italian Unlikely to Pay market | Ready to tackle the challenge?

23.0
(8%)
(11%)
(21%)
(6%)
13%
11%
9% 20.0
Exposure 31Dec15 To performing Collected To bad loans Others From performing From nonperforming
Other inflows Exposure 31Dec16
Outflows and inflows | Unicredit
Outflows and inflows | Intesa Sanpaolo
Outflows
(14.2)
Inflows
11.9
Outflows
(10.5)
Inflows
7.5
11 Unlikely to Pay inflows and outflows from 2014to 2016 – Top 10 Italian banks (breakdown by bank)
26.9
(4%)
(20%)
(21%)
(8%)
19%
10%
15% 24.5
Exposure 31Dec15 To performing Collected To bad loans Others From performing From nonperforming
Other inflows Exposure 31Dec16
PwC | 21

22 | The Italian Unlikely to Pay market | Ready to tackle the challenge?
Outflows and inflows | MPS
Outflows and inflows | Banco BPM
Outflows
(5.4)
Inflows
3.3
Outflows
(5.1)
Inflows
3.9
17.4
(3%)
(6%)
(19%) (2%)
9%
6% 4%
15.2
Exposure 31Dec15 To performing Collected To bad loans Others From performing From nonperforming
Other inflows Exposure 31Dec16
12.7
(5%)
(10%)
(23%)(2%)
22% 3%
6% 11.5
Exposure 31Dec15 To performing Collected To bad loans Others From performing From nonperforming
Other inflows Exposure 31Dec16

2.6
(5%)
(11%)
(18%)(2%)
28% 7% 5%
2.7
Exposure 31Dec15 To performing Collected To bad loans Others From performing From nonperforming
Other inflows Exposure 31Dec16
10.0
(6%)
(10%)
(24%)(1%)
21% 1%
6% 8.7
Exposure 31Dec15 To performing Collected To bad loans Others From performing From nonperforming
Other inflows Exposure 31Dec16
PwC | 23
Outflows and inflows | Banco Popolare
Outflows and inflows | BPM
Outflows
(4.1)
Inflows
2.8
Outflows
(1.0)
Inflows
1.1
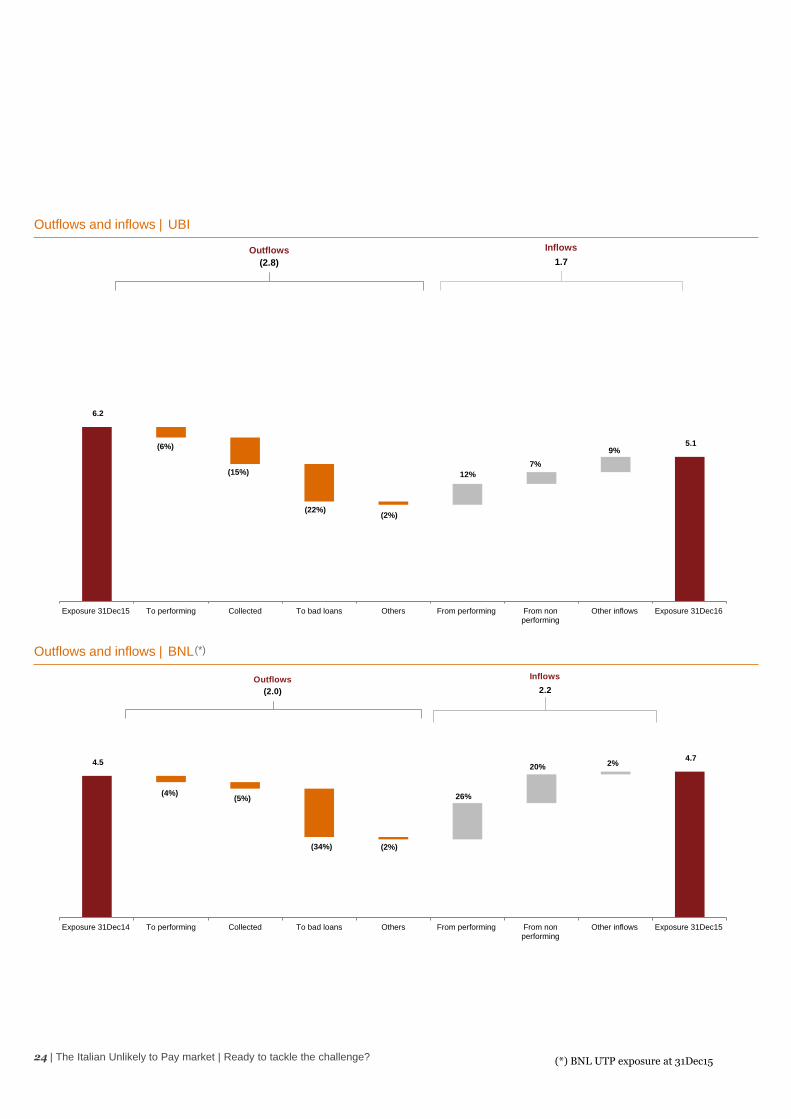
4.5
(4%)(5%)
(34%) (2%)
26%
20% 2% 4.7
Exposure 31Dec14 To performing Collected To bad loans Others From performing From nonperforming
Other inflows Exposure 31Dec15
6.2
(6%)
(15%)
(22%)(2%)
12%
7%
9% 5.1
Exposure 31Dec15 To performing Collected To bad loans Others From performing From nonperforming
Other inflows Exposure 31Dec16
Outflows and inflows | UBI
Outflows and inflows | BNL
Outflows
(2.8)
Inflows
1.7
Outflows
(2.0)
Inflows
2.2
(*) BNL UTP exposure at 31Dec15
(*)
24 | The Italian Unlikely to Pay market | Ready to tackle the challenge?

6%
3.5
(6%)
(11%)
(32%) (1%)
47%
21%
4.4
Exposure 31Dec15 To performing Collected To bad loans Others From performing From nonperforming
Other inflows Exposure 31Dec16
Inflows
2.6
4.4
(3%)
(8%)
(21%) (1%)
24%
9% 4%
4.6
Exposure 31Dec15 To performing Collected To bad loans Others From performing From nonperforming
Other inflows Exposure 31Dec16
Outflows and inflows | Banca Popolare di Vicenza
Outflows and inflows | Veneto Banca
Outflows
(1.5)
Inflows
1.7
Outflows
(1.7)
PwC | 25

4.0
(8%)
(20%)
(18%)(2%)
30% 4%
12% 4.0
Exposure 31Dec15 To performing Collected To bad loans Others From performing From nonperforming
Other inflows Exposure 31Dec16
3.0
(8%)(8%)
(11%)
(0%)
32% 5% 5%
3.5
Exposure 31Dec15 To performing Collected To bad loans Others From performing From nonperforming
Other inflows Exposure 31Dec16
Outflows and inflows | BPER
Outflows and inflows | Carige
Outflows
(0.8)
Inflows
1.3
Outflows
(1.9)
Inflows
1.9
26 | The Italian Unlikely to Pay market | Ready to tackle the challenge?

13%7% 7%
11%5%
40%
18% 19%7%
0% 12%
Credito Valtellinese CA Cariparma BP di Sondrio ICCREA Banca Popolare diBari
Banca IFIS Banco di Desio edella Brianza
CR di Bolzano CR di Ravenna Banca Findomestic Average top 20
20%
11%
6%
10%
15%
5% 8%11%
20%
8%
12%
UniCredit IntesaSanpaolo
MPS BancoPopolare
UBI BNL BPVI VenetoBanca
BPER CARIGE Average top20
1%
6%
3%5%
2% 0%2%
0% 2%
11%
4%
CreditoValtellinese
CA Cariparma BP di Sondrio ICCREA BancaPopolare di
Bari
Banca IFIS Banco di Desioe della Brianza
CR di Bolzano CR di Ravenna BancaFindomestic
Average top 20
4%
8%
3%
5% 6%
4%3%
6%
8%8%
4%
UniCredit IntesaSanpaolo
MPS BancoPopolare
UBI BNL BPVI VenetoBanca
BPER CARIGE Average top20
11 Outflows – Top 20 Italian banks
From UTP to Performing in 2016 (*)
From UTP to Collected in 2016 (*)
Average Top
20
UniCredit MPS Banco
BPM
UBI BNL BPVI BPERVeneto
Banca
Gruppo
Carige
Intesa
Sanpaolo
Average Top
20
Credito
Valtellinese
CA
Cariparma
BP
di Sondrio
ICCREA BP di Bari CR
di Bolzano
Banco di
Desio
CR di
Ravenna
Banca
Findomestic
Banca IFIS
Average Top
20
UniCredit MPS Banco
BPM
UBI BNL BPVI BPERVeneto
Banca
Gruppo
Carige
Intesa
Sanpaolo
Average Top
20
Credito
Valtellinese
CA
Cariparma
BP
di Sondrio
ICCREA BP di Bari CR
di Bolzano
Banco di
Desio
CR di
Ravenna
Banca
Findomestic
Banca IFIS
Banco Popolare BPM
6% 5%
Banco Popolare BPM
10% 11%
(*) Figures for BNL, ICCREA and Banca Findomestic refer to 2015 PwC | 27

69% 68%74% 72%
87%
36%45%
74% 72%
Not meaningful
60%
Credito Valtellinese CA Cariparma BP di Sondrio ICCREA Banca Popolare diBari
Banca IFIS Banco di Desio edella Brianza
CR di Bolzano CR di Ravenna Banca Findomestic Average top 20
55%60%
71%62% 57% 57%
68%
51% 55%
74%
60%
UniCredit IntesaSanpaolo
MPS BancoPopolare
UBI BNL BPVI VenetoBanca
BPER CARIGE Average top20
17% 19%
15% 12%6% 25% 35% 7%
19%
90%
23%
CreditoValtellinese
CA Cariparma BP di Sondrio ICCREA BancaPopolare di
Bari
Banca IFIS Banco di Desioe della Brianza
CR di Bolzano CR di Ravenna BancaFindomestic
Average top 20
21% 21% 19%23% 22%
34%
21%
32%
18%
11%
23%
UniCredit IntesaSanpaolo
MPS BancoPopolare
UBI BNL BPVI VenetoBanca
BPER CARIGE Average top20
From UTP to Bad Loans in 2016 (*)
Remained UTP in 2016 (*)
Average Top
20
UniCredit MPS Banco
BPM
UBI BNL BPVI BPERVeneto
Banca
Gruppo
Carige
Intesa
Sanpaolo
Average Top
20
Credito
Valtellinese
CA
Cariparma
BP
di Sondrio
ICCREA BP di Bari CR
di Bolzano
Banco di
Desio
CR di
Ravenna
Banca
Findomestic
Banca IFIS
Average Top
20
UniCredit MPS Banco
BPM
UBI BNL BPVI BPERVeneto
Banca
Gruppo
Carige
Intesa
Sanpaolo
Average Top
20
Credito
Valtellinese
CA
Cariparma
BP
di Sondrio
ICCREA BP di Bari CR
di Bolzano
Banco di
Desio
CR di
Ravenna
Banca
Findomestic
Banca IFIS
Banco Popolare BPM
24%18%
Banco Popolare BPM
61%66%
(*) Figures for BNL, ICCREA and Banca Findomestic refer to 2015 28 | The Italian Unlikely to Pay market | Ready to tackle the challenge?

PwC | 29
30 | The Italian Unlikely to Pay market | Ready to tackle the challenge?


© 2017 PricewaterhouseCoopers Advisory SpA. All rights reserved. PwC refers to PricewaterhouseCoopers Advisory SpA and may sometimes refer to the PwC network.
Each member firm is a separate legal entity. Please see www.pwc.com/structure for further details. This content is for general information purposes only, and should not be
used as a substitute for consultation with professional advisors.
www.pwc.com/it