the issuance of debt securities by belgian non-financial
TRANSCRIPT

158NBB Economic Review ¡ September 2021 ¡ The issuance of debt securities by Belgian non-financial corporations
The issuance of debt securities by Belgian non-financial corporations
M. V. GeraciJ. MohimontCh. Piette*
Introduction
Against the backdrop of the low interest rate environment that followed the global financial crisis, corporate debt has been expanding in Belgium like in other euro area countries. Belgian non-financial corporations’ (or NFCs) consolidated debt (excluding intra-group loans) rose from 51 % of GDP in 2010, to 67.2 % in 2020. This increase has been partly driven by debt securities, such as money market instruments, medium-term notes, and corporate bonds, issued mainly by large companies. Debt securities now account for 21.5 % of that debt. Whilst developments in bank lending are being closely monitored by prudential authorities, less attention has been devoted so far to the drivers of debt security issuance and the risks associated with these liabilities. Furthermore, favourable financing conditions may lead some firms with weaker balance sheets to increase their leverage through bond issues 1. While the related risks are alleviated by the corporate sector’s current low debt servicing burden and by its overall strong liquidity position, some bond issuers might face difficulties in servicing their debt in the event of a business cycle downturn and/or a sudden rise in interest rates.
The goal of this article is twofold. First, it aims to identify and profile Belgian firms that issue debt securities, with a focus on their main characteristics in terms of financial health. For the sake of conciseness and to conform with the literature, we refer to Belgian corporate debt security issuers simply as “bond issuers” 2. Second, it investigates possible risks linked to debt security financing. The literature generally concurs that most bond issuers are financially solid entities with, on average, a stronger balance sheet position than firms without bond market access. However, some studies have pointed out that access to bond markets might encourage debt-loading and heightened leverage. For this reason, negative shocks to fragile bond-issuing corporations could be particularly threatening for some firms and for financial stability in general.
This article is structured as follows. The first section reviews the developments in the issuance of debt securities by Belgian firms over the last decade. We link changes in the aggregate amount of debt outstanding to recent macrofinancial developments. In the second section, we look at the population of Belgian bond issuers, describe their characteristics, and discuss their importance for the Belgian economy. In section three, we identify
1 See, for instance, ECB (2019).2 Although medium-term notes account for a significant share of the outstanding volume of debt securities issued by Belgian companies, most firms concerned in this study use corporate bonds.
* The authors gratefully acknowledge the helpful guidance of Alexandre Coleau, Veerle Deniere, Geeraard Seghers and Wim Van den Broek concerning the various data sources used in this study. They also thank Luc Aucremanne, Pelin Ilbas and Christoph Machiels for their reading and comments.

159NBB Economic Review ¡ September 2021 ¡ The issuance of debt securities by Belgian non-financial corporations
a relatively small pocket of risk among Belgian bond issuers, mainly borne by entities that do not belong to the traditional financial system, such as investment funds. While most Belgian bond issuers enjoy comfortable levels of debt sustainability, it appears that a few of them may potentially face a situation of financial distress. In section four, we suggest that a firm can find itself in a situation of weak debt sustainability for two reasons : low profitability or leveraging strategies. These firms could face difficulties in the event of an increase in funding costs or a drop in corporate revenues. In addition, we also highlight some mitigating factors limiting the risks faced by most Belgian bond issuers. The last section concludes.
1. Recent developments in Belgian corporate debt issuance
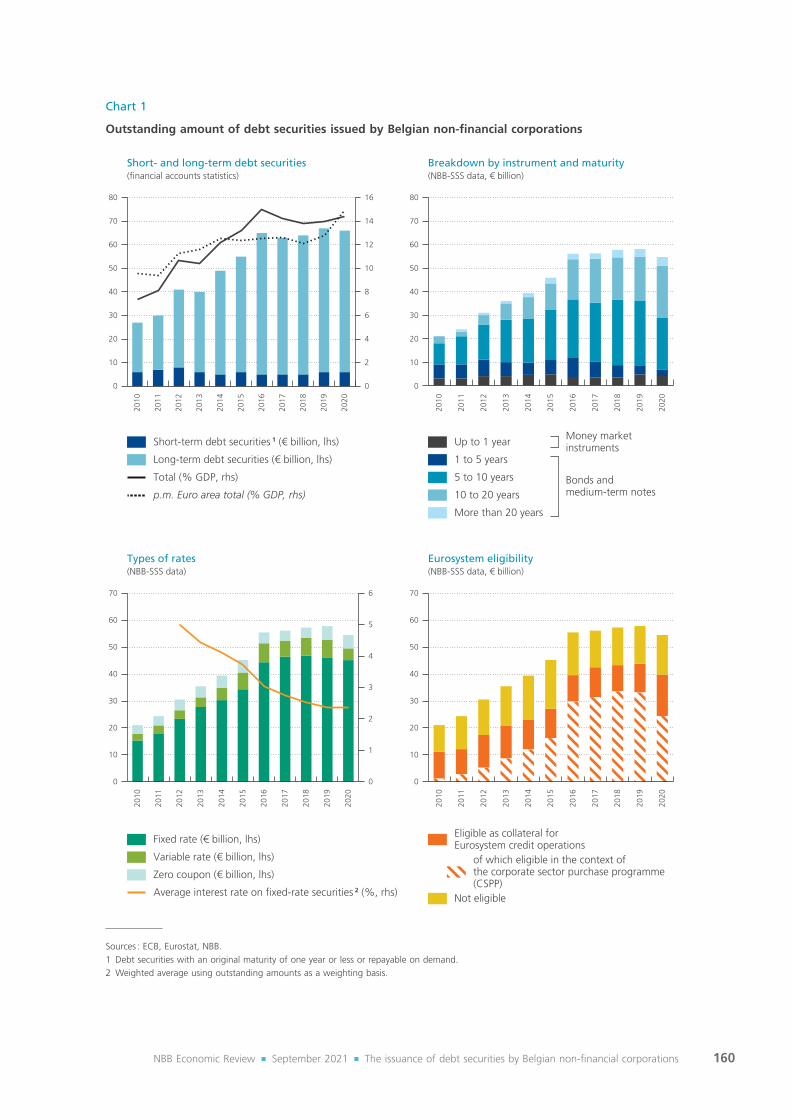
Issuance of debt securities by Belgian non-financial corporations has grown over the past decade. The upper-left panel of chart 1 shows that their total stock of debt securities, as recorded in the financial accounts statistics, expanded from € 27 billion in 2010 to € 65 billion in 2020. The trend in Belgium is comparable to the one observed in the euro area taken as a whole. Indeed, the aggregate Belgian and euro-area-wide NFC debt securities-to-GDP ratio rose by, respectively, 7 and 5 percentage points, settling at 14 and 15 % of GDP by the end of 2020.
To shed additional light on the developments of corporate debt in Belgium, we exploit a novel granular dataset on debt securities issued by Belgian NFCs from the NBB’s Securities Settlement System (NBB-SSS) 1, 2. As can be seen from the upper right-hand panel of chart 1, the NBB-SSS data covers a large portion of the total stock of debt securities issued by Belgian NFCs. Compared to financial accounts statistics, NBB-SSS data allows to explore additional granular information of corporate debt at the security level, such as the type of instrument chosen by issuers, the cost of debt, and a more detailed maturity breakdown. Between 2010 and 2020, the NBB-SSS data included information on 11 615 debt securities issued by 124 Belgian NFCs. Using this data, we can appreciate that the increase in corporate debt securities is especially pronounced in the 5 to 10 and 10 to 20 years segments (upper right panel of chart 1).
During the global financial crisis (GFC) in 2008 and 2009, bond issuers in the euro area as well as in the United States substituted bank loans for debt securities. Stress in the banking sector prompted banks to cut their credit supply. Bond issuers responded by turning to debt securities, while many bank-dependent borrowers faced difficulties in getting access to credit (Adrian, Colla and Shin, 2013 ; Becker and Ivashina, 2014 ; Crouzet, 2018 ; De Fiore and Uhlig, 2015 ; Altavilla, Darracq Pariès and Nicoletti, 2019). In the aftermath of the GFC, tighter macroprudential regulations were introduced to boost the banking sector’s resilience. To comply with higher capital requirements (imposed by the Basel III reform), banks had to adjust their credit supply, especially in the transition phase towards higher capital ratios (BCBS, 2019, 2021). This decline in bank credit supply might also have caused substitution effects in favour of corporate debt securities. Going forward, we note that the long-run effect of Basel III on the bond and bank loan mix could be ambiguous, as better capitalised banks should be able to provide more stability in credit supply, making bank loans more attractive.
The low/negative interest rate environment has also contributed to the build-up of NFC debt. With the onset of the GFC, central banks around the world lowered their policy rates and extended their toolkits to unconventional monetary policy measures. Combined with the downward trend in the natural rate of interest, expansionary monetary policies resulted in a decline in interest rates to historically low levels. In June 2014, when the euro area economy was still recovering from the European sovereign debt crisis, the ECB introduced its negative
1 For sample construction, we considered NFCs following the S.11 classification by Belgium’s National Accounts Institute.2 The NBB-SSS is a clearing system that enables the processing of transactions on both the primary market (on which new securities are issued) and the secondary market (on which financial instruments already in circulation are exchanged). Data from the NBB-SSS is available back to 2010, hence the period of study used for this article.
160NBB Economic Review ¡ September 2021 ¡ The issuance of debt securities by Belgian non-financial corporations
Chart 1
Outstanding amount of debt securities issued by Belgian non-financial corporations
Short- and long-term debt securities(financial accounts statistics)
Breakdown by instrument and maturity(NBB-SSS data, € billion)
Bonds andmedium-term notes
Types of rates(NBB-SSS data)
Eurosystem eligibility(NBB-SSS data, € billion)
p.m. Euro area total (% GDP, rhs)
Total (% GDP, rhs)
Long-term debt securities (€ billion, lhs)
Short-term debt securities 1 (€ billion, lhs) Up to 1 year
More than 20 years
10 to 20 years
5 to 10 years
1 to 5 years
Fixed rate (€ billion, lhs)
Average interest rate on fixed-rate securities 2 (%, rhs)
Zero coupon (€ billion, lhs)
Variable rate (€ billion, lhs)
Not eligible
of which eligible in the context ofthe corporate sector purchase programme(CSPP)
Eligible as collateral forEurosystem credit operations
80
70
60
50
40
30
20
2010
2011
2012
2013
2014
2015
2016
2017
2018
2019
2020
2010
2011
2012
2013
2014
2015
2016
2017
2018
2019
2020
2010
2011
2012
2013
2014
2015
2016
2017
2018
2019
2020
2010
2011
2012
2013
2014
2015
2016
2017
2018
2019
2020
10
0
80
70
60
50
40
30
20
10
0
70
60
50
40
30
20
10
0
70
60
50
40
30
20
10
0
6
5
4
3
2
1
0
16
14
12
10
8
6
4
2
0
Money marketinstruments
Sources : ECB, Eurostat, NBB.1 Debt securities with an original maturity of one year or less or repayable on demand.2 Weighted average using outstanding amounts as a weighting basis.

161NBB Economic Review ¡ September 2021 ¡ The issuance of debt securities by Belgian non-financial corporations
interest rate policy by lowering its deposit facility rate below zero. The low/negative interest rate environment triggered search-for-yield effects which contributed to the rise in (risky) corporate debt, especially in emerging market economies (Abraham, Cortina and Schmukler, 2020). In Belgium, we document a preference of issuers for fixed interest rates against the backdrop of the low interest rate environment (chart 1, lower left-hand panel). Moreover, as can be noted from the upper right-hand panel of chart 1, some Belgian NFCs were able to lock in low interest rates by issuing fixed-rate long-term debt securities.
Central banks’ asset purchases have also induced portfolio rebalancing effects in favour of (riskier) corporate debt securities. These asset purchases imply that a significant fraction of (sovereign) bonds are held by central banks, reducing the stock of bonds available to private investors, and prompting them to raise their demand for corporate debt securities. Moreover, in March 2016, the ECB decided to implement a corporate sector purchase programme (CSPP) directly targeting investment-grade euro-denominated debt securities issued by NFCs established in the euro area. The CSPP caused a drop in yields – for both eligible and non-eligible issuers – and an increase in corporate bond issuance (see Zaghini, 2020 ; Pegoraro and Montagna, 2021 ; and the references therein). The lower right-hand panel of chart 1 shows that, since the start of the programme, there has been a marked increase in the outstanding amount of CSPP-eligible debt securities issued by a limited number of Belgian NFCs 1.
Finally, it is important to note that the trends described above are not specific to Belgium. As just explained, these developments were driven by global macrofinancial factors, which had a similar impact on the NFCs debt security market in the euro area (ECB, 2019) and in the rest of the world (Çelik, Demirtaş and Isaksson, 2019 ; 2020). However, specifically Belgian factors are also at play. For example, the marked increase in Belgian NFC debt securities in 2016 was mainly driven by an issuance by AB Inbev, one of the world’s largest brewery companies, to raise funds on the capital market to finance an acquisition.
2. Which firms issue debt securities ?
In this section, we use the granular NBB-SSS securities data to identify Belgian firms that make use of debt security financing and evaluate their importance for the Belgian economy. To explore their characteristics, we aggregated the NBB-SSS data at individual firm level and matched it with firm-level information from the annual accounts of companies from the Belgian Central Balance Sheet Office. As a means of comparison for bond issuers, we kept data on the universe of Belgian NFCs. Additionally, to account for firms’ access to bank lending, we integrated the matched dataset with data from the Central Corporate Credit Register. Table 1 presents a summary breakdown of the dataset for 2019.
As can be noted from table 1, bond-issuing firms account for only a residual fraction of the total number of Belgian firms. Most bond issuers in our dataset are large firms, as they account for a high share of Belgian NFCs’ total employment and total fixed assets. The second column of table 1 shows summary statistics for firms that do not issue bonds but that rely on bank credit to finance their operations. Bank-dependent firms represent a much larger share of small and medium-sized enterprises (SME). The final part of table 1 shows that virtually all bond issuers in our sample are part of a Belgian or multinational group. This means that funds collected through the issuance of debt securities by these corporations established in Belgium are not necessarily used to finance domestic activities.
1 At the end of 2020, the Eurosystem held securities issued by 13 different Belgian companies within the framework of the CSPP. Most of them are classified as NFCs according to the methodology followed by Belgium’s National Accounts Institute.

162NBB Economic Review ¡ September 2021 ¡ The issuance of debt securities by Belgian non-financial corporations
An initial overview of the data suggests that bond issuers are healthier than firms relying on bank credit. In 2019, about 16.3 % of bank-dependent firms could be categorised as “in difficulty” 1. In contrast, during the same year, only 7.3 % of bond issuers were in a similar situation.
The institutional design of the public debt market explains why larger firms are more likely to issue debt securities. Producing the information required to issue debt securities is complex and implies substantial fixed costs. Big firms are relatively more efficient at producing this information (Fama, 1985 ; Nakamura, 1993) and can exploit economies of scales associated with their larger financing needs (Krishnaswami et al., 1999). Moreover, debt securities issued in large lots are more liquid and can enjoy the benefits of a lower liquidity premium. In contrast, as documented in the European Commission’s report on the European corporate bond market, SMEs often lack
1 We follow the European Commission’s definition to classify undertakings in difficulty.
Table 1
Share of firms issuing debt securities in the Belgian economy(data for 2019)
Firms issuing debt securities
Firms borrowing from banks Other firms
Number of firms 96 313 720 116 254
of which: large enterprises 1 47 1 229 452
Share (%) in total…
number of firms 0.0 72.9 27.0
employment 6.4 71.6 21.9
tangible fixed assets 11.3 69.9 18.8
intangible fixed assets 17.6 60.5 21.9
financial fixed assets 31.5 39.0 29.4
used bank credit 2 5.7 94.2 0.1
authorised bank credit 2 10.1 89.9 0.0
Percentage of firms…
with a balance sheet total equal to or greater than € 100 million 87.5 0.3 0.3
part of a group 94.8 19.5 17.2
in difficulty 3 7.3 16.3 20.0
whose total debt rose over the last five years, of which... 59.4 38.0 28.0
increased both their debt securities and their bank credits 21.9 – –
increased their debt securities and decreased their bank credits 19.8 – –
decreased their debt securities and increased their bank credits 11.5 – –
decreased both their debt securities and bank credits 6.3 – –
Source : NBB.1 According to the definition set out by the European Commission (Recommendation 2003/361/EC), an enterprise is considered large if it
employs at least 250 people or if its turnover is greater than € 50 million or if its balance sheet total exceeds € 43 million.2 Only loans granted by resident banks to resident non-financial corporations are considered.3 A firm is considered to be “in difficulty” if it meets at least one of the three following conditions : (1) its accumulated losses (minus the
reserves) exceed half of its subscribed share capital (including share premium and revaluation surpluses) unless it is an SME aged less than 3 years, (2) it has defaulted on a bank loan or (3) it is a large enterprise whose debt-to-equity ratio has been greater than 7.5 and whose interest-coverage ratio (defined as EBITDA divided by ordinary financial charges) has been below 1 for the past two years. This definition is an adaptation, devised under the constraint of data availability, of that of the “undertaking in difficulty” as set out by European Commission Regulation No. 651/2014.
163NBB Economic Review ¡ September 2021 ¡ The issuance of debt securities by Belgian non-financial corporations
the legal, tax and financial expertise or knowledge of the bond market. The positive correlation between firm size and debt security issuance is well documented in the empirical literature (see Kale and Meneghetti (2011) for an extensive review of the literature).
Agency problems between lenders and borrowers explain why safer borrowers are more likely to issue debt securities, while relatively riskier firms use more bank loans. Theory predicts that firms perceived as safe – with good reputation, tangible assets pledged as collateral, and well-capitalised – can access the debt security markets (Diamond, 1991 ; Holmstrom and Tirole, 1997). For other firms, lenders might find it difficult to assess their ability to repay a loan (adverse selection problem) and to ensure that they do not engage in activities that could be detrimental to debtholders (moral hazard problem). Banks mitigate these problems by engaging in screening and monitoring activities (Diamond, 1984 ; Repullo and Suarez, 2000). By pooling investor resources, banks build expertise and avoid any duplication of effort and associated free-riding problems in the screening and monitoring processes. As informed lenders, banks are thus more likely to finance viable projects and to prevent opportunistic behaviour by borrowers that might otherwise harm creditors. After a loan is granted, they are also more likely to make the right renegotiation decision to avoid liquidation of potentially viable firms in times of temporary distress (Berlin and Mester, 1992). In this context, theory predicts that riskier borrowers who require screening and monitoring or value the option to renegotiate loans in time of distress should opt for bank loans (Bolton and Freixas, 2000). The empirical literature tends to back those predictions. Proxies for borrower quality, such as profitability and share of fixed assets, tend to correlate with debt security issues (Houston and James, 1996 ; Johnson, 1997 ; Denis and Mihov, 2003).
Table 1 also shows that bond issuers have a large share in authorised credit. Of the € 178 billion of total credit authorised in 2019 by resident banks to resident NFCs, 10.1 % was assigned to bond-issuing firms. The share of credit that is used by these corporations is substantially lower than that used by bank-dependent firms. Overall, thanks to additional credit lines from banks, Belgian bond issuers can count on diversified sources of funding.
Particularly after the recent institution of central bank asset purchase programmes, part of the literature has focused on whether NFCs with access to bond markets substitute bank financing for debt security financing (Betz et al., 2019). Table 1 shows that, between 2014 and 2019, about 22 % of bond issuers have increased their financial debt by relying on a mix of bank loans and debt securities. Over the same five-year period, a similar share (20 %) of issuers has increased their debt securities and decreased their bank credits, whereas only 12 % have favoured bank loans over bonds. Among those increasing their financial debt, five firms were issuing bonds eligible for the CSPP. All these five issuers have increased their reliance on bond financing and reduced their bank credits. This is in line with the findings of De Santis et al. (2018), who document the substitution effect for CSPP-eligible companies.
3. Are there pockets of risk among bond issuers ?
Although there is consensus in the above-mentioned literature that bond issuers are safer than firms that do not issue bonds, some studies have found that less capitalised (i.e. more leveraged) firms tend to favour debt security financing over bank credit 1. For example, Faulkender and Petersen (2006) find that US firms with access to bond markets have a statistically and economically higher leverage ratio, even after controlling for other firm characteristics, such as size and riskiness, that could influence demand for debt. They conclude that bond market access eases firms’ financial constraints, which might otherwise limit leverage.
1 This is in line with the stylised fact that size is also one of the most robust determinants of leverage (Frank and Goyal, 2009), indicating that large firms might increase their leverage by exploiting their better access to bond markets.

164NBB Economic Review ¡ September 2021 ¡ The issuance of debt securities by Belgian non-financial corporations
Given these findings, we analyse the difference between comparably sized bond issuers and bank-dependent firms in terms of several indicators of firm health. We are interested in answering questions such as : are the profitability and leverage of bond issuers and bank-dependent firms of similar size substantially different ? And, considering their total assets, do bank-dependent firms and bond issuers have similar levels of liquidity and debt sustainability ?
To make the most of the timeliness and relevance of our analysis, in this section, we consider only the most recent annual accounts data available and, therefore, restrict our analysis to 2019. We construct two comparable sub-samples of firms. The first sub-sample includes bond issuers, whereas the second has bank-dependent borrowers, i.e. firms that rely solely on bank credit as their source of external financing. To make the two sub-samples comparable, we matched each bond issuer with a bank-dependent borrower in order to minimise the relative difference in total assets. The matching procedure yielded the two sub-samples, each with 92 firms.
We tested how the median firm in the two sub-samples differed across a series of corporate characteristics, including profitability, liquidity, leverage, and debt sustainability. In addition to testing differences across the median of the two sub-samples, we conducted the Kolmogorov-Smirnov test for equality of distribution of the two subsamples (see Kolmogorov, 1933 ; Smirnov, 1933 ; and Conover, 1999).
Chart 2
Financial health of firms issuing debt securities vs other borrowing firms : distributions of a selection of financial ratios(indicators calculated for firms with a balance sheet total equal or larger than € 100 million, data for 2019)
EBITDAin % of total assets
−10
10
20
30
0
Firms issuingdebt securities
Firms borrowingfrom banks
Broad liquidity ratio 1
0
1
2
3
4
Firms issuingdebt securities
Firms borrowingfrom banks
Debt-to-equity ratio 2
0
2
4
6
8
10
Firms issuingdebt securities
Firms borrowingfrom banks
Interestcoverage ratio 3,4
-40
-20
-60
100
80
60
40
20
0
Firms issuingdebt securities
Firms borrowingfrom banks
Source : NBB.Note : The distributions of the three indicators considered in this chart are presented in the form of box plots. The lower and the upper limits of the boxes correspond to the first and the third quartiles of the distribution, respectively. The bar within the box stands for the second quartile, i.e. the median, of the distribution. The extremities of the “whiskers” represent the minimum and the maximum values of the distribution once outliers are disregarded.1 The broad liquidity ratio is defined as the sum of stocks, receivable at up to one year, current investment and cash, divided by debt at up
to one year.2 Negative values (due to negative equity resulting from losses carried forward) are excluded from the data sample.3 The interest coverage ratio is calculated as earnings before interest, taxes, depreciation and amortisation (EBITDA) divided by interest charges. This ratio is calculated only for firms paying interest charges.
4 These two distributions are coloured in red to indicate a statistical difference (at 5 % significance level) between issuers of debt securities and bank-dependent firms according to two statistical tests carried out with matched sub-samples of firms (see text for precise description of how sub-samples are constructed). The two tests are : (1) the sign test for the equivalence of medians across sub-samples, (2) the Kolmogorov-Smirnov test for equivalence of distribution.

165NBB Economic Review ¡ September 2021 ¡ The issuance of debt securities by Belgian non-financial corporations
According to the statistical tests, we could not reject the null hypothesis that our median bank-dependent firm and median bond issuer had the same level of EBITDA (earnings before interest, taxes depreciation and amortisation, as a percentage of total assets). Similar results were found for the broad liquidity ratio and the leverage ratio. Furthermore, the statistical tests could not detect any difference in the distribution of these financial indicators across the two matched samples.
The box plots in chart 2, depicting the population of large Belgian enterprises with more than € 100 million in total assets, support the findings of the statistical tests with a visual representation. However, it is worth noting that the financial health indicators are more dispersed for bank-dependent firms than for bond issuers 1. In particular, the lower quartile of bank-dependent firms has lower EBITDA (as a % of total assets) than the corresponding quartile of bond issuers. This concurs with the literature backing the financial soundness of corporate bond issuers.
The statistical tests carried out with the matched sub-samples brought to light significant differences between the median interest coverage ratio (ICR) of bond issuers and that of bank-dependent firms. ICR is defined as the ratio of EBITDA to interest expenditure and, as such, is used as an indicator of debt sustainability. The last panel of chart 3 shows that bond issuers have a relatively lower ICR than large bank-dependent firms. According to the Kolmogorov-Smirnov test, differences in ICR also hold across probability distributions. Taken together, the statistical tests and the box plots indicate that some firms issuing bonds in Belgium have lower debt sustainability than firms of similar size relying solely on bank credit.
At the macro level, comfortable ICRs mitigate the risk of high leverage. However, we observe a wide dispersion of ICRs, with some bond issuers in less comfortable positions. In our sample, low ICRs can be primarily ascribed to the higher interest expenses of these issuers. Compared to bank-dependent firms, some bond issuers pay higher interest charges relative to their total assets and revenues. Overall, this indicates that there are some bond issuers with a combination of low profitability and high leverage. In the remainder of this section, we explore these cases in more detail.
We classify Belgian bond issuers into four buckets according to their average ICR over 2018 and 2019 2. Because we focus on the lower part of the distribution, which could represent potential pockets of risks, we group all firms with comfortable levels of ICR (i.e. above the median levels) into a single bucket. We then sort the remaining firms into three categories.
First, we consider firms with ICRs below 1 as firms “at imminent risk of distress”. These firms are currently unable to service their debts with their income and must take on more debt or dispose of assets to avoid default. The IMF also uses this threshold to identify the most vulnerable firms in its Global Financial Stability Report (IMF, 2019). Second, we consider firms with ICRs between 1 and 2 as firms “potentially at risk of distress”. For these firms, adverse shocks to earnings or interest charges could cause financial hardship. A threshold of two is also commonly used in other studies identifying firms at risk (ECB, 2017 ; de Almeida and Tressel, 2020). Lastly, we classify firms with below average yet reasonable ICRs between 2 and 5 in a third category.
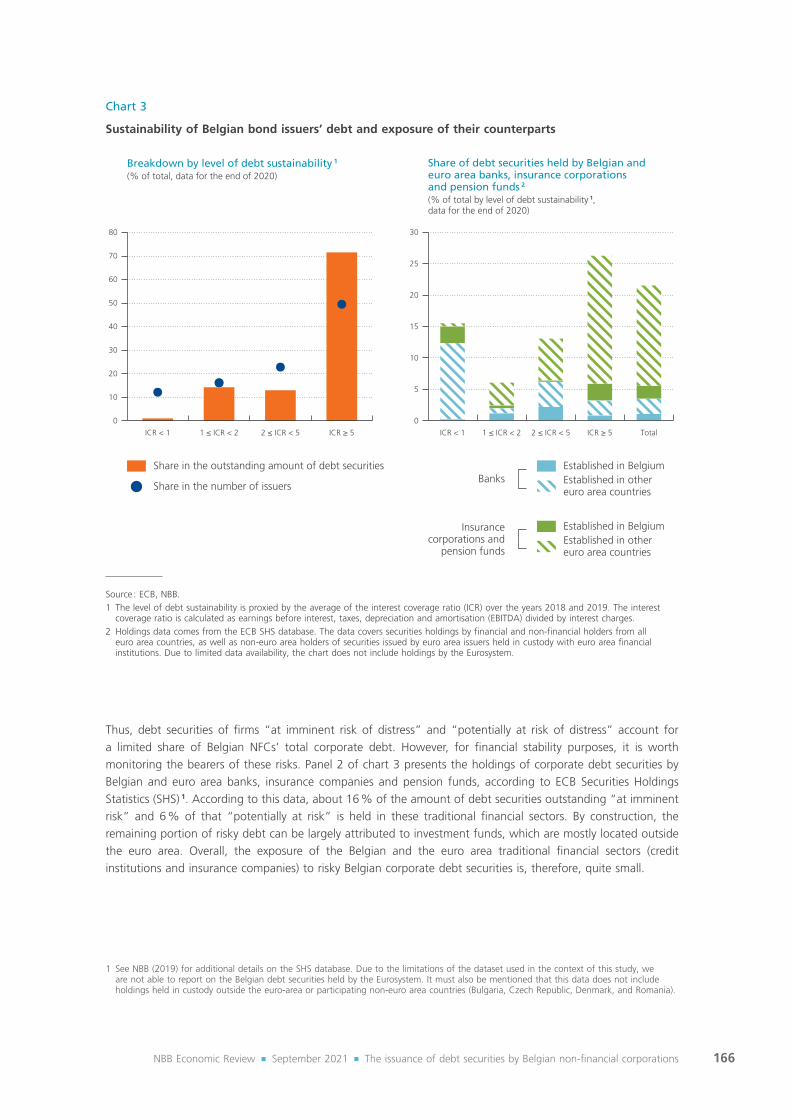
In December 2020, 12 % of bond issuers fell into the “at imminent risk of distress” category. The debt securities outstanding of these issuers totalled € 600 million, which is a marginal part (1 %) of the total outstanding amount of corporate debt securities issued by Belgian NFCs. The second category of bond issuers, classified as “potentially at risk of distress”, could hinder some pockets of risk. Panel 1 of chart 3 shows that these firms account for 14 % (€ 7.8 billion) of the outstanding amount of debt securities issued by Belgian NFCs. An unexpected large shock to interest rates or profits could potentially put these issuers at risk.
1 The higher dispersion of bank-dependent firms could be attributable to the larger sample used to construct the box plots. To control for differences in sample size, we rely on matched-sample statistical tests.
2 We use two-year averages to mitigate the influence of temporary movements in ICR. We use 2018 and 2019 data to limit the impact of COVID-19 on our results.
166NBB Economic Review ¡ September 2021 ¡ The issuance of debt securities by Belgian non-financial corporations
Thus, debt securities of firms “at imminent risk of distress” and “potentially at risk of distress” account for a limited share of Belgian NFCs’ total corporate debt. However, for financial stability purposes, it is worth monitoring the bearers of these risks. Panel 2 of chart 3 presents the holdings of corporate debt securities by Belgian and euro area banks, insurance companies and pension funds, according to ECB Securities Holdings Statistics (SHS) 1. According to this data, about 16 % of the amount of debt securities outstanding “at imminent risk” and 6 % of that “potentially at risk” is held in these traditional financial sectors. By construction, the remaining portion of risky debt can be largely attributed to investment funds, which are mostly located outside the euro area. Overall, the exposure of the Belgian and the euro area traditional financial sectors (credit institutions and insurance companies) to risky Belgian corporate debt securities is, therefore, quite small.
1 See NBB (2019) for additional details on the SHS database. Due to the limitations of the dataset used in the context of this study, we are not able to report on the Belgian debt securities held by the Eurosystem. It must also be mentioned that this data does not include holdings held in custody outside the euro-area or participating non-euro area countries (Bulgaria, Czech Republic, Denmark, and Romania).
Chart 3
Sustainability of Belgian bond issuers’ debt and exposure of their counterparts
Breakdown by level of debt sustainability 1
(% of total, data for the end of 2020)
Share in the outstanding amount of debt securities
Share in the number of issuers
J
Share of debt securities held by Belgian andeuro area banks, insurance corporationsand pension funds 2 (% of total by level of debt sustainability 1,data for the end of 2020)
80
70
60
50
40
30
20
10
ICR < 1 1 ≤ ICR < 2 2 ≤ ICR < 5 ICR ≥ 5 ICR < 1 1 ≤ ICR < 2 2 ≤ ICR < 5 ICR ≥ 5 Total0
30
25
20
15
10
5
0
Established in BelgiumEstablished in othereuro area countries
Established in BelgiumEstablished in othereuro area countries
Insurancecorporations and
pension funds
Banks
Source : ECB, NBB.1 The level of debt sustainability is proxied by the average of the interest coverage ratio (ICR) over the years 2018 and 2019. The interest coverage ratio is calculated as earnings before interest, taxes, depreciation and amortisation (EBITDA) divided by interest charges.
2 Holdings data comes from the ECB SHS database. The data covers securities holdings by financial and non-financial holders from all euro area countries, as well as non-euro area holders of securities issued by euro area issuers held in custody with euro area financial institutions. Due to limited data availability, the chart does not include holdings by the Eurosystem.

167NBB Economic Review ¡ September 2021 ¡ The issuance of debt securities by Belgian non-financial corporations
4. On the risks of higher leverages
The analysis presented in the previous section shows that some bond issuers are characterised by a heavier debt burden, in the sense that their debt servicing absorbs a large part, if not the entirety, of their revenue. A further examination of the firm-level data suggests that such a situation can arise for at least two different reasons.
The first and most trivial reason is low profitability. As illustrated by the left-hand panel of chart 4, about half of the businesses “at imminent risk of distress” incurred operating losses during their last accounting period (2019).
The other reason is the leveraging strategy pursued by other firms, such as those considered, according to our classification, “potentially at risk of distress”. These firms seem to borrow funds through the debt security market to inflate the earnings distributed to shareholders. Thanks to the leverage effect, the latter can actually benefit from higher income when revenue rises, whereas the income of debt security holders – like that of lenders in general – is limited to the payment of the interest agreed contractually. As evident from the middle panel of chart 4, the degree of financial leverage (DFL) is relatively high among firms with an ICR between 1 and 2, compared to those classified in other ICR buckets. For instance, in this group, the median DFL is equal to 2.9, which means that, if the median firms’ earnings before interest and taxes rise by 1 percentage point, the earnings per share that can be distributed to its shareholders increases by 2.9 percentage points. This is substantially more than the median DFL of better performing firms, which exhibit overall higher profitability
Chart 4
Profitability of debt securities issuers and leverage effects, by level of debt sustainability 1
(data for 2019)
EBITDA in % of total assets Degree of financial leverage 2 Dividend in % of equity
50
40
30
20
10
0ICR < 1 1 ≤ ICR < 2 2 ≤ ICR < 5 ICR ≥ 5
8
6
4
2
0ICR < 1 1 ≤ ICR < 2 2 ≤ ICR < 5 ICR ≥ 5
30
20
10
0
-10ICR < 1 1 ≤ ICR < 2 2 ≤ ICR < 5 ICR ≥ 5
Source : NBB.Note : The distributions of the three indicators considered in this chart are presented in the form of box plots. The lower and the upper limits of the boxes correspond to the first and the third quartiles of the distribution, respectively. The bar within the box stands for the second quartile, i.e. the median, of the distribution. The extremities of the “whiskers” represent the minimum and the maximum values of the distribution once outliers are disregarded.1 The level of debt sustainability is proxied by the average of the interest coverage ratio (ICR) over the years 2018 and 2019. The interest coverage ratio is calculated as earnings before interest, taxes, depreciation and amortisation (EBITDA) divided by interest charges.
2 The degree of financial leverage (DFL) is an elasticity that measures the sensitivity of the earning (before tax) per share with respect to
changes in earnings before interest and taxes (EBIT). In other words, it is the ratio of the percentage change in earnings per share to
the percentage change in the EBIT. Formally,
Source: NBB. Note: The distributions of the three indicators considered in this chart are presented in the form of box plots. The lower and the upper limits of the boxes correspond to the first and the third quartiles of the distribution, respectively. The bar within the box stands for the second quartile, i.e. the median, of the distribution. The extremities of the "whiskers" represent the minimum and the maximum values of the distribution once outliers are disregarded. 1 The level of debt sustainability is proxied by the average of the interest coverage ratio (ICR) over the years 2018 and 2019. The
interest coverage ratio is calculated as earnings before interest, taxes, depreciation and amortisation (EBITDA) divided by interest charges.
2 The degree of financial leverage (DFL) is an elasticity that measures the sensitivity of the earning (before tax) per share with respect to changes in earnings before interest and taxes (EBIT). In other words, it is the ratio of the percentage change in earnings per share to the percentage change in the EBIT. Formally, 𝐷𝐷𝐷𝐷𝐷𝐷𝐷𝐷𝐷𝐷𝐷𝐷 = 𝑑𝑑𝑑𝑑�(𝐸𝐸𝐸𝐸𝐸𝐸𝐸𝐸𝐸𝐸𝐸𝐸𝐸𝐸𝐸𝐸−𝐸𝐸𝐸𝐸)/#𝑠𝑠𝑠𝑠ℎ𝑎𝑎𝑎𝑎𝑎𝑎𝑎𝑎𝑎𝑎𝑎𝑎𝑠𝑠𝑠𝑠� �(𝐸𝐸𝐸𝐸𝐸𝐸𝐸𝐸𝐸𝐸𝐸𝐸𝐸𝐸𝐸𝐸−𝐸𝐸𝐸𝐸)/#𝑠𝑠𝑠𝑠ℎ𝑎𝑎𝑎𝑎𝑎𝑎𝑎𝑎𝑎𝑎𝑎𝑎𝑠𝑠𝑠𝑠��
𝑑𝑑𝑑𝑑𝐸𝐸𝐸𝐸𝐸𝐸𝐸𝐸𝐸𝐸𝐸𝐸𝐸𝐸𝐸𝐸 𝐸𝐸𝐸𝐸𝐸𝐸𝐸𝐸𝐸𝐸𝐸𝐸𝐸𝐸𝐸𝐸⁄, where "I" and “#shares” stands
respectively for the interest charges and the number of shares and d symbolises the derivative with respect to the EBIT. This expression can be simplified as 𝐷𝐷𝐷𝐷𝐷𝐷𝐷𝐷𝐷𝐷𝐷𝐷 = 𝐸𝐸𝐸𝐸𝐸𝐸𝐸𝐸𝐸𝐸𝐸𝐸𝐸𝐸𝐸𝐸 (𝐸𝐸𝐸𝐸𝐸𝐸𝐸𝐸𝐸𝐸𝐸𝐸𝐸𝐸𝐸𝐸 − 𝐸𝐸𝐸𝐸)⁄ .
, where “I” and “#shares” stands respectively for the
interest charges and the number of shares and d symbolises the derivative with respect to the EBIT. This expression can be simplified as
Source: NBB. Note: The distributions of the three indicators considered in this chart are presented in the form of box plots. The lower and the upper limits of the boxes correspond to the first and the third quartiles of the distribution, respectively. The bar within the box stands for the second quartile, i.e. the median, of the distribution. The extremities of the "whiskers" represent the minimum and the maximum values of the distribution once outliers are disregarded. 1 The level of debt sustainability is proxied by the average of the interest coverage ratio (ICR) over the years 2018 and 2019. The
interest coverage ratio is calculated as earnings before interest, taxes, depreciation and amortisation (EBITDA) divided by interest charges.
2 The degree of financial leverage (DFL) is an elasticity that measures the sensitivity of the earning (before tax) per share with respect to changes in earnings before interest and taxes (EBIT). In other words, it is the ratio of the percentage change in earnings per share to the percentage change in the EBIT. Formally, 𝐷𝐷𝐷𝐷𝐷𝐷𝐷𝐷𝐷𝐷𝐷𝐷 = 𝑑𝑑𝑑𝑑�(𝐸𝐸𝐸𝐸𝐸𝐸𝐸𝐸𝐸𝐸𝐸𝐸𝐸𝐸𝐸𝐸−𝐸𝐸𝐸𝐸)/#𝑠𝑠𝑠𝑠ℎ𝑎𝑎𝑎𝑎𝑎𝑎𝑎𝑎𝑎𝑎𝑎𝑎𝑠𝑠𝑠𝑠� �(𝐸𝐸𝐸𝐸𝐸𝐸𝐸𝐸𝐸𝐸𝐸𝐸𝐸𝐸𝐸𝐸−𝐸𝐸𝐸𝐸)/#𝑠𝑠𝑠𝑠ℎ𝑎𝑎𝑎𝑎𝑎𝑎𝑎𝑎𝑎𝑎𝑎𝑎𝑠𝑠𝑠𝑠��
𝑑𝑑𝑑𝑑𝐸𝐸𝐸𝐸𝐸𝐸𝐸𝐸𝐸𝐸𝐸𝐸𝐸𝐸𝐸𝐸 𝐸𝐸𝐸𝐸𝐸𝐸𝐸𝐸𝐸𝐸𝐸𝐸𝐸𝐸𝐸𝐸⁄, where "I" and “#shares” stands
respectively for the interest charges and the number of shares and d symbolises the derivative with respect to the EBIT. This expression can be simplified as 𝐷𝐷𝐷𝐷𝐷𝐷𝐷𝐷𝐷𝐷𝐷𝐷 = 𝐸𝐸𝐸𝐸𝐸𝐸𝐸𝐸𝐸𝐸𝐸𝐸𝐸𝐸𝐸𝐸 (𝐸𝐸𝐸𝐸𝐸𝐸𝐸𝐸𝐸𝐸𝐸𝐸𝐸𝐸𝐸𝐸 − 𝐸𝐸𝐸𝐸)⁄ .
.

168NBB Economic Review ¡ September 2021 ¡ The issuance of debt securities by Belgian non-financial corporations
ratios and higher ICRs. In that way, some of the firms that may be considered vulnerable based on their debt servicing costs, are able to distribute dividends comparable to those of more profitable companies.
While such a strategy is beneficial for shareholders in good times, it might also cause a debt servicing issue when turnover declines, for instance, during a business cycle downturn or in the event of an interest rate shock that is not accompanied by any expansion in earnings. The latter case concerns, more specifically, maturing debt that must be rolled over by new debt, on which higher interest rates must be paid. In such conditions, the financial health of firms that are already having difficulty in meeting their interest payments is likely to further deteriorate. Put differently, the potential risk of distress identified for levered firms with a low ICR ratio could materialise.
However, two factors might allow bond issuers to mitigate rollover risks arising from a sudden upsurge in interest rates, namely 1) the use of long-term financing instruments with fixed rates and 2) the availability of alternative financing sources. As mentioned in section 1, the bulk of debt securities outstanding have been issued with a maturity of more than five years. From the residual maturities reported in the left-hand panel of chart 5, it appears that only a limited fraction of the debt securities issued by those NFCs with high ICRs must be redeemed in the next 12 months. In addition, as the middle panel of the same chart illustrates, many of these firms have credit lines put at their disposal by banks that cover either a large share or the entirety of the debt securities maturing within the year. These credit lines might, for instance, be helpful to reduce refinancing costs in the
Chart 5
Residual maturity, rollover risk coverage and probabilities of default(data for 2019)
Breakdown of the outstandingamount of debt securitiesaccording to the residualmaturity (% of total by level of debt sustainability 1)
Ratios of the unused credit linesto the outstanding amount ofdebt securities maturingin the next 12 months(by level of debt sustainability 1)
Probabilities of default estimatedby Belgian banks for issuersof debt securities(by level of debt sustainability 1, in %)
100
90
80
70
60
50
40
30
20
10
0
6
5
4
3
2
1
0
6
5
4
3
2
1
0ICR < 1 1 ≤ ICR < 2 2 ≤ ICR < 5 ICR ≥ 5 ICR < 1 1 ≤ ICR < 2 2 ≤ ICR < 5 ICR ≥ 5 ICR < 1 1 ≤ ICR < 2 2 ≤ ICR < 5 ICR ≥ 5
Up to one year
From one to five years
More than five years
Source : NBB.Note : The distributions of the two indicators considered in the middle and the right panels are presented in the form of box plots. The lower and the upper limits of the boxes correspond to the first and the third quartiles of the distribution, respectively. The bar within the box stands for the second quartile, i.e. the median, of the distribution. The extremities of the “whiskers” represent the minimum and the maximum values of the distribution once outliers are disregarded.1 The level of debt sustainability is proxied by the average of the interest coverage ratio (ICR) over the years 2018 and 2019. The interest coverage ratio is calculated as earnings before interest, taxes, depreciation and amortisation (EBITDA) divided by interest charges.

169NBB Economic Review ¡ September 2021 ¡ The issuance of debt securities by Belgian non-financial corporations
event of a temporary interest rate hike, like the one observed on the bond market in March 2020, in the early days of the COVID-19 crisis 1. This fallback solution does not seem available, or at least not to the same extent, to firms exposed to a potential risk of distress and, even less so, to those running a more imminent risk due to their current debt burden. Moreover, these firms generally appear to be less reliable in the eyes of banks, which estimate these companies’ probabilities of default to be higher than those of borrowers with more comfortable ICRs. These firms tend to have a larger fraction of debt securities maturing in the short or medium term.
Conclusion
By identifying and profiling firms issuing corporate debt securities and by investigating possible risks linked to funding sources, this article documents recent trends in debt security financing by Belgian NFCs.
The outstanding volume of debt securities issued by Belgian NFCs has increased over the last decade. Belgian NFCs tend to issue debt securities with long maturities and fixed interest rates. A large fraction of the outstanding amount of these securities is eligible as collateral for the Eurosystem credit operations and in the context of the CSPP. These trends are largely consistent with those observed in the euro area.
Only a very small number of Belgian NFCs actually issue debt securities. However, due to their size, these firms account for a significant share of the Belgian economy. Bond issuers are generally large, have relatively sound financial health, and are often part of a corporate group structure. Moreover, many of them can count on a diversified source of funding.
Some bond issuers are riskier than others. Compared to similar-sized bank-dependent firms, certain issuers have weaker debt sustainability level (as measured by their ICR). This pocket of risk consists of just a few firms, whose debt accounts for only a small share of the total outstanding amount of debt securities issued by Belgian NFCs. The risk is borne by non-bank financial institutions, mainly located outside Belgium.
Firms can find themselves in a situation of weak debt sustainability for two reasons : either due to low profitability or due to leveraging strategies. These firms could face difficulties in the event of an increase in funding costs or a drop in corporate revenues. Most Belgian NFCs tend to issue debt securities with long maturities and fixed interest rates, and, in almost all cases, they have access to bank credit lines, which can be used to mitigate their rollover risk. However, for the small group of Belgian bond issuers that are burdened by higher debt and, consequently, face a more acute risk of distress, such mitigating factors are more limited.
1 Between 25 February 2020 and 25 March 2020, average interest rates on investment-grade corporate bonds rose by 150 basis points in the euro area, according to data compiled by Refinitiv.

170NBB Economic Review ¡ September 2021 ¡ The issuance of debt securities by Belgian non-financial corporations
Bibliography
Abraham F., J. J. Cortina and S. L. Schmukler (2020), Growth of Global Corporate Debt : Main Facts and Policy Challenges, The World Bank, Policy Research Working Paper Series, 9394.
Adrian T., P. Colla and H. S. Shin (2013), “Which Financial Frictions ? Parsing the Evidence from the Financial Crisis of 2007 to 2009”, NBER Macroeconomics Annual, 27, 159-214.
Altavilla C., M. Darracq Pariès and G. Nicoletti (2019), “Loan supply, credit markets and the euro area financial crisis”, Journal of Banking & Finance, 109, 105658.
BCBS (2019), The costs and benefits of bank capital – a review of the literature, Working Paper 37, June.
BCBS (2021), Assessing the impact of Basel III : Evidence from macroeconomic models : literature review and simulations, Working Paper 38, April.
Becker B. and V. Ivashina (2014), “Cyclicality of credit supply : Firm level evidence”, Journal of Monetary Economics, 62, 76-93.
Berlin M. and L. J. Mester (1992), “Debt covenants and renegotiation”, Journal of Financial Intermediation, 2, 95-133.
Betz F. and R. A. De Santis (2019), ECB corporate QE and the loan supply to bank-dependent firms, European Central Bank, Working Paper Series, 2314, September.
Bolton P. and X. Freixas (2000), “Equity, Bonds, and Bank Debt : Capital Structure and Financial Market Equilibrium under Asymmetric Information”, Journal of Political Economy, 108, 324-351.
Çelik S., G. Demirtaş and M. Isaksson (2020), Corporate Bond Market Trends, Emerging Risks and Monetary Policy, OECD Capital Market Series, Paris.
Çelik S., G. Demirtaş and M. Isaksson (2019), Corporate Bond Markets in a Time of Unconventional Monetary Policy, OECD Capital Market Series, Paris.
Conover W. J. (1999), Practical Nonparametric Statistics, 3rd ed., New York, Wiley.
Crouzet N. (2018), “Aggregate Implications of Corporate Debt Choices”, Review of Economic Studies, 85, 1635-1682.
de Almeida L. A. and T. Tressel (2020), Non-Financial Corporate Debt in Advanced Economies, 2010-17, IMF Working Papers 120.
De Fiore F. and H. Uhlig (2015), “Corporate Debt Structure and the Financial Crisis”, Journal of Money, Credit and Banking, 47, 1571-1598.
Denis D. J. and V. T. Mihov (2003), “The choice among bank debt, non-bank private debt, and public debt : evidence from new corporate borrowings”, Journal of Financial Economics, 70, 3-28.
De Santis R. A., A. Geis, A. Juskaite and L. Vaz Cruz (2018), The impact of the corporate sector purchase programme on corporate bond markets and the financing of euro area non-financial corporations, European Central Bank, Economic Bulletin, Issue 3, 66-84.

171NBB Economic Review ¡ September 2021 ¡ The issuance of debt securities by Belgian non-financial corporations
Diamond D. W. (1984), “Financial Intermediation and Delegated Monitoring”, The Review of Economic Studies, 51, 393-414.
Diamond D. W. (1991), “Monitoring and Reputation : The Choice between Bank Loans and Directly Placed Debt”, Journal of Political Economy, 99, 689-721.
ECB (2017), Financial Stability Review, November.
ECB (2019), Financial Stability Review, May.
European Commission (2017), Analysis of European Corporate Bond Markets, November.
Fama E. F. (1985), “What’s different about banks ?”, Journal of Monetary Economics, 15, 29-39.
Faulkender M. and M. A. Petersen (2006), “Does the Source of Capital Affect Capital Structure ?”, The Review of Financial Studies,19, 45-79.
Frank M. Z. and V. K. Goyal (2009), “Capital Structure Decisions : Which Factors Are Reliably Important ?”, Financial Management, 38, 1-37.
Holmstrom B. and J. Tirole (1997), “Financial Intermediation, Loanable Funds, and the Real Sector”, The Quarterly Journal of Economics, 112, 663-691.
Houston J. and C. James (1996), “Bank Information Monopolies and the Mix of Private and Public Debt Claims”, The Journal of Finance, 51, 1863-1889.
IMF (2019), Global Financial Stability Report : Lower for Longer, October.
Johnson S. A. (1997), “An Empirical Analysis of the Determinants of Corporate Debt Ownership Structure”, The Journal of Financial and Quantitative Analysis, 32, 47-69.
Kale J. R. and C. Meneghetti (2011), “The choice between public and private debt : A survey”, IIMB Management Review, 23, 5-14.
Kolmogorov A. N. (1933), “Sulla determinazione empirica di una legge di distribuzione”, Giornale dell’ Istituto Italiano degli Attuari, 4, 83-91.
Krishnaswami S., P. A. Spindt and V. Subramaniam (1999), “Information asymmetry, monitoring, and the placement structure of corporate debt”, Journal of Financial Economics, 51, 407-434.
McCoy J., F. Palomino, A. Perez-Orive, C. Press and G. Sanz-Maldonado (2020), Interest Coverage Ratios : Assessing Vulnerabilities in Nonfinancial Corporate Credit, FEDS Notes, Board of Governors of the Federal Reserve System, Washington, December 3.
Nakamura L. I. (1993), “Commercial bank information : information for the structure of banking” in White L. J, and M. Klausner (eds), Structural change in banking, Homewood, IL : Business One Irwin.
NBB (2019), Financial Stability Report.
Pegoraro S. and M. Montagna (2021), Issuance and valuation of corporate bonds with quantitative easing, European Central Bank, Working Paper Series, 2520, January.

172NBB Economic Review ¡ September 2021 ¡ The issuance of debt securities by Belgian non-financial corporations
Repullo R., and J. Suarez (2000), “Entrepreneurial moral hazard and bank monitoring : A model of the credit channel”, European Economic Review, 44, 1931-1950.
Smirnov N. V. (1933), “Estimate of deviation between empirical distribution functions in two independent samples”, Bulletin Moscow University, 2, 3-16.
Yosha O. (1995), “Information Disclosure Costs and the Choice of Financing Source”, Journal of Financial Intermediation, 4, 3-20.
Zaghini A. (2020), How ECB purchases of corporate bonds helped reduce firms’ borrowing costs, ECB, Research Bulletin, 66.