the invisible ones - hagasecontar.org
TRANSCRIPT

★
Accuracy Counts: How to Avoid Undercounting Young
Latino Children in the Next Census 1★
★
★
★
★★
★
The Invisible Ones:
How Latino Children Are Left Out of Our Nation’s Census CountA Report from Child Trends Hispanic Institute and the National Association of Latino Elected and Appointed Officials (NALEO) Educational Fund
William P. O’Hare, Ph.D.Yeris Mayol-Garcia, Ph.D. candidateElizabeth Wildsmith, Ph.D. Alicia Torres, Ph.D.
April 2016
★
★
AcknowledgmentsThe authors would like to acknowledge the assistance of Deborah Griffin and Eric Jensen from the U.S. Census Bureau, as well as Greg Robinson (U.S. Census Bureau, retired) for their very helpful comments on an earlier version of this report. The authors are also grateful to Arturo Vargas, Executive Director of NALEO Educational Fund, for his guidance and feedback.
The authors would additionally like to thank the Heising-Simons Foundation and The Annie E. Casey Foundation for funding this report and its distribution.
Publication # 2016-16. Copyright 2016 by Child Trends, Inc.
The Invisible Ones: How Latino Children Are Left Out of Our
Nation’s Census Count

★
1★
OverviewThe decennial census, conducted every 10 years by the U.S. Census Bureau, collects critical information on the U.S. population. An accurate count of that population helps ensure fair political representation and the equitable distribution of public services. Census data are used to distribute more than $400 billion in federal government assistance each year,1,2 including many programs which are critical to the healthy development of children. Four federal assistance programs—Head Start; the Special Supplemental Program for Women, Infants, and Children (WIC); the Child Care and Development Block Grant; and the Maternal and Child Health Services Block Grant—distribute $20 billion annually to states and localities based, at least in part, on census counts of the population under age 5.3 Census counts also form the basis for numerous other calculations within the public and private sectors alike.
Despite the best efforts of the U.S. Census Bureau, there are always some people who are missed in every census count. This number is known as an “undercount.”4,5 Places that are undercounted in the census receive neither their fair share of political representation nor an appropriate proportion of available government resources.6 This may compound existing disparities and compromise our country’s commitment to justice, fairness, and equal opportunity.
Over the next few years, critical decisions will be made on how the 2020 U.S. Census will be conducted. This report will inform that process by revealing certain issues associated with the undercount of young Hispanic children, while providing recommendations to improve the accuracy of the count in the next census.
Currently, more than 24 percent of U.S. children under age 5 are Hispanic, and this proportion is projected to grow to 32 percent by 2050.7 Nearly two-thirds (62 percent) of Hispanic children live in low-income households—that is, with incomes below two times the federal poverty line.8 As the country’s fastest-growing sector of the child population,9 Latino children’s healthy development is critical to the future social and economic well-being of the country. A more accurate count would
Over the next few years, critical decisions will be made on how the 2020 U.S. Census will be conducted.
The Invisible Ones: How Latino Children Are Left Out of Our
Nation’s Census Count

★
2★
make the allocation of resources to these children and families more equitable and in line with their actual numbers.
Definition of TermsFor ease of interpretation, we refer to the data presented in this report as undercounts, defined as the differences between census counts and population estimates. Technically, these differences include undercounts, overcounts, as well as errors in the estimates. See the “Methodology” section for more information on this point. The undercount rate is the undercount as a percent of the total population.
For ease of communication, in this report we sometimes use the term missed instead of net undercount, but technically the terms are different. The net undercount is a balance of those who are missed minus those who are double-counted or included in the census inappropriately (like foreign tourists). The number missed is almost always higher than the net undercount. This report does not include numbers of those who are missed, counted twice, or included erroneously, since there are no reliable published figures for young Latino children who fall in to those groups.
All of the data used here to calculate net undercount rates come from the U.S. Census Bureau, in the form of the 2010 Census and the Vintage 2010 Population Estimates. The population estimates were developed though the widely used cohort-component technique, which includes adding births, subtracting deaths, and including net migration. We simply subtracted the Census Bureau’s population estimates from the census counts to derive net undercount estimates.
In this report, we use the terms Hispanic and Latino interchangeably.
Key Findings • Young children have a higher net census undercount rate than any other age group, as we know from earlier
research. Latino children account for a disproportionate share (more than 36 percent) of the total net undercount for all children under age 5.
• There was a net undercount of nearly 400,000 young Latino children ages 0 to 4 in the 2010 Census.
• Much of this undercount is concentrated in a few states, and within those states, particular counties. Five states—California, Texas, Florida, Arizona, and New York—account for almost three-quarters (72 percent) of the net undercount. Almost one-third of the estimated total nationwide net undercount of young Latino children is accounted for by California alone. Within California, almost three-quarters of the undercounted young Latino children live in the five most populous counties: Los Angeles, San Diego, Orange, Riverside, and San Bernardino.
• While we lack definitive knowledge of the specific factors contributing to the high net undercount among young Latino children, existing research suggest some potential contributing factors. Exploring these and other possible explanations for the undercount should be a high priority for researchers in the near term:
o Latinos are more likely than non-Latinos to live in hard-to-count places: for example, areas with multi-unit buildings and a high proportion of renters.
o Latinos are more likely than non-Latinos to live in hard-to-count families and households, such as multigenerational and highly mobile families, and households with complex relationships.
o Additionally, there is some evidence that Latino adults are more likely than non-Latino adults to believe that young children do not need to be reported on the census form.
The Invisible Ones: How Latino Children Are Left Out of Our
Nation’s Census Count

★
3★
Key RecommendationsBelow are the key recommendations for addressing the issue of the undercount of young Latino children. These are more fully explored later in this report.
Immediately develop and pursue, with appropriate funding, the key research questions necessary to inform an action plan for reducing the undercount of young Latino children. Because many final decisions for the 2020 Census need to be made by 2018, research needs to get underway immediately to clarify reasons for the undercount, and identify how and where to target resources effectively and efficiently.
Fortunately, these research efforts can leverage and supplement current work already underway at the Census Bureau.10 Critical research questions, for example, may include the following:
• Who are the undercounted young Latino children, and where do they live? The Census Bureau is already looking into ways to address this question. This report helps identify where much of the undercount of young Latino children occurs. However, we need to better understand the characteristics of these children in order to effectively focus outreach efforts.
• Can instructions be added to the census questionnaire that will facilitate a better count of young Latino children? When additional instructions were added to the 2010 Census questionnaire, it appears they decreased the undercount of very young children. We encourage the U.S. Census Bureau to consider a new educational component in the 2020 Census outreach campaign aimed at ensuring that adults in Latino households include young children in their responses to the census questionnaire.
Develop and execute an action plan. Action steps needed to reduce the undercount may include the following:
• Alert stakeholders to the potential implications of a high undercount among young Latino children. All relevant stakeholders—Census Bureau staff, their contractors and partners, Latino families and communities, and policymakers—should understand the negative consequences associated with the undercounting of young Hispanic children.
• Engage in highly targeted outreach. Efforts to reduce the undercount—many of which are in development at the Census Bureau—should be focused in those areas with the largest number of undercounted children. Programs that serve children ages 0 to 4 could be used to reach parents of young Latino children. As an example, the Bureau’s successful outreach program, Census in Schools, could be expanded to preschools.
• Develop and leverage strategic partnerships. This should include targeted efforts to develop relationships with vested stakeholders, such as civic organizations and early childhood education organizations, that will be able to reach households with young children. This work needs to start soon.
The Invisible Ones: How Latino Children Are Left Out of Our
Nation’s Census Count
★
4★The Invisible Ones:
How Latino Children Are Left Out of Our Nation’s Census Count
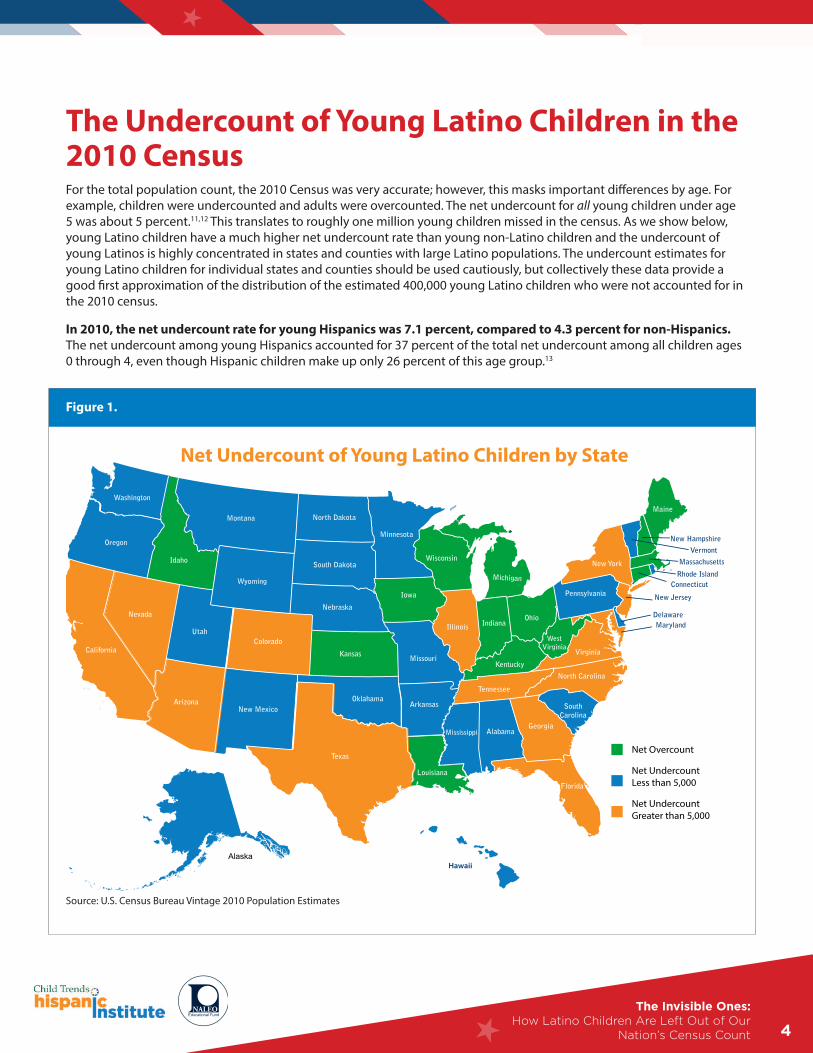
The Undercount of Young Latino Children in the 2010 CensusFor the total population count, the 2010 Census was very accurate; however, this masks important differences by age. For example, children were undercounted and adults were overcounted. The net undercount for all young children under age 5 was about 5 percent.11,12 This translates to roughly one million young children missed in the census. As we show below, young Latino children have a much higher net undercount rate than young non-Latino children and the undercount of young Latinos is highly concentrated in states and counties with large Latino populations. The undercount estimates for young Latino children for individual states and counties should be used cautiously, but collectively these data provide a good first approximation of the distribution of the estimated 400,000 young Latino children who were not accounted for in the 2010 census.
In 2010, the net undercount rate for young Hispanics was 7.1 percent, compared to 4.3 percent for non-Hispanics. The net undercount among young Hispanics accounted for 37 percent of the total net undercount among all children ages 0 through 4, even though Hispanic children make up only 26 percent of this age group.13
Figure 1.
W
Hawaii
Net Undercount of Young Latino Children by State
Alaska
Net Overcount
Net Undercount Less than 5,000
Net Undercount Greater than 5,000
Source: U.S. Census Bureau Vintage 2010 Population Estimates

★
5★
The number of young Hispanic children undercounted was higher in some states than in others. Five states—California, Texas, Florida, Arizona, and New York—accounted for 72 percent of the national net undercount of young Hispanics. The 10 states with the highest net undercount totals, detailed in Table 1, accounted for 88 percent of the entire net undercount of young Latino children. Figure 1, the map above, shows the relative over- or undercount for all 50 states. A full list of all states, with net undercount totals for each, can be found in Appendix A.
The net undercount of young Hispanic children varied across states, ranging from a net undercount of about 113,000 in California, to a net overcount of about 4,000 children in Wisconsin. In 2010, almost 30 percent of this net undercount of young Hispanic children was in California, and about 20 percent was in Texas (see Table 1). It is not surprising to see that these states account for a large share of the net undercount of young Hispanic children, because a large share of young Hispanic children live in these states. Nonetheless, these figures tell us where to focus our efforts to reduce the high net undercount of young Hispanics.
Table 1. Nearly 90 percent of the net undercount of young Latino children occurs in 10 states
State
Numeric Net Undercount (rounded to
nearest 1000)
Percent of Total Nationwide Net Undercount of Young Latino
Children
1 California -113,000 29
2 Texas -75,000 19
3 Florida -44,000 11
4 Arizona -32,000 8
5 New York -21,000 5
6 Georgia -21,000 5
7 Illinois -12,000 3
8 North Carolina -9,000 2
9 New Jersey -9,000 2
10 Colorado -8,000 2
Total for Ten States -344,000 88
United States -391,000Sources: U.S. Census Bureau, Vintage 2010 County Population Estimates (CC-EST2010-ALLDATA.csv)
U.S. Census Bureau, Table P12 (Total Population) Sex by Age, 2010 Census Summary File 1 (DEC_10_SF1_P12_with_ann.csv).
U.S. Census Bureau, Table P12H (Hispanic or Latino) Sex by Age, 2010 Census Summary File 1 (DEC_10_SF1_P12H_with_ann.csv).
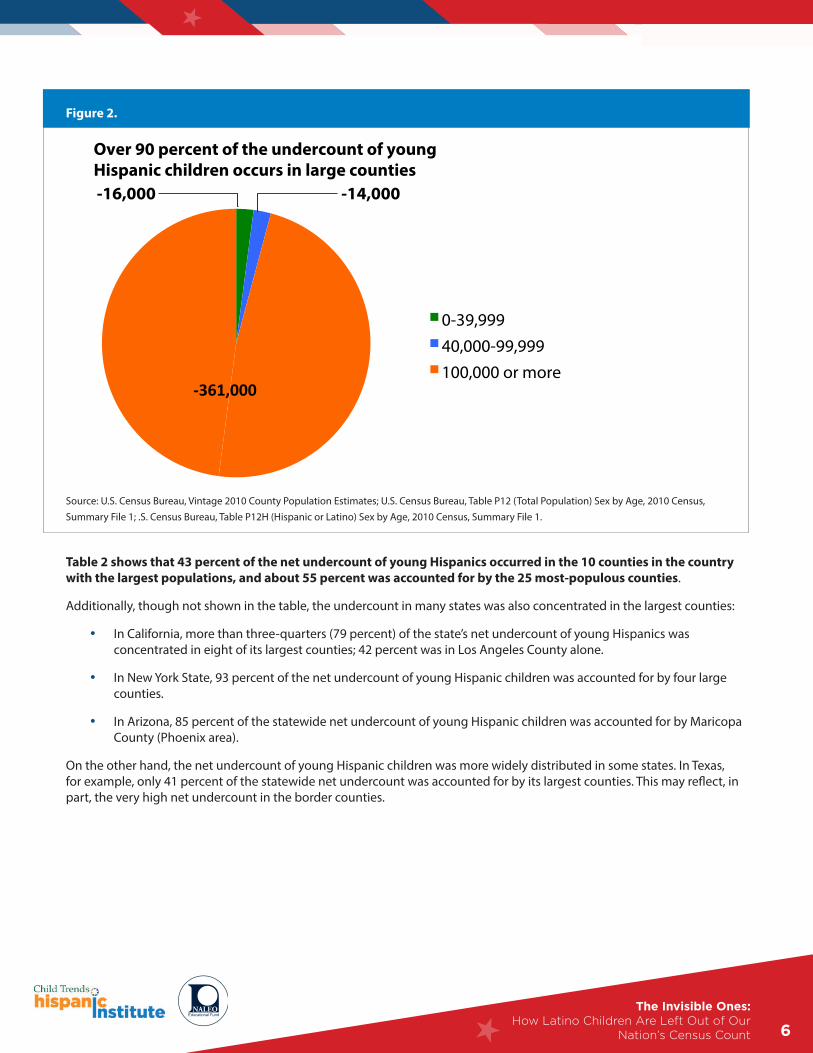
The undercount of young Hispanic children was heavily concentrated in large counties. Analyses find that 92 percent of the nationwide net undercount of Hispanics ages 0 to 4 was accounted for by those living in counties of 100,000 or more residents (see Figure 2). This is partly because Latinos, ase seen in the Vintage 2010 County Population Estimates, disproportionately live in populous counties. But the undercount rate is also slightly higher in these counties overall. Though not shown in Figure 2, the net undercount rate for young Hispanics in counties of 100,000 or more people is 7.3 percent.
The Invisible Ones: How Latino Children Are Left Out of Our
Nation’s Census Count
★
6★The Invisible Ones:
How Latino Children Are Left Out of Our Nation’s Census Count
Figure 2.
Over 90 percent of the undercount of young Hispanic children occurs in large counties
0-39,999 40,000-99,999 100,000 or more
-361,000
-14,000
-16,000
Source: U.S. Census Bureau, Vintage 2010 County Population Estimates; U.S. Census Bureau, Table P12 (Total Population) Sex by Age, 2010 Census, Summary File 1; .S. Census Bureau, Table P12H (Hispanic or Latino) Sex by Age, 2010 Census, Summary File 1.
Table 2 shows that 43 percent of the net undercount of young Hispanics occurred in the 10 counties in the country with the largest populations, and about 55 percent was accounted for by the 25 most-populous counties.
Additionally, though not shown in the table, the undercount in many states was also concentrated in the largest counties:
• In California, more than three-quarters (79 percent) of the state’s net undercount of young Hispanics was concentrated in eight of its largest counties; 42 percent was in Los Angeles County alone.
• In New York State, 93 percent of the net undercount of young Hispanic children was accounted for by four large counties.
• In Arizona, 85 percent of the statewide net undercount of young Hispanic children was accounted for by Maricopa County (Phoenix area).
On the other hand, the net undercount of young Hispanic children was more widely distributed in some states. In Texas, for example, only 41 percent of the statewide net undercount was accounted for by its largest counties. This may reflect, in part, the very high net undercount in the border counties.

★
7★
Table 2: Net and percent undercounts in the Top 10 and Top 25 most populous U.S. counties
Rank (by county population size) State County Numeric
UndercountPercent of Total
Undercount
1 California Los Angeles -47,000 12
2 Illinois Cook -11,000 3
3 Texas Harris -9,000 2
4 Arizona Maricopa -27,000 7
5 California San Diego -12,000 3
6 California Orange -15,000 4
7 New York Kings -6,000 2
8 Florida Miami-Dade -18,000 5
9 Texas Dallas -17,000 4
10 New York Queens -5,000 1
Top 10 Counties -167,000 43
11 California Riverside -6,000 2
12 California San Bernardino -3,000 1
13 Nevada Clark -6,000 1
14 Washington King -1,000 0
15 Michigan Wayne 0 0
16 Texas Tarrant -4,000 1
17 California Santa Clara -3,000 1
18 Florida Broward -6,000 2
19 Texas Bexar -1,000 0
20 New York New York -6,000 2
21 Pennsylvania Philadelphia -3,000 1
22 California Alameda -3,000 1
23 Massachusetts Middlesex 0 0
24 New York Suffolk -3,000 1
25 California Sacramento -1,000 0
Top 25 Counties -214,000 55
Total United States -391,000 100Source: U.S. Census Bureau, Vintage 2010 County Population EstimatesU.S. Census Bureau, Table P12 (Total Population) Sex by Age, 2010 Census Summary File 1U.S. Census Bureau, Table P12H (Hispanic or Latino) Sex by Age, 2010 Census Summary File 1
The Invisible Ones: How Latino Children Are Left Out of Our
Nation’s Census Count

★
8★
Drivers of the Undercount of Young Latino Children in the 2010 CensusIn the 2010 census, young children had a higher net undercount rate than other age groups, and young Latino children had an even higher net undercount than non-Latino young children. But it is not entirely clear why young children in general, and young Latino children in particular, have such high net undercounts in the Census. Possible explanations must address not only why young Latino children were missed, but why they were missed at a much higher rate than other age groups, including older Latino children.
Numerous reports have addressed the census undercount.14,15 However, only a few have focused explicitly on the undercount among young children,16,17 and, to date, none have focused on explanations for the high net undercount of young Latino children. It is not clear, for example, how many young Latino children are missed because the housing unit where they live was not included in the Census Bureau address file, and how many were missed because they were left off a census questionnaire that their household returned. A better understanding of the reasons for the undercount will help guide efforts to reduce the high net undercount of young Latino children. We offer several hypotheses in order to stimulate discussion on strategies to improve the accuracy of the count of young Latino children.
Young Latino children are concentrated in neighborhoods where it is difficult to count people.
Young Hispanic children (ages 0 through 4) make up 1.6 percent of the total U.S. population, but 3.2 percent of the national population in hard-to-count areas.18 Hard-to-count areas are those with unusual and/or complex housing, with many multi-unit buildings and a high proportion of renters, among other characteristics. These kinds of housing units are more likely to be missed by the Census Bureau.19
Young Hispanics are also overrepresented in high-poverty neighborhoods (those in which over 40 percent of households are poor), whose residents are particularly difficult to enumerate accurately.20
Young Latinos disproportionately live in households with characteristics that make them difficult to count. For example, young Hispanics are more likely than the general population age 0 to 4 to live in complex households—that is, with three or more generations, with one or more subfamilies, or with more than one family.21 Additionally, these households are more likely to be poor, to rent, to include adults who may have difficulty with the English language, and to have moved in the past year.22 In some cases, people living in these circumstances are not clearly attached to a specific household, and therefore may be left off returned census questionnaires.23 Sometimes whole households are also missed.
Some Hispanic respondents may not realize that children are meant to be included in the census. Research conducted by the Census Bureau shows that a portion of the population thinks the Bureau wants information on adults, but not children.24 Hispanics were slightly more likely than others to hold this belief.
Some Hispanic respondents may be reluctant to respond to the census. There may be reluctance to interact with or share information with the government because one or more members of a household are undocumented, but there are currently no good data on this issue.25 In addition, some recent immigrants may not be accustomed to census-taking in the United States.
In the 2010 census, young children had a higher net undercount rate than other age groups, and young Latino children had an even higher net undercount than non-Latino young children.
The Invisible Ones: How Latino Children Are Left Out of Our
Nation’s Census Count
★
9★
Strategies to Reduce the Undercount of Young Hispanic Children in 2020The next steps are to develop and execute a multi-pronged initiative to reduce the undercount of young Hispanic children, and ensure that stakeholders have the needed resources to implement an action plan.
The Census Bureau is already conducting several research projects related to the undercount of young children in the decennial census.26 While not specifically focused on young Latinos, the results will likely shed light on the undercount of this group, and help guide efforts to reduce the undercount in 2020. Here we offer recommendations for some additional steps that might help us achieve a more complete count in the 2020 census. Some of these recommendations capitalize on the Bureau’s existing efforts. Additionally, some, if not all, can be targeted to the states and counties which had the highest undercounts of young Latino children in 2010.
Identify and pursue, with appropriate funding, the research questions that will improve our understanding of why Latino children are undercounted and how to reduce the undercount. Essential to efforts to reduce the high undercount among young Latino children is a better understanding of what drives it. Critical questions to answer include:
• Who are the young Latino children not counted in the census, and where do they live? This report, in documenting the high net undercount among young Latino children, helps identify where much of the net undercount of young Latino children occurs. We also need to more fully understand the demographic and economic characteristics of these children, to effectively identify and focus outreach efforts. Administrative records are one source that can be used to provide information about young Latino children who are most likely to be missed in 2020. For example, Internal Revenue Service data could be matched to the 2010 census records to determine the income levels of children not reported in the 2010 Census. Other administration data from welfare programs could be matched to the 2010 Census to get an idea of how economically vulnerable children compare to others in terms of being counted in the census.
• Do Latino adults think the Census Bureau does not want young children included in the census? The Census Bureau’s planning efforts for 2020 include public polling, and the questions could be designed to elicit data on the public’s perception about who they think is supposed to be included in the census.27 We recommend that a question be added to assess whether the perception that young children are not to be included in the census is more widespread among Hispanics.
• Could the American Community Survey be used to identify effective messaging to make sure young children are included in the census? There is some evidence that this approach has been effective in the past. For example, reporting on very young children in the census went up after additional clarifying language about including newborns was added to the 2010 Census questionnaire.28
Begin outreach early. Time is limited. Many of the final decisions for the 2020 Census will need to be made by 2018.29 The work outlined above needs to begin immediately, particularly efforts to develop networks that will reach households with young children in 2020.
Ensure stakeholders are aware of the high undercount among young Hispanic children. It is important that all relevant stakeholders—Census Bureau staff and partners, Latino families and communities, and policymakers at all levels of government—understand the magnitude of the undercount among young Hispanic children. Those responsible for guiding communications and partnership at the Census Bureau will be central to this effort:
• The Bureau’s Integrated Communications Plan30 should include a section that specifically addresses the undercount of young Latino children and outlines the structural efforts that will be implemented to correct it.
Essential to efforts to reduce the high undercount among young Latino children is a better understanding of what drives it.
The Invisible Ones: How Latino Children Are Left Out of Our
Nation’s Census Count
★
10★
• In 2016, the Bureau will award its contract for the communications and partnership component of the 2020 Census.31 This provides an opportunity to ensure that the awardee is prepared and well-suited to prioritize this topic.
• In addition, the Census Bureau maintains a regular blog, which could be used to highlight the high net undercount of young Hispanic children to stakeholders.
Use highly targeted outreach. Since the undercount of young Latino children was concentrated in large counties, efforts could be focused on these areas. The Census Bureau should use the ongoing American Community Survey to update the locations of concentrations of Latino families.
Leverage existing partnerships and invest in new partnerships. Effective partnerships will be critical to the success of outreach efforts. Some possibilities include the following:
• Leverage government programs that already serve children—e.g., Supplemental Nutritional Assistance Program, Temporary Assistance to Needy Families, Women Infant and Children Nutrition program, and Medicaid—to help facilitate communication on the importance of including young children in the census.
• Similarly, the Census Bureau can leverage existing partnerships with local organizations. In the 2010 Census, there were more than 250,000 partnership organizations that worked with the Census Bureau to promote the census. Many other national Latino organizations were helpful in the 2010 Census, including the National Association of Latino Elected and Appointed Officials (NALEO) Educational Fund and the Leadership Conference on Civil and Human Rights, which has long taken a serious interest in the census and currently has a task force devoted to this topic. These groups have access and credibility within Latino communities, and the Census Bureau can rely on them to carry the message about the importance of the census.
• There are many other possible partnerships to explore. For example, the Bureau could undertake an aggressive outreach effort to health providers in order to reach the many children and families that now have insurance coverage under the Affordable Care Act and state exchanges. The American Hospital Association could give out information about the importance of the census to every woman who has a birth in the year before the census. The American Academy of Pediatrics and the American College of Obstetricians and Gynecologists could ask their members to put Census Bureau promotional information in their offices. The American Association of Social Workers could also remind their members to talk to clients about the importance of the census.
• Expand the Census Bureau’s “Statistics in Schools” (formerly known as Census in Schools) program to include preschools, especially in areas with large numbers of young Hispanic children. In the 2000 and 2010 Censuses, the Bureau conducted a Census in Schools project that was widely viewed as successful; however, it did not reach out to families of preschoolers.
These are just a few possibilities intended to stimulate public discourse about the undercount of young Latino children, and the formation of concrete steps to help reduce it.
Since the undercount of young Latino children was concentrated in large counties, efforts could be focused on these areas.
The Invisible Ones: How Latino Children Are Left Out of Our
Nation’s Census Count

★
11★
Summary and Implications Hispanics are the fastest-growing ethnic group among U.S. children. Ensuring that Latino children have access to the public programs and resources—and thus the same opportunities to flourish and become productive members of society—is critical to the success of our country as a whole. The allocation of many of these resources relies on data from the census. There was a higher net undercount of young Latino children in 2010 (7.1 percent) than among young children in general.
There is no clear consensus on the reasons for the high undercount of young Hispanic children, but we have identified several potential causes that we hope will spur more discussion on this topic and help us devise ways to remedy the problem.
The window of opportunity to identify why young Hispanic children are missed and implement ways to reduce future undercount is closing quickly. While 2020 may seem distant, critical decisions will be made in the next two years.
Appendix: MethodologyFor this report, we calculated the net undercounts of young Hispanic children by comparing the U.S. Census Bureau’s Vintage 2010 Population Estimates for the population aged 0 to 4 to the 2010 U.S. Decennial Census Counts for this age group. The decennial census is based on counts of people at their usual place of residence for the April 1, 2010 date. The Vintage 2010 Population Estimates provide annual estimates between July 1, 2000 and July 1, 2010, “based on the updated Census 2000 data and the components of change (births, deaths, international migration, and domestic migration) occurring each year.” In order to compare estimates to the census counts, an additional set of estimates was developed for the April 1, 2010 Census date, which we use for this report. To estimate the April 1, 2010 population, the demographers at the Census Bureau began with the July 1, 2009 population estimates and “estimated the components of change that occurred in the intervening nine months.” For the population under age 10, the Vintage 2010 Population Estimates are based only on births, deaths, and net migration between 2000 and 2010, without reliance on Census 2000 information. The difference in methodologies provides the opportunity to assess the decennial census results. This evaluation method is well-established and has been used by several analysts in the past, including demographers at the Census Bureau.32,33,34,35,36,37
While the estimates shown here are not without limitations, they are the best available for assessing undercounts by Hispanic origin, age, and geographic-level details.
There are potential limitations in the methodology used here. Readers should also be aware that the Vintage 2010 Population Estimates used provisional data for the births and deaths in 2009 and the projected births and deaths in first quarter of 2010 rather than the actual counts of births and deaths, which were not available at the time the 2010 Estimates were made. While this is a limitation, it is unlikely to have a major impact on the data shown here. When projected births and deaths were replaced with actual births and deaths for the Demographic Analysis estimates released in May 2012, the overall net undercount of young children changed from 4.7 percent to 4.6 percent.
Conceptually, the definition of Hispanic is the same in the census and the population estimates, but the identification of Hispanics is slightly different in the data from birth certificates than in the identification used in the 2010 Census.38 This point is unlikely to introduce serious errors into the calculation of the net undercount of young Hispanic children. Moreover, it is not clear whether the potential limitations identified above would result in a higher or lower net undercount for young Hispanic children.
We used county-level census counts and population estimates. County statistics are aggregated to determine the state data, which are then aggregated to determine the national data. This approach ensures that national, state, and county data are internally consistent within this report. Reliance on these county-level population estimates results in national figures that are slightly different than the results of the Census Bureau’s Demographic Analysis.
The Invisible Ones: How Latino Children Are Left Out of Our
Nation’s Census Count
★
12★
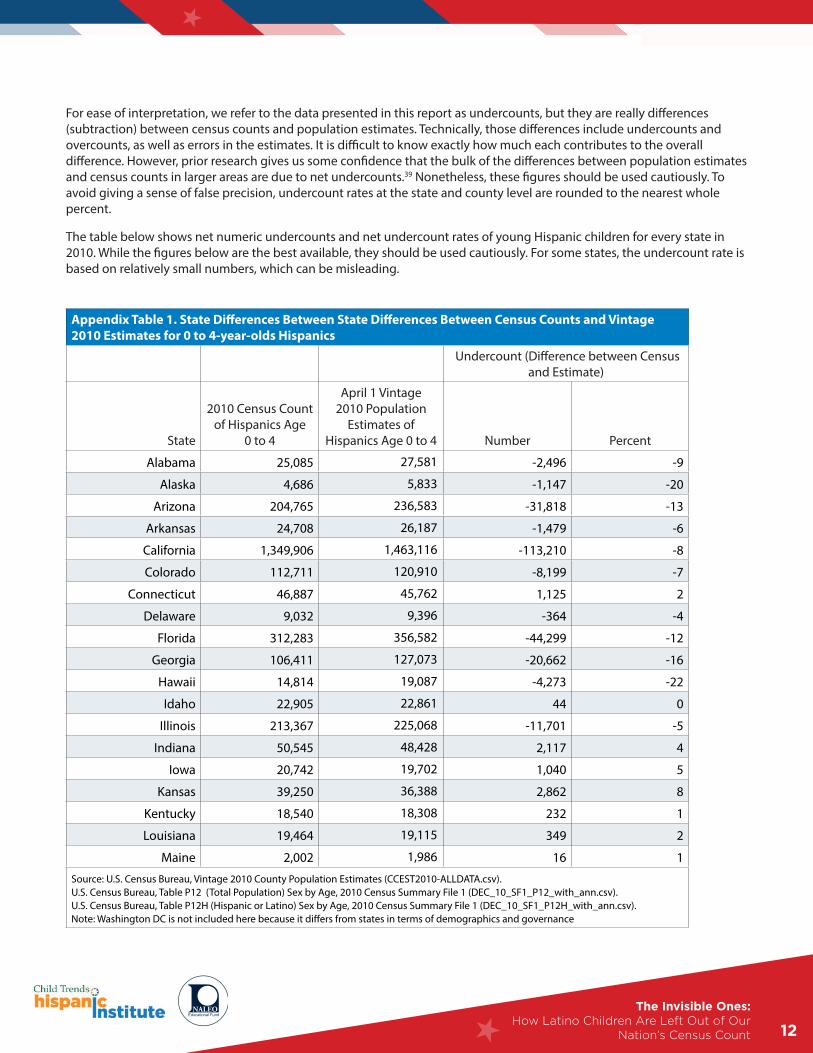
For ease of interpretation, we refer to the data presented in this report as undercounts, but they are really differences (subtraction) between census counts and population estimates. Technically, those differences include undercounts and overcounts, as well as errors in the estimates. It is difficult to know exactly how much each contributes to the overall difference. However, prior research gives us some confidence that the bulk of the differences between population estimates and census counts in larger areas are due to net undercounts.39 Nonetheless, these figures should be used cautiously. To avoid giving a sense of false precision, undercount rates at the state and county level are rounded to the nearest whole percent.
The table below shows net numeric undercounts and net undercount rates of young Hispanic children for every state in 2010. While the figures below are the best available, they should be used cautiously. For some states, the undercount rate is based on relatively small numbers, which can be misleading.
Appendix Table 1. State Differences Between State Differences Between Census Counts and Vintage 2010 Estimates for 0 to 4-year-olds Hispanics
Undercount (Difference between Census
and Estimate)
State
2010 Census Count of Hispanics Age
0 to 4
April 1 Vintage 2010 Population
Estimates of Hispanics Age 0 to 4 Number Percent
Alabama 25,085 27,581 -2,496 -9
Alaska 4,686 5,833 -1,147 -20
Arizona 204,765 236,583 -31,818 -13
Arkansas 24,708 26,187 -1,479 -6
California 1,349,906 1,463,116 -113,210 -8
Colorado 112,711 120,910 -8,199 -7
Connecticut 46,887 45,762 1,125 2
Delaware 9,032 9,396 -364 -4
Florida 312,283 356,582 -44,299 -12
Georgia 106,411 127,073 -20,662 -16
Hawaii 14,814 19,087 -4,273 -22
Idaho 22,905 22,861 44 0
Illinois 213,367 225,068 -11,701 -5
Indiana 50,545 48,428 2,117 4
Iowa 20,742 19,702 1,040 5
Kansas 39,250 36,388 2,862 8
Kentucky 18,540 18,308 232 1
Louisiana 19,464 19,115 349 2
Maine 2,002 1,986 16 1
Source: U.S. Census Bureau, Vintage 2010 County Population Estimates (CCEST2010-ALLDATA.csv). U.S. Census Bureau, Table P12 (Total Population) Sex by Age, 2010 Census Summary File 1 (DEC_10_SF1_P12_with_ann.csv). U.S. Census Bureau, Table P12H (Hispanic or Latino) Sex by Age, 2010 Census Summary File 1 (DEC_10_SF1_P12H_with_ann.csv).Note: Washington DC is not included here because it differs from states in terms of demographics and governance
The Invisible Ones: How Latino Children Are Left Out of Our
Nation’s Census Count

★
13★
Appendix Table 1 Cont. State Differences Between Census Counts and Vintage 2010 Estimates for 0 to 4-year-olds Hispanics
Undercount (Difference between Census
and Estimate)
State
2010 Census Count of Hispanics Age 0
to 4
April 1 Vintage 2010 Population
Estimates of Hispanics Age 0 to 4 Number Percent
Maryland 50,417 55,558 -5,141 -9
Massachusetts 63,050 61,266 1,784 3
Michigan 52,606 49,209 3,397 7
Minnesota 33,692 35,384 -1,692 -5
Mississippi 9,850 10,231 -381 -4
Missouri 26,805 27,930 -1,125 -4
Montana 3,428 3,524 -96 -3
Nebraska 22,728 23,616 -888 -4
Nevada 77,789 84,314 -6,525 -8
New Hampshire 4,214 3,947 267 7
New Jersey 138,591 147,111 -8,520 -6
New Mexico 86,344 88,293 -1,949 -2
New York 284,211 305,646 -21,435 -7
North Carolina 106,949 116,383 -9,434 -8
North Dakota 1,985 2,409 -424 -18
Ohio 44,416 43,751 665 2
Oklahoma 44,310 44,949 -639 -1
Oregon 55,374 57,392 -2,018 -4
Pennsylvania 79,857 83,881 -4,024 -5
Rhode Island 13,355 14,114 -759 -5
South Carolina 29,895 34,786 -4,891 -14
South Dakota 3,232 3,929 -697 -18
Tennessee 39,347 46,191 -6,844 -15
Texas 976,671 1,051,456 -74,785 -7
Utah 45,500 49,416 -3,916 -8
Vermont 799 809 -10 -1
Virginia 68,436 76,160 -7,724 -10
Washington 95,403 99,285 -3,882 -4
West Virginia 2,505 2,350 155 7
Wisconsin 44,211 40,025 4,186 10
Wyoming 5,930 6,030 -100 -2
Source: U.S. Census Bureau, Vintage 2010 County Population Estimates (CCEST2010-ALLDATA.csv). U.S. Census Bureau, Table P12 (Total Population) Sex by Age, 2010 Census Summary File 1 (DEC_10_SF1_P12_with_ann.csv). U.S. Census Bureau, Table P12H (Hispanic or Latino) Sex by Age, 2010 Census Summary File 1 (DEC_10_SF1_P12H_with_ann.csv).Note: Washington DC is not included here because it differs from states in terms of demographics and governance
The Invisible Ones: How Latino Children Are Left Out of Our
Nation’s Census Count
★
14★
References 1 Blumerman, L. M., & Vidal, P. M. (2009). Uses of population and income statistics in federal funds distribution–with a focus on census bureau data. Washington, D.C.: U.S. Census Bureau.
2 Reamer, A. D. (2010). Surveying for Dollars: The role of the American Community Survey in the geographic distribution of federal funds. Washington, D.C.: Brookings Institution.
3 O’Hare, W. P. (2015). The undercount of young children in the US Decennial Census. Springer International Publishing. New York, NY.
4 Darga, K. (1999). Sampling and the census: A case against the proposed adjustments for undercount. Washington, D.C.: American Enterprise Institute.
5 U.S. Census Bureau. (2004). Chapter 7: Dual system estimation. Accuracy and coverage evaluation of census 2000: Design and methodology. Washington, D.C.: U.S. Census Bureau.
6 Anderson, M. & Fienberg, S.E. (2001). Who counts? The politics of census taking in contemporary America, New York: Russell Sage Foundation.
7 Federal Interagency Forum on Child and Family Statistics. (2015). America’s children: key national indicators of well-being: 2015. Washington, D.C.: U.S. Government Printing Office.
8 O’Hare, W.P. (2014). State-level 2010 census coverage rates for young children. Population Research and Policy Review, 33(6), 797-816.
9 Federal Interagency Forum on Child and Family Statistics. (2015). America’s children: key national indicators of well-being: 2015. Washington, D.C.: U.S. Government Printing Office.
10 U.S. Census Bureau. (2015). 2020 census operational plan. Washington, D.C.: U.S. Census Bureau.
11 Griffin, D. H. (2014). The final task force report: Task force on the undercount of young children, memorandum for Frank A. Vitrano. Washington, D.C.: U.S. Census Bureau.
12 O’Hare, W. P. (2015). The undercount of young children in the US Decennial Census. Springer International Publishing. New York, NY.
13 O’Hare 2015
14 Anderson & Fienberg 2001
15 West, K., & Fein, D.J. (1990). U.S. decennial census undercount: An historical and contemporary sociological issues, Sociological Inquiry, 60(2), 127-141.
16 Griffin 2014
17 O’Hare 2015
18 O’Hare, W.P. (2016). Who lives in hard-to-count neighborhoods? International Journal of Social Science Studies, 4(4). pp 43-55
19 Bruce, A., Robinson. J.G., & Sanders, M.V. (2001). Hard-to-count scores and broad demographic groups associated with patterns of response rates in Census 2000. Proceedings of the Social Statistics Section: American Statistical Association.
20 Bruner, C. (2016). When place matters most: Young children and their future. Ames, IA: Child and Family Policy Center.
21 O’Hare 2015
The Invisible Ones: How Latino Children Are Left Out of Our
Nation’s Census Count
★
15★
22 O’Hare 2015
23 Martin, E. (2007). Strength of attachment: Survey coverage of people with tenuous ties to residences. Demography, 44(2),437-440.
24 Nichols, E., & Katz, J. (2016). What respondents think the census collects: Do we collect names of children? U.S. Census Bureau internal presentation. Washington, D.C.: U.S. Census Bureau.
25 West, K. & Robinson, J.G. (1999). What do we know about the undercount or children? Population Division Working Paper. Washington, D.C.: U.S. Census Bureau.
26 Konicki, S. (2015). The undercount of young children in the 2010 census. Paper presented at the U.S. Census Bureau National Advisory Committee Meetings, Washington, D.C.
27 U.S. Census Bureau. (2015). 2020 census operational plan. Washington, D.C.: U.S. Census Bureau.
28 O’Hare 2015
29 U.S. Census Bureau 2015
30 U.S. Census Bureau 2015
31 U.S. Census Bureau 2015
32 Adlakha, A. L., Robinson, J. G., West, K. K., & Bruce, A. (2003). Assessment of consistency of census data with demographic benchmarks at the subnational level. Paper presented at the Annual Meeting of the Population Association of America, Minneapolis, MN.
33 Cohn, D. (2011). How good is the 2010 census count? An update. Washington, D.C.: Pew Research Center.
34 Mayol-Garcia, Y., & Robinson, J. G. (2011). Census 2010 counts compared to the 2010 population estimates by demographic characteristics. Paper presented at the Southern Demographic Association Conference, Tallahassee, FL.
35 Robinson, J. G., Ahmed, B., Gupta, P. D., & Woodrow, K. A. (1993). Estimation of population coverage in the 1990 United States Census based on demographic analysis. Journal of the American Statistical Association, 88(423), 1061-1071.
36 Siegel, J. S., Passel, J. S., Rives, J., N., & Robinson, J. G. (1977). Developmental estimates of the coverage of the population of states in the 1970 census: Demographic analysis. Current Population Reports. Series special studies, 23(65).
37 O’Hare, W.P. (2014). State-level 2010 census coverage rates for young children. Population Research and Policy Review, 33(6), 797-816.
38 O’Hare 2015
39 Yowell, T., & Devine, J. (2013). Evaluating current and alternative methods to produce 2010 country population estimates. Washington, D.C.: U.S. Census Bureau.
The Invisible Ones: How Latino Children Are Left Out of Our
Nation’s Census Count