the influence of inter-annually varying albedo on regional...
TRANSCRIPT
The influence of inter-annually varying albedo on regionalclimate and drought
X. H. Meng • J. P. Evans • M. F. McCabe
Received: 15 September 2012 / Accepted: 24 April 2013 / Published online: 5 May 2013
� Springer-Verlag Berlin Heidelberg 2013
Abstract Albedo plays an important role in land–atmo-
sphere interactions and local climate. This study presents the
impact on simulating regional climate, and the evolution of a
drought, when using the default climatological albedo as is
usually done in regional climate modelling, or using the
actual observed albedo which is rarely done. Here, time-
varying satellite derived albedo data is used to update the
lower boundary condition of the Weather Research and
Forecasting regional climate model in order to investigate the
influence of observed albedo on regional climate simulations
and also potential changes to land–atmosphere feedback over
south-east Australia. During the study period from 2000 to
2008, observations show that albedo increased with an
increasingly negative precipitation anomaly, though it lagged
precipitation by several months. Compared to in-situ obser-
vations, using satellite observed albedo instead of the default
climatological albedo provided an improvement in the sim-
ulated seasonal mean air temperature. In terms of precipita-
tion, both simulations reproduced the drought that occurred
from 2002 through 2006. Using the observed albedo pro-
duced a drier simulation overall. During the onset of the 2002
drought, albedo changes enhanced the precipitation reduction
by 20 % on average, over locations where it was active. The
area experiencing drought increased 6.3 % due to the albedo
changes. Two mechanisms for albedo changes to impact
land–atmosphere drought feedback are investigated. One
accounts for the increased albedo, leading to reduced tur-
bulent heat flux and an associated decrease of moist static
energy density in the planetary boundary layer; the other
considers that enhanced local radiative heating, due to the
drought, favours a deeper planetary boundary layer, subse-
quently decreasing the moist static energy density through
entrainment of the free atmosphere. Analysis shows that
drought related large-scale changes in the regional climate
favour a strengthening of the second mechanism. That is, the
second mechanism is stronger in a drought year compared to
a normal year and this difference is larger than for the first
mechanism. When both mechanisms are active, the second
mechanism tends to dominate across the model domain,
particularly during the 2002 drought period. The introduction
of observed inter-annual variations in albedo produces an
enhancement of the first mechanism and a weakening of the
second mechanism during the onset of the drought.
Keywords Albedo � Land–atmosphere feedback �Drought � Regional climate model � Australia
1 Introduction
Interactions between the land surface and the atmosphere
play a critical role in modulating water and energy
X. H. Meng � J. P. Evans (&)
Climate Change Research Centre, University of New South
Wales, Sydney, Australia
e-mail: [email protected]
X. H. Meng
Key Laboratory of Land Surface Process and Climate Change in
Cold and Arid Regions, Cold and Arid Regions Environmental
and Engineering Research Institute, Chinese Academy
of Science, Lanzhou, Gansu, China
J. P. Evans
Australian Research Council Centre of Excellence
for Climate System Science, University of New South Wales,
Sydney, Australia
M. F. McCabe
Water Desalination and Reuse Center, Biological and
Environmental Sciences and Engineering Division,
King Abdullah University of Science and Technology,
Thuwal, Saudi Arabia
123
Clim Dyn (2014) 42:787–803
DOI 10.1007/s00382-013-1790-0
exchanges within the Earth system. Of particular interest is
the influence that these interactions have on weather and
climate variations: an area that has been investigated and
assessed by studies focusing on climate sensitivity to
albedo, soil moisture, land use change and vegetation
fraction (Koster and Suarez 2001; Matsui et al. 2005;
Zaitchik et al. 2005; Cook et al. 2006; Mahmood et al.
2010). In these and other investigations, both observational
analysis (Betts and Ball 1998; Eltahir 1998; Liu et al. 2006;
Notaro et al. 2006) and modelling studies (Charney et al.
1977; Chen and Avissar 1994; Blyth et al. 2006; Koster
et al. 2006; Zaitchik et al. 2007a; Xue et al. 2010) were
performed to better understand the influence of land–
atmosphere interactions on climate change: particularly on
precipitation, heat waves and urban heat islands (Zaitchik
et al. 2006; Findell et al. 2007; Fischer et al. 2007; Lin
et al. 2008). Land surface regional climate feedbacks have
been identified in both observations and numerical simu-
lations using Global Climate Models (GCMs), Regional
Climate Models (RCMs), and in coupled and uncoupled
biosphere–atmosphere models, over a wide variety of
temporal and spatial scales (Chen and Avissar 1994; Betts
and Ball 1998; Eltahir 1998; Liu et al. 2006; Alessandri
et al. 2007; Zaitchik et al. 2007b; Bonan 2008; McCabe
et al. 2008). The global land–atmosphere coupling exper-
iment (GLACE) found that hot spots of land–atmosphere
coupling are strongest in the transitional zones between wet
and dry climates (Guo et al. 2006; Koster et al. 2006).
Studies have also considered the mechanisms of land–
atmosphere interactions influencing local climate. Most of
these mechanistic studies have focused on the nature of the
variations of the surface available energy due to various
physical processes (Charney et al. 1977; Betts and Ball
1998; Eltahir 1998; Xue et al. 2010). Eltahir (1998)
hypothesised that wet soils projected a positive feedback on
precipitation by controlling the surface albedo and Bowen
ratio, through enhancing the net radiation and the total heat
flux from the surface into the planetary boundary layer
(PBL), resulting in high moist static energy in the PBL. The
investigation of Betts and Ball (1998) found that wet soils
yield high evaporative fractions and lead to a shallow PBL.
This causes a larger moist static energy density in the PBL,
favouring the occurrence of convection. Findell and Eltahir
(2003a, b) investigated the influence of soil moisture on the
development and triggering of convection by using the
convective triggering potential and a low-level humidity
index, considering the influence of soil moisture on prop-
erties of the layer between 100 and 300 mb above the
ground surface from where the air is likely to be incorpo-
rated into the PBL: an approach that has also proved to be
effective in India (Tuinenburg et al. 2011).
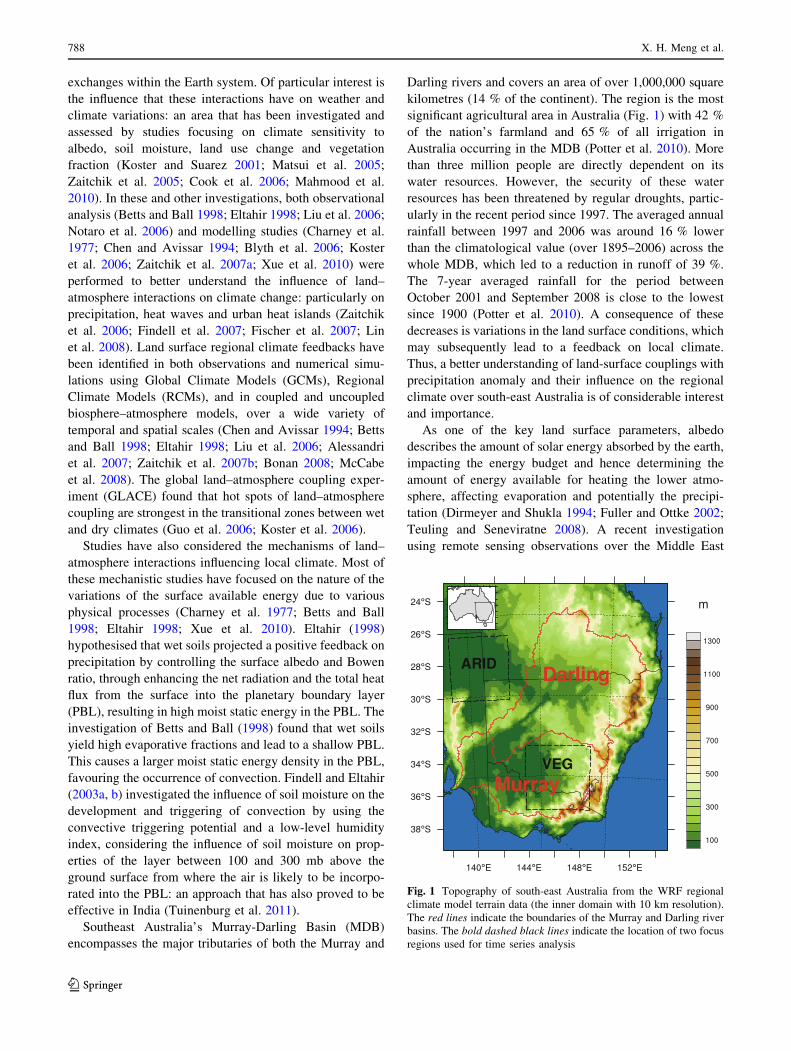
Southeast Australia’s Murray-Darling Basin (MDB)
encompasses the major tributaries of both the Murray and
Darling rivers and covers an area of over 1,000,000 square
kilometres (14 % of the continent). The region is the most
significant agricultural area in Australia (Fig. 1) with 42 %
of the nation’s farmland and 65 % of all irrigation in
Australia occurring in the MDB (Potter et al. 2010). More
than three million people are directly dependent on its
water resources. However, the security of these water
resources has been threatened by regular droughts, partic-
ularly in the recent period since 1997. The averaged annual
rainfall between 1997 and 2006 was around 16 % lower
than the climatological value (over 1895–2006) across the
whole MDB, which led to a reduction in runoff of 39 %.
The 7-year averaged rainfall for the period between
October 2001 and September 2008 is close to the lowest
since 1900 (Potter et al. 2010). A consequence of these
decreases is variations in the land surface conditions, which
may subsequently lead to a feedback on local climate.
Thus, a better understanding of land-surface couplings with
precipitation anomaly and their influence on the regional
climate over south-east Australia is of considerable interest
and importance.
As one of the key land surface parameters, albedo
describes the amount of solar energy absorbed by the earth,
impacting the energy budget and hence determining the
amount of energy available for heating the lower atmo-
sphere, affecting evaporation and potentially the precipi-
tation (Dirmeyer and Shukla 1994; Fuller and Ottke 2002;
Teuling and Seneviratne 2008). A recent investigation
using remote sensing observations over the Middle East
Fig. 1 Topography of south-east Australia from the WRF regional
climate model terrain data (the inner domain with 10 km resolution).
The red lines indicate the boundaries of the Murray and Darling river
basins. The bold dashed black lines indicate the location of two focus
regions used for time series analysis
788 X. H. Meng et al.
123

(Zaitchik et al. 2007a) showed that the links between
albedo and precipitation are geographically specific and
that the nature of these interactions are not only variable,
but depend upon the scale and regional context. While sea
surface temperature (SST) relationships with global ocean-
atmospheric circulation phenomena such as the El Nino
Southern Oscillation (ENSO) or the Indian Ocean Dipole
(IOD) (Risbey et al. 2009; Fu et al. 2010; Ummenhofer
et al. 2011) play significant roles in producing rainfall
variability in the Australian region, land surface conditions
are expected to enhance or moderate the large-scale
dynamics and have significant influences on rainfall locally
and regionally (Evans et al. 2011). Therefore, accurate
description of albedo is of great importance in regional
climate modelling and land–atmosphere interaction inves-
tigations. While many coupled land–atmosphere dynamic
processes have been shown to be important in northern
hemisphere studies, the influence of these in an Australia
context is not well understood (Evans et al. 2011).
To address this knowledge gap, this paper assesses the
influence of observed albedo changes on the regional cli-
mate over a period of drought, and then presents a study of
the influence of albedo on the land–atmosphere drought
feedback in southeast Australia and the mechanisms that
cause it. To do this, the Weather Research and Forecasting
(WRF) model is used to perform two simulations: the first
driven by the default WRF climatological albedo and the
second by Moderate Resolution Infrared Spectroradiometer
(MODIS) derived albedo. Comparison of these simulations
provides an indication of the model errors in standard WRF
simulations using the default climatological albedo, both in
the mean state and in the evolution of a major drought
event. In addition, the possible mechanisms of the local
albedo changes impacting the development of the drought
are investigated and discussed. By default, most regional
climate models prescribe seasonally varying surface con-
ditions that do not contain any inter-annual variability. This
work quantitatively evaluates the impact of time-varying
observed albedo on regional climate modelling and the
land–atmosphere feedback during a period when south-east
Australia moved into a severe drought.
The paper is structured as follows. Section 2 briefly
presents a description of the observational datasets of
precipitation and temperature used in this work, the deri-
vation of albedo from two distinct datasets and a compar-
ison between these data. Section 3 describes the Weather
Research and Forecasting (WRF) model and the experi-
mental design. The results are presented and discussed in
Sect. 4. First, the model results are evaluated against
observations and the impact of observed albedo on regional
climate modelling in southeast Australia is assessed. Then,
the albedo influence on land–atmosphere drought feedback
and its mechanisms are investigated for the severe 2002
drought, including evaluating the strength and distribution
of the mechanisms in this severe drought. The final section
summarises the findings and identifies areas requiring
future investigation.
2 Data description and albedo variations
2.1 Precipitation and temperature data
Gridded daily precipitation and air temperature products
were used to characterise the climate features and evaluate
the WRF model outputs. These 0.05� 9 0.05� resolution
products were interpolated from in situ station measure-
ments as part of the Australian Water Availability Project
(AWAP) (Jones et al. 2009), and have been previously used
in climate studies over the MDB (Cai et al. 2009a, b; Evans
and McCabe 2010). In this work, the original 0.05� reso-
lution products were interpolated to 10-km resolution in
order to compare with the model results.
2.2 Albedo datasets
The default albedo product used in the current WRF model
(referred to herein as WRF_CTL albedo) was derived from
the Advanced Very High Resolution Radiometer (AV-
HRR) sensor onboard the National Oceanographic and
Atmospheric Administration (NOAA) series of satellites,
and based upon monthly mean clear-sky, snow free surface
broadband albedo data retrieved between April 1985 to
December 1987 and January 1989 to March 1991 (refer to
Table 1). Further details of the WRF default albedo are
described by Csiszar (2009).
The MODIS derived albedo data used in this paper is
produced by Nadir BRDF (Bidirectional Reflectance Dis-
tribution Function) Adjusted Reflectances at 1,000 m spa-
tial resolution and 8-day intervals with 16-Day data
composites (MCD43B4.005) over the period 2000 through
2008. Data was downloaded from the MODIS Land
Mosaics for Australia in the Water Resources Observation
Network (WRON) of Australia’s Commonwealth Scientific
Table 1 Comparisons of albedo between WRF default and MODIS
derived datasets
Elements WRF default MODIS
Sensor AVHRR MODIS
Time period Apr 1985–Dec 1987 and
Jan 1989–Mar 1991
climatology
Jan 2000–Dec
2008
Time step Monthly 8-day interval
16-day composite
Spatial resolution 0.25 degrees 1 km
The influence of inter-annually varying albedo 789
123
and Industrial Research Organisation (CSIRO). The origi-
nal data used to produce the MODIS Land Products for
Australia were supplied by the Land Processes Distributed
Active Archive Center (LPDAAC), located at the U.S.
Geological Survey (USGS) Earth Resources Observation
and Science Center (EROS). Additional details on the data
are provided in Paget and King (2008).
2.2.1 MODIS albedo reprocessing
Quality control was performed on the MODIS retrievals to
remove outliers from the albedo data before further anal-
ysis. To do this, the following procedure was employed. At
each pixel, the 9-year albedo product with 8-day interval
(i.e., 414 time steps) is denoted as V, while the value of
each time step is denoted as Vx. If |Vx - Vx ? 1 | [ 0.015,
five data points before Vx and 4 data points after Vx ? 1 (a
total of 9 elements) were selected to make a new array V1.
The standard deviation (SD) and average (Avg) of V1 were
then calculated. If |Vx - Avg| [ 2.5 9 SD, Vx is consid-
ered as an outlier, removed from the time series, and
replaced by a linear interpolation between the nearest two
valid values. This approach was iterated until all obvious
outliers were removed. To maintain consistency between
the MODIS products and WRF defaults, the MODIS
albedo was then reprojected to the WRF Lambert confor-
mal projection, linearly interpolated to 6-h intervals, and
spatially-averaged to 10 km resolution to match the WRF
simulation.
2.2.2 Comparison of two albedo products
Seasonal average of WRF_CTL and MODIS albedo are
displayed in Fig. 2. Four seasons were defined: summer
(December, January, February; DJF), autumn (March,
April, May; MAM), winter (June, July, August; JJA) and
spring (September, October, November; SON). Both
products show similar spatial patterns (i.e., high albedo
over the west and low values over the east) related to land
surface conditions (the west is more arid), but have dif-
ferent absolute values. In general, MODIS albedo estimates
are higher than WRF_CTL, except for the south-east of the
Murray basin during autumn through spring.
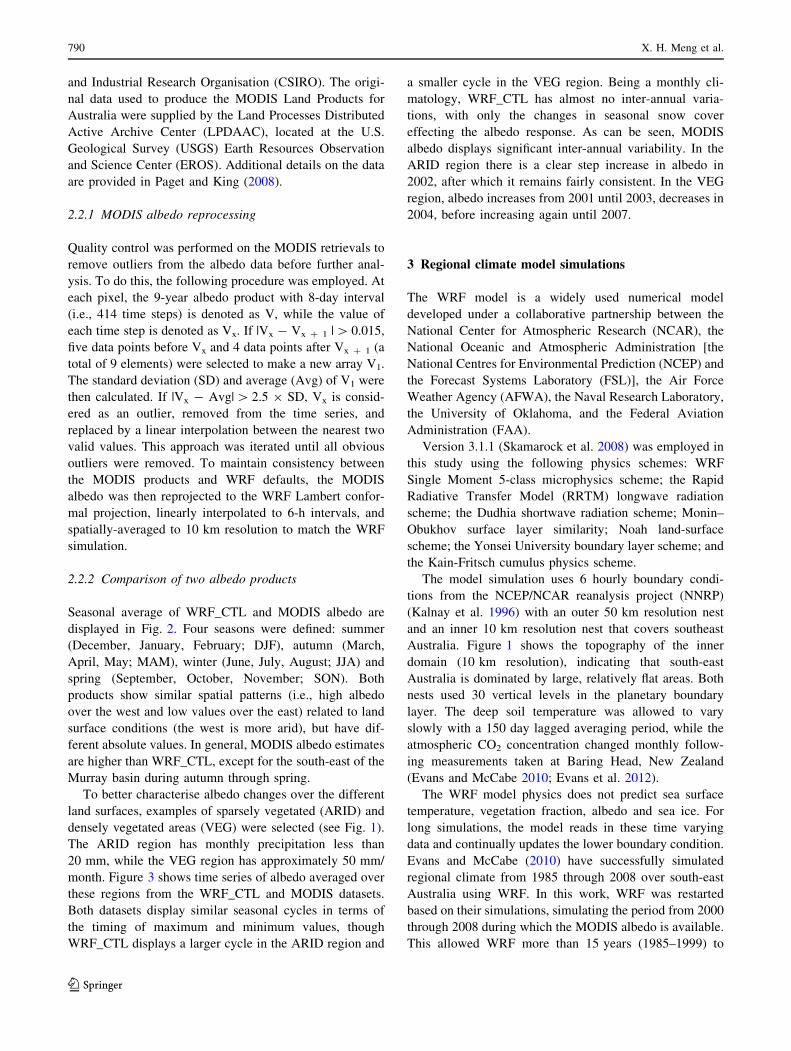
To better characterise albedo changes over the different
land surfaces, examples of sparsely vegetated (ARID) and
densely vegetated areas (VEG) were selected (see Fig. 1).
The ARID region has monthly precipitation less than
20 mm, while the VEG region has approximately 50 mm/
month. Figure 3 shows time series of albedo averaged over
these regions from the WRF_CTL and MODIS datasets.
Both datasets display similar seasonal cycles in terms of
the timing of maximum and minimum values, though
WRF_CTL displays a larger cycle in the ARID region and
a smaller cycle in the VEG region. Being a monthly cli-
matology, WRF_CTL has almost no inter-annual varia-
tions, with only the changes in seasonal snow cover
effecting the albedo response. As can be seen, MODIS
albedo displays significant inter-annual variability. In the
ARID region there is a clear step increase in albedo in
2002, after which it remains fairly consistent. In the VEG
region, albedo increases from 2001 until 2003, decreases in
2004, before increasing again until 2007.
3 Regional climate model simulations
The WRF model is a widely used numerical model
developed under a collaborative partnership between the
National Center for Atmospheric Research (NCAR), the
National Oceanic and Atmospheric Administration [the
National Centres for Environmental Prediction (NCEP) and
the Forecast Systems Laboratory (FSL)], the Air Force
Weather Agency (AFWA), the Naval Research Laboratory,
the University of Oklahoma, and the Federal Aviation
Administration (FAA).
Version 3.1.1 (Skamarock et al. 2008) was employed in
this study using the following physics schemes: WRF
Single Moment 5-class microphysics scheme; the Rapid
Radiative Transfer Model (RRTM) longwave radiation
scheme; the Dudhia shortwave radiation scheme; Monin–
Obukhov surface layer similarity; Noah land-surface
scheme; the Yonsei University boundary layer scheme; and
the Kain-Fritsch cumulus physics scheme.
The model simulation uses 6 hourly boundary condi-
tions from the NCEP/NCAR reanalysis project (NNRP)
(Kalnay et al. 1996) with an outer 50 km resolution nest
and an inner 10 km resolution nest that covers southeast
Australia. Figure 1 shows the topography of the inner
domain (10 km resolution), indicating that south-east
Australia is dominated by large, relatively flat areas. Both
nests used 30 vertical levels in the planetary boundary
layer. The deep soil temperature was allowed to vary
slowly with a 150 day lagged averaging period, while the
atmospheric CO2 concentration changed monthly follow-
ing measurements taken at Baring Head, New Zealand
(Evans and McCabe 2010; Evans et al. 2012).
The WRF model physics does not predict sea surface
temperature, vegetation fraction, albedo and sea ice. For
long simulations, the model reads in these time varying
data and continually updates the lower boundary condition.
Evans and McCabe (2010) have successfully simulated
regional climate from 1985 through 2008 over south-east
Australia using WRF. In this work, WRF was restarted
based on their simulations, simulating the period from 2000
through 2008 during which the MODIS albedo is available.
This allowed WRF more than 15 years (1985–1999) to
790 X. H. Meng et al.
123

‘‘spin-up’’ the soil moisture states in a coupled environ-
ment with the default albedo. Two simulations were per-
formed: one using the WRF default albedo and the second
using MODIS observed albedo. No other changes are made
to the land surface. Hereafter, these two simulations are
referred to as WRF control (WRF_CTL) and WRF
observed albedo (WRF_ALB) respectively.
It should be noted that while the observed albedo con-
tains all the feedbacks on albedo in the natural system, the
simulations prescribe albedo and hence do not include
feedbacks on albedo. In the simulations these prescribed
albedo changes impact land–atmosphere feedbacks through
their subsequent impacts on surface states such as soil
moisture.
4 Results and discussions
4.1 Evaluation of simulation results
The precipitation and temperature outputs from these
two WRF simulations were evaluated against AWAP
Fig. 2 Distribution of albedo from WRF default based on AVHRR 1985–1991 (WRF_CTL), MODIS 2000–2008 (WRF_ALB) and differences
between the two albedo products (WRF_ALB–WRF_CTL)
The influence of inter-annually varying albedo 791
123
observations. Statistics calculated for the evaluation include
the bias, root mean square error (RMSE), spatial correlations
of simulation outputs, and spatial correlations of anomalies
from climatology (see Table 1). Further details of the sta-
tistics are provided in Evans and McCabe (2010). The
results are generally similar for both Murray and Darling
basins. The WRF_ALB air temperature is closer to the
observations. The simulation of WRF_ALB precipitation is
slightly degraded, due largely to an increased underestimate
in the north-east during summer. In both regions,
WRF_ALB produces less precipitation overall (a larger
negative bias) indicating that the overall higher albedo has
had a negative impact on the precipitation (Table 2).
The time series of air temperature and monthly precip-
itation between WRF simulations and observations are
shown in Fig. 4, averaged over the ARID and VEG
regions. Both WRF simulations simulate the variations of
air temperature and precipitation well. WRF_ALB simu-
lates a smaller temperature bias than is present in the
WRF_CTL, but both WRF simulations reproduce the
reduction in precipitation evident in 2002 and 2006, which
were severe drought years. The two simulations produce
similar precipitation amounts, though using the observed
albedo (WRF_ALB) tends to produce less. The difference
between the simulations indicates the influence local
albedo changes have on precipitation.
The seasonal average of AWAP and the differences
between WRF simulations and AWAP for air temperature
and precipitation are displayed in Figs. 5 and 6
respectively. WRF_CTL overestimates the air temperature
in most of south-east Australia, except for areas along the
coastline. WRF_ALB improves the air temperature distri-
bution relative to the WRF_CTL, except in JJA over the
Murray basin, where it displays a slightly larger negative
bias. Figure 6 introduces Evans plots, which display the
absolute change amount using the colours hue, and the
relative change amount using the colours saturation/inten-
sity (http://www.ncl.ucar.edu/Applications/evans.shtml).
This combination makes it possible to display changes
across large climatological gradients where the same
absolute change amount may represent vastly different
relative changes within the same domain. For precipitation
(Fig. 6), the model has a tendency to underestimate, par-
ticularly in summer (DJF) and winter (JJA). WRF_ALB
simulates very similar precipitation to WRF_CTL in win-
ter, slightly less than WRF_CTL in the transition seasons,
and clearly less than WRF_CTL in summer. This empha-
sises that the impact on precipitation of changing albedo is
strongest in summer. Since the albedo has generally
increased, it also suggests a link between increasing albedo
and decreasing precipitation: in agreement with mecha-
nisms discussed in Sect. 4.3. Given that the default simu-
lation (WRF_CTL) underestimates the precipitation
overall, the introduction of the MODIS albedo exacerbates
this underestimate and produces slightly worse mean cli-
mate statistics. The impact of the drought related inter-
annual changes in albedo on the simulated precipitation is
examined in detail in Sect. 4.3.
4.2 Influence of observed albedo on the simulated
regional climate
Figure 7 presents the seasonal differences in air tempera-
ture, precipitation, net radiation, latent heat flux and wind
speed at 10 m between the two WRF simulations using
Evans plots. Inclusion of the observed albedo causes lower
air temperatures for most of the MDB due to the generally
higher observed albedo compared to the WRF default cli-
matological albedo. These temperature differences closely
correspond to the albedo changes (Fig. 2), such that the
largest albedo increases (in the north-east in winter) cor-
respond to the largest temperature decreases.
The largest decrease of precipitation caused by MODIS
albedo is seen in the north-east of the domain in summer
(DJF), while there is little change in winter (JJA): despite the
fact that the largest albedo changes occur in winter. Unlike
temperature, the connection between albedo and precipita-
tion is indirect, and other factors such as total available
moist energy, are strong intermediaries between them. In
winter, these factors essentially eliminate any influence of
albedo on precipitation, in a mean climatological sense,
regardless of the size of the albedo difference.
Fig. 3 Time series of albedo from the WRF_CTL and MODIS
datasets over ARID and VEG grid boxes (see Fig. 1)
792 X. H. Meng et al.
123

Net radiation (Rn) reflects, almost directly, the change of
albedo. Most of the domain experiences a decrease in net
radiation, except for the southern portion in spring and
winter. Latent heat flux is lower in WRF_ALB compared to
WRF_CTL throughout the domain, though some small
increases are seen in the south in spring. These changes in
the available energy (Rn) and local moisture source (latent
heat) are important for influencing the local production of
precipitation. In both cases the changes in winter tend to be
small relative to the changes in summer, despite the albedo
changes being largest in winter.
Wind speed at 10 m is lower in WRF_ALB compared to
WRF_CTL in the central MDB can be seen for the seasonal
averages. These decreases correspond to the regions with the
largest albedo increases and sensible heat decreases. This
decrease in the heating of the lower atmosphere results in
reduced vertical motion and near surface convergence. Aver-
aged over a season, this results in lower near surface horizontal
wind speeds in WRF_ALB compared to WRF_CTL.
4.3 Albedo influence on land–atmosphere drought
feedback and its mechanisms
In the previous section we assessed the impact on the
simulated climate of using the observed albedo instead of
the default climatological albedo. In the following sections
we attempt to assess the inter-annual impact on climate of
drought related albedo variations. This cannot be done by
simply comparing, say, the summer of 2003 in WRF_CTL
and WRF_ALB, because of the different albedo baselines.
Table 2 Monthly statistics of temperature and precipitation between the WRF simulations and AWAP over the Murray Basin
River basin Statistics Temperature (K) Precipitation (mm)
WRF_ALB WRF_CTL WRF_ALB WRF_CTL
Murray basin Bias 0.613 0.76 -7.13 -6.07
RMSE 1.103 1.20 11.2 11.27
Pattern correlation 0.935 0.936 0.736 0.73
Anomaly correlation 0.241 0.245 0.401 0.387
Darling basin Bias 0.802 1.188 -5.93 -2.83
RMSE 1.055 1.404 11.8 10.56
Pattern correlation 0.941 0.944 0.649 0.647
Anomaly correlation 0.355 0.339 0.424 0.42
Fig. 4 Time series of 2 m air temperature (left) and monthly precipitation (right) for the two WRF simulations (WRF_CTL and WRF_ALB) and
observations (AWAP) (12 months running average) over the ARID (top) and VEG (bottom) regions
The influence of inter-annually varying albedo 793
123

Instead, we will compare two successive years from the
simulation where the albedo does not vary (WRF_CTL)
with the same period from the other simulation in which it
does (WRF_ALB). It should be noted that a fundamental
impact of a change in albedo is a change in the available
energy at the surface. This changes the surface energy
fluxes, including evaporation, and hence the soil moisture.
Thus, while the differences between these simulations are
forced by changes in albedo, the mechanisms for feedback
on precipitation are often related to the associated changes
in soil moisture.
4.3.1 MODIS albedo changes and the precipitation
anomaly
As shown in Fig. 4, south-east Australia experienced a pre-
cipitation decrease from 2000 to 2002, and then recovered
somewhat before decreasing again in 2006. The time series
of observed albedo and precipitation together with the sim-
ulated soil moisture anomaly based on the time period from
1985 to 2008 over the ARID and VEG regions are shown in
Fig. 8. Soil moisture changes correspond to the precipitation
anomaly in both regions. The ARID region displays a
Fig. 5 Distribution of 2 m air temperature from observations (AWAP) and seasonal differences between the two simulations and observations
(WRF_CTL–AWAP and WRF_ALB–WRF_AWAP)
794 X. H. Meng et al.
123

consistently increasing albedo over most of the decade until
mid-2006, but does not return to pre-drought values. The
VEG region on the other hand presents a more variable
response, and fluctuates between the two severe drought
periods in 2002 and 2006. The albedo over the VEG region
displays an inverse relationship with the precipitation
anomaly that lags behind the precipitation changes by several
months. The albedo maximums occur in the summer in 2003
and 2007 following the precipitation minimums in late 2002
and the middle of 2006, indicating a likely relationship
with vegetation state and in agreement with the possible
response proposed by Charney et al. (1977). However, this
relationship is suggestive only as causality has not been
established.
4.3.2 Mechanisms for albedo impact on land–atmosphere
drought feedback
Feedbacks between the land surface and the atmosphere
have been the focus of recent investigations into the
Fig. 6 Distribution of precipitation from observations (AWAP) and
seasonal differences between the two simulations and observations
(WRF_CTL–AWAP and WRF_ALB–WRF_AWAP) (In the lower
two rows, hue indicates the difference in mm per season; saturation
indicates the difference in %)
The influence of inter-annually varying albedo 795
123

Fig. 7 Seasonal differences of
the variables between the two
WRF simulations (WRF_ALB–
WRF_CTL) (Hue and saturation
indicate the change of the
respective variables by amount
and by percentage)
796 X. H. Meng et al.
123

maintenance of extreme drought or flood conditions, as
well as for more fundamental climatological research
(Findell and Eltahir 2003b; Koster et al. 2006; Wei et al.
2008). One measure of the impact of this albedo change on
the drought is the change in area experiencing a decrease in
precipitation from the summer before to the summer of
the peak drought anomaly. Comparing WRF_CTL and
WRF_ALB shows that WRF_ALB has a 15.6 % increase
in the area experiencing a precipitation decrease, while the
area experiencing drought (here defined as a precipitation
anomaly of at least -20 mm/month) has increased by
6.3 % (21,500 km2).
Several mechanisms have been proposed and demon-
strated for land–atmosphere interactions affecting local
precipitation, as detailed in the introduction. Two of these
mechanisms focus on the impact on the moist static energy
density (MSED) in the PBL. MSED is calculated using:
MSED ¼ CpT þ gzþ Lvw
hPBL
ð1Þ
where Cp is the heat capacity of liquid water, T is the
temperature of the air, g is gravity, z is the height of the air
parcel, Lv is the latent heat of vaporisation, w is water
vapour mixing ratio and hPBL is the height of the PBL. In
this section, two hypotheses for albedo-soil moisture-
drought feedbacks on convective precipitation are exam-
ined in order to better understand the albedo influence on
recent south-east Australian droughts.
4.3.2.1 Proposed feedback mechanisms Two mechanis-
tic pathways have been identified and discussed in previous
work (Betts and Ball 1998; Eltahir 1998). The feedback
mechanism emphasised in the work of Eltahir (1998) is
associated with reduced net radiation, in which the
decrease of soil moisture and increase of albedo caused by
drought, leads to a reduction in available surface energy
and surface turbulent heat flux, decreasing the MSED in the
PBL and hence the convective potential (referred to here-
after as mechanism A) (MA). Note that this reduction in
net radiation may be alleviated somewhat by drought
related decreases in cloud fraction. The feedback mecha-
nism stressed in the work of Betts and Ball (1998)
describes the deepening and drying of the planetary
boundary layer (referred to hereafter as mechanism B)
(MB). This mechanism emphasises that drought results in
an increase of sensible heating from the land surface,
which may be caused by a shift in the Bowen ratio from
latent to sensible heating as well as being influenced by
changes in net radiation due to albedo and/or cloud fraction
changes. This increase of sensible heating leads to
increases in the PBL height and hence reduces the MSED
in the PBL through entrainment of air from the free
atmosphere, thus reducing the convective potential. It
should be noted that the feedback mechanisms only
become active after an initial change in soil moisture and
albedo caused by changes in the large-scale circulation
decreasing the precipitation.
The years 2002 and 2006 represent the two driest years
in the simulation and the summers starting in December,
after the two droughts, the two driest summers. As such, we
focus on these summers to examine the two mechanisms
during the onset of the drought. The analysis concentrates
on summer (DJF), as this is when most convective pre-
cipitation falls. The roles played by the mechanisms in the
summer before and the summer of the drought peaks are
directly compared and analysed (i.e., 2002 DJF–2003 DJF
and 2006 DJF–2007 DJF respectively). All DJFs in the
paper consist of Dec of the year before and Jan and Feb of
the year, and refer to means of the respective variables over
this period. For example, 2002 DJF is the mean over the
period Dec 2001–Feb 2002.).
The mechanisms discussed above are shown schemati-
cally in Fig. 9. Starting from the same drought related
surface change, they follow different paths to produce a
decrease in the MSED in the PBL. It should be noted that
these mechanisms are not mutually exclusive and may
indeed act to reinforce one another. We also note that both
Eltahir (1998) and Betts and Ball (1998) were observa-
tional studies and so were not able to differentiate the role
played by the increase in albedo and the decrease in soil
moisture. We also note that local radiative heating (QR)
was calculated as a simple radiative balance between the
Fig. 8 Time series of observed albedo and observed precipitation
anomalies, and simulated soil moisture (based on the time period
from 1985 to 2008) from 2000 to 2008 (12 months running average)
over the ARID and VEG regions
The influence of inter-annually varying albedo 797
123

lower atmosphere and the surface, QR = eaL: - esL;,
where ea and es are the emissivity of the lower atmosphere
and surface, and longwave upwelling (L:) and downwel-
ling (L;) terms are solved based on ground temperature
and air temperature near the top of the PBL respectively
(Zaitchik et al. 2007a, b). Here we attempt to quantify
when the mechanisms are acting, how strong they are
relative to each other, and what role the change in albedo
plays.
A mechanism is considered active in a grid cell if all the
changes for that mechanism, indicated in Fig. 9, are true
for that grid cell. Note that no albedo change is present in
the WRF_CTL simulation and only a change in soil
moisture is available to initiate a mechanistic pathway.
Figure 10 shows the active mechanisms during the 2002
DJF–2003 DJF (the upper panels) and 2006 DJF–2007 DJF
(the bottom panels) after the drought in 2002 and 2006.
The regions highlighted with red (MA), green (MB) and
orange (BOTH) identify the dominant feedback mecha-
nism. The WRF_CTL simulations indicate the feedback
mechanisms when the soil moisture decreased, but with no
change in albedo. The WRF_ALB simulations indicate
which mechanisms were present when both the soil mois-
ture decreased and the albedo increased. For the 2002
drought, a soil moisture-precipitation positive feedback
exists over both the northern and south-eastern parts of the
domain. MB dominates over most of the region where
feedback exists, while MA exists in some of the north and
regions in the south-east. When the albedo effect is
included (right panel), the areas indicating only MB have
slightly decreased, and MA can be seen to influence a
much larger area. Thus the albedo increases act to slightly
decrease the effectiveness of MB while improving the
effectiveness of MA. It should be noted that in most of the
region where feedback is identified, both mechanisms are
observed.
When the 2006 drought occurred, feedback mechanisms
can only be seen to be operating in the eastern part of the
study area (the bottom panels in Fig. 10). Comparison
between WRF_CTL and WRF_ALB show smaller areas
where the mechanisms are active in the WRF_ALB. This
smaller response is due to the region starting from rela-
tively dry conditions with prolonged high albedo since the
2002 drought, and relatively small changes during the 2006
drought. When feedbacks are occurring, both mechanisms
tend to be active, though MA is effective over a larger area.
Hereafter, we will focus on the analysis of albedo impact
on land–atmosphere drought feedback for the 2002
drought.
Fig. 9 Schematic of land–atmosphere drought feedback mechanisms
emphasised in the work of Eltahir (1998) (Mechanism A) and Betts
and Ball (1998) (Mechanism B). Both mechanisms require a decrease
in soil moisture, which in this case is accompanied by an increase in
albedo. H is the sensible heat, kE is the latent heat, QR is the local
radiative heating and PBL is the planetary boundary layer. Any
decrease in precipitation feeds back into a further decrease in soil
moisture
Fig. 10 Mechanisms contributing to land–atmosphere feedback in
DJF after drought occurrence in different years from WRF_CTL and
WRF_ALB (i.e., from 2002 DJF to 2003 DJF after the 2002 drought,
and from 2006 DJF to 2007 DJF after the 2006 drought). All DJFs in
the figures consist of Dec of the year before and Jan and Feb of the
year in the text. For example, 2002 DJF includes Dec 2001 and Jan
and Feb 2002. MA refers to the Mechanism A, while MB refers to
Mechanism B in this figure. BOTH identifies areas where MA and
MB are occurring in combination
798 X. H. Meng et al.
123
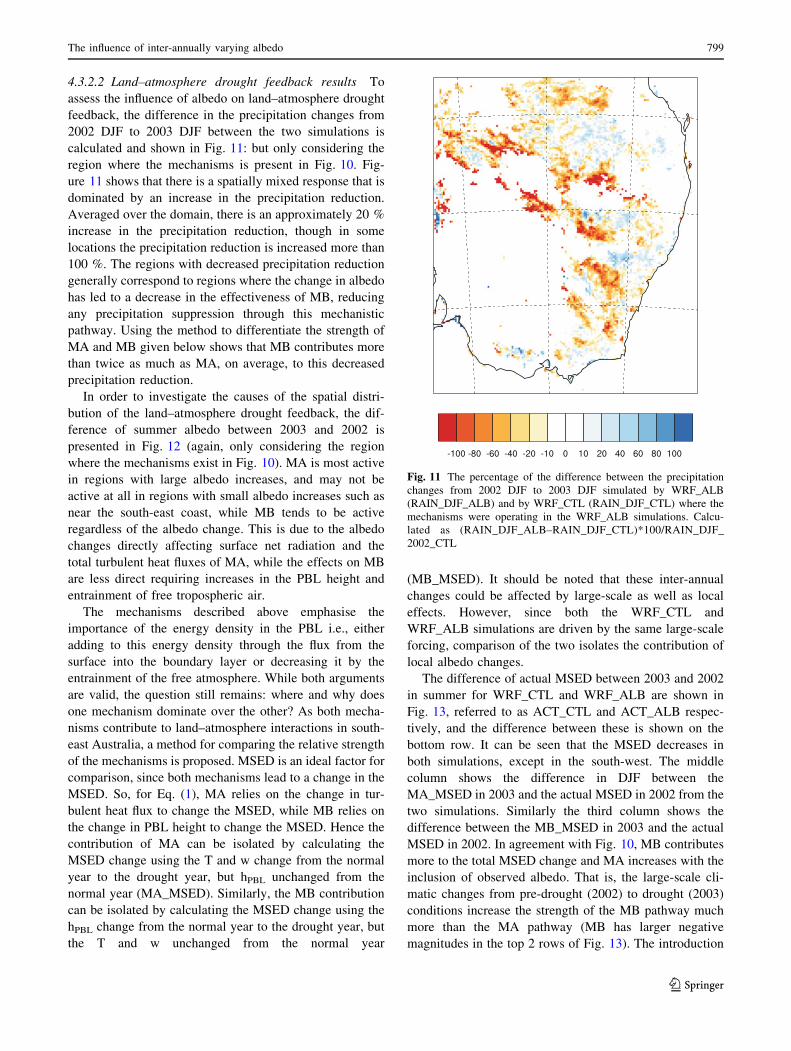
4.3.2.2 Land–atmosphere drought feedback results To
assess the influence of albedo on land–atmosphere drought
feedback, the difference in the precipitation changes from
2002 DJF to 2003 DJF between the two simulations is
calculated and shown in Fig. 11: but only considering the
region where the mechanisms is present in Fig. 10. Fig-
ure 11 shows that there is a spatially mixed response that is
dominated by an increase in the precipitation reduction.
Averaged over the domain, there is an approximately 20 %
increase in the precipitation reduction, though in some
locations the precipitation reduction is increased more than
100 %. The regions with decreased precipitation reduction
generally correspond to regions where the change in albedo
has led to a decrease in the effectiveness of MB, reducing
any precipitation suppression through this mechanistic
pathway. Using the method to differentiate the strength of
MA and MB given below shows that MB contributes more
than twice as much as MA, on average, to this decreased
precipitation reduction.
In order to investigate the causes of the spatial distri-
bution of the land–atmosphere drought feedback, the dif-
ference of summer albedo between 2003 and 2002 is
presented in Fig. 12 (again, only considering the region
where the mechanisms exist in Fig. 10). MA is most active
in regions with large albedo increases, and may not be
active at all in regions with small albedo increases such as
near the south-east coast, while MB tends to be active
regardless of the albedo change. This is due to the albedo
changes directly affecting surface net radiation and the
total turbulent heat fluxes of MA, while the effects on MB
are less direct requiring increases in the PBL height and
entrainment of free tropospheric air.
The mechanisms described above emphasise the
importance of the energy density in the PBL i.e., either
adding to this energy density through the flux from the
surface into the boundary layer or decreasing it by the
entrainment of the free atmosphere. While both arguments
are valid, the question still remains: where and why does
one mechanism dominate over the other? As both mecha-
nisms contribute to land–atmosphere interactions in south-
east Australia, a method for comparing the relative strength
of the mechanisms is proposed. MSED is an ideal factor for
comparison, since both mechanisms lead to a change in the
MSED. So, for Eq. (1), MA relies on the change in tur-
bulent heat flux to change the MSED, while MB relies on
the change in PBL height to change the MSED. Hence the
contribution of MA can be isolated by calculating the
MSED change using the T and w change from the normal
year to the drought year, but hPBL unchanged from the
normal year (MA_MSED). Similarly, the MB contribution
can be isolated by calculating the MSED change using the
hPBL change from the normal year to the drought year, but
the T and w unchanged from the normal year
(MB_MSED). It should be noted that these inter-annual
changes could be affected by large-scale as well as local
effects. However, since both the WRF_CTL and
WRF_ALB simulations are driven by the same large-scale
forcing, comparison of the two isolates the contribution of
local albedo changes.
The difference of actual MSED between 2003 and 2002
in summer for WRF_CTL and WRF_ALB are shown in
Fig. 13, referred to as ACT_CTL and ACT_ALB respec-
tively, and the difference between these is shown on the
bottom row. It can be seen that the MSED decreases in
both simulations, except in the south-west. The middle
column shows the difference in DJF between the
MA_MSED in 2003 and the actual MSED in 2002 from the
two simulations. Similarly the third column shows the
difference between the MB_MSED in 2003 and the actual
MSED in 2002. In agreement with Fig. 10, MB contributes
more to the total MSED change and MA increases with the
inclusion of observed albedo. That is, the large-scale cli-
matic changes from pre-drought (2002) to drought (2003)
conditions increase the strength of the MB pathway much
more than the MA pathway (MB has larger negative
magnitudes in the top 2 rows of Fig. 13). The introduction
Fig. 11 The percentage of the difference between the precipitation
changes from 2002 DJF to 2003 DJF simulated by WRF_ALB
(RAIN_DJF_ALB) and by WRF_CTL (RAIN_DJF_CTL) where the
mechanisms were operating in the WRF_ALB simulations. Calcu-
lated as (RAIN_DJF_ALB–RAIN_DJF_CTL)*100/RAIN_DJF_
2002_CTL
The influence of inter-annually varying albedo 799
123

of the observed change in albedo results in a strengthening
of the MA pathway, while the MB pathway is frequently
weakened (shown by bottom row of Fig. 13, where MA has
larger negative magnitudes). While the PBL height
increases from 2002 to 2003 in both simulations, this
increase is generally smaller when the observed inter-
annual change in albedo is included. This results in there
being less entrainment of the free atmosphere at the top of
the PBL and hence reduces the effectiveness of the MB
pathway.
A direct comparison of the relative contributions of the
two mechanistic pathways to the overall change in MSED
is given using the ratio of the difference between mecha-
nistic MSEDs from 2003 and the actual MSED in 2002:
Results from this assessment are shown in Fig. 14. Values
of 0 and 1 indicate that only MA (0) or only MB (1)
contribute, while intermediate values indicate that both
mechanisms are involved in the feedback processes. When
both mechanisms are active, it can be seen that MB is
stronger than MA in both simulations. While the drought-
related change of albedo increases the active area for MA
and decreases the active area of MB, MB remains the
dominant mechanism whenever they are both active.
5 Discussion and conclusion
In this study, a MODIS derived time varying albedo was
incorporated into the advanced research WRF model
(including the NOAH land-surface scheme) to assess the
influence of observed albedo on regional climate modelling
over south-east Australia and also to examine the impact on
land–atmosphere drought feedbacks occurring within this
region. Compared to using the standard climatological
albedo in these regional climate model simulations, the
observed albedo provided an improvement in the simulated
air temperature, while for precipitation responses, both
simulations capture the drought well, with the observed
satellite based albedo producing a drier simulation overall.
Time series comparisons show that the albedo changes
were inversely related to changes in the precipitation
anomaly, and lag behind the precipitation anomaly by a
few months. Variations of albedo directly impact the
radiation and energy balances, which influence other
atmospheric and hydrological variables in turn. Variables
that are only indirectly influenced by albedo, such as pre-
cipitation and wind speed, tend to show the largest impacts
in summer even when the largest albedo changes occur in
winter. This suggests that the mechanisms that connect
albedo changes to these variables are sensitive to the total
energy in the system and are therefore more active in
summer.
The albedo-atmosphere interaction leads to an average
20 % increase in the precipitation reduction experienced
while entering the 2002 drought. This increase is not spa-
tially uniform, with some areas experiencing small
decreases in the precipitation reduction. This means that
the drought in south-east Australia was dominantly caused
by changes in the large-scale circulation. That is, large-
scale external influences cause a sustained precipitation
reduction, which in turn causes an albedo increase a few
months later, this albedo increase in turn enhanced the
original precipitation reduction in most locations.
Fig. 12 Difference of MODIS derived albedo between 2003 DJF and
2002 DJF, when the mechanisms were operating in the WRF_ALB
simulations
MBMSEDð2003Þ � ACTMSEDð2002ÞðMBMSEDð2003Þ � ACTMSEDð2002ÞÞ þ ðMAMSEDð2003Þ � ACTMSEDð2002ÞÞ ð2Þ
800 X. H. Meng et al.
123

The analysis also characterised the mechanisms of land–
atmosphere interactions in south-east Australia. During the
2002 drought, the processes displayed by simulation results
are consistent with the mechanisms proposed by Eltahir
(1998) and Betts and Ball (1998). The proposed hypotheses
on the role of land–atmosphere interactions share the basic
concept that the change of MSED in the PBL impacts the
potential for convective precipitation. Mechanism A (MA)
relies on a change in the total turbulent heat, while
Mechanism B (MB) relies on a change in the PBL height to
cause the MSED changes. While both mechanisms invoke
a decrease in soil moisture as the trigger, MA is consis-
tently enhanced by the albedo changes, while MB can be
weakened by them. From WRF_CTL and WRF_ALB
simulations, both mechanisms contribute to the 2002 and
2006 drought. The 2002 drought has a much larger area
over which these land surface-atmosphere feedbacks were
operating, compared to 2006. This is likely due to the 2002
Fig. 13 Moist static energy density (MSED) difference between
2003 DJF and 2002 DJF. (ACT_CTL: actual MSED of 2003–actual
MSED of 2002 from WRF_CTL; MA_CTL: MA_MSED of 2003–
actual MSED of 2002 from WRF_CTL; MB_CTL: MB_MSED of
2003–actual MSED of 2002 from WRF_CTL; ACT_ALB, MA_ALB
and MB_ALB are the same, but from WRF_ALB results.) The bottom
row shows the difference between the ALB and CTL MSED fields
The influence of inter-annually varying albedo 801
123

drought occurring after relatively wet years, while the 2006
drought occurred after a few average to dry years.
As was discussed in Eltahir (1998) work, both of these
feedback mechanisms are valid. A method to quantify the
relative contribution of each mechanism to the total change
in MSED is proposed. Results from this analysis show that
when both mechanisms are active, MB is dominant,
although there are locations where MB is inactive while the
MA is present.
In summary, the 2002 south-east Australia drought
was caused by large-scale circulation: however, drought-
related changes in land-surface conditions play an
important role in local climate in south-east Australia.
Drought-related albedo variations can lead to an increase
in the severity of the extreme drought: however, there are
mixed enhancements of precipitation in some regions
which are related to a decrease in the strength of the MB
pathway. While drought can be sustained for many years
in south-east Australia, these land surface-atmosphere
feedbacks are very important in the initial development
and play smaller roles in subsequent re-intensification of
the drought conditions. Here, only the albedo impact on
the land–atmosphere drought feedback is addressed.
Feedback relationships with additional drought related
land surface condition changes such as vegetation dis-
tribution changes or transpiration characteristics (and
their combined influence) remains a subject requiring
further investigation.
Acknowledgments This work was funded by the Australian
Research Council as part of the Discovery Project DP0772665 and
Future Fellowship FT110100576. This work was supported by an
award under the Merit Allocation Scheme on the NCI National
Facility at the ANU.
References
Alessandri A, Gualdi S, Polcher J, Navarra A (2007) Effects of land
surface–vegetation on the boreal summer surface climate of a
GCM. J Clim 20:255–278. doi:10.1175/JCLI3983.1
Betts AK, Ball JH (1998) FIFE surface climate and site-average
dataset 1987–89. J Atmos Sci 55:1091–1108
Blyth EM, Evans JG, Finch JW, Bantges R, Harding RJ (2006)
Spatial variability of the English agricultural landscape and its
effect on evaporation. Agric For Meteorol 138:19–28. doi:
10.1016/j.agrformet.2006.03.007
Bonan GB (2008) Forests and climate change: forcings, feedbacks,
and the climate benefits of forests. Science 320:1444–1449. doi:
10.1126/science.1155121
Cai W, Cowan T, Briggs P, Raupach M (2009a) Rising temperature
depletes soil moisture and exacerbates severe drought conditions
across southeast Australia. Geophys Res Lett 36:L21709. doi:
10.1029/2009GL040334
Cai W, Cowan T, Raupach M (2009b) Positive Indian Ocean dipole
events precondition southeast Australia bushfires. Geophys Res
Lett 36:L19710. doi:10.1029/2009GL039902
Charney J, Quirk W, Chow S, Kornfield J (1977) Comparative study
of effects of albedo change on drought in semi-arid regions.
J Atmos Sci 34:1366–1385
Chen F, Avissar R (1994) Impact of land-surface moisture variability
on local shallow convective cumulus and precipitation in large-
scale models. J Appl Meteorol 33:1382–1401
Fig. 14 MSED contribution of the two mechanisms for the WRF_CTL and WRF_ALB simulations (2002–2003 DJF). Red indicates that only
MA contributes, blue indicates that only MB contributes
802 X. H. Meng et al.
123

Cook BI, Bonan GB, Levis S (2006) Soil moisture feedbacks to
precipitation in Southern Africa. J Clim 19:4198–4206
Csiszar IA (2009) ISLSCP II NOAA 5-year average monthly snow-
free albedo from AVHRR. ISLSCP initiative II collection. Data
set. Available on-line [http://daac.ornl.gov/] from Oak Ridge
National Laboratory Distributed Active Archive Center, Oak
Ridge, Tennessee, U.S.A. doi:10.3334/ORNLDAAC/959
Dirmeyer PA, Shukla J (1994) Albedo as a modulator of climate
response to tropical deforestation. J Geophys Res 99:20863–
20877
Eltahir EAB (1998) A soil moisture rainfall feedback mechanism 1.
Theory and observations. Water Resour Res 34:765–776
Evans JP, McCabe MF (2010) Regional climate simulation over
Australia’s Murray-Darling basin: a multitemporal assessment.
J Geophys Res 115:D14114. doi:10.1029/2010JD013816
Evans JP, Pitman AJ, Cruz FT (2011) Coupled atmospheric and land
surface dynamics over southeast Australia: a review, analysis
and identification of future research priorities. Int J Climatol
31:1758–1772. doi:10.1002/joc.2206
Evans JP, Ekstrom M, Ji F (2012) Evaluating the performance of a
WRF physics ensemble over South-East Australia. Clim Dyn.
doi:10.1007/s00382-011-1244-5
Findell KL, Eltahir EAB (2003a) Atmospheric controls on soil
moisture-boundary layer interactions. Part I: framework devel-
opment. J Hydrometeorol 4:552–569
Findell KL, Eltahir EAB (2003b) Atmospheric controls on soil
moisture-boundary layer interactions. Part II: feedbacks within
the continental United States. J. Hydrometeorol. 4:570–583
Findell KL, Shevliakova E, Milly PCD, Stouffer RJ (2007) Modeled
impact of anthropogenic land cover change on climate. J Clim
20:3621–3634
Fischer EM, Seneviratne SI, Vidale PL, Luthi D, Schar C (2007) Soil
moisture-atmosphere interactions during the 2003 European
summer heat wave. J Clim 20:5081–5099
Fu G, Viney N, Charles S, Liu J (2010) Long-term temporal variation
of extreme rainfall events in Australia: 1910–2006. J Hydrome-
teorol 11:950–965. doi:10.1175/2010JHM1204.1
Fuller DO, Ottke C (2002) Land cover, rainfall and land-surface
albedo in West Africa. Climatic Change 54:181–204. doi:
10.1023/A:1015730900622
Guo Z, Dirmeyer PA, Koster RD et al (2006) GLACE: the global
land-atmosphere coupling experiment. Part II: analysis. J Hydro-
meteorol 7:611–625
Jones DA, Wang W, Fawcett R (2009) High-quality spatial climate
data-sets for Australia. Aust Meteorol Mag 58:233–248
Kalnay E, Kanamitsu M, Kistler R et al (1996) The NCEP/NCAR
40-year reanalysis project. Bull Am Meteorol Soc 77:437–471
Koster RD, Suarez MJ (2001) Soil moisture memory in climate
models. J Hydrometeorol 2:558–570
Koster RD, Guo Z, Dirmeyer PA et al (2006) GLACE: the global
land-atmosphere coupling experiment. Part I: overview. J Hy-
drometeorol 7:590–610
Lin C-Y, Chen F, Huang JC et al (2008) Urban heat island effect and
its impact on boundary layer development and land–sea circu-
lation over northern Taiwan. Atmos Environ 42:5635–5649. doi:
10.1016/j.atmosenv.2008.03.015
Liu Z, Notaro M, Kutzbach J, Liu N (2006) Assessing global vegetation-
climate feedbacks from observations. J Clim 19:787–814
Mahmood R, Quintanar AI, Conner G et al (2010) Impacts of land use/
land cover change on climate and future research priorities. Bull
Am Meteorol Soc 91:37–46. doi:10.1175/2009BAMS2769.1
Matsui T, Lakshmi V, Small EE (2005) The effects of satellite-
derived vegetation cover variability on simulated land-atmo-
sphere interactions in the NAMS. J Clim 18:21–40
McCabe MF, Wood EF, Wojcik R et al (2008) Hydrological
consistency using multi-sensor remote sensing data for water
and energy cycle studies. Remote Sens Environ 112:430–444
Notaro M, Liu Z, Williams JW (2006) Observed vegetation–climate
feedbacks in the United States. J Clim 19:763–786. doi:10.1175/
JCLI3657.1
Paget MJ, King EA (2008) MODIS land data sets for the Australian
region. CSIRO Marine and Atmospheric Research internal
report. CSIRO, Canberra, Australia
Potter NJ, Chiew FHS, Frost AJ (2010) An assessment of the severity
of recent reductions in rainfall and runoff in the Murray–Darling
basin. J Hydrol 381:52–64. doi:10.1016/j.jhydrol.2009.11.025
Risbey JS, Pook MJ, McIntosh PC, Wheeler MC, Hendon HH (2009)
On the remote drivers of rainfall variability in Australia. Mon
Weather Rev 137:3233–3253
Skamarock WC, Klemp JB, Dudhia J et al (2008) A description of the
advanced research WRF Version 3. NCAR Technical Note.
NCAR, Boulder, CO, p 125
Teuling AJ, Seneviratne SI (2008) Contrasting spectral changes limit
albedo impact on land-atmosphere coupling during the 2003
European heat wave. Geophys Res Lett 35:L03401. doi:10.1029/
2007GL032778
Tuinenburg O, Hutjes R, Jacobs C, Kabat P (2011) Diagnosis of local
land-atmosphere feedbacks in India. J Clim 24:251–266. doi:
10.1175/2010JCLI3779.1
Ummenhofer CC, Gupta AS, Briggs PR et al (2011) Indian and
Pacific Ocean influences on southeast Australian drought and
soil moisture. J Clim 24:1313–1336
Wei J, Dickinson RE, Chen H (2008) A negative soil moisture-
precipitation relationship and its causes. J Hydrometeorol
9:1364–1376
Xue Y, De Sales F, Vasic R, Mechoso CR, Arakawa A, Prince S
(2010) Global and seasonal assessment of interactions between
climate and vegetation biophysical processes: a GCM study with
different land-vegetation representations. J Clim 23:1411–1433
Zaitchik BF, Evans J, Smith RB (2005) MODIS-derived boundary
conditions for a mesoscale climate model: application to
irrigated agriculture in the Euphrates Basin. Mon Weather Rev
133:1727–1743
Zaitchik B, Macalady A, Bonneau L, Smith R (2006) Europe’s 2003
heat wave: a satellite view of impacts and land-atmosphere
feedbacks. Int J Climatol 26:743–769. doi:10.1002/joc.1280
Zaitchik BF, Evans JP, Geerken RA, Smith RB (2007a) Climate and
vegetation in the Middle East: interannual variability and
drought feedbacks. J Clim 20:3924–3941
Zaitchik BF, Evans JP, Smith RB (2007b) Regional impact of an
elevated heat source: the Zagros Plateau of Iran. J Clim
20:4133–4146
The influence of inter-annually varying albedo 803
123