the intramolecular 13c-distribution in ethanol reveals the influence of the co2-fixation pathway and...
TRANSCRIPT

The intramolecular 13C-distribution in ethanol reveals theinfluence of the CO2-fixation pathway and environmentalconditions on the site-specific 13C variation in glucosepce_2308 1104..1112
ALEXIS GILBERT1, VIRGINIE SILVESTRE1, NICOLAS SEGEBARTH2, GUILLAUME TCHERKEZ3,CLAUDE GUILLOU2, RICHARD J. ROBINS1, SERGE AKOKA1 & GÉRALD S. REMAUD1
1Interdisciplinary Chemistry: Synthesis, Analysis, Modelling (CEISAM), University of Nantes – CNRS UMR 6230, 2 rue de laHoussinière, BP 92208, F-44322 Nantes, France, 2Joint Research Centre of the European Commission, Institute for Health &Consumer Protection Physical & Chemical Exposure, unit BEVABS -TP281, via Fermi 2, 21020 Ispra, Italy and 3Institut deBiologie des Plantes (IBP), CNRS UMR 8618 – Bât. 630, Université Paris Sud 11, 91405 Orsay Cedex, France
ABSTRACT
Efforts to understand the cause of 12C versus 13C isotopefractionation in plants during photosynthesis and post-photosynthetic metabolism are frustrated by the lack ofdata on the intramolecular 13C-distribution in metabolitesand its variation with environmental conditions. We haveexploited isotopic carbon-13 nuclear magnetic resonance(13C NMR) spectrometry to measure the positional isotopecomposition (d13Ci, ‰) in ethanol samples from differentorigins: European wines, liquors and sugars from C3, C4 andcrassulacean acid metabolism (CAM) plants. In C3-ethanolsamples, the methylene group was always 13C-enriched(~2‰) relative to the methyl group. In wines, this patternwas correlated with both air temperature and d18O of winewater, indicating that water vapour deficit may be a criticaldefining factor. Furthermore, in C4-ethanol, the reverserelationship was observed (methylene-C relatively 13C-depleted), supporting the concept that photorespiration isthe key metabolic process leading to the 13C distributionin C3-ethanol. By contrast, in CAM-ethanol, the isotopicpattern was similar to but stronger than C3-ethanol, with arelative 13C-enrichment in the methylene-C of up to 13‰.Plausible causes of this 13C-pattern are briefly discussed. Asthe intramolecular -values in ethanol reflect that insource glucose, our data point out the crucial impact on theratio of metabolic pathways sustaining glucose synthesis.
Key-words: isotope fractionation; photorespiration; quanti-tative isotopic 13C NMR.
INTRODUCTION
Photosynthetic CO2 fixation by terrestrial plants discrimi-nates against 13CO2, thereby depleting plant organic mate-rial in 13C (for a review, see Farquhar, Ehleringer & Hubick1989): on average, C3 and C4 plants are 13C-depleted by 20and 4‰, respectively, compared with atmospheric CO2
(Troughton, Card & Hendy 1974). Two main steps have
been identified as responsible for this isotope fractionation:CO2 diffusion and CO2 fixation. Ribulose-1,5-bisphosphatecarboxylase/oxygenase (EC 4.1.1.39) that fractionates by29‰ (Winkler et al. 1982; Roeske & O’Leary 1984; Farqu-har et al. 1989) is responsible for most of the 13C fraction-ation in C3 plants. By contrast, in C4 plants, the isotopicselectivity against 13C by phosphoenolpyruvate carboxylase(EC 4.1.1.31), of about 3‰ (Winkler et al. 1983), is overcom-pensated by the 13C enrichment in bicarbonate (HCO3
-,13C-enriched by 9‰ compared with dissolved CO2). Theisotope fractionation associated with photosynthetic CO2
net assimilation (denoted as D) has been modelled by Far-quhar and co-workers and, in its simplest form, it is given by(Farquhar, O’Leary & Berry 1982):
Δ = + ′ −( )a b acc
i
a
(1)
where a is the fractionation associated with CO2 diffusionthrough stomata (4.4‰) and b’ the net isotope fractionationassociated with carboxylation (27 to 29‰ in C3 plants, ca.0‰ in C4 plants). The ratio ci/ca is the internal-to-externalleaf CO2 mole fraction. In other words, environmental con-ditions that have an effect on CO2 conductance or photo-synthetic rate may influence ci/ca that in turn will have aneffect on D. Many studies have indeed shown that factorssuch as water restriction or nitrogen availability influencethe 13C content in plant material (for a review, see Brugnoli& Farquhar 2000).
Nevertheless, in addition to photoassimilatory andenvironmental influences, the natural 13C-abundance ofplant metabolites further depends on isotope fractionationby post-photosynthetic metabolism (Schmidt et al. 1995;Schmidt 2003). Taking the overall natural 13C-abundancefor different classes of compounds, lipids and lignin havebeen shown to be relatively 13C-depleted (Park & Epstein1961; Winkler et al. 1978), whereas starch and dark-respiredCO2 are 13C-enriched (Duranceau et al. 1999; Ghashghaieet al. 2003;Tcherkez et al. 2003).At a more refined level, it isapparent that the intramolecular isotope composition in
Correspondence: G. Remaud. Fax: +33 2 51 12 57 12; e-mail:[email protected]
Plant, Cell and Environment (2011) 34, 1104–1112 doi: 10.1111/j.1365-3040.2011.02308.x
© 2011 Blackwell Publishing Ltd1104

individual metabolites is not homogeneous, with relatively13C-depleted and 13C-enriched C-atom positions. Ina-amino-acids, it has been demonstrated that the carbonatom in the carboxyl group (-COOH) attached to thea-carbon is systematically 13C-enriched (Abelson &Hoering 1961; Schmidt et al. 1995). In the key metabolite,glucose, it has been shown that the C-3 and C-4 atom posi-tions are relatively 13C-enriched (Rossmann, Butzenlechner& Schmidt 1991), a finding recently confirmed by measuringdirectly the positional isotope composition d13Ci in all Cpositions of glucose using carbon-13 nuclear magneticresonance (13C NMR; Gilbert et al. 2009). Such a non-homogeneous isotopic distribution is caused by metabolicreactions associated with positional isotope effects, in whichC–C bonds are made or broken, or there are changes inbond orders around C atoms. The C-3 and C-4 in glucoseare enriched in 13C because of an equilibrium isotope effectof the aldolase reaction, which favours 13C in the corre-sponding C-atoms in fructose-1,6-bisphosphate, thereafterconverted to glucose-6-phosphate (Gleixner & Schmidt1997). Furthermore, using a modelling approach, Tcherkezet al. (2004) suggested that the equilibrium isotope effectof Calvin cycle enzymes (aldolase, transketolase) couldexplain most of the intramolecular 13C-pattern in glucose, aswell as the relative 13C-depletion in sucrose produced in thelight and the 13C-enrichment in transitory starch.That is, theconsumption of 13C-enriched triose phosphates by aldolasein the light in the chloroplast is responsible for both the13C-enrichment in starch and the 13C-depletion of exportedtriose phosphates that are in turn used for cytoplasmicsucrose synthesis. Consequently, metabolic fluxes appear ascritical as isotope effects for interpreting the intramolecular13C-pattern in molecules. For example, any change in thecompetition for triose phosphates (e.g. chloroplastic con-sumption versus export to cytoplasm) may have an effect onthe 13C-isotope distribution in sucrose and glucose synthe-sized in the light. More generally, the relationship between13C-isotopic patterns and metabolic pathways has beenwell-recognized and extensively analysed by Schmidt(Schmidt et al. 1995; Schmidt 2003).
However, due to technical difficulties, data on the influ-ence of contrasted environmental or metabolic conditionson intramolecular isotopic patterns are currently veryscarce: the intramolecular 13C-distribution requires eithera chemical degradation and specific d13C analyses or achemical derivatization followed by quantitative 13C NMR.Some indirect data have nevertheless been obtained. Forexample, Scrimgeour, Bennet & Connacher (1988) showedthat the relative 13C-enrichment of CO2 released by thefermentation of glucose was more pronounced in C3glucose than in C4 glucose, whereas intramolecular isotopicdifferences between sugars derived from the C3 and C4assimilation strategies have been suggested by measuringthe d13Cg of CO2 (from C-3 and C-4) and ethanol (fromC-1 + C-2, C-5 + C-6) produced from fermentation (Hobbie& Werner 2004). Notwithstanding these findings, our knowl-edge of intramolecular isotopic distribution within plantmetabolites and the metabolic mechanisms that explain theisotope composition in glucose or other key compoundssuch as respired CO2 is limited (Barbour & Hanson 2009;Tcherkez et al. 2010).
As an aid to clarifying this issue, we have investigatedvariations in intramolecular 13C-patterns in ethanol fromC3-, crassulacean acid metabolism (CAM)- and C4-sugarfrom plants of different origins. Ethanol was obtained eitherfrom liquors, wine samples or fruit juices or by fermentationof pure sugars. As there is negligible isotopic adulterationduring glucose conversion to ethanol – fermentation anddistillation both being essentially quantitative – the dataobtained should reflect the original 13C-pattern in suppliedglucose. The methylene-C (CH2OH) of ethanol comes fromthe C-2 and C-5 positions in glucose whereas the methyl-C(CH3) originates from the C-1 and C-6 positions (Fig. 1).Our results show a consistent isotopic offset betweenmethyl-C and methylene-C positions in ethanol, and suchan offset is significantly different in C3, CAM and C4 plants.Furthermore, from an analysis of a large number of samplesof C3-ethanol obtained from wines, the isotopic offsetappears to be influenced by growth of the vines conditions.We conclude that the isotope effects responsible for the
Figure 1. Simplified metabolic schemeshowing the origin (in glucose) of carbonatoms found in ethanol produced byalcoholic fermentation. The carbonnumbering refers to glucose atompositions. Glycerol formation isdeliberately omitted.
Environmental impact on the intramolecular 13C distribution in glucose 1105
© 2011 Blackwell Publishing Ltd, Plant, Cell and Environment, 34, 1104–1112

natural intramolecular 13C-distribution in source glucosevary with both photosynthetic pathways and environmentalconditions.
MATERIALS AND METHODS
Material
D-Glucose was obtained from Prolabo (Fontenay-sous-Bois, France). (NH4)2SO4, KH2PO4, MgSO4.7H2O and meatpeptone were obtained from Merck (Fontenay-sous-Bois,France). Hexadeuterated dimethylsulfoxide (DMSO-d6)was purchased from Eurisotop (Saint-Aubin, France) andtris(2,4-pentadionato)chromium-III [Cr(Acac)3] (97%)from Acros Organics (Courtaboeuf, France). Dried culturesof Saccharomyces bayanus and Saccharomyces cerevisiaewere purchased from Val-Oeno (Vallet, France). Cliniteststicks (Roche, France), used to test for glucose concentra-tion, were purchased in a local pharmacy. Fruit juices werefrom various commercial sources.
Sample origins
Ethanol was obtained either from the fermentation offruit juices, the fermentation of pure sugars, or from wineor liquor samples. In all cases, ethanol was purified bydistillation.
For fruit juices, dry Saccharomyces bayanus (2 g L-1) anddry Saccharomyces cerevisiae (2 g L-1) were added directlyto the juice. For pure sugars (glucose, fructose, sucrose), thesame quantities of dried yeast were added to a syntheticmedium composed of sugar (100 g L-1) (NH4)2SO4 (4 g L-1),KH2PO4 (3 g L-1), MgSO4.7H2O (1 g L-1) and peptone(2 g L-1). The fermentations were carried out at 30°C underslow agitation (50 rpm). The consumption of sugar was fol-lowed using a Clinitest (lower detection limit ca. 1 g L-1) andwas complete in about 3 d. Ethanol was extracted from thefermentation medium by distillation using a Cadiot columnequipped with a Teflon spinning band in strictly controlledconditions that avoid any isotope effect due to liquid-vapour transition (Moussa et al. 1990; Botosoa et al. 2008).
Ethanol samples from wine were obtained from theEuropean Office for Wine, Alcohol and Spirit Drinks data-bank (BEVABS, EC-JRC, Ispra, Italy). They are represen-tative of each production area and are used as reference forthe calculation of chaptalization according to the Europeanofficial methods for control in the wine sector [see Cal-derone & Guillou (2008) for EC regulations].
NMR spectrometry
Sample preparationIn a 4 mL vial 600 mL ethanol and 100 mL of a 0.1 m solutionof Cr(Acac)3 in DMSO-d6 were mixed.The relaxation agentCr(Acac)3 can partly precipitate in the presence of water:therefore the mixture was left to stand at room temperaturefor at least 3 h before being filtered into a 5-mm-outsidediameter (o.d.) tube.
Spectral acquisitionQuantitative 13C NMR spectra were recorded using aBruker DRX 500 spectrometer fitted with a 5-mm-internaldiameter (i.d.) dual probe 13C/1H carefully tuned at therecording frequency of 125.76 MHz. The temperature ofthe probe was set at 303 K. The offset for both 13C and 1Hwas set at the middle of the frequency range. Inverse-gated decoupling was applied in order to avoid nuclearoverhauser effect (NOE). The decoupling sequence used acosine adiabatic pulse with appropriate phase cycles, asdescribed previously (Tenailleau & Akoka 2007). Theexperimental parameters for 13C NMR spectral acquisitionwere the following: pulse width 4.3 ms (90°), samplingperiod 1.0 s, number of scans 40, repetition delay 25 s,leading to a signal-to-noise ratio (SNR) ª 2500. For eachsample, five spectra were recorded: the values reported foreach carbon are the mean of the five spectra.
Data processingFree induction decay was submitted to an exponential mul-tiplication inducing a line broadening of 2 Hz. The curvefitting was carried out in accordance with a Lorentzianmathematical model using Perch Software (Perch NMRSoftware, University of Kuopio, Finland).
Isotopic dataIsotope 13C/12C ratios were calculated from processedspectra essentially as described previously (Silvestre et al.2009). Briefly, the positional isotopic distribution in a mol-ecule was obtained from the 13C mole fractions fi (where istands for the C-atom position considered) as follows:fi = Si/Stot, where Si is the 13C-signal (i.e. the area under thepeak associated with the C-atom position i) and Stot is thesum of all 13C-signals of the molecule. Each Si had to becorrected to compensate for the slight loss of intensitycaused by satellites (13C–13C scalar couplings) by multiply-ing by (1 + n ¥ 0.011), where n is the number of carbonatoms directly attached to the C-atom position i and 1.1%(=0.011) is the average natural 13C-abundance [see Tenail-leau et al. (2004) and Silvestre et al. (2009) for a detailedexplanation]. If Fi denotes the statistical mole fraction(homogeneous 13C-distribution) at any C-atom position i,then the site-specific relative deviation in the 13C-abundance is di = fi /Fi - 1. The values of di were convertedto d13C (‰) using the isotope composition of the wholemolecule (d13Cg) obtained by isotope-ratio mass spectrom-etry (IRMS). That is, the site-specific deviations wereexpressed as d13Ci for each C-atom position of the mol-ecule (Silvestre et al. 2009).
Performance of isotopic 13C NMR to measurethe site-specific d13C in ethanolThe use of the NMR technique to obtain the site-specificd13C values has been described in detail elsewhere (Caytan
1106 A. Gilbert et al.
© 2011 Blackwell Publishing Ltd, Plant, Cell and Environment, 34, 1104–1112

et al. 2007; Tenailleau & Akoka 2007; Silvestre et al. 2009).To ensure the validity of the data obtained here, instrumen-tal repeatability was checked by measuring the d13C valueson a reference ethanol sample (commercial source). Thestandard deviation over 38 measurements was low (0.2‰)with an SNR of 2500. This precision is suitable for theintended purpose. Furthermore, this reference sample wasanalysed in each series of acquisitions so as to check thereliability of measurements.Tests were also carried out witha varying water content (0% to 60%) and it was found thatthe d13C values were independent of the amount of waterpresent when SNR was similar, confirming that water mol-ecules (usually in a very low amount in the sample) didnot influence measurements between samples. An inter-laboratory comparison performed at both partner’s labora-tories (Nantes, France; Ispra, Italy) was carried out andshowed repeatability of measurements within a standarddeviation of 0.2‰.
13C EA-IRMS
Global 13C abundance (d13Cg) in alcohols was determinedby encapsulation and measurement by EA-IRMS with anEA Flash HT coupled with a Delta-V Advantage spectrom-eter (ThermoFinnigan, Courtaboeuf, France) equipped witha Porapack Q column. About 1 mL of ethanol was sealed ina tin capsule and the d13C determined by reference to aworking standard of glutamic acid standardised against cali-brated international reference material (NBS-22, IAEA-CH-6, IAEA-CH-7). The results are expressed relative tothe international V-PDB reference: d13C = (R - Rst)/Rst
where 13C/12C for Rst = 0.0112372 is the ratio in the Pee Deereference.
18O IRMS
The 18O/16O isotope ratios of wine water were measuredaccording to the official method of the InternationalOrganisation of Vine and Wine (Compendium of Interna-tional Methods of Wine and Must Analysis, MA-E-AS2-09-MOUO18, vol 1, section 2, 2006). The principle of themethod is based on the isotopic equilibration of carbondioxide with water as originally developed by Epstein &Mayeda (1953). d18O values of meteoric water wereobtained from the IAEA 18O-databank (http://www-naweb.iaea.org/napc/ih/IHS_resources_isohis.html), usinglocations that are as close as possible to wine-samplinglocations.
RESULTS13C Isotopic fractionation associated with sugarfermentation
The precision of the technique was estimated by repeat-ability tests. The repeatability was determined for d13Ci
measured on a reference ethanol sample by isotopic 13CNMR [standard deviation (SD) = 0.2‰; n = 38]. The
repeatability associated with the fermentation processitself was estimated using five fermentations of the sameglucose batch. The standard deviation was 0.3‰, indicatingthat the fermentation process per se did not cause anyfurther disparity in the d13Ci values. Identical repeatabilitytests with fructose and sucrose gave essentially the sameresults.
In order to assess the use of ethanol as a molecular probefor source glucose, the isotopic correlation between sugarsand ethanol had to be clearly established. For this purpose,ethanol obtained by fermentation of a glucose sample ofknown d13Ci pattern was analyzed using 13C NMR. Theresults are presented in Table 1, together with the theoreti-cal pattern obtained by calculating the average d13Ci ofC-1 + C-6 of glucose for the methyl site (CH3) and ofC-2 + C-5 for the methylene site (CH2OH). No significantdifference between the experimental and calculated isoto-pic compositions is found, confirming that the carbon atomsin the source glucose are converted to ethanol without iso-topic fractionation.
d13C-difference between methylene-C andmethyl-C positions in ethanol from wine
The site-specific isotope composition of carbon atoms inethanol from several European wines is shown in Fig. 2.There was a clear isotopic offset seen between methylene(relatively 13C-enriched) and methyl (relatively 13C-depleted) carbons. Furthermore, the difference (Dd13C =d13Cmethylene - d13Cmethyl) was not constant and fell between 2and 5‰, the divergence tending to be greater when thed13Cg (global 13C content of the whole molecule, obtained byIRMS) values were more positive, that is, when the ethanolwas 13C-enriched (Fig. 2b). The relationship between thed13Ci values in the methyl and methylene carbons waslinear, with a slope of around 0.5, suggesting that the isotopefractionation associated with metabolism was differentin the two C-atom position. It is apparent that the 13C-enrichment in ethanol (d13Cg, x-axis in Fig. 2b) is primarilycaused by the d13Cmethylene, the d13Cmethyl being always rela-tively carbon-13 depleted.
Table 1. d13C values (‰) � SD of methylene (CH2OH) andmethyl (CH3) carbon sites of ethanol obtained experimentallyfrom the fermentation of a glucose of known d13Ci values andcalculated from the d13Ci values of starting glucose
Ethanol Glucose
CH2OH -12.0 � 0.3a Average (C-2 + C-5) -12.0 � 1.1b
CH3 -10.2 � 0.3a Average (C-1 + C-6) -10.8 � 1.1b
aStandard deviations (SDs) have been determined from five mea-surements for ethanol fermentation.bStandard deviation (SDs) from combined variance contributed bythe two given carbon sites from eight measurements for glucose[see Gilbert et al. 2009].
Environmental impact on the intramolecular 13C distribution in glucose 1107
© 2011 Blackwell Publishing Ltd, Plant, Cell and Environment, 34, 1104–1112
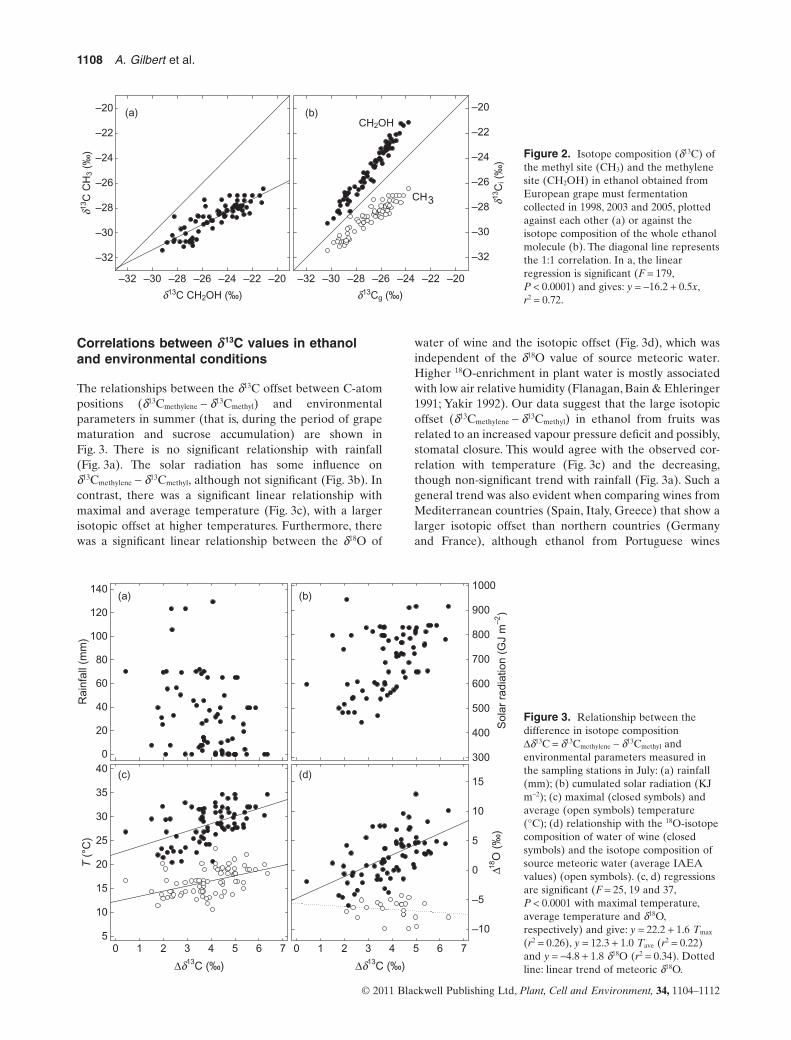
Correlations between d13C values in ethanoland environmental conditions
The relationships between the d13C offset between C-atompositions (d13Cmethylene - d13Cmethyl) and environmentalparameters in summer (that is, during the period of grapematuration and sucrose accumulation) are shown inFig. 3. There is no significant relationship with rainfall(Fig. 3a). The solar radiation has some influence ond13Cmethylene - d13Cmethyl, although not significant (Fig. 3b). Incontrast, there was a significant linear relationship withmaximal and average temperature (Fig. 3c), with a largerisotopic offset at higher temperatures. Furthermore, therewas a significant linear relationship between the d18O of
water of wine and the isotopic offset (Fig. 3d), which wasindependent of the d18O value of source meteoric water.Higher 18O-enrichment in plant water is mostly associatedwith low air relative humidity (Flanagan, Bain & Ehleringer1991; Yakir 1992). Our data suggest that the large isotopicoffset (d13Cmethylene - d13Cmethyl) in ethanol from fruits wasrelated to an increased vapour pressure deficit and possibly,stomatal closure. This would agree with the observed cor-relation with temperature (Fig. 3c) and the decreasing,though non-significant trend with rainfall (Fig. 3a). Such ageneral trend was also evident when comparing wines fromMediterranean countries (Spain, Italy, Greece) that show alarger isotopic offset than northern countries (Germanyand France), although ethanol from Portuguese wines
Figure 2. Isotope composition (d13C) ofthe methyl site (CH3) and the methylenesite (CH2OH) in ethanol obtained fromEuropean grape must fermentationcollected in 1998, 2003 and 2005, plottedagainst each other (a) or against theisotope composition of the whole ethanolmolecule (b). The diagonal line representsthe 1:1 correlation. In a, the linearregression is significant (F = 179,P < 0.0001) and gives: y = -16.2 + 0.5x,r2 = 0.72.d13C CH2OH (‰)
d13C
CH
3 (‰
)
–32
–30
–28
–26
–24
–22
–20
–32 –30 –28 –26 –24 –22 –20 –32 –30 –28 –26 –24 –22 –20
d13Cg (‰)
d13C
i (‰
)
–32
–30
–28
–26
–24
–22
–20
CH2OH
CH3
(a) (b)
Figure 3. Relationship between thedifference in isotope compositionDd13C = d13Cmethylene - d13Cmethyl andenvironmental parameters measured inthe sampling stations in July: (a) rainfall(mm); (b) cumulated solar radiation (KJm-2); (c) maximal (closed symbols) andaverage (open symbols) temperature(°C); (d) relationship with the 18O-isotopecomposition of water of wine (closedsymbols) and the isotope composition ofsource meteoric water (average IAEAvalues) (open symbols). (c, d) regressionsare significant (F = 25, 19 and 37,P < 0.0001 with maximal temperature,average temperature and d18O,respectively) and give: y = 22.2 + 1.6 Tmax
(r2 = 0.26), y = 12.3 + 1.0 Tave (r2 = 0.22)and y = -4.8 + 1.8 d18O (r2 = 0.34). Dottedline: linear trend of meteoric d18O.Δd13C (‰)
0 1 2 3 4 5 6 7
T (
°C)
5
10
15
20
25
30
35
40
Δd13C (‰)
0 1 2 3 4 5 6 7
Δ18O
(‰
)
–10
–5
0
5
10
15
Rai
nfal
l (m
m)
0
20
40
60
80
100
120
140
Sol
ar r
adia
tion
(GJ
m–2
)
300
400
500
600
700
800
900
1000(a) (b)
(c) (d)
1108 A. Gilbert et al.
© 2011 Blackwell Publishing Ltd, Plant, Cell and Environment, 34, 1104–1112

showed intermediate values (Supporting InformationTable S1).
d13C values in ethanol andphotosynthetic pathways
Pure sugars and fruit juices from C3, C4 and CAM plants(see Supporting Information Table S2) were fermented andthe ethanol produced was recovered by distillation. Ethanolfrom liquors (tequila, rum, beer) was similarly distilled foranalysis. The results are shown in Fig. 4. In addition to theoverall relative 13C-enrichment in ethanol associated withC4 and CAM plants (-22 to -32‰ in C3 compared with -9 to-13‰ in C4 and CAM, Supporting Information Table S2), asubstantial isotopic offset between the methylene-C andmethyl-C (d13Cmethylene - d13Cmethyl) is observed in the major-ity of cases. In ethanol produced from C3 sugars themethyl-C is always ca. 2‰ 13C-depleted compared with themethylene-C. The same trend is observed in CAM plants(pineapple juice, tequila from Agave), with a much largerisotopic difference of ca. 10‰. By contrast, the methylene-Cis relatively 13C-depleted in ethanol of C4 origin, by ca. 1‰.In all cases, the isotopic difference between C-atoms is sig-nificant (significant difference from zero, P < 0.01).
DISCUSSION
Is ethanol a reliable probe for theintramolecular 13C-distribution insource glucose?
In the present study, glucose was fermented by yeasts (Sac-charomyces sp.) in anaerobic conditions to form ethanol.The consumption of glucose was �99% as indicated bythe measurement of remaining glucose (see Material and
Methods). Therefore, by mass-balance, the 13C-content ofthe fermented substrate (glucose) must have been retainedin the products, ethanol + CO2 (Fig. 1), provided the accu-mulation of other products (e.g. glycerol) was negligible.These were the conditions used here. Thus, we show asimilar intramolecular isotopic composition in pure C4
glucose (Gilbert et al. 2009) and in ethanol derived there-from (present study): the average d13C in C-1 + C-6 posi-tions in glucose equalled the d13C in the methyl-C of ethanoland the average d13C of C-2 + C-5 positions equalled thed13C in the methylene-C of ethanol (Table 1). This agreeswith previous data that indicated that the d13C in ethanoland CO2 correlated well with that in source glucose (Weberet al. 1997). We recognize that some isotope fractionationmight have occurred due to the formation of glycerol.However, with the yeast strains used in the present studyand in the wine samples analysed, glycerol was present atonly a few percent of the ethanol content (data not shown).Therefore, we argue that no isotope fractionation was asso-ciated with ethanol production from glucose.
The metabolic origin of the intramolecular13C-patterns in ethanol
In all ethanol samples of C3 origin, the methylene-C(CH2OH) was relatively enriched compared with themethyl-C (CH3). This was apparent both for a large set ofvalues for ethanol produced from grape (Fig. 2) – for whichan isotopic difference of up to 6‰ (Fig. 2b) was observed –and for a range of other C3 plants (Fig. 4 and SupportingInformation Table S2). Such a difference matched thenatural 13C-distribution measured in glucose (Rossmannet al. 1991; Gilbert et al. 2009), in which the average ofC-1 + C-6 positions are 13C-depleted by ca. 3‰ comparedwith the average of C-2 + C-5 positions (see Fig. 1). Such a13C-pattern within the glucose molecule is believed to origi-nate (at least partly) from the isotope effect against 12Cassociated with aldolase in C-2 predicted by Tcherkez et al.(2004) during the production of fructose-1,6-bisphosphatefrom triose phosphates (Fig. 5). Other authors have sug-gested a possible role of photorespiration (Hobbie &Werner 2004; Ivlev 2004). While increasing photorespira-tion rates are predicted to cause a general 13C-enrichmenton the whole glucose molecule, a slight isotopic divergencebetween C-1/C-6 and C-2/C-5 atom positions, as observedin this study, has further been predicted from the model ofTcherkez et al. (2004) based on metabolic pathways consid-ered in the steady-state.This simply came from the fact thatthe mathematical expression of the 13C/12C isotope ratio inC-2 of triose phosphates involved the oxygenation-to-carboxylation rate (denoted as F) in a numerically highercoefficient (denoted as e’ in that study) than that in the C-3position (denoted as e). Furthermore, photorespiration isassociated with the loss of 13C-depleted CO2 [decarboxy-lated CO2 depleted by about 20‰ compared with C-1 inglycine (Tcherkez 2006)], which originates from the C-2atom of ribulose-1,5-bisphosphate (RuBP), that is in turn atthe origin of the C-2 atom in fructose and glucose (Fig. 5).
d13C (‰)
–35 –30 –25 –20 –15 –10 –5
CH3
CH2OH
Ethanol
CH3
CH2OH
Ethanol
CH3
CH2OH
Ethanol
CAM
C4
C3
Figure 4. Carbon isotope composition (d13C) of ethanol andspecific atom positions (methylene and methyl) in ethanol of C3,C4 and CAM origins (see Supporting Information Table S2 fordetailed results and origins), represented as whisker boxes(medium line: median value).
Environmental impact on the intramolecular 13C distribution in glucose 1109
© 2011 Blackwell Publishing Ltd, Plant, Cell and Environment, 34, 1104–1112

Photorespiration could thus cause a 13C-enrichment thatmight be captured in the C-2 position of glucose (althoughthe whole glucose molecule tends to be 13C-enriched due tophotorespiratory recycling). However, this effect was hardlyvisible in the calculations of Tcherkez et al. (2004) and soother C-atom redistribution effects may further explain therelative enrichment of C-2/C-5 in glucose.
Still, the involvement of photorespiration would beconsistent with the increased isotopic difference betweenmethylene-C and methyl-C in C3-sugar-derived ethanolwhen environmental conditions promote stomatal closure(Fig. 3) and so lower ci/ca ratios (Eqn 1), as suggested by theincreasing (less negative) d13C of whole ethanol (Fig. 2). Infact, stomatal closure may induce a larger photorespirationrate, that is, a higher CO2-loss from glycine, thereby enhanc-ing the enrichment of the C-2 atom in RuBP.
This interpretation would also be consistent with theabsence of relative 13C-depletion in the methyl-C inC4 plants (Fig. 4), which are known to have very low
photorespiration rates. This markedly different intramo-lecular pattern in C4 ethanol has already been observedusing degradation prior to IRMS or using 13C NMR (Ross-mann & Schmidt 1989; Caer et al. 1991; Caytan et al. 2007)and a role for photorespiration, or the lack thereof, has beensuggested (Hobbie & Werner 2004). That said, the intramo-lecular 13C-pattern in glucose of C4 origin seems to differsomewhat from that in C3 plants: while Rossmann et al.(1991) found a quite similar 13C-distribution in glucose frommaize grains, Gilbert et al. (2009) found a consistent 13C-enrichment in C-1 compared with C-2 and in C-6 comparedwith C-5, by ca. 2‰. The reasons for such a positionalenrichment remain unclear but can be presumed to relateto other as-yet-undefined isotope effects that occur down-stream of photosynthesis (see the following discussion).
In ethanol produced from CAM plants, the relative 13C-depletion in the methyl group is much larger than in C3
plants, with an isotopic offset of up to 13‰ betweenmethyl-C and methylene-C positions. Both the magnitude
Figure 5. Simplified scheme showing the metabolic pathway associated with photosynthesis. The C-2 atom position inribulose-1,5-bisphosphate is labelled with a star (*) so as to follow its fate in subsequent metabolites, particularly in C-2 and C-5 offructose-1,6-bisphosphate. Ordinary stars refer to carboxylation and circled stars refer to oxygenation photorespiratory recycling. Theredistribution of the C-atom associated with photorespiratory recovery of serine is not represented here. The symbol ‘P’ stands for thephosphate group. The isotope fractionation involving the C-atom of interest and associated with photorespiratory CO2 liberation fromglycine (20‰, calculated by Tcherkez 2006) and aldolization (probably near -1.2‰, calculated by Tcherkez et al. 2004) is also indicated.Positive fractionation values indicate discrimination against 13C in‰. RuBP, ribulose-1,5-bisphosphate; FBP, fructose-1,6-bisphosphate;GAP, 3-phosphoglyceraldehyde; DHAP, dihydroxyacetone phosphate.
1110 A. Gilbert et al.
© 2011 Blackwell Publishing Ltd, Plant, Cell and Environment, 34, 1104–1112

of this offset and the fact that there is only modest photo-respiratory activity in CAM plants makes it necessary toseek alternative explanations to those given for the C3
metabolism. As the offset is too large (10–13‰) to becaused only by aldolase in C-2 (ca. -1‰), the involvementof one or more other metabolic mechanism is likely. Inter-estingly, CAM plants are known to engage in gluconeogen-esis, that is, the production of glucose from oxaloacetate orpyruvate (Holtum & Osmond 1981). In Ananas, oxaloac-etate is converted to phosphoenolpyruvate by phospho-enolpyruvate carboxykinase (Dittrich, Campbell & Black1973) and in Agave, phosphoenolpyruvate is regeneratedfrom pyruvate by pyruvate-Pi dikinase (Christopher &Holtum 1996). Such biochemical reactions probably have astrong effect on the intramolecular d13C in phospho-enolpyruvate and therefore in gluconeogenic glucose. Nev-ertheless, the associated isotope effects are not known.The malic enzyme, that catalyzes a reaction similar to thatof phosphoenolpyruvate carboxykinase (that is, convertsmalate to pyruvate and CO2), is associated with an isotopefractionation of 21 and -13‰ in C-3 and C-2 of pyruvate,respectively, in the chicken enzyme (Edens, Urbauer &Cleland 1997). In other words, the inverse isotope effect inC-2 (that favours 13C) and the normal isotope effect in C-3(against 13C) act conjointly to increase the isotopic offsetbetween the ketone-C and the methyl-C in pyruvate. Wecan therefore hypothesise that similar positional isotopefractionations are associated with the enzymes that regen-erate phosphoenolpyruvate in CAM plants through gluco-neogenesis, and that such fractionation may be responsiblefor the strong intramolecular d13C-offset observed inethanol.
To date, all the investigations of the isotope distributionin ethanol relative to source glucose have involved sub-strate obtained from sink tissues (maize grains in Rossmannet al. 1991; here beet root, cane stems, etc.) and therefore,post-photosynthetic isotope effects may be involvedin the 13C-patterns observed. For example, the isotopeeffect associated with invertase, that cleaves sucrose intoglucose + fructose, may change the 13C-distribution in fruc-tose (Mauve et al. 2009) and, similarly, glucose-6-phosphateisomerase may influence the 13C-distribution in bothglucose and fructose. Currently, such post-photosyntheticenzymatic isotope effects are not well documented and theywill be addressed in a subsequent paper.
REFERENCES
Abelson P.H. & Hoering T.H. (1961) Carbon isotope fractionationin formation of amino acids by photosynthetic organisms. Pro-ceedings of the National Academy of the United States of America47, 623–632.
Barbour M.M. & Hanson D.T. (2009) Stable carbon isotopes revealdynamics of respiratory metabolism. The New Phytologist 181,243–245.
Botosoa E.P., Caytan E., Silvestre V., Robins R.J., Akoka S. &Remaud G.S. (2008) Unexpected fractionation in site-specific13C isotopic distribution detected by quantitative 13C NMR at
natural abundance. Journal of the American Chemical Society130, 414–415.
Brugnoli E. & Farquhar G.D. (2000) Photosynthetic fractionationof carbon isotopes. In Photosynthesis: Physiology and Metabo-lism (eds R.C. Leegood, T.D. Sharkey & S. von Caemmerer), pp.399–434. Kluwer Academic Publishers, The Netherlands.
Caer V., Trierweiler M., Martin G.J. & Martin M.L. (1991) Deter-mination of site-specific carbon isotope ratios at natural abun-dance by carbon-13 nuclear magnetic resonance spectroscopy.Analytical Chemistry 63, 2306–2313.
Calderone G. & Guillou C. (2008) Analysis of isotopic ratios forthe detection of illegal watering of beverages. Food Chemistry106, 1399–1405.
Caytan E., Botosoa E.P., Silvestre V., Robins R.J., Akoka S. &Remaud G.S. (2007) Accurate quantitative 13C NMR spectros-copy: repeatability over time of site-specific 13C isotope ratiodetermination. Analytical Chemistry 79, 8266–8269.
Christopher J.T. & Holtum J.A.M. (1996) Patterns of carbon par-titioning in leaves of crassulacean acid metabolism speciesduring deacidification. Plant Physiology 112, 393–399.
Dittrich P., Campbell W.H. & Black C.C. Jr (1973) Phospho-enolpyruvate carboxykinase in plants exhibiting crassulaceanacid metabolism. Plant Physiology 52, 357–361.
Duranceau M., Ghashghaie J., Badeck F., Deleens E. & Cornic G.(1999) d13C of CO2 respired in the dark in relation to d13C of leafcarbohydrates in Phaseolus vulgaris L. under progressivedrought. Plant, Cell & Environment 22, 515–523.
Edens W.A., Urbauer J.L. & Cleland W.W. (1997) Determinationof the chemical mechanism of malic enzyme by isotope effects.Biochemistry 36, 1141–1147.
Epstein S. & Mayeda T. (1953) Variation of 18O content of watersfrom natural sources. Geochimica et Cosmochimica Acta 4, 213–224.
Farquhar G.D., O’Leary M.H. & Berry J.A. (1982) On the relation-ship between carbon isotope discrimination and the intercellularcarbon dioxide concentration in leaves. Australian Journal ofPlant Physiology 9, 121–137.
Farquhar G.D., Ehleringer J.R. & Hubick K.T. (1989)Carbon isotope discrimination and photosynthesis. AnnualReview of Plant Physiology and Plant Molecular Biology 40,503–537.
Flanagan L.B., Bain J.F. & Ehleringer J.R. (1991) Stable oxygenand hydrogen isotope composition of leaf water in C3 and C4
plant species under field conditions. Oecologia 88, 394–400.Ghashghaie J., Badeck F.-W., Lanigan G., Nogués S., Tcherkez G.,
Deléens E., Cornic G. & Griffiths H. (2003) Carbon isotopefractionation during dark respiration and photorespiration in C3plants. Phytochemistry Reviews 2, 145–161.
Gilbert A., Silvestre V., Robins R.J. & Remaud G.S. (2009) Accu-rate quantitative isotopic 13C NMR spectroscopy for the deter-mination of the intramolecular distribution of 13C in glucose atnatural abundance. Analytical Chemistry 81, 8978–8985.
Gleixner G. & Schmidt H.-L. (1997) Carbon isotope effects on thefructose-1,6-bisphosphate aldolase reaction: origin for non-statistical 13C distribution in carbohydrates. Journal of BiologicalChemistry 272, 5382–5387.
Hobbie E.A. & Werner R.A. (2004) Intramolecular, compound-specific, and bulk carbon isotope patterns in C3 and C4 plants: areview and synthesis. The New Phytologist 161, 371–385.
Holtum J.A.M. & Osmond C.B. (1981) The gluconeogenic metabo-lism of pyruvate during deacidification in plants with crassu-lacean acid metabolism. Australian Journal of Plant Physiology8, 31–44.
Ivlev A. (2004) Contribution of photorespiration to changes ofcarbon isotope characteristics in plants affected by stress factors.Russian Journal of Plant Physiology 51, 271–280.
Environmental impact on the intramolecular 13C distribution in glucose 1111
© 2011 Blackwell Publishing Ltd, Plant, Cell and Environment, 34, 1104–1112

Mauve C., Bleton J., Bathellier C., Lelarge-Trouverie C., GuérardF., Ghashghaie J., Tchapla A. & Tcherkez G. (2009) Kinetic12C/13C isotope fractionation by invertase: evidence for a small invitro isotope effect and comparison of two techniques for theisotopic analysis of carbohydrates. Rapid Communications inMass Spectrometry 23, 2499–2506.
Moussa I., Naulet N., Martin M. & Martin G. (1990) A site-specificand multi-element approach of liquid-vapor isotope fraction-ation parameters: the case of alcohols. Journal of PhysicalChemistry 94, 8303–8309.
Park R. & Epstein S. (1961) Metabolic fractionation of 13C & 12C inplants. Plant Physiology 36, 133–138.
Roeske C. & O’Leary M.H. (1984) Carbon isotope effects onenzyme-catalyzed carboxylation of ribulose bisphosphate. Bio-chemistry 23, 6275–6284.
Rossmann A. & Schmidt H.-L. (1989) Nachweis der Herkunft vonEthanol und der Zuckerung von Wein durch positionelleWasserstoff- und Kohlenstoff-Isotopenverhältnis-Messung.Zeitschrift für Lebensmitteluntersuchung und Forschung A 188,434–438.
Rossmann A., Butzenlechner M. & Schmidt H.L. (1991) Evidencefor a nonstatistical carbon isotope distribution in naturalglucose. Plant Physiology 96, 609–614.
Schmidt H.-L. (2003) Fundamentals and systematics of thenon-statistical distribution of isotopes in natural compounds.Naturwissenschaften 90, 537–552.
Schmidt H.-L., Kexel H., Butzenlechner M., Schwarz S., GleixnerG., Thimet S., Werner R. & Gensler M. (1995) Non-statisticalisotopic distribution in natural compounds: mirror of their bio-synthesis and key for their origin assignment. In Stable Isotope inthe Biosphere (eds E. Wada, T. Yoneyama, M. Minagawa, T.Ando & B.D. Fry), pp. 17–35. Kyoto University Press, Kyoto,Japan.
Scrimgeour C.M., Bennet W.M. & Connacher A.A. (1988) A con-venient method of screening glucose for 13C/12C ratio for use instable isotope tracer studies. Biological Mass Spectrometry 17,265–266.
Silvestre V., Maroga Mboula V., Jouitteau C., Akoka S., Robins R.J.& Remaud G.S. (2009) Isotopic 13C-NMR spectrometry to assesscounterfeiting of active pharmaceutical ingredients: site-specific13C content of aspirin and paracetamol. Journal of Pharmaceuti-cal and Biomedical Analysis 50, 336–341.
Tcherkez G. (2006) How large is the carbon isotope fractionationof the photorespiratory enzyme glycine decarboxylase? Func-tional Plant Biology 33, 911–920.
Tcherkez G., Nogues S., Bleton J., Cornic G., Badeck F. & Ghash-ghaie J. (2003) Metabolic origin of carbon isotope compositionof leaf dark-respired CO2 in French bean. Plant Physiology 131,237–244.
Tcherkez G., Farquhar G., Beadeck F. & Ghashghaie J. (2004)Theoretical considerations about carbon isotope distribution inglucose of C3 plants. Functional Plant Biology 31, 857–877.
Tcherkez G., Schäufele R., Nogués S., et al. (2010) On the 13C/12Cisotopic signal of day and night respiration at the mesocosmlevel. Plant, Cell & Environment 33, 900–913.
Tenailleau E. & Akoka S. (2007) Adiabatic 1H decoupling schemefor very accurate intensity measurements in 13C-NMR. Journalof Magnetic Resonance 185, 50–58.
Tenailleau E., Lancelin P., Robins R. & Akoka S. (2004) NovelNMR approach to the quantification of non-statistical 13C distri-bution in natural products: the case of vanillin. Analytical Chem-istry 76, 3818–3825.
Troughton J.H., Card K.A. & Hendy C.H. (1974) Photosyntheticpathways and carbon isotope discrimination by plants. CarnegieInstitute of Washington Yearbook 73, 768–780.
Weber D., Kexel H. & Schmidt H.L. (1997) 13C-pattern of naturalglycerol: origin and practical importance. Journal of Agriculturaland Food Chemistry 45, 2042–2046.
Winkler F., Wirth E., Latzko E., Schmidt H.-L., Hoppe W. &Wimmer P. (1978) Influence of growth conditions and develop-ment on d13C values in different organs and constituents ofwheat, oat and maize. Zeitschrift fûr Pflanzenphysiologie 87,255–263.
Winkler F., Kexel H., Kranz C. & Schmidt H.-L. (1982) Parametersaffecting the 13CO2/12CO2 isotope distribution of the ribulose-1,5-bisphosphate carboxylase reaction. In Stable Isotopes (edsH.-L. Schmidt, H. Förstel & K. Heinzinger), pp. 83–89. Elsevier,Amsterdam, The Netherlands.
Winkler F., Schmidt H.-L., Wirth E., Latzko E., Lenhard B. &Ziegler H. (1983) Temperature, pH and enzyme source depen-dence of the HCO3
--carbon isotope effect on the phospho-enolpyruvate carboxylase reaction. Physiologie Végétale 21, 889–895.
Yakir D. (1992) Variations in the natural abundance of oxygen-18and deuterium in plant carbohydrates. Plant, Cell & Environ-ment 15, 1005–1020.
Received 4 November 2010; received in revised form 25 February2011; accepted for publication 8 March 2011
SUPPORTING INFORMATION
Additional Supporting Information may be found in theonline version of this article:
Table S1. Mean 13C isotopic deviation of the methylene site(dCH2OH) and the methyl site (dCH3), differences betweenthe two sites (Dd = dCH2OH - dCH3) and global isotopedeviation (d13Cg) of ethanol from grape vines from differentEuropean countries collected in 1998. Mean is calculatedover n samples for each origin. Standard deviations fromthe mean values are given in italics.Table S2. The isotope composition of the methylene site(dCH2OH), methyl site (dCH3) and the difference betweenthe two sites (Dd = dCH2OH - dCH3) in ethanol from dif-ferent origins.
Please note: Wiley-Blackwell are not responsible for thecontent or functionality of any supporting materials sup-plied by the authors. Any queries (other than missing mate-rial) should be directed to the corresponding author for thearticle.
1112 A. Gilbert et al.
© 2011 Blackwell Publishing Ltd, Plant, Cell and Environment, 34, 1104–1112