the interpublic group of companies -...
TRANSCRIPT

TH
E IN
TE
RP
UB
LIC
GR
OU
P O
F C
OM
PA
NIE
S 2
005 A
NN
UA
L R
EP
OR
T
THEINTERPUBLIC
GROUPOF
COMPANIES
2 0 0 5 A N N U A L R E P O R T
Y18078_Covers 4/27/06 1:17 Page OFC1

A LETTER FROM THE CHAIRMAN
TO OUR SHAREHOLDERS:
There is no doubt that 2005 was a challenging year for our external audit activity. This, in turn, led to the restatement we
company. announced in September. Our review was also notable in that
It was also a year in which we set and accomplished a it reconciled the company’s past practices with the require-
number of important goals — such as aggressively addressing ments faced today by a major, publicly traded multinational.
financial controls, as well as shoring up our talent base, across The new level of transparency to which we have committed
most all of our major operating units. We believe that our is appropriate so that investors can have confidence in our
success in these key areas, along with our ability to harness the results going forward. The changes we are making will also
power of our agency brands, will set the stage for a period of allow you to better understand our company, track our per-
stabilization in 2006 and the achievement of our turnaround formance and measure progress against our stated objectives.
by 2008. As was apparent from our 2005 results, we remain a work in
In January of last year, shortly after our Board of Directors progress.
mandated a new management team for the company, we
alerted the market to the extent of material weaknesses in our 2005 RESULTScompany’s internal controls. At that time, we were clear that Revenue for the year decreased 1.8% to $6.27 billion. Organicour top priority would be to come to grips with the shortcom- revenue performance was down 0.7%, with a marginal drop inings in our financial systems. This was a necessary step, not the United States and poor performance in continental Europeonly to ensure the integrity of our financial results, but offset by strength in Latin America and the United Kingdom.ultimately to break a recurring cycle of accounting errors that Net divestitures had a negative impact of 1.7% on comparativehave hampered our company for the past few years. year-to-year reported revenue results. This year, we will con-
I firmly believe that an incremental approach is not ade- tinue to divest a number of businesses that are non-strategic,quate to addressing such issues. We therefore undertook a chronically unprofitable or would never be Sarbanes-Oxleycomprehensive review process during much of the year, which compliant at reasonable cost. The impact of these divestitures,saw us significantly expand internal management work and coupled with the effect of accounts lost during 2005, results in
T H E I N T E R P U B L I C G R O U P O F C O M PA N I E S 2 0 0 5 A N N UA L R E P O RT 1

our estimate that the company entered 2006 with a revenue needed new talent to bring a spark, or new direction, to
base of approximately $5.9 billion. troubled operations.
Salary and related expense increased 7.1% in 2005, to This is why the second key priority I set for the organiza-
$4.0 billion. This reflects higher severance associated with tion last year was to significantly upgrade both strength and
streamlining certain operations and upgrading talent, the depth at the top levels of our operating units and at corporate.
global hiring of finance staff to address weaknesses in the Although this also required investment, as apparent in our
accounting and control environment, as well as increased high severance costs, I am pleased to say that improving our
headcount at certain units to support new business. Total talent base is another area in which we made substantial
severance for the full-year 2005 was $162.5 million, compared progress in 2005.
to $74.6 million in 2004. There is a newly-configured senior management team at the
Office and general expense also rose, to $2.3 billion, a 1.7% corporate center. We made major upgrades across McCann
increase compared to the previous year. Adjusted for currency and at its marketing services companies. We also have new
and the net effect of divestitures, office and general expenses senior leadership at our media operations, as well as through-
increased 5.0%, reflecting a significant increase in professional out fcb and Lowe. All of these are key investments in our
fees related to the restatement process and Sarbanes-Oxley brands and, ultimately, in our ability to grow the top line of
compliance efforts. Professional fees in 2005 totaled our business — which will be vital for us to achieve our
$332.8 million, compared to $238.0 million the previous year. turnaround.
The effect of a challenged revenue line and extremely high Early returns on these investments have been encouraging.
transitional expenses was evident in our operating results. As previously indicated, we enter 2006 working against a
Full-year operating loss was $104.2 million, compared to a loss headwind from past client losses. But recent developments
of $94.4 million in 2004. Net loss narrowed, from $558.2 mil- demonstrate that we are very much back in the game when it
lion, or ($1.34) per diluted share a year ago, to $289.2 million, comes to pursuing and winning business, from both existing
or ($0.68) per share, for 2005. and new clients. The success our agency brands continue to
have in the marketplace is testament to the strength of the
management teams we now have in place at these operatingINVESTING IN OUR FUTUREunits. It also speaks to their ability to put together the rightThe costs associated with our accounting review and withcombination of talent, capabilities, strategic insight and crea-putting quality financial management into place within manytivity so as to deliver results for clients — and for Interpublic.of our companies were significant. But, 2005 also saw us
significantly strengthen our finance teams and processes, at the
corporate level and within our operating units. LOOKING FORWARDWe made major progress in moving from a diffuse, opaque During 2005, we made significant progress in clearing away
organization to one that is more cohesive and fully transpar- historical problems and laying a solid foundation for future
ent. The time and costs involved were undeniably large, but we growth.
are a better company for it. We successfully got up-to-date with our financial filings and
Another equally vital investment took place on the talent improved both our financial leadership and reporting
front. Ours has always been an industry in which talent is a key processes. We stayed true to our conservative approach to
differentiator. As the media and marketing landscape becomes financial management, which is appropriate given the early
more complex and cluttered every day, creativity and innova- stage at which we find ourselves in our recovery. We continued
tion are becoming even more important. Yet the acquisition to attract top talent into the company, across many of our
strategy that Interpublic pursued in the late 1990s and the operating units. And we have a new management team at the
period of uncertainty that followed were not conducive to corporate center.
attracting or developing the industry’s best people. At many of This team brings a new commitment to breaking down
our agencies, new talent was required to bring the professional operating silos and adopting an ‘‘open architecture’’ model.
offerings to the level clients demand today. At others, we This will enhance our ability to meet clients’ market-
2 T H E I N T E R P U B L I C G R O U P O F C O M PA N I E S 2 0 0 5 A N N UA L R E P O RT

ing needs by allowing us to use all our resources — regardless marketing agencies and unique offerings in events, sports and
of where they reside within the company — to provide seam- entertainment marketing.
less, integrated business solutions. Our new management is The steps we took last year to place Interpublic on solid
also fully focused on integrity and transparency, which are footing, combined with our strong agency brands and a major
vital for a professional services firm seeking to build more infusion of talent, position us to once again become a recog-
open and higher-value partnerships with clients in a fast- nized leader in marketing services. This, in turn, will allow us
changing consumer and media environment. to convert our renewed competitive vitality into enhanced
As we look forward, we will be working to deliver on what I shareholder value.
call ‘‘the 21st century service contract.’’ Clients are increas- Sincerely,
ingly telling agencies that they must move beyond a business-
as-usual approach to marketing services. That all of our
companies must deliver programs which reach the empowered
consumer, embrace digital forms of communication, quantify
return on investment and share in accountability for results.
For Interpublic, these trends represent a significant oppor-Michael I. Rothtunity. We have all of the assets necessary to win in theChairman and Chief Executive Officerevolving marketplace — including strong global agency net-
works, exceptional public relations, one-to-one and digital
T H E I N T E R P U B L I C G R O U P O F C O M PA N I E S 2 0 0 5 A N N UA L R E P O RT 3

CORPORATE HEADQUARTERS FORM 10-KBOARD OF DIRECTORS EXECUTIVE OFFICERS1114 Avenue of the Americas A copy of the Company’s annualMICHAEL I. ROTHMICHAEL I. ROTH
Chairman & New York, NY 10036 report (Form 10-K) to the Securities(2002) 3Chief Executive Officer (212) 704-1200 and Exchange Commission may beChairman &
obtained without charge by writing to:Chief Executive Officer NICHOLAS J. CAMERATRANSFER AGENT & REGISTRAR Nicholas J. Camera,Senior Vice President,
FRANK J. BORELLI FOR COMMON STOCKGeneral Counsel and Secretary Senior Vice President,(1995) 3 General Counsel & Secretary,
Mellon Investor Services, LLCPresiding Director CHRISTOPHER CARROLL The Interpublic Group ofNewport Office Center VIISenior Advisor, Senior Vice President, Controller Companies, Inc.
Retired Chief Financial 480 Washington Boulevardand Chief Accounting Officer1114 Avenue of the AmericasOfficer & Director, Jersey City, NJ 07310New York, NY 10036Marsh & McLennan ALBERT S. CONTE Stock of The Interpublic Group
Companies, Inc. Senior Vice President, of Companies, Inc., is traded on Exhibits to the annual report will alsoTaxes and General Tax Counsel the New York Stock Exchange be furnished, but will be sent only
REGINALD K. BRACK At February 28, 2006, there were upon payment of the Company’sTHOMAS A. DOWLING(1996) 2, 3, 5 43,701 stockholders of record. reasonable expense in furnishing them.Senior Vice President, Chief RiskFormer Chairman &OfficerChief Executive Officer,
ANNUAL MEETING STOCK OWNER INTERNETTime, Inc. STEPHEN J. GATFIELD ACCOUNT ACCESSExecutive Vice President, The annual meeting will be held on
JILL M. CONSIDINE Network Operations May 25, 2006 at 9:30 am at: Stock owners of record may access(1997) 4, 5 Chief Executive Officer, The McGraw Hill Building their account via the Internet. ByChairman & Lowe Worldwide 1221 Avenue of the Americas accessing their account they may viewChief Executive Officer,
New York, NY 10020 share balances, obtain current marketThe Depository Trust PHILIPPE KRAKOWSKYprice of shares, historical stock prices,& Clearing Corporation Executive Vice President,and the total value of theirStrategy and Corporate Relations AUTOMATIC DIVIDENDinvestment. In addition, they may sellRICHARD A. GOLDSTEIN REINVESTMENT PLANor request issuance of dividend andFRANK MERGENTHALER(2001) 1, 4, 5
Executive Vice President, An Automatic Dividend cash investment plan shares.Chairman & ChiefChief Financial Officer Reinvestment Plan is offered to allExecutive Officer,
For information on how to access thisInternational Flavors & stockholders of record. The Plan,
secure site, please call Mellon InvestorTIMOTHY A. SOMPOLSKIFragrances Inc. which is administered by MellonServices toll free at (800) 522-6645, orExecutive Vice President,
Investor Services, provides a way toChief Human Resources Officer visit www.melloninvestor.com
acquire additional shares ofH. JOHN GREENIAUS(2001) 1, 2, 4 Interpublic Common Stock in a Outside the US, call (201) 680-6578Former Chairman & systematic and convenient manner
For hearing impaired: (800) 231-5469Chief Executive Officer, that affords savings in commissionsNabisco, Inc. for most stockholders. Those
interested in participating in this E-MAIL: [email protected]. PHILLIP SAMPER plan are invited to write for detailsINTERNET: www.melloninvestor.com(1990) 1, 2, 5 and an authorization form to:
Managing Director,Mellon Investor ServicesGabriel Venture Partners
For more information regarding TheAttn: Shareholder Relations
Interpublic Group of Companies, visitP.O. Box 3338DAVID M. THOMAS its Web site at www.interpublic.com.South Hackensack(2004) 1, 5NJ 07606-1917Chairman & Chief
Executive Officer,IMS Health Inc.
(Year Elected)
1 Audit Committee
2 Compensation Committee
3 Executive Policy Committee
4 Finance Committee
5 Corporate Governance Committee
4 T H E I N T E R P U B L I C G R O U P O F C O M PA N I E S 2 0 0 5 A N N UA L R E P O RT

UNITED STATES SECURITIES AND EXCHANGE COMMISSIONWashington, D.C. 20549
Form 10-K
¥ ANNUAL REPORT PURSUANT TO SECTION 13OF THE SECURITIES EXCHANGE ACT OF 1934
For the fiscal year ended December 31, 2005
Commission file number 1-6686
THE INTERPUBLIC GROUP OF COMPANIES, INC.(Exact name of registrant as specified in its charter)
Delaware 13-1024020State or other jurisdiction of (I.R.S. Employerincorporation or organization Identification No.)
1114 Avenue of the Americas, New York, New York 10036(Address of principal executive offices) (Zip Code)
(212) 704-1200(Registrant's telephone number, including area code)
Securities registered pursuant to Section 12(b) of the Act:
Title of Each Class Name of Each Exchange on Which Registered
Common Stock, $0.10 par value New York Stock Exchange
53/8% Series A Mandatory Convertible Preferred Stock, no par New York Stock Exchangevalue
Securities Registered Pursuant to Section 12(g) of the Act: None
Indicate by check mark if the registrant is a well-known seasoned issuer, as defined in Rule 405 of the SecuritiesAct. Yes n No ¥
Indicate by check mark if the registrant is not required to file reports pursuant to Section 13 or Section 15(d) of the
Act. Yes n No ¥
Indicate by check mark whether the registrant (1) has filed all reports required to be filed by Section 13 or 15(d) of theSecurities Exchange Act of 1934 during the preceding 12 months (or for such shorter period that the registrant was requiredto file such reports), and (2) has been subject to the filing requirements for at least the past 90 days. Yes ¥ No n
Indicate by check mark if disclosure of delinquent filers pursuant to Item 405 of Regulation S-K (Û229.405 of thischapter) is not contained herein, and will not be contained, to the best of registrant's knowledge, in definitive proxy orinformation statements incorporated by reference in Part III of this Form 10-K or any amendment to this Form 10-K. n
Indicate by check mark whether the registrant is a large accelerated filer, an accelerated filer, or a non-accelerated filer.See definition of ""accelerated filer and large accelerated filer'' in Rule 12b-2 of the Exchange Act.
Large accelerated filer ¥ Accelerated filer n Non-accelerated filer n
Indicate by check mark whether the registrant is a shell company (as defined in Rule 12b-2 of the ExchangeAct). Yes n No ¥
As of June 30, 2005, the aggregate market value of the shares of registrant's common stock held by non-affiliates was$5,201,493,786. The number of shares of the registrant's common stock outstanding as of February 28, 2006 was 436,029,334.
DOCUMENTS INCORPORATED BY REFERENCE
The following sections of the Proxy Statement for the Annual Meeting of Stockholders to be held on May 25, 2006 areincorporated by reference in Part III: ""Election of Directors,'' ""Corporate Governance Practices and Board Matters,''""Section 16(a) Beneficial Ownership Reporting Compliance,'' ""Compensation of Executive Officers,'' ""Report of theCompensation Committee of the Board of Directors,'' ""Outstanding Shares,'' ""Related Party Transactions'' and ""Appointmentof Independent Auditors.''

TABLE OF CONTENTS
Page
PART I.
Item 1. Business ÏÏÏÏÏÏÏÏÏÏÏÏÏÏÏÏÏÏÏÏÏÏÏÏÏÏÏÏÏÏÏÏÏÏÏÏÏÏÏÏÏÏÏÏÏÏÏÏÏÏÏÏÏÏÏÏÏÏÏÏÏÏÏÏÏÏÏÏÏÏ 1
Item 1A. Risk FactorsÏÏÏÏÏÏÏÏÏÏÏÏÏÏÏÏÏÏÏÏÏÏÏÏÏÏÏÏÏÏÏÏÏÏÏÏÏÏÏÏÏÏÏÏÏÏÏÏÏÏÏÏÏÏÏÏÏÏÏÏÏÏÏÏÏÏÏ 5
Item 1B. Unresolved Staff Comments ÏÏÏÏÏÏÏÏÏÏÏÏÏÏÏÏÏÏÏÏÏÏÏÏÏÏÏÏÏÏÏÏÏÏÏÏÏÏÏÏÏÏÏÏÏÏÏÏÏÏÏÏÏ 9
Item 2. Properties ÏÏÏÏÏÏÏÏÏÏÏÏÏÏÏÏÏÏÏÏÏÏÏÏÏÏÏÏÏÏÏÏÏÏÏÏÏÏÏÏÏÏÏÏÏÏÏÏÏÏÏÏÏÏÏÏÏÏÏÏÏÏÏÏÏÏÏÏÏ 9
Item 3. Legal Proceedings ÏÏÏÏÏÏÏÏÏÏÏÏÏÏÏÏÏÏÏÏÏÏÏÏÏÏÏÏÏÏÏÏÏÏÏÏÏÏÏÏÏÏÏÏÏÏÏÏÏÏÏÏÏÏÏÏÏÏÏÏÏÏ 10
Item 4. Submission of Matters to a Vote of Security Holders ÏÏÏÏÏÏÏÏÏÏÏÏÏÏÏÏÏÏÏÏÏÏÏÏÏÏÏÏÏÏÏÏ 10
PART II.
Item 5. Market for Registrant's Common Equity and Related Stockholder Matters ÏÏÏÏÏÏÏÏÏÏÏÏÏÏ 13
Item 6. Selected Financial Data ÏÏÏÏÏÏÏÏÏÏÏÏÏÏÏÏÏÏÏÏÏÏÏÏÏÏÏÏÏÏÏÏÏÏÏÏÏÏÏÏÏÏÏÏÏÏÏÏÏÏÏÏÏÏÏÏÏ 15
Item 7. Management's Discussion and Analysis of Financial Condition and Results of OperationsÏÏ 17
Item 7A. Quantitative and Qualitative Disclosures About Market Risk ÏÏÏÏÏÏÏÏÏÏÏÏÏÏÏÏÏÏÏÏÏÏÏÏÏÏ 83
Item 8. Financial Statements and Supplementary Data ÏÏÏÏÏÏÏÏÏÏÏÏÏÏÏÏÏÏÏÏÏÏÏÏÏÏÏÏÏÏÏÏÏÏÏÏÏÏ 84
Item 9. Changes in and Disagreements With Accountants on Accounting and Financial Disclosure 173
Item 9A. Controls and ProceduresÏÏÏÏÏÏÏÏÏÏÏÏÏÏÏÏÏÏÏÏÏÏÏÏÏÏÏÏÏÏÏÏÏÏÏÏÏÏÏÏÏÏÏÏÏÏÏÏÏÏÏÏÏÏÏÏÏ 173
Item 9B. Other Information ÏÏÏÏÏÏÏÏÏÏÏÏÏÏÏÏÏÏÏÏÏÏÏÏÏÏÏÏÏÏÏÏÏÏÏÏÏÏÏÏÏÏÏÏÏÏÏÏÏÏÏÏÏÏÏÏÏÏÏÏÏÏ 173
PART III.
Item 10. Directors and Executive Officers of Interpublic ÏÏÏÏÏÏÏÏÏÏÏÏÏÏÏÏÏÏÏÏÏÏÏÏÏÏÏÏÏÏÏÏÏÏÏÏÏ 174
Item 11. Executive Compensation ÏÏÏÏÏÏÏÏÏÏÏÏÏÏÏÏÏÏÏÏÏÏÏÏÏÏÏÏÏÏÏÏÏÏÏÏÏÏÏÏÏÏÏÏÏÏÏÏÏÏÏÏÏÏÏÏ 174
Item 12. Security Ownership of Certain Beneficial Owners and Management ÏÏÏÏÏÏÏÏÏÏÏÏÏÏÏÏÏÏÏÏ 174
Item 13. Certain Relationships and Related Transactions ÏÏÏÏÏÏÏÏÏÏÏÏÏÏÏÏÏÏÏÏÏÏÏÏÏÏÏÏÏÏÏÏÏÏÏÏÏ 174
Item 14. Principal Accountant Fees and ServicesÏÏÏÏÏÏÏÏÏÏÏÏÏÏÏÏÏÏÏÏÏÏÏÏÏÏÏÏÏÏÏÏÏÏÏÏÏÏÏÏÏÏÏÏ 174
PART IV.
Item 15. Exhibits and Financial Statements Schedule ÏÏÏÏÏÏÏÏÏÏÏÏÏÏÏÏÏÏÏÏÏÏÏÏÏÏÏÏÏÏÏÏÏÏÏÏÏÏÏÏ 175

EXPLANATORY NOTE
In this report, we have restated the financial data we previously published for each interim period in2005. The interim period restatements relate primarily to accounting for goodwill impairments, revenuerecognition and a number of miscellaneous items including accounting for leases and internationalcompensation arrangements.
The restated financial data and related disclosures are contained in Note 23 to the ConsolidatedFinancial Statements in Item 8. We have not amended any of our previously filed reports. The financialdata and other financial information for interim periods in 2005 in our quarterly reports on Form 10-Q forthe quarters ended March 31, June 30 and September 30, 2005 should no longer be relied upon.
i

STATEMENT REGARDING FORWARD-LOOKING DISCLOSURE
This annual report on Form 10-K contains forward-looking statements. Statements in this report thatare not historical facts, including statements about management's beliefs and expectations, constituteforward-looking statements. These statements are based on current plans, estimates and projections, andare subject to change based on a number of factors, including those outlined in this report under Item 1A,Risk Factors. Forward-looking statements speak only as of the date they are made, and we undertake noobligation to update publicly any of them in light of new information or future events.
Forward-looking statements involve inherent risks and uncertainties. A number of important factorscould cause actual results to differ materially from those contained in any forward-looking statement. Suchfactors include, but are not limited to, the following:
‚ risks arising from material weaknesses in our internal control over financial reporting, includingmaterial weaknesses in our control environment;
‚ potential adverse effects to our financial condition, results of operations or prospects as a result ofour restatements of financial statements;
‚ our ability to satisfy covenants under our credit facilities;
‚ our ability to satisfy certain reporting covenants under our indentures;
‚ our ability to attract new clients and retain existing clients;
‚ our ability to retain and attract key employees;
‚ risks associated with assumptions we make in connection with our critical accounting estimates;
‚ potential adverse effects if we are required to recognize additional impairment charges or otheradverse accounting-related developments;
‚ potential adverse developments in connection with the ongoing Securities and ExchangeCommission (""SEC'') investigation;
‚ potential downgrades in the credit ratings of our securities;
‚ risks associated with the effects of global, national and regional economic and political conditions,including with respect to fluctuations in interest rates and currency exchange rates; and
‚ developments from changes in the regulatory and legal environment for advertising and marketingand communications services companies around the world.
Investors should carefully consider these factors and the additional risk factors outlined in more detailin Item 1A, Risk Factors, in this report.
AVAILABLE INFORMATION
Information regarding our Annual Report on Form 10-K, quarterly reports on Form 10-Q, currentreports on Form 8-K, and any amendments to these reports, will be made available, free of charge, at ourwebsite at http://www.interpublic.com, as soon as reasonably practicable after we electronically file suchreports with, or furnish them to, the SEC. Any document that we file with the SEC may also be read andcopied at the SEC's Public Reference Room located at Room 1580, 100 F Street, N.E., Washington,DC 20549. Please call the SEC at 1-800-SEC-0330 for further information on the public reference room.Our filings are also available to the public from the SEC's website at http://www.sec.gov, and at theoffices of the New York Stock Exchange (""NYSE''). For further information on obtaining copies of ourpublic filings at the NYSE, please call (212) 656-5060.
Our Corporate Governance Guidelines, Code of Conduct and each of the charters for the AuditCommittee, Compensation Committee and the Corporate Governance Committee are available free ofcharge on our website at http://www.interpublic.com, or by writing to The Interpublic Group ofCompanies, Inc., 1114 Avenue of the Americas, New York, New York 10036, Attention: Secretary.
ii

PART I
Item 1. Business
The Interpublic Group of Companies, Inc. was incorporated in Delaware in September 1930 underthe name of McCann-Erickson Incorporated as the successor to the advertising agency businesses foundedin 1902 by A.W. Erickson and in 1911 by Harrison K. McCann. The Company has operated under theInterpublic name since January 1961.
Our Client Offerings
The Interpublic Group of Companies, Inc., together with its subsidiaries (the ""Company'',""Interpublic'', ""we'', ""us'' or ""our''), is one of the world's largest advertising and marketing servicescompanies, comprised of hundreds of communication agencies around the world that deliver custommarketing solutions on behalf of our clients. Our agencies cover the spectrum of marketing disciplines andspecialties, from traditional services such as consumer advertising and direct marketing, to services such asexperiential marketing and branded entertainment. With offices in over 100 countries and approximately43,000 employees, our agencies work with our clients to create global and local marketing campaigns.These marketing programs seek to build brands, influence consumer behavior and sell products.
To meet the challenge of an increasingly complex consumer culture, we create customized marketingsolutions for each of our clients. Engagements between clients and agencies fall into five basic categories,or models. In the single-discipline model, clients work directly with one agency in one discipline. Theproject collaboration model is employed when sister agencies are brought in on a project basis as a client'sneeds expand. In the integrated agency-of-record model, a multi-disciplinary agency provides a fuller rangeof marketing services for a client. The lead company model is applied when a lead agency manages thework at several of our agencies. Finally, in the virtual network model, clients have a representative at theholding company level to oversee the fullest range of our marketing spectrum.
While our agencies work on behalf of our clients using one of these models, we provide resources andsupport to ensure that our agencies can best meet our clients' needs. Based in New York City, the holdingcompany sets company-wide financial objectives, directs collaborative inter-agency programs, establishesfiscal management and operational controls, guides personnel policy, conducts investor relations andinitiates, manages and approves mergers and acquisitions. In addition, it provides limited centralizedfunctional services that offer our companies some operational efficiencies, including accounting andfinance, marketing information retrieval and analysis, legal services, real estate expertise, recruitment aid,employee benefits and executive compensation management.
Our Disciplines and Agencies
We have hundreds of specialized agencies. The following is a sample of some of our brands.
Our global networks offer our largest clients a full range of marketing and communications services.Combined, their footprint spans over 100 countries:
‚ McCann Erickson Worldwide
‚ Foote Cone & Belding Worldwide
‚ Lowe Worldwide
We have many full-service marketing agencies whose distinctive resources provide clients with multi-disciplinary communication services:
‚ Campbell-Ewald
‚ Carmichael Lynch
‚ Deutsch
1

‚ Hill Holliday
‚ Mullen
We also have many domestic advertising agencies that provide North American clients withtraditional services in print and broadcast media:
‚ Avrett Free & Ginsberg
‚ Campbell Mithun
‚ Dailey & Associates
‚ Gillespie
‚ Gotham
‚ Jay Advertising
‚ Tierney Communications
‚ TM Advertising
Our one-to-one marketing companies specialize in using a full range of digital, interactive andtraditional media services to communicate directly with consumers in relevant and innovative ways:
‚ Draft Worldwide
‚ FCBi
‚ MRM Partners Worldwide
‚ The Hacker Group
‚ R/GA
The worldwide leader in experiential marketing, Jack Morton Worldwide, is part of our group. JackMorton creates interactive experiences whose goal is to improve performance, increase sales and buildbrand recognition. The agency produces meetings and events, environmental design, exhibits, digital mediaand learning programs.
Our media offering addresses changes in today's fragmented media landscape, with capabilities inplanning, research, negotiating and buying, as well as media research, product placement andprogramming. Our major media agencies are:
‚ Initiative
‚ MAGNA Global
‚ Universal McCann
To help activate consumer demand, our promotion agencies offer clients a range of options, includingsweepstakes, incentive programs, sampling opportunities and trade programming:
‚ Marketing Drive
‚ Momentum
‚ The Properties Group
‚ Zipatoni
2

Our public relations agencies offer such worldwide services as consumer PR, corporate communica-tions, crisis management, web relations and investor relations:
‚ DeVries
‚ Golin Harris
‚ MWW Group
‚ Weber Shandwick
We also have special marketing services agencies that we believe are best-in-class for their nichemarkets:
‚ Marketing Accountability Practice (marketing accountability/ROI)
‚ frank about women (women's marketing)
‚ KidCom (youth marketing)
‚ NAS (recruitment)
‚ Newspaper Services of America (newspaper services)
‚ OSI (outdoor advertising)
‚ Wahlstrom Group (yellowpages)
‚ Women2Women Communications (women's marketing)
‚ FutureBrand (corporate identity and branding)
Our sports and entertainment marketing firms manage top athletes and sporting events and representsome of the world's most-recognized celebrities:
‚ Bragman Nyman Cafarelli
‚ Octagon
‚ PMK/HBH
‚ Rogers & Cowan
Our affiliated multicultural agency partners, in which we own a minority interest, target specificdemographic segments:
‚ Accent Marketing (Hispanic)
‚ Casanova Pendrill (Hispanic)
‚ IW Group (Asian-Pacific-American)
‚ SiboneyUSA (Hispanic)
Interpublic maintains separate agency brands to manage the broadest range of clients, even ones thatoperate in similar business areas. Having distinct agencies allows us to avoid potential conflicts of interestamong our clients in the same industry. To help manage these companies effectively, however, we haveorganized our agencies into five global operating divisions. Four of these divisions, McCann WorldGroup(""McCann''), The FCB Group (""FCB''), Lowe Worldwide (""Lowe'') and Draft Worldwide (""Draft''),provide a distinct comprehensive array of global communications and marketing services. The fifth globaloperating division, The Constituency Management Group (""CMG''), which includes Weber Shandwick,MWW Group, FutureBrand, DeVries, Golin Harris, Jack Morton and Octagon Worldwide (""Octagon''),provides clients with diversified services, including public relations, meeting and event production, sportsand entertainment marketing, corporate and brand identity and strategic marketing consulting.
3

A group of leading stand-alone agencies provide clients with a full range of advertising and marketingservices. These agencies partner with our global operating groups as needed, and include Campbell-Ewald,Hill Holliday, Deutsch and Mullen.
We believe this organizational structure allows us to provide comprehensive solutions for clients andenables stronger financial and operational growth opportunities. We practice a decentralized managementstyle, providing agency management with a great deal of operational autonomy.
Our Financial Reporting Segments
As of December 31, 2005, for financial reporting purposes we have three reportable segments. Thelargest segment, Integrated Agency Networks (""IAN''), is comprised of McCann, FCB, Lowe, Draft, ourmedia agencies, and our leading stand-alone agencies. CMG comprises our second reportable segment.Our third reportable segment is comprised of our Motorsports operations (""Motorsports''), which weresold during 2004 and had immaterial residual operating results in 2005. See Note 20 to the ConsolidatedFinancial Statements for further discussion.
Principal Markets
Our agencies are located in over 100 countries and in every significant world market. We provideservices for clients whose businesses are broadly international in scope, as well as for clients whosebusinesses are limited to a single country or a small number of countries. The United States (""U.S.''),Europe (excluding the United Kingdom (""UK'')), the UK, Asia Pacific and Latin America represented55.2%, 18.1%, 9.9%, 7.5% and 4.1% of our total revenue, respectively, in 2005. For further discussionconcerning revenues and long-lived assets on a geographical basis for each of the last three years, seeNote 20 to the Consolidated Financial Statements.
Sources of Revenue
Our revenues are primarily derived from the planning and execution of advertising programs in variousmedia and the planning and execution of other marketing and communications programs. Most of ourclient contracts are individually negotiated. Accordingly, the terms of client engagements and the basis onwhich we earn commissions and fees vary significantly. Our client contracts are becoming increasinglycomplex arrangements that frequently include provisions for incentive compensation and govern vendorrebates and credits. Our largest clients are multinational entities and we often provide services to theseclients out of multiple offices and across various agencies. In arranging for such services to be provided, wemay enter into global, regional and local agreements. Multiple agreements of this nature are reviewed bylegal counsel to determine the governing terms to be followed by the offices and agencies involved.
Revenues for creation, planning and placement of advertising are primarily determined on a negotiatedfee basis and, to a lesser extent, on a commission basis. Fees are usually calculated to reflect hourly ratesplus proportional overhead and a mark-up. Many clients include an incentive compensation component intheir total compensation package. This provides added revenue based on achieving mutually agreed-uponqualitative and/or quantitative metrics within specified time periods. Commissions are earned based onservices provided, and are usually derived from a percentage or fee over the total cost to complete theassignment. Commissions can also be derived when clients pay us the gross rate billed by media and wepay for media at a lower net rate; the difference is the commission that we earn, which is either retainedin total or shared with the client depending on the nature of the services agreement.
We pay media charges with respect to contracts for advertising time or space that we place on behalfof our clients. To reduce our risk from a client's non-payment, we typically pay media charges only afterwe receive funds from our clients. Generally, we act as the client's agent rather than the primary obligor.In some instances we agree with the media provider that we will only be liable to pay the media after theclient has paid us for the media charges.
4

We also generate revenue in negotiated fees from our public relations, sales promotion, eventmarketing, sports and entertainment marketing and corporate and brand identity services.
Our revenue is directly dependent upon the advertising, marketing and corporate communicationsrequirements of our clients and tends to be higher in the second half of the calendar year as a result of theholiday season and lower in the first half as a result of the post-holiday slow-down in client activity.Depending on the terms of the client contract, fees for services performed can be primarily recognizedthree ways: proportional performance, straight-line (or monthly basis) or completed contract. Fee revenuerecognized on a completed contract basis also contributes to the higher seasonal revenues experienced inthe fourth quarter due to the majority of our contracts ending at December 31. As is customary in theindustry, these contracts provide for termination by either party on relatively short notice, usually 90 days.See Note 1 to the Consolidated Financial Statements for further discussion of our revenue recognitionaccounting policies.
Clients
In the aggregate, our top ten clients based on revenue accounted for approximately 24.7% and 23.5%of revenue in 2005 and 2004, respectively. Based on revenue for the year ended December 31, 2005, ourlargest clients were General Motors Corporation, Microsoft, Unilever, Johnson & Johnson, and Verizon.While the loss of the entire business of any one of our largest clients might have a material adverse effectupon our business, we believe that it is unlikely that the entire business of any of these clients would belost at the same time. This is because we represent several different brands or divisions of each of theseclients in a number of geographic markets, as well as provide services across multiple advertising andmarketing disciplines, in each case through more than one of our agency systems. Representation of aclient rarely means that we handle advertising for all brands or product lines of the client in allgeographical locations. Any client may transfer its business from one of our agencies to a competingagency, and a client may reduce its marketing budget at any time.
Personnel
As of December 31, 2005, we employed approximately 43,000 persons, of whom approximately 18,000were employed in the U.S. Because of the personal service character of the advertising and marketingcommunications business, the quality of personnel is of crucial importance to our continuing success.There is keen competition for qualified employees.
Item 1A. Risk Factors
We are subject to a variety of possible risks that could adversely impact our revenues, results ofoperations or financial condition. Some of these risks relate to the industry in which we operate, whileothers are more specific to us. The following factors set out potential risks we have identified that couldadversely affect us. See also Statement Regarding Forward-Looking Disclosure.
‚ We have numerous material weaknesses in our internal control over financial reporting.
We have identified numerous material weaknesses in our internal control over financial reporting, andour internal control over financial reporting was not effective as of December 31, 2005. For a detaileddescription of these material weaknesses, see Item 8, Management's Assessment on Internal Control OverFinancial Reporting, of our Form 10-K. Each of our material weaknesses results in more than a remotelikelihood that a material misstatement will not be prevented or detected. As a result, we must performextensive additional work to obtain reasonable assurance regarding the reliability of our financialstatements. Given the extensive material weaknesses identified, even with this additional work there is arisk of errors not being prevented or detected, which could result in further restatements.
5

‚ We have extensive work remaining to remedy the material weaknesses in our internal control overfinancial reporting.
Because of our decentralized structure and our many disparate accounting systems of varying qualityand sophistication, we have extensive work remaining to remedy our material weaknesses in internalcontrol over financial reporting. We are in the process of developing a work plan for remedying all of theidentified material weaknesses, and this work will extend beyond 2006. There can be no assurance as towhen the remediation plan will be completed or when the material weaknesses will be remedied. Therewill also continue to be a serious risk that we will be unable to file future periodic reports with the SEC ina timely manner, that a default could result under the indentures governing our debt securities or underour three-year revolving credit agreement (the ""Three-Year Revolving Credit Facility'') or credit facilitiesof our subsidiaries and that our future financial statements could contain errors that will be undetected.
‚ We face substantial ongoing costs associated with complying with the requirements of Section 404of the Sarbanes-Oxley Act.
As a result of the extent of the deficiencies in our internal control over financial reporting, weincurred significant professional fees and other expenses in 2005 to prepare our consolidated financialstatements and to comply with the requirements of Section 404 of the Sarbanes-Oxley Act. Until ourremediation is completed, we will continue to incur the expenses and management burdens associated withthe manual procedures and additional resources required to prepare our consolidated financial statements.The cost of this work will continue to be significant in 2006 and beyond.
‚ We have restated our financial statements.
We may continue to suffer adverse effects from the restatement of previously issued financialstatements that we presented in our annual report on Form 10-K for the year ended December 31, 2004,as amended (the ""2004 Form 10-K''). In the 2004 Form 10-K, we restated our previously reportedfinancial statements for the years ended December 31, 2003, 2002, 2001 and 2000, and for the first threequarters of 2004 and all four quarters of 2003 (the ""Prior Restatement''). In this report, we have restatedthe financial data for the first three quarters of 2005.
As a result of these matters, we have recorded liabilities for vendor discounts and other obligationsthat will necessitate cash settlement that may negatively impact our cash flow in future years. We mayalso become subject to fines or other penalties or damages in our ongoing SEC investigation or newregulatory actions or civil litigation. Any of these matters may also contribute to further ratingsdowngrades, negative publicity and difficulties in attracting and retaining key clients, employees andmanagement personnel.
‚ Ongoing SEC investigations regarding our accounting restatements could adversely affect us.
The SEC opened a formal investigation in response to the restatement we first announced in August2002 and, as previously disclosed, the SEC staff's investigation has expanded to encompass our PriorRestatement. In particular, since we filed our 2004 Form 10-K, we have received subpoenas from the SECrelating to matters addressed in our Prior Restatement. We continue to cooperate with the investigation.We expect that the investigation will result in monetary liability, but because the investigation is ongoing,in particular with respect to the Prior Restatement, we cannot reasonably estimate either the timing of aresolution or the amount. Accordingly, we have not yet established any accounting provision relating tothese matters. Potential adverse developments in connection with the investigation, including any expansionof the scope of the investigation, could also negatively impact us and could divert the efforts and attentionof our management team from our ordinary business operations.
‚ We operate in a highly competitive industry.
The marketing communications business is highly competitive. Our agencies and media services mustcompete with other agencies, and with other providers of creative or media services, in order to maintainexisting client relationships and to win new clients. The client's perception of the quality of an agency'screative work, our reputation and the agencies' reputations are important factors in determining our
6

competitive position. An agency's ability to serve clients, particularly large international clients, on a broadgeographic basis is also an important competitive consideration. On the other hand, because an agency'sprincipal asset is its people, freedom of entry into the business is almost unlimited and a small agency is,on occasion, able to take all or some portion of a client's account from a much larger competitor.
Many companies put their advertising and marketing communications business up for competitivereview from time to time. We have won and lost client accounts in the past as a result of such periodiccompetitions. Our ability to attract new clients and to retain existing clients may also, in some cases, belimited by clients' policies or perceptions about conflicts of interest. These policies can, in some cases,prevent one agency, or even different agencies under our ownership, from performing similar services forcompeting products or companies.
In addition, issues arising from our deficiencies in our internal control over financial reporting coulddivert the efforts and attention of our management from our ordinary business operations or have anadverse impact on clients' perceptions of us and adversely affect our overall ability to compete for new andexisting business.
‚ We may lose or fail to attract and retain key employees and management personnel.
Employees, including creative, research, media, account and practice group specialists, and their skillsand relationships with clients, are among our most important assets. An important aspect of ourcompetitiveness is our ability to attract and retain key employees and management personnel. Our abilityto do so is influenced by a variety of factors, including the compensation we award, and could be adverselyaffected by our recent financial performance and financial reporting difficulties.
‚ As a marketing services company, our revenues are highly susceptible to declines as a result ofunfavorable economic conditions.
Economic downturns often more severely affect the marketing services industry than other industries.In the past, some clients have responded to weak economic performance in any region where we operateby reducing their marketing budgets, which are generally discretionary in nature and easier to reduce inthe short-term than other expenses related to operations. This pattern may recur in the future.
‚ Our liquidity profile has recently been adversely affected.
In recent periods we have experienced operating losses that have adversely affected our cash flowsfrom operations. We have recorded liabilities and incurred substantial professional fees in connection withthe Prior Restatement. It is also possible that we will be required to pay fines or other penalties ordamages in connection with the ongoing SEC investigation or future regulatory actions or civil litigation.These items have impacted and will impact our liquidity in future years negatively and could require us toseek new or additional sources of liquidity to fund our working capital needs. There can be no guaranteethat we would be able to access any such new sources of new liquidity on commercially reasonable termsor at all. If we are unable to do so, our liquidity position could be adversely affected.
‚ Downgrades of our credit ratings could adversely affect us.
Our long-term debt is currently rated B° with negative outlook by Standard and Poor's, Ba1 withnegative outlook by Moody's, and B° with stable outlook by Fitch. It is possible that our credit ratingswill be reduced further. Ratings downgrades or comparatively weak ratings can adversely affect us, becauseratings are an important factor influencing our ability to access capital. Our clients and vendors may alsoconsider our credit profile when negotiating contract terms, and if they were to change the terms on whichthey deal with us, it could have a significant adverse affect on our liquidity.
‚ If some of our clients experience financial distress, their weakened financial position couldnegatively affect our own financial position and results.
We have a large and diverse client base and at any given time, one or more of our clients mayexperience financial distress, file for bankruptcy protection or go out of business. If any client with whomwe have a substantial amount of business experiences financial difficulty, it could delay or jeopardize the
7

collection of accounts receivable, may result in significant reductions in services provided by us and mayhave a material adverse effect on our financial position, results of operations and liquidity. For adescription of our client base, see Item 1, Business- Clients.
‚ International business risks could adversely affect our operations.
International revenues represent a significant portion of our revenues, approximately 45% in 2005. Ourinternational operations are exposed to risks that affect foreign operations of all kinds, including locallegislation, monetary devaluation, exchange control restrictions and unstable political conditions. Theserisks may limit our ability to grow our business and effectively manage our operations in those countries.In addition, because a high level of our revenues and expenses is denominated in currencies other than theU.S. dollar, primarily the Euro and Pound Sterling, fluctuations in exchange rates between the U.S. dollarand such currencies may materially affect our financial results.
‚ In 2005 and prior years, we recognized impairment charges and increased our deferred tax valuationallowances, and we may be required to record additional charges in the future related to these matters.
We evaluate all of our long-lived assets (including goodwill, other intangible assets and fixed assets),investments and deferred tax assets for possible impairment or realizability at least annually and wheneverthere is an indication of impairment or lack of realizability. If certain criteria are met, we are required torecord an impairment charge or valuation allowance. In the past, we have recorded substantial amounts ofgoodwill, investment and other impairment charges, and have been required to establish substantialvaluation allowances with respect to deferred tax assets and loss carry-forwards.
As of December 31, 2005, we have substantial amounts of intangibles, investments and deferred taxassets on our Consolidated Balance Sheet. Future events, including our financial performance and strategicdecisions, could cause us to conclude that further impairment indicators exist and that the asset valuesassociated with intangibles, investments and deferred tax assets may have become impaired. Any resultingimpairment loss would have an adverse impact on our reported earnings in the period in which the chargeis recognized. In connection with the U.S. deferred tax assets, management believes that it is more likelythan not that a substantial amount of the deferred tax assets will be realized; a valuation allowance hasbeen established for the remainder. The amount of the deferred tax assets considered realizable, however,could be reduced in the near term if estimates of future U.S. taxable income are lower than anticipated.
‚ We are subject to certain restrictions and must meet certain minimum financial covenants under ourThree-Year Revolving Credit Facility.
Our Three-Year Revolving Credit Facility contains covenants that limit our operational flexibility andrequire us to meet specified financial ratios. The Three-Year Revolving Credit Facility does not permit us(i) to make cash acquisitions in excess of $50.0 million until October 2006, or thereafter in excess of$50.0 million until expiration of the agreement in May 2007, subject to increases equal to the net cashproceeds received in the applicable period from any disposition of assets; (ii) to make capital expenditures inexcess of $210.0 million annually; (iii) to repurchase or to declare or pay dividends on our capital stock(except for any convertible preferred stock, convertible trust preferred instrument or similar security, whichincludes our outstanding 5.375% Series A Mandatory Convertible Preferred Stock and our 5.25% Series BCumulative Convertible Perpetual Preferred Stock), except that we may repurchase our capital stock inconnection with the exercise of options by our employees or with proceeds contemporaneously received from anissue of new shares of our capital stock; and (iv) to incur new debt at our subsidiaries, other than unsecureddebt incurred in the ordinary course of business of our subsidiaries outside the U.S. and unsecured debt, whichmay not exceed $10.0 million in the aggregate, incurred in the ordinary course of business of ourU.S. subsidiaries. Under the Three-Year Revolving Credit Facility, we are also subject to financial covenantswith respect to our interest coverage ratio, debt to EBITDA ratio and minimum EBITDA.
We have in the past been required to seek and successfully have obtained amendments and waivers ofthe financial covenants under our committed bank facility. There can be no assurance that we will be incompliance with these covenants in future periods. If we do not comply and are unable to obtain thenecessary amendments or waivers at that time, we would be unable to borrow or obtain additional letters
8

of credit under the Three-Year Revolving Credit Facility and could choose to terminate the facility andprovide a cash deposit in connection with any outstanding letters of credit. The lenders under the Three-Year Revolving Credit Facility would also have the right to terminate the facility, accelerate anyoutstanding principal and require us to provide a cash deposit in an amount equal to the total amount ofoutstanding letters of credit. The outstanding amount of letters of credit was $162.4 million as ofDecember 31, 2005. We have not drawn under the Three-Year Revolving Credit Facility over the past twoyears, and we do not currently expect to draw under it. So long as there are no amounts to be acceleratedunder the Three-Year Revolving Credit Facility, termination of the facility would not trigger the cross-acceleration provisions of our public debt.
Any future impairment charge (excluding valuation allowance charges) could result in a violation ofthe financial covenants of our Three-Year Revolving Credit Facility, which requires us to maintainminimum levels of consolidated EBITDA (as defined in that facility) and established ratios of debt toconsolidated EBITDA and interest coverage ratios. A violation of any of these financial covenants couldtrigger a default under this facility and adversely affect our liquidity.
‚ We may not be able to meet our performance targets and milestones.
From time to time, we communicate to the market certain targets and milestones for our financialand operating performance including, but not limited to, the areas of revenue growth, operating expensereduction and operating margin growth. These targets and milestones are intended to provide metricsagainst which to evaluate our performance, but they should not be understood as predictions or guidanceabout our expected performance. Our ability to meet any target or milestone is subject to inherent risksand uncertainties, and we caution investors against placing undue reliance on them. See ""StatementRegarding Forward-Looking Disclosure.''
‚ We are subject to regulations and other governmental scrutiny that could restrict our activities ornegatively impact our revenues.
Our industry is subject to government regulation and other governmental action, both domestic andforeign. There has been an increasing tendency on the part of advertisers and consumer groups tochallenge advertising through legislation, regulation, the courts or otherwise, for example on the groundsthat the advertising is false and deceptive or injurious to public welfare. Through the years, there has beena continuing expansion of specific rules, prohibitions, media restrictions, labeling disclosures and warningrequirements with respect to the advertising for certain products. Representatives within governmentbodies, both domestic and foreign, continue to initiate proposals to ban the advertising of specific productsand to impose taxes on or deny deductions for advertising, which, if successful, may have an adverse effecton advertising expenditures and consequently our revenues.
Item 1B. Unresolved Staff Comments
None.
Item 2. Properties
Substantially all of our office space is leased from third parties. Several of our leases will be expiringwithin the next few months, while the remainder will be expiring within the next 19 years. Certain leasesare subject to rent reviews or contain escalation clauses, and certain of our leases require the payment ofvarious operating expenses, which may also be subject to escalation. Physical properties include leaseholdimprovements, furniture, fixtures and equipment located in our offices. We believe that facilities leased orowned by us are adequate for the purposes for which they are currently used and are well maintained. SeeNote 21 to the Consolidated Financial Statements for a discussion of our lease commitments.
9

Item 3. Legal Proceedings
We are or have been involved in legal and administrative proceedings of various types. While anylitigation contains an element of uncertainty, we have no reason to believe that the outcome of suchproceedings or claims will have a material adverse effect on our financial condition except as describedbelow.
SEC Investigation
The SEC opened a formal investigation in response to the restatement we first announced in August2002 and, as previously disclosed, the SEC staff's investigation has expanded to encompass our PriorRestatement. In particular, since we filed our 2004 Form 10-K, we have received subpoenas from the SECrelating to matters addressed in our Prior Restatement. We continue to cooperate with the investigation.We expect that the investigation will result in monetary liability, but because the investigation is ongoing,in particular with respect to the Prior Restatement, we cannot reasonably estimate either the timing of aresolution or the amount. Accordingly, we have not yet established any accounting provision relating tothese matters.
Item 4. Submission of Matters to a Vote of Security Holders
This item is answered in respect of the Annual Meeting of Stockholders held on November 14, 2005(the ""Annual Meeting''). At the Annual Meeting, the following number of votes were cast with respect toeach matter voted upon:
Proposal to approve Management's nominees for director as follows:
Nominee For Withheld Broker Nonvotes
Frank J. Borelli ÏÏÏÏÏÏÏÏÏÏÏÏÏÏÏÏÏÏÏÏÏÏÏÏÏÏÏÏÏÏÏ 311,766,433 59,959,629 0
Reginald K. Brack ÏÏÏÏÏÏÏÏÏÏÏÏÏÏÏÏÏÏÏÏÏÏÏÏÏÏÏÏ 315,032,540 56,693,522 0
Jill M. Considine ÏÏÏÏÏÏÏÏÏÏÏÏÏÏÏÏÏÏÏÏÏÏÏÏÏÏÏÏÏ 315,037,081 56,688,981 0
Richard A. Goldstein ÏÏÏÏÏÏÏÏÏÏÏÏÏÏÏÏÏÏÏÏÏÏÏÏÏÏ 339,686,209 32,039,853 0
H. John Greeniaus ÏÏÏÏÏÏÏÏÏÏÏÏÏÏÏÏÏÏÏÏÏÏÏÏÏÏÏÏ 339,976,351 31,749,711 0
Michael I. Roth ÏÏÏÏÏÏÏÏÏÏÏÏÏÏÏÏÏÏÏÏÏÏÏÏÏÏÏÏÏÏ 337,559,779 34,166,283 0
J. Phillip Samper ÏÏÏÏÏÏÏÏÏÏÏÏÏÏÏÏÏÏÏÏÏÏÏÏÏÏÏÏÏ 336,415,059 35,311,003 0
David M. ThomasÏÏÏÏÏÏÏÏÏÏÏÏÏÏÏÏÏÏÏÏÏÏÏÏÏÏÏÏÏ 339,228,386 32,497,676 0
Proposal to approve The Interpublic Group of Companies Employee Stock Purchase Plan (2006):
For Against Abstain Broker Nonvotes
318,034,359 18,975,362 3,237,702 31,478,639
Proposal to approve confirmation of the appointment of PricewaterhouseCoopers LLP as independentauditors for 2005:
For Against Abstain Broker Nonvotes
341,855,593 27,225,891 2,644,578 0
Shareholder proposal to arrange for the prompt sale of the Company to the highest bidder:
For Against Abstain Broker Nonvotes
11,397,027 323,825,408 5,024,987 31,478,640
10

Executive Officers of Interpublic
Name Age Office
Michael Roth(1) ÏÏÏÏÏÏÏÏÏÏÏÏÏÏÏÏÏÏ 60 Chairman of the Board and Chief ExecutiveOfficer
Nicholas J. Camera ÏÏÏÏÏÏÏÏÏÏÏÏÏÏÏÏ 59 Senior Vice President, General Counsel andSecretary
Albert S. ConteÏÏÏÏÏÏÏÏÏÏÏÏÏÏÏÏÏÏÏÏ 55 Senior Vice President, Taxes and General TaxCounsel
Nick Cyprus ÏÏÏÏÏÏÏÏÏÏÏÏÏÏÏÏÏÏÏÏÏÏ 52 Senior Vice President, Controller and ChiefAccounting Officer
Thomas A. Dowling ÏÏÏÏÏÏÏÏÏÏÏÏÏÏÏÏ 54 Senior Vice President, Chief Risk Officer
Stephen GatfieldÏÏÏÏÏÏÏÏÏÏÏÏÏÏÏÏÏÏÏ 47 Executive Vice President, Network Operations,Chief Executive Officer of Lowe Worldwide
Philippe Krakowsky ÏÏÏÏÏÏÏÏÏÏÏÏÏÏÏÏ 43 Executive Vice President, Strategy andCorporate Communications
Frank Mergenthaler ÏÏÏÏÏÏÏÏÏÏÏÏÏÏÏÏ 45 Executive Vice President and Chief FinancialOfficer
Timothy SompolskiÏÏÏÏÏÏÏÏÏÏÏÏÏÏÏÏÏ 53 Executive Vice President, Chief HumanResources Officer
(1) Also a Director
There is no family relationship among any of the executive officers.
Mr. Roth became our Chairman of the Board and Chief Executive Officer, effective January 19,2005. Prior to that time, Mr. Roth served as our Chairman of the Board from July 13, 2004 to January2005. Mr. Roth served as Chairman and Chief Executive Officer of The MONY Group Inc. fromFebruary 1994 to June 2004. Mr. Roth has been a member of the Board of Directors of Interpublic sinceFebruary 2002. He is also a director of Pitney Bowes Inc. and Gaylord Entertainment Company.
Mr. Camera was hired in May 1993. He was elected Vice President, Assistant General Counsel andAssistant Secretary in June 1994, Vice President, General Counsel and Secretary in December 1995, andSenior Vice President, General Counsel and Secretary in February 2000.
Mr. Conte was hired in March 2000 as Senior Vice President, Taxes and General Tax Counsel. Priorto joining us, Mr. Conte served as Vice President, Senior Tax Counsel for Revlon Consumer ProductsCorporation from September 1987 to February 2000.
Mr. Cyprus was hired in May 2004 as Senior Vice President, Controller and Chief AccountingOfficer. Prior to joining us, Mr. Cyprus served as Vice President and Controller of AT&T from January1999 to May 2004. On March 22, 2006, we announced that Mr. Cyprus would be leaving the Companyeffective March 31, 2006.
Mr. Dowling was hired in January 2000 as Vice President and General Auditor. He was electedSenior Vice President, Financial Administration of Interpublic in February 2001, and Senior VicePresident, Chief Risk Officer in November 2002. Prior to joining us, Mr. Dowling served as Vice Presidentand General Auditor for Avon Products, Inc. from April 1992 to December 1999.
Mr. Gatfield was hired in April 2004 as Executive Vice President, Global Operations and Innovation.He was elected Executive Vice President, Strategy and Network Operations in December 2005, and inFebruary 2006 was also named Chief Executive Officer of Lowe Worldwide. Prior to joining us, he servedas Chief Operating Officer from 2001 to 2004 and as Regional Managing Director for the Asia Pacificregion from 1997 to 2000 for Leo Burnett Worldwide.
11

Mr. Krakowsky was hired in January 2002 as Senior Vice President, Director of CorporateCommunications. He was elected Executive Vice President, Strategy and Corporate Relations inDecember 2005. Prior to joining us, he served as Senior Vice President, Communications Director forYoung & Rubicam from August 1996 to December 2000. During 2001, Mr. Krakowsky was complyingwith the terms of a non-competition agreement entered into with Young & Rubicam.
Mr. Mergenthaler was hired in August 2005 as Executive Vice President and Chief Financial Officer.Prior to joining us, he served as Executive Vice President and Chief Financial Officer for Columbia HouseCompany from July 2002 to July 2005. Mr. Mergenthaler served as Senior Vice President and DeputyChief Financial Officer for Vivendi Universal from December 2001 to March 2002. Prior to that timeMr. Mergenthaler was an executive at Seagram Company Ltd. from November 1996 to December 2001.
Mr. Sompolski was hired in July 2004 as Executive Vice President, Chief Human Resources Officer.Prior to joining us, he served as Senior Vice President of Human Resources and Administration for AltriaGroup from November 1996 to January 2003.
12

PART II
Item 5. Market for Registrant's Common Equity and Related Stockholder Matters
Price Range of Common Stock
Our common stock is listed and traded on the New York Stock Exchange (""NYSE'') under thesymbol ""IPG.'' The following table provides the high and low closing sales prices per share for the periodsshown below as reported on the NYSE. At February 28, 2006, there were 43,701 registered holders of ourcommon stock.
NYSE Sale Price
Period High Low
2005:
Fourth Quarter ÏÏÏÏÏÏÏÏÏÏÏÏÏÏÏÏÏÏÏÏÏÏÏÏÏÏÏÏÏÏÏÏÏÏÏÏÏÏÏÏÏÏÏÏÏÏÏÏÏÏÏÏ $11.75 $ 9.14
Third Quarter ÏÏÏÏÏÏÏÏÏÏÏÏÏÏÏÏÏÏÏÏÏÏÏÏÏÏÏÏÏÏÏÏÏÏÏÏÏÏÏÏÏÏÏÏÏÏÏÏÏÏÏÏÏ $12.67 $11.04
Second Quarter ÏÏÏÏÏÏÏÏÏÏÏÏÏÏÏÏÏÏÏÏÏÏÏÏÏÏÏÏÏÏÏÏÏÏÏÏÏÏÏÏÏÏÏÏÏÏÏÏÏÏÏ $13.28 $12.11
First QuarterÏÏÏÏÏÏÏÏÏÏÏÏÏÏÏÏÏÏÏÏÏÏÏÏÏÏÏÏÏÏÏÏÏÏÏÏÏÏÏÏÏÏÏÏÏÏÏÏÏÏÏÏÏÏ $13.68 $11.50
2004:
Fourth Quarter ÏÏÏÏÏÏÏÏÏÏÏÏÏÏÏÏÏÏÏÏÏÏÏÏÏÏÏÏÏÏÏÏÏÏÏÏÏÏÏÏÏÏÏÏÏÏÏÏÏÏÏÏ $13.50 $10.95
Third Quarter ÏÏÏÏÏÏÏÏÏÏÏÏÏÏÏÏÏÏÏÏÏÏÏÏÏÏÏÏÏÏÏÏÏÏÏÏÏÏÏÏÏÏÏÏÏÏÏÏÏÏÏÏÏ $13.62 $10.51
Second Quarter ÏÏÏÏÏÏÏÏÏÏÏÏÏÏÏÏÏÏÏÏÏÏÏÏÏÏÏÏÏÏÏÏÏÏÏÏÏÏÏÏÏÏÏÏÏÏÏÏÏÏÏ $16.43 $13.73
First QuarterÏÏÏÏÏÏÏÏÏÏÏÏÏÏÏÏÏÏÏÏÏÏÏÏÏÏÏÏÏÏÏÏÏÏÏÏÏÏÏÏÏÏÏÏÏÏÏÏÏÏÏÏÏÏ $17.19 $14.86
Dividend Policy
No dividend was paid on our common stock during 2003, 2004, or 2005. Our future dividend policywill be determined on a quarter-by-quarter basis and will depend on earnings, financial condition, capitalrequirements and other factors. The current terms of our Three-Year Revolving Credit Facility limit ourability to declare and pay dividends. For a discussion of the restrictions under our Three-Year RevolvingCredit Facility, see Item 7, Management's Discussion and Analysis of Financial Condition and Results ofOperations Ì Liquidity and Capital Resources. In addition, the terms of our outstanding series of preferredstock do not permit us to pay dividends on our common stock unless all accumulated and unpaid dividendshave been or contemporaneously are declared and paid or provision for the payment thereof has beenmade. Our future dividend policy may also be influenced by the impact of our securities with participatingrights in earnings available to common stockholders, including our 4.50% Convertible Senior Notes andSeries A Mandatory Convertible Preferred Stock. For a discussion of our participating securities, seeNote 13 to the Consolidated Financial Statements.
Transfer Agent and Registrar for Common Stock
The transfer agent and registrar for our common stock is:
Mellon Investor Services, Inc.480 Washington Boulevard29th FloorJersey City, NJ 07310Tel: (877) 363-6398
13

Sales of Unregistered Securities
In the fourth quarter of 2005, we issued securities without registration under the Securities Act of1933, as amended (the ""Securities Act'') in payment of deferred compensation for acquisitions we madein earlier periods and for raising capital. The specific transactions were as follows:
‚ On November 21, 2005, we issued 77,006 shares of our common stock to two shareholders of acompany in connection with the purchase of 31% of the shares of the company. The shares of ourcommon stock were valued at $800,000 as of the date of issuance and were issued withoutregistration in reliance on Regulation S under the Securities Act.
‚ On October 24, 2005, we issued 525,000 shares of our 5.25% Series B Cumulative ConvertiblePerpetual Preferred Stock (the ""Series B Preferred Stock'') at an aggregate offering price of$525,000,000. The shares of our Series B Preferred Stock were sold on October 18, 2005 in aprivate placement to a syndicate of initial purchasers at an aggregate discount of $15,750,000 andmay be resold to qualified institutional buyers in reliance on the exemption from registrationprovided by Rule 144A under the Securities Act.
Each share of our Series B Preferred Stock may be converted at any time, at the option of the holder,into 73.1904 shares of our common stock, which is equivalent to an initial conversion price ofapproximately $13.66, plus cash in lieu of fractional shares. The conversion rate is subject to adjustmentupon the occurrence of certain events. On or after October 15, 2010, we may cause shares of our Series BPreferred Stock to be automatically converted into shares of our common stock at the then prevailingconversion rate if the closing price of our common stock multiplied by the conversion rate then in effectequals or exceeds 130% of the liquidation preference for 20 trading days during any consecutive 30 tradingday period.
Repurchase of Equity Securities
The following table provides information regarding our purchases of equity securities during the fourthquarter of 2005:
MaximumNumber of
Shares that MayAverage Total Number of Shares Yet Be
Total Number Price Purchased as Part of Purchasedof Shares Paid per Publicly Announced Under the PlansPurchased Share(2) Plans or Programs or Programs
October 1-31 ÏÏÏÏÏÏÏÏÏÏÏÏÏÏÏÏ 37,019 $11.03 Ì Ì
November 1-30 ÏÏÏÏÏÏÏÏÏÏÏÏÏÏ 7,072 $10.97 Ì Ì
December 1-31 ÏÏÏÏÏÏÏÏÏÏÏÏÏÏ 238,077 $ 9.84 Ì Ì
Total(1) ÏÏÏÏÏÏÏÏÏÏÏÏÏÏÏÏÏÏÏÏ 282,168 $10.03 Ì Ì
(1) Consists of restricted shares of our common stock withheld under the terms of grants under employeestock compensation plans to offset tax withholding obligations that occurred upon vesting and releaseof restricted shares during each month of the fourth quarter of 2005 (the ""Withheld Shares'').
(2) The average price per month of the Withheld Shares was calculated by dividing the aggregate valueof the tax withholding obligations for each month by the aggregate number of shares of our commonstock withheld each month.
14

Item 6. Summary Selected Financial Data
THE INTERPUBLIC GROUP OF COMPANIES, INC. AND SUBSIDIARIES
CONSOLIDATED STATEMENTS OF OPERATIONS ANDSUMMARY SELECTED FINANCIAL DATA
(Amounts in Millions, Except Per Share Amounts)
For the Years Ended December 31,
2005 2004 2003 2002 2001
REVENUEÏÏÏÏÏÏÏÏÏÏÏÏÏÏÏÏÏÏÏÏÏÏÏÏÏÏÏÏÏÏÏÏÏÏÏÏÏÏÏÏÏÏÏÏÏÏ $6,274.3 $6,387.0 $6,161.7 $6,059.1 $6,598.5OPERATING (INCOME) EXPENSES:
Salaries and related expenses ÏÏÏÏÏÏÏÏÏÏÏÏÏÏÏÏÏÏÏÏÏÏÏÏÏÏÏÏÏ 3,999.1 3,733.0 3,501.4 3,397.1 3,634.9Office and general expenses ÏÏÏÏÏÏÏÏÏÏÏÏÏÏÏÏÏÏÏÏÏÏÏÏÏÏÏÏÏÏ 2,288.1 2,250.4 2,225.3 2,248.3 2,397.9(1)Restructuring (reversals) chargesÏÏÏÏÏÏÏÏÏÏÏÏÏÏÏÏÏÏÏÏÏÏÏÏÏÏ (7.3) 62.2 172.9 7.9 629.5Long-lived asset impairment and other charges ÏÏÏÏÏÏÏÏÏÏÏÏÏÏ 98.6 322.2 294.0 130.0 300.7Motorsports contract termination costs ÏÏÏÏÏÏÏÏÏÏÏÏÏÏÏÏÏÏÏÏÏ Ì 113.6 Ì Ì Ì
Total operating (income) expenses ÏÏÏÏÏÏÏÏÏÏÏÏÏÏÏÏÏÏÏÏÏÏÏÏÏÏ 6,378.5 6,481.4 6,193.6 5,783.3 6,963.0
OPERATING INCOME (LOSS) ÏÏÏÏÏÏÏÏÏÏÏÏÏÏÏÏÏÏÏÏÏÏÏÏÏÏ (104.2) (94.4) (31.9) 275.8 (364.5)
EXPENSES AND OTHER INCOME:Interest expense ÏÏÏÏÏÏÏÏÏÏÏÏÏÏÏÏÏÏÏÏÏÏÏÏÏÏÏÏÏÏÏÏÏÏÏÏÏÏÏÏ (181.9) (172.0) (206.6) (158.3) (169.1)Debt prepayment penalty ÏÏÏÏÏÏÏÏÏÏÏÏÏÏÏÏÏÏÏÏÏÏÏÏÏÏÏÏÏÏÏÏ (1.4) (9.8) (24.8) Ì ÌInterest incomeÏÏÏÏÏÏÏÏÏÏÏÏÏÏÏÏÏÏÏÏÏÏÏÏÏÏÏÏÏÏÏÏÏÏÏÏÏÏÏÏÏ 80.0 50.8 39.3 30.6 41.7Investment impairments ÏÏÏÏÏÏÏÏÏÏÏÏÏÏÏÏÏÏÏÏÏÏÏÏÏÏÏÏÏÏÏÏÏ (12.2) (63.4) (71.5) (40.3) (212.4)Litigation reversals (charges) ÏÏÏÏÏÏÏÏÏÏÏÏÏÏÏÏÏÏÏÏÏÏÏÏÏÏÏÏÏ Ì 32.5 (127.6) Ì ÌOther income (expense) ÏÏÏÏÏÏÏÏÏÏÏÏÏÏÏÏÏÏÏÏÏÏÏÏÏÏÏÏÏÏÏÏÏ 33.1 (10.7) 50.3 8.0 14.4
Total expenses and other income ÏÏÏÏÏÏÏÏÏÏÏÏÏÏÏÏÏÏÏÏÏÏÏÏÏÏÏÏ (82.4) (172.6) (340.9) (160.0) (325.4)
Income (loss) from continuing operations before provision forincome taxesÏÏÏÏÏÏÏÏÏÏÏÏÏÏÏÏÏÏÏÏÏÏÏÏÏÏÏÏÏÏÏÏÏÏÏÏÏÏÏÏÏÏÏ (186.6) (267.0) (372.8) 115.8 (689.9)Provision for (benefit of) income taxesÏÏÏÏÏÏÏÏÏÏÏÏÏÏÏÏÏÏÏÏÏ 81.9 262.2 242.7 106.4 (88.1)
Income (loss) from continuing operations of consolidatedcompanies ÏÏÏÏÏÏÏÏÏÏÏÏÏÏÏÏÏÏÏÏÏÏÏÏÏÏÏÏÏÏÏÏÏÏÏÏÏÏÏÏÏÏÏÏÏ (268.5) (529.2) (615.5) 9.4 (601.8)Income applicable to minority interests (net of tax) ÏÏÏÏÏÏÏÏÏÏ (16.7) (21.5) (27.0) (30.1) (27.3)Equity in net income of unconsolidated affiliates (net of tax) ÏÏ 13.3 5.8 2.4 5.9 3.2
Loss from continuing operations ÏÏÏÏÏÏÏÏÏÏÏÏÏÏÏÏÏÏÏÏÏÏÏÏÏÏÏÏ (271.9) (544.9) (640.1) (14.8) (625.9)Income from discontinued operations (net of tax) ÏÏÏÏÏÏÏÏÏÏÏÏÏ 9.0 6.5 101.0 31.5 15.5
Net income (loss) ÏÏÏÏÏÏÏÏÏÏÏÏÏÏÏÏÏÏÏÏÏÏÏÏÏÏÏÏÏÏÏÏÏÏÏÏÏÏÏÏ (262.9) (538.4) (539.1) 16.7 (610.4)Dividends on preferred stock ÏÏÏÏÏÏÏÏÏÏÏÏÏÏÏÏÏÏÏÏÏÏÏÏÏÏÏÏÏÏÏ 26.3 19.8 Ì Ì Ì
NET INCOME (LOSS) APPLICABLE TO COMMONSTOCKHOLDERS ÏÏÏÏÏÏÏÏÏÏÏÏÏÏÏÏÏÏÏÏÏÏÏÏÏÏÏÏÏÏÏÏÏÏÏÏÏ $ (289.2) $ (558.2) $ (539.1) $ 16.7 $ (610.4)
Earnings (loss) per share of common stock:Basic and diluted
Continuing operations ÏÏÏÏÏÏÏÏÏÏÏÏÏÏÏÏÏÏÏÏÏÏÏÏÏÏÏÏÏÏÏÏÏÏÏ $ (0.70) $ (1.36) $ (1.66) $ (0.04) $ (1.70)Discontinued operationsÏÏÏÏÏÏÏÏÏÏÏÏÏÏÏÏÏÏÏÏÏÏÏÏÏÏÏÏÏÏÏÏÏÏ 0.02 0.02 0.26 0.08 0.04
Total* ÏÏÏÏÏÏÏÏÏÏÏÏÏÏÏÏÏÏÏÏÏÏÏÏÏÏÏÏÏÏÏÏÏÏÏÏÏÏÏÏÏÏÏÏÏÏÏÏÏÏ $ (0.68) $ (1.34) $ (1.40) $ 0.04 $ (1.65)
Weighted average shares:Basic and diluted ÏÏÏÏÏÏÏÏÏÏÏÏÏÏÏÏÏÏÏÏÏÏÏÏÏÏÏÏÏÏÏÏÏÏÏÏÏÏÏ 424.8 415.3 385.5 376.1 369.0
OTHER DATACash dividends per share of common stock ÏÏÏÏÏÏÏÏÏÏÏÏÏÏÏÏÏ $ Ì $ Ì $ Ì $ 0.38 $ 0.38Cash dividends per share of preferred stock ÏÏÏÏÏÏÏÏÏÏÏÏÏÏÏÏÏ $ 14.50 $ 2.69 $ Ì $ Ì $ ÌCapital Expenditures ÏÏÏÏÏÏÏÏÏÏÏÏÏÏÏÏÏÏÏÏÏÏÏÏÏÏÏÏÏÏÏÏÏÏÏÏ $ (140.7) $ (194.0) $ (159.6) $ (171.4) $ (257.5)Market price on December 31,ÏÏÏÏÏÏÏÏÏÏÏÏÏÏÏÏÏÏÏÏÏÏÏÏÏÏÏÏ $ 9.65 $ 13.40 $ 15.60 $ 14.08 $ 29.02Number of EmployeesÏÏÏÏÏÏÏÏÏÏÏÏÏÏÏÏÏÏÏÏÏÏÏÏÏÏÏÏÏÏÏÏÏÏÏ 42,600 43,700 43,400 45,800 50,500
(1) Includes amortization expense of $161.0 in 2001.
* Earnings (loss) per share does not add due to rounding.
15

THE INTERPUBLIC GROUP OF COMPANIES, INC. AND SUBSIDIARIES
CONDENSED CONSOLIDATED BALANCE SHEETS(Amounts in Millions, Except Per Share Amounts)
As of December 31,
2005 2004 2003 2002 2001
ASSETS:
Cash and cash equivalents ÏÏÏÏÏÏÏÏÏÏÏÏÏÏ $ 2,075.9 $ 1,550.4 $ 1,871.9 $ 953.2 $ 938.1
Marketable securitiesÏÏÏÏÏÏÏÏÏÏÏÏÏÏÏÏÏÏÏ 115.6 420.0 195.1 30.7 21.2
Accounts receivable, net of allowances ÏÏÏÏ 4,015.7 4,319.2 4,106.3 4,263.4 4,403.9
Expenditures billable to clientsÏÏÏÏÏÏÏÏÏÏÏ 917.6 882.9 831.9 703.5 607.6
Deferred income taxesÏÏÏÏÏÏÏÏÏÏÏÏÏÏÏÏÏÏ 184.3 261.0 279.7 103.0 136.0
Prepaid expenses and other current assets 188.3 184.6 269.8 423.3 324.6
Total current assets ÏÏÏÏÏÏÏÏÏÏÏÏÏÏÏÏÏÏ 7,497.4 7,618.1 7,554.7 6,477.1 6,431.4
Land, buildings and equipment, netÏÏÏÏÏÏÏ 650.0 722.9 697.9 851.1 871.0
Deferred income taxesÏÏÏÏÏÏÏÏÏÏÏÏÏÏÏÏÏÏ 297.3 274.2 378.3 534.3 514.0
InvestmentsÏÏÏÏÏÏÏÏÏÏÏÏÏÏÏÏÏÏÏÏÏÏÏÏÏÏÏ 170.6 168.7 246.8 326.5 334.6
Goodwill ÏÏÏÏÏÏÏÏÏÏÏÏÏÏÏÏÏÏÏÏÏÏÏÏÏÏÏÏÏ 3,030.9 3,141.6 3,267.9 3,320.9 2,933.9
Other assets ÏÏÏÏÏÏÏÏÏÏÏÏÏÏÏÏÏÏÏÏÏÏÏÏÏÏ 299.0 328.2 322.3 397.9 379.9
Total non-current assets ÏÏÏÏÏÏÏÏÏÏÏÏÏÏ 4,447.8 4,635.6 4,913.2 5,430.7 5,033.4
TOTAL ASSETS ÏÏÏÏÏÏÏÏÏÏÏÏÏÏÏÏÏÏÏÏÏ $11,945.2 $12,253.7 $12,467.9 $11,907.8 $11,464.8
LIABILITIES:
Accounts payable ÏÏÏÏÏÏÏÏÏÏÏÏÏÏÏÏÏÏÏÏÏÏ $ 4,245.4 $ 4,733.5 $ 4,473.4 $ 4,333.0 $ 3,771.2
Accrued liabilities ÏÏÏÏÏÏÏÏÏÏÏÏÏÏÏÏÏÏÏÏÏ 2,554.3 2,485.2 2,420.0 2,314.5 2,501.0
Short-term debt ÏÏÏÏÏÏÏÏÏÏÏÏÏÏÏÏÏÏÏÏÏÏÏ 56.8 325.9 316.9 841.9 428.5
Total current liabilities ÏÏÏÏÏÏÏÏÏÏÏÏÏÏÏ 6,856.5 7,544.6 7,210.3 7,489.4 6,700.7
Long-term debt ÏÏÏÏÏÏÏÏÏÏÏÏÏÏÏÏÏÏÏÏÏÏÏ 2,183.0 1,936.0 2,198.7 1,822.2 2,484.6
Deferred compensation and employeebenefits ÏÏÏÏÏÏÏÏÏÏÏÏÏÏÏÏÏÏÏÏÏÏÏÏÏÏÏÏ 592.1 590.7 548.6 534.9 438.6
Other non-current liabilities ÏÏÏÏÏÏÏÏÏÏÏÏÏ 319.0 408.9 326.7 270.7 177.3
Minority interests in consolidatedsubsidiaries ÏÏÏÏÏÏÏÏÏÏÏÏÏÏÏÏÏÏÏÏÏÏÏÏÏ 49.3 55.2 64.8 68.0 84.0
Total non-current liabilitiesÏÏÏÏÏÏÏÏÏÏÏÏ 3,143.4 2,990.8 3,138.8 2,695.8 3,184.5
TOTAL LIABILITIES ÏÏÏÏÏÏÏÏÏÏÏÏÏÏÏÏ 9,999.9 10,535.4 10,349.1 10,185.2 9,885.2
TOTAL STOCKHOLDERS' EQUITY ÏÏ 1,945.3 1,718.3 2,118.8 1,722.6 1,579.6
TOTAL LIABILITIES ANDSTOCKHOLDERS' EQUITY ÏÏÏÏÏÏÏÏ $11,945.2 $12,253.7 $12,467.9 $11,907.8 $11,464.8
Certain classification revisions have been made to the prior period financial statements to conform tothe current year presentation. These classification revisions included amounts previously recorded incurrent assets as accounts receivable of $537.7, $528.6, $315.8 and $249.2 to expenditures billable toclients and amounts previously recorded in current liabilities as accounts payable of $1,411.5, $1,197.0,$1,075.1 and $1,010.0 to accrued liabilities in the accompanying Consolidated Balance Sheets as ofDecember 31, 2004, 2003, 2002 and 2001, respectively. The classification of these amounts were revised tomore appropriately reflect the composition of the year end balances of accounts receivable as amountsbilled to clients and accounts payable as amounts for which we have received invoices from vendors. Theseclassification revisions had no impact on our results of operations or changes in our stockholders' equity.
16

THE INTERPUBLIC GROUP OF COMPANIES, INC. AND SUBSIDIARIESMANAGEMENT'S DISCUSSION AND ANALYSIS OF
FINANCIAL CONDITION AND RESULTS OF OPERATIONS(Amounts in Millions, Except Per Share Amounts)
Item 7. Management's Discussion and Analysis of Financial Condition and Results of Operations
The following Management's Discussion and Analysis of Financial Condition and Results ofOperations (""MD&A'') is intended to help you understand The Interpublic Group of Companies, Inc. andits subsidiaries (the ""Company'', ""Interpublic'', ""we'', ""us'' or ""our''). MD&A is provided as a supplementto and should be read in conjunction with our financial statements and the accompanying notes. OurMD&A includes the following sections:
OVERVIEW provides a description of our business, the drivers of our business, and how we analyzeour business. It then provides an analysis of our 2005 performance and a description of the significantevents impacting 2005 and thereafter.
RESULTS OF OPERATIONS provides an analysis of the consolidated and segment results ofoperations for 2005 compared to 2004 and 2004 compared to 2003.
LIQUIDITY AND CAPITAL RESOURCES provides an overview of our cash flows, financing,contractual obligations and derivatives and hedging activities.
INTERNAL CONTROL OVER FINANCIAL REPORTING provides a description of the status ofour compliance with Section 404 of the Sarbanes-Oxley Act of 2002 and related rules. For more detail,see Item 8, Financial Statements and Supplementary Data, and Item 9A, Controls and Procedures.
LIABILITIES RELATED TO OUR PRIOR RESTATEMENT provides a description and updateof the significant liabilities recorded as part of our previously reported restated financial statements for theyears ended December 31, 2003, 2002, 2001 and 2000 (""Prior Restatement''). For additional information,see Item 8, Financial Statements and Supplementary Data.
OUT OF PERIOD ADJUSTMENTS provides a description and impact of amounts recorded as partof our 2005 financial statements which relate to a prior annual period. The out of period adjustmentsprimarily relate to errors in accounting related to vendor credits or discounts, income taxes as well as theimpact of other miscellaneous adjustments.
CRITICAL ACCOUNTING ESTIMATES provides a discussion of our accounting policies thatrequire critical judgment, assumptions and estimates.
OTHER MATTERS provides a discussion of our significant non-operational items which impact ourfinancial statements, such as the SEC investigation.
RECENT ACCOUNTING STANDARDS by reference to Note 22 to the Consolidated FinancialStatements, provides a description of accounting standards which we have not yet been required toimplement and may be applicable to our future operations, as well as those significant accountingstandards which were adopted during 2005.
OVERVIEW
Our Business
We are one of the world's largest advertising and marketing services companies, comprised of hundreds ofcommunication agencies around the world that deliver custom marketing solutions on behalf of our clients. Ouragencies cover the spectrum of marketing disciplines and specialties, from traditional services such as consumeradvertising and direct marketing, to newer disciplines such as experiential marketing and brandedentertainment. With offices in over 100 countries and approximately 43,000 employees, our agencies work withour clients to create global and local marketing campaigns that cross borders and media. These marketingprograms seek to build brands, influence consumer behavior and sell products.
17

THE INTERPUBLIC GROUP OF COMPANIES, INC. AND SUBSIDIARIESMANAGEMENT'S DISCUSSION AND ANALYSIS OF
FINANCIAL CONDITION AND RESULTS OF OPERATIONS Ì (Continued)(Amounts in Millions, Except Per Share Amounts)
Interpublic maintains separate agency brands to manage the broadest range of clients, even ones thatoperate in similar business areas. Having distinct agencies allows us to avoid potential conflicts of interestamong our clients in the same industry. To help manage these companies effectively, however, we haveorganized our agencies into five global operating divisions. Four of these divisions, McCann WorldGroup(""McCann''), The FCB Group (""FCB''), Lowe Worldwide (""Lowe'') and Draft Worldwide (""Draft''),provide a distinct, comprehensive array of global communications and marketing services. The fifth globaloperating division, The Constituency Management Group (""CMG''), which includes Weber Shandwick,MWW Group, FutureBrand, DeVries, Golin Harris, Jack Morton and Octagon Worldwide (""Octagon''),provides clients with diversified services, including public relations, meeting and event production, sportsand entertainment marketing, corporate and brand identity and strategic marketing consulting.
A group of leading stand-alone agencies provide clients with a full range of advertising and marketingservices. These agencies partner with our global operating groups as needed, and include Campbell-Ewald,Hill Holiday, Deutsch and Mullen.
We believe this organizational structure allows us to provide comprehensive solutions for clients,enables stronger financial and operational growth opportunities and allows us to improve operatingefficiencies within our organization. We practice a decentralized management style, providing agencymanagement with a great deal of operational autonomy, while holding them broadly responsible for theiragencies' financial and operational performance.
As of December 31, 2005, for financial reporting purposes we have three reportable segments. Thelargest segment, Integrated Agency Networks (""IAN''), is comprised of McCann, FCB, Lowe, Draft, ourmedia agencies, and our leading stand-alone agencies. CMG comprises our second reportable segment.Our third reportable segment is comprised of our Motorsports operations (""Motorsports''), which weresold during 2004 and had immaterial residual operating results in 2005.
Business Drivers
Our revenues are primarily derived from the planning and execution of advertising programs in variousmedia and the planning and execution of other marketing and communications programs. Most of ourclient contracts are individually negotiated and accordingly, the terms of client engagements and the basison which we earn commissions and fees vary significantly. Our client contracts are also becomingincreasingly complex arrangements that frequently include provisions for incentive compensation andgovern vendor rebates and credits.
Revenues for creation, planning and placement of advertising are primarily determined on a negotiatedfee basis and, to a lesser extent, on a commission basis. Fees are usually calculated to reflect hourly ratesplus proportional overhead and a mark-up. Many clients include an incentive compensation component intheir total compensation package. This provides added revenue based on achieving mutually agreed-uponqualitative and/or quantitative metrics within specified time periods. Commissions are earned based onservices provided, and are usually derived from a percentage or fee over the total cost to complete theassignment. Commissions can also be derived when clients pay us the gross rate billed by media and wepay for media at a lower net rate; the difference is the commission that we earn, which is either retainedin total or shared with the client depending on the nature of the services agreement.
We pay media charges with respect to contracts for advertising time or space that we place on behalfof our clients. To reduce our risk from a client's non-payment, we typically pay media charges only afterwe receive funds from our clients. Generally, we act as the client's agent rather than the primary obligor.In some instances we agree with the media provider that we will only be liable to pay the media after theclient has paid us for the media charges.
18

THE INTERPUBLIC GROUP OF COMPANIES, INC. AND SUBSIDIARIESMANAGEMENT'S DISCUSSION AND ANALYSIS OF
FINANCIAL CONDITION AND RESULTS OF OPERATIONS Ì (Continued)(Amounts in Millions, Except Per Share Amounts)
We also generate revenue in negotiated fees from our public relations, sales promotion, eventmarketing, sports and entertainment marketing and corporate and brand identity services.
Our revenue is directly dependent upon the advertising, marketing and corporate communicationsrequirements of our clients and tends to be higher in the second half of the calendar year as a result of theholiday season and lower in the first half as a result of the post-holiday slow-down in client activity.Depending on the terms of the client contract, fees for services performed can be primarily recognizedthree ways: proportional performance, straight-line (or monthly basis) or completed contract. Fee revenuerecognized on a completed contract basis also contributes to the higher seasonal revenues experienced inthe fourth quarter due to the majority of our contracts ending at December 31. As is customary in theindustry, these contracts provide for termination by either party on relatively short notice, usually 90 days.See Note 1 to the Consolidated Financial Statements for further discussion of our revenue recognitionaccounting policies.
Our revenue is driven by our ability to maintain and grow existing business, as well as generate newbusiness. Our business is directly affected by economic conditions in the industries and regions we serveand by the marketing and advertising requirements and practices of our clients and potential clients. Wheneconomic conditions decline, companies generally decrease advertising and marketing budgets, and itbecomes more difficult to achieve profitability. Our business is highly competitive, which tends to mitigateour pricing power and that of our competition.
We believe that expanding the range of services we provide to our key clients is critical to ourcontinued growth. We are focused on strengthening our collaboration across agencies, which we believewill increase our ability to better service existing clients and win new clients.
2005 Performance
The primary focus of our business analysis is on operating performance, specifically, changes inrevenues and operating expenses.
We analyze the increase or decrease in revenue by reviewing the components of the change, including:the impact of foreign currency exchange rate changes, the impact of net acquisitions and divestitures, andthe balance, which we refer to as organic revenue change. As economic conditions and demand for ourservices can vary between geographic regions, we also analyze revenues by domestic and internationalsources.
Our operating expenses are in two primary categories: salaries and related expenses, and office andgeneral expenses. As with revenue, we analyze the increase or decrease in operating expenses by reviewingthe following components of the change: the impact of foreign currency exchange rate changes, the impactof net acquisitions and divestitures, and the organic component of the change. Salaries and relatedexpenses tend to fluctuate with changes in revenues and are measured as a percentage of revenues. Officeand general expenses, which have both a fixed and variable component, tend not to vary as much withrevenue.
Our financial performance over the past several years has lagged behind that of our industry peers,due to lower revenue growth, as well as impairment, restructuring and other charges. 2005 performancewas impacted by higher salaries and related and office and general expenses and lower revenues asdiscussed in more detail below. However, both impairment and restructuring charges have decreased andwe are no longer burdened with Motorsports related costs.
19

THE INTERPUBLIC GROUP OF COMPANIES, INC. AND SUBSIDIARIESMANAGEMENT'S DISCUSSION AND ANALYSIS OF
FINANCIAL CONDITION AND RESULTS OF OPERATIONS Ì (Continued)(Amounts in Millions, Except Per Share Amounts)
Strategic Initiatives
Organic revenue growth and improving operating margin are our key corporate metrics. Ourperformance priorities are to:
‚ Achieve organic revenue growth by strengthening collaboration among our agencies, increasing thenumber of marketing services provided to existing clients and winning new clients. We haveestablished a supplemental incentive plan, expanded internal tools and resources, and heightenedinternal communications aimed at encouraging collaboration. We have also focused our efforts onattracting and retaining the highest quality industry talent and further improving client retention.We analyze our performance by calculating the percentage increase in revenue related to organicgrowth between comparable periods.
‚ Improve operating margin by increasing revenue and by controlling salaries and related expenses, aswell as office and general expenses. In addition, we are working to improve our back officeefficiency through our shared services initiatives as well as improve our real estate utilization. Weanalyze our performance by comparing revenue to prior periods and measuring salaries and relatedexpenses, as well as office and general expenses, as a percentage of revenue. We define operatingmargin as operating income divided by reported revenue.
Our revenue is directly dependent upon the advertising, marketing and corporate communicationsrequirements of our clients. Historically, we typically experience increased revenue and profitability in thefourth quarter of our fiscal year as a result of increased holiday-related client spending activity. Theincrease in fourth quarter revenue and profitability is also attributable to higher seasonal revenues due tothe timing of revenue recognition for contracts that are accounted for on the completed contract method.For the three years ended December 31, 2005, 2004 and 2003, our fourth quarter revenue as a percentageof the respective full year revenue was approximately 30% for all years.
Organic ChangesOrganic Changes for the Three
for the Years Ended Months EndedDecember 31, December 31,
Increase (Decrease) 2005 2004 2005 2004
Revenue ÏÏÏÏÏÏÏÏÏÏÏÏÏÏÏÏÏÏÏÏÏÏÏÏÏÏÏÏÏÏÏÏÏÏÏÏÏÏÏÏÏÏÏ $(45.7) $ 75.6 $(34.1) $44.5
Salaries and related expenses ÏÏÏÏÏÏÏÏÏÏÏÏÏÏÏÏÏÏÏÏÏÏÏÏÏÏ $293.4 $142.6 $116.7 $73.6
Office and general expenses ÏÏÏÏÏÏÏÏÏÏÏÏÏÏÏÏÏÏÏÏÏÏÏÏÏÏÏ $112.4 $(13.9) $ 26.3 $47.1
The organic decrease in revenue for the year ended and three months ended December 31, 2005 was$45.7 and $34.1, respectively when compared to the comparative period in 2004. Operating margindeclined for the year ended and three months ended December 31, 2005 due to a significant organicincrease in salaries and related expenses for the year ended and three months ended December 31, 2005 of$293.4 and $116.7, respectively when compared to the prior year, and an organic increase in office andgeneral expenses for year ended and three months ended December 31, 2005 of $112.4 and $26.3,respectively when compared to the prior year. See below for discussion of the drivers of these changes.
Included in our results of operations for the three months ended December 31, 2005 were certain outof period adjustments that resulted in decreased revenue and operating income of $17.3 and $21.6,respectively. When compared to the slight organic decrease in revenue and significant organic increase insalaries and related expenses and office and general expenses for the three months ended December 31,2005, these out of period adjustments were immaterial to our quarterly results of operations. Theseadjustments were immaterial to the annual period ended December 31, 2005 and to any other prior annualperiod.
20

THE INTERPUBLIC GROUP OF COMPANIES, INC. AND SUBSIDIARIESMANAGEMENT'S DISCUSSION AND ANALYSIS OF
FINANCIAL CONDITION AND RESULTS OF OPERATIONS Ì (Continued)(Amounts in Millions, Except Per Share Amounts)
For the Years For the ThreeEnded Months Ended
December 31, December 31,
2005 2004 2005 2004
Organic revenue change percentage (vs. prior year) ÏÏÏÏÏÏÏÏÏÏÏ (0.7)% 1.2% (1.7)% 2.4%
Operating margin percentage ÏÏÏÏÏÏÏÏÏÏÏÏÏÏÏÏÏÏÏÏÏÏÏÏÏÏÏÏÏÏ (1.7)% (1.5)% 3.0% 15.9%
Salaries and related expenses as a percentage of revenue ÏÏÏÏÏÏÏ 63.7% 58.4% 58.4% 52.0%
Office and general expenses as a percentage of revenue ÏÏÏÏÏÏÏÏ 36.5% 35.2% 33.6% 32.1%
Organic revenue growth. In 2005, we experienced a small organic revenue decrease, compared tosmall organic revenue growth in 2004. The decrease resulted from client losses and a reduction in revenuefrom existing clients at IAN, offset partially by an increase at CMG due to client wins and additionalbusiness from existing clients in the U.S. and Europe. As a result, there were domestic and internationalorganic revenue decreases of 0.5% and 0.9%, respectively. We experienced a small organic revenuedecrease for the three months ended December 31, 2005 when compared to the comparative periods in2004.
Operating margin. Our operating margin was negative in 2005 and 2004. The decline in 2005 resultedfrom organic revenue decreases and increases in salaries and related as well as office and general expenses.Salaries and related expenses increased, both in absolute terms and as a percentage of revenues, due toincreased severance expense as international headcount reductions occurred across several agencies. Inaddition, the increase was attributable to hiring additional creative talent to enable future revenue growthand additional staff to address weaknesses in our accounting and control environment and to developshared services, which almost offset the number of employees severed. Office and general expensesincreased, both in absolute terms and as a percentage of revenues, primarily due to higher professional feesassociated with the Prior Restatement and our ongoing efforts in internal control compliance. Salaryexpense attributable to the additional headcount and the costs of remedying our internal controlweaknesses will continue to be significant in 2006.
These negative impacts to operating margin were partially offset by a decrease in the amount ofcharges related to impairment, restructuring and contract termination costs. If not for the reduction inthese charges, our operating margin would have deteriorated significantly from 2004 to 2005 as describedabove. During 2005, we recorded asset impairments of $98.6, restructuring reversals of $7.3 and had nocontract termination charges related to the Motorsports business, which is a $406.7 decrease whencompared to these charges in 2004. Operating margin in 2004 was impacted by approximately $322.2 ofasset impairment charges, $62.2 of restructuring charges and $113.6 of contract termination costs relatedto the Motorsports business.
For the three months ended December 31, 2005 and 2004, our operating margin decreasedsignificantly, to 3.0% from 15.9%. The decline in 2005 resulted from significant increases in salaries andrelated expenses and impairment charges, as well an increase in office and general expenses and an organicrevenue decrease. Salaries and related expenses significantly increased, both in absolute terms and as apercentage of revenues, primarily due to an increase in severance expense as international headcountreductions occurred across several agencies as a result of client losses. In addition, the increase wasattributable to hiring additional creative talent to enable future revenue growth and staff to addressweaknesses in our accounting and control environment. During the three months ended December 31,2005, impairment charges of $92.1 were recorded primarily related to our Lowe reporting unit following amajor client loss and recent management defections. Office and general expenses increased, both inabsolute terms and as a percentage of revenues, primarily due to higher production and media expenses
21

THE INTERPUBLIC GROUP OF COMPANIES, INC. AND SUBSIDIARIESMANAGEMENT'S DISCUSSION AND ANALYSIS OF
FINANCIAL CONDITION AND RESULTS OF OPERATIONS Ì (Continued)(Amounts in Millions, Except Per Share Amounts)
due to an increase in arrangements where we act as principal, which requires us to record expenses on agross basis, as well as higher professional fees.
Significant 2005 Activity and Subsequent Events
Income Statement
‚ Total salaries and related expenses increased by approximately $266.1 to $3,999.1 for 2005. Thisincrease includes higher severance expense, which increased by approximately $87.9 to $162.5.Severance activity in 2005 covered approximately 3,000 employees, of which approximately 2,500had left the Company by year-end. Our severance actions were concentrated in our internationalbusinesses and included several agencies, mostly within IAN. The increase of salaries and relatedexpenses was also attributable to hiring in several areas of our business, including creative talent toenable future revenue growth, and finance and information technology staff to address weaknessesin our accounting and control environment, as well as to develop shared services, whichapproximately offset the number of employees addressed by severance during the year.
‚ A net charge of $69.9 was recorded to increase our valuation allowance for deferred income taxassets primarily relating to foreign net operating loss carry forwards, in relation to which we do nothave the historical earning trends or tax planning strategies necessary to recognize the benefits ofoperating losses. See Note 11 to the Consolidated Financial Statements for additional information.
‚ Total professional fees increased $94.8 to $332.8 for 2005. These increases related primarily to ourongoing efforts in internal control compliance, the Prior Restatement process and the preliminaryapplication development and maintenance of information technology systems and processes relatedto our shared services initiatives. Professional fees are included in office and general expenses in theConsolidated Statements of Operations.
‚ Long-lived asset impairment charges of $98.6 were recorded, including $91.0 of goodwillimpairments at Lowe following a major client loss and recent management defections and $5.8 atan agency within our sports and entertainment marketing business. See Note 9 to the ConsolidatedFinancial Statements for additional information.
Operating Cash Flow
‚ Our operating activities utilized cash of approximately $20.2, compared to cash provided byoperating activities of $464.8 in 2004. The decrease in cash provided by operating activities in 2005was primarily attributable to significant increases in our operating costs. Additional cash was usedduring 2005 for severance costs primarily related to international headcount reductions, salary costsprimarily attributable to our hiring additional creative talent to enable future revenue growth andadditional staff to address weaknesses in our accounting and control environment, and professionalfees primarily related to our Prior Restatement and our ongoing efforts in internal controlcompliance. The decrease in cash provided by operating activities in 2005 was also attributable toyear-over-year changes in working capital accounts.
Financing Activities
‚ Throughout 2005, we entered into waivers and amendments to our 364-Day and Three-YearRevolving Credit Facilities related to our reporting requirements, financial covenants and the PriorRestatement.
22

THE INTERPUBLIC GROUP OF COMPANIES, INC. AND SUBSIDIARIESMANAGEMENT'S DISCUSSION AND ANALYSIS OF
FINANCIAL CONDITION AND RESULTS OF OPERATIONS Ì (Continued)(Amounts in Millions, Except Per Share Amounts)
‚ In July 2005, we completed the issuance and sale of our $250.0 Floating Rate Notes due 2008 andused the proceeds to redeem all $250.0 of our 7.875% Senior Unsecured Notes maturing October2005.
‚ In September 2005 our $250.0 364-Day Revolving Credit Facility expired.
‚ In October 2005, we added a new bank to the syndicate of our Three-Year Revolving CreditFacility, increasing the size of the facility by $50.0 to $500.0.
‚ In October 2005, we issued 0.525 shares of our 5.25% Series B Cumulative Convertible PerpetualPreferred Stock at gross proceeds of $525.0, with net proceeds totaling approximately $507.3 afterdeducting discounts to the initial purchasers and the estimated expenses of the offering.
Subsequent to 2005
‚ On March 21, 2006, we entered into an amendment to our Three-Year Revolving Credit Facility,effective as of December 31, 2005. The amendment changed the financial covenants with respect toperiods ended December 31, 2005, March 31, 2006 and June 30, 2006, added a new minimum cashbalance covenant and amended the provisions governing letters of credit to permit the issuance ofletters of credit with expiration dates beyond the termination date of the facility, subject to certainconditions. We also obtained a waiver from the lenders under the Three-Year Revolving CreditFacility in March, 2006, to waive any default arising from the restatement of our financialspresented in this report.
RESULTS OF OPERATIONS
Consolidated Results of Operations Ì 2005 Compared to 2004
REVENUE
The components of the 2005 change were as follows:
Total Domestic International
$ % Change $ % Change % of Total $ % Change % of Total
2004 ÏÏÏÏÏÏÏÏÏÏÏÏÏÏÏÏÏÏÏÏÏÏ $6,387.0 $3,509.2 54.9% $2,877.8 45.1%
Foreign currency changes ÏÏÏÏ 40.4 0.6% Ì 0.0% 40.4 1.4%
Net acquisitions/divestitures ÏÏ (107.4) (1.7)% (28.9) (0.8)% (78.5) (2.7)%
Organic ÏÏÏÏÏÏÏÏÏÏÏÏÏÏÏÏÏÏÏ (45.7) (0.7)% (19.2) (0.5)% (26.5) (0.9)%
Total change ÏÏÏÏÏÏÏÏÏÏÏÏÏ (112.7) (1.8)% (48.1) (1.4)% (64.6) (2.2)%
2005 ÏÏÏÏÏÏÏÏÏÏÏÏÏÏÏÏÏÏÏÏÏÏ $6,274.3 $3,461.1 55.2% $2,813.2 44.8%
For the year ended December 31, 2005, consolidated revenues decreased $112.7, or 1.8%, ascompared to 2004, which was attributable to the effect of net acquisitions and divestitures of $107.4 andan organic revenue decrease of $45.7, partially offset by favorable foreign currency exchange rate changesof $40.4.
The increase due to foreign currency changes was primarily attributable to the strengthening of theBrazilian Real and the Canadian Dollar in relation to the U.S. Dollar, which primarily affected our IANsegment. The net effect of acquisitions and divestitures is comprised of $46.0 at IAN, largely fromdispositions at McCann during 2005, $12.1 at CMG and $49.3 from the sale of the Motorsports businessduring 2004.
23

THE INTERPUBLIC GROUP OF COMPANIES, INC. AND SUBSIDIARIESMANAGEMENT'S DISCUSSION AND ANALYSIS OF
FINANCIAL CONDITION AND RESULTS OF OPERATIONS Ì (Continued)(Amounts in Millions, Except Per Share Amounts)
During 2005, the organic revenue decrease of $45.7, or 0.7%, was driven by a decrease at IAN,partially offset by an increase at CMG. The decrease at IAN was a result of client losses and a reductionin revenue from existing clients primarily in our European offices. The increase at CMG was primarilydriven by growth in public relations and sports marketing business both domestically and internationally asa result of increased revenue from existing clients and new client wins.
For 2006, we expect the organic change in revenue to be flat or to decline due to the continuingimpact of client losses that we experienced during 2005.
Our revenue recognition policies are in accordance with Staff Accounting Bulletin (""SAB'') No. 104,Revenue Recognition. This accounting guidance governs the timing of when revenue is recognized.Accordingly, if work is being performed in a given quarter but there is insufficient evidence of anarrangement, the related revenue is deferred to a future quarter when the evidence is obtained. However,our costs of services are primarily expensed as incurred, except that incremental direct costs may bedeferred under a significant long term contract until complete. With revenue being deferred untilcompletion of the contract and costs primarily expensed as incurred, this will have a negative impact onour operating margin until the revenue can be recognized and in the period of revenue recognition. Whilethis will not affect cash flow and did not have a significant impact on revenue recognition in 2005 ascompared to 2004, it may affect organic revenue growth and margins in future periods. This effect is likelyto be greater in comparing quarters than in comparing full years.
In addition, we fulfill the role of an agent in most of our customer contracts however, in certainarrangements we act as principal. In accordance with Emerging Issues Task Force (""EITF'') IssueNo. 99-19, when we act as principal, we recognize gross revenue and expenses inclusive of external mediaor production costs; when we act as an agent, we recognize revenue net of such costs. The mix of wherewe act as agent and where we act as principal is contract-dependent and varies from agency to agency, andfrom period to period. Accordingly, while our cash flows and profitability are not impacted, and while thiseffect did not have a significant impact on revenue in 2005 compared to 2004, it may affect organicrevenue growth patterns in future periods.
OPERATING EXPENSES
For the Years Ended December 31,
2005 2004
% of % of$ Revenue $ Revenue $ Change % Change
Salaries and related expenses ÏÏ $3,999.1 63.7% $3,733.0 58.4% $ 266.1 7.1%
Office and general expenses ÏÏÏ 2,288.1 36.5% 2,250.4 35.2% 37.7 1.7%
Restructuring chargesÏÏÏÏÏÏÏÏÏ (7.3) 62.2 (69.5) (111.7)%
Long-lived asset impairmentand other charges ÏÏÏÏÏÏÏÏÏÏ 98.6 322.2 (223.6) (69.4)%
Motorsports contracttermination costsÏÏÏÏÏÏÏÏÏÏÏ Ì 113.6 (113.6) (100.0)%
Total operating expenses ÏÏÏÏ $6,378.5 $6,481.4 $(102.9) (1.6)%
24

THE INTERPUBLIC GROUP OF COMPANIES, INC. AND SUBSIDIARIESMANAGEMENT'S DISCUSSION AND ANALYSIS OF
FINANCIAL CONDITION AND RESULTS OF OPERATIONS Ì (Continued)(Amounts in Millions, Except Per Share Amounts)
Salaries and Related Expenses
The components of the 2005 change were as follows:
Total % of$ % Change Revenue
2004 ÏÏÏÏÏÏÏÏÏÏÏÏÏÏÏÏÏÏÏÏÏÏÏÏÏÏÏÏÏÏÏÏÏÏÏÏÏÏÏÏÏÏÏÏÏÏÏÏÏÏÏ $3,733.0 58.4%
Foreign currency changesÏÏÏÏÏÏÏÏÏÏÏÏÏÏÏÏÏÏÏÏÏÏÏÏÏÏÏÏÏÏÏÏÏÏ 19.3 0.5%
Net acquisitions/divestitures ÏÏÏÏÏÏÏÏÏÏÏÏÏÏÏÏÏÏÏÏÏÏÏÏÏÏÏÏÏÏÏ (46.6) (1.2)%
OrganicÏÏÏÏÏÏÏÏÏÏÏÏÏÏÏÏÏÏÏÏÏÏÏÏÏÏÏÏÏÏÏÏÏÏÏÏÏÏÏÏÏÏÏÏÏÏÏÏÏ 293.4 7.9%
Total change ÏÏÏÏÏÏÏÏÏÏÏÏÏÏÏÏÏÏÏÏÏÏÏÏÏÏÏÏÏÏÏÏÏÏÏÏÏÏÏÏÏÏÏÏ 266.1 7.1%
2005 ÏÏÏÏÏÏÏÏÏÏÏÏÏÏÏÏÏÏÏÏÏÏÏÏÏÏÏÏÏÏÏÏÏÏÏÏÏÏÏÏÏÏÏÏÏÏÏÏÏÏÏ $3,999.1 63.7%
Salaries and related expenses are the largest component of operating expenses and consist primarily ofsalaries and related benefits, and performance incentives. During 2005, salaries and related expensesincreased to 63.7% of revenues, compared to 58.4% in 2004. In 2005, salaries and related expensesincreased $293.4, excluding the increase related to foreign currency exchange rate changes of $19.3 and adecrease related to net acquisitions and divestitures of $46.6.
Salaries and related expenses were impacted by changes in foreign currency rates, primarilyattributable to the strengthening of the Brazilian Real and the Canadian Dollar in relation to theU.S. Dollar. The increase due to foreign currency rate changes was partially offset by the impact of netacquisitions and divestitures activity, which resulted largely from dispositions at McCann during 2005 andthe sale of the Motorsports business during 2004.
The increase in salaries and related expenses, both in absolute terms and as a percentage of revenue,excluding the impact of foreign currency and net acquisitions and divestitures, was primarily the result ofhigher severance expense, largely recorded in the fourth quarter for international headcount reductionswithin IAN as a result of client losses. In addition, the increase was attributable to our hiring additionalcreative talent to enable future revenue growth and additional staff to address weaknesses in ouraccounting and control environment and develop shared services at certain locations, which almost offsetthe number of employees severed. The increase in salaries and related expense as a percentage of revenuewas also due, in part, to the fact that revenue decreased at the same time that salaries and relatedexpenses increased for the reasons explained above.
Office and General Expenses
The components of the 2005 change were as follows:
Total % of$ % Change Revenue
2004 ÏÏÏÏÏÏÏÏÏÏÏÏÏÏÏÏÏÏÏÏÏÏÏÏÏÏÏÏÏÏÏÏÏÏÏÏÏÏÏÏÏÏÏÏÏÏÏÏÏÏÏ $2,250.4 35.2%
Foreign currency changesÏÏÏÏÏÏÏÏÏÏÏÏÏÏÏÏÏÏÏÏÏÏÏÏÏÏÏÏÏÏÏÏÏÏ 13.9 0.6%
Net acquisitions/divestitures ÏÏÏÏÏÏÏÏÏÏÏÏÏÏÏÏÏÏÏÏÏÏÏÏÏÏÏÏÏÏÏ (88.6) (3.9)%
OrganicÏÏÏÏÏÏÏÏÏÏÏÏÏÏÏÏÏÏÏÏÏÏÏÏÏÏÏÏÏÏÏÏÏÏÏÏÏÏÏÏÏÏÏÏÏÏÏÏÏ 112.4 5.0%
Total change ÏÏÏÏÏÏÏÏÏÏÏÏÏÏÏÏÏÏÏÏÏÏÏÏÏÏÏÏÏÏÏÏÏÏÏÏÏÏÏÏÏÏÏÏ 37.7 1.7%
2005 ÏÏÏÏÏÏÏÏÏÏÏÏÏÏÏÏÏÏÏÏÏÏÏÏÏÏÏÏÏÏÏÏÏÏÏÏÏÏÏÏÏÏÏÏÏÏÏÏÏÏÏ $2,288.1 36.5%
25

THE INTERPUBLIC GROUP OF COMPANIES, INC. AND SUBSIDIARIESMANAGEMENT'S DISCUSSION AND ANALYSIS OF
FINANCIAL CONDITION AND RESULTS OF OPERATIONS Ì (Continued)(Amounts in Millions, Except Per Share Amounts)
Office and general expenses primarily consists of rent, office and equipment, depreciation, professionalfees, other overhead expenses and certain out-of-pocket expenses related to our revenue. During 2005,office and general expenses increased to 36.5% of revenues, compared to 35.2% in 2004, largely due to thedecrease in revenue year on year. In 2005, office and general expenses increased $112.4, excluding theincrease related to foreign currency exchange rate changes of $13.9 and a decrease related to netacquisitions and divestitures of $88.6.
Office and general expenses were impacted by changes in foreign currency rates, primarily attributableto the strengthening of the Brazilian Real and Canadian Dollar in relation to the U.S. Dollar. The increasedue to foreign currency rate changes was offset by the impact of net acquisitions and divestitures activity,which resulted largely from dispositions at McCann during 2005 and the sale of the Motorsports businessand McCann's Transworld Marketing during 2004.
The increase in office and general expenses, excluding the impact of foreign currency and netacquisition and divestitures activity, was primarily the result of higher professional fees at both IAN andour Corporate group driven by our ongoing efforts in internal control compliance, the Prior Restatementprocess and the preliminary application development and maintenance of information technology systemsand processes related to our shared services initiatives. Except for the costs associated with the PriorRestatement process, these costs will continue to significantly impact financial results in 2006.
Restructuring (Reversals) Charges
During 2005 and 2004, we recorded net (reversals) and charges related to lease termination and otherexit costs and severance and termination costs for the 2003 and 2001 restructuring programs of ($7.3) and$62.2, respectively. Included in the net (reversals) and charges were adjustments resulting from changes inmanagement's estimates for the 2003 and 2001 restructuring programs which decreased the restructuringreserves by $9.3 and $32.0 in 2005 and 2004, respectively. 2005 net reversals primarily consisted ofchanges to management's estimates for the 2003 and 2001 restructuring programs primarily relating to ourlease termination costs. 2004 net charges primarily related to the vacating of 43 offices and workforcereduction of approximately 400 employees related to the 2003 restructuring program and adjustments tomanagement's estimates for the 2001 restructuring program. A summary of the net (reversals) and chargesby segment is as follows:
Lease Termination andOther Exit Costs Severance and Termination Costs
2003 2001 2003 2001Program Program Total Program Program Total Total
2005 Net (Reversals) Charges
IAN ÏÏÏÏÏÏÏÏÏÏÏÏÏÏÏÏÏÏÏÏÏÏÏÏÏÏÏÏÏÏÏÏÏÏ $(6.3) $(0.3) $(6.6) $(0.4) $ Ì $(0.4) $(7.0)
CMG ÏÏÏÏÏÏÏÏÏÏÏÏÏÏÏÏÏÏÏÏÏÏÏÏÏÏÏÏÏÏÏÏÏ 1.1 0.2 1.3 (0.7) Ì (0.7) 0.6
CorporateÏÏÏÏÏÏÏÏÏÏÏÏÏÏÏÏÏÏÏÏÏÏÏÏÏÏÏÏÏÏ (0.2) (0.4) (0.6) (0.3) Ì (0.3) (0.9)
TotalÏÏÏÏÏÏÏÏÏÏÏÏÏÏÏÏÏÏÏÏÏÏÏÏÏÏÏÏÏÏÏÏ $(5.4) $(0.5) $(5.9) $(1.4) $ Ì $(1.4) $(7.3)
2004 Net (Reversals) Charges
IAN ÏÏÏÏÏÏÏÏÏÏÏÏÏÏÏÏÏÏÏÏÏÏÏÏÏÏÏÏÏÏÏÏÏÏ $40.3 $(7.3) $33.0 $14.1 $(4.3) $ 9.8 $42.8
CMG ÏÏÏÏÏÏÏÏÏÏÏÏÏÏÏÏÏÏÏÏÏÏÏÏÏÏÏÏÏÏÏÏÏ 8.1 4.0 12.1 5.1 (0.7) 4.4 16.5
CorporateÏÏÏÏÏÏÏÏÏÏÏÏÏÏÏÏÏÏÏÏÏÏÏÏÏÏÏÏÏÏ 3.7 (1.0) 2.7 0.3 (0.1) 0.2 2.9
TotalÏÏÏÏÏÏÏÏÏÏÏÏÏÏÏÏÏÏÏÏÏÏÏÏÏÏÏÏÏÏÏÏ $52.1 $(4.3) $47.8 $19.5 $(5.1) $14.4 $62.2
26

THE INTERPUBLIC GROUP OF COMPANIES, INC. AND SUBSIDIARIESMANAGEMENT'S DISCUSSION AND ANALYSIS OF
FINANCIAL CONDITION AND RESULTS OF OPERATIONS Ì (Continued)(Amounts in Millions, Except Per Share Amounts)
In addition to amounts recorded as restructuring charges, we recorded charges of $11.1 during 2004related to the accelerated amortization of leasehold improvements on properties included in the 2003program. These charges were included in office and general expenses on the Consolidated Statements ofOperations. For additional information, see Note 6 to the Consolidated Financial Statements.
Long-Lived Asset Impairment and Other Charges
Long-lived assets include land, buildings, equipment, goodwill and other intangible assets. Buildings,equipment and other intangible assets with finite lives are depreciated or amortized on a straight-line basisover their respective estimated useful lives. When necessary, we record an impairment charge for theamount that the carrying value of the asset exceeds the implied fair value. See Note 1 to the ConsolidatedFinancial Statements for fair value determination and impairment testing methodologies.
The following table summarizes long-lived asset impairment and other charges:
For the Years Ended December 31,
2005 2004
Motor- Motor-IAN CMG sports Total IAN CMG sports Total
Goodwill impairment ÏÏÏÏÏÏÏÏÏÏÏÏÏÏ $97.0 $ Ì $Ì $97.0 $220.2 $91.7 $ Ì $311.9
Fixed asset impairment ÏÏÏÏÏÏÏÏÏÏÏÏ 0.5 Ì Ì 0.5 2.0 0.4 3.0 5.4
Other ÏÏÏÏÏÏÏÏÏÏÏÏÏÏÏÏÏÏÏÏÏÏÏÏÏÏÏ 1.0 0.1 Ì 1.1 4.9 Ì Ì 4.9
Total ÏÏÏÏÏÏÏÏÏÏÏÏÏÏÏÏÏÏÏÏÏÏÏÏÏ $98.5 $0.1 $Ì $98.6 $227.1 $92.1 $3.0 $322.2
The long-lived asset impairment charges recorded in 2005 and 2004 are due to the following:
2005 Impairments
IAN Ì During the fourth quarter of 2005, we recorded a goodwill impairment charge of $91.0 at ourLowe reporting unit. A triggering event occurred subsequent to our 2005 annual impairment test that ledus to believe that Lowe's goodwill and other indefinite lived intangible assets may no longer berecoverable. As a result, we were required to assess whether our goodwill balance at Lowe was impaired.Specifically, in the fourth quarter, a major client was lost by Lowe's London agency and the possibility oflosing other clients is now considered a higher risk due to recent management defections and changes inthe competitive landscape. This caused projected revenue growth to decline. As a result of these changesour long-term projections showed declines in discounted future operating cash flows. These revised cashflows caused the implied fair value of Lowe's goodwill to be less than the book value.
During the third quarter of 2005 as restated, we recorded a goodwill impairment charge of $5.8 at areporting unit within our sports and entertainment marketing business. The long-term projections showedpreviously unanticipated declines in discounted future operating cash flows and, as a result, thesediscounted future operating cash flows caused the implied fair value of goodwill to be less than the relatedbook value.
2004 Impairments
IAN Ì During the third quarter of 2004, we recorded goodwill impairment charges of $220.2 at ThePartnership reporting unit, which was comprised of Lowe Worldwide, Draft Worldwide, Mullen, Dailey &Associates and Berenter Greenhouse & Webster (""BGW''). Our long-term projections showed previouslyunanticipated declines in discounted future operating cash flows due to recent client losses, reduced clientspending, and declining industry valuation metrics. These discounted future operating cash flow projections
27

THE INTERPUBLIC GROUP OF COMPANIES, INC. AND SUBSIDIARIESMANAGEMENT'S DISCUSSION AND ANALYSIS OF
FINANCIAL CONDITION AND RESULTS OF OPERATIONS Ì (Continued)(Amounts in Millions, Except Per Share Amounts)
caused the estimated fair value of The Partnership to be less than the book value. The Partnership wassubsequently disbanded in the fourth quarter of 2004 and the remaining goodwill was allocated based onthe relative fair value of the agencies at the time of disbandment.
CMG Ì As a result of the annual impairment review, a goodwill impairment charge of $91.7 wasrecorded at our CMG reporting unit, which was comprised of Weber Shandwick, GolinHarris, DeVries,MWW Group and FutureBrand. The fair value of CMG was adversely affected by declining industrymarket valuation metrics, specifically, a decrease in the EBITDA multiples used in the underlyingvaluation calculations. The impact of the lower EBITDA multiples caused the calculated fair value ofCMG goodwill to be less than the related book value.
For additional information, see Note 9 to the Consolidated Financial Statements.
Motorsports Contract Termination Costs
As discussed in Note 5 to the Consolidated Financial Statements, during 2004, we recorded a pretaxcharge of $113.6 related to a series of agreements with the British Racing Drivers Club and Formula OneAdministration Limited which released us from certain guarantees and lease obligations in the UnitedKingdom. We have exited this business and do not anticipate any additional material charges.
EXPENSE AND OTHER INCOME
For the Years EndedDecember 31,
2005 2004 $ Change % Change
Interest expenseÏÏÏÏÏÏÏÏÏÏÏÏÏÏÏÏÏÏÏÏÏÏÏÏÏÏÏÏÏÏÏÏ $(181.9) $(172.0) $ (9.9) 5.8%
Debt prepayment penalty ÏÏÏÏÏÏÏÏÏÏÏÏÏÏÏÏÏÏÏÏÏÏÏÏ (1.4) (9.8) 8.4 (85.7)%
Interest income ÏÏÏÏÏÏÏÏÏÏÏÏÏÏÏÏÏÏÏÏÏÏÏÏÏÏÏÏÏÏÏÏ 80.0 50.8 29.2 57.5%
Investment impairments ÏÏÏÏÏÏÏÏÏÏÏÏÏÏÏÏÏÏÏÏÏÏÏÏÏ (12.2) (63.4) 51.2 (80.8)%
Litigation reversals (charges) ÏÏÏÏÏÏÏÏÏÏÏÏÏÏÏÏÏÏÏÏ Ì 32.5 (32.5) (100.0)%
Other income (expense) ÏÏÏÏÏÏÏÏÏÏÏÏÏÏÏÏÏÏÏÏÏÏÏÏ 33.1 (10.7) 43.8 (409.3)%
Total ÏÏÏÏÏÏÏÏÏÏÏÏÏÏÏÏÏÏÏÏÏÏÏÏÏÏÏÏÏÏÏÏÏÏÏÏÏÏÏ $ (82.4) $(172.6) $ 90.2 (52.3)%
Interest Expense
The increase in interest expense of $9.9 during 2005 was primarily due to waiver and consent feesincurred for the amendment of our existing debt agreements in 2005 and higher average interest rates onnewly issued debt when compared to extinguished debt. Our interest income and interest expense reflectdaily balances which may vary from period-end balances. They also reflect the gross amounts of debt andcash under certain of our cash pooling arrangements that are reflected on a net basis on our ConsolidatedBalance Sheets.
Debt Prepayment Penalty
During the third quarter of 2005, a prepayment penalty of $1.4 was recorded related to the earlyredemption of the remaining $250.0 of the 7.875% Senior Unsecured Notes due in 2005. During the fourthquarter of 2004, a prepayment penalty of $9.8 was recorded related to the early redemption of $250.0 ofour 7.875% Senior Unsecured Notes due in 2005, which represented one half of the then $500.0outstanding.
28

THE INTERPUBLIC GROUP OF COMPANIES, INC. AND SUBSIDIARIESMANAGEMENT'S DISCUSSION AND ANALYSIS OF
FINANCIAL CONDITION AND RESULTS OF OPERATIONS Ì (Continued)(Amounts in Millions, Except Per Share Amounts)
Interest Income
The increase in interest income of $29.2 during 2005 was primarily due to an increase in averageinterest rates as well an increase in cash and cash equivalents primarily resulting from our Series BCumulative Convertible Perpetual Preferred Stock offering.
Our interest income and interest expense reflect daily balances which may vary from period-endbalances. They also reflect the gross amounts of debt and cash under certain of our cash poolingarrangements that are reflected on a net basis on our Consolidated Balance Sheets.
Investment Impairments
During 2005, we recorded investment impairment charges of $12.2, primarily related to a $7.1 chargefor our remaining unconsolidated investment in Koch Tavares in Latin America to adjust the carryingamount of the investment to fair value as a result of our intent to sell and a $3.7 charge related to adecline in value of certain available-for-sale investments that were determined to be other than temporary.
During 2004, we recorded investment impairment charges of $63.4, primarily related to a $50.9 chargefor an unconsolidated investment in German advertising agency Springer & Jacoby as a result of adecrease in projected operating results. Additionally, we recorded impairment charges of $4.7 related tounconsolidated affiliates primarily in Israel, Brazil, Japan and India, and $7.8 related to several otheravailable-for-sale investments.
Litigation Charges
During 2004, with court approval of the settlement of the class action shareholder suits discussed inNote 21 to the Consolidated Financial Statements, we received $20.0 from insurance proceeds which werecorded as a reduction in litigation charges because we had not previously established a receivable. Wealso recorded a reduction of $12.5 relating to a decrease in the share price between the tentativesettlement date and the final settlement date.
Other Income (Expense)
In 2005, other income (expense) included net gains from the sales of businesses of $10.1, net gainson sales of available-for-sale securities and miscellaneous investment income of $20.3 and $2.6 related tocredits adjustments. The principal components of net gains from the sales of businesses relate to the saleof Target Research, a McCann agency, during the fourth quarter of 2005, which resulted in a gain of$18.6, offset partially by a sale of a significant component of FCB Spain during the fourth quarter of 2005which resulted in a loss of approximately $13.0. The principal components of net gains on sales ofavailable-for-sale securities and miscellaneous investment income relate to the sale of our remainingownership interest in Delaney Lund Knox Warren & Partners, an agency within FCB, for a gain ofapproximately $8.3, and net gains on sales of available-for-sale securities of $7.9, of which approximately$3.8 relates to appreciation of Rabbi Trust investments restricted for the purpose of paying our deferredcompensation and deferred benefit arrangement liabilities.
In 2005, we also recorded $2.6 for the settlement of our contractual liabilities for vendor credits anddiscounts. This amount represents a negotiated client settlement below the amount originally recorded. Itis recorded as Other Income because we do not view negotiating a favorable outcome as a revenuegenerating activity.
In 2004, other income (expense) included $18.2 of net losses on the sale of 19 agencies. The lossesrelated primarily to the sale of McCann's Transworld Marketing, a U.S.-based promotions agency, which
29

THE INTERPUBLIC GROUP OF COMPANIES, INC. AND SUBSIDIARIESMANAGEMENT'S DISCUSSION AND ANALYSIS OF
FINANCIAL CONDITION AND RESULTS OF OPERATIONS Ì (Continued)(Amounts in Millions, Except Per Share Amounts)
resulted in a loss of $8.6, and a $6.2 loss for the final liquidation of the Motorsports investment. SeeNote 5 to the Consolidated Financial Statements for further discussion of the Motorsports disposition.
OTHER ITEMS
Income Taxes
For the Years EndedDecember 31,
2005 2004 $ Change % Change
Provision for income taxes ÏÏÏÏÏÏÏÏÏÏÏÏÏÏÏÏÏÏÏÏÏ $81.9 $262.2 $(180.3) (68.8)%
Effective tax rateÏÏÏÏÏÏÏÏÏÏÏÏÏÏÏÏÏÏÏÏÏÏÏÏÏÏÏÏÏ 43.9% 98.2%
Our effective tax rate was negatively impacted in both 2005 and 2004 by the establishment ofvaluation allowances, as described below, and non-deductible long-lived asset impairment charges. In 2004,our effective tax rate was also impacted by pretax charges and related tax benefits resulting from theMotorsports contract termination costs. The difference between the effective tax rate and the statutoryfederal rate of 35% is also due to state and local taxes and the effect of non-U.S. operations.
Valuation Allowance
Under Statement of Financial Accounting Standards (""SFAS'') No. 109, Accounting for IncomeTaxes, we are required, on a quarterly basis, to evaluate the realizability of our deferred tax assets.SFAS No. 109 requires that a valuation allowance be established when it is more likely than not that allor a portion of deferred tax assets will not be realized. In circumstances where there is sufficient negativeevidence, establishment of valuation allowance must be considered. We believe that cumulative losses inthe most recent three-year period represent sufficient negative evidence under the provisions ofSFAS No. 109 and, as a result, we determined that certain of our deferred tax assets required theestablishment of a valuation allowance. The deferred tax assets for which an allowance was establishedrelate primarily to foreign net operating and U.S. capital loss carryforwards, and foreign tax credits.
During 2005, a net valuation allowance of $69.9 was established in continuing operations on existingdeferred tax assets and current year losses with no benefit. The total valuation allowance as ofDecember 31, 2005 was $501.0. Our income tax expense recorded in the future will be reduced to theextent of decreases in our valuation allowance. The establishment or reversal of valuation allowances couldhave a significant negative or positive impact on future earnings.
During 2004, a valuation allowance of $236.0 was established in continuing operations on existingdeferred tax assets and 2004 losses with no benefit. The total valuation allowance as of December 31, 2004was $488.6. Our income tax expense recorded in the future will be reduced to the extent of decreases inour valuation allowance. The establishment or reversal of valuation allowances could have a significantnegative or positive impact on future earnings.
In connection with the U.S. deferred tax assets, management believes that it is more likely than notthat a substantial amount of the deferred tax assets will be realized; a valuation allowance has beenestablished for the remainder. The amount of the deferred tax assets considered realizable, however, couldbe reduced in the near term if estimates of future U.S. taxable income are lower than anticipated.
For additional information, see Note 11 to the Consolidated Financial Statements.
30

THE INTERPUBLIC GROUP OF COMPANIES, INC. AND SUBSIDIARIESMANAGEMENT'S DISCUSSION AND ANALYSIS OF
FINANCIAL CONDITION AND RESULTS OF OPERATIONS Ì (Continued)(Amounts in Millions, Except Per Share Amounts)
Minority Interest and Unconsolidated AffiliatesFor the Years Ended
December 31,
2005 2004 $ Change % Change
Income applicable to minority interests, net of tax ÏÏÏÏ $(16.7) $(21.5) $4.8 (22.3)%
Equity in net income of unconsolidated affiliates, netof tax ÏÏÏÏÏÏÏÏÏÏÏÏÏÏÏÏÏÏÏÏÏÏÏÏÏÏÏÏÏÏÏÏÏÏÏÏÏÏÏ $ 13.3 $ 5.8 $7.5 129.3%
The decrease in income applicable to minority interests of $4.8 was primarily due to lower earnings ofmajority-owned international businesses offset by increases in minority interests at several businesses.
The increase in equity in net income of unconsolidated affiliates of $7.5 was primarily due to theimpact of prior year losses at an African unconsolidated affiliate within McCann, which was fullyconsolidated due to the purchase of an additional interest in 2005, and the impact of positive results atunconsolidated investments at FCB and McCann.
NET LOSSFor the Years Ended
December 31,
2005 2004 $ Change % Change
Loss from continuing operations ÏÏÏÏÏÏÏÏÏÏÏÏÏÏÏÏÏÏ $(271.9) $(544.9) $273.0 (50.1)%
Income from discontinued operations, net of taxes of($9.0) and $3.5, respectively ÏÏÏÏÏÏÏÏÏÏÏÏÏÏÏÏÏÏÏ 9.0 6.5 2.5 38.5%
Net loss ÏÏÏÏÏÏÏÏÏÏÏÏÏÏÏÏÏÏÏÏÏÏÏÏÏÏÏÏÏÏÏÏÏÏÏÏÏÏ (262.9) (538.4) 275.5 (51.2)%
Less: Preferred stock dividends ÏÏÏÏÏÏÏÏÏÏÏÏÏÏÏÏÏÏÏ 26.3 19.8 6.5 32.8%
Net loss applicable to common stockholders ÏÏÏÏÏÏÏ $(289.2) $(558.2) $269.0 (48.2)%
Loss from Continuing Operations
In 2005, our loss from continuing operations decreased by $273.0 or 50.1% as a result of a decreasereduced long-lived asset impairment charges and Motorsports contract termination costs in 2004, partiallyoffset by a decrease in operating income which was driven by decreases in revenue and increases inexpenses as previously discussed.
Income from Discontinued operations (net of tax)
In conjunction with the disposition of our NFO operations in the fourth quarter of 2003, weestablished reserves for certain income tax contingencies with respect to the determination of ourinvestment in NFO for income tax purposes. During the fourth quarter of 2005, these reserves of $9.0were reversed as the related income tax contingencies are no longer considered probable.
31

THE INTERPUBLIC GROUP OF COMPANIES, INC. AND SUBSIDIARIESMANAGEMENT'S DISCUSSION AND ANALYSIS OF
FINANCIAL CONDITION AND RESULTS OF OPERATIONS Ì (Continued)(Amounts in Millions, Except Per Share Amounts)
Consolidated Results of Operations Ì Three Months Ended December 31, 2005 Compared to ThreeMonths Ended December 31, 2004
REVENUE
The components of the change were as follows:
Total Domestic International
Three Months Ended $ % Change $ % Change % of Total $ % Change % of Total
December 31, 2004 ÏÏÏÏÏÏÏÏÏ $1,965.7 $983.0 50.0% $982.7 50.0%
Foreign currency changes ÏÏÏÏ (12.9) (0.7)% Ì 0.0% (12.9) (1.3)%
Net acquisitions/divestituresÏÏ (23.0) (1.2)% (15.2) (1.5)% (7.8) (0.8)%
Organic ÏÏÏÏÏÏÏÏÏÏÏÏÏÏÏÏÏÏÏ (34.1) (1.7)% 15.8 1.6% (49.9) (5.1)%
Total changeÏÏÏÏÏÏÏÏÏÏÏÏÏ (70.0) (3.6)% 0.6 0.1% (70.6) (7.2)%
December 31, 2005 ÏÏÏÏÏÏÏÏÏ $1,895.7 $983.6 51.9% $912.1 48.1%
For the three months ended December 31, 2005, consolidated revenues decreased $70.0, or 3.6%, ascompared to 2004, which was attributable to an organic revenue decrease of $34.1, a decrease in netacquisitions and divestitures of $23.0 and a decrease related to foreign currency exchange rate changes of$12.9. We recorded certain out of period adjustments in the three months ended December 31, 2005. SeeNote 3 to the Consolidated Financial Statements. Excluding out of period adjustments of $17.3 recordedin the three months ended December 31, 2005, the consolidated revenue decrease would have been $52.7.
During 2005, the organic decrease in revenue excluding the impact to out of period adjustments wasprimarily driven by a decrease at IAN, partially offset by an increase at CMG. The decrease at IAN wasprimarily a result of a reduction in revenue from existing clients primarily due to client losses at ourinternational agencies. In the fourth quarter of 2005, we recorded approximately $10.0 for certain clientnegotiations at IAN. The increase at CMG was primarily driven by worldwide growth in sports marketingbusiness and events marketing business as a result of increased revenue from existing clients and newclient wins.
OPERATING EXPENSESThree Months Ended December 31,
2005 2004
% of % of$ Revenue $ Revenue $ Change % Change
Salaries and related expenses ÏÏÏÏÏÏÏÏÏÏ $1,107.5 58.4% $1,021.9 52.0% $ 85.6 8.4%
Office and general expenses ÏÏÏÏÏÏÏÏÏÏÏ 637.1 33.6% 630.3 32.1% 6.8 1.1%
Restructuring charges ÏÏÏÏÏÏÏÏÏÏÏÏÏÏÏÏ 1.4 (4.4) 5.8 (131.8)%
Long-lived asset impairment and othercharges ÏÏÏÏÏÏÏÏÏÏÏÏÏÏÏÏÏÏÏÏÏÏÏÏÏÏ 92.1 5.8 86.3 1487.9%
Total operating expensesÏÏÏÏÏÏÏÏÏÏÏÏ $1,838.1 $1,653.6 $184.5 11.2%
Salaries and Related Expenses
Salaries and related expenses is the largest component of operating expenses and consist primarily ofsalaries, related benefits and performance incentives. During the three months ended December 31, 2005,salaries and related expenses increased to 58.4% of revenue, compared to 52.0% in the prior year. Duringthe three months ended December 31, 2005, salaries and related expenses increased by approximately$85.6 including the impact of out of period adjustments, to $1,107.5 when compared to the comparative
32

THE INTERPUBLIC GROUP OF COMPANIES, INC. AND SUBSIDIARIESMANAGEMENT'S DISCUSSION AND ANALYSIS OF
FINANCIAL CONDITION AND RESULTS OF OPERATIONS Ì (Continued)(Amounts in Millions, Except Per Share Amounts)
period in 2004. Excluding the impact of out of period adjustments of $3.2, the increase of $82.4 wasprimarily attributable to an increase in severance expense of $59.7 to $97.2. In addition, the increase wasattributable to our hiring additional creative talent to enable future revenue growth and staff to addressweaknesses in our accounting and control environment. The components of the change were as follows:
Total % ofThree Months Ended $ % Change Revenue
December 31, 2004ÏÏÏÏÏÏÏÏÏÏÏÏÏÏÏÏÏÏÏÏÏÏÏÏÏÏÏÏÏÏÏÏÏÏÏÏÏÏÏ $1,021.9 52.0%
Foreign currency changesÏÏÏÏÏÏÏÏÏÏÏÏÏÏÏÏÏÏÏÏÏÏÏÏÏÏÏÏÏÏÏÏÏÏ (10.3) (1.0)%
Net acquisitions/divestitures ÏÏÏÏÏÏÏÏÏÏÏÏÏÏÏÏÏÏÏÏÏÏÏÏÏÏÏÏÏÏÏ (20.8) (2.0)%
OrganicÏÏÏÏÏÏÏÏÏÏÏÏÏÏÏÏÏÏÏÏÏÏÏÏÏÏÏÏÏÏÏÏÏÏÏÏÏÏÏÏÏÏÏÏÏÏÏÏÏ 116.7 11.4%
Total change ÏÏÏÏÏÏÏÏÏÏÏÏÏÏÏÏÏÏÏÏÏÏÏÏÏÏÏÏÏÏÏÏÏÏÏÏÏÏÏÏÏÏÏÏ 85.6 8.4%
December 31, 2005ÏÏÏÏÏÏÏÏÏÏÏÏÏÏÏÏÏÏÏÏÏÏÏÏÏÏÏÏÏÏÏÏÏÏÏÏÏÏÏ $1,107.5 58.4%
For the three months ended December 31, 2005, salaries and related expenses increased $116.7,excluding the decrease related to net acquisitions and divestitures of $20.8 and a decrease related toforeign currency exchange rate changes of $10.3.
The increase in salaries and related expenses, excluding the impact of out of period adjustments andforeign currency and net acquisition and divestiture activity, was primarily the result of higher severanceexpense for international headcount reductions within IAN as a result of client losses. In addition, theincrease was attributable to our hiring additional creative talent to enable future revenue growth and staffto address weaknesses in our accounting and control environment.
Office and General Expenses
Office and general expenses primarily consist of rent, office and equipment, depreciation, professionalfees, other overhead expenses and certain out-of-pocket expenses related to our revenue. During the threemonths ended December 31, 2005, office and general expenses increased to 33.6% of revenue, compared to32.1% in the prior year. During the three months ended December 31, 2005, office and general expensesincreased by approximately $6.8 including the impact of out of period adjustments, to $637.1 whencompared to the comparative period in 2004. Excluding the impact of out of period adjustments of $6.1,the increase of $0.7 was primarily attributable to higher production and media expenses due to an increasein arrangements entered into where we act as a principal, which requires us to record expenses on a grossbasis. The increase was partially offset by acquisitions and divestitures. The components of the changewere as follows:
Total % ofThree Months Ended $ % Change Revenue
December 31, 2004 ÏÏÏÏÏÏÏÏÏÏÏÏÏÏÏÏÏÏÏÏÏÏÏÏÏÏÏÏÏÏÏÏÏÏÏÏÏÏ $630.3 32.1%
Foreign currency changesÏÏÏÏÏÏÏÏÏÏÏÏÏÏÏÏÏÏÏÏÏÏÏÏÏÏÏÏÏÏÏÏÏ (6.3) (1.0)%
Net acquisitions/divestitures ÏÏÏÏÏÏÏÏÏÏÏÏÏÏÏÏÏÏÏÏÏÏÏÏÏÏÏÏÏÏ (13.2) (2.1)%
OrganicÏÏÏÏÏÏÏÏÏÏÏÏÏÏÏÏÏÏÏÏÏÏÏÏÏÏÏÏÏÏÏÏÏÏÏÏÏÏÏÏÏÏÏÏÏÏÏÏ 26.3 4.2%
Total change ÏÏÏÏÏÏÏÏÏÏÏÏÏÏÏÏÏÏÏÏÏÏÏÏÏÏÏÏÏÏÏÏÏÏÏÏÏÏÏÏÏÏÏ 6.8 1.1%
December 31, 2005 ÏÏÏÏÏÏÏÏÏÏÏÏÏÏÏÏÏÏÏÏÏÏÏÏÏÏÏÏÏÏÏÏÏÏÏÏÏÏ $637.1 33.6%
33

THE INTERPUBLIC GROUP OF COMPANIES, INC. AND SUBSIDIARIESMANAGEMENT'S DISCUSSION AND ANALYSIS OF
FINANCIAL CONDITION AND RESULTS OF OPERATIONS Ì (Continued)(Amounts in Millions, Except Per Share Amounts)
For the three months ended December 31, 2005, office and general expenses increased $26.3,excluding a decrease related to net acquisitions and divestitures of $13.2 and a decrease related to foreigncurrency exchange rate changes of $6.3.
The increase in office and general expenses, excluding the impact of out of period adjustments andforeign currency and net acquisition and divestitures activity, was primarily the result of higher productionand media expenses at IAN due to an increase in arrangements entered into where we act as a principal,which requires us to record expenses on a gross basis and higher professional fees at both IAN and CMG.The higher professional fees were driven by our ongoing efforts in internal control compliance, the PriorRestatement process and the preliminary application development and maintenance of informationtechnology systems and processes related to our shared services initiatives.
Restructuring Charges (Reversals)
During the three months ended December 31, 2005 and 2004, we recorded net charges and(reversals) related to lease termination and other exit costs and severance and termination costs for the2003 and 2001 restructuring programs of $1.4 and ($4.4), respectively. 2005 net charges and 2004 netreversals primarily consisted of changes to management's estimates for the 2003 and 2001 restructuringprograms primarily relating to our lease termination costs.
Long-Lived Asset Impairment and Other Charges
During the three months ended December 31, 2005 and 2004, we recorded charges of $92.1 and $5.8,respectively. 2005 charges primarily related to a goodwill impairment charge of $91.0 at our Lowereporting unit.
EXPENSE AND OTHER INCOME
Interest Expense & Interest Income
During the three months ended December 31, 2005 and 2004, we recorded interest expense of $46.1and $44.3, respectively. During the three months ended December 31, 2005 and 2004, we recorded interestincome of $26.8 and $19.5, respectively. The increase in interest income of $7.3 primarily relates to anincrease in average interest rates and higher cash balances when compared to the prior year.
Investment Impairments
During the three months ended December 31, 2005 and 2004, we recorded investment impairments of$7.1 and $26.4, respectively. For the three months ended December 31, 2005, we recorded a $7.1 chargefor our remaining unconsolidated investment in Koch Tavares in Latin America. For the three monthsended December 31, 2004, the primary component of the balance related to a $19.9 charge for ourunconsolidated investment in German advertising agency Springer & Jacoby.
Other Income (Expense)
During the three months ended December 31, 2005 and 2004, we recorded other income (expense)amounts of $13.4 and $(13.5), respectively. The primary components of our income amount for the threemonths ended December 31, 2005 are a gain on the sale of Target Research, a McCann agency, of $18.6,offset by the sale of a significant component of FCB Spain, which resulted in a loss of approximately$13.0. The remainder of the amount relates to miscellaneous income and expense amounts. The primarycomponents of our expense amount for the three months ended December 31, 2004 are an $8.6 loss on the
34

THE INTERPUBLIC GROUP OF COMPANIES, INC. AND SUBSIDIARIESMANAGEMENT'S DISCUSSION AND ANALYSIS OF
FINANCIAL CONDITION AND RESULTS OF OPERATIONS Ì (Continued)(Amounts in Millions, Except Per Share Amounts)
sale of McCann's Transworld Marketing, a U.S.-based promotions agency, as well as a $6.2 loss for thefinal liquidation of the Motorsports investment.
OTHER ITEMS
Income Taxes
For the three months ended December 31, 2005 and 2004, we recorded an income tax provision of$77.4 and $130.6, respectively. Excluding out of period adjustments of $19.5, the income tax provisionwould have been $96.9 for the three months ended December 31, 2005.
We recorded income tax provisions of $81.9 and $262.2 for the twelve months ended December 31,2005 and 2004, respectively, although we had a pretax loss in each period. The difference between theeffective tax rate and statutory rate of 35% is due to state and local taxes and the effect of non-USoperations. Several discrete items also impacted the effective tax rate in 2005. The most significant itemnegatively impacting the effective tax rate was the establishment of approximately $69.9 of valuationallowances on certain deferred tax assets, as well as on losses incurred in non-U.S. jurisdictions whichreceive no benefit. Other discrete items impacting the effective tax rates for 2005 and 2004 wererestructuring charges, long-lived asset and investment impairment charges.
Minority Interest and Unconsolidated Affiliates
During the three months ended December 31, 2005 and 2004, we recorded $7.2 and $10.3 of incomeapplicable to minority interests, respectively. This decrease was primarily due to lower earnings ofmajority-owned international businesses.
During the three months ended December 31, 2005 and 2004, we recorded $8.1 and $1.1 of equity innet income of unconsolidated affiliates, respectively. The increase is primarily due to the impact of prioryear losses at an African unconsolidated affiliate within McCann, which was fully consolidated in thesecond quarter of 2005, as well as positive results at unconsolidated investments at FCB and Lowe.
NET INCOME (LOSS)
Loss from Continuing Operations
For the three months ended December 31, 2005 and 2004, we recorded a loss from continuingoperations of $31.9 and income from continuing operations of $130.3, respectively. The decrease in incomefrom continuing operations of $162.1 largely resulted from a decrease in revenue of $70.0, and an increasein operating expenses of $184.5, which was driven by goodwill impairment charges of $92.1 and increasedseverance and temporary staffing changes of $59.7 and $20.3, respectively. This change was offset by adecrease in taxes of $53.2 and an increase in total expenses and other income of $28.9, which was drivenby decreased litigation charges and gains from the sales of businesses. Excluding out of period adjustmentsof $2.7, the loss from continuing operations would have been $34.6 for the three months endedDecember 31, 2005.
Income from Discontinued Operations (net of tax)
In conjunction with the disposition of our NFO operations in the fourth quarter of 2003, weestablished reserves for certain income tax contingencies with respect to the determination of ourinvestment in NFO for income tax purposes. During the fourth quarter of 2005, these reserves of $9.0were reversed as the related income tax contingencies are no longer considered probable.
35

THE INTERPUBLIC GROUP OF COMPANIES, INC. AND SUBSIDIARIESMANAGEMENT'S DISCUSSION AND ANALYSIS OF
FINANCIAL CONDITION AND RESULTS OF OPERATIONS Ì (Continued)(Amounts in Millions, Except Per Share Amounts)
For the three months ended December 31, 2004 and 2003, there was no impact of discontinuedoperations on our consolidated financial statements.
Segment Results of Operations Ì 2005 Compared to 2004
As discussed in Note 20 to the Consolidated Financial Statements, we have three reportable segmentsas of December 31, 2005: our operating divisions IAN, CMG and Motorsports. Our Motorsportsoperations were sold during 2004 and had immaterial residual operating results in 2005. We also reportresults for the Corporate group. The profitability measure employed by our chief operating decision makersfor allocating resources to operating divisions and assessing operating division performance is segmentoperating income (loss), which is calculated by subtracting segment salaries and related expenses andoffice and general expenses from segment revenue. Amounts reported as segment operating income (loss)exclude the impact of restructuring and impairment charges, as we do not typically consider these chargeswhen assessing operating division performance. The impact of restructuring and impairment charges toeach reporting segment are reported separately in Notes 6 and 9 to the Consolidated Financial Statements,respectively. Segment income (loss) excludes interest income and expense, debt prepayment penalties,investment impairments, litigation charges and other non-operating income. Other than the recording oflong-lived asset impairment and contract termination costs during 2004, the operating results ofMotorsports during 2005 and 2004 were not material to consolidated results, and therefore are notdiscussed in detail below. The following table summarizes revenue and operating income (loss) bysegment:
For the Years EndedDecember 31,
2005 2004 $ Change % Change
Revenue:
IAN ÏÏÏÏÏÏÏÏÏÏÏÏÏÏÏÏÏÏÏÏÏÏÏÏÏÏÏÏÏÏÏÏÏÏÏÏÏÏÏ $5,327.8 $5,399.2 $ (71.4) (1.3)%
CMG ÏÏÏÏÏÏÏÏÏÏÏÏÏÏÏÏÏÏÏÏÏÏÏÏÏÏÏÏÏÏÏÏÏÏÏÏÏÏ 944.2 935.8 8.4 0.9%
Motorsports ÏÏÏÏÏÏÏÏÏÏÏÏÏÏÏÏÏÏÏÏÏÏÏÏÏÏÏÏÏÏÏÏÏ 2.3 52.0 (49.7) (95.6)%
Consolidated revenue ÏÏÏÏÏÏÏÏÏÏÏÏÏÏÏÏÏÏÏÏÏÏÏ $6,274.3 $6,387.0 $(112.7) (1.8)%
Segment operating income (loss):
IAN ÏÏÏÏÏÏÏÏÏÏÏÏÏÏÏÏÏÏÏÏÏÏÏÏÏÏÏÏÏÏÏÏÏÏÏÏÏÏÏ $ 249.7 $ 577.1 $(327.4) (56.7)%
CMG ÏÏÏÏÏÏÏÏÏÏÏÏÏÏÏÏÏÏÏÏÏÏÏÏÏÏÏÏÏÏÏÏÏÏÏÏÏÏ 53.0 83.7 (30.7) (36.7)%
Motorsports ÏÏÏÏÏÏÏÏÏÏÏÏÏÏÏÏÏÏÏÏÏÏÏÏÏÏÏÏÏÏÏÏÏ 0.7 (14.0) 14.7 (105.0)%
Corporate and other ÏÏÏÏÏÏÏÏÏÏÏÏÏÏÏÏÏÏÏÏÏÏÏÏÏÏ (316.3) (243.2) (73.1) 30.1%
36

THE INTERPUBLIC GROUP OF COMPANIES, INC. AND SUBSIDIARIESMANAGEMENT'S DISCUSSION AND ANALYSIS OF
FINANCIAL CONDITION AND RESULTS OF OPERATIONS Ì (Continued)(Amounts in Millions, Except Per Share Amounts)
For the Years Ended December 31,
2005 2004
IAN CMG Motorsports Corporate Total IAN CMG Motorsports Corporate Total
Reconciliation toconsolidated operatingincome:
Consolidated operatingincome (loss) ÏÏÏÏÏÏÏÏ $ 158.2 $ 52.3 $ 0.7 $(315.4) $(104.2) $ 307.2 $(24.9) $(130.6) $(246.1) $ (94.4)
Adjustments:
Restructuring reversals(charges)ÏÏÏÏÏÏÏÏÏÏ 7.0 (0.6) Ì 0.9 7.3 (42.8) (16.5) Ì (2.9) (62.2)
Long lived assetimpairment andother charges: ÏÏÏÏÏÏ (98.5) (0.1) Ì Ì (98.6) (227.1) (92.1) (116.6) Ì (435.8)
Segment operatingincome (loss) ÏÏÏÏÏÏÏÏ $ 249.7 $ 53.0 $ 0.7 $(316.3) $ 577.1 $ 83.7 $ (14.0) $(243.2)
INTEGRATED AGENCY NETWORKS (""IAN'')
REVENUE
The components of the 2005 change were as follows:
Total Domestic International
$ % Change $ % Change % of Total $ % Change % of Total
2004 ÏÏÏÏÏÏÏÏÏÏÏÏÏÏÏÏÏÏÏÏÏ $5,399.2 $2,933.3 54.3% $2,465.9 45.7%
Foreign currency changes ÏÏÏÏ 39.5 0.7% Ì 0.0% 39.5 1.6%
Net acquisitions/divestitures (46.0) (0.9)% (23.1) (0.8)% (22.9) (0.9)%
Organic ÏÏÏÏÏÏÏÏÏÏÏÏÏÏÏÏÏÏÏ (64.9) (1.2)% (5.6) (0.2)% (59.3) (2.4)%
Total change ÏÏÏÏÏÏÏÏÏÏÏÏ (71.4) (1.3)% (28.7) (1.0)% (42.7) (1.7)%
2005 ÏÏÏÏÏÏÏÏÏÏÏÏÏÏÏÏÏÏÏÏÏ $5,327.8 $2,904.6 54.5% $2,423.2 45.5%
For the year ended December 31, 2005, IAN experienced a net decrease in revenue as compared to2004 by $71.4, or 1.3%, which was comprised of an organic decrease in revenue of $64.9 and a decreaseattributable to net acquisitions and divestitures of $46.0, partially offset by an increase in foreign currencyexchange rate changes of $39.5. The decrease due to the net effect of divestitures and acquisitions,primarily related to the sale of small businesses at McCann and Draft. This decrease was partially offsetby foreign currency exchange rate changes primarily attributable to the strengthening of the Brazilian Realand the Canadian Dollar in relation to the U.S. Dollar, which mainly affected the results of McCannand FCB.
The organic revenue decrease was primarily driven by decreases at Deutsch and Lowe, partially offsetby an increase at Draft. Deutsch experienced a decline in revenues primarily due to lost clients and areduction in revenue from existing clients in the U.S., partially offset by new business wins. Lowe's declinein revenue was primarily driven by lost clients and a reduction in revenue from existing clients in theirEuropean offices, as well as a reduction in client spending in the U.S. Draft experienced growth mainly inthe U.S. due to client wins and additional revenue from existing clients. Although McCann and FCB are asignificant part of the business, they did not contribute significantly to the organic change in revenue yearon year.
37

THE INTERPUBLIC GROUP OF COMPANIES, INC. AND SUBSIDIARIESMANAGEMENT'S DISCUSSION AND ANALYSIS OF
FINANCIAL CONDITION AND RESULTS OF OPERATIONS Ì (Continued)(Amounts in Millions, Except Per Share Amounts)
SEGMENT OPERATING INCOME
For the Years EndedDecember 31,
2005 2004 $ Change % Change
Segment operating incomeÏÏÏÏÏÏÏÏÏÏÏÏÏÏÏÏÏÏÏÏÏ $249.7 $577.1 $(327.4) (56.7)%
Operating margin ÏÏÏÏÏÏÏÏÏÏÏÏÏÏÏÏÏÏÏÏÏÏÏÏÏÏÏÏ 4.7% 10.7%
For the year ended December 31, 2005, IAN operating income decreased by $327.4, or 56.7%, whichwas a result of a decrease in revenue of $71.4, an increase in salaries and related expenses of $202.3 andincreased office and general expenses of $53.7.
The decrease in IAN's operating income, excluding the impact of foreign currency and net effects ofacquisitions and divestitures, was primarily driven by decreased operating income at McCann and FCB,increased losses at Lowe and decreased operating income at Deutsch. The operating income decrease atMcCann was primarily caused by increased severance, temporary staffing costs, salary and related benefitsand professional fees. Higher severance expense was the result of international headcount reductions.Temporary staffing and salary and related benefits were impacted by additional staffing necessary toaddress weaknesses in our accounting and control environment. Professional fees increased as a result ofcosts associated with the Prior Restatement process and internal control compliance. Operating incomedecreases at FCB were due to higher salaries and freelance costs as additional staff were hired to servicenew clients and additional business from existing clients, whose revenue will impact 2006 more than 2005,as well as increased severance costs reflecting headcount reductions at our international agencies.Operating income was further impacted by increases in professional fees to assist in the restatementprocess and internal control compliance. Declines at Lowe were primarily due to organic revenue decreasesas compared to the prior year. Deutsch experienced decreases as a result of organic revenue decreases ascompared to the prior year, partially offset by lower salaries, related benefits and freelance costs due to lostclients and reduced incentive compensation expense as a result of a reduction in operating performance.
CONSTITUENCY MANAGEMENT GROUP (""CMG'')
REVENUE
The components of the 2005 change were as follows:
Total Domestic International
$ % Change $ % Change % of Total $ % Change % of Total
2004 ÏÏÏÏÏÏÏÏÏÏÏÏÏÏÏÏÏÏÏÏÏÏÏÏÏÏÏ $935.8 $576.0 61.6% $359.8 38.4%
Foreign currency changes ÏÏÏÏÏÏÏÏÏ 1.2 0.1% Ì 0.0% 1.2 0.3%
Net acquisitions/divestitures ÏÏÏÏÏÏÏ (12.1) (1.3)% (5.9) (1.0)% (6.2) (1.7)%
Organic ÏÏÏÏÏÏÏÏÏÏÏÏÏÏÏÏÏÏÏÏÏÏÏÏ 19.3 2.1% (13.6) (2.4)% 32.9 9.1%
Total change ÏÏÏÏÏÏÏÏÏÏÏÏÏÏÏÏÏÏ 8.4 0.9% (19.5) (3.4)% 27.9 7.8%
2005 ÏÏÏÏÏÏÏÏÏÏÏÏÏÏÏÏÏÏÏÏÏÏÏÏÏÏÏ $944.2 $556.5 58.9% $387.7 41.1%
For the year ended December 31, 2005, CMG experienced increased revenues as compared to 2004 of$8.4, or 0.9%, which was comprised of an organic revenue increase of $19.3 and positive foreign currencyexchange rate changes of $1.2, partially offset by decreases attributable to net acquisitions and divestituresof $12.1. Net effects of acquisitions and divestitures primarily related to the disposition of two businessesin 2005 and three businesses in 2004.
38

THE INTERPUBLIC GROUP OF COMPANIES, INC. AND SUBSIDIARIESMANAGEMENT'S DISCUSSION AND ANALYSIS OF
FINANCIAL CONDITION AND RESULTS OF OPERATIONS Ì (Continued)(Amounts in Millions, Except Per Share Amounts)
The organic revenue increase was primarily driven by growth in public relations and sports marketingbusiness both domestically and internationally as a result of increased revenue from existing clients andnew client wins. Domestically, the increase in the sports marketing business was offset by a decline in theevents marketing business. Although the events marketing business declined domestically it had an overallpositive impact to our organic revenue increase due to international client wins.
SEGMENT OPERATING INCOME
For the Years EndedDecember 31,
2005 2004 $ Change % Change
Segment operating incomeÏÏÏÏÏÏÏÏÏÏÏÏÏÏÏÏÏÏÏÏÏ $53.0 $83.7 $(30.7) (36.7)%
Operating margin ÏÏÏÏÏÏÏÏÏÏÏÏÏÏÏÏÏÏÏÏÏÏÏÏÏÏÏÏ 5.6% 8.9%
For the year ended December 31, 2005, CMG operating income decreased by $30.7, or 36.7%, whichwas the result of a $23.3 increase in salary and related expenses and a $15.8 increase in office and generalexpenses, offset by a $8.4 increase in revenue.
The decrease in operating income, excluding the impact of foreign currency and net effects ofacquisition and divestitures, was primarily driven by increases in salary expense across all businesses due toincreased headcount to further address weaknesses in our accounting and control environment. In addition,the decrease in operating income was attributable to increases in salary expenses in public relations tosupport ongoing revenue growth.
CORPORATE AND OTHER
Certain corporate and other charges are reported as a separate line within total segment operatingincome and include corporate office expenses and shared service center expenses, as well as certain othercentrally managed expenses that are not fully allocated to operating divisions. The following significantexpenses are included in corporate and other:
For the Years EndedDecember 31,
2005 2004 $ Change % Change
Salaries, benefits and related expenses ÏÏÏÏÏÏÏÏÏÏÏ $ 201.3 $ 151.2 $ 50.1 33.1%
Professional fees ÏÏÏÏÏÏÏÏÏÏÏÏÏÏÏÏÏÏÏÏÏÏÏÏÏÏÏÏÏ 199.3 145.3 54.0 37.2%
Rent and depreciationÏÏÏÏÏÏÏÏÏÏÏÏÏÏÏÏÏÏÏÏÏÏÏÏÏ 50.3 38.0 12.3 32.4%
Corporate Insurance ÏÏÏÏÏÏÏÏÏÏÏÏÏÏÏÏÏÏÏÏÏÏÏÏÏÏ 26.0 29.7 (3.7) (12.5)%
Bank fees ÏÏÏÏÏÏÏÏÏÏÏÏÏÏÏÏÏÏÏÏÏÏÏÏÏÏÏÏÏÏÏÏÏÏÏ 2.2 2.8 (0.6) (21.4)%
Other ÏÏÏÏÏÏÏÏÏÏÏÏÏÏÏÏÏÏÏÏÏÏÏÏÏÏÏÏÏÏÏÏÏÏÏÏÏÏ (1.5) 9.6 (11.1) (115.6)%
Expenses allocated to operating divisions ÏÏÏÏÏÏÏÏÏ (161.3) (133.4) (27.9) 20.9%
Total corporate and otherÏÏÏÏÏÏÏÏÏÏÏÏÏÏÏÏÏÏÏÏ $ 316.3 $ 243.2 $ 73.1 30.1%
Salaries, benefits and related expenses include salaries, pension, bonus and medical and dentalinsurance expenses for corporate office employees, as well as the cost of temporary employees at thecorporate office. Professional fees include costs related to the internal control compliance, cost of PriorRestatement efforts, financial statement audits, legal, information technology and other consulting fees,which are engaged and managed through the corporate office. Professional fees also include the cost of
39

THE INTERPUBLIC GROUP OF COMPANIES, INC. AND SUBSIDIARIESMANAGEMENT'S DISCUSSION AND ANALYSIS OF
FINANCIAL CONDITION AND RESULTS OF OPERATIONS Ì (Continued)(Amounts in Millions, Except Per Share Amounts)
temporary financial professionals associated with work on our Prior Restatement activities. Rent anddepreciation includes rental expense and depreciation of leasehold improvements for properties occupied bycorporate office employees. Corporate insurance expense includes the cost for fire, liability and automobilepremiums. Bank fees relate to cash management activity administered by the corporate office. Theamounts allocated to operating divisions are calculated monthly based on a formula that uses the revenuesof the operating unit. Amounts allocated also include specific charges for information technology relatedprojects which are allocated based on utilization.
The increase in corporate and other expense of $73.1 or 30.1% is primarily related to the increase insalaries and related expenses and professional fees. The increase in salary expenses was the result ofadditional staffing to address weaknesses in our accounting and control environment, and develop sharedservices. The increase in professional fees are the result of costs associated with internal controlcompliance, costs associated with the Prior Restatement process, and related audit costs. Amountsallocated to operating divisions primarily increased due to the implementation of new informationtechnology related projects and the consolidation of information technology support staff, the costs ofwhich are now being allocated back to operating divisions.
Segment Results of Operations Ì Three Months Ended December 31, 2005 Compared to Three MonthsEnded December 31, 2004
The following table summarizes revenue and operating income (loss) by segment for the threemonths ended December 31, 2005 and 2004. Other than long-lived asset impairment and contracttermination costs, the operating results of Motorsports are not material to our consolidated results, and aretherefore not discussed below:
For theThree Months Ended
December 31,
2005 2004 $ Change % Change
Revenue:
IAN ÏÏÏÏÏÏÏÏÏÏÏÏÏÏÏÏÏÏÏÏÏÏÏÏÏÏÏÏÏÏÏÏÏÏÏÏÏÏÏ $1,614.8 $1,700.0 $ (85.2) (5.0)%
CMG ÏÏÏÏÏÏÏÏÏÏÏÏÏÏÏÏÏÏÏÏÏÏÏÏÏÏÏÏÏÏÏÏÏÏÏÏÏÏ 280.6 261.0 19.6 7.5%
Motorsports ÏÏÏÏÏÏÏÏÏÏÏÏÏÏÏÏÏÏÏÏÏÏÏÏÏÏÏÏÏÏÏÏÏ 0.3 4.7 (4.4) (93.6)%
Consolidated revenue ÏÏÏÏÏÏÏÏÏÏÏÏÏÏÏÏÏÏÏÏÏÏÏ $1,895.7 $1,965.7 $ (70.0) (3.6)%
Segment operating income (loss):
IAN ÏÏÏÏÏÏÏÏÏÏÏÏÏÏÏÏÏÏÏÏÏÏÏÏÏÏÏÏÏÏÏÏÏÏÏÏÏÏÏ $ 221.2 $ 359.2 $(138.0) (38.4)%
CMG ÏÏÏÏÏÏÏÏÏÏÏÏÏÏÏÏÏÏÏÏÏÏÏÏÏÏÏÏÏÏÏÏÏÏÏÏÏÏ 30.7 29.7 1.0 3.4%
Motorsports ÏÏÏÏÏÏÏÏÏÏÏÏÏÏÏÏÏÏÏÏÏÏÏÏÏÏÏÏÏÏÏÏÏ (0.3) (2.0) 1.7 (85.0)%
Corporate and other ÏÏÏÏÏÏÏÏÏÏÏÏÏÏÏÏÏÏÏÏÏÏÏÏÏÏ (100.5) (73.4) (27.1) 36.9%
40

THE INTERPUBLIC GROUP OF COMPANIES, INC. AND SUBSIDIARIESMANAGEMENT'S DISCUSSION AND ANALYSIS OF
FINANCIAL CONDITION AND RESULTS OF OPERATIONS Ì (Continued)(Amounts in Millions, Except Per Share Amounts)
For the Three Months Ended December 31,
2005 2004
IAN CMG Motorsports Corporate Total IAN CMG Motorsports Corporate Total
Reconciliation toconsolidated operatingincome:
Consolidated operatingincome (loss)ÏÏÏÏÏÏÏÏÏ $130.4 $27.7 $(0.3) $(100.2) $ 57.6 $353.3 $33.3 $(2.3) $(72.2) $312.1
Adjustments:
Restructuring reversals(charges) ÏÏÏÏÏÏÏÏÏÏ 1.2 (2.9) Ì 0.3 (1.4) (1.7) 4.9 Ì 1.2 4.4
Long lived assetimpairment and othercharges: ÏÏÏÏÏÏÏÏÏÏÏÏ (92.0) (0.1) Ì Ì (92.1) (4.2) (1.3) (0.3) Ì (5.8)
Segment operating income(loss)ÏÏÏÏÏÏÏÏÏÏÏÏÏÏÏÏ $221.2 $30.7 $(0.3) $(100.5) $359.2 $29.7 $(2.0) $(73.4)
INTEGRATED AGENCY NETWORKS (""IAN'')
REVENUE
The components of the 2005 change were as follows:
Total Domestic International
Three Months Ended $ % Change $ % Change % of Total $ % Change % of Total
December 31, 2004 ÏÏÏÏÏÏÏÏÏÏÏ $1,700.0 $838.3 49.3% $861.7 50.7%
Foreign currency changes ÏÏÏÏÏÏ (9.9) (0.6)% Ì 0.0% (9.9) (1.1)%
Net acquisitions/divestitures ÏÏÏ (17.1) (1.0)% (14.3) (1.7)% (2.8) (0.3)%
Organic ÏÏÏÏÏÏÏÏÏÏÏÏÏÏÏÏÏÏÏÏÏ (58.2) (3.4)% (0.9) (0.1)% (57.3) (6.6)%
Total change ÏÏÏÏÏÏÏÏÏÏÏÏÏÏ (85.2) (5.0)% (15.2) (1.8)% (70.0) (8.1)%
December 31, 2005 ÏÏÏÏÏÏÏÏÏÏÏ $1,614.8 $823.1 51.0% $791.7 49.0%
IAN experienced a net decrease in revenue as compared to 2004 of $85.2, or 5.0%, which wascomprised of an organic decrease in revenue of $58.2, a decrease attributable to net acquisitions anddivestitures of $17.1 and a decrease in foreign currency exchange rate changes of $9.9. Excluding out ofperiod adjustments of $17.8 recorded in the three months ended December 31, 2005, the net revenuedecrease would have been $67.4.
The organic decrease in revenue excluding the impact of out of period adjustments was primarilydriven by decreases at McCann, Lowe and Deutsch. McCann experienced a decline in revenues primarilydue to a reduction in revenue from existing international clients, particularly in Europe and Asia Pacific.This reduction was partially offset by new client wins, particularly in Europe. Lowe's decline in revenuewas primarily driven by a change in the structure of certain client contracts which resulted in a deferral ofrevenue and a reduction in revenue from existing international clients, particularly in Europe. Deutschexperienced a decline in revenues primarily due to lost clients and a reduction in revenue from existingclients in the U.S. partially offset by new client wins.
41

THE INTERPUBLIC GROUP OF COMPANIES, INC. AND SUBSIDIARIESMANAGEMENT'S DISCUSSION AND ANALYSIS OF
FINANCIAL CONDITION AND RESULTS OF OPERATIONS Ì (Continued)(Amounts in Millions, Except Per Share Amounts)
SEGMENT OPERATING INCOME
For the Three MonthsEnded December 31,
2005 2004 $ Change % Change
Segment operating income ÏÏÏÏÏÏÏÏÏÏÏÏÏÏÏÏÏÏÏÏÏ $221.2 $359.2 $(138.0) (38.4)%
Operating margin ÏÏÏÏÏÏÏÏÏÏÏÏÏÏÏÏÏÏÏÏÏÏÏÏÏÏÏÏÏ 13.7% 21.1%
For the three months ended December 31, 2005, IAN operating income decreased by $138.0, or38.4%, which was the result of a decrease in revenue of $85.2, an increase in salaries and related expensesof $41.1 and increased office and general expenses of $11.7. Excluding out of period adjustments of $22.1,the total operating income decrease would have been $115.9.
The decrease in IAN's operating income, excluding the impact of out of period adjustments andforeign currency and net effects of acquisitions and divestitures, was primarily driven by decreasedoperating income at McCann and Lowe. The operating income decrease at McCann was primarily due toincreased severance, production and media expenses, occupancy costs and temporary staffing costs. Higherseverance expense was the result of domestic and international headcount reductions. The increase inproduction and media expenses was due to an increase in arrangements entered into where we act as aprincipal, which requires us to record expenses on a gross basis. The increase in occupancy costs wasprimarily due to the termination of several operating leases. Temporary staffing was impacted by additionalstaffing necessary to address weaknesses in our accounting and control environment. In the fourth quarterof 2005, we recorded approximately $10.0 for certain client negotiations. The operating income decrease atLowe was primarily due to the organic decrease in revenue as compared to the prior year.
CONSTITUENCY MANAGEMENT GROUP (""CMG'')
REVENUE
The components of the 2005 change were as follows:
Total Domestic International
Three Months Ended $ % Change $ % Change % of Total $ % Change % of Total
December 31, 2004 ÏÏÏÏÏÏÏÏÏ $261.0 $144.9 55.5% $116.1 44.5%
Foreign currency changes ÏÏÏÏ (2.5) (1.0)% Ì 0.0% (2.5) (2.2)%
Net acquisitions/divestitures ÏÏ (2.0) (0.8)% (0.7) (0.5)% (1.3) (1.1)%
Organic ÏÏÏÏÏÏÏÏÏÏÏÏÏÏÏÏÏÏÏ 24.1 9.2% 16.7 11.5% 7.4 6.4%
Total change ÏÏÏÏÏÏÏÏÏÏÏÏÏ 19.6 7.5% 16.0 11.0% 3.6 3.1%
December 31, 2005 ÏÏÏÏÏÏÏÏÏ $280.6 $160.9 57.3% $119.7 42.7%
For the three months ended December 31, 2005, CMG experienced a net increase in revenue ascompared to 2004 of $19.6, or 7.5%, which was comprised of an organic revenue increase of $24.1,partially offset by a decrease in foreign currency exchange rate changes of $2.5 and decreases attributableto net acquisitions and divestitures of $2.0. Excluding out of period adjustments of $0.5, the net revenueincrease would have been $19.1.
The organic revenue increase excluding the impact of out of period adjustments was primarily drivenby worldwide growth in sports marketing business, events marketing business and public relations businessas a result of increased revenue from existing clients and new client wins.
42

THE INTERPUBLIC GROUP OF COMPANIES, INC. AND SUBSIDIARIESMANAGEMENT'S DISCUSSION AND ANALYSIS OF
FINANCIAL CONDITION AND RESULTS OF OPERATIONS Ì (Continued)(Amounts in Millions, Except Per Share Amounts)
SEGMENT OPERATING INCOME
For the Three MonthsEnded December 31,
2005 2004 $ Change % Change
Segment operating incomeÏÏÏÏÏÏÏÏÏÏÏÏÏÏÏÏÏÏÏÏÏ $30.7 $29.7 $1.0 3.4%
Operating margin ÏÏÏÏÏÏÏÏÏÏÏÏÏÏÏÏÏÏÏÏÏÏÏÏÏÏÏÏ 10.9% 11.4%
For the three months ended December 31, 2005, CMG operating income increased by $1.0, or 3.4%,which was the result of an increase in revenue of $19.6, offset by increased salaries and related expenses of$10.4 and office and general expenses of $8.2. Excluding out of period adjustments of $3.5, the totaloperating income increase would have been $4.5.
The increase in CMG's operating income, excluding the impact of out of period adjustments andforeign currency and net effects of acquisitions and divestitures, was due to an organic revenue increaseprimarily driven by worldwide growth in sports marketing business as a result of increased revenue fromexisting clients and new client wins. This increase was partially offset by an increase in professional fees asa result of costs associated with the Prior Restatement process and internal control compliance and anincrease in salary expenses across all businesses due to increased headcount to further address weaknessesin our accounting and control environment.
CORPORATE AND OTHER
Certain corporate and other charges are reported as a separate line within total segment operatingincome and include corporate office expenses and shared service center expenses, as well as certain othercentrally managed expenses that are not fully allocated to operating divisions. The following significantexpenses are included in corporate and other:
For theThree Months
Ended December 31,
2005 2004 $ Change % Change
Salaries, benefits and related expenses ÏÏÏÏÏÏÏÏÏÏÏ $ 70.7 $ 34.3 $36.4 106.1%
Professional fees ÏÏÏÏÏÏÏÏÏÏÏÏÏÏÏÏÏÏÏÏÏÏÏÏÏÏÏÏÏ 53.0 56.7 (3.7) (6.5)%
Rent and depreciationÏÏÏÏÏÏÏÏÏÏÏÏÏÏÏÏÏÏÏÏÏÏÏÏÏ 14.2 10.0 4.2 42.0%
Corporate Insurance ÏÏÏÏÏÏÏÏÏÏÏÏÏÏÏÏÏÏÏÏÏÏÏÏÏÏ 6.2 6.0 0.2 3.3%
Bank fees ÏÏÏÏÏÏÏÏÏÏÏÏÏÏÏÏÏÏÏÏÏÏÏÏÏÏÏÏÏÏÏÏÏÏÏ 0.6 0.7 (0.1) (14.3)%
Other ÏÏÏÏÏÏÏÏÏÏÏÏÏÏÏÏÏÏÏÏÏÏÏÏÏÏÏÏÏÏÏÏÏÏÏÏÏÏ (7.8) 2.0 (9.8) (490.0)%
Expenses allocated to operating divisions ÏÏÏÏÏÏÏÏÏ (36.4) (36.3) (0.1) 0.3%
Total corporate and otherÏÏÏÏÏÏÏÏÏÏÏÏÏÏÏÏÏÏÏÏ $100.5 $ 73.4 $27.1 36.9%
Salaries, benefits and related expenses include salaries, pension, bonus and medical and dentalinsurance expenses for corporate office employees, as well as the cost of temporary employees at thecorporate office. Professional fees include costs related to the internal control compliance, cost of PriorRestatement efforts, financial statement audits, legal, information technology and other consulting fees,which are engaged and managed through the corporate office. Professional fees also include the cost oftemporary financial professionals associated with work on our Prior Restatement activities. Rent anddepreciation includes rental expense and depreciation of leasehold improvements for properties occupied bycorporate office employees. Corporate insurance expense includes the cost for fire, liability and automobile
43
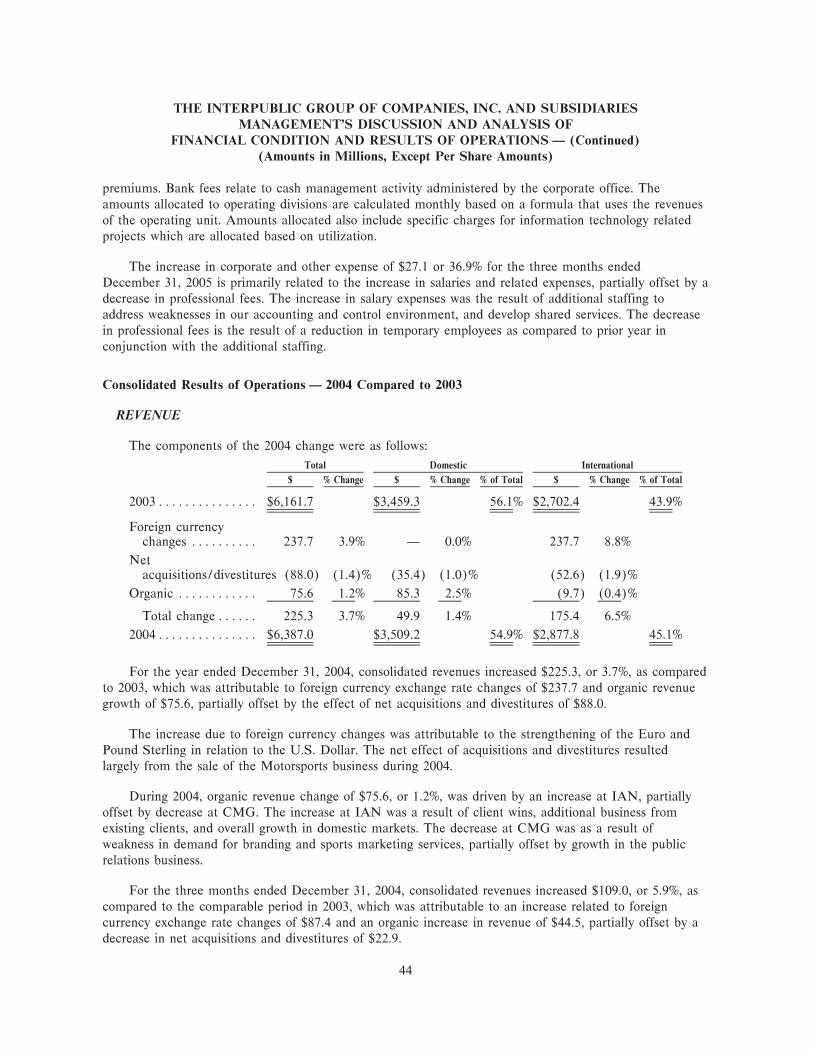
THE INTERPUBLIC GROUP OF COMPANIES, INC. AND SUBSIDIARIESMANAGEMENT'S DISCUSSION AND ANALYSIS OF
FINANCIAL CONDITION AND RESULTS OF OPERATIONS Ì (Continued)(Amounts in Millions, Except Per Share Amounts)
premiums. Bank fees relate to cash management activity administered by the corporate office. Theamounts allocated to operating divisions are calculated monthly based on a formula that uses the revenuesof the operating unit. Amounts allocated also include specific charges for information technology relatedprojects which are allocated based on utilization.
The increase in corporate and other expense of $27.1 or 36.9% for the three months endedDecember 31, 2005 is primarily related to the increase in salaries and related expenses, partially offset by adecrease in professional fees. The increase in salary expenses was the result of additional staffing toaddress weaknesses in our accounting and control environment, and develop shared services. The decreasein professional fees is the result of a reduction in temporary employees as compared to prior year inconjunction with the additional staffing.
Consolidated Results of Operations Ì 2004 Compared to 2003
REVENUE
The components of the 2004 change were as follows:
Total Domestic International
$ % Change $ % Change % of Total $ % Change % of Total
2003ÏÏÏÏÏÏÏÏÏÏÏÏÏÏÏ $6,161.7 $3,459.3 56.1% $2,702.4 43.9%
Foreign currencychanges ÏÏÏÏÏÏÏÏÏÏ 237.7 3.9% Ì 0.0% 237.7 8.8%
Netacquisitions/divestitures (88.0) (1.4)% (35.4) (1.0)% (52.6) (1.9)%
Organic ÏÏÏÏÏÏÏÏÏÏÏÏ 75.6 1.2% 85.3 2.5% (9.7) (0.4)%
Total changeÏÏÏÏÏÏ 225.3 3.7% 49.9 1.4% 175.4 6.5%
2004ÏÏÏÏÏÏÏÏÏÏÏÏÏÏÏ $6,387.0 $3,509.2 54.9% $2,877.8 45.1%
For the year ended December 31, 2004, consolidated revenues increased $225.3, or 3.7%, as comparedto 2003, which was attributable to foreign currency exchange rate changes of $237.7 and organic revenuegrowth of $75.6, partially offset by the effect of net acquisitions and divestitures of $88.0.
The increase due to foreign currency changes was attributable to the strengthening of the Euro andPound Sterling in relation to the U.S. Dollar. The net effect of acquisitions and divestitures resultedlargely from the sale of the Motorsports business during 2004.
During 2004, organic revenue change of $75.6, or 1.2%, was driven by an increase at IAN, partiallyoffset by decrease at CMG. The increase at IAN was a result of client wins, additional business fromexisting clients, and overall growth in domestic markets. The decrease at CMG was as a result ofweakness in demand for branding and sports marketing services, partially offset by growth in the publicrelations business.
For the three months ended December 31, 2004, consolidated revenues increased $109.0, or 5.9%, ascompared to the comparable period in 2003, which was attributable to an increase related to foreigncurrency exchange rate changes of $87.4 and an organic increase in revenue of $44.5, partially offset by adecrease in net acquisitions and divestitures of $22.9.
44

THE INTERPUBLIC GROUP OF COMPANIES, INC. AND SUBSIDIARIESMANAGEMENT'S DISCUSSION AND ANALYSIS OF
FINANCIAL CONDITION AND RESULTS OF OPERATIONS Ì (Continued)(Amounts in Millions, Except Per Share Amounts)
OPERATING EXPENSES
For the Years Ended December 31,
2004 2003
% of % of$ Revenue $ Revenue $ Change % Change
Salaries and related expenses ÏÏÏÏÏÏÏÏÏÏÏÏÏÏÏ $3,733.0 58.4% $3,501.4 56.8% $ 231.6 6.6%
Office and general expenses ÏÏÏÏÏÏÏÏÏÏÏÏÏÏÏÏ 2,250.4 35.2% 2,225.3 36.1% 25.1 1.1%
Restructuring charges ÏÏÏÏÏÏÏÏÏÏÏÏÏÏÏÏÏÏÏÏÏ 62.2 172.9 (110.7) (64.0)%
Long-lived asset impairment and other charges 322.2 294.0 28.2 9.6%
Motorsports contract termination costs ÏÏÏÏÏÏÏ 113.6 Ì 113.6 100.0%
Total operating expensesÏÏÏÏÏÏÏÏÏÏÏÏÏÏÏÏÏ $6,481.4 $6,193.6 $ 287.8 4.6%
Salaries and Related Expenses
The components of the 2004 change were as follows:
Total % of$ % Change Revenue
2003 ÏÏÏÏÏÏÏÏÏÏÏÏÏÏÏÏÏÏÏÏÏÏÏÏÏÏÏÏÏÏÏÏÏÏÏÏÏÏÏÏÏÏÏÏÏÏÏÏÏÏÏÏÏ $3,501.4 56.8%
Foreign currency changesÏÏÏÏÏÏÏÏÏÏÏÏÏÏÏÏÏÏÏÏÏÏÏÏÏÏÏÏÏÏÏÏÏÏ 129.5 3.7%
Net acquisitions/divestitures ÏÏÏÏÏÏÏÏÏÏÏÏÏÏÏÏÏÏÏÏÏÏÏÏÏÏÏÏÏÏÏ (40.5) (1.2)%
OrganicÏÏÏÏÏÏÏÏÏÏÏÏÏÏÏÏÏÏÏÏÏÏÏÏÏÏÏÏÏÏÏÏÏÏÏÏÏÏÏÏÏÏÏÏÏÏÏÏÏ 142.6 4.1%
Total change ÏÏÏÏÏÏÏÏÏÏÏÏÏÏÏÏÏÏÏÏÏÏÏÏÏÏÏÏÏÏÏÏÏÏÏÏÏÏÏÏÏÏÏÏ 231.6 6.6%
2004 ÏÏÏÏÏÏÏÏÏÏÏÏÏÏÏÏÏÏÏÏÏÏÏÏÏÏÏÏÏÏÏÏÏÏÏÏÏÏÏÏÏÏÏÏÏÏÏÏÏÏÏÏÏ $3,733.0 58.4%
Salaries and related expenses are the largest component of operating expenses and consist primarily ofsalaries and related benefits, and performance incentives. During 2004, salaries and related expensesincreased to 58.4% of revenues, compared to 56.8% in 2003. In 2004, salaries and related expensesincreased $142.6, excluding the increase related to foreign currency exchange rate changes of $129.5 and adecrease related to net acquisitions and divestitures of $40.5.
Salaries and related expenses were impacted by changes in foreign currency rates, attributable to thestrengthening of the Euro and Pound Sterling in relation to the U.S. Dollar. The increase due to foreigncurrency rate changes was partially offset by the impact of net acquisitions and divestitures activity, whichresulted largely from the sale of the Motorsports business during 2004.
The increase in salaries and related expenses, excluding the impact of foreign currency and netacquisitions and divestitures, was primarily the result of increases in employee headcount at certainlocations and increased utilization of temporary and freelance staffing and higher performance incentiveexpense at a number of agencies that experienced an increase in operating results. Furthermore, during theyear, we hired additional personnel within our operating units and in the corporate group to support ourback office processes, including accounting and shared services initiatives, as well as our ongoing efforts inachieving Sarbanes-Oxley compliance. We reduced staff at certain operations after client accounts werelost. Cost savings associated with headcount reductions were partially offset by increased severance costsassociate with the headcount reductions.
45

THE INTERPUBLIC GROUP OF COMPANIES, INC. AND SUBSIDIARIESMANAGEMENT'S DISCUSSION AND ANALYSIS OF
FINANCIAL CONDITION AND RESULTS OF OPERATIONS Ì (Continued)(Amounts in Millions, Except Per Share Amounts)
For the three months ended December 31, 2004, salaries and related expenses increased $73.6,excluding the increase related to foreign currency exchange rate changes of $38.8 and a decrease related tonet acquisitions and divestitures of $8.8 as compared to 2003.
Office and General Expenses
The components of the 2004 change were as follows:
Total % of$ % Change Revenue
2003 ÏÏÏÏÏÏÏÏÏÏÏÏÏÏÏÏÏÏÏÏÏÏÏÏÏÏÏÏÏÏÏÏÏÏÏÏÏÏÏÏÏÏÏÏÏÏÏÏÏÏÏ $2,225.3 36.1%
Foreign currency changesÏÏÏÏÏÏÏÏÏÏÏÏÏÏÏÏÏÏÏÏÏÏÏÏÏÏÏÏÏÏÏÏÏÏ 102.8 4.6%
Net acquisitions/divestitures ÏÏÏÏÏÏÏÏÏÏÏÏÏÏÏÏÏÏÏÏÏÏÏÏÏÏÏÏÏÏÏ (63.8) (2.9)%
OrganicÏÏÏÏÏÏÏÏÏÏÏÏÏÏÏÏÏÏÏÏÏÏÏÏÏÏÏÏÏÏÏÏÏÏÏÏÏÏÏÏÏÏÏÏÏÏÏÏÏ (13.9) (0.6)%
Total change ÏÏÏÏÏÏÏÏÏÏÏÏÏÏÏÏÏÏÏÏÏÏÏÏÏÏÏÏÏÏÏÏÏÏÏÏÏÏÏÏÏÏ 25.1 1.1%
2004 ÏÏÏÏÏÏÏÏÏÏÏÏÏÏÏÏÏÏÏÏÏÏÏÏÏÏÏÏÏÏÏÏÏÏÏÏÏÏÏÏÏÏÏÏÏÏÏÏÏÏÏ $2,250.4 35.2%
Office and general expenses primarily consist of rent, office and equipment, depreciation, professionalfees, other overhead expenses and certain out-of-pocket expenses related to our revenue. During 2004,office and general expenses decreased to 35.2% of revenues, compared to 36.1% in 2003. In 2004, officeand general expenses decreased $13.9, excluding the increase related to foreign currency exchange ratechanges of $102.8 and a decrease related to net acquisitions and divestitures of $63.8.
Office and general expenses were impacted by changes in foreign currency rates, attributable to thestrengthening of the Euro and Pound Sterling in relation to the U.S. Dollar. The increase due to foreigncurrency rate changes was offset by the impact of net acquisitions and divestitures activity, which resultedlargely from the sale of the Motorsports business in 2004.
The decrease in office and general expenses, excluding the impact of foreign currency and netacquisition and divestitures activity, was primarily the result of lower occupancy and overhead costs, and adecrease related to charges recorded by CMG in 2003 to secure certain sports television rights. Thesedecreases, however, were partially offset by increases driven by a rise in professional fees as part of ourongoing efforts in achieving Sarbanes-Oxley compliance, and the preliminary application development andmaintenance of information technology systems and processes related to our shared services initiatives.
For the three months ended December 31, 2004, office and general expenses increased $47.1,excluding an increase related to foreign currency exchange rate changes of $27.2 and a decrease related tonet acquisitions and divestitures of $20.0 when compared to 2003.
Restructuring (Reversals) Charges
During 2004 and 2003, we recorded net (reversals) and charges related to lease termination and otherexit costs and severance and termination costs for the 2003 and 2001 restructuring programs of $62.2 and$172.9, respectively. Included in the net (reversals) and charges were adjustments resulting from changesin management's estimates for the 2003 and 2001 restructuring programs which decreased the restructuringreserves by $32.0 and $2.4 in 2004 and 2003, respectively. 2004 net charges primarily related to thevacating of 43 offices and workforce reduction of approximately 400 employees related to the 2003restructuring program and adjustments to management's estimates for the 2001 restructuring program.2003 net charges primarily related to the vacating of 55 offices and workforce reduction of approximately
46

THE INTERPUBLIC GROUP OF COMPANIES, INC. AND SUBSIDIARIESMANAGEMENT'S DISCUSSION AND ANALYSIS OF
FINANCIAL CONDITION AND RESULTS OF OPERATIONS Ì (Continued)(Amounts in Millions, Except Per Share Amounts)
2,900 employees related to the 2003 restructuring program and adjustments to management's estimates forthe 2001 restructuring program. A summary of the net (reversals) and charges by segment is as follows:
Lease Terminationand Other Exit Costs Severance and Termination Costs
2003 2001 2003 2001Program Program Total Program Program Total Total
2004 Net (Reversals) Charges
IAN ÏÏÏÏÏÏÏÏÏÏÏÏÏÏÏÏÏÏÏÏÏÏÏÏÏÏÏÏÏÏ $40.3 $(7.3) $33.0 $ 14.1 $(4.3) $ 9.8 $ 42.8
CMG ÏÏÏÏÏÏÏÏÏÏÏÏÏÏÏÏÏÏÏÏÏÏÏÏÏÏÏÏÏ 8.1 4.0 12.1 5.1 (0.7) 4.4 16.5
Corporate ÏÏÏÏÏÏÏÏÏÏÏÏÏÏÏÏÏÏÏÏÏÏÏÏÏÏ 3.7 (1.0) 2.7 0.3 (0.1) 0.2 2.9
Total ÏÏÏÏÏÏÏÏÏÏÏÏÏÏÏÏÏÏÏÏÏÏÏÏÏÏÏÏ $52.1 $(4.3) $47.8 $ 19.5 $(5.1) $ 14.4 $ 62.2
2003 Net (Reversals) Charges
IAN ÏÏÏÏÏÏÏÏÏÏÏÏÏÏÏÏÏÏÏÏÏÏÏÏÏÏÏÏÏÏ $23.1 $ 8.8 $31.9 $106.6 $(0.1) $106.5 $138.4
CMG ÏÏÏÏÏÏÏÏÏÏÏÏÏÏÏÏÏÏÏÏÏÏÏÏÏÏÏÏÏ 12.7 6.1 18.8 15.7 Ì 15.7 34.5
Motorsports ÏÏÏÏÏÏÏÏÏÏÏÏÏÏÏÏÏÏÏÏÏÏÏÏ Ì Ì Ì 0.4 Ì 0.4 0.4
Corporate ÏÏÏÏÏÏÏÏÏÏÏÏÏÏÏÏÏÏÏÏÏÏÏÏÏÏ (2.2) (1.3) (3.5) 3.1 Ì 3.1 (0.4)
Total ÏÏÏÏÏÏÏÏÏÏÏÏÏÏÏÏÏÏÏÏÏÏÏÏÏÏÏÏ $33.6 $13.6 $47.2 $125.8 $(0.1) $125.7 $172.9
In addition to amounts recorded as restructuring charges, we recorded charges of $11.1 and $16.5during 2004 and 2003, respectively, related to the accelerated amortization of leasehold improvements onproperties included in the 2003 program. These charges were included in office and general expenses onthe Consolidated Statements of Operations. For additional information, see Note 6 to the ConsolidatedFinancial Statements.
During the three months ended December 31, 2004 and 2003, we recorded net (reversals) andcharges related to lease termination and other exit costs and severance and termination costs for the 2003and 2001 restructuring programs of $(4.4) and $30.2, respectively. 2004 net reversals primarily consisted ofchanges to management's estimates for the 2003 and 2001 restructuring programs primarily relating to ourlease termination costs. 2003 net charges related primarily to the vacating of offices and workforcereduction related to the 2003 restructuring program and adjustments to management's estimates for the2001 restructuring program.
Long-Lived Asset Impairment and Other Charges
The following table summarizes the long-lived asset impairment and other charges for 2004 and 2003:
For the Years Ended December 31,
2004 2003
IAN CMG Motor-sports Total IAN CMG Motor-sports Total
Goodwill impairment ÏÏÏ $220.2 $91.7 $ Ì $311.9 $ 0.4 $218.0 $ Ì $218.4
Fixed asset impairment 2.0 0.4 3.0 5.4 2.3 Ì 63.8 66.1
Other ÏÏÏÏÏÏÏÏÏÏÏÏÏÏÏÏ 4.9 Ì Ì 4.9 9.1 0.4 Ì 9.5
TotalÏÏÏÏÏÏÏÏÏÏÏÏÏÏÏ $227.1 $92.1 $3.0 $322.2 $11.8 $218.4 $63.8 $294.0
47

THE INTERPUBLIC GROUP OF COMPANIES, INC. AND SUBSIDIARIESMANAGEMENT'S DISCUSSION AND ANALYSIS OF
FINANCIAL CONDITION AND RESULTS OF OPERATIONS Ì (Continued)(Amounts in Millions, Except Per Share Amounts)
2004 Impairments
IAN Ì During the third quarter of 2004, we recorded goodwill impairment charges of approximately$220.2 at The Partnership reporting unit, which was comprised of Lowe Worldwide, Draft Worldwide,Mullen, Dailey & Associates and BGW. Our long-term projections showed previously unanticipateddeclines in discounted future operating cash flows due to recent client losses, reduced client spending, anddeclining industry valuation metrics. These discounted future operating cash flow projections caused theestimated fair value of The Partnership to be less than their book values. The Partnership wassubsequently disbanded in the fourth quarter of 2004 and the remaining goodwill was allocated based onthe relative fair value of the agencies at the time of disbandment.
CMG Ì As a result of the annual impairment review, a goodwill impairment charge of $91.7 wasrecorded at our CMG reporting unit, which was comprised of Weber Shandwick, GolinHarris, DeVries,MWW Group and FutureBrand. The fair value of CMG was adversely affected by declining industrymarket valuation metrics, specifically, a decrease in the EBITDA multiples used in the underlyingvaluation calculations. The impact of the lower EBITDA multiples caused the calculated fair value ofCMG goodwill to be less than the related book value.
2003 Impairments
CMG Ì We recorded an impairment charge of $218.0 to reduce the carrying value of goodwill atOctagon. The Octagon impairment charge reflects the reduction of the unit's fair value due principally topoor financial performance in 2003 and lower than expected future financial performance. Specifically,there was significant pricing pressure in both overseas and domestic TV rights distribution, declining feesfrom athlete representation, and lower than anticipated proceeds from committed future events, includingticket revenue and sponsorship.
Motorsports Ì We recorded fixed asset impairment charges of $63.8, consisting of $38.0 in connectionwith the sale of a business comprised of the four owned auto racing circuits, $9.6 related to the sales ofother Motorsports entities and a fixed asset impairment of $16.2 for outlays that Motorsports wascontractually required to spend to improve the racing facilities.
During the three months ended December 31, 2003, we recorded charges of $44.9. This primarilyrelated to a Motorsports' fixed asset impairment charge of $38.0 in conjunction with the sale of a businesscomprised of Motorsports four owned auto racing circuits.
For additional information, see Note 9 to the Consolidated Financial Statements.
Motorsports Contract Termination Costs
As discussed in Note 5 to the Consolidated Financial Statements, during the year endedDecember 31, 2004, we recorded a pretax charge of $113.6 related to a series of agreements with theBritish Racing Drivers Club and Formula One Administration Limited which released us from certainguarantees and lease obligations in the United Kingdom. We have exited this business and do notanticipate any additional material charges.
48

THE INTERPUBLIC GROUP OF COMPANIES, INC. AND SUBSIDIARIESMANAGEMENT'S DISCUSSION AND ANALYSIS OF
FINANCIAL CONDITION AND RESULTS OF OPERATIONS Ì (Continued)(Amounts in Millions, Except Per Share Amounts)
EXPENSE AND OTHER INCOME
For the Years EndedDecember 31,
2004 2003 $ Change % Change
Interest expenseÏÏÏÏÏÏÏÏÏÏÏÏÏÏÏÏÏÏÏÏÏÏÏÏÏÏÏÏÏÏÏÏ $(172.0) $(206.6) $ 34.6 (16.7)%
Debt prepayment penalty ÏÏÏÏÏÏÏÏÏÏÏÏÏÏÏÏÏÏÏÏÏÏÏÏ (9.8) (24.8) 15.0 (60.5)%
Interest income ÏÏÏÏÏÏÏÏÏÏÏÏÏÏÏÏÏÏÏÏÏÏÏÏÏÏÏÏÏÏÏÏ 50.8 39.3 11.5 29.3%
Investment impairments ÏÏÏÏÏÏÏÏÏÏÏÏÏÏÏÏÏÏÏÏÏÏÏÏÏ (63.4) (71.5) 8.1 (11.3)%
Litigation (reversals) charges ÏÏÏÏÏÏÏÏÏÏÏÏÏÏÏÏÏÏÏÏ 32.5 (127.6) 160.1 (125.5)%
Other income (expense) ÏÏÏÏÏÏÏÏÏÏÏÏÏÏÏÏÏÏÏÏÏÏÏÏ (10.7) 50.3 (61.0) (121.3)%
Total ÏÏÏÏÏÏÏÏÏÏÏÏÏÏÏÏÏÏÏÏÏÏÏÏÏÏÏÏÏÏÏÏÏÏÏÏÏÏÏ $(172.6) $(340.9) $168.3 (49.4)%
Interest Expense
The decrease in interest expense was primarily due to the redemption of our $250.0 1.80% ConvertibleSubordinate Notes in January 2004 and the early redemption of our borrowings under the PrudentialAgreements during the third quarter of 2003. During the three months ended December 31, 2003, werecorded interest expense of $51.6.
Debt Prepayment Penalty
During the fourth quarter of 2004, a prepayment penalty of $9.8 was recorded related to the earlyredemption of $250.0 of our 7.875% Senior Unsecured Notes due in 2005, which represented one half ofthe $500.0 outstanding. During the third quarter of 2003, we repaid our borrowings under the PrudentialAgreements, repaying $142.5 principal amount and incurring a prepayment penalty of $24.8.
Interest Income
The increase in interest income in 2004 was primarily due to an increase in our average balance ofshort-term investments held during the year, as well as an increase in interest rates when compared to2003. During the three months ended December 31, 2003, we recorded interest income of $11.5.
Investment Impairments
During 2004, we recorded investment impairment charges of $63.4, primarily related to a $50.9 chargefor our unconsolidated investment in German advertising agency Springer & Jacoby as a result of adecrease in projected operating results. Additionally, we recorded impairment charges of $4.7 related tounconsolidated affiliates primarily in Israel, Brazil, Japan and India, and $7.8 related to several otheravailable-for-sale investments.
During 2003, we recorded $71.5 of investment impairment charges related to 20 investments. Thecharge related principally to investments in Fortune Promo 7 of $9.5 in the Middle East, Koch Tavares of$7.7 in Latin America, Daiko of $10.0 in Japan, Roche Macaulay Partners of $7.9 in Canada,Springer & Jacoby of $6.5 in Germany and GlobalHue of $6.9 in the U.S. The majority of the impairmentcharges resulted from deteriorating economic conditions in the countries in which the agencies operate orthe loss of one or several key clients.
During the three months ended December 31, 2004, investment impairments decreased $15.6 ascompared to the comparable period in the prior year.
49

THE INTERPUBLIC GROUP OF COMPANIES, INC. AND SUBSIDIARIESMANAGEMENT'S DISCUSSION AND ANALYSIS OF
FINANCIAL CONDITION AND RESULTS OF OPERATIONS Ì (Continued)(Amounts in Millions, Except Per Share Amounts)
Litigation Charges
During 2004, with the court approval of the settlement of the class action shareholder suits discussedin Note 21 to the Consolidated Financial Statements, we received $20.0 from insurance proceeds which werecorded as a reduction in litigation charges because we had not previously established a receivable. Wealso recorded a reduction of $12.5 relating to a decrease in the share price between the tentativesettlement date and the final settlement date.
During 2003, we recorded litigation charges of $127.6 for various legal matters, of which $115.0related to a then-tentative settlement of the class action shareholder suits discussed above. Under theterms of the settlement, we were required to pay $20.0 in cash and issue 6.6 shares of our common stock.The ultimate amount of the litigation charge related to the settlement was dependent upon our stock priceat the time of the final settlement (as the number of shares was fixed in the agreement), which took placein December 2004.
Other Income (Expense)
In 2004, other income (expense) included $18.2 of net losses on the sale of 19 agencies. The lossesrelated primarily to the sale of Transworld Marketing, a U.S.-based promotions agency, which resulted in aloss of $8.6, and a $6.2 loss for the final liquidation of the Motorsports investment. See Note 5 to theConsolidated Financial Statements for further discussion of the Motorsports disposition.
In December 2003, we sold approximately 11.0 shares of Modem Media for net proceeds ofapproximately $57.0 in December, resulting in a pre-tax gain of $30.3. Also in December, we sold all ofthe approximately 11.7 shares of TNS we had acquired through the sale of NFO, for approximately $42.0of net proceeds. A pre-tax gain of $13.3 was recorded.
During the three months ended December 31, 2004, other income (expense) decreased by $8.7,primarily due to the losses described above for the sale of Transworld Marketing and the Motorsportsliquidation.
OTHER ITEMS
Income Taxes
For the YearsEnded
December 31,
2004 2003 $ Change % Change
Provision for income taxes ÏÏÏÏÏÏÏÏÏÏÏÏÏÏÏÏÏÏÏÏÏÏÏÏÏ $262.2 $242.7 $19.5 8.0%
Effective tax rateÏÏÏÏÏÏÏÏÏÏÏÏÏÏÏÏÏÏÏÏÏÏÏÏÏÏÏÏÏÏÏÏÏ 98.2% 65.1%
Our effective tax rate was negatively impacted in both 2004 and 2003 by the establishment ofvaluation allowances, as described below, restructuring charges, and non-deductible long-lived assetimpairment charges. In 2004, our effective tax rate was also impacted by pretax charges and related taxbenefits resulting from the Motorsports contract termination costs. The difference between the effective taxrate and the statutory federal rate of 35% is also due to state and local taxes and the effect ofnon-U.S. operations.
For the three months ended December 31, 2004 and 2003, we recorded an income tax provision of$130.6 and $247.6, respectively.
50

THE INTERPUBLIC GROUP OF COMPANIES, INC. AND SUBSIDIARIESMANAGEMENT'S DISCUSSION AND ANALYSIS OF
FINANCIAL CONDITION AND RESULTS OF OPERATIONS Ì (Continued)(Amounts in Millions, Except Per Share Amounts)
Valuation Allowance
During 2004, the valuation allowance of $236.0 was established in continuing operations on existingdeferred tax assets and current year losses with no benefit. The total valuation allowance as ofDecember 31, 2004 was $488.6. Our income tax expense recorded in the future will be reduced to theextent of offsetting decreases in our valuation allowance. The establishment or reversal of valuationallowances could have a significant negative or positive impact on future earnings.
During 2003, the valuation allowance of $111.4 was established in continuing operations on existingdeferred tax assets and losses in 2003 with no benefit. In addition, $3.7 of valuation allowances wereestablished for certain U.S. capital and other loss carryforwards. The total valuation allowance as ofDecember 31, 2003 was $252.6.
For additional information, see Note 11 to the Consolidated Financial Statements.
Minority Interest and Unconsolidated Affiliates
For the YearsEnded
December 31,
2004 2003 $ Change % Change
Income applicable to minority interests ÏÏÏÏÏÏÏÏÏÏÏÏÏÏ $(21.5) $(27.0) $5.5 (20.4)%
Equity in net income of unconsolidated affiliates, net oftax ÏÏÏÏÏÏÏÏÏÏÏÏÏÏÏÏÏÏÏÏÏÏÏÏÏÏÏÏÏÏÏÏÏÏÏÏÏÏÏÏÏÏÏ $ 5.8 $ 2.4 $3.4 141.7%
The decrease in income applicable to minority interests was primarily due to lower earnings ofmajority-owned international businesses, primarily in Europe, and the sale of majority-owned businesses inLatin America.
The increase in equity in net income of unconsolidated affiliates was primarily due to the impact ofprior year losses at Modem Media, which was sold in 2003, and the impact of higher 2003 losses at anunconsolidated investment in Brazil and a U.S.-based sports and entertainment event business.
During the three months ended December 31, 2004 and 2003, we recorded $10.3 and $13.6 of incomeapplicable to minority interests, respectively. During the three months ended December 31, 2004 and 2003,we recorded $1.1 and $3.8 of equity in net income of unconsolidated affiliates, respectively.
NET LOSS
For the Years EndedDecember 31,
2004 2003 $ Change % Change
Loss from continuing operations ÏÏÏÏÏÏÏÏÏÏÏÏÏÏÏÏÏÏ $(544.9) $(640.1) $ 95.2 (14.9)%
Income from discontinued operations, net of taxes of$3.5 and $18.5, respectively ÏÏÏÏÏÏÏÏÏÏÏÏÏÏÏÏÏÏÏÏ 6.5 101.0 (94.5) (93.6)%
Net loss ÏÏÏÏÏÏÏÏÏÏÏÏÏÏÏÏÏÏÏÏÏÏÏÏÏÏÏÏÏÏÏÏÏÏÏÏÏÏ (538.4) (539.1) 0.7 (0.1)%
Less: Preferred stock dividends ÏÏÏÏÏÏÏÏÏÏÏÏÏÏÏÏÏÏÏ 19.8 Ì 19.8 100.0%
Net loss applicable to common stockholders ÏÏÏÏÏÏÏ $(558.2) $(539.1) $(19.1) 3.5%
51

THE INTERPUBLIC GROUP OF COMPANIES, INC. AND SUBSIDIARIESMANAGEMENT'S DISCUSSION AND ANALYSIS OF
FINANCIAL CONDITION AND RESULTS OF OPERATIONS Ì (Continued)(Amounts in Millions, Except Per Share Amounts)
Loss from Continuing Operations
In 2004, our loss from continuing operations decreased by $95.2 or 14.9% as a result of an increase inrevenue of $225.3 and a decrease in expense and other income primarily driven by higher litigation costs in2003, as a result of the shareholder suit settlement. These changes were partially offset by an increase inoperating expenses of $287.8, which includes Motorsports contract termination costs of $113.6.
For the three months ended December 31, 2004 and 2003, we recorded income from continuingoperations of $130.3 and a loss from continuing operations of $3.6, respectively.
Income from Discontinued Operations
Recorded within income from discontinued operations is the impact of our sale of NFO, our researchunit, to TNS in 2003. NFO is classified in discontinued operations and the results of operations and cashflows of NFO have been removed from our results of continuing operations and cash flows for all periods.During 2003, we completed the sale of NFO for $415.6 in cash ($376.7, net of cash sold and expenses)and approximately 11.7 shares of TNS stock. We sold the TNS stock in December 2003 for net proceedsof approximately $42.0. As a result of the sale of NFO, we recognized a pre-tax gain of $99.1 ($89.1, netof tax) in the third quarter of 2003 after certain post closing adjustments. The TNS shares sold resulted ina pre-tax gain of $13.3. In July 2004, we received an additional $10.0 ($6.5, net of tax) from TNS as afinal payment. For additional information, see Note 5 to the Consolidated Financial Statements.
Segment Results of Operations Ì 2004 Compared to 2003
The following table summarizes revenue and operating income (loss) by segment in 2004 and 2003.As previously discussed, in 2004 and 2003 we had a third reportable segment, comprised of ourMotorsports operations, which were sold during 2004. Other than long-lived asset impairment and contracttermination costs, the operating results of Motorsports are not material to our consolidated results, and aretherefore not discussed below:
For the Years EndedDecember 31,
2004 2003 $ Change % Change
Revenue:
IAN ÏÏÏÏÏÏÏÏÏÏÏÏÏÏÏÏÏÏÏÏÏÏÏÏÏÏÏÏÏÏÏÏÏÏÏÏÏÏ $5,399.2 $5,140.5 $258.7 5.0%
CMG ÏÏÏÏÏÏÏÏÏÏÏÏÏÏÏÏÏÏÏÏÏÏÏÏÏÏÏÏÏÏÏÏÏÏÏÏÏ 935.8 942.4 (6.6) (0.7)%
Motorsports ÏÏÏÏÏÏÏÏÏÏÏÏÏÏÏÏÏÏÏÏÏÏÏÏÏÏÏÏÏÏÏÏ 52.0 78.8 (26.8) (34.0)%
Consolidated revenue ÏÏÏÏÏÏÏÏÏÏÏÏÏÏÏÏÏÏÏÏÏÏ $6,387.0 $6,161.7 $225.3 3.7%
Segment operating income (loss):
IAN ÏÏÏÏÏÏÏÏÏÏÏÏÏÏÏÏÏÏÏÏÏÏÏÏÏÏÏÏÏÏÏÏÏÏÏÏÏÏ $ 577.1 $ 551.6 $ 25.5 4.6%
CMG ÏÏÏÏÏÏÏÏÏÏÏÏÏÏÏÏÏÏÏÏÏÏÏÏÏÏÏÏÏÏÏÏÏÏÏÏÏ 83.7 55.7 28.0 50.3%
Motorsports ÏÏÏÏÏÏÏÏÏÏÏÏÏÏÏÏÏÏÏÏÏÏÏÏÏÏÏÏÏÏÏÏ (14.0) (43.5) 29.5 (67.8)%
Corporate and other ÏÏÏÏÏÏÏÏÏÏÏÏÏÏÏÏÏÏÏÏÏÏÏÏÏ (243.2) (128.8) (114.4) 88.8%
52

THE INTERPUBLIC GROUP OF COMPANIES, INC. AND SUBSIDIARIESMANAGEMENT'S DISCUSSION AND ANALYSIS OF
FINANCIAL CONDITION AND RESULTS OF OPERATIONS Ì (Continued)(Amounts in Millions, Except Per Share Amounts)
For the Years Ended December 31,
2004 2003
IAN CMG Motorsports Corporate Total IAN CMG Motorsports Corporate Total
Reconciliation toconsolidated operatingincome:
Consolidated operatingincome (loss)ÏÏÏÏÏÏÏÏ $ 307.2 $(24.9) $(130.6) $(246.1) $ (94.4) $ 401.4 $(197.2) $(107.7) $(128.4) $ (31.9)
Adjustments:
Restructuring reversals(charges) ÏÏÏÏÏÏÏÏÏ (42.8) (16.5) Ì (2.9) (62.2) (138.4) (34.5) (0.4) 0.4 (172.9)
Long lived assetimpairment andother charges:ÏÏÏÏÏÏ (227.1) (92.1) (116.6) Ì (435.8) (11.8) (218.4) (63.8) Ì (294.0)
Segment operatingincome (loss)ÏÏÏÏÏÏÏÏ $ 577.1 $ 83.7 $ (14.0) $(243.2) $ 551.6 $ 55.7 $ (43.5) $(128.8)
INTEGRATED AGENCY NETWORKS (""IAN'')
REVENUE
The components of the 2004 change were as follows:
Total Domestic International
$ % Change $ % Change % of Total $ % Change % of Total
2003 ÏÏÏÏÏÏÏÏÏÏÏÏÏÏÏÏÏÏÏÏÏ $5,140.5 $2,862.1 55.7% $2,278.4 44.3%
Foreign currency changes ÏÏÏ 194.1 3.8% Ì 0.0% 194.1 8.5%
Net acquisitions/divestitursÏÏ (40.0) (0.8)% (27.5) (1.0)% (12.5) (0.5)%
Organic ÏÏÏÏÏÏÏÏÏÏÏÏÏÏÏÏÏÏ 104.6 2.0% 98.7 3.4% 5.9 0.3%
Total change ÏÏÏÏÏÏÏÏÏÏÏÏ 258.7 5.0% 71.2 2.5% 187.5 8.2%
2004 ÏÏÏÏÏÏÏÏÏÏÏÏÏÏÏÏÏÏÏÏÏ $5,399.2 $2,933.3 54.3% $2,465.9 45.7%
For the year ended December 31, 2004, IAN experienced net increases in revenue as compared to2003 by $258.7, or 5.0%, which was comprised of organic revenue growth of $104.6 and an increase inforeign currency exchange rate changes of $194.1, partially offset by a decrease attributable to netacquisitions and divestitures of $40.0. The increase due to foreign currency was primarily attributable tothe strengthening of the Euro and Pound Sterling in relation to the U.S. Dollar. This increase was partiallyoffset by the net effect of divestitures and acquisitions, primarily related to the sale of some smallbusinesses at McCann, Lowe, and Draft, and increased equity ownership in two businesses at Lowe.
The organic revenue increase was primarily driven by increases at McCann, Draft, FCB, and Deutsch,partially offset by decreases at Lowe. McCann experienced an organic revenue increase as a result of newclient wins and increased business from existing clients, primarily in our U.S. and European agencies.Draft experienced an organic revenue increase mainly in the U.S. due to client wins and increased businessby existing clients, partially offset by poor economic conditions in Europe and the closing of its fieldmarketing business in 2003. FCB experienced an organic revenue increase due to increased spending byexisting clients and client wins, partially offset by a decrease in revenues as a result of clients lost duringthe year, mainly in the U.S. and Germany. Deutsch experienced organic revenue growth stemming from
53

THE INTERPUBLIC GROUP OF COMPANIES, INC. AND SUBSIDIARIESMANAGEMENT'S DISCUSSION AND ANALYSIS OF
FINANCIAL CONDITION AND RESULTS OF OPERATIONS Ì (Continued)(Amounts in Millions, Except Per Share Amounts)
new client wins and increased business from existing clients. Lowe experienced an organic revenue decline,primarily the result of client losses and reduced business from major multinational clients.
For the three months ended December 31, 2004 IAN experienced a net increase in revenue ascompared to 2003 of $119.7, or 7.6%, which was comprised of an increase in foreign currency exchangerate changes of $76.0 and an organic increase in revenue of $53.2, partially offset by a decreaseattributable to net acquisitions and divestitures of $9.5.
SEGMENT OPERATING INCOME
For the YearsEnded
December 31,
2004 2003 $ Change % Change
Segment operating incomeÏÏÏÏÏÏÏÏÏÏÏÏÏÏÏÏÏÏÏÏÏÏÏÏÏ $577.1 $551.6 $25.5 4.6%
Operating marginÏÏÏÏÏÏÏÏÏÏÏÏÏÏÏÏÏÏÏÏÏÏÏÏÏÏÏÏÏÏÏÏÏ 10.7% 10.7%
For the year ended December 31, 2004, IAN operating income increased by $25.5, or 4.6%, whichwas a result of an increase in revenue of $258.7, offset by an increase in salaries and related expenses of$201.4 and increased office and general expenses of $31.8.
Segment operating income growth, excluding the impact of foreign currency and net effects ofacquisitions and divestitures, was primarily driven by increases at McCann, and to a lesser extent, Deutschand FCB, partially offset by a decrease at Lowe. McCann experienced an organic revenue increase withessentially flat operating expenses. Operating expenses at McCann reflect higher compensation costs tosupport new client business and an increase in contractual compensation payments made to individuals forthe achievement of specific operational targets as part of certain prior year acquisition agreements. Theseincreases were offset by lower depreciation expense incurred as a result of limited capital purchases, aswell as a decrease in bad debt expense due to improved collection of accounts receivable. Deutsch andFCB experienced increases as a result of organic revenue increases, partially offset by an increase inoperating expense related to increased employee incentives and additional salaries and freelance costs tosupport the increase in business activity. The decrease in operating income at Lowe was the result of asignificant organic revenue decrease partially offset by moderate decreases in operating expenses. Thedecrease in operating expenses at Lowe was the result of lower headcount and reduced office spacerequirements.
For the three months ended December 31, 2004, IAN operating income decreased by $27.4, or 7.1%,which was the result of an increase in salaries and related expenses of $130.6 and increased office andgeneral expenses of $16.5, offset by an increase in revenue of $119.7.
54

THE INTERPUBLIC GROUP OF COMPANIES, INC. AND SUBSIDIARIESMANAGEMENT'S DISCUSSION AND ANALYSIS OF
FINANCIAL CONDITION AND RESULTS OF OPERATIONS Ì (Continued)(Amounts in Millions, Except Per Share Amounts)
CONSTITUENCY MANAGEMENT GROUP (""CMG'')
REVENUE
The components of the 2004 change were as follows:
Total Domestic International
$ % Change $ % Change % of Total $ % Change % of Total
2003 ÏÏÏÏÏÏÏÏÏÏÏÏÏÏÏÏÏÏÏÏÏÏ $942.4 $593.2 62.9% $349.2 37.1%
Foreign currency changesÏÏÏÏÏ 34.4 3.7% Ì 0.0% 34.4 9.9%
Net acquisitions/divestitures ÏÏ (11.0) (1.2)% (7.9) (1.3)% (3.1) (0.9)%
OrganicÏÏÏÏÏÏÏÏÏÏÏÏÏÏÏÏÏÏÏÏ (30.0) (3.2)% (9.3) (1.6)% (20.7) (5.9)%
Total change ÏÏÏÏÏÏÏÏÏÏÏÏÏ (6.6) (0.7)% (17.2) (2.9)% 10.6 3.0%
2004 ÏÏÏÏÏÏÏÏÏÏÏÏÏÏÏÏÏÏÏÏÏÏ $935.8 $576.0 61.6% $359.8 38.4%
For the year ended December 31, 2004, CMG experienced decreased revenues as compared to 2003by $6.6, or 0.7%, which was comprised of an organic revenue decrease of $30.0 and the impact ofacquisitions and divestitures of $11.0, partially offset by an increase in foreign currency exchange ratechanges of $34.4. The increase due to foreign currency exchange rate was primarily attributable to thestrengthening of the Euro and Pound Sterling in relation to the U.S. Dollar. Net effects of acquisitions anddivestitures primarily related to the disposition of three businesses in 2004 and two businesses in 2003.
The organic revenue decline was primarily driven by a decrease in the branding and sports marketingbusinesses, offset slightly by growth in our public relations business.
For the three months ended December 31, 2004, CMG experienced a net decrease in revenue ascompared to 2004 of $6.5, or 2.4%, which was comprised of an organic revenue decrease of $11.0 anddecreases attributable to net acquisitions and divestitures of $5.7, offset by an increase in foreign currencyexchange rate changes of $10.2.
Segment Operating IncomeFor the Years
EndedDecember 31,
2004 2003 $ Change % Change
Segment operating incomeÏÏÏÏÏÏÏÏÏÏÏÏÏÏÏÏÏÏÏÏÏÏÏÏÏÏÏ $83.7 $55.7 $28.0 50.3%
Operating marginÏÏÏÏÏÏÏÏÏÏÏÏÏÏÏÏÏÏÏÏÏÏÏÏÏÏÏÏÏÏÏÏÏÏÏ 8.9% 5.9%
For the year ended December 31, 2004, CMG operating income increased by $28.0, or 50.3%, whichwas the result of a $46.6 decrease in office and general expenses, offset by a $6.6 decrease in revenue and$12.0 increase in salary and related expenses.
Segment operating income growth, excluding the impact of foreign currency and net effects ofacquisition and divestitures, was primarily driven by an increase at sports marketing business, partiallyoffset by an increase in CMG corporate office expense. While there was an organic revenue decreasesports marketing business operating expenses decreased at a higher rate than the organic revenue decrease,due to a decrease related to charges recorded by CMG in 2003 to secure certain sports television rights.Increased corporate office expenses was driven by higher expenses recorded for performance incentiveawards as a result of improved revenue performance and additional accruals for post employment andother benefits for management personnel.
55

THE INTERPUBLIC GROUP OF COMPANIES, INC. AND SUBSIDIARIESMANAGEMENT'S DISCUSSION AND ANALYSIS OF
FINANCIAL CONDITION AND RESULTS OF OPERATIONS Ì (Continued)(Amounts in Millions, Except Per Share Amounts)
For the three months ended December 31, 2004, CMG operating income decreased by $18.8, or38.8%, which was the result of a decrease in revenue of $6.5 and increased salaries and related expenses of$15.0, partially offset by a decrease in office and general expenses of $2.7.
CORPORATE AND OTHER
Certain corporate and other charges are reported as a separate line within total segment operatingincome and include corporate office expenses and shared service center expenses, as well as certain othercentrally managed expenses which are not fully allocated to operating divisions. The following significantexpenses are included in corporate and other:
For the Years EndedDecember 31,
2004 2003 $ Change % Change
Salaries, benefits and related expenses ÏÏÏÏÏÏÏÏÏÏÏÏÏ $ 151.2 $ 129.0 $ 22.2 17.2%
Professional fees ÏÏÏÏÏÏÏÏÏÏÏÏÏÏÏÏÏÏÏÏÏÏÏÏÏÏÏÏÏÏÏ 145.3 50.6 94.7 187.2%
Rent and depreciationÏÏÏÏÏÏÏÏÏÏÏÏÏÏÏÏÏÏÏÏÏÏÏÏÏÏÏ 38.0 30.6 7.4 24.2%
Corporate Insurance ÏÏÏÏÏÏÏÏÏÏÏÏÏÏÏÏÏÏÏÏÏÏÏÏÏÏÏÏ 29.7 26.5 3.2 12.1%
Bank fees ÏÏÏÏÏÏÏÏÏÏÏÏÏÏÏÏÏÏÏÏÏÏÏÏÏÏÏÏÏÏÏÏÏÏÏÏÏ 2.8 1.6 1.2 75.0%
Other ÏÏÏÏÏÏÏÏÏÏÏÏÏÏÏÏÏÏÏÏÏÏÏÏÏÏÏÏÏÏÏÏÏÏÏÏÏÏÏÏ 9.6 8.9 0.7 7.9%
Expenses allocated to operating divisions ÏÏÏÏÏÏÏÏÏÏÏ (133.4) (118.4) (15.0) 12.7%
Total corporate and otherÏÏÏÏÏÏÏÏÏÏÏÏÏÏÏÏÏÏÏÏÏÏ $ 243.2 $ 128.8 $114.4 88.8%
Salaries, benefits and related expenses include salaries, pension, the cost of medical, dental and otherinsurance coverage and other compensation-related expenses for corporate office employees, as well as thecost of temporary employees at the corporate office. Professional fees include costs related to thepreparation for Sarbanes-Oxley Act compliance, the financial statement audit, legal counsel, informationtechnology and other consulting fees. Rent and depreciation includes rental expense and depreciation ofleasehold improvements for properties occupied by corporate office employees. Corporate insuranceexpense includes the cost for fire, liability and automobile premiums. Bank fees relates to our debt andcredit facilities. The amounts of expenses allocated to operating segments are calculated monthly based ona formula that uses the revenues of the operating unit.
The increase in corporate and other expense of $114.4 or 88.8% is primarily related to the increase inprofessional fees and salaries and related expenses. The increase in professional fees primarily resultedfrom costs associated with complying with the requirements of the Sarbanes-Oxley Act. We also incurredincreased expenses for the preliminary application development and maintenance of systems and processesrelated to our shared services initiatives. The increase in payroll related expenses is due mainly to anincrease in the use of temporary employees in order to enhance monitoring controls at the corporate officeas well as to support our significant ongoing efforts to achieve Sarbanes-Oxley compliance. Increasedheadcount and expanded office space at the corporate office also contributed to this increase. Also, certaincontractual bonuses for management increased as compared to prior year.
The increase in corporate and other expense of $7.0 or 10.5% for the three months endedDecember 31, 2004 is primarily related to the increase in professional fees offset by the decrease insalaries and related expenses. The increase in professional fees are the result of costs associated withinternal control compliance, costs associated with the Prior Restatement process, and related audit costs.Amounts allocated to operating divisions primarily increased due to the implementation of new information
56

THE INTERPUBLIC GROUP OF COMPANIES, INC. AND SUBSIDIARIESMANAGEMENT'S DISCUSSION AND ANALYSIS OF
FINANCIAL CONDITION AND RESULTS OF OPERATIONS Ì (Continued)(Amounts in Millions, Except Per Share Amounts)
December 31, 2005 technology related projects and the consolidation of information technology supportstaff, the costs of which are now being allocated back to operating divisions.
LIQUIDITY AND CAPITAL RESOURCES
CASH FLOW OVERVIEW
Operating cash flow
Our operating activities utilized cash of approximately $20.2, compared to cash provided by operatingactivities of $464.8 in 2004 and $502.6 in 2003. The decrease in cash provided by operating activities in2005 was primarily attributable to significant increases in our operating costs as well as a decline inrevenues. Additional cash was used during 2005 for severance costs primarily related to internationalheadcount reductions, salary costs primarily attributable to our hiring additional creative talent to enablefuture revenue growth and additional staff to address weaknesses in our accounting and controlenvironment, and professional fees primarily related to the Prior Restatement and our ongoing efforts ininternal control compliance. The decrease in cash provided by operating activities in 2005 was alsoattributable in part to year-over-year changes in accounts payable and other changes in working capitalaccounts.
We conduct media buying on behalf of clients, which affects our working capital and operating cashflow. In most of our businesses, we collect funds from our clients which we use, on their behalf, to payproduction costs and media costs. The amounts involved substantially exceed our revenues, and the currentassets and current liabilities on our balance sheet reflect these pass-through arrangements. Our assetsinclude both cash received and accounts receivable from customers for these pass-through arrangements,while our liabilities include amounts owed on behalf of customers to media and production suppliers.Generally, we pay production and media charges after we have received funds from our clients, and ourrisk from client nonpayment has historically not been significant.
We manage substantially all our domestic cash and liquidity centrally through the corporate treasurydepartment. Each day, domestic agencies with excess funds invest these funds with corporate treasury anddomestic agencies that require funding will borrow funds from corporate treasury. The corporate treasurydepartment aggregates the net domestic cash position on a daily basis. The net position is either investedor borrowed. Given the amount of cash on hand, we have not had short-term domestic borrowings over thepast two years.
The amount of our cash held by the banks under our International pooling arrangements is subject toa full right of offset against the amounts advanced to us, and the cash and advances are recorded net onour balance sheet. The gross amounts vary depending on how much funding is provided to agenciesthrough the pooling arrangements. At December 31, 2005 and 2004, cash of $842.6 and $939.9,respectively, was netted against an equal amount of advances under pooling arrangements. We typicallypay interest on our larger arrangements based on the gross amounts of the advances and receive interestincome on the gross amount of cash deposited, albeit at a lower rate.
Funding requirements
Our most significant funding requirements include: non-cancelable operating lease obligations, capitalexpenditures, payments related to vendor discounts and credits, payments related to past acquisitions,interest payments, preferred stock dividends and taxes.
57
THE INTERPUBLIC GROUP OF COMPANIES, INC. AND SUBSIDIARIESMANAGEMENT'S DISCUSSION AND ANALYSIS OF
FINANCIAL CONDITION AND RESULTS OF OPERATIONS Ì (Continued)(Amounts in Millions, Except Per Share Amounts)
Our non-cancelable lease commitments primarily relate to office premises and equipment. Thesecommitments are partially offset by sublease rental income we receive under non-cancelable subleases. Ourprojected obligations for 2005 and beyond are set forth below under Contractual Obligations.
Our capital expenditures are primarily to upgrade computer and telecommunications systems and tomodernize offices. Our principal bank credit facility currently limits spending on capital expenditures inany calendar year to $210.0. Our capital expenditures were $140.7 in 2005, $194.0 in 2004 and $159.6 in2003.
We acquired a large number of agencies through 2001, but in recent years the number and value ofacquisitions have been significantly less. There were no acquisitions in 2005 and cash paid for acquisitionswas approximately $14.6 in 2004 and $4.0 in 2003. Under the contractual terms of certain of our pastacquisitions we have long-term obligations to pay additional consideration or to purchase additional equityinterests in certain consolidated or unconsolidated subsidiaries if specified conditions, mostly operatingperformance, are met. Some of the consideration under these arrangements is in shares of our commonstock, but most is in cash. We made cash payments for past acquisitions of $97.0 in 2005, $161.7 in 2004and $221.2 in 2003. Our projected obligations for 2006 and beyond are set forth below under ContractualObligations.
We are required to post letters of credit primarily to support commitments to purchase mediaplacements, predominantly in locations outside the U.S., or to satisfy other obligations. We generallyobtain these letters of credit from our principal bank syndicate under the Three-Year Revolving CreditFacility described under Credit Arrangements below. The outstanding amount of letters of credit was$162.4 and $165.4 as of December 31, 2005 and 2004, respectively. These letters of credit have not beendrawn upon in recent years.
Sources of funds
At December 31, 2005 our total of cash and cash equivalents plus short-term marketable securitieswas $2,191.5 compared to $1,970.4 at December 31, 2004.
We have obtained financing through the capital markets by issuing debt securities, convertiblepreferred stock and common stock. Our outstanding debt securities and convertible preferred stock aredescribed under Long-Term Debt, 4.50% Convertible Senior Notes (""4.50% Notes'') and ConvertiblePreferred Stock below.
In July 2005, we issued $250.0 of Floating Rate Notes due 2008 in a private placement to refinancematuring debt, as described below. In October 2005, we issued 0.525 shares of Series B CumulativeConvertible Perpetual Preferred Stock at gross proceeds of $525.0 with the proceeds to be used for generalcorporate purposes as described below under Convertible Preferred Stock.
We have committed and uncommitted credit facilities, the terms of which are described below. Wemaintain our committed credit facility primarily as stand-by short-term liquidity and for the issuance ofletters of credit. We have not drawn on our committed facility over the past two years, although letters ofcredit have been and continue to be issued under this facility, as described above. Our outstandingborrowings under uncommitted credit facilities were $53.7 and $67.8 as of December 31, 2005 and 2004,respectively. We use uncommitted credit lines for working capital needs at some of our operations outsidethe United States. If we lose access to these credit lines, we may be required to provide funding directly tosome overseas operations.
58
THE INTERPUBLIC GROUP OF COMPANIES, INC. AND SUBSIDIARIESMANAGEMENT'S DISCUSSION AND ANALYSIS OF
FINANCIAL CONDITION AND RESULTS OF OPERATIONS Ì (Continued)(Amounts in Millions, Except Per Share Amounts)
Liquidity outlook
We expect our operating cash flow and cash on hand to be sufficient to meet our anticipatedoperating requirements at a minimum for the next twelve months. We have no significant scheduledamounts of long-term debt due until 2008 when $250.0 of our Floating Rate Senior Unsecured Notes aredue. In addition, holders of our $800.0 4.50% Notes may require us to repurchase the 4.50% Notes forcash at par in March 2008. We continue to have a level of cash and cash equivalents that we consider tobe conservative, particularly after receiving net proceeds of approximately $507.3 from our offering ofSeries B Preferred Stock in October 2005. We consider this approach to be important in view of the cashrequirements resulting, among other things, from the higher professional fees, from our liabilities to ourcustomers for vendor discounts and credits and from any potential penalties or fines that may have to bepaid in connection with our SEC investigation. In 2006, we will be required to pay to the IRS and stateand local taxing authorities approximately $93.4 (including interest), related to tax audit matters. Thisamount has been reclassified from non-current liabilities to current liabilities on the balance sheet. As aresult of our Prior Restatement review, we estimate that we will pay approximately $250.0 related toVendor Discounts or Credits, Internal Investigations and International Compensation Agreements over thenext 18 months. We regularly evaluate market conditions for opportunities to raise additional financing onfavorable terms, in order to enhance our financial flexibility.
Substantially all of our operating cash flow is generated by the agencies. Our liquid assets are heldprimarily at the holding company level, but also at our larger subsidiaries. The legal or contractualrestrictions on our ability to transfer funds within the group, whether in the form of dividends, loans oradvances, do not significantly reduce our financial flexibility.
59

THE INTERPUBLIC GROUP OF COMPANIES, INC. AND SUBSIDIARIESMANAGEMENT'S DISCUSSION AND ANALYSIS OF
FINANCIAL CONDITION AND RESULTS OF OPERATIONS Ì (Continued)(Amounts in Millions, Except Per Share Amounts)
FINANCING
Long-Term Debt
A summary of our long-term debt is as follows:December 31,
2005 2004
7.875% Senior Unsecured Notes due 2005 ÏÏÏÏÏÏÏÏÏÏÏÏÏÏÏÏÏÏÏÏÏÏÏÏÏÏÏÏ $ Ì $ 255.0
Floating Rate Senior Unsecured Notes due 2008 ÏÏÏÏÏÏÏÏÏÏÏÏÏÏÏÏÏÏÏÏÏÏ 250.0 Ì
5.40% Senior Unsecured Notes due 2009 (less unamortized discount of$0.3) ÏÏÏÏÏÏÏÏÏÏÏÏÏÏÏÏÏÏÏÏÏÏÏÏÏÏÏÏÏÏÏÏÏÏÏÏÏÏÏÏÏÏÏÏÏÏÏÏÏÏÏÏÏÏÏÏÏ 249.7 249.7
7.25% Senior Unsecured Notes due 2011 ÏÏÏÏÏÏÏÏÏÏÏÏÏÏÏÏÏÏÏÏÏÏÏÏÏÏÏÏÏ 499.2 500.0
6.25% Senior Unsecured Notes due 2014 (less unamortized discount of$0.9) ÏÏÏÏÏÏÏÏÏÏÏÏÏÏÏÏÏÏÏÏÏÏÏÏÏÏÏÏÏÏÏÏÏÏÏÏÏÏÏÏÏÏÏÏÏÏÏÏÏÏÏÏÏÏÏÏÏ 350.3 347.3
4.50% Convertible Senior Notes due 2023 ÏÏÏÏÏÏÏÏÏÏÏÏÏÏÏÏÏÏÏÏÏÏÏÏÏÏÏÏ 800.0 800.0
Other notes payable and capitalized leases Ì at interest rates from 3.3% to14.44%ÏÏÏÏÏÏÏÏÏÏÏÏÏÏÏÏÏÏÏÏÏÏÏÏÏÏÏÏÏÏÏÏÏÏÏÏÏÏÏÏÏÏÏÏÏÏÏÏÏÏÏÏÏÏÏÏ 36.9 42.1
Total long-term debt ÏÏÏÏÏÏÏÏÏÏÏÏÏÏÏÏÏÏÏÏÏÏÏÏÏÏÏÏÏÏÏÏÏÏÏÏÏÏÏÏÏÏÏÏ 2,186.1 2,194.1
Less: current portion ÏÏÏÏÏÏÏÏÏÏÏÏÏÏÏÏÏÏÏÏÏÏÏÏÏÏÏÏÏÏÏÏÏÏÏÏÏÏÏÏÏÏÏÏÏÏ 3.1 258.1
Long-term debt, excluding current portion ÏÏÏÏÏÏÏÏÏÏÏÏÏÏÏÏÏÏÏÏÏÏÏÏÏÏÏÏ $2,183.0 $1,936.0
Annual repayments of long-term debt as of December 31, 2005 are scheduled as follows:
2006ÏÏÏÏÏÏÏÏÏÏÏÏÏÏÏÏÏÏÏÏÏÏÏÏÏÏÏÏÏÏÏÏÏÏÏÏÏÏÏÏÏÏÏÏÏÏÏÏÏÏÏÏÏÏÏÏÏÏÏÏÏÏÏÏÏÏÏÏÏ $ 3.1
2007ÏÏÏÏÏÏÏÏÏÏÏÏÏÏÏÏÏÏÏÏÏÏÏÏÏÏÏÏÏÏÏÏÏÏÏÏÏÏÏÏÏÏÏÏÏÏÏÏÏÏÏÏÏÏÏÏÏÏÏÏÏÏÏÏÏÏÏÏÏ 4.7
2008*ÏÏÏÏÏÏÏÏÏÏÏÏÏÏÏÏÏÏÏÏÏÏÏÏÏÏÏÏÏÏÏÏÏÏÏÏÏÏÏÏÏÏÏÏÏÏÏÏÏÏÏÏÏÏÏÏÏÏÏÏÏÏÏÏÏÏÏÏ 256.7
2009ÏÏÏÏÏÏÏÏÏÏÏÏÏÏÏÏÏÏÏÏÏÏÏÏÏÏÏÏÏÏÏÏÏÏÏÏÏÏÏÏÏÏÏÏÏÏÏÏÏÏÏÏÏÏÏÏÏÏÏÏÏÏÏÏÏÏÏÏÏ 250.8
2010ÏÏÏÏÏÏÏÏÏÏÏÏÏÏÏÏÏÏÏÏÏÏÏÏÏÏÏÏÏÏÏÏÏÏÏÏÏÏÏÏÏÏÏÏÏÏÏÏÏÏÏÏÏÏÏÏÏÏÏÏÏÏÏÏÏÏÏÏÏ 0.8
Thereafter* ÏÏÏÏÏÏÏÏÏÏÏÏÏÏÏÏÏÏÏÏÏÏÏÏÏÏÏÏÏÏÏÏÏÏÏÏÏÏÏÏÏÏÏÏÏÏÏÏÏÏÏÏÏÏÏÏÏÏÏÏÏÏÏ 1,670.0
Total long-term debt ÏÏÏÏÏÏÏÏÏÏÏÏÏÏÏÏÏÏÏÏÏÏÏÏÏÏÏÏÏÏÏÏÏÏÏÏÏÏÏÏÏÏÏÏÏÏÏÏÏÏÏÏÏ $2,186.1
* Holders of our $800.0 4.50% Notes may require us to repurchase the 4.50% Notes for cash at par inMarch 2008. If all holders require us to repurchase these Notes, a total of $1,056.7 will be payable in2008 in respect of long-term debt. These Notes will mature in 2023 if not converted or repurchased.
Redemption and Repurchase of Long-Term Debt
In August 2005, we redeemed the remainder of the outstanding 7.875% Senior Unsecured Notes withan aggregate principal amount of $250.0 at maturity at gross proceeds of approximately $258.6, whichincluded the principal amount of the Notes, accrued interest to the redemption date and a prepaymentpenalty. To redeem these Notes we used the proceeds from the sale and issuance in July 2005 of $250.0Floating Rate Senior Unsecured Notes due in July 2008.
Consent Solicitation
In March 2005, we completed a consent solicitation to amend the indentures governing five series ofour outstanding public debt to provide, among other things, that our failure to file with the trustee our
60

THE INTERPUBLIC GROUP OF COMPANIES, INC. AND SUBSIDIARIESMANAGEMENT'S DISCUSSION AND ANALYSIS OF
FINANCIAL CONDITION AND RESULTS OF OPERATIONS Ì (Continued)(Amounts in Millions, Except Per Share Amounts)
SEC reports, including our 2004 Annual Report on Form 10-K and Quarterly Reports for the first andsecond quarters of 2005 on Form 10-Q, would not constitute a default under the indentures untilOctober 1, 2005.
The indenture governing our 4.50% Notes was also amended in March 2005 to provide for: (i) anextension from March 15, 2008 to September 15, 2009 of the date on or after which we may redeem the4.50% Notes and (ii) an additional ""make-whole'' adjustment to the conversion rate in the event of achange of control meeting specified conditions.
4.50% Convertible Senior Notes
Our 4.50% Notes are convertible to common stock at a conversion price of $12.42 per share, subjectto adjustment in specified circumstances. They are convertible at any time if the average price of ourcommon stock for 20 trading days immediately preceding the conversion date is greater than or equal to aspecified percentage, beginning at 120% in 2003 and declining 0.5% each year until it reaches 110% atmaturity, of the conversion price. They are also convertible, regardless of the price of our common stock,if: (i) we call the 4.50% Notes for redemption; (ii) we make specified distributions to shareholders;(iii) we become a party to a consolidation, merger or binding share exchange pursuant to which ourcommon stock would be converted into cash or property (other than securities) or (iv) the credit ratingsassigned to the 4.50% Notes by any two of Moody's Investors Service, Standard & Poor's and FitchRatings are lower than Ba2, BB and BB, respectively, or the 4.50% Notes are no longer rated by at leasttwo of these ratings services. Because of our current credit ratings, the 4.50% Notes are currentlyconvertible into approximately 64.4 shares of our common stock.
Holders of the 4.50% Notes may require us to repurchase the 4.50% Notes on March 15, 2008 forcash and on March 15, 2013 and March 15, 2018, for cash or common stock or a combination of both, atour election. Additionally, investors may require us to repurchase the 4.50% Notes in the event of certainchange of control events that occur prior to March 15, 2008 for cash or common stock or a combination ofboth, at our election. If at any time on or after March 13, 2003 we pay cash dividends on our commonstock, we will pay contingent interest in an amount equal to 100% of the per share cash dividend paid onthe common stock multiplied by the number of shares of common stock issuable upon conversion of the4.50% Notes. At our option, we may redeem the 4.50% Notes on or after September 15, 2009 for cash.The redemption price in each of these instances will be 100% of the principal amount of the Notes beingredeemed, plus accrued and unpaid interest, if any. The 4.50% Notes also provide for an additional ""make-whole'' adjustment to the conversion rate in the event of a change of control meeting specified conditions.
In accordance with EITF Issue No. 03-6, Participating Securities and the Two Ì Class Method underFASB Statement No. 128, Earnings Per Share, the 4.50% Notes are considered securities with participationrights in earnings available to common stockholders due to the feature of these securities that allowsinvestors to participate in cash dividends paid on our common stock. For periods in which we experiencenet income, the impact of these securities' participation rights is included in the calculation of earnings pershare. For periods in which we experience a net loss, the 4.50% Notes have no impact on the calculationof earnings per share due to the fact that the holders of these securities do not participate in our losses.
Convertible Preferred Stock
We currently have two series of convertible preferred stock outstanding: our 5.375% Series AMandatory Convertible Preferred Stock (""Series A Preferred Stock'') and our 5.25% Series B CumulativeConvertible Perpetual Preferred Stock (""Series B Preferred Stock'').
61

THE INTERPUBLIC GROUP OF COMPANIES, INC. AND SUBSIDIARIESMANAGEMENT'S DISCUSSION AND ANALYSIS OF
FINANCIAL CONDITION AND RESULTS OF OPERATIONS Ì (Continued)(Amounts in Millions, Except Per Share Amounts)
Series B Preferred Stock Ì On October 24, 2005, we completed a private offering of 0.525 shares ofour Series B Preferred Stock at an aggregate offering price of $525.0. The net proceeds from the sale wereapproximately $507.3 after deducting discounts to the initial purchasers and the estimated expenses of theoffering.
Each share of the Series B Preferred Stock has a liquidation preference of $1,000.00 per share and isconvertible at the option of the holder at any time into 73.1904 shares of our common stock, subject toadjustment upon the occurrence of certain events, which represents a conversion price of approximately$13.66, representing a conversion premium of approximately 30% over our closing stock price onOctober 18, 2005 of $10.51 per share. On or after October 15, 2010, each share of the Series B PreferredStock may be converted at our option if the closing price of our common stock multiplied by theconversion rate then in effect equals or exceeds 130% of the liquidation preference of $1,000.00 per sharefor 20 trading days during any consecutive 30 trading day period. Holders of the Series B Preferred Stockwill be entitled to an adjustment to the conversion rate if they convert their shares in connection with afundamental change meeting certain specified conditions.
The Series B Preferred Stock is junior to all of our existing and future debt obligations, on parity withour Series A Preferred Stock and senior to our common stock, with respect to payments of dividends andrights upon liquidation, winding up or dissolution, to the extent of the liquidation preference of$1,000.00 per share. There are no registration rights with respect to the Series B Preferred Stock, shares ofour common stock issuable upon conversion thereof or any shares of our common stock that may bedelivered in connection with a dividend payment.
In accordance with EITF Issue No. 03-6, the Series B Preferred Stock is not considered a securitywith participation rights in earnings available to common stockholders due to the contingent nature of theconversion feature of these securities.
Series A Preferred Stock Ì We currently have outstanding 7.475 shares of our Series A PreferredStock with a liquidation preference of $50.00 per share. On the automatic conversion date ofDecember 15, 2006, each share of the Series A Preferred Stock will convert, subject to certainadjustments, into between 3.0358 and 3.7037 shares of common stock, depending on the then-currentmarket price of our common stock.
At any time prior to December 15, 2006, holders may elect to convert each share of their Series APreferred Stock, subject to certain adjustments, into 3.0358 shares of our common stock. If the closingprice per share of our common stock exceeds $24.71 for at least 20 trading days within a period of 30consecutive trading days, we may elect, subject to certain limitations, to cause the conversion of all of theshares of Series A Preferred Stock then outstanding into shares of our common stock at a conversion rateof 3.0358 shares of our common stock for each share of our Series A Preferred Stock.
The Series A Preferred Stock is junior to all of our existing and future debt obligations, on parity withour Series B Preferred Stock and senior to our common stock, with respect to payments of dividends andrights upon liquidation, winding up or dissolution, to the extent of the liquidation preference of $50.00 pershare.
In accordance with EITF Issue No. 03-6, the Series A Preferred Stock is considered a security withparticipation rights in earnings available to common stockholders due to the conversion feature of thesesecurities. For periods in which we experience net income, the impact of these securities' participationrights is included in the calculation of earnings per share. For periods in which we experience a net loss,the Series A Preferred Stock has no impact on the calculation of earnings per share due to the fact thatthe holders of these securities do not participate in our losses.
62

THE INTERPUBLIC GROUP OF COMPANIES, INC. AND SUBSIDIARIESMANAGEMENT'S DISCUSSION AND ANALYSIS OF
FINANCIAL CONDITION AND RESULTS OF OPERATIONS Ì (Continued)(Amounts in Millions, Except Per Share Amounts)
Credit Arrangements
We have committed and uncommitted credit facilities with various banks that permit borrowings atvariable interest rates. At December 31, 2005 and 2004, there were no borrowings under our committedfacilities. However, there were borrowings under the uncommitted facilities made by several of oursubsidiaries outside the U.S. totaling $53.7 and $67.8, respectively. We have guaranteed the repayment ofsome of these borrowings by our subsidiaries. The weighted-average interest rate on outstanding balancesunder the uncommitted short-term facilities at December 31, 2005 and 2004 was approximately 5% ineach year. A summary of our credit facilities is as follows:
December 31,
2005 2004
Total Amount Letters Total Total Amount Letters TotalFacility Outstanding of Credit Available Facility Outstanding of Credit Available
Committed
364-Day RevolvingCredit Facility ÏÏ $ Ì $ Ì $ Ì $ Ì $250.0 $ Ì $ Ì $250.0
Three-YearRevolving CreditFacility ÏÏÏÏÏÏÏÏ 500.0 Ì 162.4 337.6 450.0 Ì 165.4 284.6
Other Facilities ÏÏÏ 0.7 Ì Ì 0.7 0.8 Ì Ì 0.8
$500.7 $ Ì $162.4 $338.3 $700.8 $ Ì $165.4 $535.4
Uncommitted
Non-U.S. ÏÏÏÏÏÏÏÏ $516.2 $53.7 $ Ì $462.5 $738.1 $67.8 $ Ì $670.3
Our primary bank credit agreement is a three-year revolving credit facility (as amended, the ""Three-Year Revolving Credit Facility''). The Three-Year Revolving Credit Facility expires on May 9, 2007 andprovides for borrowings of up to $500.0, of which $200.0 is available for the issuance of letters of credit.This facility was amended as of October 17, 2005 to increase the amount that we may borrow under thefacility by $50.0 to $500.0. Our $250.0 364-Day Revolving Credit Facility expired on September 30, 2005.
The terms of our Three-Year Revolving Credit Facility at December 31, 2005 do not permit us: (i) tomake cash acquisitions in excess of $50.0 until October 2006, or thereafter in excess of $50.0 untilexpiration of the agreement in May 2007, subject to increases equal to the net cash proceeds receivedduring the applicable period from any disposition of assets or any business; (ii) to make capitalexpenditures in excess of $210.0 annually; (iii) to repurchase our common stock or to declare or paydividends on our capital stock, except that we may declare or pay dividends in shares of our commonstock, declare or pay cash dividends on our preferred stock, and repurchase our capital stock in connectionwith the exercise of options by our employees or with proceeds contemporaneously received from an issueof new shares of our capital stock; or (iv) to incur new debt at our subsidiaries, other than unsecured debtincurred in the ordinary course of business of our subsidiaries outside the U.S. and unsecured debt, whichmay not exceed $10.0 in the aggregate, incurred in the ordinary course of business of our U.S. subsidiaries.The terms also permit the issuance of letters of credit with expiration dates beyond the termination date ofthe facility, subject to certain conditions. Such conditions include the requirement for us, on the 105th dayprior to the termination date of the facility, to provide a cash deposit in an amount equal to the totalamount of outstanding letters of credit with expiration dates beyond the termination date of the facility.These terms were previously modified by three amendments on March 31, June 22 and September 27,2005, respectively. The March 21, 2006 amendment effective as of December 31, 2005 added one newfinancial covenant so that we are required to maintain, based on a five business day testing period, in cashand securities, an average daily ending balance of $300.0 plus the aggregate principal amount of
63

THE INTERPUBLIC GROUP OF COMPANIES, INC. AND SUBSIDIARIESMANAGEMENT'S DISCUSSION AND ANALYSIS OF
FINANCIAL CONDITION AND RESULTS OF OPERATIONS Ì (Continued)(Amounts in Millions, Except Per Share Amounts)
borrowings under the credit facility in domestic accounts with our lenders. For further explanation of theseand other amendments see Note 13 of the Consolidated Financial Statements. We also obtained a waiverfrom the lenders under the Three-Year Revolving Credit Facility on March 21, 2006, to waive any defaultarising from the restatement of our financial data presented in this report.
Our Three-Year Revolving Credit Facility now contains certain financial covenants. These covenantshave been modified by amendments and waivers on March 31, 2005, June 22, 2005, September 27, 2005,November 7, 2005 (effective as of September 30, 2005) and March 21, 2006 (effective as ofDecember 31, 2005). We have been in compliance with all covenants under the Three-Year RevolvingCredit Facility, as amended or waived from time to time. For further detail of these changes to thefinancial covenants see Note 13 of the Consolidated Financial Statements. Our financial covenants,effective as of December 31, 2005, require us to maintain with respect to each fiscal quarter set forthbelow:
(i) an interest coverage ratio for the four fiscal quarters then ended of not less than that set forth oppositethe corresponding quarter in the table below:
Four Fiscal Quarters Ending Ratio
December 31, 2005ÏÏÏÏÏÏÏÏÏÏÏÏÏÏÏÏÏÏÏÏÏÏÏÏÏÏÏÏÏÏÏÏÏÏÏÏÏÏÏÏÏÏÏÏÏÏÏÏÏÏÏÏÏÏÏÏÏ *
March 31, 2006ÏÏÏÏÏÏÏÏÏÏÏÏÏÏÏÏÏÏÏÏÏÏÏÏÏÏÏÏÏÏÏÏÏÏÏÏÏÏÏÏÏÏÏÏÏÏÏÏÏÏÏÏÏÏÏÏÏÏÏÏ *
June 30, 2006 ÏÏÏÏÏÏÏÏÏÏÏÏÏÏÏÏÏÏÏÏÏÏÏÏÏÏÏÏÏÏÏÏÏÏÏÏÏÏÏÏÏÏÏÏÏÏÏÏÏÏÏÏÏÏÏÏÏÏÏÏÏ *
September 30, 2006 ÏÏÏÏÏÏÏÏÏÏÏÏÏÏÏÏÏÏÏÏÏÏÏÏÏÏÏÏÏÏÏÏÏÏÏÏÏÏÏÏÏÏÏÏÏÏÏÏÏÏÏÏÏÏÏÏ 1.75 to 1
December 31, 2006ÏÏÏÏÏÏÏÏÏÏÏÏÏÏÏÏÏÏÏÏÏÏÏÏÏÏÏÏÏÏÏÏÏÏÏÏÏÏÏÏÏÏÏÏÏÏÏÏÏÏÏÏÏÏÏÏÏ 2.15 to 1
March 31, 2007ÏÏÏÏÏÏÏÏÏÏÏÏÏÏÏÏÏÏÏÏÏÏÏÏÏÏÏÏÏÏÏÏÏÏÏÏÏÏÏÏÏÏÏÏÏÏÏÏÏÏÏÏÏÏÏÏÏÏÏÏ 2.50 to 1
* The March 21, 2006 amendment, effective as of December 31, 2005, removed the financial covenantrequirements with respect to the interest coverage ratio for the fiscal quarters ending December 31,2005, March 31, 2006 and June 30, 2006.
(ii) a debt to EBITDA ratio, where debt is the balance at period-end and EBITDA is for the four fiscalquarters then ended, of not greater than that set forth opposite the corresponding quarter in the tablebelow:
Four Fiscal Quarters Ending Ratio
December 31, 2005ÏÏÏÏÏÏÏÏÏÏÏÏÏÏÏÏÏÏÏÏÏÏÏÏÏÏÏÏÏÏÏÏÏÏÏÏÏÏÏÏÏÏÏÏÏÏÏÏÏÏÏÏÏÏÏÏÏ *
March 31, 2006ÏÏÏÏÏÏÏÏÏÏÏÏÏÏÏÏÏÏÏÏÏÏÏÏÏÏÏÏÏÏÏÏÏÏÏÏÏÏÏÏÏÏÏÏÏÏÏÏÏÏÏÏÏÏÏÏÏÏÏÏ *
June 30, 2006 ÏÏÏÏÏÏÏÏÏÏÏÏÏÏÏÏÏÏÏÏÏÏÏÏÏÏÏÏÏÏÏÏÏÏÏÏÏÏÏÏÏÏÏÏÏÏÏÏÏÏÏÏÏÏÏÏÏÏÏÏÏ *
September 30, 2006 ÏÏÏÏÏÏÏÏÏÏÏÏÏÏÏÏÏÏÏÏÏÏÏÏÏÏÏÏÏÏÏÏÏÏÏÏÏÏÏÏÏÏÏÏÏÏÏÏÏÏÏÏÏÏÏÏ 5.15 to 1
December 31, 2006ÏÏÏÏÏÏÏÏÏÏÏÏÏÏÏÏÏÏÏÏÏÏÏÏÏÏÏÏÏÏÏÏÏÏÏÏÏÏÏÏÏÏÏÏÏÏÏÏÏÏÏÏÏÏÏÏÏ 4.15 to 1
March 31, 2007ÏÏÏÏÏÏÏÏÏÏÏÏÏÏÏÏÏÏÏÏÏÏÏÏÏÏÏÏÏÏÏÏÏÏÏÏÏÏÏÏÏÏÏÏÏÏÏÏÏÏÏÏÏÏÏÏÏÏÏÏ 3.90 to 1
* The March 21, 2006 amendment, effective as of December 31, 2005, removed the financial covenantrequirements with respect to the debt to EBITDA ratio for the fiscal quarters ending December 31,2005, March 31, 2006 and June 30, 2006.
64

THE INTERPUBLIC GROUP OF COMPANIES, INC. AND SUBSIDIARIESMANAGEMENT'S DISCUSSION AND ANALYSIS OF
FINANCIAL CONDITION AND RESULTS OF OPERATIONS Ì (Continued)(Amounts in Millions, Except Per Share Amounts)
and (iii) minimum levels of EBITDA for the four fiscal quarters then ended of not less than that set forthopposite the corresponding quarter in the table below:
Four Fiscal Quarters Ending Amount
December 31, 2005ÏÏÏÏÏÏÏÏÏÏÏÏÏÏÏÏÏÏÏÏÏÏÏÏÏÏÏÏÏÏÏÏÏÏÏÏÏÏÏÏÏÏÏÏÏÏÏÏÏÏÏÏÏÏÏÏÏÏÏ $233.0
March 31, 2006ÏÏÏÏÏÏÏÏÏÏÏÏÏÏÏÏÏÏÏÏÏÏÏÏÏÏÏÏÏÏÏÏÏÏÏÏÏÏÏÏÏÏÏÏÏÏÏÏÏÏÏÏÏÏÏÏÏÏÏÏÏÏ 175.0
June 30, 2006 ÏÏÏÏÏÏÏÏÏÏÏÏÏÏÏÏÏÏÏÏÏÏÏÏÏÏÏÏÏÏÏÏÏÏÏÏÏÏÏÏÏÏÏÏÏÏÏÏÏÏÏÏÏÏÏÏÏÏÏÏÏÏÏ 100.0
September 30, 2006 ÏÏÏÏÏÏÏÏÏÏÏÏÏÏÏÏÏÏÏÏÏÏÏÏÏÏÏÏÏÏÏÏÏÏÏÏÏÏÏÏÏÏÏÏÏÏÏÏÏÏÏÏÏÏÏÏÏÏ 440.0
December 31, 2006ÏÏÏÏÏÏÏÏÏÏÏÏÏÏÏÏÏÏÏÏÏÏÏÏÏÏÏÏÏÏÏÏÏÏÏÏÏÏÏÏÏÏÏÏÏÏÏÏÏÏÏÏÏÏÏÏÏÏÏ 545.0
March 31, 2007ÏÏÏÏÏÏÏÏÏÏÏÏÏÏÏÏÏÏÏÏÏÏÏÏÏÏÏÏÏÏÏÏÏÏÏÏÏÏÏÏÏÏÏÏÏÏÏÏÏÏÏÏÏÏÏÏÏÏÏÏÏÏ 585.0
The terms used in these ratios, including EBITDA, interest coverage and debt, are subject to specificdefinitions set forth in the agreement. Under the definition set forth in the Three-Year Revolving CreditFacility, EBITDA is determined by adding to net income or loss the following items: interest expense,income tax expense, depreciation expense, amortization expense, and certain specified cash payments andnon-cash charges subject to limitations on time and amount set forth in the agreement. Interest coverageis defined as a ratio of EBITDA of the period of four fiscal quarters then ended to interest expense duringsuch period.
We have in the past been required to seek and have obtained amendments and waivers of thefinancial covenants under our committed bank facility. There can be no assurance that we will be incompliance with these covenants in future periods. If we do not comply and are unable to obtain thenecessary amendments or waivers at that time, we would be unable to borrow or obtain additional lettersof credit under the Three-Year Revolving Credit Facility and could choose to terminate the facility andprovide a cash deposit in connection with any amount under the outstanding letters of credit. The lendersunder the Three-Year Revolving Credit Facility would also have the right to terminate the facility,accelerate any outstanding principal and require us to provide a cash deposit in an amount equal to theaggregate amount of outstanding letters of credit. The outstanding amount of letters of credit was $162.4as of December 31, 2005. We have not drawn under the Three-Year Credit Facility over the past twoyears, and we do not currently expect to do so. So long as there are no amounts to be accelerated underthe Three-Year Revolving Credit Facility, termination of the facility would not trigger the cross-acceleration provisions of our public debt.
Credit Agency Ratings
Our credit ratings at year-end 2005 and 2004 were as follows:
December 31,
2005 2004
Senior SeniorUnsecured Outlook Unsecured Outlook
Moody'sÏÏÏÏÏÏÏÏÏÏÏÏÏÏÏÏÏÏÏÏÏÏÏÏÏÏ Ba1 Negative Baa3 Stable
Standard & Poor's ÏÏÏÏÏÏÏÏÏÏÏÏÏÏÏÏÏ B° Negative BB° Credit watch Negative
Fitch ÏÏÏÏÏÏÏÏÏÏÏÏÏÏÏÏÏÏÏÏÏÏÏÏÏÏÏÏ B° Stable BB° Stable
Although a ratings downgrade by any of the ratings agencies will not trigger an acceleration of any ofour indebtedness, a downgrade may adversely affect our ability to access capital and would likely result inmore stringent covenants and higher interest rates under the terms of any new indebtedness. Our currentlong-term debt credit ratings as of March 15, 2006 are Ba1 with negative outlook, B° with negative
65

THE INTERPUBLIC GROUP OF COMPANIES, INC. AND SUBSIDIARIESMANAGEMENT'S DISCUSSION AND ANALYSIS OF
FINANCIAL CONDITION AND RESULTS OF OPERATIONS Ì (Continued)(Amounts in Millions, Except Per Share Amounts)
outlook and B° with stable outlook, as reported by Moody's Investors Service, Standard & Poor's andFitch Ratings, respectively.
Payment of Dividends
We have not paid any dividends on our common stock since December of 2002. As previouslydiscussed, our ability to declare or pay dividends on common stock is currently restricted by the terms ofour Three-Year Revolving Credit Facility. In addition, the terms of our outstanding series of preferredstock do not permit us to pay dividends on our common stock unless all accumulated and unpaid dividendshave been or contemporaneously are declared and paid, or provision for the payment thereof has beenmade.
We pay annual dividends on each share of Series A Preferred Stock in the amount of $2.6875.Annual dividends on each share of Series A Preferred Stock are payable quarterly in cash or, if certainconditions are met, in common stock, at our option, on March 15, June 15, September 15 and December15 of each year. In addition to the stated annual dividend, if at any time on or before December 15, 2006,we pay a cash dividend on our common stock, the holders of Series A Preferred Stock participate in suchdistributions via adjustments to the conversion ratio, thereby increasing the number of common shares intowhich the Preferred Stock will ultimately convert. In March 2006, the Board of Directors declared adividend of $0.671875 per share on our Series A Preferred Stock, resulting in a maximum possibleaggregate dividend of $5.0.
We pay annual dividends on each share of Series B Preferred Stock in the amount of $52.50 pershare. The initial dividend on our Series B Preferred Stock is $11.8125 per share and was declared onDecember 19, 2005 and paid in cash on January 17, 2006. Annual dividends on each share of Series BPreferred Stock are payable quarterly in cash or, if certain conditions are met, in common stock, at ouroption, on January 15, April 15, July 15 and October 15 of each year. The dividend rate of the Series BPreferred Stock will be increased by 1.0% if we do not pay dividends on the Series B Preferred Stock forsix quarterly periods (whether consecutive or not). The dividend rate will revert back to the original rateonce all unpaid dividends are paid in full. The dividend rate of the Series B Preferred Stock will also beincreased by 1.0% if we do not file our periodic reports with the SEC within 15 days after the requiredfiling date during the first two-year period following the closing of the offering. In March 2006, the Boardof Directors declared a dividend of $13.125 per share on our Series B Preferred Stock, resulting in amaximum possible aggregate dividend of $6.9.
Dividends on each series of our preferred stock are cumulative from the date of issuance and arepayable on each payment date to the extent that we are in compliance with our Three-Year RevolvingCredit Facility, assets are legally available to pay dividends and our Board of Directors or an authorizedcommittee of our Board declares a dividend payable. If we do not pay dividends on any series of ourpreferred stock for six quarterly periods (whether consecutive or not), then holders of all series of ourpreferred stock then outstanding will have the right to elect two additional directors to the Board. Theseadditional directors will remain on the Board until all accumulated and unpaid dividends on ourcumulative preferred stock have been paid in full, or to the extent our series of non-cumulative preferredstock is outstanding, until non-cumulative dividends have been paid regularly for at least one year.
66

THE INTERPUBLIC GROUP OF COMPANIES, INC. AND SUBSIDIARIESMANAGEMENT'S DISCUSSION AND ANALYSIS OF
FINANCIAL CONDITION AND RESULTS OF OPERATIONS Ì (Continued)(Amounts in Millions, Except Per Share Amounts)
CONTRACTUAL OBLIGATIONS
The following summarizes our estimated contractual obligations at December 31, 2005, and theireffect on our liquidity and cash flow in future periods:
2006 2007 2008 2009 2010 Thereafter Total
Long-term debt* ÏÏÏÏÏÏÏÏÏÏÏÏÏÏÏÏÏÏÏÏÏÏÏÏÏ $ 3.1 $ 4.7 $256.7 $250.8 $ 0.8 $1,670.0 $2,186.1
Interest payments ÏÏÏÏÏÏÏÏÏÏÏÏÏÏÏÏÏÏÏÏÏÏÏÏ $128.1 $128.8 $123.5 $107.6 $ 58.1 $ 123.8 $ 669.9
Non-cancelable operating lease obligations ÏÏÏ $287.1 $250.2 $222.5 $194.6 $172.2 $ 793.6 $1,920.2
* Holders of our $800.0 4.50% Notes may require us to repurchase the 4.50% Notes for cash at par inMarch 2008. If all holders require us to repurchase these Notes, a total of $1,056.7 will be payable in2008 in respect of long-term debt. These Notes will mature in 2023 if not converted or repurchased.
We have contingent obligations under guarantees of certain obligations of our subsidiaries (""parentcompany guarantees'') relating principally to credit facilities, guarantees of certain media payables andoperating leases of certain subsidiaries. The amount of such parent company guarantees was approximately$306.8 and $601.8 at December 31, 2005 and 2004, respectively. In the event of non-payment by theapplicable subsidiary of the obligations covered by a guarantee, we would be obliged to pay the amountscovered by that guarantee. As of December 31, 2005, there are no material assets pledged as security forsuch parent company guarantees.
We have not included obligations under our pension and postretirement benefit plans in thecontractual obligations table. Our funding policy regarding our funded pension plan is to contributeamounts necessary to satisfy minimum pension funding requirements plus such additional amounts fromtime to time as are determined to be appropriate to improve the plans' funded status. The funded status ofour pension plans is dependent upon many factors, including returns on invested assets, level of marketinterest rates and levels of voluntary contributions to the plans. Declines in long-term interest rates havehad a negative impact on the funded status of the plans. For 2006, we expect to contribute $17.8 to fundour domestic pension plans, and expect to contribute $22.1 to our foreign pension plans.
We have structured certain acquisitions with additional contingent purchase price obligations in orderto reduce the potential risk associated with negative future performance of the acquired entity. In addition,we have entered into agreements that may require us to purchase additional equity interests in certainconsolidated and unconsolidated subsidiaries. The amounts relating to these transactions are based onestimates of the future financial performance of the acquired entity, the timing of the exercise of theserights, changes in foreign currency exchange rates and other factors. We have not recorded a liability forthese items on the balance sheet since the definitive amounts payable are not determinable ordistributable. When the contingent acquisition obligations have been met and the consideration isdistributable, we will record the fair value of this consideration as an additional cost of the acquired entity.The following table details the estimated liability and the estimated amount that would be paid under suchoptions, in the event of exercise at the earliest exercise date. All payments are contingent upon achievingprojected operating performance targets and satisfying other conditions specified in the related agreementsand are subject to revisions as the earn-out periods progress.
67

THE INTERPUBLIC GROUP OF COMPANIES, INC. AND SUBSIDIARIESMANAGEMENT'S DISCUSSION AND ANALYSIS OF
FINANCIAL CONDITION AND RESULTS OF OPERATIONS Ì (Continued)(Amounts in Millions, Except Per Share Amounts)
The following contingent acquisition obligations are net of compensation expense, except as notedbelow, as defined by the terms and conditions of the respective acquisition agreements and employmentterms of the former owners of the acquired businesses. This future expense will not be allocated to theassets and liabilities acquired. As of December 31, 2005, our estimated contingent acquisition obligationsare as follows:
2006 2007 2008 2009 2010 Thereafter Total
Deferred Acquisition Payments
CashÏÏÏÏÏÏÏÏÏÏÏÏÏÏÏÏÏÏÏÏÏÏÏÏÏÏÏÏÏÏÏÏÏÏ $18.3 $1.8 $ 0.9 $10.5 $ Ì $ Ì $ 31.5
Stock ÏÏÏÏÏÏÏÏÏÏÏÏÏÏÏÏÏÏÏÏÏÏÏÏÏÏÏÏÏÏÏÏÏ 11.3 0.3 Ì Ì Ì Ì 11.6
Put Options with Consolidated Affiliates*
CashÏÏÏÏÏÏÏÏÏÏÏÏÏÏÏÏÏÏÏÏÏÏÏÏÏÏÏÏÏÏÏÏÏÏ 23.4 2.3 11.4 2.8 1.8 2.9 44.6
Stock ÏÏÏÏÏÏÏÏÏÏÏÏÏÏÏÏÏÏÏÏÏÏÏÏÏÏÏÏÏÏÏÏÏ 0.1 0.3 0.5 Ì Ì Ì 0.9
Put Options with Unconsolidated Affiliates*
CashÏÏÏÏÏÏÏÏÏÏÏÏÏÏÏÏÏÏÏÏÏÏÏÏÏÏÏÏÏÏÏÏÏÏ 1.3 2.5 11.5 0.3 Ì Ì 15.6
Stock ÏÏÏÏÏÏÏÏÏÏÏÏÏÏÏÏÏÏÏÏÏÏÏÏÏÏÏÏÏÏÏÏÏ 0.4 1.0 0.6 0.3 Ì Ì 2.3
Call Options with Consolidated Affiliates*
CashÏÏÏÏÏÏÏÏÏÏÏÏÏÏÏÏÏÏÏÏÏÏÏÏÏÏÏÏÏÏÏÏÏÏ 3.3 0.4 0.4 0.1 2.7 Ì 6.9
Stock ÏÏÏÏÏÏÏÏÏÏÏÏÏÏÏÏÏÏÏÏÏÏÏÏÏÏÏÏÏÏÏÏÏ 0.1 Ì Ì Ì Ì Ì 0.1
Subtotal Ì CashÏÏÏÏÏÏÏÏÏÏÏÏÏÏÏÏÏÏÏÏÏÏÏÏ 46.3 7.0 24.2 13.7 4.5 2.9 98.6
Subtotal Ì Stock ÏÏÏÏÏÏÏÏÏÏÏÏÏÏÏÏÏÏÏÏÏÏÏ 11.9 1.6 1.1 0.3 Ì Ì 14.9
Total Contingent Acquisition PaymentsÏÏÏÏÏ $58.2 $8.6 $25.3 $14.0 $4.5 $2.9 $113.5
In accounting for acquisitions, we recognize deferred payments and purchases of additional interestsafter the effective date of purchase that are contingent upon the future employment of owners ascompensation expense in our Consolidated Statement of Operations. As of December 31, 2005, ourestimated contingent acquisition payments with associated compensation expense impacts are as follows:
2006 2007 2008 2009 2010 Thereafter Total
Compensation Expense- Related Payments
CashÏÏÏÏÏÏÏÏÏÏÏÏÏÏÏÏÏÏÏÏÏÏÏÏÏÏÏÏÏÏÏÏÏÏ $16.6 $0.8 $12.8 $ 5.4 $1.3 $0.9 $ 37.8
Stock ÏÏÏÏÏÏÏÏÏÏÏÏÏÏÏÏÏÏÏÏÏÏÏÏÏÏÏÏÏÏÏÏÏ 0.1 Ì Ì Ì Ì Ì 0.1
Subtotal ÏÏÏÏÏÏÏÏÏÏÏÏÏÏÏÏÏÏÏÏÏÏÏÏÏÏÏÏÏÏÏ 16.7 0.8 12.8 5.4 1.3 0.9 37.9
Total PaymentsÏÏÏÏÏÏÏÏÏÏÏÏÏÏÏÏÏÏÏÏÏÏÏÏÏÏÏ $74.9 $9.4 $38.1 $19.4 $5.8 $3.8 $151.4
* We have entered into certain acquisitions that contain both put and call options with similar terms andconditions. In such instances, we have included the related estimated contingent acquisition obligationswith Put Options.
We maintain certain put options with consolidated affiliates that are exercisable at the discretion ofthe minority owners as of December 31, 2005. These put options are assumed to be exercised in theearliest possible period subsequent to December 31, 2005. Therefore, the related estimated acquisitionpayments of $33.5 have been included within the total payments expected to be made in 2006 in the tableabove. These payments, if not made in 2006, will continue to carry-forward into 2007 or beyond until theyare exercised or expire.
The 2006 obligations relate primarily to acquisitions that were completed prior to December 31, 2001.
68

THE INTERPUBLIC GROUP OF COMPANIES, INC. AND SUBSIDIARIESMANAGEMENT'S DISCUSSION AND ANALYSIS OF
FINANCIAL CONDITION AND RESULTS OF OPERATIONS Ì (Continued)(Amounts in Millions, Except Per Share Amounts)
DERIVATIVES AND HEDGING ACTIVITIES
We periodically enter into interest rate swap agreements and forward contracts to manage exposure tointerest rate fluctuations and to mitigate foreign exchange volatility. In January 2005, we executed aninterest rate swap which synthetically converted $150.0 of the $500.0, 7.25% Senior Unsecured Notes dueAugust 2011, of fixed rate debt to floating rates. We entered into the swap to hedge a portion of ourfloating interest rate exposure on our cash investments. In May of 2005, we terminated all of our long-term interest rate swap agreements covering the $350.0 6.25% Senior Unsecured Notes and $150.0 of the$500.0 7.25% Senior Unsecured Notes. In connection with the interest rate swap termination, our net cashreceipts were approximately $1.1, which will be recorded as an offset to interest expense over theremaining life of the related debt.
We have entered into foreign currency transactions in which various foreign currencies are bought orsold forward. These contracts were entered into to meet currency requirements arising from specifictransactions. The changes in value of these forward contracts have been recorded as other income orexpense in our Consolidated Statement of Operations. As of December 31, 2005 and 2004, we hadcontracts covering approximately $6.2 and $1.8, respectively, of notional amount of currency and the fairvalue of the forward contracts was negligible.
The terms of the 4.50% Notes include two embedded derivative instruments and the terms of ourSeries B Preferred Stock include one embedded derivative. The fair value of the three derivatives onDecember 31, 2005 was negligible.
INTERNAL CONTROL OVER FINANCIAL REPORTING
We have identified numerous material weaknesses in our internal control over financial reporting, asset forth in greater detail in Item 8, Management's Assessment on Internal Control Over FinancialReporting and Item 9A, Controls and Procedures, of this report. Each of our material weaknesses resultsin more than a remote likelihood that a material misstatement of the annual or interim financialstatements will not be prevented or detected. As a result, we have assessed that our internal control overfinancial reporting was not effective as of December 31, 2005.
We are in the process of developing and implementing remedial measures to address the materialweaknesses in our internal control over financial reporting. However, because of our decentralized structureand our many disparate accounting systems of varying quality and sophistication, we have extensive workremaining to remedy these material weaknesses. We are in the process of developing a work plan forremedying all of the identified material weaknesses and this work will extend beyond the 2006 fiscal year.At present, there can be no assurance as to when these material weaknesses will be remedied. Until ourremediation is completed, we will continue to incur the expenses and management burdens associated withthe manual procedures and additional resources required to prepare our Consolidated Financial Statements.There will also continue to be a substantial risk that we will be unable to file our periodic reports with theSEC in a timely manner. We discuss these risks in Item 1A, Risk Factors, of this Annual Report.
LIABILITIES RELATING TO OUR PRIOR RESTATEMENT
Restatement Related Matters
As described in Note 1 to the Consolidated Financial Statements, in our 2004 Annual Report onForm 10-K filed in September 2005, we restated previously reported financial statements for 2003, 2002,2001, 2000 and for the first three quarters of 2004 and all four quarters of 2003. We refer to thatrestatement as the ""Prior Restatement''. During our Prior Restatement, we conducted an extensive
69

THE INTERPUBLIC GROUP OF COMPANIES, INC. AND SUBSIDIARIESMANAGEMENT'S DISCUSSION AND ANALYSIS OF
FINANCIAL CONDITION AND RESULTS OF OPERATIONS Ì (Continued)(Amounts in Millions, Except Per Share Amounts)
examination of financial information and significant transactions and recorded expense and liabilitiesrelated to Vendor Discounts or Credits, Internal Investigations, and International CompensationArrangements.
A summary of the remaining liabilities related to these matters is as follows:
Balance as of Balance as of12/31/05 12/31/04
Vendor Discounts or Credits* ÏÏÏÏÏÏÏÏÏÏÏÏÏÏÏÏÏÏÏÏÏÏÏÏÏÏÏÏÏÏÏÏÏÏ $284.8 $283.9
Internal Investigations* (includes asset reserves)ÏÏÏÏÏÏÏÏÏÏÏÏÏÏÏÏÏÏ 24.7 61.7
International Compensation Arrangements ÏÏÏÏÏÏÏÏÏÏÏÏÏÏÏÏÏÏÏÏÏÏÏ 36.2 40.3
TotalÏÏÏÏÏÏÏÏÏÏÏÏÏÏÏÏÏÏÏÏÏÏÏÏÏÏÏÏÏÏÏÏÏÏÏÏÏÏÏÏÏÏÏÏÏÏÏÏÏÏÏÏÏ $345.7 $385.9
* $37.5 of vendor credits disclosed within Internal Investigations as of December 31, 2004 has beenreclassified to Vendor Discounts or Credits for current year presentation.
Vendor Discounts or Credits
We receive credits from our vendors and media outlets for the acquisition of goods and services thatare entered into on behalf of our clients. The expenses include the purchase of various forms of media,including television, radio, and print advertising space, or production costs, such as the creation ofadvertising campaigns, commercials, and print advertisements. Revenues in the advertising andcommunicative services business are frequently recorded net of third party costs as the business isprimarily an agent for its clients. Since these costs are billed to clients, there are times when vendorcredits or price differences can affect the net revenue recorded by the agency. These third party discounts,rebates, or price differences are frequently referred to as credits.
Our contracts are typically ""fixed-fee'' arrangements or ""cost-based'' arrangements. In ""fixed-fee''arrangements, the amount we charge our clients is comprised of a fee for our services. The fee we earn,however, is not affected by the level of expenses incurred. Therefore, any rebates or credits received inservicing these accounts do not create a liability to the client. In ""cost-based'' arrangements, we earn apercentage commission or flat fee based on or incremental to the expenses incurred. In these cases, rebatesor credits received may accrue to the benefit of our clients and create a liability payable to the client. Theinterpretation of cost language included in our contracts can vary across international and domesticmarkets in which we operate and can affect whether or not we have a liability to the client.
The terms of agreements with our clients are significantly impacted by the following: 1) the types ofvendor credits obtained (rebates, discounts, media and production credits); 2) differing contract types withclients (fixed fee vs. cost-based arrangements); 3) varying industry practices and laws in the regions of theworld in which we operate; 4) determining which contract (global, regional or local) governs ourrelationships with clients; and 5) unique contract provisions in specific contracts.
Prior to filing our 2004 Annual Report, we performed an extensive examination of our client contractsand arrangements and considered local law in the international jurisdictions where we conduct business todetermine the impact of improperly recognizing these vendor credits as additional revenue instead ofrecognizing a liability to our clients. We identified areas where there were differences in prices billed tocustomers and prices received from vendors. All differences associated with cost-based contracts notalready passed back to customers were established as liabilities.
70

THE INTERPUBLIC GROUP OF COMPANIES, INC. AND SUBSIDIARIESMANAGEMENT'S DISCUSSION AND ANALYSIS OF
FINANCIAL CONDITION AND RESULTS OF OPERATIONS Ì (Continued)(Amounts in Millions, Except Per Share Amounts)
Following the filing of the 2004 10-K in September of 2005, we began contacting clients to notifythem of these liabilities and to negotiate an appropriate settlement. During this process the additionalfollowing information came to our attention.
‚ Additional global or regional master contracts, with contractual terms that required us to rebatevendor discounts or credits, took precedence over local contracts that did not require us to rebatevendor discounts or credits.
‚ Certain misinterpretations of contractual terms and or applicable local law in our Prior Restatementled us to re-examine our agencies' legal assessment process. As a result, our legal departmentcoordinated the engagement of local counsel in order to provide definitive guidance regardingspecific local laws, existing legal precedent and historical, as well as, ongoing legal market practices.This legal guidance required additional adjustments to be made to the liabilities established in thePrior Restatement.
‚ The liability recorded during our Prior Restatement in some instances either covered too manyyears or did not cover enough years as required by the statute of limitations, based on the contractwe determined ultimately governed. We adjusted our liabilities for all years required under thestatute of limitations in the appropriate jurisdiction.
‚ In connection with our Prior Restatement, we estimated certain amounts of our exposures. We havedetermined that in certain instances our initial estimate of the liability recorded requiredadjustment. Additionally, certain entries originally recorded as estimates have been revised based onactual data retrieved from agency books and records.
‚ We performed a detailed review of situations in which billings from vendors and billings to ourclients were different. An appropriate adjustment was recorded for any known scenarios where suchinformation was fully reconciled and the difference was not related to a cost-based contract.
‚ For certain liabilities where the statute of limitations has lapsed, we appropriately released suchliabilities, unless the liabilities were associated with customers with whom we are in the process ofsettling or we intend to settle such liabilities.
We have included a table that depicts the beginning balance, the additional liabilities recorded andthe adjustment reducing these liabilities. While we had changes to our original reserve positions, the netimpact of adjustments, excluding fluctuations related to payments and foreign currency and other was anincrease to the liability balance of $22.9, and that was primarily attributable to the out of period vendordiscounts or credits adjustments.
Balance as of Liability Additional Balance as of12/31/04 Reversals Liabilities Payments Other 12/31/05
Vendor Discounts orCreditsÏÏÏÏÏÏÏÏÏÏÏÏÏÏÏ $283.9 (76.5) 99.4 (11.6) (10.4) $284.8
Internal Investigations
In our Prior Restatement review, we noted instances of possible employee misconduct. As a result,through December 31, 2004, we recorded adjustments with a cumulative impact on income of $114.8. Ofthis amount, $61.7 related to liabilities and asset reserves, $15.6 to asset write-offs, and $37.5 related toVendor Discounts or Credits as of December 31, 2004. These adjustments were recorded to correct certainunintentional errors in our accounting that were discovered as a result of investigations and primarilyrelated to agencies outside the United States. However, certain of these investigations revealed deliberate
71

THE INTERPUBLIC GROUP OF COMPANIES, INC. AND SUBSIDIARIESMANAGEMENT'S DISCUSSION AND ANALYSIS OF
FINANCIAL CONDITION AND RESULTS OF OPERATIONS Ì (Continued)(Amounts in Millions, Except Per Share Amounts)
falsification of accounting records, evasion of taxes in jurisdictions outside the United States, inappropriatecharges to clients, diversion of corporate assets, non-compliance with local laws and regulations, and otherimproprieties. These errors were not prevented or detected earlier because of material weaknesses in ourcontrol environment and decentralized operating structure. We recorded liabilities related to these matters,for business locations under investigation in our Prior Restatement review, which represented manage-ment's best estimate of probable exposure based on the facts available at that time.
The law firm of Dewey Ballantine LLP was retained to advise the Audit Committee of the Board ofDirectors regarding the discharge of its obligations. Through the filing of this document, Dewey Ballantinehas reviewed all internal investigations cases that were included in our Prior Restatement and continues tooversee our related remediation plans. Dewey Ballantine retained a forensic accounting firm to assist withits review.
During 2005, we recorded a net decrease in our liabilities for Internal Investigations of $37.0. Thedecrease is primarily due to write-off of assets reserves, the recognition of deferred revenue, and paymentof taxes, penalties and interest. We also divested certain agencies in Greece, Spain, Azerbaijan, Ukraine,Uzbekistan, Bulgaria and Kazakhstan. We have increased our reserves related to additional VAT andpayroll related taxes.
Below is an update of our significant cases.
At our McCann and FCB agencies in Turkey we recorded adjustments related to the retention ofvendor discounts that should have been remitted to clients, the improper valuation of a previously acquiredbusiness over-billing clients for payments to vendors and evasion of local taxes. In 2005, the investigationhas concluded and we have taken the appropriate personnel actions, including the termination of localsenior management. As of December 31, 2005 and 2004, the remaining liabilities were $12.6 and $19.8,respectively.
At Media First in New York City we recorded adjustments related primarily to inadequaterecordkeeping and the payment of certain employee salaries through accounts payable, without appropriatetax withholdings, resulting in increased earn-out payments. In 2005, we recorded asset write-offs and havetaken the appropriate personnel actions, including the termination of local senior management. As ofDecember 31, 2005 and 2004, the remaining liabilities and asset reserves were $1.2 and $10.8, respectively.
At our FCB agency in Spain we recorded adjustments related to the use of companies that wereformed to account for the production and media volume discounts received from production suppliers on aseparate set of books and records, to prevent the detection of discounts and rebates in the event of a clientaudit. In addition compensation was paid to an agency executive's personal service company out of thesecompanies without proper withholding for income taxes. In 2005, we have divested our interest in acomponent of FCB Spain and signed an affiliation agreement with the management, with an appropriatecontrol structure to assure future business is properly conducted. As of December 31, 2005 and 2004, theremaining liabilities and asset reserves were $0 and $9.8, respectively.
At five McCann agencies in Azerbaijan, Ukraine, Uzbekistan, Bulgaria and Kazakhstan we recordedadjustments related to the failure to record and pay compensation-related taxes, value added taxes andcorporate income taxes, and inadequate record keeping. In 2005, we have sold these entities and signedaffiliation agreements with Azerbaijan, Uzbekistan Bulgaria and Kazakhstan and intend to sign anaffiliation agreement with Ukraine agency management. There will be an appropriate control structure toassure business is properly conducted. As of December 31, 2005 and 2004, the remaining liabilities andasset reserves were $6.2 and $8.7, respectively.
72

THE INTERPUBLIC GROUP OF COMPANIES, INC. AND SUBSIDIARIESMANAGEMENT'S DISCUSSION AND ANALYSIS OF
FINANCIAL CONDITION AND RESULTS OF OPERATIONS Ì (Continued)(Amounts in Millions, Except Per Share Amounts)
In addition, we also conducted other investigations in our Prior Restatement review for errors foundthat were similar in nature to those described above. In the aggregate, for these other investigations, werecorded $4.7 and $12.6 in liabilities as of December 31, 2005 and 2004, respectively.
International Compensation Arrangements
In our Prior Restatement review, we performed an extensive examination of employee compensationpractices across our organization. While most practices were found to be acceptable, we identified somepractices in certain jurisdictions that required additional review. In certain jurisdictions in which weoperate, particularly in Europe and Latin America, it is common for individuals to establish a personalservice company (""PSC''), in which case the hiring company will normally contract directly with the PSCfor the services of the individual. We reviewed every situation where one of our agencies had contractedwith a PSC and determined that in a number of instances, the use of a PSC was determined not to besupportable. We also identified other arrangements or practices in certain jurisdictions, such as payment ofpersonal expenses outside the normal payroll mechanism, split salary payments, equity grants andretirement payments, and independent contractors/employees that led to an avoidance of paying certaintaxes as well as not reporting compensation to local authorities.
For these issues, liabilities represented our best estimate of expected payments to variousgovernmental organizations in the jurisdictions involved. These amounts were estimates as of such date ofour liabilities that we believed were sufficient to cover the obligations that we may have had to variousauthorities. As a result of the disclosures that were made in our 2004 Annual Report, we anticipate thatthe authorities in certain jurisdictions may undertake reviews to determine whether any of the activitiesdisclosed violated local laws and regulations. This may lead to further investigations and the levy ofadditional assessments including possible fines and penalties. While we intend to defend against anyassessment that we determine to be unfounded, nevertheless we could receive assessments which may besubstantial. However, it cannot be determined at this time whether such investigations would becommenced or, if they are, what the outcome will be with any reasonable certainty.
During 2005, we recorded a net decrease in our liabilities for International CompensationArrangements of $4.1. The decrease is comprised of reductions in our liabilities due to the expiration ofone year under the statutes of limitations, changes in management's estimates and the favorable outcomeof audits in certain jurisdictions. The decrease is net of increases to our accruals due to additionalliabilities incurred in 2005 through the continued use of a PSC or other such arrangements which we arein the process of terminating, as well as interest on amounts not yet settled.
OUT OF PERIOD ADJUSTMENTS
In the fourth quarter, we identified certain vendor discounts and credits, tax, and other miscellaneousadjustments in which our previously reported financial statements were in error or did not conform toGAAP. Because these changes are not material to our financial statements for the periods prior to 2005, orto 2005 as a whole, we have recorded them in the fourth quarter of 2005.
The errors in our previously reported financial information, and the failure to prevent them or detectthem in our financial reporting process, were largely attributable to weak internal controls. We concludedthat our control environment has not progressed sufficiently to serve as an effective foundation for all othercomponents of internal control. See Management's Assessment on Internal Control Over FinancialReporting.
73

THE INTERPUBLIC GROUP OF COMPANIES, INC. AND SUBSIDIARIESMANAGEMENT'S DISCUSSION AND ANALYSIS OF
FINANCIAL CONDITION AND RESULTS OF OPERATIONS Ì (Continued)(Amounts in Millions, Except Per Share Amounts)
The following tables summarize the impact to the fourth quarter of 2005 of amounts recorded in thefourth quarter of 2005 which relate to reported revenue, operating income (loss), income (loss) fromcontinuing operations before provision for income taxes, loss from continuing operations and loss per share.
Impact of Adjustmentson Revenue
For the Three MonthsEnded December 31, 2005
Revenue as reported ÏÏÏÏÏÏÏÏÏÏÏÏÏÏÏÏÏÏÏÏÏÏÏÏÏÏÏÏÏÏÏÏÏÏÏÏÏÏÏÏÏ $ 1,895.7
Impact of adjustments:
Vendor Discounts or Credits ÏÏÏÏÏÏÏÏÏÏÏÏÏÏÏÏÏÏÏÏÏÏÏÏÏÏÏÏÏÏÏÏ 21.2
Other adjustmentsÏÏÏÏÏÏÏÏÏÏÏÏÏÏÏÏÏÏÏÏÏÏÏÏÏÏÏÏÏÏÏÏÏÏÏÏÏÏÏÏÏ (3.9)
Total net adjustmentsÏÏÏÏÏÏÏÏÏÏÏÏÏÏÏÏÏÏÏÏÏÏÏÏÏÏÏÏÏÏÏÏÏÏÏÏÏÏÏÏ 17.3
Revenue (exclusive of out of period amounts)ÏÏÏÏÏÏÏÏÏÏÏÏÏÏÏÏÏÏÏ $ 1,913.0
Impact of Adjustments onOperating Income
For the Three MonthsEnded December 31, 2005
Operating Income as reported ÏÏÏÏÏÏÏÏÏÏÏÏÏÏÏÏÏÏÏÏÏÏÏÏÏÏÏÏÏÏÏÏÏ $ 57.6
Impact of adjustments:
Vendor Discounts or CreditsÏÏÏÏÏÏÏÏÏÏÏÏÏÏÏÏÏÏÏÏÏÏÏÏÏÏÏÏÏÏÏÏÏ 23.2
Other adjustments ÏÏÏÏÏÏÏÏÏÏÏÏÏÏÏÏÏÏÏÏÏÏÏÏÏÏÏÏÏÏÏÏÏÏÏÏÏÏÏÏÏ (1.6)
Total net adjustmentsÏÏÏÏÏÏÏÏÏÏÏÏÏÏÏÏÏÏÏÏÏÏÏÏÏÏÏÏÏÏÏÏÏÏÏÏÏÏÏÏÏ 21.6
Operating Income (exclusive of out period amounts)ÏÏÏÏÏÏÏÏÏÏÏÏÏÏ $ 79.2
Impact of Adjustmentson Income
from Continuing OperationsBefore Provision For
Income Taxes
For the Three MonthsEnded December 31, 2005
Income from continuing operations before provision for incometaxes as reported ÏÏÏÏÏÏÏÏÏÏÏÏÏÏÏÏÏÏÏÏÏÏÏÏÏÏÏÏÏÏÏÏÏÏÏÏÏÏÏÏÏ $ 44.6
Impact of adjustments:
Vendor Discounts or Credits ÏÏÏÏÏÏÏÏÏÏÏÏÏÏÏÏÏÏÏÏÏÏÏÏÏÏÏÏÏÏÏÏ 22.9
Other adjustmentsÏÏÏÏÏÏÏÏÏÏÏÏÏÏÏÏÏÏÏÏÏÏÏÏÏÏÏÏÏÏÏÏÏÏÏÏÏÏÏÏÏ (2.2)
Total net adjustmentsÏÏÏÏÏÏÏÏÏÏÏÏÏÏÏÏÏÏÏÏÏÏÏÏÏÏÏÏÏÏÏÏÏÏÏÏÏÏÏÏ 20.7
Income from continuing operations before provision for incometaxes (exclusive of out of period amounts) ÏÏÏÏÏÏÏÏÏÏÏÏÏÏÏÏÏÏÏ $ 65.3
74

THE INTERPUBLIC GROUP OF COMPANIES, INC. AND SUBSIDIARIESMANAGEMENT'S DISCUSSION AND ANALYSIS OF
FINANCIAL CONDITION AND RESULTS OF OPERATIONS Ì (Continued)(Amounts in Millions, Except Per Share Amounts)
Impact of Adjustmentson Loss from
Continuing Operationsand Loss per Share
For the Three MonthsEnded December 31, 2005
Loss from continuing operations as reported ÏÏÏÏÏÏÏÏÏÏÏÏÏÏÏÏÏÏÏÏÏ $(31.9)
Impact of adjustments:
Vendor Discounts or CreditsÏÏÏÏÏÏÏÏÏÏÏÏÏÏÏÏÏÏÏÏÏÏÏÏÏÏÏÏÏÏÏÏÏ 22.9
Other adjustments ÏÏÏÏÏÏÏÏÏÏÏÏÏÏÏÏÏÏÏÏÏÏÏÏÏÏÏÏÏÏÏÏÏÏÏÏÏÏÏÏÏ (2.2)
Total adjustments (pre-tax) ÏÏÏÏÏÏÏÏÏÏÏÏÏÏÏÏÏÏÏÏÏÏÏÏÏÏÏÏÏÏÏÏÏÏÏ 20.7
Tax adjustments ÏÏÏÏÏÏÏÏÏÏÏÏÏÏÏÏÏÏÏÏÏÏÏÏÏÏÏÏÏÏÏÏÏÏÏÏÏÏÏÏÏÏÏ 19.5
Equity in net income of unconsolidated affiliates ÏÏÏÏÏÏÏÏÏÏÏÏÏÏÏÏ 3.9
Total net adjustmentsÏÏÏÏÏÏÏÏÏÏÏÏÏÏÏÏÏÏÏÏÏÏÏÏÏÏÏÏÏÏÏÏÏÏÏÏÏÏÏÏÏ (2.7)
Loss from continuing operations (exclusive of out of periodamounts)ÏÏÏÏÏÏÏÏÏÏÏÏÏÏÏÏÏÏÏÏÏÏÏÏÏÏÏÏÏÏÏÏÏÏÏÏÏÏÏÏÏÏÏÏÏÏÏÏÏ $(34.6)
Loss per share of common stock Ì basic and diluted:
Loss per share as reportedÏÏÏÏÏÏÏÏÏÏÏÏÏÏÏÏÏÏÏÏÏÏÏÏÏÏÏÏÏÏÏÏÏÏÏ $(0.10)
Effect of adjustments ÏÏÏÏÏÏÏÏÏÏÏÏÏÏÏÏÏÏÏÏÏÏÏÏÏÏÏÏÏÏÏÏÏÏÏÏÏÏÏ (0.01)
Loss per share (exclusive of out of period amounts)ÏÏÏÏÏÏÏÏÏÏÏÏÏ (0.11)
Weighted-average shares ÏÏÏÏÏÏÏÏÏÏÏÏÏÏÏÏÏÏÏÏÏÏÏÏÏÏÏÏÏÏÏÏÏÏÏÏ 425.5
The impact to 2004, 2003 and prior periods related to out of period amounts recorded in the fourthquarter of 2005 was immaterial.
Description of Out of Period Adjustments:
Vendor Discounts or Credits:
We performed extensive procedures as a result of the initiation of settlement discussions with clients.The procedures broadly considered global or regional contracts, review of key changes in legalinterpretations, review of statutes of limitations, estimated exposures and vendor price differences related tocost-based contracts. As a result of these additional procedures, adjustments were recorded to ourpreviously established liabilities.
Other Adjustments
We have identified other items which do not conform to GAAP and recorded adjustments to our2005 Consolidated Financial Statements which relate to previously reported periods. The most significantinclude accounting related to the capitalization of software costs, acquisition related costs and internationalcompensation arrangements.
Tax Adjustments
We recorded adjustments to correct the Accrued and Deferred income taxes for items primarilyrelated to the computation of income tax benefits on the 2004 Long-lived Asset Impairment Charges, theestablishment of certain valuation allowances, the accounting for certain international tax structures and
75

THE INTERPUBLIC GROUP OF COMPANIES, INC. AND SUBSIDIARIESMANAGEMENT'S DISCUSSION AND ANALYSIS OF
FINANCIAL CONDITION AND RESULTS OF OPERATIONS Ì (Continued)(Amounts in Millions, Except Per Share Amounts)
the computation of interest accruals on certain non-US income tax contingencies. The impact of amountsrecorded in the fourth quarter of 2005 was $8.7 of tax benefit.
We also record the tax impact of the out of period adjustments described above, where applicable,based on the local statutory tax rate in the jurisdiction of the entity recording the adjustment. The impactof amounts recorded in the fourth quarter of 2005 was $10.8 of tax benefit.
CRITICAL ACCOUNTING ESTIMATES
Our Consolidated Financial Statements are prepared in accordance with generally accepted accountingprinciples in the United States of America. Preparation of the Consolidated Financial Statements andrelated disclosures requires us to make judgments, assumptions and estimates that affect the amountsreported and disclosed in the accompanying notes. We believe that of our significant accounting policies,the following critical accounting estimates involve management's most difficult, subjective or complexjudgments. We consider these accounting estimates to be critical because changes in the underlyingassumptions or estimates have the potential to materially impact our financial statements. Managementhas discussed with our Audit Committee the development, selection, application and disclosure of thesecritical accounting estimates. We regularly evaluate our judgments, assumptions and estimates based onhistorical experience and various other factors that we believe to be relevant under the circumstances.Actual results may differ from these estimates under different assumptions or conditions.
Revenue Recognition
Our revenues are primarily derived from the planning and execution of advertising programs in variousmedia and the planning and execution of other marketing and communications programs. Most of ourclient contracts are individually negotiated and accordingly, the terms of client engagements and the baseson which we earn commissions and fees vary significantly. Our client contracts are also becomingincreasingly complex arrangements that frequently include provisions for incentive compensation andgovern vendor rebates and credits. Our largest clients are multinational entities and, as such, we oftenprovide services to these clients out of multiple offices and across various agencies. In arranging for suchservices to be provided, it is possible for both a global and local agreement to be initiated. Multipleagreements of this nature are reviewed by legal counsel to determine the governing terms to be followedby the offices and agencies involved. Critical judgments and estimates are involved in determining both theamount and timing of revenue recognition under these arrangements.
Revenue for our services is recognized when all of the following criteria are satisfied: (i) persuasiveevidence of an arrangement exists; (ii) the price is fixed or determinable; (iii) collectibility is reasonablyassured; and (iv) services have been performed. Depending on the terms of the client contract, fees forservices performed can be primarily recognized three ways: proportional performance, straight-line (ormonthly basis) or completed contract.
‚ Fees are generally recognized as earned based on the proportional performance method of revenuerecognition in situations where our fee is reconcilable to the actual hours incurred to service theclient as detailed in a contractual staffing plan or where the fee is earned on a per hour basis, withthe amount of revenue recognized in both situations limited to the amount realizable under theclient contract. We believe an input based measure (the ""hour') is appropriate in situations wherethe client arrangement essentially functions as a time and out-of-pocket expense contract and theclient receives the benefit of the services provided throughout the contract term.
‚ Fees are recognized on a straight-line or monthly basis when service is provided essentially on a prorata basis and the terms of the contract support monthly basis accounting.
76

THE INTERPUBLIC GROUP OF COMPANIES, INC. AND SUBSIDIARIESMANAGEMENT'S DISCUSSION AND ANALYSIS OF
FINANCIAL CONDITION AND RESULTS OF OPERATIONS Ì (Continued)(Amounts in Millions, Except Per Share Amounts)
‚ Certain fees (such as for major marketing events) are deferred until contract completion as thefinal act is so significant in relation to the service transaction taken as a whole. Fees are alsorecognized on a completed contract basis when the terms of the contract call for the delivery ofdiscrete projects (""milestone' arrangements), if any of the criteria of SAB No. 104 were notsatisfied prior to job completion or the terms of the contract do not otherwise qualify forproportional performance or monthly basis recognition.
Incremental direct costs incurred related to contracts where revenue is accounted for on a completedcontract basis are generally expensed as incurred. There are certain exceptions made for significantcontracts or for certain agencies where the majority of the contracts are project-based and systems are inplace to properly capture appropriate direct costs. Commissions are generally earned on the date of thebroadcast or publication. Contractual arrangements with clients may also include performance incentiveprovisions designed to link a portion of the revenue to our performance relative to both qualitative andquantitative goals. Performance incentives are recognized as revenue for quantitative targets when thetarget has been achieved and for qualitative targets when confirmation of the incentive is received from theclient. Therefore, depending on the terms of the client contract, revenue is derived from diversearrangements involving fees for services performed, commissions, performance incentive provisions andcombinations of the three. The classification of client arrangements to determine the appropriate revenuerecognition involves judgments. If the judgments change there can be a material impact on our financialstatements, and particularly on the allocation of revenues between periods.
Substantially all of our revenue is recorded as the net amount of our gross billings less pass-throughexpenses charged to a client. In most cases, the amount that is billed to clients significantly exceeds theamount of revenue that is earned and reflected in our financial statements, because of various pass-throughexpenses such as production and media costs. In compliance with EITF Issue No. 99-19, ReportingRevenue Gross as a Principal versus Net as an Agent, we assess whether the agency or the third-partysupplier is the primary obligor. We evaluate the terms of our client agreements as part of this assessment.In addition, we give appropriate consideration to other key indicators such as latitude in establishing price,discretion in supplier selection and credit risk to the vendor. Because we operate broadly as an advertisingagency based on our primary lines of business and given the industry practice to generally record revenueon a net versus gross basis, we believe that there must be strong evidence in place to overcome thepresumption of net revenue accounting. Accordingly, we generally record revenue net of pass-throughcharges as we believe the key indicators of the business suggest we generally act as an agent on behalf ofour clients in our primary lines of business. In those businesses (primarily sales promotion, event, sportsand entertainment marketing and corporate and brand identity services) where the key indicators suggestwe act as a principal, we record the gross amount billed to the client as revenue and the related costsincurred as operating expenses.
The determination whether revenue in a particular line of business should be recognized net or grossinvolves difficult judgments. If we make these judgments differently, it could significantly affect ourfinancial performance. If it were determined that we must recognize a significant portion of revenues on agross basis rather than a net basis, it would positively impact revenues, but have no impact on ouroperating income. Conversely, if it were determined that we must recognize a significant portion ofrevenues on a net basis rather than a gross basis, it would negatively impact revenues, but have no impacton our operating income.
As we provide services as part of our core operations, we generally incur incidental expenses, which,in practice, are commonly referred to as ""out of pocket'' expenses. These expenses often include expensesrelated to airfare, mileage, hotel stays, out of town meals and telecommunication charges. In accordance
77

THE INTERPUBLIC GROUP OF COMPANIES, INC. AND SUBSIDIARIESMANAGEMENT'S DISCUSSION AND ANALYSIS OF
FINANCIAL CONDITION AND RESULTS OF OPERATIONS Ì (Continued)(Amounts in Millions, Except Per Share Amounts)
with EITF Issue No. 01-14, Income Statement Characterization of Reimbursements Received for ""Out-of-Pocket' Expenses Incurred, we record the reimbursements received for incidental expenses as revenue.
We receive credits from our vendors and media outlets for transactions entered into on behalf of ourclients, which are passed through to our clients in accordance with contractual provisions and local law. Ifa pass-through is not required, then these credits are a reduction of vendor cost, and are generally recordedas additions to revenue. In connection with our Prior Restatement, where it was impractical to reviewclient contracts, we used statistical methods to estimate our exposure that could arise from credits,discounts and other rebates owed to clients. If our estimate is insufficient, we may be required to recognizeadditional liabilities. If the initial estimate of the liability recorded is subsequently determined to be overor under provided for, the difference is recorded as an adjustment to revenue. If we are able to negotiate afavorable settlement of a recorded liability, however, the reversal of this amount is recorded in a non-operating income account since negotiating a favorable outcome with a client is not considered a revenuegenerating activity. See Note 2 to the Consolidated Financial Statements for further information.
Allowance for Doubtful Accounts
The allowance for doubtful accounts is estimated based on the aging of accounts receivable, reviews ofclient credit reports, industry trends and economic indicators, as well as analysis of recent payment historyfor specific customers. The estimate is based largely on a formula-driven calculation but is supplementedwith economic indicators and knowledge of potential write-offs of specific client accounts. Though weconsider the balance to be adequate, changes in general domestic and international economic conditions inspecific markets could have a material impact on the required reserve balance. A 10% increase in theallowance for doubtful accounts would result in a $10.6 increase in bad debt expense for 2005.
Income Taxes
The provision for income taxes includes federal, state, local and foreign taxes. Deferred tax assets andliabilities are recognized for the estimated future tax consequences of temporary differences between thefinancial statement carrying amounts and their respective tax bases. Deferred tax assets and liabilities aremeasured using enacted tax rates expected to apply to taxable income in the year in which the temporarydifferences are expected to be recovered or settled. We evaluate the realizability of our deferred tax assetsand establish a valuation allowance when it is more likely than not that all or a portion of deferred taxassets will not be realized.
The realization of our deferred tax assets is primarily dependent on future earnings. Any reduction inestimated forecasted results may require that we record additional valuation allowances against ourdeferred tax assets. In connection with the U.S. deferred tax assets, management believes that it is morelikely than not that a substantial amount of the deferred tax assets will be realized; a valuation allowancehas been established for the remainder. The amount of the deferred tax assets considered realizable,however, could be reduced in the near term if estimates of future U.S. taxable income are lower thananticipated. Once a valuation allowance has been established, it will be maintained until there is sufficientpositive evidence to conclude that it is more likely than not that the deferred tax assets will be realized. Apattern of sustained profitability will generally be considered as sufficient positive evidence to reverse avaluation allowance. If the allowance is reversed in a future period, our income tax provision will becorrespondingly reduced. Accordingly, the establishment and reversal of valuation allowances has had andcould have a significant negative or positive impact on our future earnings. See Note 11 to theConsolidated Financial Statements for further information.
78

THE INTERPUBLIC GROUP OF COMPANIES, INC. AND SUBSIDIARIESMANAGEMENT'S DISCUSSION AND ANALYSIS OF
FINANCIAL CONDITION AND RESULTS OF OPERATIONS Ì (Continued)(Amounts in Millions, Except Per Share Amounts)
We measure deferred tax assets and liabilities using enacted tax rates that, if changed, would result ineither an increase or decrease in the provision for income taxes in the period of change.
Undistributed earnings of our foreign subsidiaries are permanently reinvested. While the AmericanJobs Creation Act of 2004 (the ""Jobs Act'') creates a temporary incentive for U.S. corporations torepatriate undistributed international earnings by providing an 85% dividends received deduction, we havereviewed the provisions and determined not to take advantage of this provision to repatriate undistributedearnings of our foreign subsidiaries to the U.S.
Land, Buildings and Equipment
The assignment of useful lives to buildings and equipment involves judgments and the use ofestimates. Buildings and equipment are depreciated generally using the straight-line method over theestimated useful lives of the related assets, which range from 3 to 7 years for furniture, equipment andcomputer software costs, 10 to 35 years for buildings and the shorter of the useful life of the asset (whichranges from 3 to 10 years) or the remaining lease term for leasehold improvements. A one-year decreasein the useful lives of these assets would result in an $19.1 increase in annual depreciation expense for2005.
Certain events or changes in circumstances could cause us to conclude that the carrying value of ourbuildings and equipment may not be recoverable. Events or circumstances that might require impairmenttesting include, but are not limited to, decrease in market price, negative forecasted cash flow, or asignificant adverse change in business climate of the asset grouping. If the total estimate of the expectedfuture undiscounted cash flows of an asset grouping over its useful life is less than its carrying value, animpairment loss is recognized in the financial statements equal to the difference between the estimated fairvalue and carrying value of the asset grouping. If our estimates change, it may have a material impact onour financial statements.
Investments
We regularly review our cost and equity method investments to determine whether a significant eventor change in circumstances has occurred that may have an adverse effect on the fair value of eachinvestment. In the event a decline in fair value of an investment occurs, we must determine if the declinehas been other than temporary. We consider our investments strategic and long-term in nature, so we mustdetermine if the fair value decline is recoverable within a reasonable period. For investments accounted forusing the cost or equity basis, we evaluate fair value based on specific information (valuationmethodologies, estimates of appraisals, financial statements, etc.) in addition to quoted market price, ifavailable. Factors indicative of an other than temporary decline also include recurring operating losses,credit defaults and subsequent rounds of financing with pricing that is below the cost basis of theinvestment. This list is not all-inclusive; we consider all known quantitative and qualitative factors indetermining if an other than temporary decline in value of an investment has occurred. Our assessments offair value represent our best estimates at the time of impairment review. If different fair values are laterestimated, it could have a material impact on our financial statements. See Note 10 to the ConsolidatedFinancial Statements for further information.
Goodwill and Other Intangible Assets
We account for our business combinations using the purchase accounting method. The total costs ofthe acquisitions are allocated to the underlying net assets, based on their respective estimated fair marketvalues and the remainder allocated to goodwill and other intangible assets. Considering the characteristics
79

THE INTERPUBLIC GROUP OF COMPANIES, INC. AND SUBSIDIARIESMANAGEMENT'S DISCUSSION AND ANALYSIS OF
FINANCIAL CONDITION AND RESULTS OF OPERATIONS Ì (Continued)(Amounts in Millions, Except Per Share Amounts)
of advertising, specialized marketing and communication services companies, our acquisitions usually donot have significant amounts of tangible assets as the principal asset we typically acquire is creative talent.As a result, a substantial portion of the purchase price is allocated to goodwill. Determining the fairmarket value of assets acquired and liabilities assumed requires management's judgment and involves theuse of significant estimates, including future cash inflows and outflows, discount rates, asset lives andmarket multiples.
We review goodwill and other intangible assets with indefinite lives not subject to amortization(e.g., customer lists, trade names and customer relationships) annually or whenever events orsignificant changes in circumstances indicate that the carrying value may not be recoverable. Weevaluate the recoverability of goodwill at a reporting unit level. We have 16 reporting units that areeither the entities at the operating segment level or one level below the operating segment level. For2005, in accordance with SFAS No. 142, Goodwill and Other Intangible Assets, we did not test certainreporting units whose 2004 fair value determination exceeded their carrying amount by a substantialmargin, where no significant event occurred since the last fair value determination that wouldsignificantly change this margin and where the reporting units did not have a triggering event during2005. The remaining reporting units were tested either as part of the 2005 annual impairment testingas their 2004 fair value did not significantly exceed their carrying value by a substantial margin or asa result of a triggering event. We review intangible assets with definite lives subject to amortizationwhenever events or circumstances indicate that a carrying amount of an asset may not be recoverable.Intangible assets with definite lives subject to amortization are amortized on a straight-line basis withestimated useful lives generally ranging from 1 to 15 years. Events or circumstances that might requireimpairment testing include the loss of a significant client, the identification of other impaired assetswithin a reporting unit, loss of key personnel, the disposition of a significant portion of a reportingunit, or a significant adverse change in business climate or regulations.
SFAS No. 142 specifies a two-step process for testing for goodwill impairment and measuring themagnitude of any impairment. The first step of the impairment test is a comparison of the fair value of areporting unit to its carrying value, including goodwill. Goodwill allocated to a reporting unit whose fairvalue is equal to or greater than its carrying value is not impaired and no further testing is required.Should the carrying amount for a reporting unit exceed its fair value, then the first step of the impairmenttest is failed and the magnitude of any goodwill impairment is determined under the second step. Thesecond step is a comparison of the implied fair value of a reporting unit's goodwill to its carrying value.Goodwill of a reporting unit is impaired when its carrying value exceeds its implied fair value. Impairedgoodwill is written down to its implied fair value with a charge to expense in the period the impairment isidentified.
The fair value of a reporting unit is estimated using our projections of discounted future operatingcash flows (without interest) of the unit. Such projections require the use of significant estimates andassumptions as to matters such as future revenue growth, profit margins, capital expenditures, assumed taxrates and discount rates. We believe that the estimates and assumptions made are reasonable but they aresusceptible to change from period to period. For example, our strategic decisions or changes in marketvaluation multiples could lead to impairment charges. Actual results of operations, cash flows and otherfactors used in a discounted cash flow valuation will likely differ from the estimates used and it is possiblethat differences and changes could be material.
For the year ended December 31, 2005, we changed the date of our annual impairment test forgoodwill and other intangible assets with indefinite lives from September 30th to October 1st. During 2005we performed this annual impairment test on September 30th and then again on October 1st to ensurethat multiples used in the reporting units tested were consistent. By moving the date into the fourth
80

THE INTERPUBLIC GROUP OF COMPANIES, INC. AND SUBSIDIARIESMANAGEMENT'S DISCUSSION AND ANALYSIS OF
FINANCIAL CONDITION AND RESULTS OF OPERATIONS Ì (Continued)(Amounts in Millions, Except Per Share Amounts)
quarter we will be able to utilize the most current and accurate plan and forecast information. The newdate also provides us additional time to meet future accelerated public reporting requirements. This changedid not delay, accelerate or avoid an impairment charge. This change in accounting principle also did nothave an effect on our Consolidated Financial Statements. Accordingly, we believe that the accountingchange described above is an alternative accounting principle that is preferable.
Our annual impairment reviews as of September 30th and October 1st, 2005 resulted in animpairment charge at a reporting unit within our sports and entertainment marketing business. In addition,during the fourth quarter of 2005, there was a loss of a significant client at one of our reporting units thatcaused us to perform additional impairment testing. As a result, we recorded $97.0 of impairments during2005. See Notes 8 and 9 to the Consolidated Financial Statements for further information. The excess ofthe low range of the fair value over the carrying value for each of the non-impaired reporting units rangedfrom approximately $2.4 to $1,501.9 and $6.4 to $1,501.9 in 2005 and 2004, respectively. In order toevaluate the sensitivity of the fair value calculations on the goodwill impairment test, we applied ahypothetical 10% decrease to the fair values of each reporting unit. The hypothetical 10% decrease appliedto 2005 fair values for each of the non-impaired reporting units would result in a range of an impairmentcharge of approximately $38.2 to excess fair value over carrying value of approximately $871.9. Thishypothetical 10% decrease would result in excess fair value over carrying value for each of the non-impaired reporting units ranging from approximately $3.4 to $871.9 in 2004.
Acquisitions
The majority of our acquisitions involve an initial payment at the time of closing and provide foradditional contingent purchase price payments over a specified time. The initial purchase price of anacquisition is allocated to identifiable assets acquired and liabilities assumed based on estimated fair valueswith any excess being recorded as goodwill and other intangible assets. These contingent payments, whichare also known as ""earn-outs'' and ""put options,'' are calculated based on estimates of the future financialperformance of the acquired entity, the timing of the exercise of these rights, changes in foreign currencyexchange rates and other factors. Earn-outs and put options are recorded within the financial statements asan increase to goodwill and other intangible assets once the terms and conditions of the contingentacquisition obligations have been met and the consideration is distributable or expensed as compensationbased on the acquisition agreement and the terms and conditions of employment for the former owners ofthe acquired businesses. See the Liquidity and Capital Resources section of this report and Note 21 to theConsolidated Financial Statements for further information regarding future contingent acquisitionobligations.
Restructuring Reserves
When appropriate, we establish restructuring reserves for severance and termination costs and leasetermination and other exit costs related to our restructuring programs. We have established reserves forrestructuring programs initiated in 2001 and 2003. The reserves reflect our best estimates for the costs ofthe plans. However, actual results may differ from the estimated amounts based on, but not limited to,changes in demand for advertising services and unexpected usage of leased properties. Comparison ofactual results to estimates may materially impact the amount of the restructuring charges or reversals. Wewill continue to monitor our restructuring reserves and may adjust the current balances based on futureevents. See Note 6 to the Consolidated Financial Statements for further information.
81

THE INTERPUBLIC GROUP OF COMPANIES, INC. AND SUBSIDIARIESMANAGEMENT'S DISCUSSION AND ANALYSIS OF
FINANCIAL CONDITION AND RESULTS OF OPERATIONS Ì (Continued)(Amounts in Millions, Except Per Share Amounts)
Pension and Postretirement Benefits
We use various actuarial methods and assumptions in determining our pension and postretirementbenefit costs and obligations, including the discount rate used to determine the present value of futurebenefits, expected long-term rate of return on plan assets and healthcare cost trend rates. The discountrate determination is one of the significant assumptions that impacts our benefit cost and recordedobligations for pension and postretirement plans. Discount rates used for our benefit plans attempt tomatch the duration of the underlying liability with highly rated securities that could be used to effectivelysettle the obligation. For example, in 2005, a 25 basis point decrease in the discount rate would haveincreased our net benefit cost by approximately $2.0. See Note 16 to the Consolidated FinancialStatements for further information.
OTHER MATTERS
SEC Investigation
The SEC opened a formal investigation in response to the restatement we first announced in August2002 and, as previously disclosed, the SEC staff's investigation has expanded to encompass our PriorRestatement. In particular, since we filed our 2004 Form 10-K, we have received subpoenas from the SECrelating to matters addressed in our Prior Restatement. We continue to cooperate with the investigation.We expect that the investigation will result in monetary liability, but because the investigation is ongoing,in particular with respect to the Prior Restatement, we cannot reasonably estimate either the timing of aresolution or the amount. Accordingly, we have not yet established any accounting provision relating tothese matters.
RECENT ACCOUNTING STANDARDS
See Note 22 to the Consolidated Financial Statements for a complete description of recent accountingpronouncements that have affected us or may affect us.
82

THE INTERPUBLIC GROUP OF COMPANIES, INC. AND SUBSIDIARIES(Amounts in Millions, Except Per Share Amounts)
Item 7A. Quantitative and Qualitative Disclosures About Market Risk
In the normal course of business, we are exposed to market risks related to interest rates and foreigncurrency rates. From time to time, we use derivatives, pursuant to established guidelines and policies, tomanage some portion of these risks. Derivative instruments utilized in our hedging activities are viewed asrisk management tools, involve little complexity and are not used for trading or speculative purposes. SeeNote 18 to the Consolidated Financial Statements.
Interest Rates
Our exposure to market risk for changes in interest rates relates primarily to our debt obligations. Asfurther described in Note 13 to the Consolidated Financial Statements, our principal debt obligations atDecember 31, 2005 consisted of our 4.50% Notes and Senior Unsecured Notes, with expiration datesranging from 2009 to 2014.
At December 31, 2005 and 2004, 86.0% and 81.1% of our debt obligations bore interest at fixedinterest rates. Accordingly, assuming the fixed-rate debt is not refinanced, there would be no impact oninterest expense or cash flow from either a 10% increase or decrease in market rates of interest. However,there would be an impact on the fair market value of the debt, as the fair market value of debt is sensitiveto changes in interest rates. For 2005, the fair market value of the debt obligations would decrease byapproximately $27.7 if market rates were to increase by 10% and would increase by approximately $28.0 ifmarket rates were to decrease by 10%. For 2004, the fair market value of the debt obligations would havedecreased by approximately $16.3 if market rates increased by 10% and would have increased byapproximately $19.5 if market rates decreased by 10%. For that portion of the debt that bore interest atvariable rates, based on outstanding amounts and rates at December 31, 2005, interest expense and cashout-flow would increase or decrease by approximately $2.1 if market rates were to increase or decrease by10%, respectively. For that portion of the debt that bore interest at variable rates, based on outstandingamounts and rates at December 31, 2004, interest expense and cash out-flow would have increased ordecreased by approximately $1.8 if market rates increased or decreased by 10%, respectively. From time totime we have used interest rate swaps to manage the mix of our fixed and floating rate debt obligations. InMay 2005, we terminated all our existing long-term interest rate swap agreements, and currently have noneoutstanding.
Foreign Currencies
We face translation and transaction risks related to changes in foreign currency exchange rates.Amounts invested in our foreign operations are translated into U.S. Dollars at the exchange rates in effectat the balance sheet date. The resulting translation adjustments are recorded as a component ofaccumulated other comprehensive income (loss) in the stockholders' equity section of our ConsolidatedBalance Sheet. Our foreign subsidiaries generally collect revenues and pay expenses in currencies otherthan the U.S. Dollar, mitigating transaction risk. Since the functional currency of our foreign operations isgenerally the local currency, foreign currency translation of the balance sheet is reflected as a componentof stockholders' equity and does not impact operating results. Revenues and expenses in foreign currenciestranslate into varying amounts of U.S. Dollars depending upon whether the U.S. Dollar weakens orstrengthens against other currencies. Therefore, changes in exchange rates may either positively ornegatively affect our consolidated revenues and expenses (as expressed in U.S. Dollars) from foreignoperations. Currency transaction gains or losses arising from transactions in currencies other than thefunctional currency are included in results of operations and were not significant in the years endedDecember 31, 2005 and 2004. We have not entered into a material amount of foreign currency forwardexchange contracts or other derivative financial instruments to hedge the effects of adverse fluctuations inforeign currency exchange rates.
83

Item 8. Financial Statements and Supplementary Data
INDEX
Page
Management's Assessment on Internal Control over Financial Reporting ÏÏÏÏÏÏÏÏÏÏÏÏÏÏÏÏÏÏÏÏÏÏÏÏ 85
Report of Independent Registered Public Accounting Firm ÏÏÏÏÏÏÏÏÏÏÏÏÏÏÏÏÏÏÏÏÏÏÏÏÏÏÏÏÏÏÏÏÏÏÏ 92
Consolidated Statements of Operations for the years ended December 31, 2005, 2004 and 2003 ÏÏÏÏ 99
Consolidated Balance Sheets as of December 31, 2005 and 2004ÏÏÏÏÏÏÏÏÏÏÏÏÏÏÏÏÏÏÏÏÏÏÏÏÏÏÏÏÏÏÏ 100
Consolidated Statements of Cash Flows for the years ended December 31, 2005, 2004 and 2003ÏÏÏÏ 101
Consolidated Statements of Stockholders' Equity and Comprehensive Income (Loss) for the yearsended December 31, 2005, 2004 and 2003ÏÏÏÏÏÏÏÏÏÏÏÏÏÏÏÏÏÏÏÏÏÏÏÏÏÏÏÏÏÏÏÏÏÏÏÏÏÏÏÏÏÏÏÏÏÏÏÏ 102
Notes to Consolidated Financial Statements ÏÏÏÏÏÏÏÏÏÏÏÏÏÏÏÏÏÏÏÏÏÏÏÏÏÏÏÏÏÏÏÏÏÏÏÏÏÏÏÏÏÏÏÏÏÏÏÏ 103
Financial Statement Schedule Ì Valuation and Qualifying Accounts for the years endedDecember 31, 2005, 2004 and 2003 ÏÏÏÏÏÏÏÏÏÏÏÏÏÏÏÏÏÏÏÏÏÏÏÏÏÏÏÏÏÏÏÏÏÏÏÏÏÏÏÏÏÏÏÏÏÏÏÏÏÏÏÏÏ 171
84

MANAGEMENT'S ASSESSMENT ON INTERNAL CONTROL OVER FINANCIAL REPORTING
Management is responsible for establishing and maintaining adequate internal control over financialreporting as defined in Rules 13a-15(f) and 15d-15(f) under the Securities Exchange Act of 1934.Internal control over financial reporting is designed to provide reasonable assurance regarding the reliabilityof financial reporting and the preparation of financial statements for external purposes in accordance withgenerally accepted accounting principles in the United States of America (""GAAP''). We recognize thatbecause of its inherent limitations, internal control over financial reporting may not prevent or detectmisstatements. Also, projections of any evaluation of effectiveness to future periods are subject to the riskthat controls may become inadequate because of changes in conditions, or that the degree of compliancewith the policies and procedures may deteriorate.
To evaluate the effectiveness of our internal control over financial reporting, management used thecriteria described in Internal Control Ì Integrated Framework issued by the Committee of SponsoringOrganizations of the Treadway Commission (""COSO'').
A material weakness (within the meaning of PCAOB Auditing Standard No. 2) in internal controlover financial reporting is a control deficiency, or combination of control deficiencies, that results in morethan a remote likelihood that a material misstatement of the annual or interim financial statements willnot be prevented or detected.
Management's assessment is that our internal control over financial reporting was not effective as ofDecember 31, 2005 because of the material weaknesses identified and described below. The materialweaknesses identified by us at December 31, 2005 are grouped according to the components of the COSOframework to which they relate. These material weaknesses resulted in restatements, misstatements andaudit adjustments as described below, and could result in misstatements that would be material to theannual or interim consolidated financial statements that would not be prevented or detected.
Control Environment
1. The Company did not maintain an effective control environment. Specifically, controls were notdesigned and in place to ensure compliance with the Company's policies and procedures, including thosecontained in the Company's Code of Conduct. Further, the Company did not maintain a sufficientcomplement of personnel with an appropriate level of accounting knowledge, experience and training in theapplication of GAAP commensurate with the Company's financial reporting requirements. The Companyalso failed to implement processes to ensure periodic monitoring of its existing internal control activitiesover financial reporting by placing heavy reliance on manual procedures without quality control review andother monitoring controls in place to adequately identify and assess significant risks that may impactfinancial statements and related disclosures. This deficiency results in a control environment that allowedinstances of falsified books and records, violations of laws, regulations and the Company's policies,misappropriation of assets and improper customer charges and dealings with vendors. This deficiencyresulted in a restatement of the first three interim periods of 2005 and misstatements and auditadjustments, including the out of period adjustments, to the 2005 annual and interim consolidated financialstatements. Additionally, this control deficiency could result in a misstatement of account balances ordisclosure that would result in a material misstatement to annual or interim consolidated financialstatements that would not be prevented or detected. This deficiency has had a pervasive impact on theCompany's control environment and has contributed to the material weaknesses described below.
Control Activities
2. The Company did not maintain effective controls over the accounting for purchase businesscombinations. Specifically, the Company did not have controls designed and in place to ensure thecompleteness, accuracy and valuation of revenue and expenses of acquired companies related to periodsafter the closing date of the transactions. In addition, the Company did not maintain effective controls toensure the completeness, accuracy and valuation of assets and liabilities recorded for compensatory earn-out and put arrangements or derivatives embedded within acquisition transactions. This deficiency resultedin a restatement of the first three interim periods of 2005 and misstatements and audit adjustments,including out of period adjustments, to the 2005 annual and interim consolidated financial statements,
85

which primarily impacted accounts receivable, net, accounts payable, minority interests in consolidatedsubsidiaries, goodwill, and other income. Additionally, this control deficiency could result in amisstatement of account balances or disclosure, including, but not limited to, the aforementioned accountsabove that would result in a material misstatement to the annual or interim consolidated financialstatements that would not be prevented or detected.
3. The Company did not maintain effective controls over the accuracy and presentation and disclosureof recording of revenue. Specifically, controls were not designed and in place to ensure that customercontracts were authorized, that customer contracts were analyzed to select the appropriate method ofrevenue recognition, and billable job costs were compared to client cost estimates to ensure that noamounts were owed to clients. In addition, controls were not designed and in place to ensure that revenuetransactions were analyzed for appropriate presentation and disclosure of billable client pass-throughexpenses or for recognition of revenue on a gross or net basis. This deficiency resulted in a restatement ofthe first three interim periods of 2005, and misstatements and audit adjustments, including out of periodadjustments, to the 2005 annual and interim consolidated financial statements, which impacted revenue,office and general expenses, accounts receivable, net, expenditures billable to clients, accounts payable, andaccrued liabilities. Additionally, this control deficiency could result in a misstatement of account balancesor disclosure, including the aforementioned accounts above, that would result in a material misstatement tothe annual or interim consolidated financial statements that would not be prevented or detected.
4. The Company did not maintain effective controls to ensure that certain financial statementtransactions were appropriately initiated, authorized, processed, documented and accurately recorded. Thiswas primarily evident in the following specific areas:
i. client contracts, and client or vendor incentives and rebates;
ii. accounts receivable transactions, expenditures and fees billable to clients;
iii. fixed assets purchases, disposals, depreciable lives and leases;
iv. accounts payable and accrued liabilities;
v. payments made for employee and executive compensation and payments for benefits;
vi. cash and cash equivalents, wire transfers, and foreign currency transactions;
vii. arrangements with derivative instruments;
viii. intercompany transactions;
ix. purchase of equity of investments in unconsolidated entities;
x. purchase, disposal or write-off of intangible assets; and
xi. debt and equity transactions.
This deficiency resulted in a restatement of the first three interim periods of 2005, and misstatements andaudit adjustments, including out of period adjustments, to the 2005 annual and interim consolidatedfinancial statements, which impacted substantially all accounts in the consolidated financial statements.Additionally, this control deficiency could result in a misstatement of account balances or disclosure,including the aforementioned accounts above, that would result in a material misstatement to the annualor interim consolidated financial statements that would not be prevented or detected.
5. The Company did not maintain effective controls over the complete and accurate recording ofleases in accordance with GAAP. Specifically, the Company did not completely evaluate and accuratelyaccount for leases with rent holidays, rent escalation clauses, leasehold improvements or asset retirementobligations associated with real estate leases. This deficiency resulted in audit adjustments to the 2005annual and interim consolidated financial statements, which primarily impacted office and generalexpenses, restructuring charges, land, buildings and equipment, net, accrued liabilities and other non-current liabilities. Additionally, this control deficiency could result in a misstatement of account balancesor disclosure, including the aforementioned accounts above, that would result in a material misstatement tothe annual or interim consolidated financial statements that would not be prevented or detected.
86

6. The Company did not maintain effective controls over the accounting for income taxes in domesticoperations and operations outside of the United States to ensure amounts are accurately accounted for inaccordance with GAAP. Specifically, the Company did not have controls designed and in place to ensurethat accounting personnel performed the following: recorded income tax provision between current anddeferred tax accounts in the balance sheet; reconciled prior years' income tax returns to the appropriateperiod income tax provision computations; timely identified income tax exposures and contingencies,including interest and penalties; and reconciled tax accounts to tax filings. This deficiency resulted inmisstatements and audit adjustments, including out of period adjustments, to the 2005 annual consolidatedfinancial statements, which impacted accrued liabilities, deferred income taxes, other non-current liabilitiesand the provision for income taxes. Additionally, this control deficiency could result in a misstatement ofaccount balances or disclosure, including the aforementioned accounts above, that would result in amaterial misstatement to the annual or interim consolidated financial statements that would not beprevented or detected.
7. The Company did not maintain effective controls over reporting local income tax in the localstatutory accounts or local income tax returns in operations outside of the United States. Specifically, theCompany did not have controls designed and in place to ensure that accounting personnel adhere to policyand procedures regarding compliance with local laws and regulations, and reconcile its accounts betweenGAAP and local income tax reporting. This allowed in prior periods the violation of local tax regulationsand incomplete and inaccurate recording of income taxes in the Company's consolidated financialstatements. This deficiency did not result in an audit adjustment to the consolidated financial statements.However, this deficiency could result in a misstatement of account balances or disclosure, including, butnot limited to, accrued liabilities, deferred income taxes, other non-current liabilities and the provision forincome taxes, that would result in a material misstatement to the annual or interim consolidated financialstatements that would not be prevented or detected.
8. The Company did not maintain effective controls relating to the completeness and accuracy oflocal payroll and compensation related liabilities in certain operations outside of the United States.Specifically the Company did not have controls designed and in place to identify instances where localreporting regulations and payroll tax withholding requirements were not met or identification ofcompensation practices which were either not supportable under local law or were not fully in accordancewith the Company's policies and procedures. This allowed in prior periods improperly omitting, orinstances of purposefully omitting, certain liabilities in the consolidated financial statements. Thisdeficiency resulted in a restatement of the first three interim periods of 2005, and misstatements and auditadjustments, including out of period adjustments, to the 2005 annual and interim consolidated financialstatements, which impacted salaries and related expenses and accrued liabilities. Additionally, thisdeficiency could result in a misstatement of account balances or disclosure, including the aforementionedaccounts above, that would result in a material misstatement to the annual or interim consolidatedfinancial statements that would not be prevented or detected.
9. The Company did not maintain effective controls over the accuracy and completeness of theprocessing and monitoring of intercompany transactions, including appropriate authorization for intercom-pany charges. Specifically, controls were not designed and in place to ensure that intercompany balanceswere accurately classified and completely reported in the Company's consolidated financial statements, andintercompany confirmations were not completed timely or accurately between the Company's agencies toensure proper elimination as part of the consolidation process. This deficiency resulted in immaterial auditadjustments to the 2005 annual and interim consolidated financial statements. Additionally, this controldeficiency could result in a misstatement of account balances or disclosure that would result in a materialmisstatement to the annual or interim consolidated financial statements that would not be prevented ordetected.
10. The Company did not maintain effective controls over the reconciliation of certain financialstatement accounts. Specifically, controls were not designed and in place to ensure that the Company'saccounts were accurate and agreed to detailed support. This deficiency resulted in a restatement of thefirst three interim periods of 2005, and misstatements and audit adjustments, including the out of period
87

adjustments, to the 2005 annual and interim consolidated financial statements, which impactedsubstantially all accounts in the Company's consolidated financial statements. Additionally, this controldeficiency could result in a misstatement of account balances or disclosure that would result in a materialmisstatement to the annual or interim consolidated financial statements that would not be prevented ordetected.
11. The Company did not maintain effective control over the monitoring of financial statementaccounts to value and record them in a timely, accurate and complete manner. Specifically, controls werenot designed and in place to:
i. compare revenue recorded to amounts billed to clients;
ii. identify contracts with potential client rebates and vendor incentives;
iii. analyze collectibility of aged accounts receivable or expenditures billable to clients;
iv. compare billable job costs to client cost estimates;
v. review fixed asset records for under utilized, missing or fully depreciated assets;
vi. ensure that the underlying records support liabilities related to employee compensation,including an inventory of employee benefit plans, the calculation of pension liabilities andchanges made to benefit plans which impact the Company's compliance with certainemployment and tax regulations;
vii. review intercompany balances and transactions for appropriate classification;
viii. review cash, foreign currency translation adjustments and other derivative transactions;
ix. analyze accrued expenses, including restructuring charges;
x. test tangible and intangible assets for impairments and appropriate economic lives;
xi. review of other asset and other liability accounts, equity and revenue and expense accounts forappropriate activity or roll-forward of balances; and
xii. analyze amounts recorded as income tax liabilities or deferred tax assets or liabilities and therelated income tax provision or benefit.
This deficiency resulted in a restatement of the first three interim periods of 2005, and misstatementsand audit adjustments, including out of period adjustments, to the 2005 annual and interim consolidatedfinancial statements, which impacted substantially all accounts in the Company's consolidated financialstatements. Additionally, this control deficiency could result in a misstatement of account balances ordisclosure, including the aforementioned accounts above, that would result in a material misstatement tothe annual or interim consolidated financial statements that would not be prevented or detected.
12. The Company did not maintain effective controls over the period end financial reporting process.Specifically, controls were not designed and in place to ensure that (i) journal entries, both recurring andnon-recurring, were reviewed and approved, (ii) timely and complete review procedures were properlyperformed over the accounts and disclosures in our financial statements by personnel with knowledgesufficient to reach appropriate accounting conclusions, and (iii) a reconciliation of its legal entity financialresults to the financial results recorded in the consolidated financial statements was performed. Thisdeficiency resulted in a restatement of the first three interim periods of 2005, and misstatements and auditadjustments, including the out of period adjustments, to the 2005 annual and interim consolidated financialstatements, which impacted substantially all accounts in the Company's consolidated financial statements.Additionally, this control deficiency could result in a misstatement of account balances or disclosure thatwould result in a material misstatement to the annual or interim consolidated financial statements thatwould not be prevented or detected.
13. The Company did not maintain effective controls over the safeguarding of assets. Controls werenot designed and in place to segregate responsibility and authority between initiating, processing andrecording of transactions which has impacted many accounts in the Company's consolidated financialstatements. This deficiency has resulted in certain improper transactions being entered into and thosetransactions being recorded or not recorded in the Company's financial statements. This deficiency resulted
88

in a restatement of the first three interim periods of 2005, and misstatements and audit adjustments,including the out of period adjustments, to the 2005 annual and interim consolidated financial statements,which impacted substantially all accounts in the Company's consolidated financial statements. Addition-ally, this control deficiency could result in a misstatement of account balances or disclosure that wouldresult in a material misstatement to the annual or interim consolidated financial statements that would notbe prevented or detected.
14. The Company did not maintain effective controls over certain independent service providers.Specifically, the Company was unable to document, test, and evaluate controls at third party vendors towhich the Company outsources certain payroll processing services in North America. This deficiency didnot result in an adjustment to the consolidated financial statements. However, this deficiency could resultin a misstatement of account balances or disclosure, including salaries and related expenses and accruedliabilities that would result in a material misstatement to the annual or interim consolidated financialstatements that would not be prevented or detected.
15. The Company did not maintain effective controls over access to the Company's financialapplications and data as well as controls over changes to financial applications. Specifically, controls werenot designed and in place to ensure that access to certain financial applications and data at certainlocations were adequately restricted or changes to financial applications were documented or tested. Inaddition, the Company did not adequately monitor the access to financial applications and data. Thisdeficiency has had a pervasive impact on the Company's information technology control environment.Additionally, this deficiency could result in a misstatement of account balances or disclosure tosubstantially all accounts that would result in a material misstatement to the annual or interimconsolidated financial statements that would not be prevented or detected.
16. The Company did not maintain effective controls over spreadsheets used in the Company'sfinancial reporting process. Specifically, controls were not designed and in place to ensure that access wasrestricted to appropriate personnel, and that unauthorized modification of the data or formulas withinspreadsheets was prevented. This deficiency did not result in material adjustments to the consolidatedfinancial statements. However, this deficiency could result in a misstatement of account balances ordisclosure to substantially all accounts that would result in a material misstatement to the annual orinterim consolidated financial statements that would not be prevented or detected.
Information and Communication
17. The Company did not maintain effective controls over the communication of policies andprocedures. Specifically, controls were not designed and in place to ensure corporate communications,including the Company's code of conduct, were received by personnel across the Company. This deficiencyhas had a pervasive impact on the Company's control environment and has contributed to the materialweaknesses described above. Additionally, this deficiency could result in a misstatement of accountbalances or disclosure to substantially all accounts that would result in a material misstatement to theannual or interim consolidated financial statements that would not be prevented or detected.
Monitoring
18. The Company did not maintain effective controls over monitoring the performance of properapplication of the Company's internal controls over financial reporting and related policies and procedures.Specifically, controls were not designed and in place to ensure that the Company identifies and remediatescontrol deficiencies timely. This deficiency has had a pervasive impact on the Company's controlenvironment and has contributed to the material weaknesses described above. Additionally, this deficiencycould result in a misstatement of account balances or disclosure to substantially all accounts that wouldresult in a material misstatement to the annual or interim consolidated financial statements that would notbe prevented or detected.
89

Management's assessment of the effectiveness of the Company's internal control over financialreporting as of December 31, 2005 has been audited by PricewaterhouseCoopers LLP (PwC), ourindependent registered public accounting firm. Refer to PwC's report within Item 8.
REMEDIATION OF MATERIAL WEAKNESSES ININTERNAL CONTROL OVER FINANCIAL REPORTING
We continue to have extensive work remaining to remedy the material weaknesses described above.The magnitude of the work is attributable partly to our significantly decentralized structure and thenumber of our disparate accounting systems of varying quality and sophistication. We continue the processof developing and implementing a remediation plan to address our deficiencies and expect that this planwill extend into the 2006 fiscal year and beyond. The following list describes remedial actions that havebeen implemented to date or continue to be implemented across the Company's operating units.
Continuing meetings with management of our financial and operating units to ensure theirunderstanding of the procedures to be followed and requirements to be met prior to executing requiredinternal management certification letters to accompany the financial statements they submit. Thesemeetings have been occurring and will continue.
Requiring Interpublic Group Code of Conduct compliance certifications by all significant managementof the Company and our agencies prior to the submission of the financial and operating units'financial statements.
Continuing a focused effort to establish controls to deter and detect fraud with significant oversightand input by our Board of Directors and Audit Committee, including, but not limited to, ensuringproper follow-up and resolution of whistleblowers' assertions.
Established standard global documentation and testing requirements of internal controls over financialreporting to ensure consistency in the overall evaluation of internal controls within our operating unitsand to enable focused future remediation efforts related to our control deficiencies.
Implementing a new enterprise-wide resource-planning software system, starting with initialimplementations at select entities during the latter part of 2005 with continuing rollouts through early2007. This implementation will allow for more transparency in the reporting of our results ofoperations and will also allow for numerous controls to be automated as part of the system.
Continuing the development throughout 2006 of a shared service center program to consolidatevarious financial transactional functions to attain efficiencies and controls surrounding these activities.
Reorganizing and restructuring our Controllers and Finance Group by hiring additional qualifiedpersonnel and revising the reporting structure. We are also continuing our assessment of theaccounting and finance departments at our agencies and, in some cases, have already either replacedpersonnel or hired additional resources. This assessment is continuing and the remediation willcontinue throughout 2006 before our agencies are appropriately staffed to levels we considerappropriate.
With assistance from the Corporate Controllers Group and the Internal Control Group, we continueto conduct surprise audits of selected income statement items and balance sheet accounts at variousfinancial and operating units to ensure accuracy of results.
Updating and continuing to enhance accounting and finance-related policies and procedures. Themaintenance of policies is a constantly evolving process subject to continuous update, and in thatregard, we have recently issued or in the process of updated policies with respect to revenuerecognition, accounting for expenditures under real estate leases, and the processing of inter-companytransactions among others.
90

Maintaining an ongoing program of continuing professional education for financial employees invarious areas and disciplines, including revenue recognition, lease accounting, financial reporting andethics.
Established standard global manual documentation requirements at the local reporting levels for theassessment of processing and monitoring of intercompany transactions, appropriate revenue recognitionand the proper recognition of expenditures under real estate leases.
Establishing and continuing to improve ongoing analytical review procedures, at the local reportinglevels as well as the consolidated level, as part of the monthly closing process and continuing thedetailed monthly results analysis and meetings with all significant entities by the CorporateControllers Group.
Establishing revised quarterly reporting for tax accounts, update and enhance tax related policies andprocedures, and increase tax training at regional and local levels. We also hired a team ofprofessionals solely responsible for interacting with all levels of financial personnel in the agencies toensure that the tax reporting information is being provided timely and accurately.
Engaging outside professional tax advisors to review local income tax returns of each subsidiaryoutside of the U.S. prior to filing in order to ensure they are filed on a timely basis and are preparedin accordance with local law and regulations.
Requiring written approval of a corporate committee consisting of senior representatives of the humanresources, tax, legal and accounting functions for any non-traditional employment arrangement orpayroll practice. In addition, all existing non-traditional employment arrangements must be reviewedby senior agency financial executives and a formal plan proposed to eliminate those arrangementswhich are not supportable under both local law and practice as well as our policies and procedures.
Given the presence of material weaknesses in our internal control over financial reporting, there ismore than a remote likelihood that a material misstatement of the annual or interim financial statementswill not be prevented or detected. Our financial reporting process includes extensive procedures weundertake so that our published financial statements are presented in accordance with GAAP,notwithstanding the material weaknesses in internal control. We have significantly expanded our year-endclosing procedures. We have expanded our review of customer contracts and agreements to addressrevenue recognition issues. In addition, we have other procedures to monitor account analysis, specificallyrelated to liabilities arising from vendor discounts or credits, future obligations related to prior acquisitions,internal investigations and international compensation arrangements, as well as account reconciliations. Allof the above mentioned procedures have been designed so that our consolidated financial statements arepresented in accordance with GAAP. As a result, management, to the best of its knowledge, believes that(i) this report does not contain any untrue statements of a material fact or omits any material fact and(ii) the consolidated financial statements and other financial information included in this report for theyear ended December 31, 2005 have been prepared in conformity with GAAP and fairly present in allmaterial respects our financial condition, results of operations and cash flows.
91

Report of Independent Registered Public Accounting Firm
To the Board of Directors and Stockholders ofThe Interpublic Group of Companies, Inc.:
We have completed an integrated audit of The Interpublic Group of Companies, Inc.'s 2005 consolidatedfinancial statements and of its internal control over financial reporting as of December 31, 2005 and auditsof its 2004 and 2003 consolidated financial statements in accordance with the standards of the PublicCompany Accounting Oversight Board (United States). Our opinions, based on our audits, are presentedbelow.
Consolidated financial statements and financial statement schedule
In our opinion, the accompanying consolidated balance sheets and the related consolidated statements ofoperations, of stockholders' equity and of cash flows present fairly, in all material respects, the financialposition of The Interpublic Group of Companies, Inc. and its subsidiaries at December 31, 2005 and 2004,and the results of their operations and their cash flows for each of the three years in the period endedDecember 31, 2005 in conformity with accounting principles generally accepted in the United States ofAmerica. In addition, in our opinion, the financial statement schedule listed in the index appearing underItem 8 presents fairly, in all material respects, the information set forth therein when read in conjunctionwith the related consolidated financial statements. These financial statements and financial statementschedule are the responsibility of the Company's management. Our responsibility is to express an opinionon these financial statements and financial statement schedule based on our audits. We conducted ouraudits of these statements in accordance with the standards of the Public Company Accounting OversightBoard (United States). Those standards require that we plan and perform the audit to obtain reasonableassurance about whether the financial statements are free of material misstatement. An audit of financialstatements includes examining, on a test basis, evidence supporting the amounts and disclosures in thefinancial statements, assessing the accounting principles used and significant estimates made bymanagement, and evaluating the overall financial statement presentation. We believe that our auditsprovide a reasonable basis for our opinion.
As described in Note 8 to the consolidated financial statements the Company has changed the date of itsannual goodwill impairment test from September 30 to October 1.
Internal control over financial reporting
Also, we have audited management's assessment, included in Management's Assessment on InternalControl Over Financial Reporting appearing under Item 8, that The Interpublic Group of Companies, Inc.did not maintain effective internal control over financial reporting as of December 31, 2005, because theCompany did not maintain: (1) an effective control environment; (2) effective controls over theaccounting for purchase business combinations; (3) effective controls over the accuracy and presentationand disclosure of recording of revenue; (4) effective controls to ensure that certain financial statementtransactions were appropriately initiated, authorized, processed, documented and accurately recorded;(5) effective controls over the complete and accurate recording of leases in accordance with GAAP;(6) effective controls over the accounting for income taxes in domestic operations and operations outsideof the United States to ensure amounts are accurately accounted for in accordance with GAAP;(7) effective controls over reporting local income tax in the local statutory accounts or local income taxreturns in operations outside of the United States; (8) effective controls relating to the completeness andaccuracy of local payroll and compensation related liabilities in certain operations outside of the UnitedStates; (9) effective controls over the accuracy and completeness of the processing and monitoring ofintercompany transactions, including appropriate authorization for intercompany charges; (10) effectivecontrols over the reconciliation of certain financial statement accounts; (11) effective control over themonitoring of financial statement accounts to value and record them in a timely, accurate and completemanner; (12) effective controls over the period end financial reporting process; (13) effective controls overthe safeguarding of assets; (14) effective controls over certain independent service providers; (15) effective
92

controls over access to the Company's financial applications and data as well as controls over changes tofinancial applications; (16) effective controls over spreadsheets used in the Company's financial reportingprocess; (17) effective controls over the communication of policies and procedures; and (18) effectivecontrols over monitoring the performance of proper application of the Company's internal controls overfinancial reporting and related policies and procedures, based on criteria established in Internal Control ÌIntegrated Framework issued by the Committee of Sponsoring Organizations of the Treadway Commission(COSO). The Company's management is responsible for maintaining effective internal control overfinancial reporting and for its assessment of the effectiveness of internal control over financial reporting.Our responsibility is to express opinions on management's assessment and on the effectiveness of theCompany's internal control over financial reporting based on our audit.
We conducted our audit of internal control over financial reporting in accordance with the standards of thePublic Company Accounting Oversight Board (United States). Those standards require that we plan andperform the audit to obtain reasonable assurance about whether effective internal control over financialreporting was maintained in all material respects. An audit of internal control over financial reportingincludes obtaining an understanding of internal control over financial reporting, evaluating management'sassessment, testing and evaluating the design and operating effectiveness of internal control, andperforming such other procedures as we consider necessary in the circumstances. We believe that our auditprovides a reasonable basis for our opinions.
A company's internal control over financial reporting is a process designed to provide reasonable assuranceregarding the reliability of financial reporting and the preparation of financial statements for externalpurposes in accordance with generally accepted accounting principles. A company's internal control overfinancial reporting includes those policies and procedures that (i) pertain to the maintenance of recordsthat, in reasonable detail, accurately and fairly reflect the transactions and dispositions of the assets of thecompany; (ii) provide reasonable assurance that transactions are recorded as necessary to permitpreparation of financial statements in accordance with generally accepted accounting principles, and thatreceipts and expenditures of the company are being made only in accordance with authorizations ofmanagement and directors of the company; and (iii) provide reasonable assurance regarding prevention ortimely detection of unauthorized acquisition, use, or disposition of the company's assets that could have amaterial effect on the financial statements.
Because of its inherent limitations, internal control over financial reporting may not prevent or detectmisstatements. Also, projections of any evaluation of effectiveness to future periods are subject to the riskthat controls may become inadequate because of changes in conditions, or that the degree of compliancewith the policies or procedures may deteriorate.
A material weakness is a control deficiency, or combination of control deficiencies, that results in morethan a remote likelihood that a material misstatement of the annual or interim financial statements willnot be prevented or detected. The following material weaknesses have been identified and included inmanagement's assessment.
1. The Company did not maintain an effective control environment. Specifically, controls were notdesigned and in place to ensure compliance with the Company's policies and procedures, including thosecontained in the Company's Code of Conduct. Further, the Company did not maintain a sufficientcomplement of personnel with an appropriate level of accounting knowledge, experience and training in theapplication of GAAP commensurate with the Company's financial reporting requirements. The Companyalso failed to implement processes to ensure periodic monitoring of its existing internal control activitiesover financial reporting by placing heavy reliance on manual procedures without quality control review andother monitoring controls in place to adequately identify and assess significant risks that may impactfinancial statements and related disclosures. This deficiency results in a control environment that allowedinstances of falsified books and records, violations of laws, regulations and the Company's policies,misappropriation of assets and improper customer charges and dealings with vendors. This deficiencyresulted in a restatement of the first three interim periods of 2005, and misstatements and auditadjustments, including the out of period adjustments, to the 2005 annual and interim consolidated financial
93

statements. Additionally, this control deficiency could result in a misstatement of account balances ordisclosure that would result in a material misstatement to annual or interim consolidated financialstatements that would not be prevented or detected. This deficiency has had a pervasive impact on theCompany's control environment and has contributed to the material weaknesses described below.
2. The Company did not maintain effective controls over the accounting for purchase businesscombinations. Specifically, the Company did not have controls designed and in place to ensure thecompleteness, accuracy and valuation of revenue and expenses of acquired companies related to periodsafter the closing date of the transactions. In addition, the Company did not maintain effective controls toensure the completeness, accuracy and valuation of assets and liabilities recorded for compensatory earn-out and put arrangements or derivatives embedded within acquisition transactions. This deficiency resultedin a restatement of the first three interim periods of 2005, and misstatements and audit adjustments,including out of period adjustments, to the 2005 annual and interim consolidated financial statements,which primarily impacted accounts receivable, net, accounts payable, minority interests in consolidatedsubsidiaries, goodwill, and other income. Additionally, this control deficiency could result in amisstatement of account balances or disclosure, including, but not limited to, the aforementioned accountsabove that would result in a material misstatement to the annual or interim consolidated financialstatements that would not be prevented or detected.
3. The Company did not maintain effective controls over the accuracy and presentation and disclosure ofrecording of revenue. Specifically, controls were not designed and in place to ensure that customercontracts were authorized, that customer contracts were analyzed to select the appropriate method ofrevenue recognition, and billable job costs were compared to client cost estimates to ensure that noamounts were owed to clients. In addition, controls were not designed and in place to ensure that revenuetransactions were analyzed for appropriate presentation and disclosure of billable client pass-throughexpenses or for recognition of revenue on a gross or net basis. This deficiency resulted in a restatement ofthe first three interim periods of 2005, and misstatements and audit adjustments, including out of periodadjustments, to the 2005 annual and interim consolidated financial statements, which impacted revenue,office and general expenses, accounts receivable, net, expenditures billable to clients, accounts payable, andaccrued liabilities. Additionally, this control deficiency could result in a misstatement of account balancesor disclosure, including the aforementioned accounts above, that would result in a material misstatement tothe annual or interim consolidated financial statements that would not be prevented or detected.
4. The Company did not maintain effective controls to ensure that certain financial statement transactionswere appropriately initiated, authorized, processed, documented and accurately recorded. This wasprimarily evident in the following specific areas:
i. client contracts, and client or vendor incentives and rebates;
ii. accounts receivable transactions, expenditures and fees billable to clients;
iii. fixed assets purchases, disposals, depreciable lives and leases;
iv. accounts payable and accrued liabilities;
v. payments made for employee and executive compensation and payments for benefits;
vi. cash and cash equivalents, wire transfers, and foreign currency transactions;
vii. arrangements with derivative instruments;
viii. intercompany transactions;
ix. purchase of equity of investments in unconsolidated entities;
x. purchase, disposal or write-off of intangible assets; and
xi. debt and equity transactions.
This deficiency resulted in a restatement of the first three interim periods of 2005, and misstatements andaudit adjustments, including out of period adjustments, to the 2005 annual and interim consolidatedfinancial statements, which impacted substantially all accounts in the consolidated financial statements.Additionally, this control deficiency could result in a misstatement of account balances or disclosure,
94

including the aforementioned accounts above, that would result in a material misstatement to the annualor interim consolidated financial statements that would not be prevented or detected.
5. The Company did not maintain effective controls over the complete and accurate recording of leases inaccordance with GAAP. Specifically, the Company did not completely evaluate and accurately account forleases with rent holidays, rent escalation clauses, leasehold improvements or asset retirement obligationsassociated with real estate leases. This deficiency resulted in audit adjustments to the 2005 annual andinterim consolidated financial statements, which primarily impacted office and general expenses,restructuring charges, land, buildings and equipment, net, accrued liabilities and other non-currentliabilities. Additionally, this control deficiency could result in a misstatement of account balances ordisclosure, including the aforementioned accounts above, that would result in a material misstatement tothe annual or interim consolidated financial statements that would not be prevented or detected.
6. The Company did not maintain effective controls over the accounting for income taxes in domesticoperations and operations outside of the United States to ensure amounts are accurately accounted for inaccordance with GAAP. Specifically, the Company did not have controls designed and in place to ensurethat accounting personnel performed the following: recorded income tax provision between current anddeferred tax accounts in the balance sheet; reconciled prior years' income tax returns to the appropriateperiod income tax provision computations; timely identified income tax exposures and contingencies,including interest and penalties; and reconciled tax accounts to tax filings. This deficiency resulted inmisstatements and audit adjustments, including out of period adjustments, to the 2005 annual consolidatedfinancial statements, which impacted accrued liabilities, deferred income taxes, other non-current liabilitiesand the provision for income taxes. Additionally, this control deficiency could result in a misstatement ofaccount balances or disclosure, including the aforementioned accounts above, that would result in amaterial misstatement to the annual or interim consolidated financial statements that would not beprevented or detected.
7. The Company did not maintain effective controls over reporting local income tax in the local statutoryaccounts or local income tax returns in operations outside of the United States. Specifically, the Companydid not have controls designed and in place to ensure that accounting personnel adhere to policy andprocedures regarding compliance with local laws and regulations, and reconcile its accounts betweenGAAP and local income tax reporting. This allowed in prior periods the violation of local tax regulationsand incomplete and inaccurate recording of income taxes in the Company's consolidated financialstatements. This deficiency did not result in an audit adjustment to the consolidated financial statements.However, this deficiency could result in a misstatement of account balances or disclosure, including, butnot limited to, accrued liabilities, deferred income taxes, other non-current liabilities and the provision forincome taxes, that would result in a material misstatement to the annual or interim consolidated financialstatements that would not be prevented or detected.
8. The Company did not maintain effective controls relating to the completeness and accuracy of localpayroll and compensation related liabilities in certain operations outside of the United States. Specificallythe Company did not have controls designed and in place to identify instances where local reportingregulations and payroll tax withholding requirements were not met or identification of compensationpractices which were either not supportable under local law or were not fully in accordance with theCompany's policies and procedures. This allowed in prior periods improperly omitting, or instances ofpurposefully omitting, certain liabilities in the consolidated financial statements. This deficiency resulted ina restatement of the first three interim periods of 2005, and misstatements and audit adjustments,including out of period adjustments, to the 2005 annual and interim consolidated financial statements,which impacted salaries and related expenses and accrued liabilities. Additionally, this deficiency couldresult in a misstatement of account balances or disclosure, including the aforementioned accounts above,that would result in a material misstatement to the annual or interim consolidated financial statements thatwould not be prevented or detected.
9. The Company did not maintain effective controls over the accuracy and completeness of the processingand monitoring of intercompany transactions, including appropriate authorization for intercompany charges.
95

Specifically, controls were not designed and in place to ensure that intercompany balances were accuratelyclassified and completely reported in the Company's consolidated financial statements, and intercompanyconfirmations were not completed timely or accurately between the Company's agencies to ensure properelimination as part of the consolidation process. This deficiency resulted in immaterial audit adjustments tothe 2005 annual and interim consolidated financial statements. Additionally, this control deficiency couldresult in a misstatement of account balances or disclosure that would result in a material misstatement tothe annual or interim consolidated financial statements that would not be prevented or detected.
10. The Company did not maintain effective controls over the reconciliation of certain financial statementaccounts. Specifically, controls were not designed and in place to ensure that the Company's accounts wereaccurate and agreed to detailed support. This deficiency resulted in a restatement of the first three interimperiods of 2005, and misstatements and audit adjustments, including the out of period adjustments, to the2005 annual and interim consolidated financial statements, which impacted substantially all accounts in theCompany's consolidated financial statements. Additionally, this control deficiency could result in amisstatement of account balances or disclosure that would result in a material misstatement to the annualor interim consolidated financial statements that would not be prevented or detected.
11. The Company did not maintain effective control over the monitoring of financial statement accounts tovalue and record them in a timely, accurate and complete manner. Specifically, controls were not designedand in place to:
i. compare revenue recorded to amounts billed to clients;
ii. identify contracts with potential client rebates and vendor incentives;
iii. analyze collectibility of aged accounts receivable or expenditures billable to clients;
iv. compare billable job costs to client cost estimates;
v. review fixed asset records for under utilized, missing or fully depreciated assets;
vi. ensure that the underlying records support liabilities related to employee compensation,including an inventory of employee benefit plans, the calculation of pension liabilities andchanges made to benefit plans which impact the Company's compliance with certainemployment and tax regulations;
vii. review intercompany balances and transactions for appropriate classification;
viii. review cash, foreign currency translation adjustments and other derivative transactions;
ix. analyze accrued expenses, including restructuring charges;
x. test tangible and intangible assets for impairments and appropriate economic lives;
xi. review of other asset and other liability accounts, equity and revenue and expenseaccounts for appropriate activity or roll-forward of balances; and
xii. analyze amounts recorded as income tax liabilities or deferred tax assets or liabilities andthe related income tax provision or benefit.
This deficiency resulted in a restatement of the first three interim periods of 2005, and misstatements andaudit adjustments, including out of period adjustments, to the 2005 annual and interim consolidatedfinancial statements, which impacted substantially all accounts in the Company's consolidated financialstatements. Additionally, this control deficiency could result in a misstatement of account balances ordisclosure, including the aforementioned accounts above, that would result in a material misstatement tothe annual or interim consolidated financial statements that would not be prevented or detected.
12. The Company did not maintain effective controls over the period end financial reporting process.Specifically, controls were not designed and in place to ensure that (i) journal entries, both recurring andnon-recurring, were reviewed and approved, (ii) timely and complete review procedures were properlyperformed over the accounts and disclosures in our financial statements by personnel with knowledgesufficient to reach appropriate accounting conclusions, and (iii) a reconciliation of its legal entity financialresults to the financial results recorded in the consolidated financial statements was performed. Thisdeficiency resulted in a restatement of the first three interim periods of 2005, and misstatements and audit
96

adjustments, including the out of period adjustments, to the 2005 annual and interim consolidated financialstatements, which impacted substantially all accounts in the Company's consolidated financial statements.Additionally, this control deficiency could result in a misstatement of account balances or disclosure thatwould result in a material misstatement to the annual or interim consolidated financial statements thatwould not be prevented or detected.
13. The Company did not maintain effective controls over the safeguarding of assets. Controls were notdesigned and in place to segregate responsibility and authority between initiating, processing and recordingof transactions which has impacted many accounts in the Company's consolidated financial statements.This deficiency has resulted in certain improper transactions being entered into and those transactionsbeing recorded or not recorded in the Company's financial statements. This deficiency resulted in arestatement of the first three interim periods of 2005, and misstatements and audit adjustments, includingthe out of period adjustments, to the 2005 annual and interim consolidated financial statements, whichimpacted substantially all accounts in the Company's consolidated financial statements. Additionally, thiscontrol deficiency could result in a misstatement of account balances or disclosure that would result in amaterial misstatement to the annual or interim consolidated financial statements that would not beprevented or detected.
14. The Company did not maintain effective controls over certain independent service providers.Specifically, the Company was unable to document, test, and evaluate controls at third party vendors towhich the Company outsources certain payroll processing services in North America. This deficiency didnot result in an adjustment to the consolidated financial statements. However, this deficiency could resultin a misstatement of account balances or disclosure, including salaries and related expenses and accruedliabilities that would result in a material misstatement to the annual or interim consolidated financialstatements that would not be prevented or detected.
15. The Company did not maintain effective controls over access to the Company's financial applicationsand data as well as controls over changes to financial applications. Specifically, controls were not designedand in place to ensure that access to certain financial applications and data at certain locations wereadequately restricted or changes to financial applications were documented or tested. In addition, theCompany did not adequately monitor the access to financial applications and data. This deficiency has hada pervasive impact on the Company's information technology control environment. Additionally, thisdeficiency could result in a misstatement of account balances or disclosure to substantially all accountsthat would result in a material misstatement to the annual or interim consolidated financial statements thatwould not be prevented or detected.
16. The Company did not maintain effective controls over spreadsheets used in the Company's financialreporting process. Specifically, controls were not designed and in place to ensure that access was restrictedto appropriate personnel, and that unauthorized modification of the data or formulas within spreadsheetswas prevented. This deficiency did not result in material adjustments to the consolidated financialstatements. However, this deficiency could result in a misstatement of account balances or disclosure tosubstantially all accounts that would result in a material misstatement to the annual or interimconsolidated financial statements that would not be prevented or detected.
17. The Company did not maintain effective controls over the communication of policies and procedures.Specifically, controls were not designed and in place to ensure corporate communications, including theCompany's code of conduct, were received by personnel across the Company. This deficiency has had apervasive impact on the Company's control environment and has contributed to the material weaknessesdescribed above. Additionally, this deficiency could result in a misstatement of account balances ordisclosure to substantially all accounts that would result in a material misstatement to the annual orinterim consolidated financial statements that would not be prevented or detected.
18. The Company did not maintain effective controls over monitoring the performance of properapplication of the Company's internal controls over financial reporting and related policies and procedures.Specifically, controls were not designed and in place to ensure that the Company identifies and remediatescontrol deficiencies timely. This deficiency has had a pervasive impact on the Company's control
97

environment and has contributed to the material weaknesses described above. Additionally, this deficiencycould result in a misstatement of account balances or disclosure to substantially all accounts that wouldresult in a material misstatement to the annual or interim consolidated financial statements that would notbe prevented or detected.
These material weaknesses were considered in determining the nature, timing, and extent of audit testsapplied in our audit of the 2005 consolidated financial statements, and our opinion regarding theeffectiveness of the Company's internal control over financial reporting does not affect our opinion onthose consolidated financial statements.
In our opinion, management's assessment that the Company did not maintain effective internal controlover financial reporting as of December 31, 2005, is fairly stated, in all material respects, based on criteriaestablished in Internal Control Ì Integrated Framework issued by the COSO. Also, in our opinion,because of the effects of the material weaknesses described above on the achievement of the objectives ofthe control criteria, the Company has not maintained effective internal control over financial reporting asof December 31, 2005, based on criteria established in Internal Control Ì Integrated Framework issued bythe COSO.
/s/ PricewaterhouseCoopers LLP
New York, New YorkMarch 22, 2006
98

THE INTERPUBLIC GROUP OF COMPANIES, INC. AND SUBSIDIARIES
CONSOLIDATED STATEMENTS OF OPERATIONS(Amounts in Millions, Except Per Share Amounts)
Years Ended December 31,
2005 2004 2003
REVENUEÏÏÏÏÏÏÏÏÏÏÏÏÏÏÏÏÏÏÏÏÏÏÏÏÏÏÏÏÏÏÏÏÏÏÏÏÏÏÏÏÏÏÏÏÏÏÏÏÏÏÏÏ $6,274.3 $6,387.0 $6,161.7
OPERATING (INCOME) EXPENSES:
Salaries and related expenses ÏÏÏÏÏÏÏÏÏÏÏÏÏÏÏÏÏÏÏÏÏÏÏÏÏÏÏÏÏÏÏÏÏÏÏ 3,999.1 3,733.0 3,501.4
Office and general expenses ÏÏÏÏÏÏÏÏÏÏÏÏÏÏÏÏÏÏÏÏÏÏÏÏÏÏÏÏÏÏÏÏÏÏÏÏ 2,288.1 2,250.4 2,225.3
Restructuring (reversals) charges ÏÏÏÏÏÏÏÏÏÏÏÏÏÏÏÏÏÏÏÏÏÏÏÏÏÏÏÏÏÏÏ (7.3) 62.2 172.9
Long-lived asset impairment and other charges ÏÏÏÏÏÏÏÏÏÏÏÏÏÏÏÏÏÏÏÏ 98.6 322.2 294.0
Motorsports contract termination costs ÏÏÏÏÏÏÏÏÏÏÏÏÏÏÏÏÏÏÏÏÏÏÏÏÏÏÏ Ì 113.6 Ì
Total operating (income) expenses ÏÏÏÏÏÏÏÏÏÏÏÏÏÏÏÏÏÏÏÏÏÏÏÏÏÏÏÏÏÏÏÏ 6,378.5 6,481.4 6,193.6
OPERATING LOSSÏÏÏÏÏÏÏÏÏÏÏÏÏÏÏÏÏÏÏÏÏÏÏÏÏÏÏÏÏÏÏÏÏÏÏÏÏÏÏÏÏÏÏÏ (104.2) (94.4) (31.9)
EXPENSES AND OTHER INCOME:
Interest expense ÏÏÏÏÏÏÏÏÏÏÏÏÏÏÏÏÏÏÏÏÏÏÏÏÏÏÏÏÏÏÏÏÏÏÏÏÏÏÏÏÏÏÏÏÏÏ (181.9) (172.0) (206.6)
Debt prepayment penalty ÏÏÏÏÏÏÏÏÏÏÏÏÏÏÏÏÏÏÏÏÏÏÏÏÏÏÏÏÏÏÏÏÏÏÏÏÏÏ (1.4) (9.8) (24.8)
Interest incomeÏÏÏÏÏÏÏÏÏÏÏÏÏÏÏÏÏÏÏÏÏÏÏÏÏÏÏÏÏÏÏÏÏÏÏÏÏÏÏÏÏÏÏÏÏÏÏ 80.0 50.8 39.3
Investment impairments ÏÏÏÏÏÏÏÏÏÏÏÏÏÏÏÏÏÏÏÏÏÏÏÏÏÏÏÏÏÏÏÏÏÏÏÏÏÏÏ (12.2) (63.4) (71.5)
Litigation reversals (charges)ÏÏÏÏÏÏÏÏÏÏÏÏÏÏÏÏÏÏÏÏÏÏÏÏÏÏÏÏÏÏÏÏÏÏÏ Ì 32.5 (127.6)
Other income (expense) ÏÏÏÏÏÏÏÏÏÏÏÏÏÏÏÏÏÏÏÏÏÏÏÏÏÏÏÏÏÏÏÏÏÏÏÏÏÏÏ 33.1 (10.7) 50.3
Total expenses and other incomeÏÏÏÏÏÏÏÏÏÏÏÏÏÏÏÏÏÏÏÏÏÏÏÏÏÏÏÏÏÏÏÏÏÏ (82.4) (172.6) (340.9)
Loss from continuing operations before provision for income taxesÏÏÏÏÏ (186.6) (267.0) (372.8)
Provision for income taxes ÏÏÏÏÏÏÏÏÏÏÏÏÏÏÏÏÏÏÏÏÏÏÏÏÏÏÏÏÏÏÏÏÏÏÏÏÏ 81.9 262.2 242.7
Loss from continuing operations of consolidated companiesÏÏÏÏÏÏÏÏÏÏÏ (268.5) (529.2) (615.5)
Income applicable to minority interests (net of tax)ÏÏÏÏÏÏÏÏÏÏÏÏÏÏÏÏ (16.7) (21.5) (27.0)
Equity in net income of unconsolidated affiliates (net of tax)ÏÏÏÏÏÏÏÏ 13.3 5.8 2.4
Loss from continuing operations ÏÏÏÏÏÏÏÏÏÏÏÏÏÏÏÏÏÏÏÏÏÏÏÏÏÏÏÏÏÏÏÏÏÏ (271.9) (544.9) (640.1)
Income from discontinued operations (net of tax)ÏÏÏÏÏÏÏÏÏÏÏÏÏÏÏÏÏÏÏ 9.0 6.5 101.0
Net lossÏÏÏÏÏÏÏÏÏÏÏÏÏÏÏÏÏÏÏÏÏÏÏÏÏÏÏÏÏÏÏÏÏÏÏÏÏÏÏÏÏÏÏÏÏÏÏÏÏÏÏÏÏÏÏ (262.9) (538.4) (539.1)
Dividends on preferred stock ÏÏÏÏÏÏÏÏÏÏÏÏÏÏÏÏÏÏÏÏÏÏÏÏÏÏÏÏÏÏÏÏÏÏÏÏÏ 26.3 19.8 Ì
NET LOSS APPLICABLE TO COMMON STOCKHOLDERS ÏÏÏÏÏÏ $ (289.2) $ (558.2) $ (539.1)
Earnings (loss) per share of common stock:
Basic and diluted:
Continuing operations ÏÏÏÏÏÏÏÏÏÏÏÏÏÏÏÏÏÏÏÏÏÏÏÏÏÏÏÏÏÏÏÏÏÏÏÏÏÏÏÏÏ $ (0.70) $ (1.36) $ (1.66)
Discontinued operations ÏÏÏÏÏÏÏÏÏÏÏÏÏÏÏÏÏÏÏÏÏÏÏÏÏÏÏÏÏÏÏÏÏÏÏÏÏÏÏ 0.02 0.02 0.26
Total ÏÏÏÏÏÏÏÏÏÏÏÏÏÏÏÏÏÏÏÏÏÏÏÏÏÏÏÏÏÏÏÏÏÏÏÏÏÏÏÏÏÏÏÏÏÏÏÏÏÏÏÏÏÏÏÏÏ $ (0.68) $ (1.34) $ (1.40)
Weighted-average shares:
Basic and diluted ÏÏÏÏÏÏÏÏÏÏÏÏÏÏÏÏÏÏÏÏÏÏÏÏÏÏÏÏÏÏÏÏÏÏÏÏÏÏÏÏÏÏÏÏÏ 424.8 415.3 385.5
The accompanying notes are an integral part of these financial statements.
99

THE INTERPUBLIC GROUP OF COMPANIES, INC. AND SUBSIDIARIES
CONSOLIDATED BALANCE SHEETS(Amounts in Millions, Except Per Share Amounts)
December 31
2005 2004
ASSETS:Cash and cash equivalents ÏÏÏÏÏÏÏÏÏÏÏÏÏÏÏÏÏÏÏÏÏÏÏÏÏÏÏÏÏÏÏÏÏÏÏÏÏÏÏÏÏÏÏÏÏÏ $ 2,075.9 $ 1,550.4Marketable securities ÏÏÏÏÏÏÏÏÏÏÏÏÏÏÏÏÏÏÏÏÏÏÏÏÏÏÏÏÏÏÏÏÏÏÏÏÏÏÏÏÏÏÏÏÏÏÏÏÏÏ 115.6 420.0Accounts receivable, net of allowance of $105.5 and $136.1 ÏÏÏÏÏÏÏÏÏÏÏÏÏÏÏÏÏÏ 4,015.7 4,319.2Expenditures billable to clients ÏÏÏÏÏÏÏÏÏÏÏÏÏÏÏÏÏÏÏÏÏÏÏÏÏÏÏÏÏÏÏÏÏÏÏÏÏÏÏÏÏÏ 917.6 882.9Deferred income taxes ÏÏÏÏÏÏÏÏÏÏÏÏÏÏÏÏÏÏÏÏÏÏÏÏÏÏÏÏÏÏÏÏÏÏÏÏÏÏÏÏÏÏÏÏÏÏÏÏÏ 184.3 261.0Prepaid expenses and other current assets ÏÏÏÏÏÏÏÏÏÏÏÏÏÏÏÏÏÏÏÏÏÏÏÏÏÏÏÏÏÏÏÏÏ 188.3 184.6
Total current assets ÏÏÏÏÏÏÏÏÏÏÏÏÏÏÏÏÏÏÏÏÏÏÏÏÏÏÏÏÏÏÏÏÏÏÏÏÏÏÏÏÏÏÏÏÏÏÏÏÏÏ 7,497.4 7,618.1Land, buildings and equipment, net ÏÏÏÏÏÏÏÏÏÏÏÏÏÏÏÏÏÏÏÏÏÏÏÏÏÏÏÏÏÏÏÏÏÏÏÏÏÏ 650.0 722.9Deferred income taxes ÏÏÏÏÏÏÏÏÏÏÏÏÏÏÏÏÏÏÏÏÏÏÏÏÏÏÏÏÏÏÏÏÏÏÏÏÏÏÏÏÏÏÏÏÏÏÏÏÏ 297.3 274.2Investments ÏÏÏÏÏÏÏÏÏÏÏÏÏÏÏÏÏÏÏÏÏÏÏÏÏÏÏÏÏÏÏÏÏÏÏÏÏÏÏÏÏÏÏÏÏÏÏÏÏÏÏÏÏÏÏÏÏÏ 170.6 168.7Goodwill ÏÏÏÏÏÏÏÏÏÏÏÏÏÏÏÏÏÏÏÏÏÏÏÏÏÏÏÏÏÏÏÏÏÏÏÏÏÏÏÏÏÏÏÏÏÏÏÏÏÏÏÏÏÏÏÏÏÏÏÏÏ 3,030.9 3,141.6Other assets ÏÏÏÏÏÏÏÏÏÏÏÏÏÏÏÏÏÏÏÏÏÏÏÏÏÏÏÏÏÏÏÏÏÏÏÏÏÏÏÏÏÏÏÏÏÏÏÏÏÏÏÏÏÏÏÏÏÏ 299.0 328.2
Total non-current assets ÏÏÏÏÏÏÏÏÏÏÏÏÏÏÏÏÏÏÏÏÏÏÏÏÏÏÏÏÏÏÏÏÏÏÏÏÏÏÏÏÏÏÏÏÏÏ 4,447.8 4,635.6
TOTAL ASSETS ÏÏÏÏÏÏÏÏÏÏÏÏÏÏÏÏÏÏÏÏÏÏÏÏÏÏÏÏÏÏÏÏÏÏÏÏÏÏÏÏÏÏÏÏÏÏÏÏÏÏÏÏÏ $11,945.2 $12,253.7
LIABILITIES:Accounts payable ÏÏÏÏÏÏÏÏÏÏÏÏÏÏÏÏÏÏÏÏÏÏÏÏÏÏÏÏÏÏÏÏÏÏÏÏÏÏÏÏÏÏÏÏÏÏÏÏÏÏÏÏÏ $ 4,245.4 $ 4,733.5Accrued liabilities ÏÏÏÏÏÏÏÏÏÏÏÏÏÏÏÏÏÏÏÏÏÏÏÏÏÏÏÏÏÏÏÏÏÏÏÏÏÏÏÏÏÏÏÏÏÏÏÏÏÏÏÏÏ 2,554.3 2,485.2Short-term debtÏÏÏÏÏÏÏÏÏÏÏÏÏÏÏÏÏÏÏÏÏÏÏÏÏÏÏÏÏÏÏÏÏÏÏÏÏÏÏÏÏÏÏÏÏÏÏÏÏÏÏÏÏÏÏ 56.8 325.9
Total current liabilities ÏÏÏÏÏÏÏÏÏÏÏÏÏÏÏÏÏÏÏÏÏÏÏÏÏÏÏÏÏÏÏÏÏÏÏÏÏÏÏÏÏÏÏÏÏÏÏ 6,856.5 7,544.6Long-term debt ÏÏÏÏÏÏÏÏÏÏÏÏÏÏÏÏÏÏÏÏÏÏÏÏÏÏÏÏÏÏÏÏÏÏÏÏÏÏÏÏÏÏÏÏÏÏÏÏÏÏÏÏÏÏÏ 2,183.0 1,936.0Deferred compensation and employee benefits ÏÏÏÏÏÏÏÏÏÏÏÏÏÏÏÏÏÏÏÏÏÏÏÏÏÏÏÏÏ 592.1 590.7Other non-current liabilitiesÏÏÏÏÏÏÏÏÏÏÏÏÏÏÏÏÏÏÏÏÏÏÏÏÏÏÏÏÏÏÏÏÏÏÏÏÏÏÏÏÏÏÏÏÏ 319.0 408.9Minority interests in consolidated subsidiaries ÏÏÏÏÏÏÏÏÏÏÏÏÏÏÏÏÏÏÏÏÏÏÏÏÏÏÏÏÏÏ 49.3 55.2
Total non-current liabilities ÏÏÏÏÏÏÏÏÏÏÏÏÏÏÏÏÏÏÏÏÏÏÏÏÏÏÏÏÏÏÏÏÏÏÏÏÏÏÏÏÏÏÏ 3,143.4 2,990.8
TOTAL LIABILITIESÏÏÏÏÏÏÏÏÏÏÏÏÏÏÏÏÏÏÏÏÏÏÏÏÏÏÏÏÏÏÏÏÏÏÏÏÏÏÏÏÏÏÏÏÏÏÏÏÏ 9,999.9 10,535.4
Commitments and contingencies (Note 21)STOCKHOLDERS' EQUITY:
Preferred stock, no par value, shares authorized: 20.0Series A shares issued and outstanding: 2005 Ì 7.5; 2004 Ì 7.5 ÏÏÏÏÏÏÏÏÏÏÏÏ 373.7 373.7Series B shares issued and outstanding: 2005 Ì 0.5 ÏÏÏÏÏÏÏÏÏÏÏÏÏÏÏÏÏÏÏÏÏÏÏ 525.0 Ì
Common stock, $0.10 par value, shares authorized: 800.0 ÏÏÏÏÏÏÏÏÏÏÏÏÏÏÏÏÏÏÏÏ 43.0 42.5shares issued: 2005 Ì 430.3; 2004 Ì 424.9shares outstanding: 2005 Ì 429.9; 2004 Ì 424.5
Additional paid-in capitalÏÏÏÏÏÏÏÏÏÏÏÏÏÏÏÏÏÏÏÏÏÏÏÏÏÏÏÏÏÏÏÏÏÏÏÏÏÏÏÏÏÏÏÏÏÏÏ 2,224.1 2,208.9Accumulated deficit ÏÏÏÏÏÏÏÏÏÏÏÏÏÏÏÏÏÏÏÏÏÏÏÏÏÏÏÏÏÏÏÏÏÏÏÏÏÏÏÏÏÏÏÏÏÏÏÏÏÏÏ (841.1) (578.2)Accumulated other comprehensive loss, net of tax ÏÏÏÏÏÏÏÏÏÏÏÏÏÏÏÏÏÏÏÏÏÏÏÏÏÏ (276.0) (248.6)
2,048.7 1,798.3Less:Treasury stock, at cost: 2005 Ì 0.4 shares; 2004 Ì 0.4 shares ÏÏÏÏÏÏÏÏÏÏÏÏÏÏÏÏ (14.0) (14.0)Unamortized deferred compensationÏÏÏÏÏÏÏÏÏÏÏÏÏÏÏÏÏÏÏÏÏÏÏÏÏÏÏÏÏÏÏÏÏÏÏÏÏÏ (89.4) (66.0)
TOTAL STOCKHOLDERS' EQUITYÏÏÏÏÏÏÏÏÏÏÏÏÏÏÏÏÏÏÏÏÏÏÏÏÏÏÏÏÏÏÏÏÏÏÏ 1,945.3 1,718.3
TOTAL LIABILITIES AND STOCKHOLDERS' EQUITYÏÏÏÏÏÏÏÏÏÏÏÏÏÏÏÏÏ $11,945.2 $12,253.7
The accompanying notes are an integral part of these financial statements.
100

THE INTERPUBLIC GROUP OF COMPANIES, INC. AND SUBSIDIARIES
CONSOLIDATED STATEMENTS OF CASH FLOWS(Amounts in Millions)
Years Ended December 31,
2005 2004 2003
(Revised Ì See Note 1)
CASH FLOWS FROM OPERATING ACTIVITIES:Net lossÏÏÏÏÏÏÏÏÏÏÏÏÏÏÏÏÏÏÏÏÏÏÏÏÏÏÏÏÏÏÏÏÏÏÏÏÏÏÏÏÏÏÏÏÏÏÏÏÏÏÏÏÏÏÏÏÏÏÏÏÏÏÏÏÏÏÏÏÏÏÏÏÏÏÏÏÏÏÏ $ (262.9) $ (538.4) $ (539.1)Income from discontinued operations, net of taxÏÏÏÏÏÏÏÏÏÏÏÏÏÏÏÏÏÏÏÏÏÏÏÏÏÏÏÏÏÏÏÏÏÏÏÏÏÏÏÏÏÏÏÏÏ (9.0) (6.5) (101.0)Adjustments to reconcile net loss to cash provided by (used in) operating activities:
Depreciation and amortization of fixed assets and intangible assets ÏÏÏÏÏÏÏÏÏÏÏÏÏÏÏÏÏÏÏÏÏÏÏÏÏÏÏ 168.8 185.1 216.5Provision for bad debtÏÏÏÏÏÏÏÏÏÏÏÏÏÏÏÏÏÏÏÏÏÏÏÏÏÏÏÏÏÏÏÏÏÏÏÏÏÏÏÏÏÏÏÏÏÏÏÏÏÏÏÏÏÏÏÏÏÏÏÏÏÏÏÏÏ 16.9 36.7 32.6Amortization of restricted stock and other non-cash compensationÏÏÏÏÏÏÏÏÏÏÏÏÏÏÏÏÏÏÏÏÏÏÏÏÏÏÏÏ 42.3 31.4 38.8Amortization of bond discounts and deferred financing costs ÏÏÏÏÏÏÏÏÏÏÏÏÏÏÏÏÏÏÏÏÏÏÏÏÏÏÏÏÏÏÏÏ 9.1 22.9 35.0Deferred income tax provision ÏÏÏÏÏÏÏÏÏÏÏÏÏÏÏÏÏÏÏÏÏÏÏÏÏÏÏÏÏÏÏÏÏÏÏÏÏÏÏÏÏÏÏÏÏÏÏÏÏÏÏÏÏÏÏÏÏÏ 44.6 128.2 58.1Equity in (income) loss of unconsolidated affiliates, net of dividends ÏÏÏÏÏÏÏÏÏÏÏÏÏÏÏÏÏÏÏÏÏÏÏÏÏ (7.4) 3.5 6.4Income applicable to minority interests, net of tax ÏÏÏÏÏÏÏÏÏÏÏÏÏÏÏÏÏÏÏÏÏÏÏÏÏÏÏÏÏÏÏÏÏÏÏÏÏÏÏÏÏ 16.7 21.5 27.0Restructuring charges (reversals) Ì non-cashÏÏÏÏÏÏÏÏÏÏÏÏÏÏÏÏÏÏÏÏÏÏÏÏÏÏÏÏÏÏÏÏÏÏÏÏÏÏÏÏÏÏÏÏÏ (0.1) 6.7 ÌLong-lived asset impairment and other chargesÏÏÏÏÏÏÏÏÏÏÏÏÏÏÏÏÏÏÏÏÏÏÏÏÏÏÏÏÏÏÏÏÏÏÏÏÏÏÏÏÏÏÏÏ 98.6 322.2 294.0Investment impairments ÏÏÏÏÏÏÏÏÏÏÏÏÏÏÏÏÏÏÏÏÏÏÏÏÏÏÏÏÏÏÏÏÏÏÏÏÏÏÏÏÏÏÏÏÏÏÏÏÏÏÏÏÏÏÏÏÏÏÏÏÏÏÏ 12.2 63.4 71.5Litigation (reversals) chargesÏÏÏÏÏÏÏÏÏÏÏÏÏÏÏÏÏÏÏÏÏÏÏÏÏÏÏÏÏÏÏÏÏÏÏÏÏÏÏÏÏÏÏÏÏÏÏÏÏÏÏÏÏÏÏÏÏÏÏ Ì (12.5) 127.6Gain on sales of investments ÏÏÏÏÏÏÏÏÏÏÏÏÏÏÏÏÏÏÏÏÏÏÏÏÏÏÏÏÏÏÏÏÏÏÏÏÏÏÏÏÏÏÏÏÏÏÏÏÏÏÏÏÏÏÏÏÏÏÏ (16.3) (5.4) (47.9)(Gain) loss on sales of businessesÏÏÏÏÏÏÏÏÏÏÏÏÏÏÏÏÏÏÏÏÏÏÏÏÏÏÏÏÏÏÏÏÏÏÏÏÏÏÏÏÏÏÏÏÏÏÏÏÏÏÏÏÏÏÏ (10.1) 18.2 0.3OtherÏÏÏÏÏÏÏÏÏÏÏÏÏÏÏÏÏÏÏÏÏÏÏÏÏÏÏÏÏÏÏÏÏÏÏÏÏÏÏÏÏÏÏÏÏÏÏÏÏÏÏÏÏÏÏÏÏÏÏÏÏÏÏÏÏÏÏÏÏÏÏÏÏÏÏÏÏÏÏ 9.8 (6.6) 0.9
Change in assets and liabilities, net of acquisitions and disposals:Accounts receivableÏÏÏÏÏÏÏÏÏÏÏÏÏÏÏÏÏÏÏÏÏÏÏÏÏÏÏÏÏÏÏÏÏÏÏÏÏÏÏÏÏÏÏÏÏÏÏÏÏÏÏÏÏÏÏÏÏÏÏÏÏÏÏÏÏÏÏ 39.6 (38.4) 385.0Expenditures billable to clients ÏÏÏÏÏÏÏÏÏÏÏÏÏÏÏÏÏÏÏÏÏÏÏÏÏÏÏÏÏÏÏÏÏÏÏÏÏÏÏÏÏÏÏÏÏÏÏÏÏÏÏÏÏÏÏÏÏ (54.3) (34.4) (136.0)Prepaid expenses and other current assets ÏÏÏÏÏÏÏÏÏÏÏÏÏÏÏÏÏÏÏÏÏÏÏÏÏÏÏÏÏÏÏÏÏÏÏÏÏÏÏÏÏÏÏÏÏÏÏÏ (6.6) 50.6 83.1Accounts payable and accrued expensesÏÏÏÏÏÏÏÏÏÏÏÏÏÏÏÏÏÏÏÏÏÏÏÏÏÏÏÏÏÏÏÏÏÏÏÏÏÏÏÏÏÏÏÏÏÏÏÏÏÏ (152.4) 202.4 (122.1)Other non-current assets and liabilitiesÏÏÏÏÏÏÏÏÏÏÏÏÏÏÏÏÏÏÏÏÏÏÏÏÏÏÏÏÏÏÏÏÏÏÏÏÏÏÏÏÏÏÏÏÏÏÏÏÏÏÏ 40.3 14.2 77.8Net cash used in operating activities of discontinued operations ÏÏÏÏÏÏÏÏÏÏÏÏÏÏÏÏÏÏÏÏÏÏÏÏÏÏÏÏÏÏ Ì Ì (5.9)
Net cash provided by (used in) operating activities ÏÏÏÏÏÏÏÏÏÏÏÏÏÏÏÏÏÏÏÏÏÏÏÏÏÏÏÏÏÏÏÏÏÏÏÏÏÏ (20.2) 464.8 502.6
CASH FLOWS FROM INVESTING ACTIVITIES:Acquisitions, including deferred payments, net of cash acquiredÏÏÏÏÏÏÏÏÏÏÏÏÏÏÏÏÏÏÏÏÏÏÏÏÏÏÏÏÏÏ (91.7) (175.4) (224.6)Capital expenditures ÏÏÏÏÏÏÏÏÏÏÏÏÏÏÏÏÏÏÏÏÏÏÏÏÏÏÏÏÏÏÏÏÏÏÏÏÏÏÏÏÏÏÏÏÏÏÏÏÏÏÏÏÏÏÏÏÏÏÏÏÏÏÏÏÏÏ (140.7) (194.0) (159.6)Proceeds from sales of businesses and fixed assets ÏÏÏÏÏÏÏÏÏÏÏÏÏÏÏÏÏÏÏÏÏÏÏÏÏÏÏÏÏÏÏÏÏÏÏÏÏÏÏÏÏ 61.8 30.4 26.8Proceeds from sales of investments ÏÏÏÏÏÏÏÏÏÏÏÏÏÏÏÏÏÏÏÏÏÏÏÏÏÏÏÏÏÏÏÏÏÏÏÏÏÏÏÏÏÏÏÏÏÏÏÏÏÏÏÏÏÏ 70.4 43.0 128.8Purchases of investments ÏÏÏÏÏÏÏÏÏÏÏÏÏÏÏÏÏÏÏÏÏÏÏÏÏÏÏÏÏÏÏÏÏÏÏÏÏÏÏÏÏÏÏÏÏÏÏÏÏÏÏÏÏÏÏÏÏÏÏÏÏÏ (39.9) (34.3) (65.8)Maturities of short-term marketable securitiesÏÏÏÏÏÏÏÏÏÏÏÏÏÏÏÏÏÏÏÏÏÏÏÏÏÏÏÏÏÏÏÏÏÏÏÏÏÏÏÏÏÏÏÏÏ 690.5 1,148.4 177.0Purchases of short-term marketable securities ÏÏÏÏÏÏÏÏÏÏÏÏÏÏÏÏÏÏÏÏÏÏÏÏÏÏÏÏÏÏÏÏÏÏÏÏÏÏÏÏÏÏÏÏÏ (384.0) (1,372.7) (339.1)Proceeds from the sale of discontinued operations, net of cash sold ÏÏÏÏÏÏÏÏÏÏÏÏÏÏÏÏÏÏÏÏÏÏÏÏÏÏÏ Ì 10.0 376.7Net cash used in investing activities of discontinued operations ÏÏÏÏÏÏÏÏÏÏÏÏÏÏÏÏÏÏÏÏÏÏÏÏÏÏÏÏÏÏ Ì Ì (5.8)
Net cash provided by (used in) investing activities ÏÏÏÏÏÏÏÏÏÏÏÏÏÏÏÏÏÏÏÏÏÏÏÏÏÏÏÏÏÏÏÏÏÏÏÏÏÏ 166.4 (544.6) (85.6)
CASH FLOWS FROM FINANCING ACTIVITIES:Increase (decrease) in short-term bank borrowings ÏÏÏÏÏÏÏÏÏÏÏÏÏÏÏÏÏÏÏÏÏÏÏÏÏÏÏÏÏÏÏÏÏÏÏÏÏÏÏÏ (35.9) 7.0 (214.4)Payments of long-term debt ÏÏÏÏÏÏÏÏÏÏÏÏÏÏÏÏÏÏÏÏÏÏÏÏÏÏÏÏÏÏÏÏÏÏÏÏÏÏÏÏÏÏÏÏÏÏÏÏÏÏÏÏÏÏÏÏÏÏÏÏ (257.1) (843.0) (745.6)Proceeds from long-term debt ÏÏÏÏÏÏÏÏÏÏÏÏÏÏÏÏÏÏÏÏÏÏÏÏÏÏÏÏÏÏÏÏÏÏÏÏÏÏÏÏÏÏÏÏÏÏÏÏÏÏÏÏÏÏÏÏÏÏ 252.4 602.3 801.2Debt issuance costs and consent fees ÏÏÏÏÏÏÏÏÏÏÏÏÏÏÏÏÏÏÏÏÏÏÏÏÏÏÏÏÏÏÏÏÏÏÏÏÏÏÏÏÏÏÏÏÏÏÏÏÏÏÏÏ (17.9) (8.0) (27.0)Issuance of preferred stock, net of issuance costs ÏÏÏÏÏÏÏÏÏÏÏÏÏÏÏÏÏÏÏÏÏÏÏÏÏÏÏÏÏÏÏÏÏÏÏÏÏÏÏÏÏÏ 508.0 Ì 361.6Issuance of common stock, net of issuance costs ÏÏÏÏÏÏÏÏÏÏÏÏÏÏÏÏÏÏÏÏÏÏÏÏÏÏÏÏÏÏÏÏÏÏÏÏÏÏÏÏÏÏ 3.2 25.6 335.3Distributions to minority interests, net ÏÏÏÏÏÏÏÏÏÏÏÏÏÏÏÏÏÏÏÏÏÏÏÏÏÏÏÏÏÏÏÏÏÏÏÏÏÏÏÏÏÏÏÏÏÏÏÏÏÏÏ (22.6) (23.6) (26.4)Preferred stock dividends ÏÏÏÏÏÏÏÏÏÏÏÏÏÏÏÏÏÏÏÏÏÏÏÏÏÏÏÏÏÏÏÏÏÏÏÏÏÏÏÏÏÏÏÏÏÏÏÏÏÏÏÏÏÏÏÏÏÏÏÏÏÏ (20.0) (19.8) ÌNet cash used in financing activities of discontinued operations ÏÏÏÏÏÏÏÏÏÏÏÏÏÏÏÏÏÏÏÏÏÏÏÏÏÏÏÏÏÏ Ì Ì (1.7)
Net cash provided by (used in) financing activities ÏÏÏÏÏÏÏÏÏÏÏÏÏÏÏÏÏÏÏÏÏÏÏÏÏÏÏÏÏÏÏÏÏÏÏÏÏÏ 410.1 (259.5) 483.0
Effect of exchange rates on cash and cash equivalentsÏÏÏÏÏÏÏÏÏÏÏÏÏÏÏÏÏÏÏÏÏÏÏÏÏÏÏÏÏÏÏÏÏÏÏÏÏÏÏÏ (30.8) 17.8 18.7
Increase (decrease) in cash and cash equivalents ÏÏÏÏÏÏÏÏÏÏÏÏÏÏÏÏÏÏÏÏÏÏÏÏÏÏÏÏÏÏÏÏÏÏÏÏÏÏÏÏÏÏÏÏ 525.5 (321.5) 918.7Cash and cash equivalents at beginning of yearÏÏÏÏÏÏÏÏÏÏÏÏÏÏÏÏÏÏÏÏÏÏÏÏÏÏÏÏÏÏÏÏÏÏÏÏÏÏÏÏÏÏÏÏÏÏ 1,550.4 1,871.9 953.2
Cash and cash equivalents at end of yearÏÏÏÏÏÏÏÏÏÏÏÏÏÏÏÏÏÏÏÏÏÏÏÏÏÏÏÏÏÏÏÏÏÏÏÏÏÏÏÏÏÏÏÏÏÏÏÏÏÏÏ $2,075.9 $ 1,550.4 $1,871.9
SUPPLEMENTAL CASH FLOW INFORMATIONCash paid for interest ÏÏÏÏÏÏÏÏÏÏÏÏÏÏÏÏÏÏÏÏÏÏÏÏÏÏÏÏÏÏÏÏÏÏÏÏÏÏÏÏÏÏÏÏÏÏÏÏÏÏÏÏÏÏÏÏÏÏÏÏÏÏÏÏÏ $ 180.2 $ 162.8 $ 155.6Cash paid for income taxes, net of $34.1 and $47.3 of refunds in 2005 and 2004, respectivelyÏÏÏÏÏ $ 94.9 $ 66.2 $ 122.7
The accompanying notes are an integral part of these financial statements.
101

THE INTERPUBLIC GROUP OF COMPANIES, INC. AND SUBSIDIARIES
CONSOLIDATED STATEMENTS OF STOCKHOLDERS' EQUITY ANDCOMPREHENSIVE INCOME (LOSS)
(Amounts in Millions, Except Per Share Amounts)
Years Ended December 31,
2005 2004 2003
COMMON STOCKBalance at beginning of yearÏÏÏÏÏÏÏÏÏÏÏÏÏÏÏÏÏÏÏÏÏÏÏÏÏÏÏÏÏÏÏÏÏÏÏÏÏÏÏÏÏÏÏÏÏÏÏÏÏÏÏÏÏÏÏÏÏÏÏÏÏÏÏÏÏÏÏÏÏÏÏÏÏÏÏÏÏÏÏÏÏÏ $ 42.5 $ 41.8 $ 38.9
Restricted stock, net of forfeitures and amortization ÏÏÏÏÏÏÏÏÏÏÏÏÏÏÏÏÏÏÏÏÏÏÏÏÏÏÏÏÏÏÏÏÏÏÏÏÏÏÏÏÏÏÏÏÏÏÏÏÏÏÏÏÏÏÏÏÏÏÏÏ 0.4 0.3 ÌEmployee stock purchasesÏÏÏÏÏÏÏÏÏÏÏÏÏÏÏÏÏÏÏÏÏÏÏÏÏÏÏÏÏÏÏÏÏÏÏÏÏÏÏÏÏÏÏÏÏÏÏÏÏÏÏÏÏÏÏÏÏÏÏÏÏÏÏÏÏÏÏÏÏÏÏÏÏÏÏÏÏÏÏÏÏÏ Ì 0.1 0.1Issuance of common stock, net of fees ÏÏÏÏÏÏÏÏÏÏÏÏÏÏÏÏÏÏÏÏÏÏÏÏÏÏÏÏÏÏÏÏÏÏÏÏÏÏÏÏÏÏÏÏÏÏÏÏÏÏÏÏÏÏÏÏÏÏÏÏÏÏÏÏÏÏÏÏÏÏÏ Ì Ì 2.6Issuance of shares for acquisitions ÏÏÏÏÏÏÏÏÏÏÏÏÏÏÏÏÏÏÏÏÏÏÏÏÏÏÏÏÏÏÏÏÏÏÏÏÏÏÏÏÏÏÏÏÏÏÏÏÏÏÏÏÏÏÏÏÏÏÏÏÏÏÏÏÏÏÏÏÏÏÏÏÏÏÏ 0.1 0.2 0.2Issuance of common stock- litigation settlement ÏÏÏÏÏÏÏÏÏÏÏÏÏÏÏÏÏÏÏÏÏÏÏÏÏÏÏÏÏÏÏÏÏÏÏÏÏÏÏÏÏÏÏÏÏÏÏÏÏÏÏÏÏÏÏÏÏÏÏÏÏÏÏ Ì 0.1 Ì
Balance at end of yearÏÏÏÏÏÏÏÏÏÏÏÏÏÏÏÏÏÏÏÏÏÏÏÏÏÏÏÏÏÏÏÏÏÏÏÏÏÏÏÏÏÏÏÏÏÏÏÏÏÏÏÏÏÏÏÏÏÏÏÏÏÏÏÏÏÏÏÏÏÏÏÏÏÏÏÏÏÏÏÏÏÏÏÏÏÏÏ 43.0 42.5 41.8
PREFERRED STOCKBalance at beginning of year, Series A ÏÏÏÏÏÏÏÏÏÏÏÏÏÏÏÏÏÏÏÏÏÏÏÏÏÏÏÏÏÏÏÏÏÏÏÏÏÏÏÏÏÏÏÏÏÏÏÏÏÏÏÏÏÏÏÏÏÏÏÏÏÏÏÏÏÏÏÏÏÏÏÏÏ 373.7 373.7 Ì
Issuance of preferred stock ÏÏÏÏÏÏÏÏÏÏÏÏÏÏÏÏÏÏÏÏÏÏÏÏÏÏÏÏÏÏÏÏÏÏÏÏÏÏÏÏÏÏÏÏÏÏÏÏÏÏÏÏÏÏÏÏÏÏÏÏÏÏÏÏÏÏÏÏÏÏÏÏÏÏÏÏÏÏÏÏÏ Ì Ì 373.7
Balance at end of year, Series A ÏÏÏÏÏÏÏÏÏÏÏÏÏÏÏÏÏÏÏÏÏÏÏÏÏÏÏÏÏÏÏÏÏÏÏÏÏÏÏÏÏÏÏÏÏÏÏÏÏÏÏÏÏÏÏÏÏÏÏÏÏÏÏÏÏÏÏÏÏÏÏÏÏÏÏÏÏÏ 373.7 373.7 373.7
Balance at beginning of year, Series B ÏÏÏÏÏÏÏÏÏÏÏÏÏÏÏÏÏÏÏÏÏÏÏÏÏÏÏÏÏÏÏÏÏÏÏÏÏÏÏÏÏÏÏÏÏÏÏÏÏÏÏÏÏÏÏÏÏÏÏÏÏÏÏÏÏÏÏÏÏÏÏÏÏ Ì Ì ÌIssuance of preferred stock ÏÏÏÏÏÏÏÏÏÏÏÏÏÏÏÏÏÏÏÏÏÏÏÏÏÏÏÏÏÏÏÏÏÏÏÏÏÏÏÏÏÏÏÏÏÏÏÏÏÏÏÏÏÏÏÏÏÏÏÏÏÏÏÏÏÏÏÏÏÏÏÏÏÏÏÏÏÏÏÏÏ 525.0 Ì Ì
Balance at end of year, Series B ÏÏÏÏÏÏÏÏÏÏÏÏÏÏÏÏÏÏÏÏÏÏÏÏÏÏÏÏÏÏÏÏÏÏÏÏÏÏÏÏÏÏÏÏÏÏÏÏÏÏÏÏÏÏÏÏÏÏÏÏÏÏÏÏÏÏÏÏÏÏÏÏÏÏÏÏÏÏ 525.0 Ì Ì
ADDITIONAL PAID IN CAPITALBalance at beginning of yearÏÏÏÏÏÏÏÏÏÏÏÏÏÏÏÏÏÏÏÏÏÏÏÏÏÏÏÏÏÏÏÏÏÏÏÏÏÏÏÏÏÏÏÏÏÏÏÏÏÏÏÏÏÏÏÏÏÏÏÏÏÏÏÏÏÏÏÏÏÏÏÏÏÏÏÏÏÏÏÏÏÏ 2,208.9 2,076.0 1,797.8
Restricted stock, net of forfeitures and amortization ÏÏÏÏÏÏÏÏÏÏÏÏÏÏÏÏÏÏÏÏÏÏÏÏÏÏÏÏÏÏÏÏÏÏÏÏÏÏÏÏÏÏÏÏÏÏÏÏÏÏÏÏÏÏÏÏÏÏÏÏ 42.7 26.4 (3.9)Employee stock purchasesÏÏÏÏÏÏÏÏÏÏÏÏÏÏÏÏÏÏÏÏÏÏÏÏÏÏÏÏÏÏÏÏÏÏÏÏÏÏÏÏÏÏÏÏÏÏÏÏÏÏÏÏÏÏÏÏÏÏÏÏÏÏÏÏÏÏÏÏÏÏÏÏÏÏÏÏÏÏÏÏÏÏ 1.2 7.6 9.6Exercise of stock options, including tax benefit ÏÏÏÏÏÏÏÏÏÏÏÏÏÏÏÏÏÏÏÏÏÏÏÏÏÏÏÏÏÏÏÏÏÏÏÏÏÏÏÏÏÏÏÏÏÏÏÏÏÏÏÏÏÏÏÏÏÏÏÏÏÏÏÏ 2.1 7.8 1.6Issuance of common stock, net of fees ÏÏÏÏÏÏÏÏÏÏÏÏÏÏÏÏÏÏÏÏÏÏÏÏÏÏÏÏÏÏÏÏÏÏÏÏÏÏÏÏÏÏÏÏÏÏÏÏÏÏÏÏÏÏÏÏÏÏÏÏÏÏÏÏÏÏÏÏÏÏÏ Ì Ì 326.9Issuance of shares for acquisitions ÏÏÏÏÏÏÏÏÏÏÏÏÏÏÏÏÏÏÏÏÏÏÏÏÏÏÏÏÏÏÏÏÏÏÏÏÏÏÏÏÏÏÏÏÏÏÏÏÏÏÏÏÏÏÏÏÏÏÏÏÏÏÏÏÏÏÏÏÏÏÏÏÏÏÏ 12.9 33.9 (45.6)Issuance of common stock- litigation settlement ÏÏÏÏÏÏÏÏÏÏÏÏÏÏÏÏÏÏÏÏÏÏÏÏÏÏÏÏÏÏÏÏÏÏÏÏÏÏÏÏÏÏÏÏÏÏÏÏÏÏÏÏÏÏÏÏÏÏÏÏÏÏÏ Ì 72.6 ÌIssuance of preferred stock ÏÏÏÏÏÏÏÏÏÏÏÏÏÏÏÏÏÏÏÏÏÏÏÏÏÏÏÏÏÏÏÏÏÏÏÏÏÏÏÏÏÏÏÏÏÏÏÏÏÏÏÏÏÏÏÏÏÏÏÏÏÏÏÏÏÏÏÏÏÏÏÏÏÏÏÏÏÏÏÏÏ (17.4) Ì (12.1)Preferred stock dividends ÏÏÏÏÏÏÏÏÏÏÏÏÏÏÏÏÏÏÏÏÏÏÏÏÏÏÏÏÏÏÏÏÏÏÏÏÏÏÏÏÏÏÏÏÏÏÏÏÏÏÏÏÏÏÏÏÏÏÏÏÏÏÏÏÏÏÏÏÏÏÏÏÏÏÏÏÏÏÏÏÏÏ (26.3) (19.8) ÌOther ÏÏÏÏÏÏÏÏÏÏÏÏÏÏÏÏÏÏÏÏÏÏÏÏÏÏÏÏÏÏÏÏÏÏÏÏÏÏÏÏÏÏÏÏÏÏÏÏÏÏÏÏÏÏÏÏÏÏÏÏÏÏÏÏÏÏÏÏÏÏÏÏÏÏÏÏÏÏÏÏÏÏÏÏÏÏÏÏÏÏÏÏÏÏÏÏÏÏÏ Ì 4.4 1.7
Balance at end of yearÏÏÏÏÏÏÏÏÏÏÏÏÏÏÏÏÏÏÏÏÏÏÏÏÏÏÏÏÏÏÏÏÏÏÏÏÏÏÏÏÏÏÏÏÏÏÏÏÏÏÏÏÏÏÏÏÏÏÏÏÏÏÏÏÏÏÏÏÏÏÏÏÏÏÏÏÏÏÏÏÏÏÏÏÏÏÏ 2,224.1 2,208.9 2,076.0
RETAINED EARNINGS (ACCUMULATED DEFICIT)Balance at beginning of yearÏÏÏÏÏÏÏÏÏÏÏÏÏÏÏÏÏÏÏÏÏÏÏÏÏÏÏÏÏÏÏÏÏÏÏÏÏÏÏÏÏÏÏÏÏÏÏÏÏÏÏÏÏÏÏÏÏÏÏÏÏÏÏÏÏÏÏÏÏÏÏÏÏÏÏÏÏÏÏÏÏÏ (578.2) (39.8) 499.3
Net loss ÏÏÏÏÏÏÏÏÏÏÏÏÏÏÏÏÏÏÏÏÏÏÏÏÏÏÏÏÏÏÏÏÏÏÏÏÏÏÏÏÏÏÏÏÏÏÏÏÏÏÏÏÏÏÏÏÏÏÏÏÏÏÏÏÏÏÏÏÏÏÏÏÏÏÏÏÏÏÏÏÏÏÏÏÏÏÏÏÏÏÏÏÏÏÏÏÏ (262.9) (538.4) (539.1)
Balance at end of yearÏÏÏÏÏÏÏÏÏÏÏÏÏÏÏÏÏÏÏÏÏÏÏÏÏÏÏÏÏÏÏÏÏÏÏÏÏÏÏÏÏÏÏÏÏÏÏÏÏÏÏÏÏÏÏÏÏÏÏÏÏÏÏÏÏÏÏÏÏÏÏÏÏÏÏÏÏÏÏÏÏÏÏÏÏÏÏ (841.1) (578.2) (39.8)
ACCUMULATED OTHER COMPREHENSIVE LOSSBalance at beginning of yearÏÏÏÏÏÏÏÏÏÏÏÏÏÏÏÏÏÏÏÏÏÏÏÏÏÏÏÏÏÏÏÏÏÏÏÏÏÏÏÏÏÏÏÏÏÏÏÏÏÏÏÏÏÏÏÏÏÏÏÏÏÏÏÏÏÏÏÏÏÏÏÏÏÏÏÏÏÏÏÏÏÏ (248.6) (259.1) (395.2)
Adjustment for minimum pension liability (net of tax of ($1.0), ($5.4) and ($0.6) in 2005, 2004 and 2003, respectively) ÏÏÏ 1.4 (47.6) 4.0Changes in market value of securities available-for-sale, net of tax of ($7.8) in 2005 ÏÏÏÏÏÏÏÏÏÏÏÏÏÏÏÏÏÏÏÏÏÏÏÏÏÏÏÏÏÏÏÏ 14.6 3.4 10.1Foreign currency translation adjustment ÏÏÏÏÏÏÏÏÏÏÏÏÏÏÏÏÏÏÏÏÏÏÏÏÏÏÏÏÏÏÏÏÏÏÏÏÏÏÏÏÏÏÏÏÏÏÏÏÏÏÏÏÏÏÏÏÏÏÏÏÏÏÏÏÏÏÏÏÏÏ (43.0) 51.5 122.0Recognition of previously unrealized loss on securities available-for-sale, net of taxÏÏÏÏÏÏÏÏÏÏÏÏÏÏÏÏÏÏÏÏÏÏÏÏÏÏÏÏÏÏÏÏÏÏ (0.4) 3.2 Ì
Net other comprehensive loss adjustments ÏÏÏÏÏÏÏÏÏÏÏÏÏÏÏÏÏÏÏÏÏÏÏÏÏÏÏÏÏÏÏÏÏÏÏÏÏÏÏÏÏÏÏÏÏÏÏÏÏÏÏÏÏÏÏÏÏÏÏÏÏÏÏÏÏÏÏÏ (27.4) 10.5 136.1
Balance at end of yearÏÏÏÏÏÏÏÏÏÏÏÏÏÏÏÏÏÏÏÏÏÏÏÏÏÏÏÏÏÏÏÏÏÏÏÏÏÏÏÏÏÏÏÏÏÏÏÏÏÏÏÏÏÏÏÏÏÏÏÏÏÏÏÏÏÏÏÏÏÏÏÏÏÏÏÏÏÏÏÏÏÏÏÏÏÏÏ (276.0) (248.6) (259.1)
TREASURY STOCKBalance at beginning of yearÏÏÏÏÏÏÏÏÏÏÏÏÏÏÏÏÏÏÏÏÏÏÏÏÏÏÏÏÏÏÏÏÏÏÏÏÏÏÏÏÏÏÏÏÏÏÏÏÏÏÏÏÏÏÏÏÏÏÏÏÏÏÏÏÏÏÏÏÏÏÏÏÏÏÏÏÏÏÏÏÏÏ (14.0) (11.3) (119.2)
Issuance of shares for acquisitions ÏÏÏÏÏÏÏÏÏÏÏÏÏÏÏÏÏÏÏÏÏÏÏÏÏÏÏÏÏÏÏÏÏÏÏÏÏÏÏÏÏÏÏÏÏÏÏÏÏÏÏÏÏÏÏÏÏÏÏÏÏÏÏÏÏÏÏÏÏÏÏÏÏÏÏ Ì (2.7) 107.9
Balance at end of yearÏÏÏÏÏÏÏÏÏÏÏÏÏÏÏÏÏÏÏÏÏÏÏÏÏÏÏÏÏÏÏÏÏÏÏÏÏÏÏÏÏÏÏÏÏÏÏÏÏÏÏÏÏÏÏÏÏÏÏÏÏÏÏÏÏÏÏÏÏÏÏÏÏÏÏÏÏÏÏÏÏÏÏÏÏÏÏ (14.0) (14.0) (11.3)
UNAMORTIZED DEFERRED COMPENSATIONBalance at beginning of yearÏÏÏÏÏÏÏÏÏÏÏÏÏÏÏÏÏÏÏÏÏÏÏÏÏÏÏÏÏÏÏÏÏÏÏÏÏÏÏÏÏÏÏÏÏÏÏÏÏÏÏÏÏÏÏÏÏÏÏÏÏÏÏÏÏÏÏÏÏÏÏÏÏÏÏÏÏÏÏÏÏÏ (66.0) (62.5) (99.0)
Restricted stock, net of forfeitures and amortization ÏÏÏÏÏÏÏÏÏÏÏÏÏÏÏÏÏÏÏÏÏÏÏÏÏÏÏÏÏÏÏÏÏÏÏÏÏÏÏÏÏÏÏÏÏÏÏÏÏÏÏÏÏÏÏÏÏÏÏÏ (23.4) (3.5) 36.5
Balance at end of yearÏÏÏÏÏÏÏÏÏÏÏÏÏÏÏÏÏÏÏÏÏÏÏÏÏÏÏÏÏÏÏÏÏÏÏÏÏÏÏÏÏÏÏÏÏÏÏÏÏÏÏÏÏÏÏÏÏÏÏÏÏÏÏÏÏÏÏÏÏÏÏÏÏÏÏÏÏÏÏÏÏÏÏÏÏÏÏ (89.4) (66.0) (62.5)
TOTAL STOCKHOLDERS' EQUITY ÏÏÏÏÏÏÏÏÏÏÏÏÏÏÏÏÏÏÏÏÏÏÏÏÏÏÏÏÏÏÏÏÏÏÏÏÏÏÏÏÏÏÏÏÏÏÏÏÏÏÏÏÏÏÏÏÏÏÏÏÏÏÏÏÏÏÏÏÏÏÏÏ $1,945.3 $1,718.3 $2,118.8
COMPREHENSIVE INCOME (LOSS)Net loss applicable to common stockholders ÏÏÏÏÏÏÏÏÏÏÏÏÏÏÏÏÏÏÏÏÏÏÏÏÏÏÏÏÏÏÏÏÏÏÏÏÏÏÏÏÏÏÏÏÏÏÏÏÏÏÏÏÏÏÏÏÏÏÏÏÏÏÏÏÏÏ $ (289.2)$ (558.2)$ (539.1)Preferred stock dividends ÏÏÏÏÏÏÏÏÏÏÏÏÏÏÏÏÏÏÏÏÏÏÏÏÏÏÏÏÏÏÏÏÏÏÏÏÏÏÏÏÏÏÏÏÏÏÏÏÏÏÏÏÏÏÏÏÏÏÏÏÏÏÏÏÏÏÏÏÏÏÏÏÏÏÏÏÏÏÏÏÏÏ 26.3 19.8 ÌNet other comprehensive income (loss) adjustments ÏÏÏÏÏÏÏÏÏÏÏÏÏÏÏÏÏÏÏÏÏÏÏÏÏÏÏÏÏÏÏÏÏÏÏÏÏÏÏÏÏÏÏÏÏÏÏÏÏÏÏÏÏÏÏÏÏÏÏ (27.4) 10.5 136.1
Total comprehensive lossÏÏÏÏÏÏÏÏÏÏÏÏÏÏÏÏÏÏÏÏÏÏÏÏÏÏÏÏÏÏÏÏÏÏÏÏÏÏÏÏÏÏÏÏÏÏÏÏÏÏÏÏÏÏÏÏÏÏÏÏÏÏÏÏÏÏÏÏÏÏÏÏÏÏÏÏÏÏÏÏÏÏÏÏÏ $ (290.3)$ (527.9)$ (403.0)
NUMBER OF COMMON SHARESBalance at beginning of yearÏÏÏÏÏÏÏÏÏÏÏÏÏÏÏÏÏÏÏÏÏÏÏÏÏÏÏÏÏÏÏÏÏÏÏÏÏÏÏÏÏÏÏÏÏÏÏÏÏÏÏÏÏÏÏÏÏÏÏÏÏÏÏÏÏÏÏÏÏÏÏÏÏÏÏÏÏÏÏÏÏÏ 424.9 418.4 389.3
Restricted stock, net of forfeitures and amortization ÏÏÏÏÏÏÏÏÏÏÏÏÏÏÏÏÏÏÏÏÏÏÏÏÏÏÏÏÏÏÏÏÏÏÏÏÏÏÏÏÏÏÏÏÏÏÏÏÏÏÏÏÏÏÏÏÏÏÏÏ 4.1 2.7 ÌEmployee stock purchasesÏÏÏÏÏÏÏÏÏÏÏÏÏÏÏÏÏÏÏÏÏÏÏÏÏÏÏÏÏÏÏÏÏÏÏÏÏÏÏÏÏÏÏÏÏÏÏÏÏÏÏÏÏÏÏÏÏÏÏÏÏÏÏÏÏÏÏÏÏÏÏÏÏÏÏÏÏÏÏÏÏÏ 0.1 0.7 0.9Exercise of stock options, including tax benefit ÏÏÏÏÏÏÏÏÏÏÏÏÏÏÏÏÏÏÏÏÏÏÏÏÏÏÏÏÏÏÏÏÏÏÏÏÏÏÏÏÏÏÏÏÏÏÏÏÏÏÏÏÏÏÏÏÏÏÏÏÏÏÏÏ 0.3 0.5 ÌIssuance of common stock, net of fees ÏÏÏÏÏÏÏÏÏÏÏÏÏÏÏÏÏÏÏÏÏÏÏÏÏÏÏÏÏÏÏÏÏÏÏÏÏÏÏÏÏÏÏÏÏÏÏÏÏÏÏÏÏÏÏÏÏÏÏÏÏÏÏÏÏÏÏÏÏÏÏ Ì Ì 25.8Issuance of shares for acquisitions ÏÏÏÏÏÏÏÏÏÏÏÏÏÏÏÏÏÏÏÏÏÏÏÏÏÏÏÏÏÏÏÏÏÏÏÏÏÏÏÏÏÏÏÏÏÏÏÏÏÏÏÏÏÏÏÏÏÏÏÏÏÏÏÏÏÏÏÏÏÏÏÏÏÏÏ 0.9 1.8 2.4Issuance of common stock- litigation settlement ÏÏÏÏÏÏÏÏÏÏÏÏÏÏÏÏÏÏÏÏÏÏÏÏÏÏÏÏÏÏÏÏÏÏÏÏÏÏÏÏÏÏÏÏÏÏÏÏÏÏÏÏÏÏÏÏÏÏÏÏÏÏÏ Ì 0.8 Ì
Balance at end of yearÏÏÏÏÏÏÏÏÏÏÏÏÏÏÏÏÏÏÏÏÏÏÏÏÏÏÏÏÏÏÏÏÏÏÏÏÏÏÏÏÏÏÏÏÏÏÏÏÏÏÏÏÏÏÏÏÏÏÏÏÏÏÏÏÏÏÏÏÏÏÏÏÏÏÏÏÏÏÏÏÏÏÏÏÏÏÏ 430.3 424.9 418.4
The accompanying notes are an integral part of these financial statements.
102

NOTES TO CONSOLIDATED FINANCIAL STATEMENTS
(Amounts in Millions, Except Per Share Amounts)
Note 1: Summary of Significant Accounting Policies
Business Description
The Interpublic Group of Companies, Inc. and subsidiaries (the ""Company'', ""Interpublic'', ""we'',""us'' or ""our'') is one of the world's largest advertising and marketing services companies, comprised ofhundreds of communication agencies around the world that deliver custom marketing solutions on behalfof our clients. Our agencies cover the spectrum of marketing disciplines and specialties, from traditionalservices such as consumer advertising and direct marketing, to services such as experiential marketing andbranded entertainment. With offices in over 100 countries and approximately 43,000 employees, ouragencies work with our clients to create global and local marketing campaigns. These marketing programsseek to build brands, influence consumer behavior and sell products.
Prior Restatement
In our 2004 Annual Report on Form 10-K, we restated our previously reported financial statementsfor the years ended December 31, 2003, 2002, 2001 and 2000, and for the first three quarters of 2004 andall four quarters of 2003 (the ""Prior Restatement''). The Prior Restatement also affected periods prior to2000, which was reflected as an adjustment to opening retained earnings as of January 1, 2000. All of thefinancial statements and financial information contained in this Form 10-K related to the prior periodsmentioned above reflect the effect of the Prior Restatement adjustments.
Principles of Consolidation
The Consolidated Financial Statements include the accounts of the Company, most of which arewholly owned. Investments in companies in which we exercise significant influence, but not control, areaccounted for using the equity method of accounting. Investments in companies in which we have lessthan a 20% ownership interest and do not exercise significant influence are accounted for at cost. Allintercompany accounts and transactions have been eliminated in consolidation.
In accordance with Statements of Financial Accounting Standards (""SFAS'') Interpretation No. 46,Consolidation of Variable Interest Entities, an Interpretation of ARB No. 51 along with certain revisions,we have consolidated certain entities meeting the definition of variable interest entities. The inclusion ofthese entities does not have a material impact on our Consolidated Balance Sheets or Statements ofOperations.
Reclassifications and Revisions
Certain classification revisions have been made to the prior period financial statements to conform tothe current year presentation. These classification revisions included amounts previously recorded incurrent assets as accounts receivable of $537.7 to expenditures billable to clients and amounts previouslyrecorded in current liabilities as accounts payable of $1,411.5 to accrued liabilities in the accompanyingConsolidated Balance Sheet as of December 31, 2004. The classification of these amounts was revised tomore appropriately reflect the composition of the year end balances of accounts receivable as amountsbilled to clients and accounts payable as amounts for which we have received invoices from vendors. Theseclassification revisions had no impact on our results of operations or changes in our stockholders' equity.
During 2003, we completed the sale of NFO World Group Inc. (""NFO''), and its related activity isclassified as discontinued operations for all periods presented. We have revised our 2004 and 2003Consolidated Statements of Cash Flows to separately disclose the operating, investing and financingportions of the cash flows attributable to our discontinued operations. We had previously reported theseamounts on a combined basis as a separate caption.
103

NOTES TO CONSOLIDATED FINANCIAL STATEMENTS Ì (Continued)
(Amounts in Millions, Except Per Share Amounts)
Use of Estimates
The preparation of financial statements in conformity with generally accepted accounting principlesrequires us to make estimates and assumptions that affect the reported amounts of assets and liabilities,the disclosure of contingent assets and liabilities at the date of the financial statements and the reportedamounts of revenues and expenses during the reporting period. Actual results could differ from thoseestimates. Estimates are used when accounting for certain items such as revenue recognition, allowancesfor doubtful accounts, depreciation and amortization, income taxes, restructuring reserves, valuation oftangible and intangible assets, recoverability of goodwill, business combinations, contingencies and pensionand postretirement benefit obligations, among others.
Segments
As of December 31, 2005, we have three reportable segments: Integrated Agency Network (""IAN''),Constituency Management Group (""CMG'') and Motorsports. We also report results for the Corporategroup. The largest segment, IAN, is comprised of McCann WorldGroup (""McCann''), The FCB Group(""FCB''), Lowe Worldwide (""Lowe''), Draft Worldwide (""Draft'') and our leading stand-alone agencies.Our stand-alone agencies include Campbell-Ewald, Hill Holliday, Deutsch and Mullen. The secondsegment, CMG, is comprised of Weber Shandwick, GolinHarris, DeVries, Jack Morton, MWW Group,FutureBrand and Octagon Worldwide (""Octagon''). Our third reportable segment is comprised of ourMotorsports operations, which were sold during 2004 and had immaterial residual operating results in2005.
Revenue Recognition
Our revenues are primarily derived from the planning and execution of advertising programs in variousmedia and the planning and execution of other marketing and communications programs. Most of ourclient contracts are individually negotiated and accordingly, the terms of client engagements and the baseson which we earn commissions and fees vary significantly. Our client contracts are also becomingincreasingly complex arrangements that frequently include provisions for incentive compensation andgovern vendor rebates and credits. Our largest clients are multinational entities and, as such, we oftenprovide services to these clients out of multiple offices and across various agencies. In arranging for suchservices to be provided, it is possible for both a global and local agreement to be initiated. Multipleagreements of this nature are reviewed by legal counsel to determine the governing terms to be followedby the offices and agencies involved.
Revenue for our services is recognized when all of the following criteria are satisfied: (i) persuasiveevidence of an arrangement exists; (ii) the price is fixed or determinable; (iii) collectibility is reasonablyassured; and (iv) services have been performed. Depending on the terms of the client contract, fees forservices performed can be primarily recognized three ways: proportional performance, straight-line (ormonthly basis) or completed contract.
‚ Fees are generally recognized as earned based on the proportional performance method of revenuerecognition in situations where our fee is reconcilable to the actual hours incurred to service theclient as detailed in a contractual staffing plan or where the fee is earned on a per hour basis, withthe amount of revenue recognized in both situations limited to the amount realizable under theclient contract. We believe an input based measure (the "hour') is appropriate in situations wherethe client arrangement essentially functions as a time and out-of-pocket expense contract and theclient receives the benefit of the services provided throughout the contract term.
‚ Fees are recognized on a straight-line or monthly basis when service is provided essentially on a prorata basis and the terms of the contract support monthly basis accounting.
104
NOTES TO CONSOLIDATED FINANCIAL STATEMENTS Ì (Continued)
(Amounts in Millions, Except Per Share Amounts)
‚ Certain fees (such as for major marketing events) are deferred until contract completion as thefinal act is so significant in relation to the service transaction taken as a whole. Fees are alsorecognized on a completed contract basis when the terms of the contract call for the delivery ofdiscrete projects ("milestone' arrangements), if any of the criteria of Staff Accounting Bulletin(""SAB'') No. 104, Revenue Recognition, were not satisfied prior to job completion or the terms ofthe contract do not otherwise qualify for proportional performance or monthly basis recognition.
Incremental direct costs incurred related to contracts where revenue is accounted for on a completedcontract basis are generally expensed as incurred. There are certain exceptions made for significantcontracts or for certain agencies where the majority of the contracts are project-based and systems are inplace to properly capture appropriate direct costs. Commissions are generally earned on the date of thebroadcast or publication. Contractual arrangements with clients may also include performance incentiveprovisions designed to link a portion of the revenue to our performance relative to both qualitative andquantitative goals. Performance incentives are recognized as revenue for quantitative targets when thetarget has been achieved and for qualitative targets when confirmation of the incentive is received from theclient. Therefore, depending on the terms of the client contract, revenue is derived from diversearrangements involving fees for services performed, commissions, performance incentive provisions andcombinations of the three.
Substantially all of our revenue is recorded as the net amount of our gross billings less pass-throughexpenses charged to a client. In most cases, the amount that is billed to clients significantly exceeds theamount of revenue that is earned and reflected in our financial statements, because of various pass-throughexpenses such as production and media costs. In compliance with Emerging Issues Task Force (""EITF'')Issue No. 99-19, Reporting Revenue Gross as a Principal versus Net as an Agent, we assess whether theagency or the third-party supplier is the primary obligor. We evaluate the terms of our client agreementsas part of this assessment. In addition, we give appropriate consideration to other key indicators such aslatitude in establishing price, discretion in supplier selection and credit risk to the vendor. Because weoperate broadly as an advertising agency based on our primary lines of business and given the industrypractice to generally record revenue on a net versus gross basis, we believe that there must be strongevidence in place to overcome the presumption of net revenue accounting. Accordingly, we generallyrecord revenue net of pass-through charges as we believe the key indicators of the business suggest wegenerally act as an agent on behalf of our clients in our primary lines of business. In those businesses(primarily sales promotion, event, sports and entertainment marketing and corporate and brand identityservices) where the key indicators suggest we act as a principal, we record the gross amount billed to theclient as revenue and the related costs incurred as operating expenses.
As we provide services as part of our core operations, we generally incur incidental expenses, which,in practice, are commonly referred to as ""out-of-pocket'' expenses. These expenses often include expensesrelated to airfare, mileage, hotel stays, out of town meals and telecommunication charges. In accordancewith EITF Issue No. 01-14, Income Statement Characterization of Reimbursements Received for "Out-of-Pocket' Expenses Incurred, we record the reimbursements received for incidental expenses as revenue.
We receive credits from our vendors and media outlets for transactions entered into on behalf of ourclients, which are passed through to our clients in accordance with contractual provisions and local law. Ifa pass-through is not required, then these credits are a reduction of vendor cost, and are recorded asadditions to revenue. In connection with our Prior Restatement, where it was impractical to review clientcontracts, we used statistical methods to estimate our exposure that could arise from credits, discounts andother rebates owed to clients. If our estimate is insufficient, we may be required to recognize additionalliabilities. If the initial estimate of the liability recorded is subsequently determined to be over or underprovided for, the difference is recorded as an adjustment to revenue. If we are able to negotiate a favorablesettlement of a recorded liability, however, the reversal of this amount is recorded in a non-operating
105

NOTES TO CONSOLIDATED FINANCIAL STATEMENTS Ì (Continued)
(Amounts in Millions, Except Per Share Amounts)
income account since negotiating a favorable outcome with a client is not considered a revenue generatingactivity. See Note 2 for further information.
Costs of Services (Salaries and Related Expenses and Office and General Expenses)
Salaries and related expenses consist of payroll costs and related benefits associated with client serviceprofessional staff and administrative staff, including severance associated with reductions in workforce andcosts incurred for freelance contractors who are utilized to support business development. Office andgeneral expenses include costs directly attributable to client engagements. These costs include out-of-pocket costs such as travel for client service professional staff, production costs and other direct costs thatare rebilled to our clients. Office and general expenses also include expenses attributable to the support ofclient service professional staff, depreciation and amortization costs, rent expense, bad debt expenserelating to accounts receivable, professional fees, the costs associated with the development of a sharedservices center and implementation costs associated with upgrading our information technologyinfrastructure.
Cash Equivalents and Short-Term Marketable Securities
Cash equivalents are highly liquid investments, including certificates of deposit, government securitiesand time deposits with original maturities of three months or less at the time of purchase and are stated atestimated fair value, which approximates cost. Cash is maintained at high-credit quality financialinstitutions.
As of December 31, 2005 and 2004, we held restricted cash of $34.2 and $32.0, respectively, includedin prepaid expenses and other current assets on our Consolidated Balance Sheets. Restricted cashrepresents cash equivalents that are maintained on behalf of our clients and are legally restricted for aspecified business purpose.
We classify all of our short-term marketable equity securities as available-for-sale. These securitiesare carried at fair value with the corresponding unrealized gains and losses reported as a separatecomponent of comprehensive loss. The cost of securities sold is determined based upon the average cost ofthe securities sold.
Certain auction rate securities are classified as short-term marketable securities based upon ourevaluation of the maturity dates associated with the underlying bonds. Although these securities are issuedand rated as long-term bonds, with maturities ranging from 20 to 30 years, they are priced and traded asshort-term instruments because of the significant degree of market liquidity provided through the interestrate resets.
Allowance for Doubtful Accounts
The allowance for doubtful accounts is estimated based on the aging of accounts receivable, reviews ofclient credit reports, industry trends and economic indicators, as well as analysis of recent payment historyfor specific customers. The estimate is based largely on a formula-driven calculation but is supplementedwith economic indicators and knowledge of potential write-offs of specific client accounts.
Expenditures Billable to Clients
As is typical of our normal business operations, it is common for agencies to incur costs on behalf ofclients, including media and production costs. These costs are applicable when providing advertising,marketing and other services to clients. Expenditures billable to clients is primarily comprised ofproduction and media costs which have been incurred but have not yet been billed to clients, as well asinternal labor and overhead amounts and other accrued receivables which have not yet been billed to
106

NOTES TO CONSOLIDATED FINANCIAL STATEMENTS Ì (Continued)
(Amounts in Millions, Except Per Share Amounts)
clients. Unbilled amounts are presented in expenditures billable to clients regardless of whether they relateto fee or production/media. A provision is made for unrecoverable costs as deemed appropriate.
Investments
Investments are accounted for on the equity basis or cost basis, including investments to fund certaindeferred compensation and retirement obligations. We regularly review our equity and cost methodinvestments to determine whether a significant event or change in circumstances has occurred that mayhave an adverse effect on the fair value of each investment. In the event a decline in fair value of aninvestment occurs, we must determine if the decline has been other than temporary. We consider ourinvestments strategic and long-term in nature, so we must determine if the fair value decline is recoverablewithin a reasonable period. For investments accounted for using the equity basis or cost basis, we evaluatefair value based on specific information (valuation methodologies, estimates of appraisals, financialstatements, etc.) in addition to quoted market price, if available. Factors indicative of an other thantemporary decline include recurring operating losses, credit defaults and subsequent rounds of financingwith pricing that is below the cost basis of the investment. This list is not all-inclusive; we consider allknown quantitative and qualitative factors in determining if an other than temporary decline in value of aninvestment has occurred. Our assessments of fair value represent our best estimates at the time ofimpairment review. See Note 10 for further information.
Land, Buildings and Equipment
Land, buildings and equipment are stated at cost, net of accumulated depreciation. Buildings andequipment are depreciated generally using the straight-line method over the estimated useful lives of therelated assets, which range from 3 to 7 years for furniture, equipment and computer software costs, 10 to35 years for buildings and the shorter of the useful life of the asset (which ranges from 3 to 10 years) orthe remaining lease term for leasehold improvements. The total depreciation expense for the years endedDecember 31, 2005, 2004 and 2003 was $167.3, $178.3 and $204.4, respectively.
During 2005, we revised the estimated depreciable lives from 3 to 20 years for furniture, equipment,and computer software costs, 10 to 45 years for buildings and the shorter of the useful life of the asset(which ranged from 3 to 12 years) or the remaining lease term for leasehold improvements to moreaccurately reflect the productive lives of these assets. The change in depreciable lives was accounted for asa change in accounting estimate on a prospective basis from July 1, 2005 and had an immaterial impacton depreciation expense for 2005.
Certain events or changes in circumstances could cause us to conclude that the carrying value of ourbuildings and equipment may not be recoverable. Events or circumstances that might require impairmenttesting include, but are not limited to, decrease in market price, negative forecasted cash flow, or asignificant adverse change in business climate of the asset. If the total estimate of the expected futureundiscounted cash flows of an asset grouping over its useful life is less than its carrying value, animpairment loss is recognized in the financial statements equal to the difference between the estimated fairvalue and carrying value of the asset grouping.
Goodwill and Other Intangible Assets
We account for our business combinations using the purchase accounting method. The total costs ofthe acquisitions are allocated to the underlying net assets, based on their respective estimated fair marketvalues and the remainder is allocated to goodwill and other intangible assets. Considering thecharacteristics of advertising, specialized marketing and communication services companies, our acquisi-tions usually do not have significant amounts of tangible assets as the principal assets we acquire aremostly creative talent. As a result, a substantial portion of the purchase price is allocated to goodwill.
107

NOTES TO CONSOLIDATED FINANCIAL STATEMENTS Ì (Continued)
(Amounts in Millions, Except Per Share Amounts)
Determining the fair market value of assets acquired and liabilities assumed requires management'sjudgment and involves the use of significant estimates, including future cash inflows and outflows, discountrates, asset lives, and market multiples.
We review goodwill and other intangible assets with indefinite lives not subject to amortization (e.g.,customer lists, trade names and customer relationships) annually or whenever events or significant changesin circumstances indicate that the carrying value may not be recoverable. We evaluate the recoverability ofgoodwill at a reporting unit level. We have 16 reporting units that are either the entities at the operatingsegment level or one level below the operating segment level. For 2005, in accordance withSFAS No. 142, Goodwill and Other Intangible Assets, we did not test certain reporting units because their2004 fair value determination exceeded their carrying amount by a substantial margin, where no significantevent occurred since the last fair value determination that would significantly change this margin andwhere the reporting units did not have a triggering event during 2005. The remaining reporting units weretested either as part of the 2005 annual impairment testing as their 2004 fair value did not significantlyexceed their carrying value by a substantial margin or as a result of a triggering event. We reviewintangible assets with definite lives subject to amortization whenever events or circumstances indicate thata carrying amount of an asset may not be recoverable. Events or circumstances that might requireimpairment testing include the loss of a significant client, the identification of other impaired assets withina reporting unit, loss of key personnel, the disposition of a significant portion of a reporting unit, or asignificant adverse change in business climate or regulations.
SFAS No. 142 specifies a two-step process for testing for goodwill impairment and measuring themagnitude of any impairment. The first step of the impairment test is a comparison of the fair value of areporting unit to its carrying value, including goodwill. Goodwill allocated to a reporting unit whose fairvalue is equal to or greater than its carrying value is not impaired and no further testing is required.Should the carrying amount for a reporting unit exceed its fair value, then the first step of the impairmenttest is failed and the magnitude of any goodwill impairment is determined under the second step. Thesecond step is a comparison of the implied fair value of a reporting unit's goodwill to its carrying value.Goodwill of a reporting unit is impaired when its carrying value exceeds its implied fair value. Impairedgoodwill is written down to its implied fair value with a charge to expense in the period the impairment isidentified.
The fair value of a reporting unit is estimated using our projections of discounted future operatingcash flows (without interest) of the unit. Such projections require the use of significant estimates andassumptions as to matters such as future revenue growth, profit margins, capital expenditures, assumed taxrates and discount rates. We believe that the estimates and assumptions made are reasonable but aresusceptible to change from period to period. Additionally, our strategic decisions or changes in marketvaluation multiples could lead to impairment charges. Actual results of operations, cash flows and otherfactors used in a discounted cash flow valuation will likely differ from the estimates used and it is possiblethat differences and changes could be material.
For the year ended December 31, 2005, we changed the date of our annual impairment test for allgoodwill and other intangible assets with indefinite lives from September 30th to October 1st. During 2005we performed this annual impairment test on September 30th and then again on October 1st to ensure thatmultiples used in the reporting units tested were consistent. See Note 8 for further explanation.
Foreign Currencies
The financial statements of our foreign operations, when the local currency is the functional currency,are translated into U.S. Dollars at the exchange rates in effect at each year end for assets and liabilitiesand average exchange rates during each year for the results of operations. The related unrealized gains orlosses from translation are reported as a separate component of comprehensive loss. Transactions
108

NOTES TO CONSOLIDATED FINANCIAL STATEMENTS Ì (Continued)
(Amounts in Millions, Except Per Share Amounts)
denominated in currencies other than the functional currency are recorded based on exchange rates at thetime such transactions arise. Subsequent changes in exchange rates result in transaction gains or losses,which are reflected within other income (expense) in the Consolidated Statements of Operations.
Concentrations of Credit Risk
Financial instruments that potentially subject us to concentrations of credit risk are primarily cash andcash equivalents, short-term marketable securities, accounts receivable, expenditures billable to clients,interest rate instruments and foreign exchange contracts. We invest our excess cash in investment-grade,short-term securities with financial institutions and limit the amount of credit exposure to any onecounterparty. Concentrations of credit risk with accounts receivable are limited due to our large number ofclients and their dispersion across different industries and geographical areas. We perform ongoing creditevaluations of our clients and maintain an allowance for doubtful accounts based upon the expectedcollectibility of all accounts receivable. We are exposed to credit loss in the event of nonperformance bythe counterparties of the foreign currency contracts. We limit our exposure to any one financial institutionand do not anticipate nonperformance by these counterparties.
Income Taxes
The provision for income taxes includes federal, state, local and foreign taxes. Income taxes areaccounted for under the liability method. Deferred tax assets and liabilities are recognized for theestimated future tax consequences of temporary differences between the financial statement carryingamounts and their respective tax bases. Deferred tax assets and liabilities are measured using enacted taxrates expected to apply to taxable income in the year in which the temporary differences are expected tobe recovered or settled. We evaluate the realizability of our deferred tax assets and establish a valuationallowance when it is more likely than not that all or a portion of deferred tax assets will not be realized.See Note 11 for further explanation.
Earnings (Loss) Per Share
In periods when we generate a loss, basic loss per share is computed by dividing the loss attributableto common shareholders by the weighted-average number of common shares and contingently issuableshares outstanding for the period. In periods when we generate income, basic Earnings Per Share (""EPS'')is calculated using the two-class method, pursuant to EITF Issue No. 03-6, Participating Securities andthe Two Ì Class Method under SFAS Statement No. 128. The two-class method is required as our4.50% Convertible Senior Notes and Series A Mandatory Convertible Preferred Stock (""Series APreferred Stock'') qualify as participating securities, each having the right to receive dividends or dividendequivalents should dividends be declared on common stock. Under this method, earnings for the period(after deduction for contractual preferred stock dividends) are allocated on a pro-rata basis to the commonshareholders and to the holders of participating securities based on their right to receive dividends. Theweighted-average number of shares outstanding is increased to reflect the number of common shares intowhich the participating securities could convert.
Diluted earnings (loss) per share reflects the potential dilution that would occur if certaincontingently issuable shares were issued and if stock-based incentives and option plans (including stockoptions, awards of restricted stock and restricted stock units), the 4.50% Notes as described in Note 13and the Series A Preferred Stock as discussed in Note 14 were exercised or converted into common stock.The potential issuance of common stock is assumed to occur at the beginning of the year (or at the timeof issuance of the dilution instrument, if later), and the incremental shares are included using the treasurystock or ""if-converted'' methods. The proceeds utilized in applying the treasury stock method consist of:(1) the amount, if any, to be paid upon exercise; (2) the amount of compensation cost attributed to future
109

NOTES TO CONSOLIDATED FINANCIAL STATEMENTS Ì (Continued)
(Amounts in Millions, Except Per Share Amounts)
service not yet recognized; and (3) any tax benefits credited to paid-in-capital related to the exercise.These proceeds are then assumed to be used by us to purchase common stock at the average market priceduring the period. The incremental shares (difference between the shares assumed to be issued and theshares assumed to be purchased), to the extent they would have been dilutive, are included in thedenominator of the diluted EPS calculation.
Derivative Instruments and Hedging Activities
Derivative instruments, including those that are embedded in other contracts, are recorded at fairvalue in the balance sheet as either an asset or a liability. Changes in the fair value of the derivatives arerecorded each period in earnings unless specific hedge accounting criteria are met. We do not enter intoderivative financial instruments for speculative purposes and do not have a material portfolio of derivativefinancial instruments. See Note 18 for a further discussion.
Pension and Postretirement Benefits
We have pension and postretirement benefit plans covering certain domestic and internationalemployees. We use various actuarial methods and assumptions in determining our pension andpostretirement benefit costs and obligations, including the discount rate used to determine the presentvalue of future benefits, expected long-term rate of return on plan assets and healthcare cost trend rates.See Note 16 for a further discussion.
Stock-Based Compensation
In accordance with SFAS No. 123, Accounting for Stock-Based Compensation, we have accounted forour various stock-based compensation plans under the intrinsic value recognition and measurementprinciples of Accounting Principles Board (""APB'') Opinion No. 25, Accounting for Stock Issued toEmployees, and its related interpretations.
Generally, the exercise price of stock options granted equals the market price of the underlying shareson the date of the grant and, therefore, no compensation expense is recorded. The intrinsic value ofrestricted stock grants and certain other stock-based compensation issued to employees and BoardMembers as of the date of grant is amortized to compensation expense over the vesting period. Certainstock options and restricted stock units are subject to variable accounting. See Note 22 for informationregarding recent accounting standards and Note 15 for further discussion of incentive plans.
On December 20, 2005, the Compensation Committee of our Board of Directors (""CompensationCommittee'') approved the immediate acceleration of vesting of all of our ""out-of-the-money'' outstandingand unvested stock options previously awarded to our employees under equity compensation plans,excluding certain specified unvested options. See Note 15 for further discussion. On January 1, 2006, weplan to implement SFAS No. 123R using the modified prospective method, which requires thatcompensation expense be recorded for all unvested stock options and other equity-based awards. Weestimate the impact of applying the provisions of SFAS No. 123R, Share-Based Payment, will result in anincremental pre-tax expense in our Consolidated Statements of Operations of approximately $15.5 from2006 through 2011 based on the outstanding options as of December 31, 2005. See Note 22 for furtherdiscussion.
If compensation expense for our stock option plans and Employee Stock Purchase Plan (""ESPP'')had been determined based on the fair value at the grant dates as defined by SFAS No. 123 and amendedby SFAS No. 148, Accounting for Stock-Based Compensation Ì Transition and Disclosure Ì An
110

NOTES TO CONSOLIDATED FINANCIAL STATEMENTS Ì (Continued)
(Amounts in Millions, Except Per Share Amounts)
Amendment of FASB No. 123, our pro forma net loss applicable to common stockholders and loss pershare would have been as follows:
For the Years Ended December 31,
2005 2004 2003
As reported, net lossÏÏÏÏÏÏÏÏÏÏÏÏÏÏÏÏÏÏÏÏÏÏÏÏÏÏÏÏÏÏÏÏÏÏÏÏÏÏ $(262.9) $(538.4) $(539.1)
Dividends on preferred stock ÏÏÏÏÏÏÏÏÏÏÏÏÏÏÏÏÏÏÏÏÏÏÏÏÏÏÏÏÏÏÏ (26.3) (19.8) Ì
Net loss applicable to common stockholders ÏÏÏÏÏÏÏÏÏÏÏÏÏÏÏÏÏÏ (289.2) (558.2) (539.1)
Add:
Stock-based employee compensation expense included in netloss applicable to common stockholders, net of tax ÏÏÏÏÏÏÏÏ 30.2 22.5 22.9
Less:
Total fair value of stock-based employee compensationexpense, net of tax ÏÏÏÏÏÏÏÏÏÏÏÏÏÏÏÏÏÏÏÏÏÏÏÏÏÏÏÏÏÏÏÏÏÏÏ (62.6) (51.3) (57.6)
Pro forma net loss applicable to common stockholders ÏÏÏÏÏÏÏÏÏ $(321.6) $(587.0) $(573.8)
Loss per share
Basic and diluted loss per share*
As reported ÏÏÏÏÏÏÏÏÏÏÏÏÏÏÏÏÏÏÏÏÏÏÏÏÏÏÏÏÏÏÏÏÏÏÏÏÏÏÏÏÏÏÏ $ (0.68) $ (1.34) $ (1.40)
Pro formaÏÏÏÏÏÏÏÏÏÏÏÏÏÏÏÏÏÏÏÏÏÏÏÏÏÏÏÏÏÏÏÏÏÏÏÏÏÏÏÏÏÏÏÏÏ $ (0.76) $ (1.41) $ (1.49)
* Diluted loss per share is equal to basic loss per share for the years ended December 31, 2005, 2004 and2003 due to the anti-dilutive impact of our stock options, restricted stock and convertible securities as aresult of the net loss applicable to common stockholders in all related periods.
For purposes of this pro forma information, the weighted-average fair value of the 15% discountreceived by employees on the date that stock was purchased under the ESPP was $1.97, $2.03 and$1.88 per share in 2005, 2004 and 2003, respectively, and is included in the total fair value of stock-basedemployee compensation expense. No stock was purchased under the ESPP during the second quarter of2005. The ESPP expired effective June 30, 2005 and shares are no longer available for issuance under theESPP.
We use the Black-Scholes option-pricing model which requires the input of subjective assumptions,including the option's expected life and the price volatility of the underlying stock. Changes in theassumptions can materially affect the estimate of fair value of options granted and our pro forma results ofoperations could be materially impacted. In light of recent guidance in SAB No. 107, Share-BasedPayment, we re-evaluated the assumptions used to estimate the value of stock options granted in the thirdquarter of 2005. The following assumptions have been modified:
Expected Volatility: We determined that implied volatility of publicly traded options in our commonstock is expected to be more reflective of market conditions and, therefore, can be a reasonable indicatorof expected volatility of our common stock, rather than based only on historical volatility of commonstock. Therefore, we revised the expected volatility factor used to estimate the fair value of stock optionsawarded during the third quarter of 2005 to be based on a blend of historical volatility of our commonstock and implied volatility of our tradable forward put and call options to purchase and sell shares of ourcommon stock. Prior to the third quarter of 2005, we estimated future volatility based on historicalvolatility of our common stock over the most recent period commensurate with the estimated expectedlives of our stock options.
111

NOTES TO CONSOLIDATED FINANCIAL STATEMENTS Ì (Continued)
(Amounts in Millions, Except Per Share Amounts)
Expected Option Lives: In the third quarter of 2005, we revised our estimate of expected lives basedon our review of historical patterns for exercises of stock options. We took the average of (1) anassumption that all outstanding options are exercised upon achieving their full vesting date and (2) anassumption that all outstanding options will be exercised at the midpoint between the current date (i.e.,the date awards have ratably vested through) and their full contractual term. In determining the estimate,we considered several factors, including the historical option exercise behavior of our employees and theterms and vesting periods of the options granted.
The fair value of each option grant has been estimated on the date of grant using the Black-Scholesoption-pricing model with the following assumptions:
For the Years Ended December 31,
2005 2004 2003
Expected option lives ÏÏÏÏÏÏÏÏÏÏÏÏÏÏÏÏÏÏÏÏÏÏÏÏÏÏÏÏÏÏÏÏÏÏÏÏÏÏ 6 years 6 years 6 years
Risk free interest rate ÏÏÏÏÏÏÏÏÏÏÏÏÏÏÏÏÏÏÏÏÏÏÏÏÏÏÏÏÏÏÏÏÏÏÏÏÏ 4.0% 4.0% 3.3%
Expected volatility ÏÏÏÏÏÏÏÏÏÏÏÏÏÏÏÏÏÏÏÏÏÏÏÏÏÏÏÏÏÏÏÏÏÏÏÏÏÏÏÏ 41.0% 44.7% 43.9%
Dividend yieldÏÏÏÏÏÏÏÏÏÏÏÏÏÏÏÏÏÏÏÏÏÏÏÏÏÏÏÏÏÏÏÏÏÏÏÏÏÏÏÏÏÏÏÏ 0.0% 0.0% 0.0%
Weighted-average option grant price ÏÏÏÏÏÏÏÏÏÏÏÏÏÏÏÏÏÏÏÏÏÏÏÏÏ $ 12.39 $ 14.19 $ 10.59
Weighted-average fair value of options granted ÏÏÏÏÏÏÏÏÏÏÏÏÏÏÏÏ $ 5.62 $ 6.91 $ 4.96
Note 2: Liabilities Relating to our Prior Restatement
As described in Note 1, during our Prior Restatement, we conducted an extensive examination offinancial information and significant transactions and recorded expense and liabilities related to VendorDiscounts or Credits, Internal Investigations, and International Compensation Arrangements.
A summary of the remaining liabilities related to these matters is as follows:
Balance as of 12/31/05 Balance as of 12/31/04
Vendor Discounts or Credits* ÏÏÏÏÏÏÏÏÏÏÏÏÏÏÏÏÏÏÏÏ $284.8 $283.9
Internal Investigations* (includes asset reserves)ÏÏÏÏ 24.7 61.7
International Compensation Arrangements ÏÏÏÏÏÏÏÏÏ 36.2 40.3
TotalÏÏÏÏÏÏÏÏÏÏÏÏÏÏÏÏÏÏÏÏÏÏÏÏÏÏÏÏÏÏÏÏÏÏÏÏÏÏÏ $345.7 $385.9
* $37.5 of vendor credits disclosed within Internal Investigations as of December 31, 2004 has beenreclassified to Vendor Discounts or Credits for current year presentation.
Vendor Discounts or Credits
We receive credits from our vendors and media outlets for the acquisition of goods and services thatare entered into on behalf of our clients. The expenses include the purchase of various forms of media,including television, radio, and print advertising space, or production costs, such as the creation ofadvertising campaigns, commercials, and print advertisements. Revenues in the advertising andcommunicative services business are frequently recorded net of third party costs as the business isprimarily an agent for its clients. Since these costs are billed to clients, there are times when vendorcredits or price differences can affect the net revenue recorded by the agency. These third party discounts,rebates, or price differences are frequently referred to as credits.
Our contracts are typically ""fixed-fee'' arrangements or ""cost-based'' arrangements. In ""fixed-fee''arrangements, the amount we charge our clients is comprised of a fee for our services. The fee we earn,however, is not affected by the level of expenses incurred. Therefore, any rebates or credits received in
112

NOTES TO CONSOLIDATED FINANCIAL STATEMENTS Ì (Continued)
(Amounts in Millions, Except Per Share Amounts)
servicing these accounts do not create a liability to the client. In ""cost-based'' arrangements, we earn apercentage commission or flat fee based on or incremental to the expenses incurred. In these cases, rebatesor credits received may accrue to the benefit of our clients and create a liability payable to the client. Theinterpretation of cost language included in our contracts can vary across international and domesticmarkets in which we operate and can affect whether or not we have a liability to the client.
The terms of agreements with our clients are significantly impacted by the following: 1) the types ofvendor credits obtained (rebates, discounts, media and production credits); 2) differing contract types withclients (fixed fee vs. cost-based arrangements); 3) varying industry practices and laws in the regions of theworld in which we operate; 4) determining which contract (global, regional or local) governs ourrelationships with clients; and 5) unique contract provisions in specific contracts.
Prior to filing our 2004 Annual Report, we performed an extensive examination of our client contractsand arrangements and considered local law in the international jurisdictions where we conduct business todetermine the impact of improperly recognizing these vendor credits as additional revenue instead ofrecognizing a liability to our clients. We identified areas where there were differences in prices billed tocustomers and prices received from vendors. All differences associated with cost-based contracts notalready passed back to customers were established as liabilities.
Following the filing of the 2004 10-K in September of 2005, we began contacting clients to notifythem of these liabilities and to negotiate an appropriate settlement. During this process the additionalfollowing information came to our attention.
‚ Additional global or regional master contracts, with contractual terms that required us to rebatevendor discounts or credits, took precedence over local contracts that did not require us to rebatevendor discounts or credits.
‚ Certain misinterpretation of contractual terms and or applicable local law in our Prior Restatementled us to re-examine our agencies' legal assessment process. As a result, our legal departmentcoordinated the engagement of local counsel in order to provide definitive guidance regardingspecific local laws, existing legal precedent and historical, as well as, ongoing legal market practices.This legal guidance required additional adjustments to be made to the liabilities established in thePrior Restatement.
‚ The liability recorded during our Prior Restatement in some instances either covered too manyyears or did not cover enough years as required by the statute of limitations, based on the contractwe determined ultimately governed. We adjusted our liabilities for all years required under thestatute of limitations in the appropriate jurisdiction.
‚ In connection with our Prior Restatement, we estimated certain amounts of our exposures. We havedetermined that in certain instances our initial estimate of the liability recorded requiredadjustment. Additionally, certain entries originally recorded as estimates have been revised based onactual data retrieved from agency books and records.
‚ We performed a detailed review of situations in which billings from vendors and billings to ourclients were different. An appropriate adjustment was recorded for any known scenarios where suchinformation was fully reconciled and the difference was not related to a cost-based contract.
‚ For certain liabilities where the statute of limitations has lapsed, we appropriately released suchliabilities, unless the liabilities were associated with customers with whom we are in the process ofsettling or we intend to settle such liabilities.
We have included a table that depicts the beginning balance, the additional liabilities recorded andthe adjustment reducing these liabilities. While we had changes to our original reserve positions,
113

NOTES TO CONSOLIDATED FINANCIAL STATEMENTS Ì (Continued)
(Amounts in Millions, Except Per Share Amounts)
the net impact of adjustments, excluding fluctuations related to payments and foreign currency and otherwas an increase to the liability balance of $22.9, and that was primarily attributable to the out of periodadjustments discussed below.
Balance as of Liability Additional Balance as of12/31/04 Reversals Liabilities Payments Other 12/31/05
Vendor Discounts or CreditsÏÏÏÏ $283.9 (76.5) 99.4 (11.6) (10.4) $284.8
Internal Investigations
In our Prior Restatement review, we noted instances of possible employee misconduct. As a result,through December 31, 2004, we recorded adjustments with a cumulative impact on income of $114.8. Ofthis amount, $61.7 related to liabilities and asset reserves, $15.6 to asset write-offs, and $37.5 related toVendor Discounts or Credits as of December 31, 2004. These adjustments were recorded to correct certainunintentional errors in our accounting that were discovered as a result of investigations and primarilyrelated to agencies outside the United States. However, certain of these investigations revealed deliberatefalsification of accounting records, evasion of taxes in jurisdictions outside the United States, inappropriatecharges to clients, diversion of corporate assets, non-compliance with local laws and regulations, and otherimproprieties. These errors were not prevented or detected earlier because of material weaknesses in ourcontrol environment and decentralized operating structure. We recorded liabilities related to these matters,for business locations under investigation in our Prior Restatement review, which represented manage-ment's best estimate of probable exposure based on the facts available at that time.
The law firm of Dewey Ballantine LLP was retained to advise the Audit Committee of the Board ofDirectors regarding the discharge of its obligations. Through the filing of this document, Dewey Ballantinehas reviewed all internal investigations cases that were included in our Prior Restatement and continues tooversee our related remediation plans. Dewey Ballantine retained a forensic accounting firm to assist withits review.
During 2005, we recorded a net decrease in our liabilities for Internal Investigations of $37.0. Thedecrease is primarily due to write-off of assets reserves, the recognition of deferred revenue, and paymentof taxes, penalties and interest. We also divested certain agencies in Greece, Spain, Azerbaijan, Ukraine,Uzbekistan, Bulgaria and Kazakhstan. We have increased our reserves related to additional VAT andpayroll related taxes.
Below is an update of our significant cases.
At our McCann and FCB agencies in Turkey we recorded adjustments related to the retention ofvendor discounts that should have been remitted to clients, the improper valuation of a previously acquiredbusiness and over-billing clients for payments to vendors and evasion of local taxes. In 2005, theinvestigation has concluded and we have taken the appropriate personnel actions, including the terminationof local senior management. As of December 31, 2005 and 2004, the remaining liabilities were $12.6 and$19.8, respectively.
At Media First in New York City we recorded adjustments related primarily to inadequaterecordkeeping and the payment of certain employee salaries through accounts payable, without appropriatetax withholdings, resulting in increased earn-out payments. In 2005, we recorded asset write-offs and havetaken the appropriate personnel actions, including the termination of local senior management. As ofDecember 31, 2005 and 2004, the remaining liabilities and asset reserves were $1.2 and $10.8, respectively.
At our FCB agency in Spain we recorded adjustments related to the use of companies that wereformed to account for the production and media volume discounts received from production suppliers on aseparate set of books and records, to prevent the detection of discounts and rebates in the event of a client
114

NOTES TO CONSOLIDATED FINANCIAL STATEMENTS Ì (Continued)
(Amounts in Millions, Except Per Share Amounts)
audit. In addition, compensation was paid to an agency executive's personal service company out of thesecompanies without proper withholding for income taxes. In 2005, we have divested our interest in acomponent of FCB Spain and signed an affiliation agreement with the management, with an appropriatecontrol structure to assure future business is properly conducted. As of December 31, 2005 and 2004, theremaining liabilities and asset reserves were $0 and $9.8, respectively.
At five McCann agencies in Azerbaijan, Ukraine, Uzbekistan, Bulgaria and Kazakhstan we recordedadjustments related to the failure to record and pay compensation-related taxes, value added taxes andcorporate income taxes, and inadequate record keeping. In 2005, we have sold these entities and signedaffiliation agreements with Azerbaijan, Uzbekistan, Bulgaria and Kazakhstan and intend to sign anaffiliation agreement with Ukraine agency management. There will be an appropriate control structure toassure business is properly conducted. As of December 31, 2005 and 2004, the remaining liabilities andasset reserves were $6.2 and $8.7, respectively.
In addition, we also conducted other investigations in our Prior Restatement review for errors foundthat were similar in nature to those described above. In the aggregate, for these other investigations, werecorded $4.7 and $12.6 in liabilities as of December 31, 2005 and 2004, respectively.
International Compensation Arrangements
In our Prior Restatement review, we performed an extensive examination of employee compensationpractices across our organization. While most practices were found to be acceptable, we identified somepractices in certain jurisdictions that required additional review. In certain jurisdictions in which weoperate, particularly in Europe and Latin America, it is common for individuals to establish a personalservice company (""PSC''), in which case the hiring company will normally contract directly with the PSCfor the services of the individual. We reviewed every situation where one of our agencies had contractedwith a PSC and determined that in a number of instances, the use of a PSC was determined not to besupportable. We also identified other arrangements or practices in certain jurisdictions, such as payment ofpersonal expenses outside the normal payroll mechanism, split salary payments, equity grants andretirement payments, and independent contractors/employees that led to an avoidance of paying certaintaxes as well as not reporting compensation to local authorities.
For these issues, liabilities represented our best estimate of expected payments to variousgovernmental organizations in the jurisdictions involved. These amounts were estimates as of such date ofour liabilities that we believed were sufficient to cover the obligations that we may have had to variousauthorities. As a result of the disclosures that were made in our 2004 Annual Report, we anticipate thatthe authorities in certain jurisdictions may undertake reviews to determine whether any of the activitiesdisclosed violated local laws and regulations. This may lead to further investigations and the levy ofadditional assessments including possible fines and penalties. While we intend to defend against anyassessment that we determine to be unfounded, nevertheless we could receive assessments which may besubstantial. However, it cannot be determined at this time whether such investigations would becommenced or, if they are, what the outcome will be with any reasonable certainty.
During 2005, we recorded a net decrease in our liabilities for International CompensationArrangements of $4.1. The decrease is comprised of reductions in our liabilities due to the expiration ofone year under the statutes of limitations, changes in management's estimates and the favorable outcomeof audits in certain jurisdictions. The decrease is net of increases to our accruals due to additionalliabilities incurred in 2005 through the continued use of a PSC or other such arrangements which we arein the process of terminating, as well as interest on amounts not yet settled.
115

NOTES TO CONSOLIDATED FINANCIAL STATEMENTS Ì (Continued)
(Amounts in Millions, Except Per Share Amounts)
Note 3: Out of Period Adjustments
In the fourth quarter, we identified certain vendor discounts and credits, tax, and other miscellaneousadjustments in which our previously reported financial statements were in error or did not conform toGAAP. Because these changes are not material to our financial statements for the periods prior to 2005, orto 2005 as a whole, we have recorded them in the fourth quarter of 2005.
The errors in our previously reported financial information, and the failure to prevent them or detectthem in our financial reporting process, were largely attributable to weak internal controls. We concludedthat our control environment has not progressed sufficiently to serve as an effective foundation for all othercomponents of internal control. See Management's Assessment on Internal Control Over FinancialReporting.
The following tables summarize the impact to the fourth quarter of 2005 of amounts recorded in thefourth quarter of 2005 which relate to reported revenue, operating income (loss), income (loss) fromcontinuing operations before provision for income taxes, loss from continuing operations and loss per share.
Impact ofAdjustmentson Revenue
For the ThreeMonths EndedDecember 31,
2005
Revenue ÏÏÏÏÏÏÏÏÏÏÏÏÏÏÏÏÏÏÏÏÏÏÏÏÏÏÏÏÏÏÏÏÏÏÏÏÏÏÏÏÏÏÏÏÏÏÏÏÏÏÏÏÏÏÏÏÏÏÏÏ $1,895.7
Impact of adjustments:
Vendor Discounts or Credits ÏÏÏÏÏÏÏÏÏÏÏÏÏÏÏÏÏÏÏÏÏÏÏÏÏÏÏÏÏÏÏÏÏÏÏÏÏÏÏÏÏ 21.2
Other adjustments ÏÏÏÏÏÏÏÏÏÏÏÏÏÏÏÏÏÏÏÏÏÏÏÏÏÏÏÏÏÏÏÏÏÏÏÏÏÏÏÏÏÏÏÏÏÏÏÏÏ (3.9)
Total net adjustmentsÏÏÏÏÏÏÏÏÏÏÏÏÏÏÏÏÏÏÏÏÏÏÏÏÏÏÏÏÏÏÏÏÏÏÏÏÏÏÏÏÏÏÏÏÏÏÏÏÏ 17.3
$1,913.0
Impact ofAdjustments on
Operating Income
For the ThreeMonths EndedDecember 31,
2005
Operating income ÏÏÏÏÏÏÏÏÏÏÏÏÏÏÏÏÏÏÏÏÏÏÏÏÏÏÏÏÏÏÏÏÏÏÏÏÏÏÏÏÏÏÏÏÏÏÏÏÏÏÏÏ $ 57.6
Impact of adjustments:
Vendor Discounts or Credits ÏÏÏÏÏÏÏÏÏÏÏÏÏÏÏÏÏÏÏÏÏÏÏÏÏÏÏÏÏÏÏÏÏÏÏÏÏÏÏÏÏ 23.2
Other adjustments ÏÏÏÏÏÏÏÏÏÏÏÏÏÏÏÏÏÏÏÏÏÏÏÏÏÏÏÏÏÏÏÏÏÏÏÏÏÏÏÏÏÏÏÏÏÏÏÏÏ (1.6)
Total net adjustmentsÏÏÏÏÏÏÏÏÏÏÏÏÏÏÏÏÏÏÏÏÏÏÏÏÏÏÏÏÏÏÏÏÏÏÏÏÏÏÏÏÏÏÏÏÏÏÏÏÏ 21.6
$ 79.2
116

NOTES TO CONSOLIDATED FINANCIAL STATEMENTS Ì (Continued)
(Amounts in Millions, Except Per Share Amounts)
Impact ofAdjustments onIncome fromContinuing
Operations BeforeProvision forIncome Taxes
For the ThreeMonths EndedDecember 31,
2005
Income from continuing operations before provision for income taxesÏÏÏÏÏÏÏÏ $44.6
Impact of adjustments:
Vendor Discounts or Credits ÏÏÏÏÏÏÏÏÏÏÏÏÏÏÏÏÏÏÏÏÏÏÏÏÏÏÏÏÏÏÏÏÏÏÏÏÏÏÏÏÏ 22.9
Other adjustments ÏÏÏÏÏÏÏÏÏÏÏÏÏÏÏÏÏÏÏÏÏÏÏÏÏÏÏÏÏÏÏÏÏÏÏÏÏÏÏÏÏÏÏÏÏÏÏÏÏ (2.2)
Total net adjustmentsÏÏÏÏÏÏÏÏÏÏÏÏÏÏÏÏÏÏÏÏÏÏÏÏÏÏÏÏÏÏÏÏÏÏÏÏÏÏÏÏÏÏÏÏÏÏÏÏÏ 20.7
$65.3
Impact ofAdjustments on
Loss fromContinuing
Operations andLoss per Share
For the ThreeMonths EndedDecember 31,
2005
Loss from continuing operations ÏÏÏÏÏÏÏÏÏÏÏÏÏÏÏÏÏÏÏÏÏÏÏÏÏÏÏÏÏÏÏÏÏÏÏÏÏÏÏ $(31.9)
Impact of adjustments:
Vendor Discounts or Credits ÏÏÏÏÏÏÏÏÏÏÏÏÏÏÏÏÏÏÏÏÏÏÏÏÏÏÏÏÏÏÏÏÏÏÏÏÏÏÏÏÏ 22.9
Other adjustments ÏÏÏÏÏÏÏÏÏÏÏÏÏÏÏÏÏÏÏÏÏÏÏÏÏÏÏÏÏÏÏÏÏÏÏÏÏÏÏÏÏÏÏÏÏÏÏÏÏ (2.2)
Total adjustments (pre-tax) ÏÏÏÏÏÏÏÏÏÏÏÏÏÏÏÏÏÏÏÏÏÏÏÏÏÏÏÏÏÏÏÏÏÏÏÏÏÏÏÏÏÏÏ 20.7
Tax adjustments ÏÏÏÏÏÏÏÏÏÏÏÏÏÏÏÏÏÏÏÏÏÏÏÏÏÏÏÏÏÏÏÏÏÏÏÏÏÏÏÏÏÏÏÏÏÏÏÏÏÏÏ 19.5
Equity in net income of unconsolidated affiliates ÏÏÏÏÏÏÏÏÏÏÏÏÏÏÏÏÏÏÏÏÏÏÏÏ 3.9
Total net adjustmentsÏÏÏÏÏÏÏÏÏÏÏÏÏÏÏÏÏÏÏÏÏÏÏÏÏÏÏÏÏÏÏÏÏÏÏÏÏÏÏÏÏÏÏÏÏÏÏÏÏ (2.7)
$(34.6)
Loss per share of common stock Ì basic and diluted:
Loss per shareÏÏÏÏÏÏÏÏÏÏÏÏÏÏÏÏÏÏÏÏÏÏÏÏÏÏÏÏÏÏÏÏÏÏÏÏÏÏÏÏÏÏÏÏÏÏÏÏÏÏÏÏÏ $(0.10)
Effect of adjustments ÏÏÏÏÏÏÏÏÏÏÏÏÏÏÏÏÏÏÏÏÏÏÏÏÏÏÏÏÏÏÏÏÏÏÏÏÏÏÏÏÏÏÏÏÏÏÏ (0.01)
(0.11)
Weighted-average shares ÏÏÏÏÏÏÏÏÏÏÏÏÏÏÏÏÏÏÏÏÏÏÏÏÏÏÏÏÏÏÏÏÏÏÏÏÏÏÏÏÏÏÏÏ 425.5
The impact to 2004, 2003 and prior periods related to out of period amounts recorded in the fourthquarter of 2005 was immaterial.
117

NOTES TO CONSOLIDATED FINANCIAL STATEMENTS Ì (Continued)
(Amounts in Millions, Except Per Share Amounts)
Description of Out of Period Adjustments:
Vendor Discounts or Credits:
We performed extensive procedures as a result of the initiation of settlement discussions with clients.The procedures broadly considered global or regional contracts, review of key changes in legalinterpretations, review of statutes of limitations, estimated exposures and vendor price differences related tocost-based contracts. As a result of these additional procedures, adjustments were recorded to ourpreviously established liabilities.
Other Adjustments
We have identified other items which do not conform to GAAP and recorded adjustments to our2005 Consolidated Financial Statements which relate to previously reported periods. The most significantinclude accounting related to the capitalization of software costs, acquisition related costs and internationalcompensation arrangements.
Tax Adjustments
We recorded adjustments to correct the Accrued and Deferred income taxes for items primarilyrelated to the computation of income tax benefits on the 2004 Long-lived Asset Impairment Charges, theestablishment of certain valuation allowances, the accounting for certain international tax structures andthe computation of interest accruals on certain non-US income tax contingencies. The impact of amountsrecorded in the fourth quarter of 2005 was $8.7 of tax benefit.
We also recorded the tax impact of the out of period adjustments described above, where applicable,based on the local statutory tax rate in the jurisdiction of the entity recording the adjustment. The impactof amounts recorded in the fourth quarter of 2005 was $10.8 of tax benefit.
Note 4: Loss Per Share
The following table sets forth the computation of basic and diluted loss per common share for net lossavailable to common stockholders:
For the Years Ended December 31,
2005 2004 2003
Basic and Diluted
Loss from continuing operations ÏÏÏÏÏÏÏÏÏÏÏÏÏÏÏÏÏÏÏÏÏÏÏÏÏÏÏÏ $(271.9) $(544.9) $(640.1)
Less: preferred stock dividends ÏÏÏÏÏÏÏÏÏÏÏÏÏÏÏÏÏÏÏÏÏÏÏÏÏÏÏÏÏ 26.3 19.8 Ì
(298.2) (564.7) (640.1)
Income from discontinued operations, net of taxes of ($9.0),$3.5 and $18.5, respectively ÏÏÏÏÏÏÏÏÏÏÏÏÏÏÏÏÏÏÏÏÏÏÏÏÏÏÏÏÏÏ 9.0 6.5 101.0
Net loss applicable to common stockholders ÏÏÏÏÏÏÏÏÏÏÏÏÏÏÏÏÏ $(289.2) $(558.2) $(539.1)
Weighted-average number of common shares outstanding Ìbasic and dilutedÏÏÏÏÏÏÏÏÏÏÏÏÏÏÏÏÏÏÏÏÏÏÏÏÏÏÏÏÏÏÏÏÏÏÏÏÏÏÏ 424.8 415.3 385.5
Loss per share from continuing operationsÏÏÏÏÏÏÏÏÏÏÏÏÏÏÏÏÏÏÏÏ $ (0.70) $ (1.36) $ (1.66)
Earnings per share from discontinued operations ÏÏÏÏÏÏÏÏÏÏÏÏÏÏ 0.02 0.02 0.26
Loss per share Ì basic and diluted ÏÏÏÏÏÏÏÏÏÏÏÏÏÏÏÏÏÏÏÏÏÏÏÏÏ $ (0.68) $ (1.34) $ (1.40)
118

NOTES TO CONSOLIDATED FINANCIAL STATEMENTS Ì (Continued)
(Amounts in Millions, Except Per Share Amounts)
Basic and diluted shares outstanding and loss per share are equal for the years ended December 31,2005, 2004 and 2003 due to the anti-dilutive impact of our stock options, restricted stock and convertiblesecurities as a result of the net loss applicable to common stockholders in all related periods. The followingtable presents the weighted-average number of incremental anti-dilutive shares excluded from thecomputations of diluted loss per share for the years ended December 31, 2005, 2004 and 2003:
December 31,
2005 2004 2003
Stock Options, Non-vested Restricted Stock
Awards and Restricted Stock Units ÏÏÏÏÏÏÏÏÏÏÏÏÏÏÏÏÏÏÏÏÏÏÏÏÏÏÏÏÏÏÏÏ 4.8 4.0 4.1
Contingently Issuable SharesÏÏÏÏÏÏÏÏÏÏÏÏÏÏÏÏÏÏÏÏÏÏÏÏÏÏÏÏÏÏÏÏÏÏÏÏÏÏ Ì 1.2 Ì
1.80% Convertible Notes ÏÏÏÏÏÏÏÏÏÏÏÏÏÏÏÏÏÏÏÏÏÏÏÏÏÏÏÏÏÏÏÏÏÏÏÏÏÏÏÏÏ Ì 0.4 6.7
1.87% Convertible Notes ÏÏÏÏÏÏÏÏÏÏÏÏÏÏÏÏÏÏÏÏÏÏÏÏÏÏÏÏÏÏÏÏÏÏÏÏÏÏÏÏÏ Ì 6.1 6.4
4.50% Convertible Notes ÏÏÏÏÏÏÏÏÏÏÏÏÏÏÏÏÏÏÏÏÏÏÏÏÏÏÏÏÏÏÏÏÏÏÏÏÏÏÏÏÏ 64.4 64.4 51.5
Series A Mandatory Convertible Preferred StockÏÏÏÏÏÏÏÏÏÏÏÏÏÏÏÏÏÏÏÏÏ 27.7 26.3 0.8
Series B Cumulative Convertible Perpetual Preferred StockÏÏÏÏÏÏÏÏÏÏÏÏ 7.3 Ì Ì
Total ÏÏÏÏÏÏÏÏÏÏÏÏÏÏÏÏÏÏÏÏÏÏÏÏÏÏÏÏÏÏÏÏÏÏÏÏÏÏÏÏÏÏÏÏÏÏÏÏÏÏÏÏÏÏÏÏ 104.2 102.4 69.5
Our Series B Cumulative Convertible Perpetual Preferred Stock was issued on October 24, 2005. Hadthese convertible securities been outstanding for the full year, 38.4 of incremental shares would beexcluded from the computation of diluted loss per share for the year ended December 31, 2005.
In September 2004, the EITF reached a consensus on the guidance provided by EITF IssueNo. 04-8, The Effect of Contingently Convertible Instruments on Diluted Earnings per Share. Theguidance requires that the share impact of contingently convertible instruments (including debt securities)with a market price conversion trigger be included in diluted EPS computations (if dilutive), regardless ofwhether the market price conversion trigger (or other contingent feature) has been met. We implementedthe requirements of EITF Issue No. 04-8 for the quarter and fiscal year ended December 31, 2004. Theadoption of EITF Issue No. 04-8 requires that we include approximately 64.4 shares in our calculation ofdiluted EPS to reflect the assumed conversion of our 4.50% Notes in periods when dilutive. The adoptionof this pronouncement had no impact on the calculation of earnings per share for any period presented,due to the anti-dilutive impact of the convertible instruments.
We adopted EITF Issue No. 03-6, Participating Securities and the Two Ì Class Method Under FASBStatement No. 128, during the quarter ended June 30, 2004. The adoption of this pronouncement had noimpact on the calculation of earnings per share for any period presented, as the holders of our 4.50% Notesand Series A Preferred Stock, which are participating securities, do not participate in our net loss.
Note 5: Acquisitions and Dispositions
Acquisitions
The majority of our acquisitions include an initial payment at the time of closing and provide foradditional contingent purchase price payments over a specified time. The initial purchase price of anacquisition is allocated to identifiable assets acquired and liabilities assumed based on estimated fair valueswith any excess being recorded as goodwill and other intangible assets. These contingent payments, whichare also known as ""earn-outs'' and ""put options,'' are calculated based on estimates of the future financialperformance of the acquired entity, the timing of the exercise of these rights, changes in foreign currencyexchange rates and other factors. Earn-outs and put options are recorded within the financial statements asan increase to goodwill and other intangible assets once the terms and conditions of the contingentacquisition obligations have been met and the consideration is distributable or expensed as compensation
119

NOTES TO CONSOLIDATED FINANCIAL STATEMENTS Ì (Continued)
(Amounts in Millions, Except Per Share Amounts)
based on the acquisition agreement and the terms and conditions of employment for the former owners ofthe acquired businesses.
Cash paid and stock issued for prior acquisitions are comprised of: (i) contingent payments asdescribed above; (ii) further investments in companies in which we already have an ownership interest;and (iii) other payments related to loan notes and guaranteed deferred payments that have been previouslyrecognized on the balance sheet.
We did not complete any acquisitions during 2005. We completed two acquisitions during 2004 andtwo during 2003, none of which were significant on an individual basis. The results of operations of theseacquired companies were included in our consolidated results from the date of close of the transaction. Wedid, however, make stock payments related to acquisitions initiated in prior years of $12.9, $23.8 and $56.2during 2005, 2004 and 2003, respectively. Details of cash paid for new and prior acquisitions are as follows:
For the Years EndedDecember 31,
2005 2004 2003
Cash paid for current year acquisitions ÏÏÏÏÏÏÏÏÏÏÏÏÏÏÏÏÏÏÏÏÏÏÏÏÏÏ $ Ì $ 14.6 $ 4.0
Cash paid for prior acquisitions:
Cost of Investment ÏÏÏÏÏÏÏÏÏÏÏÏÏÏÏÏÏÏÏÏÏÏÏÏÏÏÏÏÏÏÏÏÏÏÏÏÏÏÏÏÏ 91.7 141.6 216.9
Compensation Expense Ì Related Payments ÏÏÏÏÏÏÏÏÏÏÏÏÏÏÏÏÏÏÏ 5.3 20.1 4.3
Less: cash acquiredÏÏÏÏÏÏÏÏÏÏÏÏÏÏÏÏÏÏÏÏÏÏÏÏÏÏÏÏÏÏÏÏÏÏÏÏÏÏÏÏÏÏÏ Ì (0.9) (0.6)
Net cash paid for acquisitions ÏÏÏÏÏÏÏÏÏÏÏÏÏÏÏÏÏÏÏÏÏÏÏÏÏÏÏÏÏÏÏÏÏÏ $97.0 $175.4 $224.6
The following table includes the cash paid and stock issued for prior acquisitions that were primarilyrecorded as an increase to goodwill and other intangibles in 2005 relating to companies acquired duringprior periods:
Total PaidYear of Original Acquisition During
1999 and Prior 2000 2001 2002 2003 2004 2005
Cash payments for prior acquisitions ÏÏÏÏÏ $40.1 $26.1 $26.8 $1.9 $0.4 $1.7 $ 97.0
Stock issued for prior acquisitions ÏÏÏÏÏÏÏ 0.8 12.1 Ì Ì Ì Ì 12.9
Total consideration ÏÏÏÏÏÏÏÏÏÏÏÏÏÏÏÏÏÏ $40.9 $38.2 $26.8 $1.9 $0.4 $1.7 $109.9
Dispositions
During 2005 we completed the sale of twenty-seven businesses at our IAN segment and twobusinesses at our CMG segment, which comprised approximately $31.0 of revenue. The results ofoperations as well as the gain or loss on sale of each of these agencies were not material to theConsolidated Financial Statements in any of the periods presented.
Motorsports Ì On January 12, 2004, we completed the sale of a business comprising the fourMotorsports circuits, including Brands Hatch, Oulton Park, Cadwell Park and Snetterton (the ""four ownedcircuits''), owned by our Brands Hatch subsidiaries, to MotorSport Vision Limited. The consideration forthe sale was approximately $26.0. An additional contingent amount of approximately $4.0 may be paid tous depending upon the future financial results of the operations sold. We recognized a fixed assetimpairment loss related to the four owned circuits of $38.0 in the fourth quarter of 2003. Additionally, werecognized a fixed asset impairment of $9.6 related to the other Motorsports entities and a capitalexpenditure impairment of $16.2 for outlays that Motorsports was contractually required to spend toupgrade and maintain certain remaining racing facilities.
On April 19, 2004, we reached an agreement with the Formula One Administration Limited(""FOA'') to terminate and release our respective guarantee and promoter obligations relating to the
120

NOTES TO CONSOLIDATED FINANCIAL STATEMENTS Ì (Continued)
(Amounts in Millions, Except Per Share Amounts)
British Grand Prix held at the Silverstone racetrack in the United Kingdom (""UK''). Under thisagreement, we were released from our obligations following the British Grand Prix in July 2004. Inexchange for the early termination of the obligations and liabilities, we paid a total of $93.0 to the FOA intwo installments of $46.5 each on April 19, 2004 and May 24, 2004. A pre-tax charge of $80.0 wasrecorded in Motorsports contract termination costs related to this transaction during the second quarter of2004, net of approximately $13.0 in existing reserves related to the termination of this agreement.
On July 1, 2004, the British Racing Drivers Club (""BRDC'') agreed to vary the terms of the leaseagreement relating to the Silverstone race track and we entered into a series of agreements regarding thepotential termination of our remaining Motorsports obligations in the UK. These agreements gave us theright to terminate our lease obligations at the Silverstone race track and related agreements, which weexercised on November 1, 2004. In connection with these agreements, we paid the BRDC approximately$49.0 in three installments. The first installment of approximately $24.5 was paid on July 1, 2004, thesecond installment of approximately $16.0 was paid on September 30, 2004, and the third installment ofapproximately $8.5 was paid on October 7, 2004. As a result of these agreements, we recorded a pre-taxcharge in the third quarter of 2004 of $33.6 in Motorsports contract termination costs. This charge is netof existing reserves of $9.9. The payments also include $5.5 in office and general expenses reflecting theamount of lease expense associated with our continued use of the leased property through the third andfourth quarters of 2004. We have exited this business and do not anticipate any additional materialcharges. Motorsports charges consist of the following:
For the YearsEnded
December 31,
2004 2003
Long-lived asset impairment and other charges ÏÏÏÏÏÏÏÏÏÏÏÏÏÏÏÏÏÏÏÏÏÏÏÏÏÏÏÏ $ 3.0 $63.8
Motorsports contract termination costs ÏÏÏÏÏÏÏÏÏÏÏÏÏÏÏÏÏÏÏÏÏÏÏÏÏÏÏÏÏÏÏÏÏÏÏ 113.6 Ì
Total ÏÏÏÏÏÏÏÏÏÏÏÏÏÏÏÏÏÏÏÏÏÏÏÏÏÏÏÏÏÏÏÏÏÏÏÏÏÏÏÏÏÏÏÏÏÏÏÏÏÏÏÏÏÏÏÏÏÏÏÏÏ $116.6 $63.8
NFO Ì On July 10, 2003, we completed the sale of NFO, our research unit, to Taylor Nelson Sofresplc (""TNS'') for $415.6 in cash ($376.7 net of cash sold and expenses) and approximately 11.7 shares ofTNS stock that were sold in December 2003 for net proceeds of approximately $42.0. As a result of thissale, we recognized a pre-tax gain of $99.1 ($89.1, net of tax) in the third quarter of 2003 after certainpost closing adjustments. The TNS shares sold resulted in a pre-tax gain of $13.3 recorded in Otherincome (expense) in the Consolidated Statements of Operations. In July 2004, we received $10.0 fromTNS as a final payment with respect to the sale of NFO, which resulted in a $6.5 gain, net of tax. Weestablished reserves for certain income tax contingencies with respect to the determination of ourinvestment in NFO for income tax purposes at the time of the disposition of NFO. During the fourthquarter of 2005, these reserves of $9.0 were reversed, as the related income tax contingencies are no longerconsidered probable. The results of NFO are classified as discontinued operations in accordance withSFAS No. 144, Accounting for the Impairment or Disposal of Long Lived Assets, and, accordingly, theresults of operations and cash flows have been removed from our results of continuing operations and cashflows for prior periods.
121

NOTES TO CONSOLIDATED FINANCIAL STATEMENTS Ì (Continued)
(Amounts in Millions, Except Per Share Amounts)
Income from discontinued operations consists of the following:
For the Years EndedDecember 31,
2005 2004 2003
Revenue ÏÏÏÏÏÏÏÏÏÏÏÏÏÏÏÏÏÏÏÏÏÏÏÏÏÏÏÏÏÏÏÏÏÏÏÏÏÏÏÏÏÏÏÏÏÏÏÏÏÏÏÏÏÏÏ $ Ì $ Ì $250.1
Pre-tax income from discontinued operations ÏÏÏÏÏÏÏÏÏÏÏÏÏÏÏÏÏÏÏÏÏÏÏÏ $ Ì $ Ì $ 20.4
Tax expenseÏÏÏÏÏÏÏÏÏÏÏÏÏÏÏÏÏÏÏÏÏÏÏÏÏÏÏÏÏÏÏÏÏÏÏÏÏÏÏÏÏÏÏÏÏÏÏÏÏÏÏÏ Ì Ì (8.5)
Net income ÏÏÏÏÏÏÏÏÏÏÏÏÏÏÏÏÏÏÏÏÏÏÏÏÏÏÏÏÏÏÏÏÏÏÏÏÏÏÏÏÏÏÏÏÏÏÏÏÏÏÏÏ Ì Ì 11.9
Gain on sale, net of taxes of ($9.0), $3.5 and $10.0, respectively ÏÏÏÏÏÏÏ 9.0 6.5 89.1
Income from discontinued operationsÏÏÏÏÏÏÏÏÏÏÏÏÏÏÏÏÏÏÏÏÏÏÏÏÏÏÏÏÏ $9.0 $6.5 $101.0
Note 6: Restructuring (Reversals) Charges
During 2005, 2004 and 2003, we recorded net (reversals) and charges related to lease termination andother exit costs and severance and termination costs for the 2003 and 2001 restructuring programs of($7.3), $62.2 and $172.9, respectively, which included the impact of adjustments resulting from changes inmanagement's estimates as described below. The 2003 program was initiated in response to softness indemand for advertising and marketing services. The 2001 program was initiated following the acquisition ofTrue North Communications Inc. and was designed to integrate the acquisition and improve productivity.Total inception to date net charges for the 2003 and 2001 programs were $224.2 and $641.0, respectively.The 2003 and 2001 restructuring programs focused on decreasing our overall cost structure mainly throughtotal reductions in head count of approximately 10,300 employees and through downsizing or closingapproximately 280 non-strategic or excess office locations. As of December 31, 2005, substantially allactivities under the 2003 and 2001 programs were completed. A summary of the net (reversals) andcharges by segment is as follows:
Lease Termination and Severance andOther Exit Costs Termination Costs
2003 2001 2003 2001Program Program Total Program Program Total Total
2005 Net (Reversals) Charges
IAN ÏÏÏÏÏÏÏÏÏÏÏÏÏÏÏÏÏÏÏÏÏÏÏÏÏÏÏÏÏÏ $(6.3) $(0.3) $(6.6) $ (0.4) $ Ì $ (0.4) $ (7.0)
CMG ÏÏÏÏÏÏÏÏÏÏÏÏÏÏÏÏÏÏÏÏÏÏÏÏÏÏÏÏÏ 1.1 0.2 1.3 (0.7) Ì (0.7) 0.6
Corporate ÏÏÏÏÏÏÏÏÏÏÏÏÏÏÏÏÏÏÏÏÏÏÏÏÏÏ (0.2) (0.4) (0.6) (0.3) Ì (0.3) (0.9)
Total ÏÏÏÏÏÏÏÏÏÏÏÏÏÏÏÏÏÏÏÏÏÏÏÏÏÏÏÏ $(5.4) $(0.5) $(5.9) $ (1.4) $ Ì $ (1.4) $ (7.3)
2004 Net (Reversals) Charges
IAN ÏÏÏÏÏÏÏÏÏÏÏÏÏÏÏÏÏÏÏÏÏÏÏÏÏÏÏÏÏÏ $40.3 $(7.3) $33.0 $ 14.1 $(4.3) $ 9.8 $ 42.8
CMG ÏÏÏÏÏÏÏÏÏÏÏÏÏÏÏÏÏÏÏÏÏÏÏÏÏÏÏÏÏ 8.1 4.0 12.1 5.1 (0.7) 4.4 16.5
Corporate ÏÏÏÏÏÏÏÏÏÏÏÏÏÏÏÏÏÏÏÏÏÏÏÏÏÏ 3.7 (1.0) 2.7 0.3 (0.1) 0.2 2.9
Total ÏÏÏÏÏÏÏÏÏÏÏÏÏÏÏÏÏÏÏÏÏÏÏÏÏÏÏÏ $52.1 $(4.3) $47.8 $ 19.5 $(5.1) $ 14.4 $ 62.2
2003 Net (Reversals) Charges
IAN ÏÏÏÏÏÏÏÏÏÏÏÏÏÏÏÏÏÏÏÏÏÏÏÏÏÏÏÏÏÏ $23.1 $ 8.8 $31.9 $106.6 $(0.1) $106.5 $138.4
CMG ÏÏÏÏÏÏÏÏÏÏÏÏÏÏÏÏÏÏÏÏÏÏÏÏÏÏÏÏÏ 12.7 6.1 18.8 15.7 Ì 15.7 34.5
Motorsports ÏÏÏÏÏÏÏÏÏÏÏÏÏÏÏÏÏÏÏÏÏÏÏÏ Ì Ì Ì 0.4 Ì 0.4 0.4
Corporate ÏÏÏÏÏÏÏÏÏÏÏÏÏÏÏÏÏÏÏÏÏÏÏÏÏÏ (2.2) (1.3) (3.5) 3.1 Ì 3.1 (0.4)
Total ÏÏÏÏÏÏÏÏÏÏÏÏÏÏÏÏÏÏÏÏÏÏÏÏÏÏÏÏ $33.6 $13.6 $47.2 $125.8 $(0.1) $125.7 $172.9
122

NOTES TO CONSOLIDATED FINANCIAL STATEMENTS Ì (Continued)
(Amounts in Millions, Except Per Share Amounts)
Lease termination and other exit costs
2003 Program
Net (reversals) and charges related to lease termination and other exit costs of ($5.4), $52.1 and$33.6 recorded for 2005, 2004, and 2003, respectively, were comprised of charges of $2.0, $67.8 and $41.6offset by adjustments to management's estimates of $7.4, $15.7 and $8.0, respectively. The discount relatedto lease terminations is being amortized over the expected remaining term of the related lease and is theprimary amount included as charges for 2005. Additionally, charges were recorded for the vacating of 43and 55 offices in 2004 and 2003, respectively, located primarily in the U.S. and Europe. Charges wererecorded at net present value and were net of estimated sublease rental income. Given the remaining lifeof the vacated leased properties, cash payments are expected to be made through 2015. In addition toamounts recorded as restructuring charges, we recorded charges of $11.1 and $16.5 during 2004 and 2003,respectively, related to the accelerated amortization of leasehold improvements on properties included inthe 2003 program. These charges were included in office and general expenses in the ConsolidatedStatements of Operations.
2001 Program
Net (reversals) and charges related to lease termination and other exit costs of ($0.5), ($4.3) and$13.6, recorded for 2005, 2004 and 2003, respectively, resulted exclusively from the impact of adjustmentsto management's estimates. The 2001 program resulted in approximately 180 offices being vacatedworldwide. Given the remaining life of the vacated properties, cash payments are expected to be madethrough 2024.
Adjustments to Estimates
Lease termination and other exit costs for the 2003 and 2001 restructuring programs included the netimpact of adjustments for changes in management's estimates to decrease the restructuring reserves by$7.9 and $20.0 in 2005 and 2004, respectively, and increase the reserve by $5.6 in 2003. The significantfactors that caused the adjustments to management's estimates were our negotiation of terms upon the exitof leased properties, changes in sublease rental income, revised valuations and utilization of previouslyvacated properties by certain of our agencies due to improved economic conditions in certain markets, allof which occurred during the period recorded.
Severance and termination costs
2003 Program
Net reversals related to severance and termination costs of ($1.4) for 2005, resulted from the impactof adjustments to management's estimates. Net charges of $19.5 recorded for 2004 were comprised ofcharges of $26.4, partially offset by adjustments to management's estimates of $6.9. For 2003, net chargesof $125.8 were comprised of charges of $133.7 partially offset by adjustments of $7.9. These chargesrelated to a worldwide workforce reduction of approximately 400 employees in 2004 and 2,900 in 2003.The restructuring program affected employee groups across all levels and functions, including executive,regional and account management and administrative, creative and media production personnel. The majorityof the severance charges related to the U.S. and Europe, with the remainder in Asia and Latin America.
2001 Program
Net reversals related to severance and termination costs of ($5.1) and ($0.1) recorded for 2004 and2003, respectively, resulted from the impact of adjustments to management's estimates. The 2001 programrelated to a worldwide reduction of approximately 7,000 employees.
123

NOTES TO CONSOLIDATED FINANCIAL STATEMENTS Ì (Continued)
(Amounts in Millions, Except Per Share Amounts)
Adjustments to Estimates
Severance and termination costs associated with the 2003 and 2001 restructuring programs includedthe net impact of adjustments for changes in management's estimates to decrease the restructuringreserves by $1.4, $12.0 and $8.0 in 2005, 2004 and 2003, respectively. The significant factors that causedthe adjustments to management's estimates were the decrease in the number of terminated employees,change in amounts paid to terminated employees and change in estimates of taxes and restricted stockpayments related to terminated employees, all of which occurred during the period recorded.
A summary of the remaining liability for the 2003 and 2001 restructuring programs is as follows:
Liability at Estimate Liability at12/31/04 Charges Payments Adjustments Other(1) 12/31/05
2003 Program
Lease termination andother exit costsÏÏÏÏÏÏÏÏÏ $51.0 $2.0 $(19.9) $(7.4) $(2.1) $23.6
Severance and terminationcosts ÏÏÏÏÏÏÏÏÏÏÏÏÏÏÏÏÏ 7.2 Ì (3.0) (1.4) (0.4) 2.4
Total ÏÏÏÏÏÏÏÏÏÏÏÏÏÏÏÏÏ $58.2 $2.0 $(22.9) $(8.8) $(2.5) $26.0
2001 Program
Lease termination andother exit costsÏÏÏÏÏÏÏÏÏ $37.2 $ Ì $(14.3) $(0.5) $ 0.1 $22.5
Severance and terminationcosts ÏÏÏÏÏÏÏÏÏÏÏÏÏÏÏÏÏ 1.6 Ì (1.1) Ì Ì 0.5
Total ÏÏÏÏÏÏÏÏÏÏÏÏÏÏÏÏÏ $38.8 $ Ì $(15.4) $(0.5) $ 0.1 $23.0
Total Restructuring ÏÏÏÏÏÏ $97.0 $2.0 $(38.3) $(9.3) $(2.4) $49.0
Liability at Estimate Liability at12/31/03 Charges Payments Adjustments Other(1) 12/31/04
2003 Program
Lease termination andother exit costsÏÏÏÏÏÏÏÏÏ $ 37.7 $67.8 $ (32.6) $(15.7) $(6.2) $51.0
Severance and terminationcosts ÏÏÏÏÏÏÏÏÏÏÏÏÏÏÏÏÏ 39.0 26.4 (52.4) (6.9) 1.1 7.2
Total ÏÏÏÏÏÏÏÏÏÏÏÏÏÏÏÏÏ $ 76.7 $94.2 $ (85.0) $(22.6) $(5.1) $58.2
2001 Program
Lease termination andother exit costsÏÏÏÏÏÏÏÏÏ $ 65.6 $ Ì $ (28.0) $ (4.3) $ 3.9 $37.2
Severance and terminationcosts ÏÏÏÏÏÏÏÏÏÏÏÏÏÏÏÏÏ 10.2 Ì (3.1) (5.1) (0.4) 1.6
Total ÏÏÏÏÏÏÏÏÏÏÏÏÏÏÏÏÏ $ 75.8 $ Ì $ (31.1) $ (9.4) $ 3.5 $38.8
Total Restructuring ÏÏÏÏÏÏ $152.5 $94.2 $(116.1) $(32.0) $(1.6) $97.0
124

NOTES TO CONSOLIDATED FINANCIAL STATEMENTS Ì (Continued)
(Amounts in Millions, Except Per Share Amounts)
(1) Amounts represent adjustments to the liability for changes in foreign currency exchange rates as wellas liabilities that were previously maintained on the Consolidated Balance Sheet in other balancesheet accounts.
Severance amounts incurred outside the parameters of our restructuring programs are recorded in thefinancial statements when they become both probable and estimable. With the exception of medical anddental benefits paid to employees who are on long-term disability, we do not establish liabilities associatedwith ongoing post-employment benefits that may vest or accumulate as the employee provides service aswe cannot reasonably predict what our future experience will be. See Note 16 for further discussion.
Note 7: Land, Buildings and Equipment
The following table provides a summary of the components of land, buildings and equipment:
December 31,
2005 2004
Land and buildings ÏÏÏÏÏÏÏÏÏÏÏÏÏÏÏÏÏÏÏÏÏÏÏÏÏÏÏÏÏÏÏÏÏÏÏÏÏÏÏÏÏÏÏÏÏÏÏ $ 97.0 $ 111.1
Furniture and equipmentÏÏÏÏÏÏÏÏÏÏÏÏÏÏÏÏÏÏÏÏÏÏÏÏÏÏÏÏÏÏÏÏÏÏÏÏÏÏÏÏÏÏÏ 954.3 1,038.6
Leasehold improvementsÏÏÏÏÏÏÏÏÏÏÏÏÏÏÏÏÏÏÏÏÏÏÏÏÏÏÏÏÏÏÏÏÏÏÏÏÏÏÏÏÏÏÏ 549.6 571.3
1,600.9 1,721.0
Less: accumulated depreciation ÏÏÏÏÏÏÏÏÏÏÏÏÏÏÏÏÏÏÏÏÏÏÏÏÏÏÏÏÏÏÏÏÏÏÏÏÏ (950.9) (998.1)
Land, buildings and equipment, netÏÏÏÏÏÏÏÏÏÏÏÏÏÏÏÏÏÏÏÏÏÏÏÏÏÏÏÏÏÏÏÏÏÏ $ 650.0 $ 722.9
Note 8: Goodwill and Other Intangible Assets
Goodwill
Goodwill is the excess purchase price remaining from an acquisition after an allocation of purchaseprice has been made to identifiable assets acquired and liabilities assumed based on estimated fair values.In order to determine the fair value of net assets for new agency acquisitions, valuations are performedbased on several factors, including the type of service offered, competitive market position, brandreputation and geographic coverage. Considering the characteristics of advertising, specialized marketingand communication services companies, our acquisitions usually do not have significant amounts oftangible assets as the principle asset we typically acquire is creative talent. As a result, a substantialportion of the purchase price is allocated to goodwill. Subsequent changes to goodwill include both currentyear and deferred payments related to acquisitions. We perform an annual impairment review of goodwillas of October 1st or whenever events or significant changes in circumstances indicate that the carryingvalue may not be recoverable. See Note 1 for fair value determination and impairment testingmethodologies. For more discussion on impairment charges, refer to Note 9.
For the year ended December 31, 2005, we changed the date of our annual impairment test for allgoodwill and other intangible assets with indefinite lives from September 30th to October 1st. During 2005we performed this annual impairment test on September 30th and then again on October 1st to ensurethat multiples used in the reporting units tested were consistent. By moving the date into the fourthquarter we will be able to utilize the most current and accurate plan and forecast information. The newdate also provides us additional time to meet future accelerated public reporting requirements. This changedid not delay, accelerate or avoid an impairment charge. This change in accounting principle also did nothave an effect on our Consolidated Financial Statements. Accordingly, we believe that the accountingchange described above is an alternative accounting principle that is preferable.
125

NOTES TO CONSOLIDATED FINANCIAL STATEMENTS Ì (Continued)
(Amounts in Millions, Except Per Share Amounts)
The changes in the carrying value of goodwill by segment for the years ended December 31, 2005 and2004 are as follows:
IAN CMG Total
Balance as of December 31, 2003ÏÏÏÏÏÏÏÏÏÏÏÏÏÏÏÏÏÏÏÏÏÏÏÏÏÏÏ $2,845.3 $422.6 $3,267.9
Goodwill from current acquisitions ÏÏÏÏÏÏÏÏÏÏÏÏÏÏÏÏÏÏÏÏÏÏÏÏ 10.1 Ì 10.1
Goodwill from prior acquisitions ÏÏÏÏÏÏÏÏÏÏÏÏÏÏÏÏÏÏÏÏÏÏÏÏÏÏ 93.8 56.6 150.4
Impairment charges ÏÏÏÏÏÏÏÏÏÏÏÏÏÏÏÏÏÏÏÏÏÏÏÏÏÏÏÏÏÏÏÏÏÏÏÏ (220.2) (91.7) (311.9)
Other (primarily currency translation)ÏÏÏÏÏÏÏÏÏÏÏÏÏÏÏÏÏÏÏÏÏ 24.5 0.6 25.1
Balance as of December 31, 2004ÏÏÏÏÏÏÏÏÏÏÏÏÏÏÏÏÏÏÏÏÏÏÏÏÏÏÏ $2,753.5 $388.1 $3,141.6
Goodwill disposed ofÏÏÏÏÏÏÏÏÏÏÏÏÏÏÏÏÏÏÏÏÏÏÏÏÏÏÏÏÏÏÏÏÏÏÏÏ (24.2) (1.7) (25.9)
Goodwill from prior acquisitions ÏÏÏÏÏÏÏÏÏÏÏÏÏÏÏÏÏÏÏÏÏÏÏÏÏÏ 45.4 37.8 83.2
Impairment charges ÏÏÏÏÏÏÏÏÏÏÏÏÏÏÏÏÏÏÏÏÏÏÏÏÏÏÏÏÏÏÏÏÏÏÏÏ (97.0) Ì (97.0)
Other (primarily currency translation)ÏÏÏÏÏÏÏÏÏÏÏÏÏÏÏÏÏÏÏÏÏ (65.0) (6.0) (71.0)
Balance as of December 31, 2005ÏÏÏÏÏÏÏÏÏÏÏÏÏÏÏÏÏÏÏÏÏÏÏÏÏÏÏ $2,612.7 $418.2 $3,030.9
Other Intangible Assets
As of December 31, 2005 and 2004, the net carrying value of other intangible assets was $35.0 and$37.6, respectively. Included in other intangible assets are assets with indefinite lives not subject toamortization and assets with definite lives subject to amortization. Other intangible assets include non-compete agreements, license costs, trade names and customer lists. Intangible assets with definitive livessubject to amortization are amortized on a straight-line basis with estimated useful lives generally rangingfrom 1 to 15 years. The total amortization expense for the twelve months ended December 31, 2005, 2004and 2003 was $1.5, $6.8 and $12.1, respectively. See Note 1 for fair value determination and impairmenttesting methodologies. The following table provides a summary of other intangible assets:
December 31,
2005 2004
Other intangible assets ÏÏÏÏÏÏÏÏÏÏÏÏÏÏÏÏÏÏÏÏÏÏÏÏÏÏÏÏÏÏÏÏÏÏÏÏÏÏÏÏÏÏÏÏÏÏÏ $ 64.4 $ 63.4
Less: accumulated amortization ÏÏÏÏÏÏÏÏÏÏÏÏÏÏÏÏÏÏÏÏÏÏÏÏÏÏÏÏÏÏÏÏÏÏÏÏÏÏÏÏ (29.4) (25.8)
Other intangible assets, netÏÏÏÏÏÏÏÏÏÏÏÏÏÏÏÏÏÏÏÏÏÏÏÏÏÏÏÏÏÏÏÏÏÏÏÏÏÏÏÏÏÏÏÏ $ 35.0 $ 37.6
Note 9: Long-Lived Asset Impairment and Other Charges
Long-lived assets include land, buildings, equipment, goodwill and other intangible assets. Buildings,equipment and other intangible assets with finite lives are depreciated or amortized on a straight-line basisover their respective estimated useful lives. When necessary, we record an impairment charge for theamount that the carrying value of the asset exceeds the implied fair value. See Note 1 for fair valuedetermination and impairment testing methodologies.
126

NOTES TO CONSOLIDATED FINANCIAL STATEMENTS Ì (Continued)
(Amounts in Millions, Except Per Share Amounts)
The following table summarizes the long-lived asset impairment and other charges:
For the Years Ended December 31,
2005 2004 2003
IAN CMG Motorsports Total IAN CMG Motorsports Total IAN CMG Motorsports Total
GoodwillimpairmentÏÏÏ $97.0 $ Ì $Ì $97.0 $220.2 $91.7 $ Ì $311.9 $ 0.4 $218.0 $ Ì $218.4
Fixed assetimpairmentÏÏÏ 0.5 Ì Ì 0.5 2.0 0.4 3.0 5.4 2.3 Ì 63.8 66.1
Other ÏÏÏÏÏÏÏÏÏ 1.0 0.1 Ì 1.1 4.9 Ì Ì 4.9 9.1 0.4 Ì 9.5
Total ÏÏÏÏÏÏÏÏ $98.5 $0.1 $Ì $98.6 $227.1 $92.1 $3.0 $322.2 $11.8 $218.4 $63.8 $294.0
2005 Impairments
IAN Ì During the fourth quarter of 2005, we recorded a goodwill impairment charge ofapproximately $91.0 at our Lowe reporting unit. A triggering event occurred subsequent to our 2005annual impairment test that led us to believe that Lowe's goodwill and other indefinite lived intangibleassets may no longer be recoverable. As a result, we were required to assess whether our goodwill balanceat Lowe was impaired. Specifically, a major client was lost by Lowe's London agency and the possibility oflosing other clients is now considered a higher risk due to recent management defections and changes inthe competitive landscape. This caused projected revenue growth to decline. As a result of these changesour long-term projections showed declines in discounted future operating cash flows. These revised cashflows caused the implied fair value of Lowe's goodwill to be less than the book value.
During the third quarter of 2005 as restated, we recorded a goodwill impairment charge ofapproximately $5.8 at a reporting unit within our sports and entertainment marketing business. The long-term projections showed previously unanticipated declines in discounted future operating cash flows and, asa result, these discounted future operating cash flows caused the implied fair value of goodwill to be lessthan the related book value.
2004 Impairments
IAN Ì During the third quarter of 2004, we recorded goodwill impairment charges of approximately$220.2 at The Partnership reporting unit, which was comprised of Lowe Worldwide, Draft Worldwide,Mullen, Dailey & Associates and Berenter Greenhouse & Webster (""BGW''). Our long-term projectionsshowed previously unanticipated declines in discounted future operating cash flows due to recent clientlosses, reduced client spending and declining industry valuation metrics. These discounted future operatingcash flow projections caused the estimated fair values of The Partnership to be less than their book values.The Partnership was subsequently disbanded in the fourth quarter of 2004 and the remaining goodwill wasallocated based on the relative fair value of the agencies at the time of disbandment. We considered thepossibility of impairment at Lowe and Draft, the two largest agencies previously within The Partnership.However, we determined that there was no discernible triggering event that would have led us to believethat goodwill was impaired.
CMG Ì As a result of the annual impairment review, a goodwill impairment charge of $91.7 wasrecorded at our CMG reporting unit, which was comprised of Weber Shandwick, GolinHarris, DeVries,MWW Group and FutureBrand. The fair value of CMG was adversely affected by declining industrymarket valuation metrics, specifically, a decrease in the EBITDA multiples used in the underlyingvaluation calculations. The impact of the lower EBITDA multiples caused the calculated fair value ofCMG goodwill to be less than the related book value.
127

NOTES TO CONSOLIDATED FINANCIAL STATEMENTS Ì (Continued)
(Amounts in Millions, Except Per Share Amounts)
2003 Impairments
CMG Ì We recorded an impairment charge of $218.0 to reduce the carrying value of goodwill atOctagon. The Octagon impairment charge reflects the reduction of the unit's fair value due principally topoor financial performance in 2003 and lower than expected future financial performance. Specifically,there was significant pricing pressure in both overseas and domestic TV rights distribution, declining feesfrom athlete representation, and lower than anticipated proceeds from committed future events, includingticket revenue and sponsorship.
Motorsports Ì We recorded fixed asset impairment charges of $63.8, consisting of $38.0 in connectionwith the sale of a business comprised of the four owned auto racing circuits, $9.6 related to the sales ofother Motorsports entities and a fixed asset impairment of $16.2 for outlays that Motorsports wascontractually required to spend to improve the racing facilities.
Note 10: Expenses and Other Income
Investment Impairment
We monitor our investments to determine whether a significant event or changes in circumstanceshave occurred that may have an adverse effect on the fair value of each investment. When an other thantemporary decline in value is deemed to have occurred, an impairment charge is recorded to adjust thecarrying value of the investment to the estimated fair value. See Note 1 for further discussion of fair valuedetermination and impairment testing methodologies.
During 2005, we recorded investment impairment charges of $12.2, primarily related to a $7.1 chargefor our remaining unconsolidated investment in Koch Tavares in Latin America to adjust the carryingamount of the investment to fair value and a $3.7 charge related to a decline in value of certain available-for-sale investments that were determined to be other than temporary.
During 2004, we recorded investment impairment charges of $63.4, primarily related to a $50.9 chargefor an unconsolidated investment in German advertising agency Springer & Jacoby as a result of adecrease in projected operating results. Additionally, we recorded impairment charges of $4.7 related tounconsolidated affiliates primarily in Israel, Brazil, Japan and India, and $7.8 related to several otheravailable-for-sale investments.
During 2003, we recorded $71.5 of investment impairment charges related to 20 investments. Thecharges related principally to investments in Fortune Promo 7 of $9.5 in the Middle East, Koch Tavares of$7.7 in Latin America, Daiko of $10.0 in Japan, Roche Macaulay Partners of $7.9 in Canada, Springer &Jacoby of $6.5 in Germany and Global Hue of $6.9 in the U.S. The majority of the impairment chargesresulted from deteriorating economic conditions in the countries in which the agencies operate, due to theloss of one or several key clients.
128

NOTES TO CONSOLIDATED FINANCIAL STATEMENTS Ì (Continued)
(Amounts in Millions, Except Per Share Amounts)
Other Income (Expense)
The following table sets forth the components of other income (expense):
For the Years Ended December 31,
2005 2004 2003
Gains (losses) on sales of businesses ÏÏÏÏÏÏÏÏÏÏÏÏÏÏÏÏÏÏÏÏÏÏÏÏÏ $10.1 $(18.2) $ 0.3
Gain on sale of Modem Media shares ÏÏÏÏÏÏÏÏÏÏÏÏÏÏÏÏÏÏÏÏÏÏÏÏ 0.1 0.8 30.3
Gain on sale of TNS sharesÏÏÏÏÏÏÏÏÏÏÏÏÏÏÏÏÏÏÏÏÏÏÏÏÏÏÏÏÏÏÏÏÏ Ì Ì 13.3
Contractual liability settlements ÏÏÏÏÏÏÏÏÏÏÏÏÏÏÏÏÏÏÏÏÏÏÏÏÏÏÏÏÏ 2.6 Ì Ì
Gains on sales of other available-for-sale securities andmiscellaneous investment income ÏÏÏÏÏÏÏÏÏÏÏÏÏÏÏÏÏÏÏÏÏÏÏÏÏÏ 20.3 6.7 6.4
Total ÏÏÏÏÏÏÏÏÏÏÏÏÏÏÏÏÏÏÏÏÏÏÏÏÏÏÏÏÏÏÏÏÏÏÏÏÏÏÏÏÏÏÏÏÏÏÏÏÏÏ $33.1 $(10.7) $50.3
In 2005, other income (expense) included net gains from the sales of businesses of $10.1, net gainson sales of available-for-sale securities and miscellaneous investment income of $20.3 and $2.6 related tocredits adjustments. The principal components of net gains from the sales of businesses relate to the saleof Target Research, a McCann agency, during the fourth quarter of 2005, which resulted in a gain of$18.6, offset partially by a sale of a significant component of FCB Spain during the fourth quarter of 2005which resulted in a loss of approximately $13.0. The principal components of net gains on sales ofavailable-for-sale securities and miscellaneous investment income relate to the sale of our remainingownership interest in Delaney Lund Knox Warren & Partners, an agency within FCB, for a gain ofapproximately $8.3, and net gains on sales of available-for-sale securities of $7.9, of which approximately$3.8 relates to appreciation of Rabbi Trust investments restricted for the purpose of paying our deferredcompensation and deferred benefit arrangement liabilities.
In 2005, we also recorded $2.6 for the settlement of our contractual liabilities for vendor credits anddiscounts. This amount represents a negotiated client settlement below the amount originally recorded.
In 2004, other income (expense) included $18.2 of net losses on the sale of 19 agencies. The lossesrelated primarily to the sale of Transworld Marketing, a U.S.-based promotions agency, which resulted in aloss of $8.6, and a $6.2 loss for the final liquidation of the Motorsports investment. See Note 5 for furtherdiscussion of the Motorsports disposition.
In December 2003, we sold approximately 11.0 shares of Modem Media for net proceeds ofapproximately $57.0, resulting in a pre-tax gain of $30.3. Also in December 2003, we sold all of theapproximately 11.7 shares of TNS we had acquired through the sale of NFO for approximately $42.0 ofnet proceeds. A pre-tax gain of $13.3 was recorded.
Note 11: Provision for Income Taxes
The components of income (loss) from continuing operations before provision for (benefit of) incometaxes, equity earnings, and minority interest expense are as follows:
For the Years Ended December 31,
2005 2004 2003
Domestic ÏÏÏÏÏÏÏÏÏÏÏÏÏÏÏÏÏÏÏÏÏÏÏÏÏÏÏÏÏÏÏÏÏÏÏÏÏÏÏÏÏÏÏÏÏÏÏ $ 54.4 $ (72.4) $ (8.8)
Foreign ÏÏÏÏÏÏÏÏÏÏÏÏÏÏÏÏÏÏÏÏÏÏÏÏÏÏÏÏÏÏÏÏÏÏÏÏÏÏÏÏÏÏÏÏÏÏÏÏÏ (241.0) (194.6) (364.0)
Total ÏÏÏÏÏÏÏÏÏÏÏÏÏÏÏÏÏÏÏÏÏÏÏÏÏÏÏÏÏÏÏÏÏÏÏÏÏÏÏÏÏÏÏÏÏÏÏÏÏ $(186.6) $(267.0) $(372.8)
129

NOTES TO CONSOLIDATED FINANCIAL STATEMENTS Ì (Continued)
(Amounts in Millions, Except Per Share Amounts)
The provision for (benefit of) income taxes on continuing operations consists of:
For the Years EndedDecember 31,
2005 2004 2003
Federal income taxes (including foreign withholding taxes):
CurrentÏÏÏÏÏÏÏÏÏÏÏÏÏÏÏÏÏÏÏÏÏÏÏÏÏÏÏÏÏÏÏÏÏÏÏÏÏÏÏÏÏÏÏÏÏÏÏÏÏÏÏÏÏ $20.8 $ 37.2 $ 16.2
Deferred ÏÏÏÏÏÏÏÏÏÏÏÏÏÏÏÏÏÏÏÏÏÏÏÏÏÏÏÏÏÏÏÏÏÏÏÏÏÏÏÏÏÏÏÏÏÏÏÏÏÏÏÏ 16.0 18.2 39.6
36.8 55.4 55.8
State and local income taxes:
CurrentÏÏÏÏÏÏÏÏÏÏÏÏÏÏÏÏÏÏÏÏÏÏÏÏÏÏÏÏÏÏÏÏÏÏÏÏÏÏÏÏÏÏÏÏÏÏÏÏÏÏÏÏÏ 12.2 12.8 27.0
Deferred ÏÏÏÏÏÏÏÏÏÏÏÏÏÏÏÏÏÏÏÏÏÏÏÏÏÏÏÏÏÏÏÏÏÏÏÏÏÏÏÏÏÏÏÏÏÏÏÏÏÏÏÏ 4.6 (22.6) (9.0)
16.8 (9.8) 18.0
Foreign income taxes:
CurrentÏÏÏÏÏÏÏÏÏÏÏÏÏÏÏÏÏÏÏÏÏÏÏÏÏÏÏÏÏÏÏÏÏÏÏÏÏÏÏÏÏÏÏÏÏÏÏÏÏÏÏÏÏ 4.3 84.0 141.4
Deferred ÏÏÏÏÏÏÏÏÏÏÏÏÏÏÏÏÏÏÏÏÏÏÏÏÏÏÏÏÏÏÏÏÏÏÏÏÏÏÏÏÏÏÏÏÏÏÏÏÏÏÏÏ 24.0 132.6 27.5
28.3 216.6 168.9
Total ÏÏÏÏÏÏÏÏÏÏÏÏÏÏÏÏÏÏÏÏÏÏÏÏÏÏÏÏÏÏÏÏÏÏÏÏÏÏÏÏÏÏÏÏÏÏÏÏÏÏÏÏÏ $81.9 $262.2 $242.7
The components of deferred tax assets consist of the following items:
December 31,
2005 2004
Postretirement/postemployment benefits ÏÏÏÏÏÏÏÏÏÏÏÏÏÏÏÏÏÏÏÏÏÏÏÏÏÏÏÏÏÏ $ 36.4 $ 18.6
Deferred compensationÏÏÏÏÏÏÏÏÏÏÏÏÏÏÏÏÏÏÏÏÏÏÏÏÏÏÏÏÏÏÏÏÏÏÏÏÏÏÏÏÏÏÏÏÏ 162.7 234.1
Pension costs ÏÏÏÏÏÏÏÏÏÏÏÏÏÏÏÏÏÏÏÏÏÏÏÏÏÏÏÏÏÏÏÏÏÏÏÏÏÏÏÏÏÏÏÏÏÏÏÏÏÏÏÏÏ 36.1 50.1
Basis differences in fixed assetsÏÏÏÏÏÏÏÏÏÏÏÏÏÏÏÏÏÏÏÏÏÏÏÏÏÏÏÏÏÏÏÏÏÏÏÏÏÏ 59.8 14.8
Rent ÏÏÏÏÏÏÏÏÏÏÏÏÏÏÏÏÏÏÏÏÏÏÏÏÏÏÏÏÏÏÏÏÏÏÏÏÏÏÏÏÏÏÏÏÏÏÏÏÏÏÏÏÏÏÏÏÏÏÏÏ 19.8 8.8
Interest ÏÏÏÏÏÏÏÏÏÏÏÏÏÏÏÏÏÏÏÏÏÏÏÏÏÏÏÏÏÏÏÏÏÏÏÏÏÏÏÏÏÏÏÏÏÏÏÏÏÏÏÏÏÏÏÏÏÏ (13.7) (4.5)
Accruals and reserves ÏÏÏÏÏÏÏÏÏÏÏÏÏÏÏÏÏÏÏÏÏÏÏÏÏÏÏÏÏÏÏÏÏÏÏÏÏÏÏÏÏÏÏÏÏÏ 239.3 130.5
Allowance for doubtful accountsÏÏÏÏÏÏÏÏÏÏÏÏÏÏÏÏÏÏÏÏÏÏÏÏÏÏÏÏÏÏÏÏÏÏÏÏÏ 23.0 33.3
Basis differences in intangible assets ÏÏÏÏÏÏÏÏÏÏÏÏÏÏÏÏÏÏÏÏÏÏÏÏÏÏÏÏÏÏÏÏÏ (35.4) (5.3)
Investments in equity securitiesÏÏÏÏÏÏÏÏÏÏÏÏÏÏÏÏÏÏÏÏÏÏÏÏÏÏÏÏÏÏÏÏÏÏÏÏÏÏ (6.8) 16.2
Tax loss/tax credit carry forwardsÏÏÏÏÏÏÏÏÏÏÏÏÏÏÏÏÏÏÏÏÏÏÏÏÏÏÏÏÏÏÏÏÏÏÏÏ 447.3 411.6
Restructuring and other merger-related costs ÏÏÏÏÏÏÏÏÏÏÏÏÏÏÏÏÏÏÏÏÏÏÏÏÏÏ 16.9 45.2
Other ÏÏÏÏÏÏÏÏÏÏÏÏÏÏÏÏÏÏÏÏÏÏÏÏÏÏÏÏÏÏÏÏÏÏÏÏÏÏÏÏÏÏÏÏÏÏÏÏÏÏÏÏÏÏÏÏÏÏÏ (2.8) 70.4
Total deferred tax assets, netÏÏÏÏÏÏÏÏÏÏÏÏÏÏÏÏÏÏÏÏÏÏÏÏÏÏÏÏÏÏÏÏÏÏÏÏÏÏ 982.6 1,023.8
Valuation allowance ÏÏÏÏÏÏÏÏÏÏÏÏÏÏÏÏÏÏÏÏÏÏÏÏÏÏÏÏÏÏÏÏÏÏÏÏÏÏÏÏÏÏÏÏÏÏÏ (501.0) (488.6)
Net deferred tax assetsÏÏÏÏÏÏÏÏÏÏÏÏÏÏÏÏÏÏÏÏÏÏÏÏÏÏÏÏÏÏÏÏÏÏÏÏÏÏÏÏÏÏÏ $ 481.6 $ 535.2
The valuation allowance of $501.0 and $488.6 at December 31, 2005 and 2004, respectively, applies tocertain deferred tax assets, including U.S. tax credits, capital loss carryforwards and net operating losscarryforwards in certain jurisdictions that, in our opinion, are more likely than not, not to be utilized. Thechange during 2005 in the deferred tax valuation allowance primarily relates to uncertainties regarding the
130

NOTES TO CONSOLIDATED FINANCIAL STATEMENTS Ì (Continued)
(Amounts in Millions, Except Per Share Amounts)
utilization of capital loss and foreign net operating loss carryforwards. At December 31, 2005, there are$51.9 of tax credit carryforwards with expiration periods beginning in 2009 and ending in 2013.
In connection with the U.S. deferred tax assets, management believes that it is more likely than notthat a substantial amount of the deferred tax assets will be realized; a valuation allowance has beenestablished for the remainder. The amount of the deferred tax assets considered realizable, however, couldbe reduced in the near term if estimates of future U.S. taxable income are lower than anticipated. Thereare $999.1 of tax loss carryforwards, of which $294.2 are U.S. capital and net operating loss carryforwardsthat expire in the years 2006 through 2025. The majority of the remaining $704.9 are non-U.S. netoperating loss carryforwards with unlimited carry forward periods. We have concluded that it is more likelythan not that the net deferred tax asset balance will be realized.
Effective Tax Rate Reconciliation on Continuing Operations
A reconciliation of the effective income tax rate on continuing operations before equity earnings andminority interest expense as reflected in the Consolidated Statements of Income to the U.S. Federalstatutory income tax rate is as follows:
For the Years EndedDecember 31,
2005 2004 2003
US Federal statutory income tax rateÏÏÏÏÏÏÏÏÏÏÏÏÏÏÏÏÏÏÏÏÏÏÏÏÏÏ 35.0% 35.0% 35.0%
Federal income tax provision (benefit) at statutory rate ÏÏÏÏÏÏÏÏÏÏ (65.3) $(93.5) $(130.5)
State and local income taxes, net of federal income tax benefit ÏÏÏÏ 3.6 13.7 11.1
Impact of foreign operations, including withholding taxes ÏÏÏÏÏÏÏÏÏ 44.4 77.6 114.8
Change in valuation allowance ÏÏÏÏÏÏÏÏÏÏÏÏÏÏÏÏÏÏÏÏÏÏÏÏÏÏÏÏÏÏÏ 69.9 236.0 111.4
Goodwill and other long-lived asset impairment charges ÏÏÏÏÏÏÏÏÏÏ 21.5 26.3 103.6
Goodwill amortization ÏÏÏÏÏÏÏÏÏÏÏÏÏÏÏÏÏÏÏÏÏÏÏÏÏÏÏÏÏÏÏÏÏÏÏÏÏÏ (1.7) Ì Ì
Restructuring and other merger-related costs ÏÏÏÏÏÏÏÏÏÏÏÏÏÏÏÏÏÏÏ Ì (1.2) 15.2
Liquidation of Motorsports ÏÏÏÏÏÏÏÏÏÏÏÏÏÏÏÏÏÏÏÏÏÏÏÏÏÏÏÏÏÏÏÏÏÏ Ì (19.7) Ì
Capitalized expensesÏÏÏÏÏÏÏÏÏÏÏÏÏÏÏÏÏÏÏÏÏÏÏÏÏÏÏÏÏÏÏÏÏÏÏÏÏÏÏÏ 10.0 Ì Ì
Other ÏÏÏÏÏÏÏÏÏÏÏÏÏÏÏÏÏÏÏÏÏÏÏÏÏÏÏÏÏÏÏÏÏÏÏÏÏÏÏÏÏÏÏÏÏÏÏÏÏÏÏÏ (0.5) 23.0 17.1
Provision (benefit) for income taxes ÏÏÏÏÏÏÏÏÏÏÏÏÏÏÏÏÏÏÏÏÏÏÏÏÏÏ $ 81.9 $262.2 $ 242.7
Effective tax rate on operationsÏÏÏÏÏÏÏÏÏÏÏÏÏÏÏÏÏÏÏÏÏÏÏÏÏÏÏÏÏÏÏ 43.9% 98.2% 65.1%
Our effective tax rate was negatively impacted by the establishment of valuation allowances, asdescribed below, and non-deductible long-lived asset impairment charges. The difference between theeffective tax rate and the statutory federal rate of 35% is also due to state and local taxes and the effect ofnon-U.S. operations.
As required by SFAS No. 109, we are required to evaluate on a quarterly basis the realizability of ourdeferred tax assets. SFAS No. 109, Accounting for Income Tax, requires a valuation allowance to beestablished when it is more likely than not that all or a portion of deferred tax assets will not be realized.In circumstances where there is sufficient negative evidence, establishment of a valuation allowance mustbe considered. We believe that cumulative losses in the most recent three-year period represent sufficientnegative evidence under the provisions of SFAS No. 109, Accounting for Income Tax, and, as a result, wedetermined that certain of our deferred tax assets required the establishment of a valuation allowance. Thedeferred tax assets for which an allowance was established relate primarily to foreign net operating andU.S. capital loss carryforwards. During 2005, a net valuation allowance of $69.9 was established in
131

NOTES TO CONSOLIDATED FINANCIAL STATEMENTS Ì (Continued)
(Amounts in Millions, Except Per Share Amounts)
continuing operations on existing deferred tax assets and current year losses with no tax benefits. The totalvaluation allowance as of December 31, 2005 was $501.0.
The total amount of undistributed earnings of foreign subsidiaries for income tax purposes was $663.2and $734.6 at December 31, 2005 and 2004, respectively. The undistributed earnings of our foreignsubsidiaries are permanently reinvested. After the completion of our evaluation, we have determined thatwe will not take advantage of the provisions of the Jobs Act which grants a temporary incentive torepatriate foreign earnings.
On April 21, 2003 the Internal Revenue Service (""IRS'') proposed additions to our taxable incomefor the years 1994 through 1996 that would have resulted in additional income taxes, including conformingstate and local tax adjustments, of $41.5 million plus appropriate interest. The Company is close tofinalizing a settlement covering all of the adjustments proposed by the IRS, and the IRS has alsotentatively agreed to a refund claim which we filed in respect of certain business expenses for which wehad previously failed to claim deductions in those years. While we anticipate finalizing this settlementshortly, any additional payments, will not have a material effect on our cash flow, financial position or theresults of operations.
The IRS has recently completed the field audit of the years 1997-2002 and has proposed additions toour taxable income. One of the adjustments proposed by the IRS would disallow the deduction of a lossclaimed in 2002 on the grounds that the Company had not established that the claimed worthlessness ofan acquired business had yet occurred in 2002. The Company had previously received a refund ofapproximately $45 million of tax on account of this claimed loss. The proposed disallowance will result inthe Company having to repay that amount, plus appropriate interest. Further, the Company intends toamend its 2004 tax return to claim this deduction in that return, which we anticipate will be subject toaudit by the IRS commencing in Q2, 2006. In connection with the remaining proposed adjustments,subject to our further review, we intend to file an administrative protest of, and to challenge vigorously,those adjustments for which we believe the IRS does not have adequate support. Although the ultimateresolution of these proposed adjustment may result in final adjustments against the company, we do notanticipate that there will be significant cash tax payments in addition to the repayment of the refunddescribed above, and therefore do not expect a material effect on our cash flow, financial position orresults of operations.
We have various tax years under examination by tax authorities in various countries, such as theUnited Kingdom, and in various states, such as New York, in which we have significant businessoperations. It is not yet known whether these examinations will, in the aggregate, result in our payingadditional taxes. We have established tax reserves that we believe to be adequate in relation to thepotential for additional assessments in each of the jurisdictions in which we are subject to taxation. Weregularly assess the likelihood of additional tax assessments in those jurisdictions and adjust our reserves asadditional information requires.
132

NOTES TO CONSOLIDATED FINANCIAL STATEMENTS Ì (Continued)
(Amounts in Millions, Except Per Share Amounts)
Note 12: Accrued Liabilities
The following table provides a summary of the components of accrued liabilities:
December 31,
2005 2004
Accrued media and production expenses ÏÏÏÏÏÏÏÏÏÏÏÏÏÏÏÏÏÏÏÏÏÏÏÏÏÏÏÏÏ $1,517.6 $1,411.5
Salaries, benefits and related expenses ÏÏÏÏÏÏÏÏÏÏÏÏÏÏÏÏÏÏÏÏÏÏÏÏÏÏÏÏÏÏÏ 447.2 441.5
Accrued vendor discounts and credits ÏÏÏÏÏÏÏÏÏÏÏÏÏÏÏÏÏÏÏÏÏÏÏÏÏÏÏÏÏÏÏÏ 195.1 153.1
Accrued office and related expenses ÏÏÏÏÏÏÏÏÏÏÏÏÏÏÏÏÏÏÏÏÏÏÏÏÏÏÏÏÏÏÏÏÏ 93.6 113.8
Accrued professional fees ÏÏÏÏÏÏÏÏÏÏÏÏÏÏÏÏÏÏÏÏÏÏÏÏÏÏÏÏÏÏÏÏÏÏÏÏÏÏÏÏÏÏ 70.4 73.6
Accrued restructuring charges ÏÏÏÏÏÏÏÏÏÏÏÏÏÏÏÏÏÏÏÏÏÏÏÏÏÏÏÏÏÏÏÏÏÏÏÏÏÏ 49.0 97.0
Accrued interest ÏÏÏÏÏÏÏÏÏÏÏÏÏÏÏÏÏÏÏÏÏÏÏÏÏÏÏÏÏÏÏÏÏÏÏÏÏÏÏÏÏÏÏÏÏÏÏÏÏÏ 35.2 35.0
Accrued taxesÏÏÏÏÏÏÏÏÏÏÏÏÏÏÏÏÏÏÏÏÏÏÏÏÏÏÏÏÏÏÏÏÏÏÏÏÏÏÏÏÏÏÏÏÏÏÏÏÏÏÏÏ 46.7 58.8
Other ÏÏÏÏÏÏÏÏÏÏÏÏÏÏÏÏÏÏÏÏÏÏÏÏÏÏÏÏÏÏÏÏÏÏÏÏÏÏÏÏÏÏÏÏÏÏÏÏÏÏÏÏÏÏÏÏÏÏÏ 99.5 100.9
Total ÏÏÏÏÏÏÏÏÏÏÏÏÏÏÏÏÏÏÏÏÏÏÏÏÏÏÏÏÏÏÏÏÏÏÏÏÏÏÏÏÏÏÏÏÏÏÏÏÏÏÏÏÏÏÏÏÏ $2,554.3 $2,485.2
Note 13: Debt
Long-Term Debt
A summary of the carrying amounts and fair values of our long-term debt is as follows:
December 31,
2005 2004
Book Value Fair Value Book Value Fair Value
7.875% Senior Unsecured Notes due 2005 ÏÏÏÏÏ $ Ì $ Ì $ 255.0 $ 257.5
Floating Rate Senior Unsecured Notes due2008ÏÏÏÏÏÏÏÏÏÏÏÏÏÏÏÏÏÏÏÏÏÏÏÏÏÏÏÏÏÏÏÏÏÏÏ 250.0 250.6 Ì Ì
5.40% Senior Unsecured Notes due 2009 (lessunamortized discount of $0.3) ÏÏÏÏÏÏÏÏÏÏÏÏÏ 249.7 225.0 249.7 252.9
7.25% Senior Unsecured Notes due 2011 ÏÏÏÏÏÏ 499.2 465.0 500.0 537.3
6.25% Senior Unsecured Notes due 2014 (lessunamortized discount of $0.9) ÏÏÏÏÏÏÏÏÏÏÏÏÏ 350.3 297.5 347.3 354.3
4.50% Convertible Senior Notes due 2023 ÏÏÏÏÏ 800.0 834.0 800.0 1,045.0
Other notes payable and capitalized leases Ì atinterest rates from 3.3% to 14.44% ÏÏÏÏÏÏÏÏÏ 36.9 42.1
Total long-term debt ÏÏÏÏÏÏÏÏÏÏÏÏÏÏÏÏÏÏÏÏÏ 2,186.1 2,194.1
Less: current portion ÏÏÏÏÏÏÏÏÏÏÏÏÏÏÏÏÏÏÏÏÏÏÏ 3.1 258.1
Long-term debt, excluding current portion ÏÏÏÏÏ $2,183.0 $1,936.0
133

NOTES TO CONSOLIDATED FINANCIAL STATEMENTS Ì (Continued)
(Amounts in Millions, Except Per Share Amounts)
Annual repayments of long-term debt as of December 31, 2005 are scheduled as follows:
2006ÏÏÏÏÏÏÏÏÏÏÏÏÏÏÏÏÏÏÏÏÏÏÏÏÏÏÏÏÏÏÏÏÏÏÏÏÏÏÏÏÏÏÏÏÏÏÏÏÏÏÏÏÏÏÏÏÏÏÏÏÏÏÏÏÏÏÏÏÏ $ 3.1
2007ÏÏÏÏÏÏÏÏÏÏÏÏÏÏÏÏÏÏÏÏÏÏÏÏÏÏÏÏÏÏÏÏÏÏÏÏÏÏÏÏÏÏÏÏÏÏÏÏÏÏÏÏÏÏÏÏÏÏÏÏÏÏÏÏÏÏÏÏÏ 4.7
2008*ÏÏÏÏÏÏÏÏÏÏÏÏÏÏÏÏÏÏÏÏÏÏÏÏÏÏÏÏÏÏÏÏÏÏÏÏÏÏÏÏÏÏÏÏÏÏÏÏÏÏÏÏÏÏÏÏÏÏÏÏÏÏÏÏÏÏÏÏ 256.7
2009ÏÏÏÏÏÏÏÏÏÏÏÏÏÏÏÏÏÏÏÏÏÏÏÏÏÏÏÏÏÏÏÏÏÏÏÏÏÏÏÏÏÏÏÏÏÏÏÏÏÏÏÏÏÏÏÏÏÏÏÏÏÏÏÏÏÏÏÏÏ 250.8
2010ÏÏÏÏÏÏÏÏÏÏÏÏÏÏÏÏÏÏÏÏÏÏÏÏÏÏÏÏÏÏÏÏÏÏÏÏÏÏÏÏÏÏÏÏÏÏÏÏÏÏÏÏÏÏÏÏÏÏÏÏÏÏÏÏÏÏÏÏÏ 0.8
Thereafter* ÏÏÏÏÏÏÏÏÏÏÏÏÏÏÏÏÏÏÏÏÏÏÏÏÏÏÏÏÏÏÏÏÏÏÏÏÏÏÏÏÏÏÏÏÏÏÏÏÏÏÏÏÏÏÏÏÏÏÏÏÏÏÏ 1,670.0
Total long-term debt ÏÏÏÏÏÏÏÏÏÏÏÏÏÏÏÏÏÏÏÏÏÏÏÏÏÏÏÏÏÏÏÏÏÏÏÏÏÏÏÏÏÏÏÏÏÏÏÏÏÏÏÏÏ $2,186.1
* Holders of our $800.0 4.50% Notes may require us to repurchase the 4.50% Notes for cash at par inMarch 2008. If all holders require us to repurchase these Notes, a total of $1,056.7 will be payable in2008 in respect of long-term debt. These Notes will mature in 2023 if not converted or repurchased.
Redemption and Repurchase of Long-Term Debt
In August 2005, we redeemed the remainder of the outstanding 7.875% Senior Unsecured Notes withan aggregate principal amount of $250.0 at maturity at gross proceeds of approximately $258.6, whichincluded the principal amount of the Notes, accrued interest to the redemption date, and a prepaymentpenalty. To redeem these Notes we used the proceeds from the sale and issuance in July 2005 of $250.0Floating Rate Senior Unsecured Notes due in July 2008.
In November 2004, we tendered for $250.0 of the $500.0 outstanding face value 7.875% SeniorUnsecured Notes at gross proceeds of approximately $263.1, which included the principal amount of theNotes plus accrued interest to the tender date. A prepayment premium of $9.8 was recorded on the earlyretirement of $250.0 of these Notes. In December 2004, we redeemed our outstanding 1.87% ConvertibleSubordinated Notes with an aggregate principal amount of approximately $361.0 at maturity at grossproceeds of approximately $346.8, which included the principal amount of the Notes plus accrued interestto the redemption date. To tender for the 7.875% Senior Unsecured Notes and redeem the1.87% Convertible Subordinated Notes, we used approximately $250.0 and $350.0, respectively, of the netproceeds from the sale and issuance in November 2004 of the 5.40% Senior Unsecured Notes dueNovember 2009 and 6.25% Senior Unsecured Notes due November 2014.
In January 2004, we redeemed the 1.80% Convertible Subordinated Notes with an aggregate principalamount of $250.0 at maturity at gross proceeds of approximately $246.0, which included the principalamount of the Notes plus original issue discount and accrued interest to the redemption date. To redeemthese Convertible Subordinated Notes, we used approximately $246.0 of the net proceeds from the 2003Common and Mandatory Convertible Preferred Stock offerings as discussed in Note 14.
Consent Solicitation
In March 2005, we completed a consent solicitation to amend the indentures governing five series ofour outstanding public debt to provide, among other things, that our failure to file with the trustee ourSEC reports, including our 2004 Annual Report on Form 10-K and Quarterly Reports for the first andsecond quarters of 2005 on Form 10-Q, would not constitute a default under the indentures untilOctober 1, 2005.
The indenture governing our 4.50% Notes was also amended in March 2005 to provide for: (i) anextension from March 15, 2008 to September 15, 2009 of the date on or after which we may redeem the4.50% Notes and (ii) an additional ""make-whole'' adjustment to the conversion rate in the event of achange of control meeting specified conditions.
134

NOTES TO CONSOLIDATED FINANCIAL STATEMENTS Ì (Continued)
(Amounts in Millions, Except Per Share Amounts)
4.50% Convertible Senior Notes
The 4.50% Notes are convertible to common stock at a conversion price of $12.42 per share, subjectto adjustment in specified circumstances. They are convertible at any time if the average price of ourcommon stock for 20 trading days immediately preceding the conversion date is greater than or equal to aspecified percentage, beginning at 120% in 2003 and declining 0.5% each year until it reaches 110% atmaturity, of the conversion price. They are also convertible, regardless of the price of our common stock,if: (i) we call the 4.50% Notes for redemption; (ii) we make specified distributions to shareholders;(iii) we become a party to a consolidation, merger or binding share exchange pursuant to which ourcommon stock would be converted into cash or property (other than securities) or (iv) the credit ratingsassigned to the 4.50% Notes by any two of Moody's Investors Service, Standard & Poor's and FitchRatings are lower than Ba2, BB and BB, respectively, or the 4.50% Notes are no longer rated by at leasttwo of these ratings services. Because of our current credit ratings, the 4.50% Notes are currentlyconvertible into approximately 64.4 shares of our common stock.
Holders of the 4.50% Notes may require us to repurchase the 4.50% Notes on March 15, 2008 forcash and on March 15, 2013 and March 15, 2018 for cash or common stock or a combination of both, atour election. Additionally, investors may require us to repurchase the 4.50% Notes in the event of certainchange of control events that occur prior to March 15, 2008 for cash or common stock or a combination ofboth, at our election. If at any time on or after March 13, 2003 we pay cash dividends on our commonstock, we will pay contingent interest in an amount equal to 100% of the per share cash dividend paid onthe common stock multiplied by the number of shares of common stock issuable upon conversion of the4.50% Notes. At our option, we may redeem the 4.50% Notes on or after September 15, 2009 for cash.The redemption price in each of these instances is 100% of the principal amount of the Notes beingredeemed, plus accrued and unpaid interest, if any. The 4.50% Notes also provide for an additional ""make-whole'' adjustment to the conversion rate in the event of a change of control meeting specified conditions.
In accordance with EITF Issue No. 03-6, Participating Securities and the Two Ì Class Method underFASB Statement No. 128, Earnings Per Share, the 4.50% Notes are considered securities with participationrights in earnings available to common stockholders due to the feature of these securities that allowsinvestors to participate in cash dividends paid on our common stock. For periods in which we experiencenet income, the impact of these securities' participation rights is included in the calculation of earnings pershare. For periods in which we experience a net loss, the 4.50% Notes have no impact on the calculationof earnings per share due to the fact that the holders of these securities do not participate in our losses.
See Note 19 for additional discussion of fair market value of our long-term debt.
Cash Poolings
The amount of our cash held by the banks under our international pooling arrangements is subject toa full right of offset against the amounts advanced to us, and the cash and advances are recorded net onour balance sheet. The gross amounts vary depending on how much funding is provided to agenciesthrough the pooling arrangements. At December 31, 2005 and 2004, cash of $842.6 and $939.9,respectively, was netted against an equal amount of advances under pooling arrangements. We typicallypay interest on the gross amounts of the advances and receive interest income on the cash deposited, albeitat a lower rate.
135

NOTES TO CONSOLIDATED FINANCIAL STATEMENTS Ì (Continued)
(Amounts in Millions, Except Per Share Amounts)
Credit Arrangements
We have committed and uncommitted credit facilities with various banks that permit borrowings atvariable interest rates. At December 31, 2005 and 2004, there were no borrowings under our committedfacilities. However, there were borrowings under the uncommitted facilities made by several of oursubsidiaries outside the U.S. totaling $53.7 and $67.8, respectively. We have guaranteed the repayment ofsome of these borrowings by our subsidiaries. The weighted-average interest rate on outstanding balancesunder the uncommitted short-term facilities at December 31, 2005 and 2004 was approximately 5% ineach year. A summary of our credit facilities is as follows:
December 31,
2005 2004
Total Amount Letters Total Total Amount Letters TotalFacility Outstanding of Credit Available Facility Outstanding of Credit Available
Committed
364-Day Revolving CreditFacility ÏÏÏÏÏÏÏÏÏÏÏÏÏÏÏÏ $ Ì $ Ì $ Ì $ Ì $250.0 $ Ì $ Ì $250.0
Three-Year Revolving CreditFacility ÏÏÏÏÏÏÏÏÏÏÏÏÏÏÏÏ 500.0 Ì 162.4 337.6 450.0 Ì 165.4 284.6
Other Facilities ÏÏÏÏÏÏÏÏÏÏÏ 0.7 Ì Ì 0.7 0.8 Ì Ì 0.8
$500.7 $ Ì $162.4 $338.3 $700.8 $ Ì $165.4 $535.4
Uncommitted
Non-U.S. ÏÏÏÏÏÏÏÏÏÏÏÏÏÏÏÏ $516.2 $53.7 $ Ì $462.5 $738.1 $67.8 $ Ì $670.3
Our primary bank credit agreement is a three-year revolving credit facility (as amended, ""Three-YearRevolving Credit Facility''). The Three-Year Revolving Credit Facility expires on May 9, 2007 andprovides for borrowings of up to $500.0, of which $200.0 is available for the issuance of letters of credit.This facility was amended as of October 17, 2005 to increase the amount that we may borrow under thefacility by $50.0 to $500.0. Our $250.0 364-Day Revolving Credit Facility expired on September 30, 2005.The Three-Year Revolving Credit Facility has been modified multiple times since inception as notedbelow. We have been in compliance with all covenants under the Three-Year Revolving Credit Facility, asamended or waived from time to time.
Borrowings under the Three-Year Revolving Credit Facility are unsecured. Outstanding balances bearinterest at variable rates based on either LIBOR or a bank's base rate, at our option. The interest rates onLIBOR loans and base rate loans under the Three-Year Revolving Credit Facility are affected by thefacility's utilization levels and our credit ratings.
The original terms of the Three-Year Revolving Credit Facility restricted our ability to declare or paydividends, repurchase shares of common stock, make cash acquisitions or investments and make capitalexpenditures, as well as the ability of our subsidiaries to incur additional unsecured debt. The originalterms of the Three-Year Revolving Credit Facility limited annual cash consideration paid for acquisitionsto $100.0 in the aggregate for any calendar year, provided that amounts unused in any year could havebeen rolled over to the following years, but could not have exceeded $250.0 in any calendar year. Annualcommon stock buybacks and dividend payments on our capital stock were limited to $95.0 in the aggregatefor any calendar year, of which $45.0 could have been used for dividend payments on our convertiblepreferred stock and $50.0 could have been used for dividend payments on our capital stock (includingcommon stock) and for common stock buybacks. Any unused portion of the permitted amount of $50.0could have been rolled over into successive years; provided that the payments in any calendar year did notexceed $125.0 in the aggregate. Our permitted level of annual capital expenditures was limited to $225.0,provided that amounts unused in any year up to $50.0 could have been rolled over to the next year. These
136

NOTES TO CONSOLIDATED FINANCIAL STATEMENTS Ì (Continued)
(Amounts in Millions, Except Per Share Amounts)
terms were subsequently modified with three amendments made to the Three-Year Revolving CreditFacility on March 31, June 22 and September 27, 2005.
The March 31, 2005 waiver and amendment to the Three-Year Revolving Credit Facility, amongother things, (i) required us to maintain an ending balance of $225.0 of cash in domestic accounts withour lenders for the seven days preceding a borrowing, (ii) restricted cash consideration paid foracquisitions to less than $5.0 for the period between March 31, 2005 and July 11, 2005, and (iii) restrictedour ability to make certain restricted payments such as dividends until July 11, 2005 to paying dividendson our preferred stock and to repurchase capital stock in connection with employees' exercise of options.
The June 22, 2005 waiver and amendment to the Three-Year Revolving Credit Facility, among otherthings, (i) required us to maintain a daily ending balance of $225.0 of cash and securities in domesticaccounts with our lenders, (ii) restricted our ability to make cash acquisitions in excess of $7.5 in theaggregate until September 30, 2005, and (iii) restricted our ability to make certain restricted paymentssuch as dividends until September 30, 2005 to paying dividends on our preferred stock and to repurchasecapital stock in connection with employees' exercise of options.
The terms of the September 27, 2005 amendment to the Three-Year Revolving Credit Facility didnot permit us: (i) to make cash acquisitions in excess of $50.0 until October 2006, or thereafter in excessof $50.0 until expiration of the agreement in May 2007, subject to increases equal to the net cash proceedsreceived during the applicable period from any disposition of assets; (ii) to make capital expenditures inexcess of $210.0 annually; (iii) to repurchase or to declare or pay dividends on our capital stock (exceptfor any convertible preferred stock, convertible trust preferred instrument or similar security, whichincludes our outstanding 5.375% Series A Mandatory Convertible Preferred Stock), except that we mayrepurchase our capital stock in connection with the exercise of options by our employees or with proceedscontemporaneously received from an issue of new shares of our capital stock; or (iv) to incur new debt byour subsidiaries, other than unsecured debt incurred in the ordinary course of business of our subsidiariesoutside the U.S. and unsecured debt, which may not exceed $10.0 in the aggregate, incurred in theordinary course of business of our U.S. subsidiaries. In addition the daily ending balance of cash andsecurities requirement from the previous amendment was removed through this amendment.
The October 17, 2005 amendment increased the amount that we may borrow under the facility by$50.0 to $500.0.
The November 7, 2005 amendment, effective as of September 30, 2005, amended the financialcovenants with respect to the period ended September 30, 2005 and extended the period during whichlong-lived asset and impairment charges in an aggregate amount not in excess of $500.0 may berecognized and added back to the calculation of EBITDA.
The March 21, 2006 amendment, effective as of December 31, 2005, amended the financial covenantswith respect to periods ended December 31, 2005, March 31, 2006 and June 30, 2006 and certainprovisions relating to letters of credit, so that letters of credit issued under the facility may have expirationdates beyond the termination date of the facility, subject to certain conditions. Such conditions include,among others, the requirement for us, on the 105th day prior to the termination date of the facility, toprovide a cash deposit in an amount equal to the total amount of the outstanding letters of credit withexpiration dates beyond the termination date of the facility. The amendment also added one new financialcovenant so that we are required to maintain, based on a five business day testing period, in cash andsecurities, an average daily ending balance of $300.0 plus the aggregate principal amount of borrowingsunder the credit facility in domestic accounts with our lenders. We also obtained a waiver from the lendersunder the Three-Year Revolving Credit Facility on March 21, 2006 to waive any default arising from therestatement of our financial data presented in this report.
137

NOTES TO CONSOLIDATED FINANCIAL STATEMENTS Ì (Continued)
(Amounts in Millions, Except Per Share Amounts)
The Three-Year Revolving Credit Facility now contains revised financial covenants. These covenantshave been modified previously by amendments and waivers on March 31, 2005, June 22, 2005,September 27, 2005, November 7, 2005 (effective as of September 30, 2005) and March 21, 2006(effective as of December 31, 2005). The revisions in the covenants subsequent to each amendment aredetailed below. These covenants require us to maintain with respect to each fiscal quarter set forth below:
(i) an interest coverage ratio for the four fiscal quarters then ended of not less than that setforth opposite the corresponding quarter in the table below:
Year-EndOriginal Terms TermsCovenant Revisions Effective as of:
Four Fiscal Quarters Ending 5/10/04 3/31/05 6/22/05 9/27/05 9/30/05 12/31/05
December 31, 2004 ÏÏÏÏÏ 3.75 to 1 3.00 to 1
March 31, 2005 ÏÏÏÏÏÏÏÏ 3.75 to 1 3.75 to 1 2.40 to 1
June 30, 2005 ÏÏÏÏÏÏÏÏÏÏ 3.75 to 1 3.75 to 1 2.00 to 1
September 30, 2005ÏÏÏÏÏ 3.75 to 1 3.75 to 1 3.75 to 1 2.15 to 1 1.95 to 1
December 31, 2005 ÏÏÏÏÏ 3.75 to 1 3.75 to 1 3.75 to 1 1.75 to 1 1.75 to 1 *
March 31, 2006 ÏÏÏÏÏÏÏÏ 3.75 to 1 3.75 to 1 3.75 to 1 1.85 to 1 1.85 to 1 *
June 30, 2006 ÏÏÏÏÏÏÏÏÏÏ 3.75 to 1 3.75 to 1 3.75 to 1 1.45 to 1 1.45 to 1 *
September 30, 2006ÏÏÏÏÏ 3.75 to 1 3.75 to 1 3.75 to 1 1.75 to 1 1.75 to 1 1.75 to 1
December 31, 2006 ÏÏÏÏÏ 3.75 to 1 3.75 to 1 3.75 to 1 2.15 to 1 2.15 to 1 2.15 to 1
March 31, 2007 ÏÏÏÏÏÏÏÏ 3.75 to 1 3.75 to 1 3.75 to 1 2.50 to 1 2.50 to 1 2.50 to 1
* The March 21, 2006 amendment, effective as of December 31, 2005, removed the financial covenantrequirements with respect to the interest coverage ratio for the fiscal quarters ending December 31,2005, March 31, 2006 and June 30, 2006.
(ii) a debt to EBITDA ratio, where debt is the balance at period-end and EBITDA is for thefour fiscal quarters then ended, of not greater than that set forth opposite the corresponding quarter inthe table below:
Original Terms Covenant Revisions Effective as of: Year-End Terms
Four Fiscal Quarters Ending 5/10/04 3/31/05 6/22/05 9/27/05 9/30/05 12/31/05
December 31, 2004 ÏÏÏÏÏ 3.25 to 1 4.25 to 1
March 31, 2005 ÏÏÏÏÏÏÏÏ 3.25 to 1 3.25 to 1 4.80 to 1
June 30, 2005 ÏÏÏÏÏÏÏÏÏÏ 3.25 to 1 3.25 to 1 5.65 to 1
September 30, 2005ÏÏÏÏÏ 3.25 to 1 3.25 to 1 3.25 to 1 5.20 to 1 5.70 to 1
December 31, 2005 ÏÏÏÏÏ 3.25 to 1 3.25 to 1 3.25 to 1 6.30 to 1 6.30 to 1 *
March 31, 2006 ÏÏÏÏÏÏÏÏ 3.25 to 1 3.25 to 1 3.25 to 1 5.65 to 1 5.65 to 1 *
June 30, 2006 ÏÏÏÏÏÏÏÏÏÏ 3.25 to 1 3.25 to 1 3.25 to 1 6.65 to 1 6.65 to 1 *
September 30, 2006ÏÏÏÏÏ 3.25 to 1 3.25 to 1 3.25 to 1 5.15 to 1 5.15 to 1 5.15 to 1
December 31, 2006 ÏÏÏÏÏ 3.25 to 1 3.25 to 1 3.25 to 1 4.15 to 1 4.15 to 1 4.15 to 1
March 31, 2007 ÏÏÏÏÏÏÏÏ 3.25 to 1 3.25 to 1 3.25 to 1 3.90 to 1 3.90 to 1 3.90 to 1
138

NOTES TO CONSOLIDATED FINANCIAL STATEMENTS Ì (Continued)
(Amounts in Millions, Except Per Share Amounts)
* The March 21, 2006 amendment, effective as of December 31, 2005, removed the financial covenantrequirements with respect to the debt to EBITDA ratio for the fiscal quarters ending December 31,2005, March 31, 2006 and June 30, 2006.
(iii) minimum levels of EBITDA for the four fiscal quarters then ended of not less than that setforth opposite the corresponding quarter in the table below:
Original Terms Covenant Revisions Effective as of: Year-End Terms
Four Fiscal Quarters Ending 5/10/04 3/31/05 6/22/05 9/27/05 9/30/05 12/31/05
December 31, 2004 ÏÏÏÏÏÏÏÏÏÏÏÏÏ $750.0 $550.0
March 31, 2005 ÏÏÏÏÏÏÏÏÏÏÏÏÏÏÏÏ 750.0 750.0 $470.0
June 30, 2005ÏÏÏÏÏÏÏÏÏÏÏÏÏÏÏÏÏÏ 750.0 750.0 400.0
September 30, 2005 ÏÏÏÏÏÏÏÏÏÏÏÏ 750.0 750.0 750.0 $435.0 $400.0
December 31, 2005 ÏÏÏÏÏÏÏÏÏÏÏÏÏ 750.0 750.0 750.0 360.0 360.0 $233.0
March 31, 2006 ÏÏÏÏÏÏÏÏÏÏÏÏÏÏÏÏ 750.0 750.0 750.0 400.0 400.0 175.0
June 30, 2006ÏÏÏÏÏÏÏÏÏÏÏÏÏÏÏÏÏÏ 750.0 750.0 750.0 340.0 340.0 100.0
September 30, 2006 ÏÏÏÏÏÏÏÏÏÏÏÏ 750.0 750.0 750.0 440.0 440.0 440.0
December 31, 2006 ÏÏÏÏÏÏÏÏÏÏÏÏÏ 750.0 750.0 750.0 545.0 545.0 545.0
March 31, 2007 ÏÏÏÏÏÏÏÏÏÏÏÏÏÏÏÏ 750.0 750.0 750.0 585.0 585.0 585.0
The terms used in these financial covenant ratios, including EBITDA, interest coverage and debt, aresubject to specific definitions set forth in the agreement. Under the definition set forth in the Three-YearRevolving Credit Facility, EBITDA is determined by adding to net income or loss the following items:interest expense, income tax expense, depreciation expense, amortization expense, and certain specifiedcash payments and non-cash charges subject to limitations on time and amount set forth in the agreement.Interest coverage is defined as a ratio of EBITDA of the period of four fiscal quarters then ended tointerest expense during such period.
We have in the past been required to seek and have obtained amendments and waivers of thefinancial covenants under our committed bank facility. There can be no assurance that we will be incompliance with these covenants in future periods. If we do not comply and are unable to obtain thenecessary amendments or waivers at that time, we would be unable to borrow or obtain additional lettersof credit under the Three-Year Revolving Credit Facility and could choose to terminate the facility andprovide a cash deposit in connection with any outstanding letters of credit. The lenders under the Three-Year Revolving Credit Facility would also have the right to terminate the facility, accelerate anyoutstanding principal and require us to provide a cash deposit in an amount equal to the total amount ofoutstanding letters of credit. The outstanding amount of letters of credit was $162.4 as of December 31,2005. We have not drawn under the Three-Year Credit Facility over the past two years, and we do notcurrently expect to do so. So long as there are no amounts to be accelerated under the Three-YearRevolving Credit Facility, termination of the facility would not trigger the cross-acceleration provisions ofour public debt.
Note 14: Convertible Preferred Stock
We currently have two series of convertible preferred stock outstanding: our 5.375% Series AMandatory Convertible Preferred Stock (""Series A Preferred Stock'') and our 5.25% Series B CumulativeConvertible Perpetual Preferred Stock (""Series B Preferred Stock'').
139

NOTES TO CONSOLIDATED FINANCIAL STATEMENTS Ì (Continued)
(Amounts in Millions, Except Per Share Amounts)
Series B Preferred Stock
On October 24, 2005, we completed a private offering of 0.525 shares of our Series B Preferred Stockat an aggregate offering price of $525.0. The net proceeds from the sale were approximately $507.3 afterdeducting discounts to the initial purchasers and the estimated expenses of the offering.
Each share of the Series B Preferred Stock has a liquidation preference of $1,000.00 per share and isconvertible at the option of the holder at any time into 73.1904 shares of our common stock, subject toadjustment upon the occurrence of certain events, which represents a conversion price of approximately$13.66, representing a conversion premium of approximately 30% over our closing stock price onOctober 18, 2005 of $10.51 per share. On or after October 15, 2010, each share of the Series B PreferredStock may be converted at our option if the closing price of our common stock multiplied by theconversion rate then in effect equals or exceeds 130% of the liquidation preference of $1,000.00 per sharefor 20 trading days during any consecutive 30 trading day period. Holders of the Series B Preferred Stockwill be entitled to an adjustment to the conversion rate if they convert their shares in connection with afundamental change meeting certain specified conditions.
The Series B Preferred Stock is junior to all of our existing and future debt obligations, on parity withour Series A Preferred Stock and senior to our common stock, with respect to payments of dividends andrights upon liquidation, winding up or dissolution, to the extent of the liquidation preference of$1,000.00 per share. There are no registration rights with respect to the Series B Preferred Stock, shares ofour common stock issuable upon conversion thereof or any shares of our common stock that may bedelivered in connection with a dividend payment.
In accordance with EITF Issue No. 03-6, Participating Securities and the Two Ì Class Method underFASB Statement No. 128, Earnings Per Share, the Series B Preferred Stock is not considered a securitywith participation rights in earnings available to common stockholders due to the contingent nature of theconversion feature of these securities.
Series A Preferred Stock
We currently have outstanding 7.475 shares of our Series A Preferred Stock with a liquidationpreference of $50.00 per share. On the automatic conversion date of December, 15, 2006, each share ofthe Series A Preferred Stock will convert, subject to certain adjustments, into between 3.0358 and3.7037 shares of our common stock, depending on the then-current market price of our common stock.
At any time prior to December 15, 2006, holders may elect to convert each share of their Series APreferred Stock, subject to certain adjustments, into 3.0358 shares of our common stock. If the closingprice per share of our common stock exceeds $24.71 for at least 20 trading days within a period of30 consecutive trading days, we may elect, subject to certain limitations, to cause the conversion of all ofthe shares of Series A Preferred Stock then outstanding into shares of our common stock at a conversionrate of 3.0358 shares of our common stock for each share of our Series A Preferred Stock.
The Series A Preferred Stock is junior to all of our existing and future debt obligations, on parity withour Series B Preferred Stock and senior to our common stock, with respect to payments of dividends andrights upon liquidation, winding up or dissolution, to the extent of the liquidation preference of $50.00 pershare.
In accordance with EITF Issue No. 03-6, the Series A Preferred Stock is considered a security withparticipation rights in earnings available to common stockholders due to the conversion feature of thesesecurities. For periods in which we experience net income, the impact of these securities' participationrights is included in the calculation of earnings per share. For periods in which we experience a net loss,
140

NOTES TO CONSOLIDATED FINANCIAL STATEMENTS Ì (Continued)
(Amounts in Millions, Except Per Share Amounts)
the Series A Preferred Stock has no impact on the calculation of earnings per share due to the fact thatthe holders of these securities do not participate in our losses.
Payment of Dividends
We have not paid any dividends on our common stock since December of 2002. Our ability to declareor pay dividends on common stock is currently restricted by the terms of our Three-Year Revolving CreditFacility. In addition, the terms of our outstanding series of preferred stock do not permit us to paydividends on our common stock unless all accumulated and unpaid dividends have been orcontemporaneously are declared and paid, or provision for the payment thereof has been made.
We pay annual dividends on each share of Series A Preferred Stock in the amount of $2.6875.Annual dividends on each share of Series A Preferred Stock are payable quarterly in cash or, if certainconditions are met, in common stock, at our option, on March 15, June 15, September 15 andDecember 15 of each year. In addition to the stated annual dividend, if at any time on or beforeDecember 15, 2006, we pay a cash dividend on our common stock, the holders of Series A PreferredStock participate in such distributions via adjustments to the conversion ratio, thereby increasing thenumber of common shares into which the Preferred Stock will ultimately convert. In March 2006, theBoard of Directors declared a dividend of $0.671875 per share on our Series A Preferred Stock, resultingin a maximum possible aggregate dividend of $5.0.
We pay annual dividends on each share of Series B Preferred Stock in the amount of $52.50 pershare. The initial dividend on our Series B Preferred Stock is $11.8125 per share and was declared onDecember 19, 2005 payable in cash on January 17, 2006. Annual dividends on each share of Series BPreferred Stock are payable quarterly in cash or, if certain conditions are met, in common stock, at ouroption, on January 15, April 15, July 15 and October 15 of each year. The dividend rate of the Series BPreferred Stock will be increased by 1.0% if we do not pay dividends on the Series B Preferred Stock forsix quarterly periods (whether consecutive or not). The dividend rate will revert back to the original rateonce all unpaid dividends are paid in full. The dividend rate of the Series B Preferred Stock will also beincreased by 1.0% if we do not file our periodic reports with the SEC within 15 days after the requiredfiling date during the first two year period following the closing of the offering. In March 2006, the Boardof Directors declared a dividend of $13.125 per share on our Series B Preferred Stock, resulting in amaximum possible aggregate dividend of $6.9.
Dividends on each share of preferred stock are cumulative from the date of issuance and are payableon each payment date to the extent that: we are in compliance with our Three-Year Revolving CreditFacility, assets are legally available to pay dividends and our Board of Directors or an authorizedcommittee of our Board declares a dividend payable. If we do not pay dividends on any series of ourpreferred stock for six quarterly periods (whether consecutive or not), then holders of all series of ourpreferred stock then outstanding will have the right to elect two additional directors to the Board. Theseadditional directors will remain on the Board until all accumulated and unpaid dividends on ourcumulative preferred stock have been paid in full, or to the extent our series of non-cumulative preferredstock is outstanding, until non-cumulative dividends have been paid regularly for at least one year.
Note 15: Incentive Plans
We issue stock and cash based incentive awards to our employees under a plan established by theCompensation Committee and approved by our shareholders. Common stock may be granted under thecurrent plan, up to 4.5 shares for stock options and 14.0 shares for awards other than stock options,however there are limits as to the number of shares available for certain awards and to any one participant.Additional stock options and shares for awards other than stock options may be granted under the currentplan if stock options and shares for awards other than stock options previously awarded under prior year
141

NOTES TO CONSOLIDATED FINANCIAL STATEMENTS Ì (Continued)
(Amounts in Millions, Except Per Share Amounts)
compensation plans are forfeited. During the year ended December 31, 2005, forfeitures of stock optionsand shares for awards other than stock options previously granted of 6.2 and 1.9, respectively, resulted inan additional 8.1 shares available to be issued in future awards. At December 31, 2005, there were8.2 shares for stock options and 2.3 shares for awards other than stock options that were available underthe plan.
Stock Options
Stock options are granted at the fair market value of our common stock on the date of grant and aregenerally exercisable between two and five years after the date of grant and expire ten years from the grantdate.
Following is a summary of stock option transactions during the three-year period ended December 31:
2005 2004 2003
Weighted- Weighted- Weighted-Average Average AverageExercise Exercise Exercise
Options Price Options Price Options Price
Stock options, beginning of yearÏÏÏÏ 39.5 $26.36 41.9 $26.60 42.3 $29.35
Options granted ÏÏÏÏÏÏÏÏÏÏÏÏÏÏÏÏÏ 3.3 12.39 2.2 14.14 6.4 10.60
Options exercised ÏÏÏÏÏÏÏÏÏÏÏÏÏÏÏÏ (0.2) 10.75 (0.7) 10.64 (0.1) 10.49
Options cancelled, forfeited andexpiredÏÏÏÏÏÏÏÏÏÏÏÏÏÏÏÏÏÏÏÏÏÏÏ (6.3) 26.91 (3.9) 25.40 (6.7) 29.23
Stock options, end of yearÏÏÏÏÏÏÏÏÏ 36.3 25.06 39.5 26.36 41.9 26.60
Options exercisable at year-end ÏÏÏÏ 32.9 26.39 21.1 28.94 20.8 27.49
The following table summarizes information about stock options outstanding and exercisable atDecember 31, 2005:
Options Outstanding Options Exercisable
Weighted-Average Weighted- Weighted-
Number of Remaining Average Number of AverageOptions Contractual Life Exercise Price Options Exercise Price
Range of Exercise Prices
$ 9.12 to $14.99ÏÏÏÏÏÏÏÏÏÏÏÏÏÏÏ 10.2 8.1 $11.79 6.8 $11.46
$15.00 to $24.99ÏÏÏÏÏÏÏÏÏÏÏÏÏÏÏ 7.3 2.0 18.90 7.3 18.90
$25.00 to $34.99ÏÏÏÏÏÏÏÏÏÏÏÏÏÏÏ 12.2 4.6 31.26 12.2 31.26
$35.00 to $56.28ÏÏÏÏÏÏÏÏÏÏÏÏÏÏÏ 6.6 4.5 40.95 6.6 40.95
36.3 25.06 32.9 26.39
Acceleration of Stock Options
On December 20, 2005, the Compensation Committee approved the immediate acceleration of vestingof all of our ""out-of-the-money'' outstanding and unvested stock options previously awarded to ouremployees under equity compensation plans, excluding unvested options (1) granted during the 2005calendar year, (2) held by our CEO or CFO or (3) held by non-management directors. All of theoutstanding non-excluded unvested options were considered ""out-of-the-money'' if on December 20, 2005,the options had per share exercise prices equal to or in excess of $9.585, the average of the high and lowprice per share as quoted on the New York Stock Exchange on that date. As a result of the accelerated
142
NOTES TO CONSOLIDATED FINANCIAL STATEMENTS Ì (Continued)
(Amounts in Millions, Except Per Share Amounts)
vesting, options to purchase approximately 7.8 shares of our common stock became exercisableimmediately. The weighted-average exercise price of the options subject to the acceleration was $18.40 pershare. The number of shares, exercise prices and other terms of the options subject to the accelerationremain unchanged. The options are exercisable under their modified terms; however we were unable toissue securities upon the exercise of stock options due to the SEC's position concerning our ineligibility touse the applicable registration forms.
The accelerated vesting eliminates the future compensation expense that we would otherwiserecognize in our Consolidated Statements of Operations with respect to these options upon the adoption ofSFAS No. 123R (revised 2004), Share-Based Payment, as of January 1, 2006. The accelerated vesting ofthese stock options is expected to reduce the non-cash compensation expense that would have beenrecorded in the Consolidated Statements of Operations by $26.7 over the course of the original vestingperiods through 2009. Upon adoption of SFAS No. 123R, we will recognize compensation expense relatedto any unvested options as of that date, as well as any options granted on or after that date. Since most ofthe accelerated options are considerably ""out-of-the-money,'' we expect that the accelerated vesting ofthese stock options will have a positive effect on employee retention and perception of stock option value.Because our near-term, share-based compensation expenses were reduced by the acceleration of vesting,share-based compensation expenses could grow significantly in future periods if we continue to grantamounts of new share-based compensation awards similar to recent periods.
As of January 1, 2006, we plan to implement SFAS No. 123R using the modified prospectivemethod, which requires that compensation expense be recorded for all unvested stock options and otherequity-based awards. We estimate the impact of applying the provisions of SFAS No. 123R will result inan incremental expense in our Consolidated Statements of Operations of approximately $15.5 from 2006through 2011 related to the outstanding options as of December 31, 2005. See Note 22 for furtherexplanation.
Restricted Stock and Performance-Based Stock
Restricted stock is granted to certain key employees and is subject to certain restrictions and vestingrequirements as determined by the Compensation Committee. The vesting period is generally two to fiveyears. No monetary consideration is paid by a recipient for a restricted stock award and the fair value ofthe shares on the grant date is amortized over the vesting period. There were 10.1 and 7.5 shares ofrestricted stock outstanding at December 31, 2005 and 2004, respectively. We awarded 5.2 shares,4.1 shares and 0.5 shares of restricted stock with a weighted-average grant date fair value of $12.13, $13.72and $11.51 during 2005, 2004 and 2003, respectively. The expense recorded for restricted stock awards, netof forfeitures, was $39.9, $31.1 and $34.9 during 2005, 2004 and 2003, respectively.
Performance-based stock awards are a form of stock-award in which the number of shares ultimatelyreceived by the holder depends on our performance against specific performance targets. Performance-based stock awards were granted to certain key employees and were subject to certain restrictions andvesting requirements as determined by the Compensation Committee. The awards generally vest over athree-year period tied to the employees' continuing employment and the achievement of certainperformance conditions. No monetary consideration is paid by a recipient for a performance-based stockaward and the fair value of the shares on the grant date is amortized over the vesting period. AtDecember 31, 2005, there were 2.1 shares of the performance-based stock outstanding. During 2005, weawarded 2.3 shares of performance-based stock with a weighted-average grant date fair value of $12.09.The expense recorded for the performance-based stock awards, net of forfeitures, was $3.0 during 2005.
143

NOTES TO CONSOLIDATED FINANCIAL STATEMENTS Ì (Continued)
(Amounts in Millions, Except Per Share Amounts)
Restricted Stock Units and Share Appreciation Performance-Based Units
Restricted stock units are granted to employees and generally vest in three years. The grantee isentitled to receive a payment in cash or in shares of common stock, at the discretion of the Company,based on the fair market value of the corresponding number of shares of common stock upon completionof the vesting period. The holder of restricted stock units has no ownership interest in the underlyingshares of common stock until the restricted stock units vest and the shares of common stock are issued. AtDecember 31, 2005, there were 2.4 restricted stock units outstanding. During 2005 and 2004, we awarded1.6 and 1.0 shares of restricted stock units with a weighted-average grant date fair value of $12.09 and$13.41, respectively. The expense recorded for the restricted stock units, net of forfeitures, was $4.3 and$2.2 during 2005 and 2004, respectively.
In 2005, we granted Michael Roth, Chairman of the Board and Chief Executive Officer, 0.3 shareappreciation performance-based units (""SAPUs'') based on a weighted-average grant date stock price of$12.17. Based on the discretion of the Company, the grantee is entitled to receive a payment in cash orshares of common stock upon completion of the four-year vesting period. The holder of the SAPUs has noownership interest in the underlying shares of common stock until the SAPUs vest and the shares ofcommon stock are issued. No expense was recorded for the SAPUs, as the awards were ""out-of-the-money'' due to the exercise price exceeding the market price during 2005.
Performance Units
Before December 2003, performance units had been awarded to certain key employees. The payoutfor these performance units was contingent upon the annual growth in profits (as defined) over theperformance periods. The awards are generally paid in cash. The projected value of these units is accruedand charged to expense over the performance period. The expense recorded for performance units, net offorfeitures, was $5.3, $12.1 and $19.7 during 2005, 2004 and 2003, respectively. In December 2003, theCompensation Committee terminated the existing Performance Units Plan. Final payments under this plantotaling approximately $9.6 are expected to be made in 2006.
Note 16: Employee Benefits
Pension Plans
Through March 31, 1998, we had a defined benefit plan (""Domestic Plan'') which coveredsubstantially all regular domestic employees. In 1992, the Domestic Plan was amended to offer new planparticipants a cash balance benefit as opposed to a career pay formula benefit which was the previous planformula prior to the amendment. Under the cash balance benefit, participants were credited with anannual allocation equal to a percentage of their compensation, ranging from 1.5% to 5.0%, based on theparticipant's age and years of service. For pre-1992 participants, the benefit is the greater of the cashbalance account or the career pay formula benefit. Under the career pay formula benefit, annual accrualswere earned based on 1.0% of compensation up to $15,000 (actual number) plus 1.3% of compensationabove $15,000 (actual number). Participants are eligible to receive their benefit in the form of a lumpsum payment or as an annuity. Effective April 1, 1998, plan participation and benefit accruals for thisDomestic Plan were frozen and participants with five or less years of service became fully vested. As ofDecember 31, 2005, there were approximately 4,900 participants (actual number) in the Domestic Plan.Participants with five or more years of participation in the Domestic Plan as of March 31, 1998 retainedtheir vested balances in the Domestic Plan and also became eligible for payments under a newcompensation arrangement, the ""Supplemental Compensation Plan'' (described below). One of ouragencies has an additional domestic plan covering approximately 200 employees (actual number). Thisplan is closed to new participants.
144

NOTES TO CONSOLIDATED FINANCIAL STATEMENTS Ì (Continued)
(Amounts in Millions, Except Per Share Amounts)
We also have numerous plans outside the United States, some of which are funded, while othersprovide payments at the time of retirement or termination under applicable labor laws or agreements. TheInterpublic Pension Plan in the UK (""UK Pension Plan'') is the most material foreign pension plan interms of the liability and plan assets. The UK Pension Plan is a defined benefit plan offering planparticipants a final average pay benefit. Under the final average pay benefit formula, the normal retirementbenefit is 1.67% of final average pay per each year of service, where final average pay is the highestconsecutive 36 months of pay out of the last ten years prior to retirement. Effective November 1, 2002,the UK Pension Plan was closed to new entrants, but existing participants continue to earn benefits underthe plan. New employees after November 1, 2002 may be eligible to join the industry wide plan thatoperates on a defined contribution basis. As of December 31, 2005, there were approximately 1,800participants (actual number) in the UK Pension Plan.
During 2005, we identified certain additional foreign pension plans. We have included the net periodiccost, as well as the benefit obligations and assets related to these plans as of and for the year endedDecember 31, 2005. The benefit obligations and plan assets are classified as ""other'' adjustments withinthe Pension and Postretirement Benefit Obligation table below. These plans do not have a material impacton our Consolidated Balance Sheets or Statements of Operations in 2005 or 2004.
Postretirement Benefit Plans
Some of our subsidiaries provide postretirement health benefits to eligible employees and theirdependents and postretirement life insurance to eligible employees. For domestic employees to be eligiblefor postretirement health benefits, an employee had to be hired prior to January 1, 1988. Benefits areprovided to retirees before and after eligibility for Medicare, and the Company's cost is limited to $7,000(actual number) per covered individual pre-Medicare eligibility and $2,000 (actual number) per coveredindividual post-Medicare eligibility. For both pre-Medicare and post-Medicare retirees, prescription drugcoverage is included in the benefits that are subject to the cap. Employees that retired prior to May 1,1993 and their dependents are not subject to the annual cap on company costs. Retiree contributions arerequired for pre-Medicare coverage. To be eligible for life insurance, an employee had to be hired prior toDecember 1, 1961. As of December 31, 2005, there were approximately 1,400 participants (actualnumber) in the postretirement health benefits plan and approximately 230 participants (actual number) inthe postretirement life insurance plan.
In addition to the participants in the postretirement health benefits plan described above, certaindomestic employees of the former True North Communications companies acquired in June 2001 andtheir dependents are eligible for postretirement health benefits and life insurance. Generally, onlyemployees hired prior to June 22, 2001 are eligible for coverage. Certain cost-sharing features andlimitations on Company cost apply to most of these participants. As of December 31, 2005, there wereapproximately 2,300 participants (actual number) in both the True North postretirement health benefitsplan and postretirement life insurance plan.
Our postretirement health benefits plans are unfunded, and the Company pays claims as presented bythe plans' administrator. The postretirement life insurance plan is insured and the Company payspremiums to the plan administrator.
In December 2003, the Medicare Prescription Drug, Improvement and Modernization Act of 2003(the ""Act'') was enacted. The Act established a prescription drug benefit under Medicare, known as""Medicare Part D,'' and a federal subsidy to sponsors of postretirement health benefits plans that provide abenefit that is at least actuarially equivalent to the Medicare Part D benefit. The prescription drug benefitprovided to certain participants in the postretirement medical plan is at least actuarially equivalent to theMedicare Part D benefit, and, accordingly, we are entitled to a subsidy. Our application for the subsidy forour retirees was accepted by the Department of Health and Human Services, with the exception of certain
145

NOTES TO CONSOLIDATED FINANCIAL STATEMENTS Ì (Continued)
(Amounts in Millions, Except Per Share Amounts)
participants of the True North postretirement benefit plan, whose benefits we believe are not actuariallyequivalent to the Medicare Part D benefit and, therefore, not eligible for the Medicare Part D subsidy. Wehave adopted FASB Staff Position (""FSP'') No. FAS 106-2, Accounting and Disclosure RequirementsRelated to the Medicare Prescription Drug, Improvement and Modernization Act of 2003, prospectivelyfrom July 1, 2004. The expected subsidy reduced the accumulated postretirement benefit obligation by$5.0 at adoption, and the net periodic cost by $1.0 and $0.3 for 2005 and 2004, respectively, as comparedwith the amount calculated without considering the effects of the subsidy.
Pension and Postretirement Net Periodic Cost
We use a measurement date of December 31 for all material plans. The following table identifies thecomponents of net periodic cost for the domestic pension plans, the principal foreign pension plans, andthe post retirement benefit plans.
Postretirement BenefitDomestic Pension Plans Foreign Pension Plans Plans
For the Years Ended December 31, 2005 2004 2003 2005 2004 2003 2005 2004 2003
Service cost ÏÏÏÏÏÏÏÏÏÏÏÏÏÏÏÏÏÏÏÏÏÏÏ $ 0.7 $ 0.7 $ 0.7 $ 17.2 $ 17.1 $15.6 $ 0.7 $0.4 $ 0.6
Interest cost ÏÏÏÏÏÏÏÏÏÏÏÏÏÏÏÏÏÏÏÏÏÏÏ 8.6 8.7 9.7 21.7 18.1 14.7 3.8 3.9 3.1
Expected return on plan assets ÏÏÏÏÏÏÏ (9.4) (9.9) (7.3) (14.9) (11.6) (9.0) Ì Ì Ì
Curtailment gains ÏÏÏÏÏÏÏÏÏÏÏÏÏÏÏÏÏÏ Ì Ì Ì (2.2) Ì Ì Ì Ì Ì
Settlement losses ÏÏÏÏÏÏÏÏÏÏÏÏÏÏÏÏÏÏÏ Ì Ì Ì 1.4 Ì Ì Ì Ì Ì
Special termination benefitsÏÏÏÏÏÏÏÏÏÏ Ì Ì Ì 4.9 Ì Ì Ì Ì Ì
Amortization of:
Transition obligation ÏÏÏÏÏÏÏÏÏÏÏÏÏÏ Ì Ì Ì 1.4 Ì 1.4 0.1 0.2 0.2
Prior service cost ÏÏÏÏÏÏÏÏÏÏÏÏÏÏÏÏÏ (0.2) (0.1) (0.2) 0.1 Ì 0.1 (0.1) Ì Ì
Unrecognized actuarial losses (gains) 6.3 4.1 6.1 6.7 4.9 3.5 0.9 0.4 (0.1)
Other ÏÏÏÏÏÏÏÏÏÏÏÏÏÏÏÏÏÏÏÏÏÏÏÏÏÏÏÏ Ì Ì Ì 0.8 Ì Ì Ì Ì Ì
Net periodic costÏÏÏÏÏÏÏÏÏÏÏÏÏÏÏÏÏÏÏ $ 6.0 $ 3.5 $ 9.0 $ 37.1 $ 28.5 $26.3 $ 5.4 $4.9 $ 3.8
The weighted-average assumptions used to determine the net periodic cost are as follows:
Domestic Pension Plans Foreign Pension Plans Postretirement Benefit Plans
For the Years Ended December 31, 2005 2004 2003 2005 2004 2003 2005 2004 2003
Discount rate ÏÏÏÏÏÏÏÏÏÏÏÏÏÏÏÏÏÏÏ 5.45% 6.15% 6.60% 4.81% 5.20% 5.40% 5.50% 6.25% 6.75%
Rate of compensation increase ÏÏÏÏÏ N/A N/A N/A 3.26% 3.50% 3.10% N/A N/A N/A
Expected return on plan assets ÏÏÏÏÏ 8.63% 8.65% 8.65% 6.28% 6.35% 6.50% N/A N/A N/A
146

NOTES TO CONSOLIDATED FINANCIAL STATEMENTS Ì (Continued)
(Amounts in Millions, Except Per Share Amounts)
Pension and Postretirement Benefit Obligation
We use a measurement date of December 31 for all material plans. The change in the benefitobligation, the change in plan assets, the funded status and amounts recognized for the domestic pensionplans, the principal foreign pension plans, and the postretirement benefit plans are as follows:
Domestic Pension Foreign Pension PostretirementPlans Plans Benefit Plans
For the Years Ended December 31, 2005 2004 2005 2004 2005 2004
Change in projected benefit obligationProjected benefit obligation at January 1ÏÏÏÏÏÏÏ $167.6 $154.8 $ 447.5 $ 356.6 $ 72.2 $ 62.1Service cost ÏÏÏÏÏÏÏÏÏÏÏÏÏÏÏÏÏÏÏÏÏÏÏÏÏÏÏÏÏÏÏ 0.7 0.7 17.2 17.1 0.7 0.4Interest cost ÏÏÏÏÏÏÏÏÏÏÏÏÏÏÏÏÏÏÏÏÏÏÏÏÏÏÏÏÏÏÏ 8.6 8.7 21.7 18.1 3.8 3.9Benefits paid ÏÏÏÏÏÏÏÏÏÏÏÏÏÏÏÏÏÏÏÏÏÏÏÏÏÏÏÏÏÏ (13.4) (14.2) (25.3) (16.3) (6.4) (7.0)Plan participant contributions ÏÏÏÏÏÏÏÏÏÏÏÏÏÏÏÏ Ì Ì 2.9 2.7 1.4 1.3Plan amendments ÏÏÏÏÏÏÏÏÏÏÏÏÏÏÏÏÏÏÏÏÏÏÏÏÏÏ Ì Ì Ì Ì (1.2) ÌActuarial losses ÏÏÏÏÏÏÏÏÏÏÏÏÏÏÏÏÏÏÏÏÏÏÏÏÏÏÏÏ 5.5 17.6 49.7 38.8 2.7 11.5Curtailments ÏÏÏÏÏÏÏÏÏÏÏÏÏÏÏÏÏÏÏÏÏÏÏÏÏÏÏÏÏÏ Ì Ì (2.4) Ì Ì ÌSettlements ÏÏÏÏÏÏÏÏÏÏÏÏÏÏÏÏÏÏÏÏÏÏÏÏÏÏÏÏÏÏÏ Ì Ì (5.3) Ì Ì ÌSpecial termination benefitsÏÏÏÏÏÏÏÏÏÏÏÏÏÏÏÏÏÏ Ì Ì 4.9 Ì Ì ÌForeign currency effectÏÏÏÏÏÏÏÏÏÏÏÏÏÏÏÏÏÏÏÏÏÏ Ì Ì (49.3) 28.8 Ì ÌOther ÏÏÏÏÏÏÏÏÏÏÏÏÏÏÏÏÏÏÏÏÏÏÏÏÏÏÏÏÏÏÏÏÏÏÏÏ Ì Ì 35.5 1.7 Ì Ì
Projected benefit obligation at December 31ÏÏÏÏ $169.0 $167.6 $ 497.1 $ 447.5 $ 73.2 $ 72.2
Change in fair value of plan assetsFair value of plan assets at January 1 ÏÏÏÏÏÏÏÏÏ $119.2 $ 93.6 $ 213.6 $ 179.0 $ Ì $ ÌActual return on plan assets ÏÏÏÏÏÏÏÏÏÏÏÏÏÏÏÏÏ 9.4 7.7 48.0 20.7 Ì ÌEmployer contributionsÏÏÏÏÏÏÏÏÏÏÏÏÏÏÏÏÏÏÏÏÏÏ 1.1 32.1 33.0 15.1 5.0 5.7Plan participant contributions ÏÏÏÏÏÏÏÏÏÏÏÏÏÏÏÏ Ì Ì 2.9 2.7 1.4 1.3Benefits paid ÏÏÏÏÏÏÏÏÏÏÏÏÏÏÏÏÏÏÏÏÏÏÏÏÏÏÏÏÏÏ (13.4) (14.2) (25.3) (16.3) (6.4) (7.0)Settlements ÏÏÏÏÏÏÏÏÏÏÏÏÏÏÏÏÏÏÏÏÏÏÏÏÏÏÏÏÏÏÏ Ì Ì (5.3) Ì Ì ÌForeign currency effectÏÏÏÏÏÏÏÏÏÏÏÏÏÏÏÏÏÏÏÏÏÏ Ì Ì (24.6) 13.1 Ì ÌOther ÏÏÏÏÏÏÏÏÏÏÏÏÏÏÏÏÏÏÏÏÏÏÏÏÏÏÏÏÏÏÏÏÏÏÏÏ Ì Ì 33.0 (0.7) Ì Ì
Fair value of plan assets at December 31 ÏÏÏÏÏÏ $116.3 $119.2 $ 275.3 $ 213.6 $ Ì $ Ì
Reconciliation of funded status to total amountrecognized
Funded status of the plansÏÏÏÏÏÏÏÏÏÏÏÏÏÏÏÏÏÏÏ $(52.7) $(48.4) $(221.8) $(233.9) $(73.2) $(72.2)Unrecognized net actuarial losses ÏÏÏÏÏÏÏÏÏÏÏÏÏ 77.5 78.4 111.9 112.4 22.8 21.0Unrecognized prior service costÏÏÏÏÏÏÏÏÏÏÏÏÏÏÏ 0.6 0.3 0.2 0.4 (1.1) ÌUnrecognized transition cost ÏÏÏÏÏÏÏÏÏÏÏÏÏÏÏÏÏ Ì Ì 1.4 3.2 1.1 1.2
Net asset (liability) recognizedÏÏÏÏÏÏÏÏÏÏÏÏÏÏÏ $ 25.4 $ 30.3 $(108.3) $(117.9) $(50.4) $(50.0)
Amounts recognized in consolidated balancesheet
Accrued benefit liabilityÏÏÏÏÏÏÏÏÏÏÏÏÏÏÏÏÏÏÏÏÏ $(47.4) $(43.9) $(182.0) $(201.1) $(50.4) $(50.0)Intangible asset ÏÏÏÏÏÏÏÏÏÏÏÏÏÏÏÏÏÏÏÏÏÏÏÏÏÏÏÏ 0.6 0.3 1.1 2.9 Ì Ì
Accumulated other comprehensive loss ÏÏÏÏÏÏ 72.2 73.9 72.6 80.3 Ì Ì
Net asset (liability) recognizedÏÏÏÏÏÏÏÏÏÏÏÏÏ $ 25.4 $ 30.3 $(108.3) $(117.9) $(50.4) $(50.0)
Accumulated benefit obligation ÏÏÏÏÏÏÏÏÏÏÏÏÏÏ $163.7 $163.1 $ 454.6 $ 411.2
147

NOTES TO CONSOLIDATED FINANCIAL STATEMENTS Ì (Continued)
(Amounts in Millions, Except Per Share Amounts)
Differences between the aggregate balance sheet amounts listed above and the totals reported in ourConsolidated Balance Sheets and our Consolidated Statements of Stockholders' Equity and ComprehensiveIncome (Loss) relate to the non-material foreign plans.
The projected benefit obligation, accumulated benefit obligation and fair value of plan assets fordomestic pension plans with accumulated benefit obligations in excess of plan assets were $169.0, $163.7and $116.3, respectively, at December 31, 2005 and $167.6, $163.1 and $119.2, respectively, atDecember 31, 2004.
The projected benefit obligation, accumulated benefit obligation and fair value of plan assets forforeign pension plans with accumulated benefit obligations in excess of plan assets were $493.7, $452.5 and$271.9, respectively, at December 31, 2005 and $445.3, $409.0 and $211.3, respectively, at December 31,2004. Our foreign pension plans are largely under funded due to different funding incentives that existoutside of the U.S. In certain countries where we have major operations, there are no legal requirementsor financial incentives provided to companies to pre-fund pension obligations. In these instances, benefitpayments are typically paid directly from our cash as they become due.
The weighted-average assumptions used in determining the actuarial present value of our benefitobligations are as follows:
Domestic Pension Foreign Pension PostretirementPlans Plans Benefit Plans
At December 31, 2005 2004 2005 2004 2005 2004
Discount rate ÏÏÏÏÏÏÏÏÏÏÏÏÏÏÏÏÏÏÏÏÏÏÏÏÏÏÏÏÏÏÏÏ 5.41% 5.45% 4.34% 5.00% 5.50% 5.50%
Rate of compensation increase ÏÏÏÏÏÏÏÏÏÏÏÏÏÏÏÏÏÏ N/A N/A 3.28% 3.55% N/A N/A
Healthcare cost trend rate assumed for next yearInitial rate (weighted-average)ÏÏÏÏÏÏÏÏÏÏÏÏÏÏÏÏ 10.00% 9.00%
Year ultimate rate is reached ÏÏÏÏÏÏÏÏÏÏÏÏÏÏÏÏÏÏÏ 2015 2012
Ultimate rate ÏÏÏÏÏÏÏÏÏÏÏÏÏÏÏÏÏÏÏÏÏÏÏÏÏÏÏÏÏÏÏÏ 5.50% 5.50%
Determination of Discount Rates
For the domestic pension and postretirement benefit plans, we determine our discount rate based onthe estimated rate at which annuity contracts could be purchased to effectively settle the respective benefitobligations. In determining the discount rate, we utilize a yield curve based on high-quality corporatebonds. Each plan's projected cash flow is matched to this yield curve and a present value is developed,which is then used to develop a single equivalent discount rate. When identifying the bonds to be used, weexclude bonds with outlier yields as these bonds are more likely to be mispriced or misgraded.
For the foreign pension plans, we determine a discount rate by referencing market yields on highquality corporate bonds in the local markets with the appropriate term at December 31, 2005.
Determination of the Expected Return on Assets
For the Domestic Plan, we develop the long-term expected rate of return assumptions which we useto model and determine overall asset allocations. Our rate of return analyses factor in historical trends,current market conditions, risk premiums associated with asset classes, and long-term inflation rates. Wedetermine both a short-term (5-7 year) and long-term (30 year) view and then attempt to select a long-term rate of return assumption that matches the duration of our liabilities. Factors included in the analysisof returns include historical trends of asset class index returns over various market cycles and economicconditions.
148

NOTES TO CONSOLIDATED FINANCIAL STATEMENTS Ì (Continued)
(Amounts in Millions, Except Per Share Amounts)
Approximately 84% of the foreign plan assets are part of the UK Pension Plan. The UK PensionPlan's statement of investment principles specifies benchmark allocations by asset category for eachinvestment manager employed, with specified ranges around the central benchmark allocation. For the UKPension Plan, we determine the expected rate of return by utilizing the current long-term rates of returnavailable on government bonds and applying suitable risk premiums that consider historical market returnsand current market expectations.
Asset Allocation
The primary investment goal for our plans' assets is to maximize total asset returns while ensuring theplans' assets are available to fund the plans' liabilities as they become due. The plans' assets in aggregateand at the individual portfolio level are invested so that total portfolio risk exposure and risk-adjustedreturns best meet this objective.
As of December 31, 2005 our domestic and foreign (primarily the UK) pension plan target assetallocations for 2006, as well as the actual asset allocations at December 31, 2005 and 2004, are as follows:
Plan Assets at December 31,2006 TargetAllocation Domestic Foreign
Asset category Domestic Foreign 2005 2004 2005 2004
Equity securities ÏÏÏÏÏÏÏÏÏÏÏÏÏÏÏÏÏÏÏÏÏÏÏÏÏÏÏ 51% 64% 49% 54% 64% 73%
Fixed income securities ÏÏÏÏÏÏÏÏÏÏÏÏÏÏÏÏÏÏÏÏÏ 27% 28% 23% 21% 28% 18%
Real estate ÏÏÏÏÏÏÏÏÏÏÏÏÏÏÏÏÏÏÏÏÏÏÏÏÏÏÏÏÏÏÏÏ 9% 3% 9% 6% 3% 4%
Other ÏÏÏÏÏÏÏÏÏÏÏÏÏÏÏÏÏÏÏÏÏÏÏÏÏÏÏÏÏÏÏÏÏÏÏÏ 13% 5% 19% 19% 5% 5%
Total ÏÏÏÏÏÏÏÏÏÏÏÏÏÏÏÏÏÏÏÏÏÏÏÏÏÏÏÏÏÏÏÏÏÏÏ 100% 100% 100% 100% 100% 100%
The aggregate amount of our own stock held as investment for our domestic and foreign pensionfunds is considered negligible relative to the total fund assets.
Healthcare Cost Trend
Assumed healthcare cost trend rates have a moderate effect on the amounts reported for thepostretirement benefit plans. We develop our healthcare cost trend rate assumptions based on datacollected on recent trends and forecasts. A one percentage point change in assumed healthcare cost trendrates would have the following effects:
1% Increase 1% Decrease
Effect of a one percentage point change in assumed healthcare costtrend
-on total service and interest cost components ÏÏÏÏÏÏÏÏÏÏÏÏÏÏÏÏÏÏÏÏ $0.1 $(0.1)
-on postretirement benefit obligation ÏÏÏÏÏÏÏÏÏÏÏÏÏÏÏÏÏÏÏÏÏÏÏÏÏÏÏÏ $1.6 $(1.6)
Cash Flows
Contributions
For 2006, we expect to contribute $17.8 to fund our domestic pension plans, and expect to contribute$22.1 to our foreign pension plans. The minimum funding obligation for 2005 is $0 for our domesticpension plans and $12.7 for our foreign pension plans.
149

NOTES TO CONSOLIDATED FINANCIAL STATEMENTS Ì (Continued)
(Amounts in Millions, Except Per Share Amounts)
Estimated Future Payments
The following estimated future payments, which reflect future service, as appropriate, are expected tobe paid in the years indicated:
Domestic Foreign PostretirementYears Pension Plans Pension Plans Benefit Plans
2006 ÏÏÏÏÏÏÏÏÏÏÏÏÏÏÏÏÏÏÏÏÏÏÏÏÏÏÏÏÏÏÏÏÏÏÏÏÏÏÏÏÏÏÏÏÏÏÏ $12.1 $ 15.4 $ 6.6
2007 ÏÏÏÏÏÏÏÏÏÏÏÏÏÏÏÏÏÏÏÏÏÏÏÏÏÏÏÏÏÏÏÏÏÏÏÏÏÏÏÏÏÏÏÏÏÏÏ 13.2 18.3 6.6
2008 ÏÏÏÏÏÏÏÏÏÏÏÏÏÏÏÏÏÏÏÏÏÏÏÏÏÏÏÏÏÏÏÏÏÏÏÏÏÏÏÏÏÏÏÏÏÏÏ 13.1 17.2 6.5
2009 ÏÏÏÏÏÏÏÏÏÏÏÏÏÏÏÏÏÏÏÏÏÏÏÏÏÏÏÏÏÏÏÏÏÏÏÏÏÏÏÏÏÏÏÏÏÏÏ 12.0 24.0 6.5
2010 ÏÏÏÏÏÏÏÏÏÏÏÏÏÏÏÏÏÏÏÏÏÏÏÏÏÏÏÏÏÏÏÏÏÏÏÏÏÏÏÏÏÏÏÏÏÏÏ 12.5 19.2 6.5
2011-2015 ÏÏÏÏÏÏÏÏÏÏÏÏÏÏÏÏÏÏÏÏÏÏÏÏÏÏÏÏÏÏÏÏÏÏÏÏÏÏÏÏÏÏÏÏ 59.9 110.0 31.0
The estimated future payments for our postretirement benefit plans are before any estimated federalsubsidies expected to be received under the Act. Federal subsidies are estimated to range from $0.6 in2006, to $0.9 in 2010 and are estimated to be $5.3 for the period 2011-2015.
Supplemental Compensation Plan
As discussed above, participants with five or more years of participation in the Domestic Plan as ofMarch 31, 1998 became eligible for payments under the Supplemental Compensation Plan. Under theSupplemental Compensation Plan, each participant is eligible for an annual allocation, which approximatesthe projected discontinued pension benefit accrual (formerly made under the cash balance formula in theDomestic Plan) plus interest, while they continue to work for us. Participants in active service are eligibleto receive up to ten years of allocations coinciding with the number of years of plan participation in theDomestic Plan as of March 31, 1998. After five years of plan participation, a participant starts to receivean annual cash payment equal to 50% of the accumulated plan balance. Participants must be employedwith us as of the scheduled payment date to receive a payment. However, a participant is entitled to 100%of the accumulated plan balance at termination of employment if certain age and service requirements aremet. Payments began in 2003 and are scheduled to end in 2008. As of December 31, 2005 and 2004, theSupplemental Compensation Plan liability recorded on our Consolidated Balance Sheet was $7.3 and $9.7,respectively. Amounts expensed for the Supplemental Compensation Plan in 2005, 2004 and 2003 were$1.0, $5.4 and $3.4, respectively.
Savings Plans
We sponsor a defined contribution plan (""Savings Plan'') that covers substantially all domesticemployees. The Savings Plan permits participants to make contributions on a pre-tax and/or after-taxbasis. The Savings Plan allows participants to choose among various investment alternatives. We match aportion of participant contributions based upon their years of service. We contributed $29.9, $28.0 and$26.9 to the Savings Plan in 2005, 2004 and 2003, respectively.
Deferred Compensation and Benefit Arrangements
We have deferred compensation arrangements which (i) permit certain of our key officers andemployees to defer a portion of their salary or incentive compensation, or (ii) result in us contributing anamount to the participant's account. The arrangements typically provide that the participant will receivethe amounts deferred plus interest upon attaining certain conditions, such as completing a certain numberof years of service or upon retirement or termination. As of December 31, 2005 and 2004, the deferredcompensation liability balance recorded on our Consolidated Balance Sheets was $141.3 and $154.3,
150

NOTES TO CONSOLIDATED FINANCIAL STATEMENTS Ì (Continued)
(Amounts in Millions, Except Per Share Amounts)
respectively. Amounts expensed for deferred compensation arrangements in 2005, 2004 and 2003 were$10.2, $8.8 and $5.0, respectively.
We have deferred benefit arrangements with certain key officers and employees which provideparticipants with an annual payment, payable when the participant attains a certain age and after theparticipant's employment has terminated. The deferred benefit liability recorded on our ConsolidatedBalance Sheets at December 31, 2005 and 2004 was $151.5 and $128.3, respectively. Amounts expensedfor deferred benefit arrangements in 2005, 2004 and 2003 were $30.9, $17.1 and $12.7, respectively.
We use various actuarial methods and assumptions in determining our pension and postretirementbenefit costs and obligations, including the discount rate used to determine the present value of futurebenefits, expected long-term rate of return on plan assets and healthcare cost trend rates. A significantassumption used to estimate certain deferred benefit liabilities is a participant's retirement age. For one ofour more significant deferred benefit arrangements we determined that participants are eligible to retireand begin collecting their deferred benefits at age 60. Historically, based upon prior experience andtrending data we assumed that related participants would retire at age 65. However, more recentexperience indicates that a majority of eligible participants were retiring and beginning to collect theirdeferred benefits at age 60. Therefore, in conjunction with our annual review of pension and postretirementbenefit assumptions in the fourth quarter of 2005, we revised the assumed retirement age from 65 to 60within the related deferred benefit liability calculation. As a result of this change in estimate, during thefourth quarter of 2005 the deferred benefit expense increased salaries and related expenses on ourConsolidated Statements of Operations by $14.8, with a corresponding increase to the deferred benefitliability.
We have purchased life insurance policies on participants' lives to assist in the funding of the relateddeferred compensation and deferred benefit liabilities. As of December 31, 2005 and 2004, the cashsurrender value of these policies was $132.8 and $141.4, respectively. In addition to the life insurancepolicies, certain investments are held for the purpose of paying the deferred compensation and deferredbenefit liabilities. These investments, along with the life insurance policies, are held in a separate trust andare restricted for the purpose of paying the deferred compensation and the deferred benefit arrangementliabilities. As of December 31, 2005 and 2004, the value of such restricted assets was $86.1 and $80.2,respectively. The short-term investments, long-term investments and cash surrender value of the policies inthe trust are included in Other Current Assets, Investments and Other Assets, respectively, on ourConsolidated Balance Sheets.
Long-term Disability Plan
We have a Long-term Disability (""LTD'') plan which provides income replacement benefits toeligible participants who are unable to perform their job duties during the first 24 months of disability.Benefits are continued thereafter, provided the participants receive disability benefits from Social Security.As all income replacement benefits are fully insured, no related obligation is required at December 31,2005 and 2004. In addition to income replacement benefits, all LTD participants continue to receivemedical, dental and life insurance benefits up to age 65 (subject to minimum periods depending on theparticipants' age at time of disability). We have recorded an obligation of $9.3 and $6.1 as ofDecember 31, 2005 and 2004, respectively, related to medical, dental benefits and life insurance benefitsfor LTD participants.
Employee Stock Purchase Plan
Under the ESPP, employees could purchase our common stock through payroll deductions notexceeding 10% of their compensation. The price an employee paid for a share of stock under the ESPPwas 85% of the average market price on the last business day of each month. In 2005, 2004 and 2003, we
151

NOTES TO CONSOLIDATED FINANCIAL STATEMENTS Ì (Continued)
(Amounts in Millions, Except Per Share Amounts)
issued 0.1 shares, 0.7 shares and 0.9 shares, respectively, purchased by employees under the ESPP. Sharesissued to employees under the ESPP have no impact on our Consolidated Statements of Operations. Nostock was purchased under the ESPP during the second quarter of 2005. The ESPP expired effectiveJune 30, 2005 and shares are no longer available for issuance under the ESPP. See Note 22 for discussionof the impact of shares issued to employees under the ESPP upon our adoption of SFAS No. 123R.
In November 2005, the Company's stockholders approved the establishment of an Interpublic Groupof Companies Employee Stock Purchase Plan (the ""2006 Plan'') to replace the previously existing ESPP.Under the 2006 Plan, employees may purchase our common stock through payroll deductions notexceeding 10% of their compensation. The price an employee pays for a share of stock under the 2006Plan is 90% of the lesser of the market price of a share on the offering date or the market price of a shareon the last business day of the offering period of three months. An aggregate of 15.0 shares are reservedfor issuance under the 2006 Plan. Beginning on March 17, 2005 and ending on the filing date of thisannual report, we were unable to issue securities pursuant to the ESPP or the 2006 Plan due to the SEC'sposition concerning our ineligibility to use the applicable registration forms.
Note 17: Accumulated Other Comprehensive Income (Loss)
Comprehensive income (loss) is included on the Consolidated Statement of Stockholders' Equity andComprehensive Income (Loss). Accumulated other comprehensive loss, net of tax, is reflected in theConsolidated Balance Sheets as follows:
December 31,
2005 2004
Foreign currency translation adjustment ÏÏÏÏÏÏÏÏÏÏÏÏÏÏÏÏÏÏÏÏÏÏÏÏÏÏÏÏÏÏÏ $(188.8) $(145.8)
Adjustment for minimum pension liability, net ÏÏÏÏÏÏÏÏÏÏÏÏÏÏÏÏÏÏÏÏÏÏÏÏÏ (111.4) (112.8)
Unrealized holding gain on securities, netÏÏÏÏÏÏÏÏÏÏÏÏÏÏÏÏÏÏÏÏÏÏÏÏÏÏÏÏÏÏ 24.2 10.0
Accumulated other comprehensive loss, net of tax ÏÏÏÏÏÏÏÏÏÏÏÏÏÏÏÏÏÏÏÏÏÏ $(276.0) $(248.6)
Note 18: Derivative and Hedging Instruments
We periodically enter into interest rate swap agreements and forward contracts to manage exposure tointerest rate fluctuations and to mitigate foreign exchange volatility.
Interest Rate Swaps
During the fourth quarter of 2004, we executed three interest rate swaps which synthetically converted$350.0 of fixed rate debt to floating rates, to hedge a portion of our floating rate exposure on our cashinvestments. The interest rate swaps effectively converted the $350.0, 6.25% Senior Unsecured Notes dueNovember 2014 to floating rate debt and mature on the same day the debt is due. As of December 31,2004, the floating rate was approximately 4.2%. Under the terms of the interest rate swap agreement, wepaid a floating interest rate, based on one-month LIBOR plus an average spread of 176.6 basis points, andreceived the fixed interest rate of the underlying bond being hedged. Fair value adjustments decreased thecarrying amount of our debt outstanding at December 31, 2004 by approximately $1.7.
In January 2005, we executed an interest rate swap which synthetically converted an additional $150.0of fixed rate debt to floating rates. The interest rate swap effectively converted $150.0 of the $500.0,7.25% Senior Unsecured Notes due August 2011 to floating rate debt and matures on the same day thedebt is due. Under the terms of the interest rate swap agreement we paid a floating interest rate, based onone-month LIBOR plus a spread of 297.0 basis points, and received the fixed interest rate of theunderlying bond being hedged.
152
NOTES TO CONSOLIDATED FINANCIAL STATEMENTS Ì (Continued)
(Amounts in Millions, Except Per Share Amounts)
On May 25, 2005, we terminated all of our long-term interest rate swap agreements covering the$350.0, 6.25% Notes due November 2014 and $150.0 of the $500.0, 7.25% Notes due August 2011. Inconnection with the interest rate swap termination, our net cash receipts were approximately $1.1, whichwill be recorded as an offset to interest expense over the remaining life of the related debt.
We accounted for interest rate swaps related to our existing long-term debt as fair value hedges. As aresult, the incremental interest payments or receipts from the swaps were recorded as adjustments tointerest expense in the Consolidated Statement of Operations. The interest rate swaps settled on theunderlying bond interest payment dates until maturity. There was no assumed hedge ineffectiveness as theinterest rate swap terms matched the terms of the hedged bond.
Forward Contracts
We have entered into foreign currency transactions in which various foreign currencies are bought orsold forward. These contracts were entered into to meet currency requirements arising from specifictransactions. The changes in value of these forward contracts have been recorded as other income orexpense in our Consolidated Statement of Operations. As of December 31, 2005 and 2004, we hadcontracts covering approximately $6.2 and $1.8, respectively, of notional amount of currency and the fairvalue of the forward contracts was negligible.
Other
The terms of the 4.50% Notes include two embedded derivative instruments and our Series BPreferred Stock include one embedded derivative. The fair value of the three derivatives on December 31,2005 was negligible.
Note 19: Financial Instruments
The following table presents the carrying amounts and fair values of our financial instruments atDecember 31, 2005 and 2004. The carrying amounts reflected in our Consolidated Balance Sheet for cashand cash equivalents, accounts receivable, accounts payable, accrued expenses and short-term borrowingsapproximated their respective fair values at December 31, 2005 and 2004.
December 31,
2005 2004
Book Value Fair Value Book Value Fair Value
Investment securities:
Ì Marketable securities ÏÏÏÏÏÏÏÏÏÏÏÏÏÏÏÏÏ $ 115.6 $ 115.6 $ 420.0 $ 420.0
Ì Cost investmentsÏÏÏÏÏÏÏÏÏÏÏÏÏÏÏÏÏÏÏÏÏ 120.7 120.7 121.6 121.6
Ì Other investments ÏÏÏÏÏÏÏÏÏÏÏÏÏÏÏÏÏÏÏ 49.9 49.9 47.1 47.1
Long-term debt ÏÏÏÏÏÏÏÏÏÏÏÏÏÏÏÏÏÏÏÏÏÏÏÏÏÏ (2,149.2) (2,072.1) (2,152.0) (2,447.0)
Financial commitments:
Ì Other forward contractsÏÏÏÏÏÏÏÏÏÏÏÏÏÏÏ (4.5) (4.5) (4.0) (4.0)
Ì Put option obligations ÏÏÏÏÏÏÏÏÏÏÏÏÏÏÏÏ Ì Ì (10.1) (10.1)
Investment Securities
Marketable securities consisted primarily of available-for-sale equity securities that are publicly tradedand have been reported at fair value with net unrealized gains and losses reported as a component of othercomprehensive income. Cost investments consisted primarily of public available-for-sale equity securitiesaccounted for under the cost method. Other investments consisted primarily of investments in
153

NOTES TO CONSOLIDATED FINANCIAL STATEMENTS Ì (Continued)
(Amounts in Millions, Except Per Share Amounts)
unconsolidated affiliated companies accounted for under the equity method and have been carried at cost,which approximates fair value. Dividends received from our investments in unconsolidated affiliatedcompanies were $5.9, $9.3 and $8.8 in 2005, 2004 and 2003, respectively, and reduced the carrying valuesof the related investments. The estimated fair values of financial assets have been determined usingavailable market information and appropriate valuation methodologies. Judgment is required in interpretingmarket information to develop the estimated fair value amounts, and accordingly, changes in assumptionsand valuation methodologies may affect these amounts. In the absence of other evidence, cost is presumedto equal fair value for our cost and other investments. Net unrealized holding gains on our investmentswere $24.2, $10.0 and $3.4 at December 31, 2005, 2004 and 2003, respectively.
Long-Term Debt
Long-term debt included variable and fixed rate debt. The fair value of our long-term debtinstruments was based on market prices for debt instruments with similar terms and maturities. During2005 and 2004, we executed four interest rate swaps to hedge a portion of our floating rate debt exposure.The interest rate swaps were subsequently terminated in May of 2005. The fair value of the interest rateswap agreements was estimated based on quotes from the financial institutions of these instruments andrepresents the estimated amounts that we would expect to receive or pay to terminate the agreements atthe reporting date. Fair value adjustments increased/decreased the carrying value of our debt outstandingat December 31, 2004 by approximately $1.7, as discussed in Note 18.
Financial Commitments
Financial commitments include other forward contracts and put obligations. Other forward contractsrelated primarily to an obligation to repurchase 49% of the minority-owned equity shares of a consolidatedsubsidiary, valued pursuant to SFAS No. 150, Accounting for Certain Financial Instruments withCharacteristic of Both Liabilities and Equity. Fair value measurement of the obligation was based upon theamount payable as if the forward contract was settled at December 31, 2005 and 2004. Changes in the fairvalue of the obligation have been recorded as interest expense or income in the Consolidated Statement ofOperations.
Financial commitments included a written put option representing an obligation to repurchase 40% ofthe minority-owned equity shares of a consolidated subsidiary as of December 31, 2004. The put optionobligation has been marked-to-market by assessing the fair value of the 40% interest as compared to theamount payable if the put option was exercised at December 31, 2004. Changes in the fair value of the putoption obligation have been recorded as long-lived asset impairment and other charges in the ConsolidatedStatement of Operations. During the fourth quarter of 2005, the put option was exercised by the minorityowners and the existing put option obligation of $11.5 was relieved against the purchase price paid by theCompany.
Note 20: Segment Information
As of December 31, 2005, we are organized into five global operating divisions and a group of leadingstand-alone agencies. Our operating divisions are grouped into three reportable segments. The IANreportable segment is comprised of McCann, FCB, Lowe, Draft and our stand-alone agencies. CMGcomprises our second reportable segment. Our third reportable segment is comprised of our Motorsportsoperations, which were sold during 2004 and had immaterial residual operating results in 2005. We alsoreport results for the Corporate group. Future changes to our organizational structure may result inchanges to the reportable segment disclosure.
Within the IAN segment, McCann, FCB, Lowe, Draft and our stand-alone agencies provide acomprehensive array of global communications and marketing services, each offering a distinctive range of
154

NOTES TO CONSOLIDATED FINANCIAL STATEMENTS Ì (Continued)
(Amounts in Millions, Except Per Share Amounts)
solutions for our clients. Our leading stand-alone agencies, including Campbell-Ewald, Hill Holliday,Deutsch and Mullen, provide a full range of advertising, marketing communications services and/ormarketing services and partner with our global operating divisions as needed. Each of IAN's operatingdivisions share economic characteristics, specifically related to the nature of their respective services, themanner in which the services are provided and the similarity of their respective customers. The annualmargins of each of the operating divisions may vary due to global economic conditions and client spending.However, based on the respective future prospects of the operating divisions, we believe that the long-termaverage gross margin of each of these divisions will converge over time and, given the similarity of theiroperations, they have been aggregated into a single reportable segment.
CMG, which includes Weber Shandwick, MWW Group, FutureBrand, DeVries, GolinHarris, JackMorton, and Octagon Worldwide, provides clients with diversified services, including public relations,meeting and event production, sports and entertainment marketing, corporate and brand identity andstrategic marketing consulting. CMG shares some similarities to other service lines offered by IAN,however, on a stand-alone basis, its economic characteristics and expected margin performance aresufficiently different to support CMG as a separate reportable segment. Specifically, CMG's businesses, onan aggregate basis, have a higher proportion of arrangements for which it acts as principal, a greaterproportion of non-global clients and different margins.
During 2004, we exited our Motorsports business, which owned and operated venue-based motorsportsbusinesses. Other than the recording of long-lived asset impairment and contract termination costs during2004, the operating results of Motorsports during 2005 and 2004 were not material, and therefore notdiscussed in detail.
The profitability measure employed by our chief operating decision makers for allocating resources tooperating divisions and assessing operating division performance is operating income (loss), which iscalculated by subtracting segment salaries and related expenses and office and general expenses fromsegment revenue. Amounts reported as segment operating income (loss) exclude the impact ofrestructuring and impairment charges, as we do not typically consider these charges when assessingoperating division performance. The impact of restructuring and impairment charges to each reportingsegment are reported separately in Notes 6 and 9, respectively. Segment income (loss) excludes interestincome and expense, debt prepayment penalties, investment impairments, litigation charges and other non-operating income. With the exception of excluding certain amounts for reportable segment operatingincome (loss), all segments follow the same accounting policies as those described in Note 1.
Certain corporate and other charges are reported as a separate line within total segment operatingincome and include corporate office expenses and shared service center expenses, as well as certain othercentrally managed expenses which are not fully allocated to operating divisions, as shown in the tablebelow. Salaries, benefits and related expenses include salaries, pension, bonus and medical and dentalinsurance expenses for corporate office employees. Professional fees include costs related to the internalcontrol compliance, cost of Prior Restatement efforts, financial statement audits, legal, informationtechnology and other consulting fees, which are engaged and managed through the corporate office.Professional fees also include the cost of temporary financial professionals associated with work on ourPrior Restatement activities. Rent and depreciation includes rental expense and depreciation of leaseholdimprovements for properties occupied by corporate office employees. Corporate insurance expense includesthe cost for fire, liability and automobile premiums. Bank fees relate to cash management activityadministered by the corporate office. The amounts allocated to operating divisions are calculated monthlybased on a formula that uses the revenues of the operating unit. Amounts allocated also include specific
155

NOTES TO CONSOLIDATED FINANCIAL STATEMENTS Ì (Continued)
(Amounts in Millions, Except Per Share Amounts)
charges for information technology related projects which are allocated based on utilization. The followingexpenses are included in Corporate and Other:
For the Year Ended December 31,
2005 2004 2003
Salaries, and related expenses ÏÏÏÏÏÏÏÏÏÏÏÏÏÏÏÏÏÏÏÏÏÏÏÏÏÏÏÏÏÏ $ 201.3 $ 151.2 $ 129.0
Professional fees ÏÏÏÏÏÏÏÏÏÏÏÏÏÏÏÏÏÏÏÏÏÏÏÏÏÏÏÏÏÏÏÏÏÏÏÏÏÏÏÏÏ 199.3 145.3 50.6
Rent and depreciationÏÏÏÏÏÏÏÏÏÏÏÏÏÏÏÏÏÏÏÏÏÏÏÏÏÏÏÏÏÏÏÏÏÏÏÏÏ 50.3 38.0 30.6
Corporate insurance ÏÏÏÏÏÏÏÏÏÏÏÏÏÏÏÏÏÏÏÏÏÏÏÏÏÏÏÏÏÏÏÏÏÏÏÏÏÏ 26.0 29.7 26.5
Bank fees ÏÏÏÏÏÏÏÏÏÏÏÏÏÏÏÏÏÏÏÏÏÏÏÏÏÏÏÏÏÏÏÏÏÏÏÏÏÏÏÏÏÏÏÏÏÏÏ 2.2 2.8 1.6
Other ÏÏÏÏÏÏÏÏÏÏÏÏÏÏÏÏÏÏÏÏÏÏÏÏÏÏÏÏÏÏÏÏÏÏÏÏÏÏÏÏÏÏÏÏÏÏÏÏÏÏ (1.5) 9.6 8.9
Expenses allocated to operating divisionsÏÏÏÏÏÏÏÏÏÏÏÏÏÏÏÏÏÏÏÏÏ (161.3) (133.4) (118.4)
Total corporate and otherÏÏÏÏÏÏÏÏÏÏÏÏÏÏÏÏÏÏÏÏÏÏÏÏÏÏÏÏÏÏÏÏÏÏ $ 316.3 $ 243.2 $ 128.8
156

NOTES TO CONSOLIDATED FINANCIAL STATEMENTS Ì (Continued)
(Amounts in Millions, Except Per Share Amounts)
Summarized financial information concerning our reportable segments is shown in the following table:
For the Years Ended December 31,
2005 2004 2003
Revenue:IANÏÏÏÏÏÏÏÏÏÏÏÏÏÏÏÏÏÏÏÏÏÏÏÏÏÏÏÏÏÏÏÏÏÏÏÏÏÏÏÏÏÏÏÏÏÏÏÏÏÏÏÏÏÏÏÏ $ 5,327.8 $ 5,399.2 $5,140.5CMGÏÏÏÏÏÏÏÏÏÏÏÏÏÏÏÏÏÏÏÏÏÏÏÏÏÏÏÏÏÏÏÏÏÏÏÏÏÏÏÏÏÏÏÏÏÏÏÏÏÏÏÏÏÏÏ 944.2 935.8 942.4MotorsportsÏÏÏÏÏÏÏÏÏÏÏÏÏÏÏÏÏÏÏÏÏÏÏÏÏÏÏÏÏÏÏÏÏÏÏÏÏÏÏÏÏÏÏÏÏÏÏÏÏÏ 2.3 52.0 78.8
Consolidated revenueÏÏÏÏÏÏÏÏÏÏÏÏÏÏÏÏÏÏÏÏÏÏÏÏÏÏÏÏÏÏÏÏÏÏÏÏÏÏÏÏÏÏ $ 6,274.3 $ 6,387.0 $6,161.7
Segment operating income (loss):IANÏÏÏÏÏÏÏÏÏÏÏÏÏÏÏÏÏÏÏÏÏÏÏÏÏÏÏÏÏÏÏÏÏÏÏÏÏÏÏÏÏÏÏÏÏÏÏÏÏÏÏÏÏÏÏÏ $ 249.7 $ 577.1 $ 551.6CMGÏÏÏÏÏÏÏÏÏÏÏÏÏÏÏÏÏÏÏÏÏÏÏÏÏÏÏÏÏÏÏÏÏÏÏÏÏÏÏÏÏÏÏÏÏÏÏÏÏÏÏÏÏÏÏ 53.0 83.7 55.7MotorsportsÏÏÏÏÏÏÏÏÏÏÏÏÏÏÏÏÏÏÏÏÏÏÏÏÏÏÏÏÏÏÏÏÏÏÏÏÏÏÏÏÏÏÏÏÏÏÏÏÏÏ 0.7 (14.0) (43.5)Corporate and otherÏÏÏÏÏÏÏÏÏÏÏÏÏÏÏÏÏÏÏÏÏÏÏÏÏÏÏÏÏÏÏÏÏÏÏÏÏÏÏÏÏÏÏ (316.3) (243.2) (128.8)
Total segment operating incomeÏÏÏÏÏÏÏÏÏÏÏÏÏÏÏÏÏÏÏÏÏÏÏÏÏÏÏÏÏÏÏ $ (12.9) $ 403.6 $ 435.0
Reconciliation of total segment operating income (loss) to loss fromcontinuing operations before provision for income taxes:
Restructuring reversals (charges) ÏÏÏÏÏÏÏÏÏÏÏÏÏÏÏÏÏÏÏÏÏÏÏÏÏÏÏÏÏÏÏ 7.3 (62.2) (172.9)Long-lived asset impairment and other charges ÏÏÏÏÏÏÏÏÏÏÏÏÏÏÏÏÏÏÏÏ (98.6) (322.2) (294.0)Motorsports contract termination costs ÏÏÏÏÏÏÏÏÏÏÏÏÏÏÏÏÏÏÏÏÏÏÏÏÏÏÏ Ì (113.6) ÌInterest expense ÏÏÏÏÏÏÏÏÏÏÏÏÏÏÏÏÏÏÏÏÏÏÏÏÏÏÏÏÏÏÏÏÏÏÏÏÏÏÏÏÏÏÏÏÏÏ (181.9) (172.0) (206.6)Debt prepayment penalty ÏÏÏÏÏÏÏÏÏÏÏÏÏÏÏÏÏÏÏÏÏÏÏÏÏÏÏÏÏÏÏÏÏÏÏÏÏÏ (1.4) (9.8) (24.8)Interest incomeÏÏÏÏÏÏÏÏÏÏÏÏÏÏÏÏÏÏÏÏÏÏÏÏÏÏÏÏÏÏÏÏÏÏÏÏÏÏÏÏÏÏÏÏÏÏÏ 80.0 50.8 39.3Investment impairments ÏÏÏÏÏÏÏÏÏÏÏÏÏÏÏÏÏÏÏÏÏÏÏÏÏÏÏÏÏÏÏÏÏÏÏÏÏÏÏ (12.2) (63.4) (71.5)Litigation reversals (charges)ÏÏÏÏÏÏÏÏÏÏÏÏÏÏÏÏÏÏÏÏÏÏÏÏÏÏÏÏÏÏÏÏÏÏÏ Ì 32.5 (127.6)Other income (expense) ÏÏÏÏÏÏÏÏÏÏÏÏÏÏÏÏÏÏÏÏÏÏÏÏÏÏÏÏÏÏÏÏÏÏÏÏÏÏÏ 33.1 (10.7) 50.3
Loss from continuing operations before provision for incometaxes: $ (186.6) $ (267.0) $ (372.8)
Depreciation and amortization:IANÏÏÏÏÏÏÏÏÏÏÏÏÏÏÏÏÏÏÏÏÏÏÏÏÏÏÏÏÏÏÏÏÏÏÏÏÏÏÏÏÏÏÏÏÏÏÏÏÏÏÏÏÏÏÏÏ $ 135.3 $ 146.5 $ 171.2CMGÏÏÏÏÏÏÏÏÏÏÏÏÏÏÏÏÏÏÏÏÏÏÏÏÏÏÏÏÏÏÏÏÏÏÏÏÏÏÏÏÏÏÏÏÏÏÏÏÏÏÏÏÏÏÏ 18.3 22.1 28.5MotorsportsÏÏÏÏÏÏÏÏÏÏÏÏÏÏÏÏÏÏÏÏÏÏÏÏÏÏÏÏÏÏÏÏÏÏÏÏÏÏÏÏÏÏÏÏÏÏÏÏÏÏ Ì Ì 3.7Corporate and otherÏÏÏÏÏÏÏÏÏÏÏÏÏÏÏÏÏÏÏÏÏÏÏÏÏÏÏÏÏÏÏÏÏÏÏÏÏÏÏÏÏÏÏ 15.2 16.5 13.1
Total depreciation and amortization ÏÏÏÏÏÏÏÏÏÏÏÏÏÏÏÏÏÏÏÏÏÏÏÏÏÏÏÏÏ $ 168.8 $ 185.1 $ 216.5
Capital expenditures:IANÏÏÏÏÏÏÏÏÏÏÏÏÏÏÏÏÏÏÏÏÏÏÏÏÏÏÏÏÏÏÏÏÏÏÏÏÏÏÏÏÏÏÏÏÏÏÏÏÏÏÏÏÏÏÏÏ $ 89.7 $ 133.7 $ 104.0CMGÏÏÏÏÏÏÏÏÏÏÏÏÏÏÏÏÏÏÏÏÏÏÏÏÏÏÏÏÏÏÏÏÏÏÏÏÏÏÏÏÏÏÏÏÏÏÏÏÏÏÏÏÏÏÏ 14.8 27.1 12.3MotorsportsÏÏÏÏÏÏÏÏÏÏÏÏÏÏÏÏÏÏÏÏÏÏÏÏÏÏÏÏÏÏÏÏÏÏÏÏÏÏÏÏÏÏÏÏÏÏÏÏÏÏ Ì Ì 25.7Corporate and otherÏÏÏÏÏÏÏÏÏÏÏÏÏÏÏÏÏÏÏÏÏÏÏÏÏÏÏÏÏÏÏÏÏÏÏÏÏÏÏÏÏÏÏ 36.2 33.2 17.6
Total capital expenditures ÏÏÏÏÏÏÏÏÏÏÏÏÏÏÏÏÏÏÏÏÏÏÏÏÏÏÏÏÏÏÏÏÏÏÏÏ $ 140.7 $ 194.0 $ 159.6
Total assets:IANÏÏÏÏÏÏÏÏÏÏÏÏÏÏÏÏÏÏÏÏÏÏÏÏÏÏÏÏÏÏÏÏÏÏÏÏÏÏÏÏÏÏÏÏÏÏÏÏÏÏÏÏÏÏÏÏ $ 9,217.1 $ 9,799.6CMGÏÏÏÏÏÏÏÏÏÏÏÏÏÏÏÏÏÏÏÏÏÏÏÏÏÏÏÏÏÏÏÏÏÏÏÏÏÏÏÏÏÏÏÏÏÏÏÏÏÏÏÏÏÏÏ 965.9 960.3Corporate and otherÏÏÏÏÏÏÏÏÏÏÏÏÏÏÏÏÏÏÏÏÏÏÏÏÏÏÏÏÏÏÏÏÏÏÏÏÏÏÏÏÏÏÏ 1,762.2 1,493.8
Total assets ÏÏÏÏÏÏÏÏÏÏÏÏÏÏÏÏÏÏÏÏÏÏÏÏÏÏÏÏÏÏÏÏÏÏÏÏÏÏÏÏÏÏÏÏÏÏÏÏ $11,945.2 $12,253.7
157

NOTES TO CONSOLIDATED FINANCIAL STATEMENTS Ì (Continued)
(Amounts in Millions, Except Per Share Amounts)
Revenue and long-lived assets are presented below by major geographic area:
For the Years Ended December 31,
2005 2004 2003
Revenue:
US ÏÏÏÏÏÏÏÏÏÏÏÏÏÏÏÏÏÏÏÏÏÏÏÏÏÏÏÏÏÏÏÏÏÏÏÏÏÏÏÏÏÏÏÏÏÏÏÏÏÏÏ $3,461.1 $3,509.2 $3,459.3
International:
UKÏÏÏÏÏÏÏÏÏÏÏÏÏÏÏÏÏÏÏÏÏÏÏÏÏÏÏÏÏÏÏÏÏÏÏÏÏÏÏÏÏÏÏÏÏÏÏÏÏ 619.3 654.1 662.6
All Other EuropeÏÏÏÏÏÏÏÏÏÏÏÏÏÏÏÏÏÏÏÏÏÏÏÏÏÏÏÏÏÏÏÏÏÏÏÏÏ 1,143.4 1,219.3 1,130.5
Asia PacificÏÏÏÏÏÏÏÏÏÏÏÏÏÏÏÏÏÏÏÏÏÏÏÏÏÏÏÏÏÏÏÏÏÏÏÏÏÏÏÏÏÏ 473.0 474.7 429.4
Latin America ÏÏÏÏÏÏÏÏÏÏÏÏÏÏÏÏÏÏÏÏÏÏÏÏÏÏÏÏÏÏÏÏÏÏÏÏÏÏÏ 275.2 240.8 233.3
Other ÏÏÏÏÏÏÏÏÏÏÏÏÏÏÏÏÏÏÏÏÏÏÏÏÏÏÏÏÏÏÏÏÏÏÏÏÏÏÏÏÏÏÏÏÏÏÏ 302.3 288.9 246.6
Total international ÏÏÏÏÏÏÏÏÏÏÏÏÏÏÏÏÏÏÏÏÏÏÏÏÏÏÏÏÏÏÏÏÏÏÏÏÏÏ 2,813.2 2,877.8 2,702.4
Total consolidated ÏÏÏÏÏÏÏÏÏÏÏÏÏÏÏÏÏÏÏÏÏÏÏÏÏÏÏÏÏÏÏÏÏÏÏÏÏÏ $6,274.3 $6,387.0 $6,161.7
Long-Lived Assets:
US ÏÏÏÏÏÏÏÏÏÏÏÏÏÏÏÏÏÏÏÏÏÏÏÏÏÏÏÏÏÏÏÏÏÏÏÏÏÏÏÏÏÏÏÏÏÏÏÏÏÏÏ $2,733.6 $2,721.7
International:
UKÏÏÏÏÏÏÏÏÏÏÏÏÏÏÏÏÏÏÏÏÏÏÏÏÏÏÏÏÏÏÏÏÏÏÏÏÏÏÏÏÏÏÏÏÏÏÏÏÏ 306.9 296.9
All Other EuropeÏÏÏÏÏÏÏÏÏÏÏÏÏÏÏÏÏÏÏÏÏÏÏÏÏÏÏÏÏÏÏÏÏÏÏÏÏ 615.2 852.5
Asia PacificÏÏÏÏÏÏÏÏÏÏÏÏÏÏÏÏÏÏÏÏÏÏÏÏÏÏÏÏÏÏÏÏÏÏÏÏÏÏÏÏÏÏ 119.1 127.7
Latin America ÏÏÏÏÏÏÏÏÏÏÏÏÏÏÏÏÏÏÏÏÏÏÏÏÏÏÏÏÏÏÏÏÏÏÏÏÏÏÏ 144.9 139.4
Other ÏÏÏÏÏÏÏÏÏÏÏÏÏÏÏÏÏÏÏÏÏÏÏÏÏÏÏÏÏÏÏÏÏÏÏÏÏÏÏÏÏÏÏÏÏÏÏ 230.8 223.2
Total international ÏÏÏÏÏÏÏÏÏÏÏÏÏÏÏÏÏÏÏÏÏÏÏÏÏÏÏÏÏÏÏÏÏÏÏÏÏÏ 1,416.9 1,639.7
Total consolidated ÏÏÏÏÏÏÏÏÏÏÏÏÏÏÏÏÏÏÏÏÏÏÏÏÏÏÏÏÏÏÏÏÏÏÏÏÏÏ $4,150.5 $4,361.4
Revenue is attributed to geographic areas based on where the services are performed. Property andequipment is allocated based upon physical location. Intangible assets, other assets and investments areallocated based on the location of the related operations.
Our largest client contributed approximately 8% in 2005, 7% in 2004 and 8% in 2003 to revenue. Oursecond largest client contributed approximately 3% in 2005, 3% in 2004 and 3% in 2003 to revenue. TheIAN segment reported the majority of the revenue for both clients in all periods.
Note 21: Commitments and Contingencies
Leases
We lease certain facilities and equipment. Where leases contain escalation clauses or concessions,such as rent holidays and landlord/tenant incentives or allowances, the impact of such adjustments isrecognized on a straight-line basis over the minimum lease period. Certain leases provide for renewal
158

NOTES TO CONSOLIDATED FINANCIAL STATEMENTS Ì (Continued)
(Amounts in Millions, Except Per Share Amounts)
options and require the payment of real estate taxes or other occupancy costs, which are also subject toescalation clauses. Rent expense was as follows:
For the Years EndedDecember 31,
2005 2004 2003
Gross rent expense ÏÏÏÏÏÏÏÏÏÏÏÏÏÏÏÏÏÏÏÏÏÏÏÏÏÏÏÏÏÏÏÏÏÏÏÏÏÏÏÏÏÏ $404.4 $433.0 $440.2
Third-party sublease rental incomeÏÏÏÏÏÏÏÏÏÏÏÏÏÏÏÏÏÏÏÏÏÏÏÏÏÏÏÏÏ (25.4) (24.6) (31.6)
Net rent expenseÏÏÏÏÏÏÏÏÏÏÏÏÏÏÏÏÏÏÏÏÏÏÏÏÏÏÏÏÏÏÏÏÏÏÏÏÏÏÏÏÏÏÏÏ $379.0 $408.4 $408.6
Future minimum lease commitments for office premises and equipment under non-cancelable leases,along with minimum sublease rental income to be received under non-cancelable subleases, are as follows:
Gross SubleaseRent Rental Net Rent
Period Expense Income Expense
2006 ÏÏÏÏÏÏÏÏÏÏÏÏÏÏÏÏÏÏÏÏÏÏÏÏÏÏÏÏÏÏÏÏÏÏÏÏÏÏÏÏÏÏÏÏÏÏÏÏÏÏ $ 335.5 $ (48.4) $ 287.1
2007 ÏÏÏÏÏÏÏÏÏÏÏÏÏÏÏÏÏÏÏÏÏÏÏÏÏÏÏÏÏÏÏÏÏÏÏÏÏÏÏÏÏÏÏÏÏÏÏÏÏÏ 292.1 (41.9) 250.2
2008 ÏÏÏÏÏÏÏÏÏÏÏÏÏÏÏÏÏÏÏÏÏÏÏÏÏÏÏÏÏÏÏÏÏÏÏÏÏÏÏÏÏÏÏÏÏÏÏÏÏÏ 257.0 (34.5) 222.5
2009 ÏÏÏÏÏÏÏÏÏÏÏÏÏÏÏÏÏÏÏÏÏÏÏÏÏÏÏÏÏÏÏÏÏÏÏÏÏÏÏÏÏÏÏÏÏÏÏÏÏÏ 225.6 (31.0) 194.6
2010 ÏÏÏÏÏÏÏÏÏÏÏÏÏÏÏÏÏÏÏÏÏÏÏÏÏÏÏÏÏÏÏÏÏÏÏÏÏÏÏÏÏÏÏÏÏÏÏÏÏÏ 195.3 (23.1) 172.2
2011 and thereafterÏÏÏÏÏÏÏÏÏÏÏÏÏÏÏÏÏÏÏÏÏÏÏÏÏÏÏÏÏÏÏÏÏÏÏÏÏÏ 862.3 (68.7) 793.6
Total ÏÏÏÏÏÏÏÏÏÏÏÏÏÏÏÏÏÏÏÏÏÏÏÏÏÏÏÏÏÏÏÏÏÏÏÏÏÏÏÏÏÏÏÏÏÏÏÏ $2,167.8 $(247.6) $1,920.2
Contingent Acquisition Obligations
We have structured certain acquisitions with additional contingent purchase price obligations in orderto reduce the potential risk associated with negative future performance of the acquired entity. In addition,we have entered into agreements that may require us to purchase additional equity interests in certainconsolidated and unconsolidated subsidiaries. The amounts relating to these transactions are based onestimates of the future financial performance of the acquired entity, the timing of the exercise of theserights, changes in foreign currency exchange rates and other factors. We have not recorded a liability forthese items on the Balance Sheet since the definitive amounts payable are not determinable ordistributable. When the contingent acquisition obligations have been met and consideration is distributable,we will record the fair value of this consideration as an additional cost of the acquired entity. Thefollowing table details the estimated liability and the estimated amount that would be paid under suchoptions, in the event of exercise at the earliest exercise date. All payments are contingent upon achievingprojected operating performance targets and satisfying other conditions specified in the related agreementsand are subject to revisions as the earn-out periods progress.
159

NOTES TO CONSOLIDATED FINANCIAL STATEMENTS Ì (Continued)
(Amounts in Millions, Except Per Share Amounts)
The following contingent acquisition obligations are net of compensation expense, except as notedbelow, as defined by the terms and conditions of the respective acquisition agreements and employmentterms of the former owners of the acquired businesses. This future expense will not be allocated to theassets and liabilities acquired. As of December 31, 2005, our estimated contingent acquisition obligationsare as follows:
2006 2007 2008 2009 2010 Thereafter Total
Deferred Acquisition Payments
CashÏÏÏÏÏÏÏÏÏÏÏÏÏÏÏÏÏÏÏÏÏÏÏÏÏÏÏÏÏÏÏÏÏÏÏÏÏÏÏÏÏÏ $18.3 $1.8 $ 0.9 $10.5 $ Ì $ Ì $ 31.5
Stock ÏÏÏÏÏÏÏÏÏÏÏÏÏÏÏÏÏÏÏÏÏÏÏÏÏÏÏÏÏÏÏÏÏÏÏÏÏÏÏÏÏ 11.3 0.3 Ì Ì Ì Ì 11.6
Put Options with Consolidated Affiliates *
CashÏÏÏÏÏÏÏÏÏÏÏÏÏÏÏÏÏÏÏÏÏÏÏÏÏÏÏÏÏÏÏÏÏÏÏÏÏÏÏÏÏÏ 23.4 2.3 11.4 2.8 1.8 2.9 44.6
Stock ÏÏÏÏÏÏÏÏÏÏÏÏÏÏÏÏÏÏÏÏÏÏÏÏÏÏÏÏÏÏÏÏÏÏÏÏÏÏÏÏÏ 0.1 0.3 0.5 Ì Ì Ì 0.9
Put Options with Unconsolidated Affiliates *
CashÏÏÏÏÏÏÏÏÏÏÏÏÏÏÏÏÏÏÏÏÏÏÏÏÏÏÏÏÏÏÏÏÏÏÏÏÏÏÏÏÏÏ 1.3 2.5 11.5 0.3 Ì Ì 15.6
Stock ÏÏÏÏÏÏÏÏÏÏÏÏÏÏÏÏÏÏÏÏÏÏÏÏÏÏÏÏÏÏÏÏÏÏÏÏÏÏÏÏÏ 0.4 1.0 0.6 0.3 Ì Ì 2.3
Call Options with Consolidated Affiliates *
CashÏÏÏÏÏÏÏÏÏÏÏÏÏÏÏÏÏÏÏÏÏÏÏÏÏÏÏÏÏÏÏÏÏÏÏÏÏÏÏÏÏÏ 3.3 0.4 0.4 0.1 2.7 Ì 6.9
Stock ÏÏÏÏÏÏÏÏÏÏÏÏÏÏÏÏÏÏÏÏÏÏÏÏÏÏÏÏÏÏÏÏÏÏÏÏÏÏÏÏÏ 0.1 Ì Ì Ì Ì Ì 0.1
Subtotal Ì CashÏÏÏÏÏÏÏÏÏÏÏÏÏÏÏÏÏÏÏÏÏÏÏÏÏÏÏÏÏÏÏÏ 46.3 7.0 24.2 13.7 4.5 2.9 98.6
Subtotal Ì Stock ÏÏÏÏÏÏÏÏÏÏÏÏÏÏÏÏÏÏÏÏÏÏÏÏÏÏÏÏÏÏÏ 11.9 1.6 1.1 0.3 Ì Ì 14.9
Total Contingent Acquisition PaymentsÏÏÏÏÏÏÏÏÏÏÏÏÏÏÏ $58.2 $8.6 $25.3 $14.0 $4.5 $2.9 $113.5
In accounting for acquisitions, we recognize deferred payments and purchases of additional interestsafter the effective date of purchase that are contingent upon the future employment of owners ascompensation expense in our Consolidated Statements of Operations. As of December 31, 2005 ourestimated contingent acquisition payments with associated compensation expense impacts are as follows:
Compensation Expenses Related Payments 2006 2007 2008 2009 2010 Thereafter Total
CashÏÏÏÏÏÏÏÏÏÏÏÏÏÏÏÏÏÏÏÏÏÏÏÏÏÏÏÏÏÏÏÏÏÏÏÏÏÏÏÏÏÏ $16.6 $0.8 $12.8 $ 5.4 $1.3 $0.9 $ 37.8
Stock ÏÏÏÏÏÏÏÏÏÏÏÏÏÏÏÏÏÏÏÏÏÏÏÏÏÏÏÏÏÏÏÏÏÏÏÏÏÏÏÏÏ 0.1 Ì Ì Ì Ì Ì 0.1
Subtotal ÏÏÏÏÏÏÏÏÏÏÏÏÏÏÏÏÏÏÏÏÏÏÏÏÏÏÏÏÏÏÏÏÏÏÏÏÏÏÏ 16.7 0.8 12.8 5.4 1.3 0.9 37.9
Total PaymentsÏÏÏÏÏÏÏÏÏÏÏÏÏÏÏÏÏÏÏÏÏÏÏÏÏÏÏÏÏÏÏÏÏÏÏ $74.9 $9.4 $38.1 $19.4 $5.8 $3.8 $151.4
* We have entered into certain acquisitions that contain both put and call options with similar terms andconditions. In such instances, we have included the related estimated contingent acquisition obligationswith put options.
We maintain certain put options with consolidated affiliates that are exercisable at the discretion ofthe minority owners as of December 31, 2005. These put options are assumed to be exercised in theearliest possible period subsequent to December 31, 2005. Therefore, the related estimated acquisitionpayments of $33.5 have been included within the total payments expected to be made in 2006 in the tableabove. These payments, if not made in 2006, will continue to carry-forward into 2007 or beyond until theyare exercised or expire.
The 2006 obligations relate primarily to acquisitions that were completed prior to December 31, 2001.
160

NOTES TO CONSOLIDATED FINANCIAL STATEMENTS Ì (Continued)
(Amounts in Millions, Except Per Share Amounts)
Legal Matters
Shares Deliverable Under Securities Class Actions
In the fourth quarter of 2004, we reached a final settlement of the consolidated class actionshareholders suits against us. The class actions were filed against the Company and certain of our presentand former directors and officers on behalf of a purported class of purchasers of our stock shortly after ourAugust 13, 2002 announcement regarding the restatement of our previously reported earnings for theperiods January 1, 1997 through March 31, 2002. Under the terms of the settlement, we agreed to issue atotal of 6.6 shares of our common stock. During the fourth quarter of 2004, we issued 0.8 of the shares tothe plaintiffs' counsel as payment for their fee and will issue the remaining 5.8 shares once the appropriateallocation of the shares is made by plaintiffs' counsel. Beginning in the fourth quarter of 2004, the6.6 shares have been included in our shares of common stock outstanding for purposes of determiningearnings (loss) per share.
SEC Investigation
The SEC opened a formal investigation in response to the restatement we first announced in August2002 and, as previously disclosed, the SEC staff's investigation has expanded to encompass our PriorRestatement. In particular, since we filed our 2004 Form 10-K, we have received subpoenas from the SECrelating to matters addressed in our Prior Restatement. We continue to cooperate with the investigation.We expect that the investigation will result in monetary liability, but because the investigation is ongoing,in particular with respect to the Prior Restatement, we cannot reasonably estimate either the timing of aresolution or the amount. Accordingly, we have not yet established any accounting provision relating tothese matters.
Other Legal Matters
We are involved in other legal and administrative proceedings of various types. While any litigationcontains an element of uncertainty, we have no reason to believe that the outcome of such proceedings orclaims will have a material adverse effect on our financial condition, results of operations or our cashflows.
Note 22: Recent Accounting Standards
In November 2005, the FASB issued FSP No. FAS 115-1 and FAS 124-1, The Meaning of Other-Than-Temporary Impairment and Its Application to Certain Investments. This FSP addresses thedetermination as to when an investment is considered impaired, whether the impairment is other thantemporary, and the measurement of an impairment loss. This FSP specifically nullifies the requirements ofparagraphs 10-18 of EITF Issue No. 03-1, The Meaning of Other-Than-Temporary Impairment and ItsApplication to Certain Investments and references existing other-than-temporary impairment guidance. Theguidance in this FSP is effective for reporting periods beginning after December 15, 2005. We do notexpect the adoption of FSP No. FAS 115-1 & FAS 124-1 to have a material impact on our ConsolidatedBalance Sheet or Statement of Operations.
In May 2005, SFAS No. 154, Accounting Changes and Error Corrections, was issued, which replacesAPB Opinion No. 20, Accounting Changes, and SFAS No. 3, Reporting Accounting Changes in InterimFinancial Statements. Among other changes, SFAS No. 154 requires retrospective application of avoluntary change in accounting principle to prior period financial statements presented on the newaccounting principle, unless it is impracticable to determine either the period-specific effects or thecumulative effect of the change. Further, the Statement requires that corrections of errors in previouslyissued financial statements be termed a ""restatement.'' The new standard is effective for accounting
161

NOTES TO CONSOLIDATED FINANCIAL STATEMENTS Ì (Continued)
(Amounts in Millions, Except Per Share Amounts)
changes and error corrections made in fiscal years beginning after December 15, 2005. We do not expectthe adoption of SFAS No. 154 to have a material impact on our Consolidated Balance Sheet or Statementof Operations.
In March 2005, FASB Interpretation (""FIN'') No. 47, Accounting for Conditional Asset RetirementObligations, was issued, an interpretation of SFAS No. 143, Accounting for Asset Retirement Obligations.FIN No. 47 clarifies the timing of liability recognition for legal obligations associated with the retirementof a tangible long-lived asset when the timing and/or method of settlement are conditional on a futureevent. We adopted the provisions of FIN No. 47 during the quarter ended December 31, 2005. Theadoption of FIN No. 47 did not have a material impact on our Consolidated Balance Sheet or Statementof Operations.
In December 2004, SFAS No. 123R (revised 2004), Share-Based Payment, was issued, whichreplaces SFAS No. 123, Accounting for Stock-Based Compensation, and supersedes APB Opinion No. 25,Accounting for Stock Issued to Employees. SFAS No. 123R requires all share-based payments toemployees, including grants of employee stock options and the shares issued under our employee stockpurchase plan to be recognized in the financial statements based on their fair values, as of the beginning ofthe first fiscal year that starts after June 15, 2005. We are required to adopt SFAS No. 123R effectiveJanuary 1, 2006. The pro forma disclosures previously permitted under SFAS No. 123 will no longer be analternative to financial statement recognition. In March 2005, SAB No. 107, Share-Based Payment, wasissued regarding the SEC's interpretation of SFAS No. 123R and the valuation of share-based paymentsfor public companies. At adoption, we plan to use the modified prospective method which requires expenserecognition for all unvested and outstanding awards and any awards granted thereafter. The adoption ofSFAS No. 123R is expected to result in an increase in compensation expense for the year endedDecember 31, 2006 of approximately $6.3, as compared with the expense that would have been recognizedunder our prior accounting policy.
In November 2005, the FASB issued FSP FAS 123R-3, Transition Election Related to Accountingfor the Tax Effects of Share-Based Payment Awards (""FSP 123R-3''). FSP 123R-3 provides an electivealternative simplified method to calculate the windfall tax pool (the ""APIC pool''). Under this FSP, acompany may calculate the beginning balance of the APIC pool related to employee compensation and asimplified method to determine the subsequent impact on the APIC pool of employee awards that arefully vested and outstanding upon the adoption of SFAS No. 123R. We are currently evaluating thisalternative transition method and have until December 31, 2006 to make our one-time election. We do notexpect the adoption of FSP 123R-3 to have a material impact on our Consolidated Balance Sheet orStatement of Operations.
In December 2004, SFAS No. 153, Exchanges of Nonmonetary Assets, was issued, an amendment ofAPB Opinion No. 29, Accounting for Nonmonetary Transactions. SFAS No. 153 is based on the principlethat exchanges of nonmonetary assets should be recorded and measured at the fair value of the assetsexchanged. APB Opinion No. 29 provided an exception to its basic measurement principle (fair value) forexchanges of similar productive assets. Under APB Opinion No. 29, an exchange of a productive asset fora similar productive asset was based on the recorded amount of the asset relinquished. SFAS No. 153eliminates this exception and replaces it with exceptions for exchanges of nonmonetary assets that do nothave reasonably determinable fair values or commercial substance. SFAS No. 153 is effective fornonmonetary asset exchanges occurring in reporting periods beginning after June 15, 2005. The adoption ofSFAS No. 153 did not have a material impact on our Consolidated Balance Sheet or Statement ofOperations.
162

NOTES TO CONSOLIDATED FINANCIAL STATEMENTS Ì (Continued)
(Amounts in Millions, Except Per Share Amounts)
The adoption of the following accounting pronouncements during 2005 did not have a material impacton our Consolidated Balance Sheet or Statement of Operations:
‚ EITF Issue No. 05-6, Determining the Amortization Period for Leasehold Improvements Purchasedafter Lease Inception or Acquired in a Business Combination;
‚ EITF Issue No. 05-2, The Meaning of ""Conventional Convertible Debt Instrument'' in Issue 00-19;
‚ EITF Issue No. 03-13, Applying the Condition in Paragraph 42 of FASB Statement No. 144 inDetermining Whether to Report Discontinued Operations;
‚ FSP No. FAS 13-1, Accounting for Rental Costs Incurred during a Construction Period;
‚ FSP No. APB 18-1, Accounting by an Investor for Its Proportionate Share of Accumulated OtherComprehensive Income of an Investee Accounted for under the Equity Method in Accordance withAPB Opinion No. 18 upon a Loss of Significant Influence.
Note 23: Results by Quarter (Unaudited)
The first set of tables below presents unaudited quarterly financial information for 2005 and 2004. The2005 amounts presented have been restated from those previously reported on Form 10-Q for theapplicable periods. The tables below also set forth, for each of the quarters and for each of the interimbalance sheet dates presented the amounts of the restatement adjustments and a reconciliation frompreviously reported amounts to restated amounts.
The quarterly restatement adjustments relate primarily to accounting for goodwill impairments,revenue recognition and a number of miscellaneous items including accounting for leases and internationalcompensation arrangements. The third set of tables below summarizes, for each of the quarters and foreach of the interim balance sheet dates presented, the impact of each category of adjustment on previouslyreported revenue, operating income (loss), income (loss) from continuing operations before provision forincome taxes, net income (loss) and earnings per share, and assets, liabilities and stockholders' equity.Below is a description of the restatement adjustments.
Goodwill Impairment: Adjustments were made to properly record goodwill impairment at a reportingunit within our sports and marketing business.
Revenue Recognition related to Customer Contracts: Adjustments were recorded to properly state therevenue in accordance with the terms of customer contracts and our policies. In certain transactions withour customers the persuasive evidence of the customer arrangement was not always adequate to supportrevenue recognition, or the timing of revenue recognition did appropriately follow the specific contractterms.
Other Adjustments: We have identified other items which do not conform to GAAP and recordedadjustments to our 2005 Consolidated Financial Statements which relate to previously reported periods.Cash and accounts payable balances were increased due to the identification of cash accounts held onbehalf of our clients.
163

NOTES TO CONSOLIDATED FINANCIAL STATEMENTS Ì (Continued)
(Amounts in Millions, Except Per Share Amounts)
Results by Quarter (Unaudited)Three Months Three Months Three MonthsThree MonthsEnded June 30, Ended September 30, Ended December 31,Ended March 31,
2005 2004 2005 2004 2005 2004 2005 2004
(Restated) (Restated) (Restated)
REVENUEÏÏÏÏÏÏÏÏÏÏÏÏÏÏÏÏÏÏÏÏÏÏÏÏÏÏ $1,328.2 $1,389.4 $1,610.7 $1,512.8 $1,439.7 $1,519.1 $1,895.7 $1,965.7
OPERATING (INCOME) EXPENSES:Salaries and related expenses ÏÏÏÏÏÏÏÏÏÏÏ 975.1 887.0 953.7 898.7 962.8 925.4 1,107.5 1,021.9Office and general expenses ÏÏÏÏÏÏÏÏÏÏÏÏ 529.1 510.7 543.4 552.8 578.5 556.6 637.1 630.3Restructuring charges (reversals)ÏÏÏÏÏÏÏÏ (6.9) 61.6 (1.9) 3.9 0.1 1.1 1.4 (4.4)Long-lived asset impairment and other
chargesÏÏÏÏÏÏÏÏÏÏÏÏÏÏÏÏÏÏÏÏÏÏÏÏÏÏÏÏ Ì 5.7 Ì 3.1 6.5 307.6 92.1 5.8Motorsports contract termination costs ÏÏÏ Ì Ì Ì 80.0 Ì 33.6 Ì Ì
Total operating (income) expenses ÏÏÏÏÏÏ 1,497.3 1,465.0 1,495.2 1,538.5 1,547.9 1,824.3 1,838.1 1,653.6
OPERATING INCOME (LOSS) ÏÏÏÏÏÏ (169.1) (75.6) 115.5 (25.7) (108.2) (305.2) 57.6 312.1
EXPENSES AND OTHER INCOME:Interest expense ÏÏÏÏÏÏÏÏÏÏÏÏÏÏÏÏÏÏÏÏÏÏ (46.9) (43.6) (42.2) (41.8) (46.7) (42.3) (46.1) (44.3)Debt prepayment penalty ÏÏÏÏÏÏÏÏÏÏÏÏÏÏ Ì Ì Ì Ì (1.4) Ì Ì (9.8)Interest incomeÏÏÏÏÏÏÏÏÏÏÏÏÏÏÏÏÏÏÏÏÏÏÏ 14.9 9.8 16.5 10.4 21.8 11.1 26.8 19.5Investment impairments ÏÏÏÏÏÏÏÏÏÏÏÏÏÏÏ Ì (3.2) (3.6) Ì (1.5) (33.8) (7.1) (26.4)Litigation reversalÏÏÏÏÏÏÏÏÏÏÏÏÏÏÏÏÏÏÏÏÏ Ì Ì Ì Ì Ì Ì Ì 32.5Other income (expense) ÏÏÏÏÏÏÏÏÏÏÏÏÏÏÏ 14.7 1.3 4.3 2.2 0.7 (0.7) 13.4 (13.5)
Total expenses and other income ÏÏÏÏÏÏÏÏ (17.3) (35.7) (25.0) (29.2) (27.1) (65.7) (13.0) (42.0)
Income (loss) from continuing operationsbefore provision for income taxesÏÏÏÏÏÏ (186.4) (111.3) 90.5 (54.9) (135.3) (370.9) 44.6 270.1
Provision (benefit) for income taxes ÏÏÏÏÏ (40.6) (29.0) 79.9 30.6 (34.8) 130.0 77.4 130.6
Income (loss) from continuing operationsof consolidated companiesÏÏÏÏÏÏÏÏÏÏÏÏ (145.8) (82.3) 10.6 (85.5) (100.5) (500.9) (32.8) 139.5
Income applicable to minority interests(net of tax)ÏÏÏÏÏÏÏÏÏÏÏÏÏÏÏÏÏÏÏÏÏÏÏÏ (1.2) (2.6) (3.7) (4.2) (4.6) (4.4) (7.2) (10.3)
Equity in net income of unconsolidatedaffiliates (net of tax) ÏÏÏÏÏÏÏÏÏÏÏÏÏÏÏÏ 0.6 1.1 2.3 1.3 2.3 2.3 8.1 1.1
Income (loss) from continuing operations (146.4) (83.8) 9.2 (88.4) (102.8) (503.0) (31.9) 130.3Income from discontinued operations (net
of tax) ÏÏÏÏÏÏÏÏÏÏÏÏÏÏÏÏÏÏÏÏÏÏÏÏÏÏÏÏ Ì Ì Ì Ì Ì 6.5 9.0 Ì
Net income (loss) ÏÏÏÏÏÏÏÏÏÏÏÏÏÏÏÏÏÏÏÏ (146.4) (83.8) 9.2 (88.4) (102.8) (496.5) (22.9) 130.3Dividends on preferred stock ÏÏÏÏÏÏÏÏÏÏÏ 5.0 4.8 5.0 5.0 5.0 5.0 11.3 5.0
NET INCOME (LOSS) APPLICABLETO COMMON STOCKHOLDERS ÏÏ $ (151.4) $ (88.6) $ 4.2 $ (93.4) $ (107.8) $ (501.5) $ (34.2) $ 125.3
Earnings (loss) per share of common stock:
Basic:Continuing operations ÏÏÏÏÏÏÏÏÏÏÏÏÏÏÏÏÏ $ (0.36) $ (0.21) $ 0.01** $ (0.23) $ (0.25) $ (1.22) $ (0.10) $ 0.25**Discontinued operationsÏÏÏÏÏÏÏÏÏÏÏÏÏÏÏÏ Ì Ì Ì Ì Ì 0.02 0.02 Ì
Total ÏÏÏÏÏÏÏÏÏÏÏÏÏÏÏÏÏÏÏÏÏÏÏÏÏÏÏÏÏÏÏ $ (0.36) $ (0.21) $ 0.01 $ (0.23) $ (0.25) $ (1.21)* $ (0.08) $ 0.25
Diluted:Continuing operations ÏÏÏÏÏÏÏÏÏÏÏÏÏÏÏÏÏ $ (0.36) $ (0.21) $ 0.01** $ (0.23) $ (0.25) $ (1.22) $ (0.10) $ 0.22**Discontinued operationsÏÏÏÏÏÏÏÏÏÏÏÏÏÏÏÏ Ì Ì Ì Ì Ì 0.02 0.02 Ì
Total ÏÏÏÏÏÏÏÏÏÏÏÏÏÏÏÏÏÏÏÏÏÏÏÏÏÏÏÏÏÏÏ $ (0.36) $ (0.21) $ 0.01 $ (0.23) $ (0.25) $ (1.21)* $ (0.08) $ 0.22
Weighted-average shares:Basic ÏÏÏÏÏÏÏÏÏÏÏÏÏÏÏÏÏÏÏÏÏÏÏÏÏÏÏÏÏÏÏ 423.8 413.3 424.8 414.6 425.3 415.4 425.5 417.8DilutedÏÏÏÏÏÏÏÏÏÏÏÏÏÏÏÏÏÏÏÏÏÏÏÏÏÏÏÏÏÏ 423.8 413.3 429.6 414.6 425.3 415.4 425.5 518.9
* Does not add due to rounding.
** Due to the existence of income from continuing operations, basic and diluted EPS have beencalculated using the two-class method pursuant to EITF Issue No. 03-6 for the quarters endedJune 30, 2005 and December 31, 2004. For the quarter ended June 30, 2005, the two-class methodresulted in a decrease of $0.7 in net income (numerator) for both basic and diluted EPS calculations.For the quarter ended December 31, 2004, the two-class method resulted in a decrease of $22.6 and$12.2 in net income (numerator) for the basic and diluted EPS calculations, respectively.
164

NOTES TO CONSOLIDATED FINANCIAL STATEMENTS Ì (Continued)
(Amounts in Millions, Except Per Share Amounts)
2005
Three Months Ended Three Months Ended Three Months EndedMarch 31, June 30, September 30,
As Previously As As Previously As As Previously AsReported Restated Reported Restated Reported Restated
REVENUEÏÏÏÏÏÏÏÏÏÏÏÏÏÏÏÏÏÏÏÏÏÏÏÏÏÏÏÏÏÏ $1,330.3 $1,328.2 $1,616.2 $1,610.7 $1,442.2 $1,439.7
OPERATING (INCOME) EXPENSES:Salaries and related expenses ÏÏÏÏÏÏÏÏÏÏÏÏÏÏÏ 973.9 975.1 951.8 953.7 959.8 962.8Office and general expenses ÏÏÏÏÏÏÏÏÏÏÏÏÏÏÏÏ 528.0 529.1 542.0 543.4 579.9 578.5Restructuring charges (reversals)ÏÏÏÏÏÏÏÏÏÏÏÏ (6.9) (6.9) (1.9) (1.9) (0.9) 0.1Long-lived asset impairment and other charges Ì Ì Ì Ì 0.7 6.5Motorsports contract termination costs ÏÏÏÏÏÏÏ Ì Ì Ì Ì Ì Ì
Total operating (income) expenses ÏÏÏÏÏÏÏÏÏÏ 1,495.0 1,497.3 1,491.9 1,495.2 1,539.5 1,547.9
OPERATING INCOME (LOSS) ÏÏÏÏÏÏÏÏÏÏ (164.7) (169.1) 124.3 115.5 (97.3) (108.2)
EXPENSES AND OTHER INCOME:Interest expense ÏÏÏÏÏÏÏÏÏÏÏÏÏÏÏÏÏÏÏÏÏÏÏÏÏÏ (46.9) (46.9) (42.2) (42.2) (46.7) (46.7)Debt prepayment penalty ÏÏÏÏÏÏÏÏÏÏÏÏÏÏÏÏÏÏ Ì Ì Ì Ì (1.4) (1.4)Interest incomeÏÏÏÏÏÏÏÏÏÏÏÏÏÏÏÏÏÏÏÏÏÏÏÏÏÏÏ 14.9 14.9 16.5 16.5 21.8 21.8Investment impairments ÏÏÏÏÏÏÏÏÏÏÏÏÏÏÏÏÏÏÏ Ì Ì (3.6) (3.6) (1.5) (1.5)Litigation chargesÏÏÏÏÏÏÏÏÏÏÏÏÏÏÏÏÏÏÏÏÏÏÏÏÏ Ì Ì Ì Ì Ì ÌOther income ÏÏÏÏÏÏÏÏÏÏÏÏÏÏÏÏÏÏÏÏÏÏÏÏÏÏÏÏ 14.4 14.7 4.7 4.3 0.8 0.7
Total expenses and other income ÏÏÏÏÏÏÏÏÏÏÏÏ (17.6) (17.3) (24.6) (25.0) (27.0) (27.1)
Income (loss) from continuing operationsbefore provision for income taxesÏÏÏÏÏÏÏÏÏÏ (182.3) (186.4) 99.7 90.5 (124.3) (135.3)
Provision (benefit) for income taxes ÏÏÏÏÏÏÏÏÏ (39.1) (40.6) 83.8 79.9 (29.9) (34.8)
Income (loss) from continuing operations ofconsolidated companies ÏÏÏÏÏÏÏÏÏÏÏÏÏÏÏÏÏÏ (143.2) (145.8) 15.9 10.6 (94.4) (100.5)
Income applicable to minority interests (net oftax) ÏÏÏÏÏÏÏÏÏÏÏÏÏÏÏÏÏÏÏÏÏÏÏÏÏÏÏÏÏÏÏÏÏÏ (1.2) (1.2) (3.7) (3.7) (4.6) (4.6)
Equity in net income of unconsolidatedaffiliates (net of tax) ÏÏÏÏÏÏÏÏÏÏÏÏÏÏÏÏÏÏÏÏ 0.6 0.6 2.3 2.3 2.4 2.3
Net income (loss) ÏÏÏÏÏÏÏÏÏÏÏÏÏÏÏÏÏÏÏÏÏÏÏÏ (143.8) (146.4) 14.5 9.2 (96.6) (102.8)Dividends on preferred stock ÏÏÏÏÏÏÏÏÏÏÏÏÏÏÏ 5.0 5.0 5.0 5.0 5.0 5.0
NET INCOME (LOSS) APPLICABLE TOCOMMON STOCKHOLDERS ÏÏÏÏÏÏÏÏÏÏ $ (148.8) $ (151.4) $ 9.5 $ 4.2 $ (101.6) $ (107.8)
Earnings (loss) per share of common stock:Basic:Continuing operations ÏÏÏÏÏÏÏÏÏÏÏÏÏÏÏÏÏÏÏÏÏ $ (0.35) $ (0.36) $ 0.02* $ 0.01* $ (0.24) $ (0.25)Discontinued operationsÏÏÏÏÏÏÏÏÏÏÏÏÏÏÏÏÏÏÏÏ Ì Ì Ì Ì Ì Ì
Total ÏÏÏÏÏÏÏÏÏÏÏÏÏÏÏÏÏÏÏÏÏÏÏÏÏÏÏÏÏÏÏÏÏÏÏ $ (0.35) $ (0.36) $ 0.02 $ 0.01 $ (0.24) $ (0.25)
Diluted:Continuing operations ÏÏÏÏÏÏÏÏÏÏÏÏÏÏÏÏÏÏÏÏÏ $ (0.35) $ (0.36) $ 0.02* $ 0.01* $ (0.24) $ (0.25)Discontinued operationsÏÏÏÏÏÏÏÏÏÏÏÏÏÏÏÏÏÏÏÏ Ì Ì Ì Ì Ì Ì
Total ÏÏÏÏÏÏÏÏÏÏÏÏÏÏÏÏÏÏÏÏÏÏÏÏÏÏÏÏÏÏÏÏÏÏÏ $ (0.35) $ (0.36) $ 0.02 $ 0.01 $ (0.24) $ (0.25)
Weighted-average shares:Basic ÏÏÏÏÏÏÏÏÏÏÏÏÏÏÏÏÏÏÏÏÏÏÏÏÏÏÏÏÏÏÏÏÏÏÏ 423.8 423.8 424.8 424.8 425.3 425.3DilutedÏÏÏÏÏÏÏÏÏÏÏÏÏÏÏÏÏÏÏÏÏÏÏÏÏÏÏÏÏÏÏÏÏÏ 423.8 423.8 429.6 429.6 425.3 425.3
* Due to the existence of income from continuing operations, basic and diluted EPS have been calculatedusing the two-class method pursuant to EITF Issue No. 03-6 for the quarter ended June 30, 2005. Forthe quarter ended June 30, 2005 as previously reported, the two-class method resulted in a decrease of$1.7 in net income (numerator) for both basic and diluted EPS calculations. For the quarter endedJune 30, 2005 as restated, the two-class method resulted in a decrease of $0.7 in net income(numerator) for both basic and diluted EPS calculations.
165

NOTES TO CONSOLIDATED FINANCIAL STATEMENTS Ì (Continued)
(Amounts in Millions, Except Per Share Amounts)
2005
As of March 31, As of June 30, As of September 30,
As Previously As As Previously As As Previously AsReported Restated Reported Restated Reported Restated
ASSETS:Cash and cash equivalentsÏÏÏÏÏÏÏÏÏÏÏÏÏ $ 1,549.5 $ 1,549.5 $ 1,588.0 $ 1,588.0 $ 1,352.0 $ 1,351.8Marketable securities ÏÏÏÏÏÏÏÏÏÏÏÏÏÏÏÏÏ 1.2 1.2 1.3 1.3 2.0 2.0Accounts receivable, net ÏÏÏÏÏÏÏÏÏÏÏÏÏÏ 3,986.5 3,986.5 4,208.9 4,209.0 3,795.6 3,796.5Expenditures billable to clientsÏÏÏÏÏÏÏÏÏ 1,044.5 1,044.5 1,111.0 1,111.6 1,104.5 1,105.4Deferred income taxes ÏÏÏÏÏÏÏÏÏÏÏÏÏÏÏÏ 310.9 311.9 268.8 272.8 268.9 277.2Prepaid expenses and other current assets 187.5 187.4 170.1 170.0 175.3 174.3
Total current assets ÏÏÏÏÏÏÏÏÏÏÏÏÏÏÏÏ 7,080.1 7,081.0 7,348.1 7,352.7 6,698.3 6,707.2Land, buildings and equipment, netÏÏÏÏÏ 703.3 702.7 682.5 681.4 673.8 672.3Deferred income taxes ÏÏÏÏÏÏÏÏÏÏÏÏÏÏÏÏ 264.9 265.1 245.4 245.6 295.5 295.7InvestmentsÏÏÏÏÏÏÏÏÏÏÏÏÏÏÏÏÏÏÏÏÏÏÏÏÏ 180.5 180.5 175.5 175.4 169.2 169.0Goodwill ÏÏÏÏÏÏÏÏÏÏÏÏÏÏÏÏÏÏÏÏÏÏÏÏÏÏÏ 3,141.0 3,141.0 3,145.6 3,145.1 3,165.8 3,159.5Other assets ÏÏÏÏÏÏÏÏÏÏÏÏÏÏÏÏÏÏÏÏÏÏÏÏ 324.6 324.6 319.8 319.8 316.4 316.5
Total non-current assets ÏÏÏÏÏÏÏÏÏÏÏÏ 4,614.3 4,613.9 4,568.8 4,567.3 4,620.7 4,613.0
TOTAL ASSETSÏÏÏÏÏÏÏÏÏÏÏÏÏÏÏÏÏÏÏÏ $11,694.4 $11,694.9 $11,916.9 $11,920.0 $11,319.0 $11,320.2
LIABILITIES:Accounts payable ÏÏÏÏÏÏÏÏÏÏÏÏÏÏÏÏÏÏÏÏ $ 4,327.2 $ 4,329.2 $ 4,594.0 $ 4,601.2 $ 4,238.8 $ 4,249.2Accrued liabilitiesÏÏÏÏÏÏÏÏÏÏÏÏÏÏÏÏÏÏÏÏ 2,493.8 2,495.0 2,463.8 2,465.8 2,279.2 2,281.4Short-term debt ÏÏÏÏÏÏÏÏÏÏÏÏÏÏÏÏÏÏÏÏÏ 337.2 337.2 332.6 332.6 66.7 66.7
Total current liabilitiesÏÏÏÏÏÏÏÏÏÏÏÏÏÏ 7,158.2 7,161.4 7,390.4 7,399.6 6,584.7 6,597.3Long-term debtÏÏÏÏÏÏÏÏÏÏÏÏÏÏÏÏÏÏÏÏÏÏ 1,923.9 1,923.9 1,933.5 1,933.5 2,184.0 2,184.0Deferred compensation and employee
benefits ÏÏÏÏÏÏÏÏÏÏÏÏÏÏÏÏÏÏÏÏÏÏÏÏÏÏ 571.2 571.4 575.8 577.5 583.8 585.7Other non-current liabilities ÏÏÏÏÏÏÏÏÏÏÏ 422.4 422.1 404.1 404.1 429.4 430.3Minority interests in consolidated
subsidiaries ÏÏÏÏÏÏÏÏÏÏÏÏÏÏÏÏÏÏÏÏÏÏÏ 50.9 50.9 45.5 45.5 44.5 44.5
Total non-current liabilitiesÏÏÏÏÏÏÏÏÏÏ 2,968.4 2,968.3 2,958.9 2,960.6 3,241.7 3,244.5
TOTAL LIABILITIES ÏÏÏÏÏÏÏÏÏÏÏÏÏÏÏ 10,126.6 10,129.7 10,349.3 10,360.2 9,826.4 9,841.8
STOCKHOLDERS' EQUITY:Preferred StockÏÏÏÏÏÏÏÏÏÏÏÏÏÏÏÏÏÏÏÏÏÏ 373.7 373.7 373.7 373.7 373.7 373.7Common StockÏÏÏÏÏÏÏÏÏÏÏÏÏÏÏÏÏÏÏÏÏÏ 42.6 42.6 42.7 42.7 43.0 43.0Additional paid-in capital ÏÏÏÏÏÏÏÏÏÏÏÏÏ 2,212.5 2,212.5 2,226.3 2,226.3 2,275.2 2,275.2Accumulated deficitÏÏÏÏÏÏÏÏÏÏÏÏÏÏÏÏÏÏ (722.0) (724.5) (707.6) (715.3) (804.2) (818.1)Accumulated other comprehensive loss,
net ÏÏÏÏÏÏÏÏÏÏÏÏÏÏÏÏÏÏÏÏÏÏÏÏÏÏÏÏÏÏ (264.1) (264.2) (290.8) (290.9) (275.1) (275.4)
1,642.7 1,640.1 1,644.3 1,636.5 1,612.6 1,598.4Less:Treasury stock, at costÏÏÏÏÏÏÏÏÏÏÏÏÏÏÏÏ (14.0) (14.0) (14.0) (14.0) (14.0) (14.0)Unamortized deferred compensation ÏÏÏÏ (60.9) (60.9) (62.7) (62.7) (106.0) (106.0)TOTAL STOCKHOLDERS' EQUITY 1,567.8 1,565.2 1,567.6 1,559.8 1,492.6 1,478.4
TOTAL LIABILITIES &STOCKHOLDERS' EQUITY ÏÏÏÏÏÏÏ $11,694.4 $11,694.9 $11,916.9 $11,920.0 $11,319.0 $11,320.2
166

NOTES TO CONSOLIDATED FINANCIAL STATEMENTS Ì (Continued)
(Amounts in Millions, Except Per Share Amounts)
2005
Three Months Ended Six Months Ended Nine Months EndedMarch 31, June 30, September 30,
As Previously As As Previously As As Previously AsReported Restated Reported Restated Reported Restated
CASH FLOWS FROM OPERATINGACTIVITIES
Net cash used in operating activities ÏÏÏÏÏÏÏÏÏ $ (334.5) $ (339.9) $ (231.8) $ (231.6) $ (359.8) $ (369.8)
CASH FLOWS FROM INVESTINGACTIVITIES
Acquisitions, including deferred payments,net of cash acquired ÏÏÏÏÏÏÏÏÏÏÏÏÏÏÏÏÏÏÏ (16.6) (12.5) (55.5) (50.8) (86.4) (81.7)
Capital expenditures ÏÏÏÏÏÏÏÏÏÏÏÏÏÏÏÏÏÏÏÏÏ (32.6) (31.8) (65.5) (64.0) (99.2) (97.0)
Proceeds from sales of businesses and fixedassetsÏÏÏÏÏÏÏÏÏÏÏÏÏÏÏÏÏÏÏÏÏÏÏÏÏÏÏÏÏÏÏÏ 1.8 1.8 7.9 7.9 10.8 10.8
Proceeds from sales of investmentsÏÏÏÏÏÏÏÏÏ 20.6 20.6 40.4 40.4 63.7 63.7
Purchase of investments ÏÏÏÏÏÏÏÏÏÏÏÏÏÏÏÏÏÏ (13.5) (13.5) (18.4) (18.4) (34.3) (34.3)
Maturities of short-term marketablesecuritiesÏÏÏÏÏÏÏÏÏÏÏÏÏÏÏÏÏÏÏÏÏÏÏÏÏÏÏÏÏ 669.0 669.0 689.7 689.7 689.5 689.5
Purchases of short-term marketable securities (270.0) (270.0) (270.4) (270.4) (271.3) (271.3)
Net cash provided by investing activities ÏÏÏÏÏÏ 358.7 363.6 328.2 334.4 272.8 279.7
CASH FLOWS FROM FINANCINGACTIVITIES
Increase (decrease) in short-term bankborrowings ÏÏÏÏÏÏÏÏÏÏÏÏÏÏÏÏÏÏÏÏÏÏÏÏÏÏÏ 8.8 8.8 (12.1) (12.1) (25.6) (25.6)
Payments of long-term debtÏÏÏÏÏÏÏÏÏÏÏÏÏÏÏ (0.3) (0.3) (0.6) (0.6) (257.1) (257.1)
Proceeds from long-term debt ÏÏÏÏÏÏÏÏÏÏÏÏÏ 1.9 1.9 2.0 2.0 252.3 252.3
Debt issuance costs ÏÏÏÏÏÏÏÏÏÏÏÏÏÏÏÏÏÏÏÏÏÏ (6.3) (6.3) (9.7) (9.7) (17.6) (17.6)
Preferred stock dividends ÏÏÏÏÏÏÏÏÏÏÏÏÏÏÏÏÏ (5.0) (5.0) (10.0) (10.0) (15.0) (15.0)
Issuance of common stock, net of issuancecosts ÏÏÏÏÏÏÏÏÏÏÏÏÏÏÏÏÏÏÏÏÏÏÏÏÏÏÏÏÏÏÏÏ 0.3 0.3 13.7 4.9 0.2 0.2
Distributions to minority interests ÏÏÏÏÏÏÏÏÏÏ (4.7) (4.7) (10.9) (10.9) (18.7) (18.7)
Net cash used in financing activities ÏÏÏÏÏÏÏÏÏ (5.3) (5.3) (27.6) (36.4) (81.5) (81.5)
Effect of exchange rates on cash and cashequivalents ÏÏÏÏÏÏÏÏÏÏÏÏÏÏÏÏÏÏÏÏÏÏÏÏÏÏÏÏÏ (19.8) (19.3) (31.2) (28.8) (29.9) (27.0)
Increase (decrease) in cash and cashequivalents ÏÏÏÏÏÏÏÏÏÏÏÏÏÏÏÏÏÏÏÏÏÏÏÏÏÏÏÏÏ (0.9) (0.9) 37.6 37.6 (198.4) (198.6)
Cash and cash equivalents at beginning of year 1,550.4 1,550.4 1,550.4 1,550.4 1,550.4 1,550.4
Cash and cash equivalents at end of period ÏÏÏÏ $ 1,549.5 $1,549.5 $1,588.0 $1,588.0 $1,352.0 $1,351.8
167

NOTES TO CONSOLIDATED FINANCIAL STATEMENTS Ì (Continued)
(Amounts in Millions, Except Per Share Amounts)
The following tables summarize, for each of the 2005 quarters, the impact of each category ofadjustment on previously reported revenue, operating income (loss), income (loss) from continuingoperations before provision for income taxes, net income (loss) and earnings per share, and assets,liabilities and stockholders' equity.
Impact of Adjustments on Revenue
For the Quarter Ended
3/31/2005 6/30/2005 9/30/2005
As previously reported ÏÏÏÏÏÏÏÏÏÏÏÏÏÏÏÏÏÏÏÏÏÏÏÏÏÏÏÏÏÏÏÏÏÏ $1,330.3 $1,616.2 $1,442.2
Revenue recognition ÏÏÏÏÏÏÏÏÏÏÏÏÏÏÏÏÏÏÏÏÏÏÏÏÏÏÏÏÏÏÏÏÏÏ (2.2) (3.6) (3.5)
Other adjustmentsÏÏÏÏÏÏÏÏÏÏÏÏÏÏÏÏÏÏÏÏÏÏÏÏÏÏÏÏÏÏÏÏÏÏÏÏ 0.1 (1.9) 1.0
Total restatement adjustmentsÏÏÏÏÏÏÏÏÏÏÏÏÏÏÏÏÏÏÏÏÏÏÏÏÏÏÏÏ (2.1) (5.5) (2.5)
As restatedÏÏÏÏÏÏÏÏÏÏÏÏÏÏÏÏÏÏÏÏÏÏÏÏÏÏÏÏÏÏÏÏÏÏÏÏÏÏÏÏÏÏÏÏ $1,328.2 $1,610.7 $1,439.7
Impact of Adjustments on OperatingIncome (Loss)
For the Quarter Ended
3/31/2005 6/30/2005 9/30/2005
As previously reported ÏÏÏÏÏÏÏÏÏÏÏÏÏÏÏÏÏÏÏÏÏÏÏÏÏÏ $(164.7) $124.3 $ (97.3)
Revenue recognition ÏÏÏÏÏÏÏÏÏÏÏÏÏÏÏÏÏÏÏÏÏÏÏÏÏÏ (1.9) (3.1) (2.8)
GoodwillÏÏÏÏÏÏÏÏÏÏÏÏÏÏÏÏÏÏÏÏÏÏÏÏÏÏÏÏÏÏÏÏÏÏÏÏ Ì Ì (5.8)
Other adjustmentsÏÏÏÏÏÏÏÏÏÏÏÏÏÏÏÏÏÏÏÏÏÏÏÏÏÏÏÏ (2.5) (5.7) (2.3)
Total restatement adjustmentsÏÏÏÏÏÏÏÏÏÏÏÏÏÏÏÏÏÏÏÏ (4.4) (8.8) (10.9)
As restatedÏÏÏÏÏÏÏÏÏÏÏÏÏÏÏÏÏÏÏÏÏÏÏÏÏÏÏÏÏÏÏÏÏÏÏÏ $(169.1) $115.5 $(108.2)
Impact of Adjustments on Income(Loss) from Continuing Operationsbefore Provision for Income Taxes
For the Quarter Ended
3/31/2005 6/30/2005 9/30/2005
As previously reported ÏÏÏÏÏÏÏÏÏÏÏÏÏÏÏÏÏÏÏÏÏÏÏÏÏÏÏÏÏÏÏÏÏÏ $(182.3) $99.7 $(124.3)
Revenue recognition ÏÏÏÏÏÏÏÏÏÏÏÏÏÏÏÏÏÏÏÏÏÏÏÏÏÏÏÏÏÏÏÏÏÏ (1.9) (3.1) (2.8)
GoodwillÏÏÏÏÏÏÏÏÏÏÏÏÏÏÏÏÏÏÏÏÏÏÏÏÏÏÏÏÏÏÏÏÏÏÏÏÏÏÏÏÏÏÏÏ Ì (0.5) (5.8)
Other adjustmentsÏÏÏÏÏÏÏÏÏÏÏÏÏÏÏÏÏÏÏÏÏÏÏÏÏÏÏÏÏÏÏÏÏÏÏÏ (2.2) (5.6) (2.4)
Total restatement adjustmentsÏÏÏÏÏÏÏÏÏÏÏÏÏÏÏÏÏÏÏÏÏÏÏÏÏÏÏÏ (4.1) (9.2) (11.0)
As restatedÏÏÏÏÏÏÏÏÏÏÏÏÏÏÏÏÏÏÏÏÏÏÏÏÏÏÏÏÏÏÏÏÏÏÏÏÏÏÏÏÏÏÏÏ $(186.4) $90.5 $(135.3)
168

NOTES TO CONSOLIDATED FINANCIAL STATEMENTS Ì (Continued)
(Amounts in Millions, Except Per Share Amounts)
Impact of Adjustments on Net Income (Loss)and Earnings (Loss) per Share
For the Quarter Ended
3/31/2005 6/30/2005 9/30/2005
Net income (loss) as previously reported ÏÏÏÏÏÏÏÏÏÏÏÏÏÏÏÏÏÏ $(143.8) $14.5 $ (96.6)
Restatement adjustments (pre-tax):
Revenue recognition ÏÏÏÏÏÏÏÏÏÏÏÏÏÏÏÏÏÏÏÏÏÏÏÏÏÏÏÏÏÏÏÏÏÏ (1.9) (3.1) (2.8)
GoodwillÏÏÏÏÏÏÏÏÏÏÏÏÏÏÏÏÏÏÏÏÏÏÏÏÏÏÏÏÏÏÏÏÏÏÏÏÏÏÏÏÏÏÏÏ Ì (0.5) (5.8)
Other adjustmentsÏÏÏÏÏÏÏÏÏÏÏÏÏÏÏÏÏÏÏÏÏÏÏÏÏÏÏÏÏÏÏÏÏÏÏÏ (2.2) (5.6) (2.4)
Total restatement adjustments (pre-tax) ÏÏÏÏÏÏÏÏÏÏÏÏÏÏÏÏÏÏÏ (4.1) (9.2) (11.0)
Tax adjustments ÏÏÏÏÏÏÏÏÏÏÏÏÏÏÏÏÏÏÏÏÏÏÏÏÏÏÏÏÏÏÏÏÏÏÏÏÏ (1.5) (3.9) (4.8)
Total net restatement adjustments ÏÏÏÏÏÏÏÏÏÏÏÏÏÏÏÏÏÏÏÏÏÏÏÏ (2.6) (5.3) (6.2)
Net income (loss) as restatedÏÏÏÏÏÏÏÏÏÏÏÏÏÏÏÏÏÏÏÏÏÏÏÏÏÏÏÏ $(146.4) $ 9.2 $(102.8)
Earnings (loss) per share of common stock:
Basic
As previously reported ÏÏÏÏÏÏÏÏÏÏÏÏÏÏÏÏÏÏÏÏÏÏÏÏÏÏÏÏÏÏÏÏ $ (0.35) $0.02 $ (0.24)
Effect of restatement ÏÏÏÏÏÏÏÏÏÏÏÏÏÏÏÏÏÏÏÏÏÏÏÏÏÏÏÏÏÏÏÏÏ (0.01) (0.01) (0.01)
As restatedÏÏÏÏÏÏÏÏÏÏÏÏÏÏÏÏÏÏÏÏÏÏÏÏÏÏÏÏÏÏÏÏÏÏÏÏÏÏÏÏÏÏ $ (0.36) $0.01 $ (0.25)
Weighted-average shares ÏÏÏÏÏÏÏÏÏÏÏÏÏÏÏÏÏÏÏÏÏÏÏÏÏÏÏÏÏÏ 423.8 424.8 425.3
Diluted
As previously reported ÏÏÏÏÏÏÏÏÏÏÏÏÏÏÏÏÏÏÏÏÏÏÏÏÏÏÏÏÏÏÏÏ $ (0.35) $0.02 $ (0.24)
Effect of restatement ÏÏÏÏÏÏÏÏÏÏÏÏÏÏÏÏÏÏÏÏÏÏÏÏÏÏÏÏÏÏÏÏÏ (0.01) (0.01) (0.01)
As restatedÏÏÏÏÏÏÏÏÏÏÏÏÏÏÏÏÏÏÏÏÏÏÏÏÏÏÏÏÏÏÏÏÏÏÏÏÏÏÏÏÏÏ $ (0.36) $0.01 $ (0.25)
Weighted-average shares ÏÏÏÏÏÏÏÏÏÏÏÏÏÏÏÏÏÏÏÏÏÏÏÏÏÏÏÏÏÏ 423.8 429.6 425.3
Impact of Adjustments on Consolidated Balance Sheet Accounts
As of March 31, 2005 As of June 30, 2005
Total Total Stockholders' Total Total Stockholders'Assets Liabilities Equity Assets Liabilities Equity
As previously reported ÏÏÏÏÏÏÏÏÏ $11,694.4 $10,126.6 $1,567.8 $11,916.9 $10,349.3 $1,567.6
Revenue recognition ÏÏÏÏÏÏÏÏÏ 0.1 2.0 (1.9) 0.3 5.2 (4.9)
GoodwillÏÏÏÏÏÏÏÏÏÏÏÏÏÏÏÏÏÏÏ Ì Ì Ì (0.5) Ì (0.5)
Other adjustmentsÏÏÏÏÏÏÏÏÏÏÏ (0.8) 1.4 (2.2) (0.9) 6.8 (7.7)
Tax adjustments ÏÏÏÏÏÏÏÏÏÏÏÏ 1.2 (0.3) 1.5 4.2 (1.1) 5.3
Total restatement adjustmentsÏÏÏ 0.5 3.1 (2.6) 3.1 10.9 (7.8)
As restatedÏÏÏÏÏÏÏÏÏÏÏÏÏÏÏÏÏÏÏ $11,694.9 $10,129.7 $1,565.2 $11,920.0 $10,360.2 $1,559.8
169

NOTES TO CONSOLIDATED FINANCIAL STATEMENTS Ì (Continued)
(Amounts in Millions, Except Per Share Amounts)
As of September 30, 2005
Stockholders'Total Assets Total Liabilities Equity
As previously reportedÏÏÏÏÏÏÏÏÏÏÏÏÏÏÏÏÏÏÏÏÏÏÏÏÏÏÏ $11,319.0 $9,826.4 $1,492.6
Revenue RecognitionÏÏÏÏÏÏÏÏÏÏÏÏÏÏÏÏÏÏÏÏÏÏÏÏÏÏ 0.5 8.3 (7.8)
Goodwill ÏÏÏÏÏÏÏÏÏÏÏÏÏÏÏÏÏÏÏÏÏÏÏÏÏÏÏÏÏÏÏÏÏÏÏÏ (6.3) Ì (6.3)
Other adjustments ÏÏÏÏÏÏÏÏÏÏÏÏÏÏÏÏÏÏÏÏÏÏÏÏÏÏÏÏ (1.5) 8.8 (10.3)
Tax adjustments ÏÏÏÏÏÏÏÏÏÏÏÏÏÏÏÏÏÏÏÏÏÏÏÏÏÏÏÏÏÏ 8.5 (1.7) 10.2
Total restatement adjustments ÏÏÏÏÏÏÏÏÏÏÏÏÏÏÏÏÏÏÏÏ 1.2 15.4 (14.2)
As restated ÏÏÏÏÏÏÏÏÏÏÏÏÏÏÏÏÏÏÏÏÏÏÏÏÏÏÏÏÏÏÏÏÏÏÏÏ $11,320.2 $9,841.8 $1,478.4
170

SCHEDULE II Ì 1 of 2
THE INTERPUBLIC GROUP OF COMPANIES, INC. AND ITS SUBSIDIARIESVALUATION AND QUALIFYING ACCOUNTS
(Amounts in Millions)
For the Three Years Ended December 31, 2005
Column A Column B Column C Column D Column E Column F
Additions/(Deductions)
Balance at Charged to Charged BalanceBeginning Costs & to Other at End
Description of Period Expenses Accounts Deductions of Period
Allowance for Doubtful Accounts Ì deducted from Accounts Receivable in the Consolidated BalanceSheet:
2005 ÏÏÏÏÏÏÏÏÏÏÏÏÏÏÏÏÏÏÏÏÏÏÏÏÏ $136.1 $16.9 $ Ì $ (3.3)(4) $105.5
$(2.7)(2) $(32.9)(5)
$ Ì $ (8.6)(6)
2004 ÏÏÏÏÏÏÏÏÏÏÏÏÏÏÏÏÏÏÏÏÏÏÏÏÏ $134.1 $36.7 $ Ì $ (3.0)(4) $136.1
$(0.8)(2) $(45.6)(5)
$ 6.8 (3) $ 7.9 (6)
2003 ÏÏÏÏÏÏÏÏÏÏÏÏÏÏÏÏÏÏÏÏÏÏÏÏÏ $138.3 $32.6 $ 8.5 (1) $ (2.3)(4) $134.1
$(2.1)(2) $(34.0)(5)
$ (6.9)(6)
(1) Allowance for doubtful accounts of acquired and newly consolidated companies.
(2) Miscellaneous.
(3) Reclassifications.
(4) Dispositions.
(5) Uncollectible accounts written off.
(6) Foreign currency translation adjustment.
171

SCHEDULE II Ì 2 of 2
THE INTERPUBLIC GROUP OF COMPANIES, INC. AND ITS SUBSIDIARIESVALUATION AND QUALIFYING ACCOUNTS
(Amounts in Millions)
For the Three Years Ended December 31, 2005
Column A Column B Column C Column D Column E Column F
Additions
Balance at Charged to Charged BalanceBeginning Costs & to Other at End
Description of Period Expenses Accounts Deductions of Period
Valuation Allowance Ì deducted from Deferred Income Taxes on the Consolidated Balance Sheet:
2005 ÏÏÏÏÏÏÏÏÏÏÏÏÏÏÏÏÏÏÏÏÏÏÏÏÏ $488.6 $ 69.9 $(57.5) $Ì $501.0
2004 ÏÏÏÏÏÏÏÏÏÏÏÏÏÏÏÏÏÏÏÏÏÏÏÏÏ $252.6 $236.0 $ Ì $Ì $488.6
2003 ÏÏÏÏÏÏÏÏÏÏÏÏÏÏÏÏÏÏÏÏÏÏÏÏÏ $123.9 $111.4 $ 17.3(1) $Ì $252.6
(1) Included in discontinued operations related to NFO.
172

Item 9. Changes in and Disagreements with Accountants on Accounting and Financial Disclosure
Not applicable.
Item 9A. Controls and Procedures
Management's Assessment on Internal Control over Financial Reporting and the Report ofIndependent Registered Public Accounting Firm located in Item 8 are incorporated by reference herein.
Disclosure controls and procedures
We have carried out an evaluation under the supervision of, and with the participation of, ourmanagement, including the Chief Executive Officer and Chief Financial Officer, of the effectiveness of thedesign and operation of our disclosure controls and procedures as of December 31, 2005. Our evaluationhas disclosed numerous material weaknesses in our internal control over financial reporting as noted inManagement's Assessment on Internal Control over Financial Reporting located in Item 8. Materialweaknesses in internal controls may also constitute deficiencies in our disclosure controls and procedures.Based on an evaluation of these material weaknesses, our Chief Executive Officer and Chief FinancialOfficer have concluded that our disclosure controls and procedures are not effective as of December 31,2005, to provide reasonable assurance that information required to be disclosed by us in the reports thatwe file or submit under the Exchange Act is recorded, processed, summarized and reported, within thetime periods specified in the applicable rules and forms, and that it is accumulated and communicated toour management, including our Chief Executive Officer and our Chief Financial Officer, as appropriate toallow timely decisions regarding required disclosure. However, based on work performed to date,management believes that there are no material inaccuracies or omissions of any material fact in this 2005Annual Report. Management, to the best of its knowledge, believes that the financial statements containedin the 2005 Annual Report are fairly presented in all material respects.
There are inherent limitations to the effectiveness of any system of disclosure controls and procedures,including the possibility of human error and the circumvention or overriding of the controls andprocedures. Accordingly, even effective disclosure controls and procedures can only provide reasonableassurance of achieving their control objectives.
Changes in internal control over financial reporting
We have assessed our internal control over financial reporting as of December 31, 2005 and reportedon our assessment in Item 8 of this report.
There has been no change in internal control over financial reporting in the fiscal quarter endedDecember 31, 2005, that has materially affected, or is reasonably likely to materially affect, our internalcontrol over financial reporting. We continue to develop a remediation plan to address the materialweaknesses in our internal control over financial reporting. The development of our remediation plan isdescribed in Remediation of Material Weaknesses in Internal Control over Financial Reporting in Item 8.We expect that the implementation of this plan will extend into 2006 and beyond.
Item 9B. Other Information
Not applicable.
173

PART III
Item 10. Directors and Executive Officers of Interpublic
The information required by this Item is incorporated by reference to the ""Election of Directors''section, the ""Corporate Governance Practices and Board Matters'' section and the ""Section 16(a)Beneficial Ownership Reporting Compliance'' section of the Proxy Statement, except for the description ofthe Company's Executive Officers which appears in Part I of this Report on Form 10-K under the heading""Executive Officers of Interpublic.''
NYSE Certification
In 2005, our CEO provided the Annual CEO Certification to the NYSE, as required underSection 303A.12(a) of the New York Stock Exchange Listed Company Manual.
Item 11. Executive Compensation
The information required by this Item is incorporated by reference to the ""Compensation of ExecutiveOfficers'' section and the ""Report of the Compensation Committee of the Board of Directors'' section ofthe Proxy Statement. Such incorporation by reference shall not be deemed to incorporate specifically byreference the information referred to in Item 402(a)(8) of Regulation S-K.
Item 12. Security Ownership of Certain Beneficial Owners and Management
The information required by this Item is incorporated by reference to the ""Outstanding Shares''section and the ""Compensation of Executive Officers Ì Equity Compensation Plan Information Table''section of the Proxy Statement.
Item 13. Certain Relationships and Related Transactions
The information required by this Item is incorporated by reference to the ""Related PartyTransactions'' section of the Proxy Statement. Such incorporation by reference shall not be deemed toincorporate specifically by reference the information referred to in Item 402(a)(8) of Regulation S-K.
Item 14. Principal Accountant Fees and Services
The information required by this Item is incorporated by reference to the ""Appointment ofIndependent Auditors'' section of the Proxy Statement.
174

PART IV
Item 15. Exhibits and Financial Statement Schedule
(a) Listed below are all financial statements, financial statement schedules and exhibits filed as partof this Report on Form 10-K.
1. Financial Statements:
The Interpublic Group of Companies, Inc. and Subsidiaries Report of Independent RegisteredPublic Accounting Firm
Consolidated Statements of Operations for the years ended December 31, 2005, 2004 and2003
Consolidated Balance Sheets as of December 31, 2005 and 2004
Consolidated Statements of Cash Flows for the years ended December 31, 2005, 2004 and2003
Consolidated Statements of Changes in Stockholders' Equity and Comprehensive Income(Loss) for the years ended December 31, 2005, 2004 and 2003
Notes to Consolidated Financial Statements
2. Financial Statement Schedule:
Valuation and Qualifying Accounts (for the three years ended December 31, 2005)
All other schedules are omitted because they are not applicable.
3. Exhibits:
(Numbers used are the numbers assigned in Item 601 of Regulation S-K and the EDGAR Filer Manual.An additional copy of this exhibit index immediately precedes the exhibits filed with this Report onForm 10-K and the exhibits transmitted to the SEC as part of the electronic filing of this Report.)
Exhibit No. Description
3(i) Restated Certificate of Incorporation of the Registrant, as amended throughOctober 24, 2005, is incorporated by reference to Exhibit 3(i) to the Registrant'sQuarterly Report on Form 10-Q for the quarter ended September 30, 2005 filed withthe Securities and Exchange Commission (the ""SEC'') on November 9, 2005.
3(ii) By-Laws of the Registrant, as amended and restated through January 18, 2005, areincorporated by reference to Exhibit 3.2 to the Registrant's Current Report onForm 8-K filed with the SEC on January 21, 2005.
4(iii)(A) Certificate of Designations of 53/8% Series A Mandatory Convertible Preferred Stock ofthe Registrant, as filed with the Delaware Secretary of State on December 17, 2003 isincorporated by reference to Exhibit 4.1 to the Registrant's Current Report onForm 8-K filed with the SEC on December 19, 2003.
4(iii)(B) Certificate of Designations of 5.25% Series B Cumulative Convertible PerpetualPreferred Stock of the Registrant, as filed with the Delaware Secretary of State onOctober 24, 2005 is incorporated by reference to Exhibit 4.1 to the Registrant's CurrentReport on Form 8-K filed with the SEC on October 24, 2005.
4(iii)(C) Senior Debt Indenture, dated as of October 20, 2000 (the ""2000 Indenture''), betweenthe Registrant and The Bank of New York, as trustee, is incorporated by reference toExhibit 99.1 to the Registrant's Current Report on Form 8-K filed with the SEC onOctober 24, 2000.
175

Exhibit No. Description
4(iii)(D) First Supplemental Indenture, dated as of August 22, 2001, to the 2000 Indenture, withrespect to the 7.25% Senior Unsecured Notes due 2011 is incorporated by reference toExhibit 4.2 to the Registrant's Registration Statement on Form S-4 filed with the SECon December 4, 2001.
4(iii)(E) Second Supplemental Indenture, dated as of December 14, 2001, to the 2000Indenture, with respect to the Zero-Coupon Convertible Senior Notes due 2021 isincorporated by reference to Exhibit 4.1 to the Registrant's Registration Statement onForm S-3 filed with the SEC on April 5, 2002.
4(iii)(F) Third Supplemental Indenture, dated as of March 13, 2003, to the 2000 Indenture, withrespect to the 4.50% Convertible Senior Notes due 2023 is incorporated by reference toExhibit 4.1 to the Registrant's Current Report on Form 8-K filed with the SEC onMarch 18, 2003.
4(iii)(G) Fifth Supplemental Indenture, dated as of March 28, 2005, to the 2000 Indenture, asmodified by the First Supplemental Indenture, dated as of August 22, 2001, withrespect to the 7.25% Senior Unsecured Notes due 2011 is incorporated by reference toExhibit 4.2 to the Registrant's Current Report on Form 8-K filed with the SEC onApril 1, 2005.
4(iii)(H) Sixth Supplemental Indenture, dated as of March 30, 2005, to the 2000 Indenture, asmodified by the Third Supplemental Indenture, dated as of March 13, 2003, withrespect to the 4.50% Convertible Senior Notes due 2023 is incorporated by reference toExhibit 4.3 to the Registrant's Current Report on Form 8-K filed with the SEC onApril 1, 2005.
4(iii)(I) Seventh Supplemental Indenture, dated as of August 11, 2005, to the 2000 Indenture,as modified by the Third Supplemental Indenture, dated as of March 13, 2003, and theSixth Supplemental Indenture, dated as of March 30, 2005, with respect to the4.50% Convertible Senior Notes due 2023 is incorporated by reference to Exhibit 4.1 tothe Registrant's Current Report on Form 8-K filed with the SEC on August 15, 2005.
4(iii)(J) Senior Debt Indenture dated as of November 12, 2004 (the ""2004 Indenture''),between the Registrant and Suntrust Bank, as trustee, is incorporated by reference toExhibit 4.1 to the Registrant's Current Report on Form 8-K filed with the SEC onNovember 15, 2004.
4(iii)(K) First Supplemental Indenture, dated as of November 18, 2004, to the 2004 Indenture,with respect to the 5.40% Notes due 2009 is incorporated by reference to Exhibit 4.1 tothe Registrant's Current Report on Form 8-K filed with the SEC on November 19,2004.
4(iii)(L) Second Supplemental Indenture, dated as of November 18, 2004, to the 2004Indenture, with respect to the 6.25% Notes due 2014 is incorporated by reference toExhibit 4.2 to the Registrant's Current Report on Form 8-K filed with the SEC onNovember 19, 2004.
4(iii)(M) Third Supplemental Indenture, dated as of March 28, 2005, to the 2004 Indenture, asmodified by the Second Supplemental Indenture, dated as of November 18, 2004, withrespect to the 6.25% Senior Unsecured Notes due 2014 is incorporated by reference toExhibit 4.4 to the Registrant's Current Report on Form 8-K filed with the SEC onApril 1, 2005.
4(iii)(N) Fourth Supplemental Indenture, dated as of March 29, 2005, to the 2004 Indenture, asmodified by the First Supplemental Indenture, dated as of November 18, 2004, withrespect to the 5.40% Senior Unsecured Notes due 2009 is incorporated by reference toExhibit 4.5 to the Registrant's Current Report on Form 8-K filed with the SEC onApril 1, 2005.
4(iii)(O) Fifth Supplemental Indenture, dated as of July 25, 2005, to the 2004 Indenture, withrespect to the Floating Rate Notes due 2008 is incorporated by reference to Exhibit 4.1to the Registrant's Current Report on Form 8-K filed with the SEC on July 26, 2005.
176

Exhibit No. Description
10(i)(A) Amended and Restated 3-Year Credit Agreement, dated as of May 10, 2004, amendedand restated as of September 27, 2005, among the Registrant, the Initial LendersNamed Therein, and Citibank, N.A., as Administrative Agent is incorporated byreference to Exhibit 10(i)(G) to the Registrant's Annual Report on Form 10-K for theyear ended December 31, 2004 filed with the SEC on September 30, 2005.
10(i)(B) Amendment No. 1, dated as of October 17, 2005, to the Amended and Restated3-Year Credit Agreement, dated as of May 10, 2004, amended and restated as ofSeptember 27, 2005, among the Registrant, the Initial Lenders Named Therein, andCitibank, N.A., as Administrative Agent, is incorporated by reference to Exhibit 10.1 tothe Registrant's Current Report on Form 8-K filed with the SEC on October 17, 2005.
10(i)(C) Amendment No. 2, dated as of September 30, 2005, to the Amended and Restated3-Year Credit Agreement, dated as of May 10, 2004, amended and restated as ofSeptember 27, 2005, among the Registrant, the Initial Lenders Named Therein, andCitibank, N.A., as Administrative Agent, is incorporated by reference toExhibit 10(i)(C) to the Registrant's Quarterly Report on Form 10-Q for the quarterended September 30, 2005 filed with the SEC on November 9, 2005.
10(i)(D) Amendment No. 3, dated as of December 31, 2005, to the Amended and Restated3-Year Credit Agreement, dated as of May 10, 2004, amended and restated as ofSeptember 27, 2005, among the Registrant, the Initial Lenders Named Therein, andCitibank, N.A., as Administrative Agent.
10(i)(E) Letter Agreement, dated as of March 21, 2006, between the Registrant and the Lendersparty to the Amended and Restated 3-Year Credit Agreement, dated as of May 10,2004, amended and restated as of September 27, 2005, among the Registrant, theInitial Lenders Named Therein, and Citibank, N.A., as Administrative Agent, waivingbreaches of the 3-Year Credit Agreement.
Management contracts and compensation plans and arrangements:
(i) Michael Roth
10(iii)(A)(1) Employment Agreement, made as of July 13, 2004, by and between the Registrant andMichael I. Roth, is incorporated by reference to Exhibit 10(iii)(A)(9) to theRegistrant's Quarterly Report on Form 10-Q for the quarter ended June 30, 2004.
10(iii)(A)(2) Executive Severance Agreement, dated July 13, 2004 and executed as of July 27, 2004,by and between the Registrant and Michael I. Roth, is incorporated by reference toExhibit 10(iii)(A)(10) to the Registrant's Quarterly Report on Form 10-Q for thequarter ended June 30, 2004.
10(iii)(A)(3) Supplemental Employment Agreement, dated as of January 19, 2005, between theRegistrant and Michael I. Roth, is incorporated by reference to Exhibit 10.2 to theRegistrant's Current Report on Form 8-K filed with the SEC on January 21, 2005.
10(iii)(A)(4) Supplemental Employment Agreement, dated as of February 14, 2005, between theRegistrant and Michael I. Roth, is incorporated by reference to Exhibit 10.2 to theRegistrant's Current Report on Form 8-K filed with the SEC on February 17, 2005.
(ii) David A. Bell
10(iii)(A)(5) David A. Bell Employment Agreement, dated as of January 1, 2000, between TrueNorth Communications Inc. and David A. Bell is incorporated by reference toExhibit 10(b)(iii)(a) to the Registrant's Annual Report on Form 10-K for the yearended December 31, 2001.
10(iii)(A)(6) Employment Agreement Amendment, dated as of March 1, 2001, to an EmploymentAgreement, dated as of January 1, 2000, between True North Communications Inc. andDavid A. Bell is incorporated by reference to Exhibit 10(b)(iii)(b) to the Registrant'sAnnual Report on Form 10-K for the year ended December 31, 2001.
177

Exhibit No. Description
10(iii)(A)(7) Employment Agreement Amendment, dated as of June 1, 2001, and signed as ofOctober 1, 2002, between True North Communications Inc. and David A. Bell to anEmployment Agreement, dated as of January 1, 2000, as amended, is incorporated byreference to Exhibit 10(b)(i)(a) to the Registrant's Annual Report on Form 10-K forthe year ended December 31, 2002.
10(iii)(A)(8) Supplemental Agreement, made as of February 28, 2003, to an EmploymentAgreement, made as of January 1, 2000, between the Registrant and David A. Bell, isincorporated by reference to Exhibit 10(iii)(A)(i) to the Registrant's Quarterly Reporton Form 10-Q for the quarter ended March 31, 2003.
10(iii)(A)(9) Executive Special Benefit Agreement, made as of April 1, 2003, by and between theRegistrant and David A. Bell, is incorporated by reference to Exhibit 10(iii)(A)(i)(a)to the Registrant's Quarterly Report on Form 10-Q for the quarter ended June 30,2003.
10(iii)(A)(10) Memorandum dated May 1, 2003, from David A. Bell, providing for Cancellation ofCertain Stock Options, is incorporated by reference to Exhibit 10(iii)(A)(I)(b) to theRegistrant's Quarterly Report on Form 10-Q for the quarter ended June 30, 2003.
10(iii)(A)(11) Employment Agreement, dated as of January 18, 2005, between the Registrant andDavid A. Bell, is incorporated by reference to Exhibit 10.1 to the Registrant's CurrentReport on Form 8-K filed with the SEC on January 21, 2005.
(iii) Nicholas J. Camera
10(iii)(A)(12) Executive Special Benefit Agreement, dated as of January 1, 1995, between theRegistrant and Nicholas J. Camera, is incorporated by reference toExhibit 10(b)(v)(c) to the Registrant's Annual Report on Form 10-K for the yearended December 31, 2002.
10(iii)(A)(13) Executive Severance Agreement, dated as of January 1, 1998, between the Registrantand Nicholas J. Camera, is incorporated by reference to Exhibit 10(b)(vi)(a) to theRegistrant's Annual Report on Form 10-K for the year ended December 31, 2001.
10(iii)(A)(14) Employment Agreement, dated as of November 14, 2002, between the Registrant andNicholas J. Camera, is incorporated by reference to Exhibit 10(b)(v)(a) to theRegistrant's Annual Report on Form 10-K for the year ended December 31, 2002.
10(iii)(A)(15) Supplemental Agreement, made as of January 1, 2003 and executed as of June 23,2003 to an Executive Severance Agreement, made as of January 1, 1998, by andbetween the Registrant and Nicholas J. Camera, is incorporated by reference toExhibit 10(iii)(A)(iii)(a) to the Registrant's Quarterly Report on Form 10-Q for thequarter ended June 30, 2003.
10(iii)(A)(16) Supplemental Agreement, made as of June 16, 2003, to an Executive SeveranceAgreement, made as of January 1, 1998, by and between the Registrant and Nicholas J.Camera, is incorporated by reference to Exhibit 10(iii)(A)(iii)(b) to the Registrant'sQuarterly Report on Form 10-Q for the quarter ended June 30, 2003.
(iv) Albert Conte
10(iii)(A)(17) Employment Agreement, dated as of February 21, 2000, between the Registrant andAlbert Conte, is incorporated by reference to Exhibit 10(b)(vii)(a) to the Registrant'sAnnual Report on Form 10-K for the year ended December 31, 2001.
10(iii)(A)(18) Supplemental Agreement, made as of June 15, 2004, to an Employment Agreement,made as of February 21, 2000, by and between the Registrant and Albert Conte, isincorporated by reference to Exhibit 10(iii)(A)(3) to the Registrant's Quarterly Reporton Form 10-Q for the quarter ended June 30, 2004.
10(iii)(A)(19) The Interpublic Capital Accumulation Plan Participation Agreement, effective June 15,2004, by and between the Registrant and Albert Conte, is incorporated by reference toExhibit 10(iii)(A)(4) to the Registrant's Quarterly Report on Form 10-Q for thequarter ended June 30, 2004.
178

Exhibit No. Description
10(iii)(A)(20) Executive Special Benefit Agreement, made as of January 1, 2002 and executed as ofJune 26, 2004, by and between the Registrant and Albert Conte, is incorporated byreference to Exhibit 10(iii)(A)(5) to the Registrant's Quarterly Report on Form 10-Qfor the quarter ended June 30, 2004.
(v) Nicholas S. Cyprus
10(iii)(A)(21) Employment Agreement, made as of May 2004, by and between the Registrant andNicholas S. Cyprus, is incorporated by reference to Exhibit 10(iii)(A)(6) to theRegistrant's Quarterly Report on Form 10-Q for the quarter ended June 30, 2004.
10(iii)(A)(22) Executive Severance Agreement, made as of May 24, 2004, by and between theRegistrant and Nicholas S. Cyprus, is incorporated by reference toExhibit 10(iii)(A)(7) to the Registrant's Quarterly Report on Form 10-Q for thequarter ended June 30, 2004.
10(iii)(A)(23) The Interpublic Capital Accumulation Plan Participation Agreement, effective May 15,2004, by and between the Registrant and Nicholas S. Cyprus, is incorporated byreference to Exhibit 10(iii)(A)(8) to the Registrant's Quarterly Report on Form 10-Qfor the quarter ended June 30, 2004.
(vi) Thomas Dowling
10(iii)(A)(24) Employment Agreement, dated as of November 1999, between the Registrant andThomas Dowling, is incorporated by reference to Exhibit 10(b)(iii)(A)(1) to theRegistrant's Quarterly Report on Form 10-Q for the quarter ended March 31, 2002.
10(iii)(A)(25) Executive Special Benefit Agreement, dated as of February 1, 2000, between theRegistrant and Thomas Dowling, is incorporated by reference to Exhibit 10(b)(viii)(a)to the Registrant's Annual Report on Form 10-K for the year ended December 31,2001.
10(iii)(A)(26) Executive Special Benefit Agreement, dated as of February 1, 2001, between theRegistrant and Thomas Dowling, is incorporated by reference to Exhibit 10(b)(viii)(b)to the Registrant's Annual Report on Form 10-K for the year ended December 31,2001.
10(iii)(A)(27) Supplemental Agreement, dated as of October 1, 2002, to an Employment Agreement,dated as of November 1999, between the Registrant and Thomas Dowling, isincorporated by reference to Exhibit 10(b)(vii)(b) to the Registrant's Annual Reporton Form 10-K for the year ended December 31, 2002.
10(iii)(A)(28) Supplemental Agreement, dated as of November 14, 2002, to an EmploymentAgreement, dated as of November 1999, between the Registrant and Thomas Dowling,is incorporated by reference to Exhibit 10(b)(vii)(a) to the Registrant's Annual Reporton Form 10-K for the year ended December 31, 2002.
10(iii)(A)(29) Executive Severance Agreement, dated November 14, 2002, between the Registrant andThomas Dowling, is incorporated by reference to Exhibit 10(iii)(A)(vii) to theRegistrant's Quarterly Report on Form 10-Q for the quarter ended March 31, 2003.
(vii) Steven Gatfield
10(iii)(A)(30) Employment Agreement, made as of February 2, 2004, by and between the Registrantand Steve Gatfield, is incorporated by reference to Exhibit 10(iii)(A)(1) to theRegistrant's Quarterly Report on Form 10-Q for the quarter ended March 31, 2004.
10(iii)(A)(31) Participation Agreement under The Interpublic Senior Executive Retirement IncomePlan, dated as of January 30, 2004, between the Registrant and Steve Gatfield, isincorporated by reference to Exhibit 10(iii)(A)(2) to the Registrant's Quarterly Reporton Form 10-Q for the quarter ended March 31, 2004.
10(iii)(A)(32) Executive Severance Agreement, made as of April 1, 2004, by and between theRegistrant and Steve Gatfield, is incorporated by reference to Exhibit 10(iii)(A)(3) tothe Registrant's Quarterly Report on Form 10-Q for the quarter ended March 31, 2004.
179

Exhibit No. Description
10(iii)(A)(33) Supplemental Agreement, dated as of February 24, 2006, between Interpublic andStephen Gatfield, is incorporated by reference to Exhibit 10.1 to the Registrant'sCurrent Report on Form 8-K/A filed with the SEC on March 3, 2006.
(viii) Philippe Krakowsky
10(iii)(A)(34) Employment Agreement, dated as of January 28, 2002, between the Registrant andPhilippe Krakowsky, is incorporated by reference to Exhibit 10(iii)(A)(2) to theRegistrant's Quarterly Report on Form 10-Q for the quarter ended March 31, 2002.
10(iii)(A)(35) Executive Special Benefit Agreement, dated as of February 1, 2002, and signed as ofJuly 1, 2002, between the Registrant and Philippe Krakowsky, is incorporated byreference to Exhibit 10(iii)(A)(v) to the Registrant's Quarterly Report on Form 10-Qfor the quarter ended September 30, 2002.
10(iii)(A)(36) Special Deferred Compensation Agreement, dated as of April 1, 2002, and signed as ofJuly 1, 2002, between the Registrant and Philippe Krakowsky, is incorporated byreference to Exhibit 10(iii)(A)(iv) to the Registrant's Quarterly Report on Form 10-Qfor the quarter ended September 30, 2002.
10(iii)(A)(37) Executive Severance Agreement, dated September 13, 2002, between the Registrantand Philippe Krakowsky, is incorporated by reference to Exhibit 10(iii)(A)(vi) to theRegistrant's Quarterly Report on Form 10-Q for the quarter ended September 30, 2002.
10(iii)(A)(38) Executive Special Benefit Agreement, dated September 30, 2002, between theRegistrant and Philippe Krakowsky, is incorporated by reference toExhibit 10(iii)(A)(vi) to the Registrant's Quarterly Report on Form 10-Q for thequarter ended September 30, 2002.
10(iii)(A)(39) Supplemental Agreement, made as of April 8, 2003, to an Employment Agreement,made as of January 28, 2002, by and between the Registrant and Philippe Krakowsky,is incorporated by reference to Exhibit 10(iii)(A)(viii)(a) to the Registrant's QuarterlyReport on Form 10-Q for the quarter ended June 30, 2003.
10(iii)(A)(40) Supplemental Agreement, made as of June 16, 2003, to an Executive SeveranceAgreement, made as of November 14, 2002, by and between the Registrant andPhilippe Krakowsky, is incorporated by reference to Exhibit 10(iii)(A)(viii)(b) to theRegistrant's Quarterly Report on Form 10-Q for the quarter ended June 30, 2003.
(ix) Frank Mergenthaler
10(iii)(A)(41) Employment Agreement, made as of July 13, 2005, between the Registrant and FrankMergenthaler is incorporated by reference to Exhibit 10.1 to the Registrant's CurrentReport on Form 8-K filed with the SEC on July 19, 2005.
10(iii)(A)(42) Executive Severance Agreement, made as of July 13, 2005, between the Registrant andFrank Mergenthaler is incorporated by reference to Exhibit 10.1 to the Registrant'sCurrent Report on Form 8-K filed with the SEC on July 19, 2005.
(x) Timothy A. Sompolski
10(iii)(A)(43) Employment Agreement, made as of July 6, 2004, by and between the Registrant andTimothy Sompolski, is incorporated by reference to Exhibit 10(iii)(A)(11) to theRegistrant's Quarterly Report on Form 10-Q for the quarter ended March 31, 2004.
10(iii)(A)(44) Executive Severance Agreement, made as of July 6, 2004, by and between theRegistrant and Timothy Sompolski, is incorporated by reference toExhibit 10(iii)(A)(12) to the Registrant's Quarterly Report on Form 10-Q for thequarter ended March 31, 2004.
10(iii)(A)(45) The Interpublic Capital Accumulation Plan Participation Agreement, effective July 6,2004, by and between the Registrant and Timothy Sompolski, is incorporated byreference to Exhibit 10(iii)(A)(13) to the Registrant's Quarterly Report onForm 10-Q for the quarter ended June 30, 2004.
(xi) John J. Dooner, Jr.
180

Exhibit No. Description
10(iii)(A)(46) Executive Special Benefit Agreement, dated as of July 1, 1986, between the Registrantand John J. Dooner, Jr., is incorporated by reference to Exhibit 10(e) to theRegistrant's Annual Report on Form 10-K for the year ended December 31, 1995.
10(iii)(A)(47) Executive Severance Agreement, dated as of August 10, 1987, between the Registrantand John J. Dooner, Jr., is incorporated by reference to Exhibit 10(h) to theRegistrant's Annual Report on Form 10-K for the year ended December 31, 1995.
10(iii)(A)(48) Supplemental Agreement, dated as of May 23, 1990, to an Executive Special BenefitAgreement, dated as of July 1, 1986, between the Registrant and John J. Dooner, Jr., isincorporated by reference to Exhibit 10(l) to the Registrant's Annual Report onForm 10-K for the year ended December 31, 1995.
10(iii)(A)(49) Executive Special Benefit Agreement, dated as of, July 1, 1992, between the Registrantand John J. Dooner, Jr., is incorporated by reference to Exhibit 10(q) to theRegistrant's Annual Report on Form 10-K for the year ended December 31, 1995.
10(iii)(A)(50) Supplemental Agreement, dated as of August 10, 1992, to an Executive SeveranceAgreement, dated as of August 10, 1987, between the Registrant and John J.Dooner, Jr., is incorporated by reference to Exhibit 10(p) to the Registrant's AnnualReport on Form 10-K for the year ended December 31, 1995.
10(iii)(A)(51) Employment Agreement, dated as of January 1, 1994, between the Registrant andJohn J. Dooner, Jr., is incorporated by reference to Exhibit 10(r) to the Registrant'sAnnual Report on Form 10-K for the year ended December 31, 1995.
10(iii)(A)(52) Executive Special Benefit Agreement, dated as of June 1, 1994, between the Registrantand John J. Dooner, Jr., is incorporated by reference to Exhibit 10(s) to theRegistrant's Annual Report on Form 10-K for the year ended December 31, 1995.
10(iii)(A)(53) Supplemental Agreement, dated as of July 1, 1995, to an Employment Agreementbetween the Registrant and John J. Dooner, Jr., dated as of January 1, 1994, isincorporated by reference to Exhibit 10(B) to the Registrant's Quarterly Report onForm 10-Q for the quarter ended September 30, 1995.
10(iii)(A)(54) Supplemental Agreement, dated as of July 1, 1995, to an Employment Agreement,dated as of January 1, 1994, between the Registrant and John J. Dooner, Jr., isincorporated by reference to Exhibit 10(t) to the Registrant's Annual Report onForm 10-K for the year ended December 31, 1995.
10(iii)(A)(55) Supplemental Agreement, dated as of September 1, 1997, to an EmploymentAgreement between the Registrant and John J. Dooner, Jr., is incorporated by referenceto Exhibit 10(k) to the Registrant's Quarterly Report on Form 10-Q for the quarterended September 30, 1997.
10(iii)(A)(56) Executive Severance Agreement, dated January 1, 1998, between the Registrant andJohn J. Dooner, Jr., is incorporated by reference to Exhibit 10(b) to the Registrant'sQuarterly Report on Form 10-Q for the quarter ended March 31, 1998.
10(iii)(A)(57) Supplemental Agreement, dated as of January 1, 1999, to an Employment Agreementdated as of January 1, 1994, between the Registrant and John J. Dooner, Jr., isincorporated by reference to Exhibit 10(e) to the Registrant's Quarterly Report onForm 10-Q for the quarter ended March 31, 1999.
10(iii)(A)(58) Supplemental Agreement, dated as of April 1, 2000, to an Employment Agreementbetween the Registrant and John J. Dooner, Jr., is incorporated by reference toExhibit 10(b) to the Registrant's Quarterly Report on Form 10-Q for the quarter endedMarch 31, 2000.
10(iii)(A)(59) Executive Special Benefit Agreement, dated as of May 20, 2002, between theRegistrant and John J. Dooner, Jr., signed as of November 11, 2002, is incorporated byreference to Exhibit 10(b)(xv)(c) to the Registrant's Annual Report on Form 10-K forthe year ended December 31, 2002.
181

Exhibit No. Description
10(iii)(A)(60) Supplemental Agreement, dated as of November 7, 2002, to an EmploymentAgreement between the Registrant and John J. Dooner, Jr., is incorporated by referenceto Exhibit 10(b)(xv)(a) to the Registrant's Annual Report on Form 10-K for the yearended December 31, 2002.
10(iii)(A)(61) Supplemental Agreement, dated as of November 7, 2002, to an Executive SpecialBenefit Agreement between the Registrant and John J. Dooner, Jr., is incorporated byreference to Exhibit 10(b)(xv)(b) to the Registrant's Annual Report on Form 10-K forthe year ended December 31, 2002.
10(iii)(A)(62) Supplemental Agreement, made as of January 1, 2003 and executed as of June 17,2003, to an Executive Severance Agreement, made as of January 1, 1998, by andbetween the Registrant and John J. Dooner, Jr., is incorporated by reference toExhibit 10(iii)(A)(iv)(b) to the Registrant's Quarterly Report on Form 10-Q for thequarter ended June 30, 2003.
10(iii)(A)(63) Supplemental Agreement, made as of March 31, 2003, to an Employment Agreementmade as of January 1, 1994, as amended between the Registrant and John J.Dooner, Jr., is incorporated by reference to Exhibit 10(iii)(A)(v) to the Registrant'sQuarterly Report on Form 10-Q for the quarter ended March 31, 2003.
10(iii)(A)(64) Supplemental Agreement, made as of March 31, 2003 and executed as of April 15,2003, to an Employment Agreement, made as of January 1, 1994, by and between theRegistrant and John J. Dooner, Jr., is incorporated by reference toExhibit 10(iii)(A)(iv)(a) to the Registrant's Quarterly Report on Form 10-Q for thequarter ended June 30, 2003.
10(iii)(A)(65) Letter Agreement, dated May 8, 2003, between the Registrant and John J. Dooner, Jr.,providing for cancellation of certain Stock Options, is incorporated by reference toExhibit 10(iii)(A)(iv)(c) to the Registrant's Quarterly Report on Form 10-Q for thequarter ended June 30, 2003.
10(iii)(A)(66) Supplemental Agreement dated as of November 12, 2003, to an EmploymentAgreement between the Registrant and John J. Dooner, Jr., is incorporated by referenceto Exhibit 10(b)(viii)(u) to the Registrant's Annual Report on Form 10-K for the yearended December 31, 2003.
(xii) Jill Considine
10(iii)(A)(67) Deferred Compensation Agreement, dated as of April 1, 2002, between the Registrantand Jill Considine, is incorporated by reference to Exhibit 10(c) to the Registrant'sQuarterly Report on Form 10-Q for the quarter ended June 30, 2002.
(xiii) Richard A. Goldstein
10(iii)(A)(68) Richard A Goldstein Deferred Compensation Agreement, dated as of June 1, 2001,between the Registrant and Richard A. Goldstein, is incorporated by reference toExhibit 10(c) to Registrant's Quarterly Report on Form 10-Q for the quarter endedJune 30, 2001.
(xiv) Christopher J. Coughlin
10(iii)(A)(69) Employment Agreement, made as of May 6, 2003, by and between the Registrant andChristopher J. Coughlin, is incorporated by reference to Exhibit 10(iii)(A)(ii) to theRegistrant's Quarterly Report on Form 10-Q for the quarter ended March 31, 2003.
10(iii)(A)(70) Executive Special Benefit Agreement, made as of June 16, 2003, by and between theRegistrant and Christopher J. Coughlin, is incorporated by reference toExhibit 10(iii)(A)(iii) to the Registrant's Quarterly Report on Form 10-Q for thequarter ended March 31, 2003.
10(iii)(A)(71) Executive Severance Agreement, made as of June 16, 2003, by and between theRegistrant and Christopher J. Coughlin, is incorporated by reference toExhibit 10(iii)(A)(iv) to the Registrant's Quarterly Report on Form 10-Q for thequarter ended March 31, 2003.
182

Exhibit No. Description
10(iii)(A)(72) Confidential Separation Agreement and General Release, between the Registrant andChristopher J. Coughlin is incorporated by reference to Exhibit 10.1 to the Registrant'sCurrent Report on Form 8-K filed with the SEC on January 6, 2005.
(xv) Other
10(iii)(A)(73) Trust Agreement, dated as of June 1, 1990, between the Registrant, Lintas Campbell-Ewald Company, McCann-Erickson USA, Inc., McCann-Erickson Marketing, Inc.,Lintas, Inc. and Chemical Bank, as Trustee, is incorporated by reference to theRegistrant's Annual Report on Form 10-K for the year ended December 31, 1990.
10(iii)(A)(74) The Stock Option Plan (1988) and the Achievement Stock Award Plan of theRegistrant are incorporated by reference to Appendices C and D of the Prospectus,dated May 4, 1989, forming part of its Registration Statement on Form S-8(No. 33-28143).
10(iii)(A)(75) The Management Incentive Compensation Plan of the Registrant is incorporated byreference to the Registrant's Quarterly Report on Form 10-Q for the quarter endedJune 30, 1995.
10(iii)(A)(76) The 1986 Stock Incentive Plan of the Registrant is incorporated by reference toRegistrant's Annual Report on Form 10-K for the year ended December 31, 1993.
10(iii)(A)(77) The 1986 United Kingdom Stock Option Plan of the Registrant is incorporated byreference to the Registrant's Annual Report on Form 10-K for the year endedDecember 31, 1992.
10(iii)(A)(78) The Long-Term Performance Incentive Plan of the Registrant is incorporated byreference to Appendix A of the Prospectus dated December 12, 1988 forming part of itsRegistration Statement on Form S-8 (No. 33-25555).
10(iii)(A)(79) Resolution of the Board of Directors adopted on February 16, 1993, amending theLong-Term Performance Incentive Plan is incorporated by reference to the Registrant'sAnnual Report on Form 10-K for the year ended December 31, 1992.
10(iii)(A)(80) Resolution of the Board of Directors adopted on May 16, 1989 amending the Long-Term Performance Incentive Plan is incorporated by reference to the Registrant'sAnnual Report on Form 10-K for the year ended December 31, 1989.
10(iii)(A)(81) The 1996 Stock Incentive Plan of the Registrant is incorporated by reference to theRegistrant's Quarterly Report on Form 10-Q for the quarter ended June 30, 1996.
10(iii)(A)(82) The 1997 Performance Incentive Plan of the Registrant is incorporated by reference tothe Registrant's Quarterly Report on Form 10-Q for the quarter ended June 30, 1997.
10(iii)(A)(83) True North Communications Inc. Stock Option Plan is incorporated by reference toExhibit 4.5 of Post-Effective Amendment No. 1 on Form S-8 to Registration Statementon Form S-4 (Registration No. 333-59254).
10(iii)(A)(84) Bozell, Jacobs, Kenyon & Eckhardt, Inc. Stock Option Plan is incorporated byreference to Exhibit 4.5 of Post-Effective Amendment No. 1 on Form S-8 toRegistration Statement on Form S-4 (Registration No. 333-59254).
10(iii)(A)(85) True North Communications Inc. Deferred Compensation Plan is incorporated byreference to Exhibit(c)(xiv) of the Registrant's Annual Report on Form 10-K for theyear ended December 31, 2002.
10(iii)(A)(86) Resolution of the Board of Directors of True North Communications Inc. adopted onMarch 1, 2002 amending the Deferred Compensation Plan is incorporated by referenceto Exhibit(c)(xv) of the Registrant's Annual Report on Form 10-K for the year endedDecember 31, 2002.
10(iii)(A)(87) The 2002 Performance Incentive Plan of the Registrant is incorporated by reference toAppendix A to the Registrant's Proxy Statement on Schedule 14A, filed April 17, 2002.
10(iii)(A)(88) The Interpublic Senior Executive Retirement Income Plan is incorporated by referenceto the Registrant's Quarterly Report on Form 10-Q for the quarter endedSeptember 30, 2003.
183

Exhibit No. Description
10(iii)(A)(89) The Interpublic Capital Accumulation Plan is incorporated by reference to theRegistrant's Quarterly Report on Form 10-Q for the quarter ended September 30, 2003.
10(iii)(A)(90) The Interpublic Outside Directors Stock Incentive Plan of Interpublic, as amendedthrough August 1, 2003, is incorporated by reference to the Registrant's QuarterlyReport on Form 10-Q for the quarter ended September 30, 2003.
10(iii)(A)(91) 2004 Performance Incentive Plan of the Registrant is incorporated by reference toAppendix B to the Registrant's Proxy Statement on Schedule 14A, filed with the SECon April 23, 2004.
10(iii)(A)(92) The Interpublic Non-Management Directors' Stock Incentive Plan is incorporated byreference to Appendix C to the Registrant's Proxy Statement on Schedule 14A, filedwith the SEC on April 23, 2004.
10(iii)(A)(93) The Interpublic Senior Executive Retirement Income Plan Ì Form of ParticipationAgreement is incorporated by reference to Exhibit 10.7 of the Registrant's CurrentReport on Form 8-K filed with the SEC on October 27, 2004.
10(iii)(A)(94) The Interpublic Capital Accumulation Plan Ì Form of Participation Agreement isincorporated by reference to Exhibit 10.8 of the Registrant's Current Report onForm 8-K filed with the SEC on October 27, 2004.
10(iii)(A)(95) The Interpublic Group of Companies, Inc. 2004 Performance Incentive Plan (the""PIP'') Ì Form of Instrument of Restricted Stock is incorporated by reference toExhibit 10.2 to the Registrant's Current Report on Form 8-K filed with the SEC onOctober 27, 2004.
10(iii)(A)(96) PIP Ì Form of Instrument of Restricted Stock Units is incorporated by reference toExhibit 10.3 to the Registrant's Current Report on Form 8-K filed with the SEC onOctober 27, 2004.
10(iii)(A)(97) PIP Ì Form of Option Certificate is incorporated by reference to Exhibit 10.1 to theRegistrant's Current Report on Form 8-K filed with the SEC on October 27, 2004.
10(iii)(A)(98) Interpublic's Non-Management Directors' Stock Incentive Plan (the ""Non-Manage-ment Directors' Plan'') Ì Form of Instrument of Restricted Shares is incorporated byreference to Exhibit 10.5 to the Registrant's Current Report on Form 8-K filed with theSEC on October 27, 2004.
10(iii)(A)(99) The Non-Management Directors' Plan Ì Form of Instrument of Restricted Share Unitsis incorporated by reference to Exhibit 10.6 of the Registrant's Current Report onForm 8-K filed with the SEC on October 27, 2004.
10(iii)(A)(100) The Non-Management Directors' Plan Ì Form of Plan Option Certificate is incorpo-rated by reference to Exhibit 10.4 of the Registrant's Current Report on Form 8-K filedwith the SEC on October 27, 2004.
10(iii)(A)(101) The Employee Stock Purchase Plan (2006) of the Registrant is incorporated byreference to Appendix B to the Registrant's Proxy Statement on Schedule 14A, filedwith the SEC on October 21, 2005.
(18) Preferability Letter from PricewaterhouseCoopers LLP, dated March 22, 2006.
(21) Subsidiaries of the Registrant.
(24) Power of Attorney to sign Form 10-K and resolution of Board of Directors re Power ofAttorney.
(31.1) Certification dated as of March 22, 2006 and executed by Michael I. Roth, underSection 302 of the Sarbanes-Oxley Act of 2002 (""S-OX'').
(31.2) Certification dated as of March 22, 2006 and executed by Frank Mergenthaler, underSection 302 of S-OX.
(32) Certification dated as of March 22, 2006 and executed by Michael I. Roth and FrankMergenthaler, furnished pursuant to Section 906 of S-OX.
184

SIGNATURES
Pursuant to the requirements of Section 13 of the Securities Exchange Act of 1934, the Registranthas duly caused this Report to be signed on its behalf by the undersigned, thereunto duly authorized.
THE INTERPUBLIC GROUP OF COMPANIES, INC.(Registrant)
By: /s/ Michael I. Roth
Michael I. RothChairman of the Boardand Chief Executive Officer
March 22, 2006
Pursuant to the requirements of the Securities Exchange Act of 1934, this Report has been signedbelow by the following persons on behalf of the Registrant and in the capacities and on the datesindicated.
Name Title Date
/s/ Michael I. Roth Chairman of the Board, and Chief March 22, 2006Executive Officer (PrincipalMichael I. Roth
Executive Officer)
/s/ Frank Mergenthaler Executive Vice President, Chief March 22, 2006Financial Officer (PrincipalFrank Mergenthaler
Financial Officer)
/s/ Nicholas S. Cyprus Senior Vice President and Controller March 22, 2006(Principal Accounting Officer)Nicholas S. Cyprus
/s/ Frank J. Borelli Director March 22, 2006
Frank J. Borelli
/s/ Reginald K. Brack Director March 22, 2006
Reginald K. Brack
/s/ Jill M. Considine Director March 22, 2006
Jill M. Considine
/s/ Richard A. Goldstein Director March 22, 2006
Richard A. Goldstein
/s/ H. John Greeniaus Director March 22, 2006
H. John Greeniaus
/s/ J. Phillip Samper Director March 22, 2006
J. Phillip Samper
/s/ David M. Thomas Director March 22, 2006
David M. Thomas
185

Exhibit 31.1
CERTIFICATION
I, Michael I. Roth, certify that:
1. I have reviewed this annual report on Form 10-K of The Interpublic Group of Companies, Inc.;
2. Based on my knowledge, this report does not contain any untrue statement of a material fact oromit to state a material fact necessary to make the statements made, in light of the circumstances underwhich such statements were made, not misleading with respect to the period covered by this report;
3. Based on my knowledge, the financial statements, and other financial information included in thisreport, fairly present in all material respects the financial condition, results of operations and cash flows ofthe registrant as of, and for, the periods presented in this report;
4. The registrant's other certifying officer(s) and I are responsible for establishing and maintainingdisclosure controls and procedures (as defined in Exchange Act Rules 13a-15(e) and 15d-15(e)) andinternal control over financial reporting (as defined in Exchange Act Rules 13a-15(f) and 15d-15(f)) forthe registrant and have:
(a) Designed such disclosure controls and procedures, or caused such disclosure controls andprocedures to be designed under our supervision, to ensure that material information relating to theregistrant, including its consolidated subsidiaries, is made known to us by others within those entities,particularly during the period in which this report is being prepared;
(b) Designed such internal control over financial reporting, or caused such internal control overfinancial reporting to be designed under our supervision, to provide reasonable assurance regarding thereliability of financial reporting and the preparation of financial statements for external purposes inaccordance with generally accepted accounting principles;
(c) Evaluated the effectiveness of the registrant's disclosure controls and procedures andpresented in this report our conclusions about the effectiveness of the disclosure controls andprocedures, as of the end of the period covered by this report based on such evaluation; and
(d) Disclosed in this report any change in the registrant's internal control over financial reportingthat occurred during the registrant's most recent fiscal quarter (the registrant's fourth fiscal quarter inthe case of an annual report) that has materially affected, or is reasonably likely to materially affect,the registrant's internal control over financial reporting; and
5. The registrant's other certifying officer(s) and I have disclosed, based on our most recentevaluation of internal control over financial reporting, to the registrant's auditors and the audit committeeof registrant's board of directors (or persons performing the equivalent functions):
(a) All significant deficiencies and material weaknesses in the design or operation of internalcontrol over financial reporting which are reasonably likely to adversely affect the registrant's ability torecord, process, summarize and report financial information; and
(b) Any fraud, whether or not material, that involves management or other employees who havea significant role in the registrant's internal control over financial reporting.
/s/ Michael I. Roth
Michael I. RothChairman and Chief Executive Officer
Date: March 22, 2006

Exhibit 31.2
CERTIFICATION
I, Frank Mergenthaler, certify that:
1. I have reviewed this annual report on Form 10-K of The Interpublic Group of Companies, Inc.;
2. Based on my knowledge, this report does not contain any untrue statement of a material fact oromit to state a material fact necessary to make the statements made, in light of the circumstances underwhich such statements were made, not misleading with respect to the period covered by this report;
3. Based on my knowledge, the financial statements, and other financial information included in thisreport, fairly present in all material respects the financial condition, results of operations and cash flows ofthe registrant as of, and for, the periods presented in this report;
4. The registrant's other certifying officer(s) and I are responsible for establishing and maintainingdisclosure controls and procedures (as defined in Exchange Act Rules 13a-15(e) and 15d-15(e)) andinternal control over financial reporting (as defined in Exchange Act Rules 13a-15(f) and 15d-15(f)) forthe registrant and have:
(a) Designed such disclosure controls and procedures, or caused such disclosure controls andprocedures to be designed under our supervision, to ensure that material information relating to theregistrant, including its consolidated subsidiaries, is made known to us by others within those entities,particularly during the period in which this report is being prepared;
(b) Designed such internal control over financial reporting, or caused such internal control overfinancial reporting to be designed under our supervision, to provide reasonable assurance regarding thereliability of financial reporting and the preparation of financial statements for external purposes inaccordance with generally accepted accounting principles;
(c) Evaluated the effectiveness of the registrant's disclosure controls and procedures andpresented in this report our conclusions about the effectiveness of the disclosure controls andprocedures, as of the end of the period covered by this report based on such evaluation; and
(d) Disclosed in this report any change in the registrant's internal control over financial reportingthat occurred during the registrant's most recent fiscal quarter (the registrant's fourth fiscal quarter inthe case of an annual report) that has materially affected, or is reasonably likely to materially affect,the registrant's internal control over financial reporting; and
5. The registrant's other certifying officer(s) and I have disclosed, based on our most recentevaluation of internal control over financial reporting, to the registrant's auditors and the audit committeeof registrant's board of directors (or persons performing the equivalent functions):
(a) All significant deficiencies and material weaknesses in the design or operation of internalcontrol over financial reporting which are reasonably likely to adversely affect the registrant's ability torecord, process, summarize and report financial information; and
(b) Any fraud, whether or not material, that involves management or other employees who havea significant role in the registrant's internal control over financial reporting.
/s/ Frank Mergenthaler
Frank MergenthalerExecutive Vice President andChief Financial Officer
Date: March 22, 2006

Exhibit 32
CERTIFICATION PURSUANT TO 18 U.S.C. SECTION 1350,AS ADOPTED PURSUANT TO SECTION 906OF THE SARBANES-OXLEY ACT OF 2002
Pursuant to Section 906 of the Sarbanes-Oxley Act of 2002 (subsections (a) and (b) ofSection 1350, Chapter 63 of Title 18, United States Code), each of the undersigned officers of TheInterpublic Group of Companies, Inc. (the ""Company''), does hereby certify, to such officer's knowledge,that:
The annual report on Form 10-K for the year ended December 31, 2005 of the Company fullycomplies with the requirements of Section 13(a) or 15(d) of the Securities Exchange Act of 1934 and theinformation contained in the annual report on Form 10-K fairly presents, in all material respects, thefinancial condition and results of operations of the Company.
/s/ Michael I. Roth
Michael I. RothChairman and Chief Executive Officer
Dated: March 22, 2006
/s/ Frank Mergenthaler
Frank MergenthalerExecutive Vice President andChief Financial Officer
Dated: March 22, 2006
