the interpretation of sustainability criteria using … interpretation of sustainability criteria...
TRANSCRIPT

1
SZENT ISTVÁN UNIVERSITY
PHD SCHOOL OF MANAGEMENT AND BUSINESS ADMINISTRATION
The Interpretation of Sustainability Criteria using Game Theory Models
Theses of PhD Dissertation
Csaba Fogarassy PhD.
Gödöllő, 2014
0

2
SZENT ISTVÁN UNIVERSITY
Office of Doctoral and Habilitation Council
PhD School: PhD School of Management and Business Administration
Discipline: management- and business administration
Director: Prof. István Szűcs PhD.
Professor, doctor of MTA (DSc.)
Faculty of Economic and Social Sciences
Institution of Social Economy, Law and Methodology
Supervisors: Prof. István Szűcs PhD.
Professor, doctor of MTA (DSc.)
Faculty of Economic and Social Sciences
Institution of Social Economy, Law and Methodology
Prof. Sándor Molnár PhD.
Professor, Head of Department, mathematics (CSc.)
Faculty of Mechanical Engineering
Institution of Mathematics and Informatics
data
Director’s approval Supervisors’ approvals

3
TABLE OF CONTENTS
1. ANTECEDENT AND GOALS ................................................................................................................... 5
2. SOURCE AND METHOD .......................................................................................................................... 7
2.1. SOURCE ................................................................................................................................................... 7
2.2. METHOD .................................................................................................................................................. 7
2.2.1. SWOT analysis ................................................................................................................................ 7
2.2.2. Theoretic process evaluation ........................................................................................................... 8
2.2.3. Data collection for multi-dimension „low-carbon” development processes with content analysis . 8
2.2.4. Evaluation of Game Theory algorithms by process of tolerance and applicability ......................... 8
2.2.5. Determining the criteria and cube attributes with the Churchman-Ackoff method ......................... 9
2.2.6. Applicability analysis of „usefulness-functions” in multi-dimension evaluation (SMART) .......... 9
3. RESULTS ................................................................................................................................................... 10
3.1. SWOT ANALYSIS .................................................................................................................................. 10
3.2. THE PRINCIPLES AND SUSTAINABILITY RELATIONS OF THE LAYER BY LAYER SOLUTION METHOD ..... 12
3.2.1. Process evaluation of layer by layer completion of the 3×3×3 Rubik’s Cube .............................. 13
3.3. 1D, 2D AND 3D PROBLEM MANAGEMENT METHOD BASED ON RUBIK’S CUBE .................................... 14
3.4. PROCESS OF ROJECT DEVELOPMENT WITH RUBIK’S CUBE USING GAME METHOD INTERPRETATIONS 18
3.4.1. Algorithms of input-side imaging .................................................................................................. 18
3.4.2. Defining input and output connections with Game Theory correlations ....................................... 22
3.4.3. Imaging of Output-side algorithms ................................................................................................ 25
3.5. SMART (SIMPLE MULTI ATTRIBUTE RANKING TECHNIC) ANALYSIS.............................................. 27
3.6. NEW AND NOVEL SCIENTIFIC RESULTS ..................................................................................... 31
3.6.1. New scientific conclusions ............................................................................................................ 31
3.6.2. New scientific results ..................................................................................................................... 31
4. CONCLUSIONS AND SUGGESTIONS ................................................................................................. 33
5. PUBLICATIONS RELEVANT TO THE PRESENT TOPIC .............................................................. 35

4

5
1. Antecedent and Goals
It is very difficult to calculate in advance the positive and negative long-term impacts of an
investment, or a development venture. A serious global problem arises from the fact that numerous
environmental-protection oriented private and government ventures are implemented in an incorrect
manner significantly impair the conditions of both the environment and the economy (market).
There is a high number of innovative energy related investments, waste and water management
projects, etc. in Europe, which cause more harm to the society than ever imagined . In Hungary, the
state funding – be it direct or indirect – of such enviro-protection oriented ventures amounts to
thousands of billions of HUF every year, and the improper use of these funds can set an entire
economical sector back for decades in its development. Therefore for these funds, proper mapping,
channeling in a manner conforming with market mechanisms, and sufficient re-structuring (as fast
as possible) can not only liberate enormous resources for the society and the domestic economy, but
can also contribute to the improvement of the current state of the environment, the labor market,
and welfare indicators. For these aforementioned development strategies and investment programs
to be contestable, the need for a „construction mechanism” that can fundamentally outrule these
adverse processes and false directions of development throughout the course of planning and
actualisation arises.
In my paper, I’m trying to find solutions to these problems of planning and development
methodology, based on both the Rubik Logic and modern Game Theory applications.
A typical form of environmentally/economically harmful funding is when economic policy
doesn’t have sufficient information on the environmental damages and negative environmental
effects caused by the infrastructure to be developed (f.e. electric systems, or regional waste
management facilities). Because of the low transparency of enviro-orientated developments, both in
an economic, and in a market sense, if we compare them to „no governmental financing” sectors,
we can observe far worse conditions when we aim for an economic development which keeps
market equilibrium intact. Without this balance , supply or demand can typically be either too high
or too low.
The main goal of this dissertation is to make enviro-protection and climate friendly
investments sustainably plannable, under both economic, and political instability. Therefore, my
goal is to provide a scientifically comprehensive model of mathematic relationships based on
project development and management systems, which can handle the aforementioned problems with
its new approach, regardless of national borders.
To realise the main goal of my research, I composed and defined the following targets:
- Through the process of literature review, the classic and modern style introduction of
the relations of economical value and sustainability.
- The mathematic interpretation of sustainability factors, introduction of the
sustainable economic equilibrum or corporate strategies in a game theory approach,
interpretations of finding classic balance points in non-cooperative game theory
solutions.

6
- Introduction of conflict alleviation and compromise search through Game Theory
methods, and the evaluation of its adaptability in sustainable cooperative corporate
strategies.
- The sustainability interpretation of the structure and solution of Rubik’s Cube, and
the analysis of relations between sustainability and the Rubik solution algorithms.
The market errors which presently have a detrimental impact on the economic environment
require a capable external – meaning it’s positioned outside the market’s condition systems, but has
an impact on them nonetheless – condition system, because it’s imperative for the actualisation of
sustainable enviro-investments. The creation of a set of rules through the summary of external
effects, and the definement and tipisation of the correct external effects of developing sustainable
economic structures (and keeping said set of rules defineable through mathematic functions) is a
social requirement, because it can define the presently used criteria of sustainability for both market
shareholders and political decision-makers.
If we go by what was said above, when I defined my goals, I primarily found the verification
of the following hypotheses to be important:
- H1: The relationships of project attributes which have an impact on the viability and
sustainability of enviro-orientated or climate friendly investments can be defined
through models.
- H2: When searching for a sustainable equilibrum using game theory methods, it is
possible to map functions of relations between the compared attributes .
- H3: Multivariate test functions may be used to select attribute groups which
dominantly affect the sucessful implementation of the project.
- H4: The various sustainability logics can be synchronised with the 3×3×3 Rubik’s
Cube solution algorithms, and the relations of the cube’s sides define a planning
strategy that provides a new scientific approach for investment planning.
I assume that the „Layer by layer” Rubik’s Cube solution method, that is, the row to row
solution can be used to model the sustainability criteria, in other words, during project planning
(e.g. investments in renewable energy) the conformance with sustainability criteria can be
maintained with this method.
According to the hypothesis on the solution algorithms of the Rubik’s Cube, the parts
rotated next to each other, meaning the project attributes which have an impact on each other, have
a relation system which can be defined in mathematic terms, therefore, their point of balance (f.e.
Nash’s) can also be determined by game theory models (finite games , zero sum games,
oligopolistic games, etc.).

7
2. Source and Method
2.1. Source
Throughout my research, I thoroughly read though, categorised and critically evaluated
literature sources of both electronic and printed formats, which include domestic and international
literature. The theoric of literature was conducted on the different interpretations of sustainability,
the major Game Theory solutions used in economic strategy planning, and the Rubik solutions. For
the theoretical base of the research, the software analysis of the cube’s inherent attributes was
followed by creation of the actual professional database. The primary data used for the SMART
(Simple Multi Attribute Ranking Technic) 3D analysis was generated through the synthesis of the
research results of Cleantech Incubation Europe (CIE).
2.2. Method
To analyse the software aimed at solving Rubik’s Cube, I used a SWOT analysis during my
research, and to evaluate the processes of the Rubik’s Cube solution algorithms, I used Theoretic
process evaluation. For the sustainability interpretations of low-carbon development processes, I
used content analysis, for which I employed the aid of the European Union’s Low-carbon 2050
strategic guide (http://www.roadmap2050.eu/). The main point of the content analysis was to „ask”
the social product named „A practical guide to a prosperous, low carbon Eusope”, and other
professional documents which went through social control during the data collection, for the sake of
obtaining empirical data. During the research on Game Theory algorithms I was searching for, I
used process of tolerance, meaning I was researching the admissible differences between the
attributes of the cube, and the parametrisation of the Game Theory functions.
To define the criteria-system of the low-carbon project development concept, I used the
Churchman-Ackoff procedure. I examined the estimated usefulness of the factors, for the sake of
optimalising the ones out of all the factor groups which are most important, and most useful to the
project. To determine the relative usefulness of all the factors, I created „usefulness-functions”,
which can properly represent either the equality, or the hierarchy of the factor groups.
2.2.1. SWOT analysis
The goal of the SWOT analysis on solution-searching:
In case of the solution-searching softwares which were examined, the goal of the SWOT
analysis is to determine if the functions of the softwares are applicable to the input and output
system attributes of the low-carbon project evaluation model, and if they satisfy the user
expectations. According to the data at hand, the object of the analysis should be: how, and how
much is the low-carbon innovation and incubation system based on the „About low-carbon
economy” (LCE Ltd. 2011), and „Hubconcepts – Global best practice for innovation ecosystems”
(Launonen, 2011) professional guidelines satisfied by the chosen software.
Reason for the choice of method:
The SWOT analysis offers a good opportunity to create an overwiew comparison, which has
no exact attributes defineable in easily comparable dimensions. In itself, the SWOT analysis has no
meaning, however, if it’s part of a complex analysis, it can sufficiently facilitate thought process.

8
2.2.2. Theoretic process evaluation
With the solution algorithms of the 3×3×3 Rubik’s Cube, the sustainability theories can be
synchronised, and the relations of the cube’s sides define a planning strategy that provides a new
scientific approach for investment planning. I theoretically evaluated the various solution processes,
and investment planning levels paralell to them by following the solution levels and stages of the
cube. After these various level-evaluations, I made „low-carbon interpretation” summaries.
The structure of the process evaluation is as follows:
defining sector or level,
theoretic evaluation,
evaluation of process and results (interpretations),
summarising the evaluation of process and results.
To show the various states of the cube, and to attach an explanation to the low-carbon
interpretations, I used the Online Ruwix Cube Solver program.
2.2.3. Data collection for multi-dimension „low-carbon” development processes with content
analysis
The content analysis can be categorised in the research methods as a so-called „no
intervention” type. The biggest benefit of using this type of examination is that the people doing the
research are a proper distance away from the actualisation of the problem, therefore, they can do the
data collection without any chance of intervention in the process. In this case, there is no problem
with our data collection process affecting the answeree. Content analysis is a kind of data collection
where we conduct information gathering and analysis using the designated document. It is also a
kind of social analysis method, which is used for the the examination of human messaging (Kérdő,
2008). I analysed the program documentations through the social inspection mechanics, and debates
in the Union, which were relevant to both the low-carbon development concepts, and the topic of
sustainability. The point of the content analysis was to „ask” the social products named the „A
practical guide to a prosperous, low-carbon Europe”, the „National Energy Strategy 2030”, and the
„Hungary’s renewable energy plan 2010-2020” (NCST2010-2020 for short) professional
documents which went through social control, for the sake of obtaining empirical data.
During the completion of the content analysis, I found it important to „ask” these social
products which are mostly goal orientations and documents – as the source of my empirical data –
in a way that avoids contradictions, and to highlight the preference indicators of green energy, or
climate-friendly investments as common decision factors.
Reason for the choice of method:
A primary form of data collection, where we try to find an answer with the dissolution of
contradictions in the professional documentation, or continue the examination by re-defining the
contradictions.
2.2.4. Evaluation of Game Theory algorithms by process of tolerance and applicability
The evaluation of process of tolerance in the sense of engineering means the allowed
maximum differentiation from the determined sizes, quantities or qualities. In the case of the Game
Theory algorithms, I researched the following: which method is the same as the solution process
model of the Rubik’s Cube in terms of its attributes, and in what scale does it differ from it, while
staying representative. For the Game Theory algorithms I was searching for, I used process of
tolerance, meaning I was researching the admissible differences between the attributes of the cube,
and the parametrisation of the Game Theory functions (Ligeti, 2006). During the research, I took

9
the various Game Theory algorithms, and analysed the models that can be linked to the rotation
algorithms (interpretations) in the process of model-making.
2.2.5. Determining the criteria and cube attributes with the Churchman-Ackoff method
It is important to weight the attributes which have an impact on the development processes,
to choose the groups that give the defining conditions of the development of the project, and the
actualisation of the investments. In the method made by Churchman and Ackoff, there are two
almost indistinct processes, if we go by the number of attributes. The first one was made for one to
seven attributes, while the second one for more than seven attributes. The method is based on
consecutive comparisons, and is also usable to select a lower number of attributes, which in our
case is four. With the help of this method, I designated the main attributes of the various
development processes, which I can assign to Rubik’s Cube’s four analysis areas (Orange, Red,
Blue, Green). I named them „main analysis agents (attribute groups)”, and then divided them
further into sub-pieces (small cube attributes), according to their usefulness.
2.2.6. Applicability analysis of „usefulness-functions” in multi-dimension evaluation (SMART)
In order to optimise the most important and most useful attributes of the criteria systems
(attribute groups) that have an impact on Rubik’s Cube low-carbon development, we have to
evaluate the estimated usefulness of the attributes. To determine the relative usefulness of all the
factors, I created „usefulness-functions”, which can properly represent either the equality, or the
hierarchy of the attribute groups. These „usefulness-functions” designate a single number to all the
stages, to show the preferability of each stage. By combining the consequences of the actions with
its probability, we get the estimated usefulness for each action (Russel-Norvin, 2003).
By defining the usefulness in the attribute groups, I was able to determine which attributes
will be 1, 2, or 3 dimension cube attributes, in other words – which can be assigned to the mid cube,
the outer cube, or the cornercube.
I also added rank values, or SMART values to the attribute groups, or various attributes
within the groups, which I analysed with a three-dimensional comparison. The research conducted
by the three-dimensional depictions determined which of the analysed attributes can be tagged with
a „not allowed difference”. For these attributes, and their correction of equilibrum, we can use the
typed Game Theory model.

10
3. RESULTS
3.1. SWOT analysis
The SWOT analysis alredy depicted and explained in the methodology part before, has the
goal of making it clear to me, if the functions of the chosen software are applicable to the input and
output expectations of the low-carbon project evaluation model. The analysis was conducted in
accordance to classic SWOT analysis rules, therefore, I won’t show the details, only the charts with
the results. However, for the sake of understandability, I will give a short explanation on the various
software functions.
Softwares evaluated with SWOT analysis: RUWIX PROGRAM
RUBIKSOLVE PROGRAM
SOLUTION SEARCHING LBL SOFTWARE
The solution searching SWOT evaluation of the Ruwix program (Chart 1) in accordance to
the input and output expectations of the low-carbon project evaluation model:
Chart 1: Ruwix program SWOT chart
POSITIVE TRAITS NEGATIVE TRAITS
INTERNAL TRAITS
STRENGHTS
Exceptional graphics and visual
details, some mention it as the world’s
most advanced solution software.
Offers solutions not only to Rubik’s
Cube, but many other logical games.
WEAKNESSES
Presently not compatible, since it uses
different, faster algorithms than the layer
by layer solution, which aren’t the best for
low-carbon solutions.
EXTERNAL TRAITS
OPPORTUNITIES
Because of its strenghts, and the
applicability, it would be beneficial to
develop low-carbon specifications as
well.
THREATS
Since the program runs in an online
format, it isn’t possible to add special data
to it.
Even in case of a low-carbon
specification, syncing the free software
with the pay-to-use SMART add-on
makes it difficult to use.
Source: self-made
The solution searching SWOT evaluation of the Rubiksolve program (Chart 2) in
accordance to the input and output expectations of the low-carbon project evaluation model:
Chart 2: Rubiksolve program SWOT chart
POSITIVE TRAITS NEGATIVE TRAITS
INTERNAL TRAITS
STRENGHTS
Fast, constantly developed, can use
layer by layer method
WEAKNESSES
2D, can’t interpret layer by layer logic at
the input, other user functions are missing.
EXTERNAL TRAITS OPPORTUNITIES
Easy plugin options offer good
compatibility with low-carbon usage.
THREATS
Since it focuses on fast solutions, not all
details can be understood by the users.
Source: self-made

11
Chart 3: Rubik’s Cube Solution Search program SWOT chart
POSITIVE TRAITS NEGATIVE TRAITS
INTERNAL TRAITS
STRENGHTS
The steps of conceptual and practical
solutions are the same
The layer by layer solution is followed
through in the program
Uses obvious advancement and
correction steps
Because of the easy programming, it’s
also easy to develop
Every algorithm is also defineable in
the steps of the low-carbon project
evaluation model as well.
WEAKNESSES
The visual interface is not up-to-date
Slightly slow processing
Not available in online format
As of now, it can only solve the 3×3×3
Rubik’s Cube.
EXTERNAL TRAITS
OPPORTUNITIES
Visual interface
Easy to sync with the SMART
evaluation software plugin
The definition of low-carbon domain
requires no additional development on
the software
Because of the easy programming, it
may prove to be cheap to be a
newcomer on the market.
THREATS
Quite an old development
The program may seem slow, because it
can’t be accelerated properly because of a
set of certain configurations
„Easy to copy”.
Source: self-made
The introduced Ruwix Solver and Rubiksolve applications are both the further developed
versions of Kociemba’s Cube Explorer, which was the basis of most Rubik’s Cube fans’ software
development work and ideas since 2005. After reviewing the different solution programs, we can
say that there is an option to bring in technically any new algorithm, but of course, the goal of all
the developers was to give the competitors a program that offers the solutions with the highest
possible procession speed, and lowest number of combinations necessary.
The Rubik’s Cube Solution Search program (Chart 3) completes the cube with the seven
solution levels defined by MOHÓ’s search program. During the evaluation of the methodology
manual, we made it clear that this one is able to get to the completed stage, meaning the one side –
one color state from any starting stage with the layer by layer method. Also, the process may be
stopped at any given stage. The number of rotations varies by the starting stage, but usually it takes
more than 70 rotations to complete the cube. However, from an easier starting point, it can reduce to
a mere 40-45 rotations.
Also, by analysing the SWOT evaluations, it can be said that the swift
strenghts/weaknesses/opportunities/threats chart prefers the hungarian-developed Rubik’s Cube
Solution Search program, which was optimised for the layer by layer algorithms. This Java-based
application proved to be best in its functionality for the low-carbon project evaluation model’s input
and output expectations, also noted by the structural trait that the software’s „State Area” pack
designates almost the same solution levels, that the hand-solved algorithms do. (The other evaluated
softwares designate almost completely different levels.)

12
3.2. The principles and sustainability relations of the layer by layer solution method
The various sustainability logics can be synchronised with the 3×3×3 Rubik’s Cube’s
solution algorithms, and the relations of the cube’s sides define a planning strategy that provides a
new scientific approach for investment planning. I theoretically evaluated the various solution
processes, and paralell investment planning levels following the solution levels and stages of the
cube. After these various level-evaluations, I made „low-carbon interpretation” summaries. To
show the various states of the cube, and to attach an explanation to the low-carbon interpretations, I
used the Online Ruwix Cube Solver program.
In 1980, Ernő Rubik wrote that the cube seems to be alive, as it comes into life while you
rotate it in your hands. Rubik’s Cube has three rows and three columns, and this can also have a
symbolic, or even mystical meaning. If we look at the attributes of the various blocks, the 3×3×3
cube’s sides, it’s almost immediately obvious that in case of each side, we have system elements, or
specific small cubes (mid cubes, outer cubes, and cornercubes) which hide a specific meaning, and
keep this meaning in them, regardless of where we rotate them in the system. According to Ernő
Rubik, the number „three”, through its special meaning, is even able to model life itself. It’s able to
show the relationship of man and nature, the process of creation, care and destruction, and the
relations of cooperation between our resource systems (Rubik, 1981).
We may think that the solution to the „mystical cube game” problem may properly portray
the biggest question of one of today’s hardest problems – the proper and effective use of energy.
Nowadays, the entire energy consumption system seems like a huge puzzle, where we don’t seem to
be able to find the correct pieces. However, we suggest that the 3×3×3 Rubik’s Cube’s solution
method may help us find the various pieces’ relations, the relevant inclusion of system attributes in
both a 2D and 3D interpretable manner, therefore, it may give correct pointers on interpreting the
supply and demand sides of energy consumption.
One of the most widely known and most used method of solving Rubik’s Cube is the „layer
by layer” method, but we must also note that it’s the basis for the more advanced methods like
Fridrich, Corner first, etc. The gist of the method is to complete the cube during the solution process
row by row. That means that at first, we form a color cross on the first row, then insert the correct
corners, then comes the middle row, and finally, the lower middle cube goes into its place, followed
by the lower cornercubes (Fogarassy et al., 2012).
Most amateurs use the layer by layer method, since this is the easiest to learn, and this is one
of the few that has both a professionally based algorithm, and introduction guides. All other
advanced solution methods began from this one. I introduced the process of solution according to
the outline provided by the www.rubikkocka.hu official website. However, in the current document, I
also included UNFCCC’s basic development theories, namely „Low-Emission and low-carbon
Development Strategies” (LEDS) – which has close ties to basic sustainability criteria – for the
official solution method cited in this document.
We made the assumption that since the Rubik’s Cube’s number „three” offers indirect
answers to many of our world’s currently unsolved questions though it’s mystical logic, it’s correct
to also assume that those who can complete the cube can think „Rubically” in general, or more
specifically, about the questions of strategic planning and economic equilibrum search. In the next
part of this document, you can find the methodical steps on solving the cube, which can be taken as
a compilation theory during strategic development following the solution of the cube, usable for f.e.
the advancement from fossilized to renewable energy support systems.

13
3.2.1. Process evaluation of layer by layer completion of the 3×3×3 Rubik’s Cube
The layer by layer method is fundamentally a structured arrangement system, which defines
cornerstones, stages to the process of completion (white cross, second row, yellow cross, etc.),
where even though these stages can be achieved by different routes, or one might say that everyone
does it to their own personal leisure, it is technically impossible to advance to the next stage without
going through the various stages and phases.
Chart 4: Process of model development, evaluation of results
CUBE
INTERPRETATIONS
(number of rotation
algorithm)
LEVEL OF
MODEL
DEVELOPMENT
/LOW-CARBON/ PROJECT
ATTRIBUTE IN QUESTION
CORRELATION WITH GAME
THEORY
NO1 INPUT „White cross” – defining the starting
criteria
A stage defineable by an n-
person zero sum game of
infinite kind.
NO2 INPUT
„White corner” – defining the
sustainable development routes,
equilibrum-search, non-cooperative
optimum
According to functions on Nash-
equilibrum, non-cooperative
strategy, defineable by games of
finite kind.
NO3 MID CUBE
„Second row” – anchoring of
relation points, achieving
equilibrum, arranging two-
dimensional attributes, positioning
fixpoint
Positioning outer cubes is
possible with conflict alleviation
methods. Fixpoint positioning is
advised to be done with zero
sum game.
NO4 MID CUBE „Yellow cross” – indirect
synchronising of input/output sides
Defineable by oligopolistic
games of finite kind, or method
of equal compromise.
NO5 OUTPUT
„Yellow corner” – interpretation of
sustainability attributes during the
arrangement of outputs
Defineable by three-person
game of infinite kind, needs
Nash-equilibrum.
NO6 OUTPUT „Yellow side edge-switch” – strict
synchronising of input/output sides
Defineable by zero sum game,
conflict alleviation method, and
cooperative strategy.
NO7 OUTPUT
„Corner switch” – the phase of
setting the final balance, achieving
equilibrum, finalising sustainability
attributes
Oligopolistic games by
functions based on either
cooperative equilibrum strategy
or Nash-equilibrum.
Cooperative strategy.
Source: self-made.
In case of the sustainability principles and low-carbon development concepts, the abidement
by the steps of development phase to phase has importance, because even though the circumstances
and the makings may define different routes to equilibrum search, the arrangement logic must be
the same, wherever we search for the equilibrum points – be it Hungary, or China, etc. I relied upon
the methodical guideline of the www.rubikkocka.hu official website, and the solution plans of
Singmaster (1980) during the defining of the row by row solution phases. However, because of the
low-carbon methodology connections, the process which is demonstrated and interpreted in this
document differs greatly from these guides. To illustrate the various stages and different solution
levels of the cube, I used the Online Ruwix Cube Solver program.
14
3.3. 1D, 2D and 3D problem management method based on Rubik’s Cube
Project planning and development is basically a process optimalisation, which is based on
the collective handling of different attributes, in a way that the examined segments are placed into
the most harmonic constellation compared to each other. In case of a supposed „low-carbon
optimalisation protocol”, there is a need to create four different determination areas (attribute
groups), which can be associated with the 3×3×3 cube’s different colored sides. Two opposing sides
(white and yellow) would be our project’s input and output sides. The attribute groups which
determine our optimalisation can be the following in a demonstrational project: optimalisation of
strategic goals system (red side), analysis of market opportunities (green side), the area of
actualisation and technological criteria system (blue side), monetary effects (orange side), the
attributes summarizing input-side goals (white side), and last, but not least, the attributes
summarizing output-side goals (yellow side).
One of the most important characteristics of the low-carbon optimalisation concept (based
on the software development experiences from India), is that the analysis of various projects on
multiple levels is based on the analysis of the relevant interactions of various pieces, therefore, by
avoiding the analysis of irrelevant interactions spares tremendous time and effort (low-carbon
solution). The system connections assigned to the various sides of the cube (outer cube
characteristics, and cornercube characteristics) makes the direct examination of various attributes
irrelevant, meaning that not all system connections actually have to „communicate” with each other.
The „communications” between these system elements can therefore be reached by simple border-
area connections, or through transferred system connections.
In the next chart (Chart 5) I summarized the characteristics of the input and output sides of
an actual project. The typed goal of project development in this case is the advancement from
fossilized energy resources to renewable ones, or its combined systems. The four main agents which
were assigned to the four colored sides were decided upon by professional evaluation, individual
weighting and process of dominance analysis in charts 6 and 9. Of these four colors, red represents
„criteria of laws and regulations for strategic program development”, green represents „examination
of market opportunities”, blue represents „technological criteria system”, and orange represents
„summarisation of monetary effects”. Also, on the various sides (main agents), I defined cube
characteristics which represent two or three individual attributes through the connection system of
the cubes themselves. The characteristics, which are unimportant and unrelated to the development
and actualisation of the project per se, are linked to the mid cubes, of which there is one on each
side, with one defining attribute – obviously though, even if there are fixed cubes on the input and
output sides as well, they aren’t associated with main agents. The attributes which include two or
three different factors were linked to the outer and cornercubes. The defining of the attributes and
their association to the cubes was done by their usefulness. The attributes which are determinable
one way (pointlike) were named 1D (x), those which are determinable two ways were named 2D
(x,y), and those which are determinable three ways were named 3D (x,y,z) attributes. Even though
in our following project, the choice of definition of Rubik’s Cube’s attribute sides and its cubes was
random, it’s still advised to examine their usefulness with some kind of function-like connection,
because we can define the importance of the attributes and the preference comparisons. Also, to
raise the sufficience of the model, we employed a new method to weight criteria and define
dominance.
Following the completion of the process of dominance analysis and the use of the
„usefulness-function”, both the attributes of the main agents and the small cube attributes fall into
place.

15
Chart 5: Meanings of input (white/W) and output (yellow/Y) sides of Rubik’s Cube
SIDE COLORS
MEANING OF COLORS
1D – single-simension trait (x)
2D – dual-dimension trait (x,y)
3D – tri-dimension trait (x,y,z)
WHITE (F)
INTPUT:
Defining input requirements, basic system of the product or provision defined along the
matching of state regulations and market.
IMAGING OF WHITE SIDE:
MID WHITE (1D)
energy rationalisation (W)
OUTER WHITE (2D)
strategic base-connection (WR),
basic technological requirement (WB),
financing expectation (WO),
basic market positioning (WG),
CORNER WHITE (3D),
basic requirement of payoff (OGW),
sufficience to technological criteria and funding instruments (OBW),
syncing basic goals with technological threats and innovation priorities (BRW),
designating strategically synced market segment at basic criteria (RGW).
YELLOW (Y)
OUTPUT:
Pareto optimal product or provision system outlined by taking into consideration the
maximum values of resource-usage opportunities.
IMAGING OF YELLOW SIDE: MID YELLOW (1D)
resource-optimised energy consumption/profitable production (Y)
OUTER YELLOW (2D)
strategic congruitisation of energy and CO2 scale (RY),
optimising technological threat minimalisation (BY),
tax and benefit criteria in the energy-production system (OY),
monetary criteria of artificial and actual advancement to the market (GY),
CORNER YELLOW (3D)
structure compatible with strategic goals systems, where „shelf-life” is also guaranteed (RYG),
planning option sufficient both in monetary and technological terms – meaning
technological solution which guarantees positive cost-benefit rate (OYB),
production and provision conditions sustainable on the market (GYO),
long-term and legit option, where the chosen technological solution supports the
strategic goals to the utmost level (BYR),
(endorsement of sustainability criteria through development).
(Definitions: D=dimension, W=white, Y=yellow, G=green, R=red, B=blue, O=orange)
Source: self-made.

16
Chart 6: Meanings of attribute side Red(R) of Rubik’s Cube
SIDE COLORS
MEANING OF COLORS
1D – single-simension trait (x)
2D – dual-dimension trait (x,y)
3D – tri-dimension trait (x,y,z)
RED (R)
Criteria of laws and regulations for strategic program development:
Providing the defining information, synergies, cooperations for the planned profile on a
corporate, local, sectoral, regional or union economic policy level.
MID RED (1D)
realisation of local/corporate strategy (R)
OUTER RED (2D)
following and matching of marketing strategy and economic policy priorities (RG),
defining technological systems for cost-clear versions, matching the techno-
parameters of financing priorities to the project (RB),
strategic congruitisation of energy and CO2 scale (RY),
strategic base-connection (RW)
CORNER RED (3D)
syncing basic goals with technological threats and innovation priorities (BRW),
designating strategically synced market segment at basic criteria (RGW),
structure compatible with strategic goals systems, where „shelf-life” is also guaranteed (RYG),
long-term and legit option, where the chosen technological solution supports the
strategic goals to the utmost level (BYR)
(Definitions: D=dimension, W=white, Y=yellow, G=green, R=red, B=blue, O=orange)
Source: self-made.
Chart 7: Meanings of attribute side Green(G) of Rubik’s Cube
SIDE COLORS
MEANING OF COLORS
1D – single-simension trait (x)
2D – dual-dimension trait (x,y)
3D – tri-dimension trait (x,y,z)
GREEN (G)
Examination of market opportunities:
Evaluation of market opportunities and positions in artificial and actual market
segments.
MID GREEN (1D)
plannable price in supply and demand equilibrum (G)
OUTER GREEN (2D)
following and matching of marketing strategy and economic policy priorities (RG),
effects of market changes on the financing system, analysation of foreign currency
risk factors, and global effects (OG),
monetary criteria of artificial and actual advancement to the market (GY),
basic market positioning (WG).
CORNER GREEN (3D)
structure compatible with strategic goals systems, where „shelf-life” is also guaranteed (RYG),
production and provision conditions sustainable on the market (GYO),
basic requirement of payoff (OGW),
designating strategically synced market segment at basic criteria (RGW).
(Definitions: D=dimension, W=white, Y=yellow, G=green, R=red, B=blue, O=orange)
Source: self-made.

17
Chart 8: Meanings of attribute side Blue(B) of Rubik’s Cube
SIDE COLORS
MEANING OF COLORS
1D – single-simension trait (x)
2D – dual-dimension trait (x,y)
3D – tri-dimension trait (x,y,z)
BLUE (B)
Technological criteria system:
Matching of market opportunities and technological solutions. Research of the techno-
risks and opportunities is advised.
MID BLUE (1D)
technological usage that abides by BAT technological requirements (B)
OUTER BLUE (2D)
defining technological systems for cost-clear versions, matching the techno-
parameters of financing priorities to the project (RB),
basic technological requirement (WB),
optimising technological threat minimalisation (BY),
the most cost-efficient technological solution with both high quality and innovation-
level (BO).
CORNER BLUE (3D)
sufficience to technological criteria and funding instruments (OBW),
planning option sufficient both in monetary and technological terms – meaning
technological solution which guarantees positive cost-benefit rate (OYB),
syncing basic goals with technological threats and innovation priorities (BRW),
long-term and legit option, where the chosen technological solution supports the
strategic goals to the utmost level (BYR).
(Definitions: D=dimension, W=white, Y=yellow, G=green, R=red, B=blue, O=orange)
Source: self-made.
Chart 9: Meanings of attribute side Orange(O) of Rubik’s Cube
SIDE COLORS
MEANING OF COLORS
1D – single-simension trait (x)
2D – dual-dimension trait (x,y)
3D – tri-dimension trait (x,y,z)
ORANGE (O)
Summarisation of monetary effects:
Type of financing, relevance of government tools, tax, foreign currency risks, liquidity
questions.
MID ORANGE (1D)
time for payoff, corporate value (O)
OUTER ORANGE (2D)
tax and benefit criteria in the energy-production system (OY),
financing expectation (WO),
the most cost-efficient technological solution with both high quality and innovation-
level (BO),
effects of market changes on the financing system, analysation of foreign currency
risk factors, and global effects (OG)
CORNER ORANGE (3D)
planning option sufficient both in monetary and technological terms – meaning
technological solution which guarantees positive cost-benefit rate (OYB),
basic requirement of payoff (OGW),
sufficience to technological criteria and funding instruments (OBW),
production and provision conditions sustainable on the market (GYO).
(Definitions: D=dimension, W=white, Y=yellow, G=green, R=red, B=blue, O=orange)
Source: self-made.

18
3.4. Process of roject development with Rubik’s Cube using Game Theory Method
interpretations
The low-carbon project planning and project development using Rubik’s Cube is a specially
constructed planning concept which – as of now – is a one of a kind concept that can interpret
factors with an impact on processes in 3D. For „setting” the equilibrum point of the economical or
resource-usage of input and output sides, and to describe the relation between them, I used game
theory solutions which weren’t used for this purpose during scientific research before.
Used before the process of modeling, the evaluation of process of tolerance in the sense of
engineering means the allowed maximum differentiation from the determined sizes, quantities or
qualities. In the case of game theory algorithms, I researched the following: which method is the
same as the solution process model of Rubik’s Cube in terms of its attributes, and in what scale
does it differ from it, while staying representative. For the Game Theory algorithms I was searching
for, I used process of tolerance, meaning I was researching the admissible differences between the
attributes of the cube, and the parametrisation of the Game Theory functions.
During the complex modeling, I analysed the Game Theory models one by one, and through
the process of modeling I assigned the relevant models to the various rotation algorithms
(interpretations). I separated the attribute groups of the cube to three different aggregations, which
are INPUT side attributes, MID CUBE side attributes, and OUTPUT side attributes. I used Game
Theory methods to determine the points of equilibrum between the three attribute groups. The gist
of this was that where the attribute elements were tagged with a „not allowed difference” by the
SMART (Simple Multi Attribute Ranking Technic) analysis, I listed parameters which lead to the
points of equilibrum (Nash equilibrum) through strategic models. Both the analyses and the
modeling were conducted via a three-stage system, therefore I also conducted the Game Theory
modeling of the entire process on three levels, meaning the matching of three different types of
Game Theory models (or three different cost-functions).
3.4.1.Algorithms of input-side imaging
The project begins in this phase. We can find the answer to the following question: what do
we have to keep in mind when starting a project! The incorrect rotation of the first layer, or row of
cubes results in incorrect continuation, therefore, we can’t approach the next layer.
We can easily explain this with a simple energy-transaction. If we change our initial energy-
supply system in a way that the old one still has a life expectation of 20-40% of its estimated use
duration, then we may end up with a considerable financial loss if we intervene. To avoid ending up
in such a situation, we can use a Nash equilibrum to calculate the optimal intervention time.
GAME THEORY MODELING OF INPUT SIDE (LEVEL 1)
Enviro-orientated developments are fundamentally against the economic development
priority system (f.e. the program for lowering the greenhouse gases, and the one for usage of
fossilized energy sources contradict each other, since the former promotes minimalisation of energy
consumption, while the latter promotes the increased emission of pollutants). When planning the
first layer, this can be used in the process of project planning in terms of regulation policy and
financing policy (Illustration 1). We also have the same situation concerning the the waterbase-
defense and the rising requirements of favored water-dependant energy plants.
In case of various projects, for the sake of realising clear business regulations and
sustainable business strategies, we have to include the criteria of non-cooperative competitors as
well. In this situation, it’s incredibly hard to find the Nash equilibrum, but imperative nevertheless,
since the project can’t be further developed in a controversy.

19
Definition:
The definition of the Nash equilibrum is as follows:
The equilibrum point or strategy of a n-member game is a
point (strategic n-tuple), which satisfies
, …,
, …,
for every player. Such an equilibrum is called a Nash equilibrum.
Thesis:
Following the completion of the first layer, only the connection with a Nash equilibrum can
be further developed, meaning that we can only rotate the cube further from this position. The first
layer always correlates with the second layer’s mid cube, and can only be the same color.
Illustration 1: Equilibrum point for the first row or layer (circled), where the mid cube is
always the same color (illustrated by the lines).
Verification:
Let = (
be one point of equilibrum for the game. Then for any arbitrarily chosen
:
from where through simple addition it’s obvious that . Based on this, a well-
performing algorithm can be provided to define the points of equilibrum which have an impact on
the planning, and to solve the fix-problems of the aggregations.
Example:
It’s a critical point during the planning of biomass-based renewable energy production that
the high amount of water consumed can have a detrimental effect on the project’s profitability, and
may become the criteria for use of the most effective technology. Therefore, the question, and the
criteria is wiewed as strictly technological in nature, and we try to match the strategy and Game
Theory optimum with the cornercube which has 3D attributes (colours are red-green-white), where
white means input, red means regulation criteria, and green means technological solutions, which
we handle collectively (Illustration 2).

20
Luckily, solving water distribution problems plays a major role in Game Theory solutions,
but we can usually reach the points of equilibrum that provide criteria for the outlines of an assured
system usage only through defining many intricate function-connections, for which calculating
mathematic correlations is quite difficult. Multi-purpose water usage, and the interests and cost-
functions of those connected to it offer different optimums, which usually suppose a game of multi-
player and nonlinear nature, and yet which is somehow still a non-cooperative game based on some
kind of Nash equilibrum.
To define the problem – according to the low-carbon developments using Rubik’s Cube – I
made a three player optimalisation regarding water usage for the process of strategic planning using
Rubik’s Cube, based on the guide by Szidarovszky and Molnár (2013).
Multi-purpose water usage as a decision-method task has been a problem for decades, and
one with many solution options. In our case, we’re searching for one on a non-cooperative three-
player (agricultural consumer /watering/, industrial consumer /cooling/, and household consumer
/functional/) Nash equilibrum. The central element of the low-carbon strategy problem is how will
the agricultural (biomass producer) water usage project developer decide, if the project has enough
water out of the resources at hand.
Illustration 2: 3D attributes of „white-green-red” corner cubes (WGR), the technological
solution that assures payoff (optimised for three-person water usage)
(Dimensions from left to right: SMART value, Cube type and dominance, Main agent
inherent attributes)
Source: self-made.
The problem has three dimensions, where the Rubik solution is the issue of the input side.
The base of water usage can be water, underground water, and purified wastewater. Let k = 1,2,3 be
the three players, who may follow variations of decision during their decision phase as follows:
The strategy for each player can be described by a five variable vector:
where
fk = local water tk =local underground
water
kk = purified wastewater
fk =import water tk
=import underground
water

21
The payoff-function for the total amount of water used for each player is as follows:
All players have two common constraining criteria, one of which state that the amount of
used water may not be less than the minimal requirement , while the other states that it may
not be more than the maximum requirement of thechnology either . (These sustainability criteria
are to avoid wasting water.)
In addition, the agricultural player (k=1) has to introduce two additional criteria for water usage,
which have the following variables:
G = group of plants exclusive to underground water
ai = density of plants (i) on the entire agricultural area
wi = water-demand of plants (i) by acre
T= group of plants which can be watered with purified wastewater
We know that the underground water supply offers the best quality water, while the purified
wastewater offers the worst, so we have to define the volume of plants (sensitive) in the agricultural
portfolio which can’t be irrigated with purified wastewater. The water requirement which draws
solely from the underground water sources may not exceed the water-dependence of the plants
which are exclusive to clean, quality underground water:
equation converted to linear form:
where
Similarly, the rate and availibility of the purified water can also be modeled. The water
requirement for purified wastewater may not exceed the total availible amount either. This
connection gives the volume of plants that can either only or also be watered thus (f.e. plants for
energetic use).
equation converted to linear form:
where

22
For the other players, we similarly have to define the connections of the functions defined
by complications, for which the system can be found in the cited publications, before adding
numeric data.
In light of the above mentioned facts, it can be stated that if we design our agricultural
systems for the use of energetic biomass by allocating the complicating energy source (in this case,
water) into an equilibrum state right at the beginning with Game Theory methods, then the planning
process is applicable to the sustainability criteria system as well. The actual result of the entire
analysis can be one of the following: either we won’t over-calculate the water usage (over-calculate,
as in the allocation won’t be misrated), or we will discard the project entirely, because it doesn’t
abide by the sustainability criteria, since if it’s clear at this point that the amount of water at hand is
insufficient to reach the Pareto optimal production state, then the shortage of water causes a water-
deficit in the analysed system.
3.4.2. Defining input and output connections with Game Theory correlations
GAME THEORY MODELING OF MID CUBE CONNECTIONS (LEVEL 2)
Keeping the mid cube in place and solving the row or layer imitates the zero sum game,
since the position of the mid cube can not be changed, so it serves as a fix point for the rotation of
the other cubes. Their place is fixed (meaning they can’t be rotated out of their position, or
connection systems), and their defined value elements can be considered constant (Illustration 3).
Illustration 3: Zero sum games are always illustrated with the fixed mid cube (circled), which
serve as criteria for the optimalisation of outer cubes (two colors).
Source: self-made.
Definition:
A game with players is called a constant sum game, if the sum of the wins and losses
of the player is a constant , regardless of strategy.
Formula:
Where , the game is zero sum.

23
Thesis:
With the zero sum game, we do a constant sum optimalisation because the resource has a
limited sum due to the fixpoint trait, therefore, the goal is to harmonically divide the resources at
hand, and we search for the point of equilibrum of the attribute group (Illustration 4). During the
SMART analysis, we verified that the orange mid cube of Rubik’s Cube shows a „not allowed
difference” attribute. Currently, the inherent attribute group of the orange side is the monetary value
of the project, and the time needed for payoff. The analysis of this trait with Game Theory
optimalisation methods shows us how the fixed resources of the low-carbon project will optimalise
themselves into a Nash equilibrum.
Illustration 4: Not allowed attribute of the SMART analysis (time for payoff, value of project
isn’t in equilibrum with the other attributes)
(Title: Middle Cube, Dimensions from left to right: Usefulness, SMART value, Value score).
Source: self-made
The imbalance on Illustration 4 can be ascribable to the insufficience of the stability of
external factors which have an impact on the payoff of the investment. We have to analyse the
circumstances of market entry of the newcomer.
It isn’t easy to solve the problem, if there are attributes in the group which are non-market
elements (externals), but have an impact on the time required for payoff nevertheless (f.e. tax- and
regulation policy, pollution control, foreign currency policy, etc.).
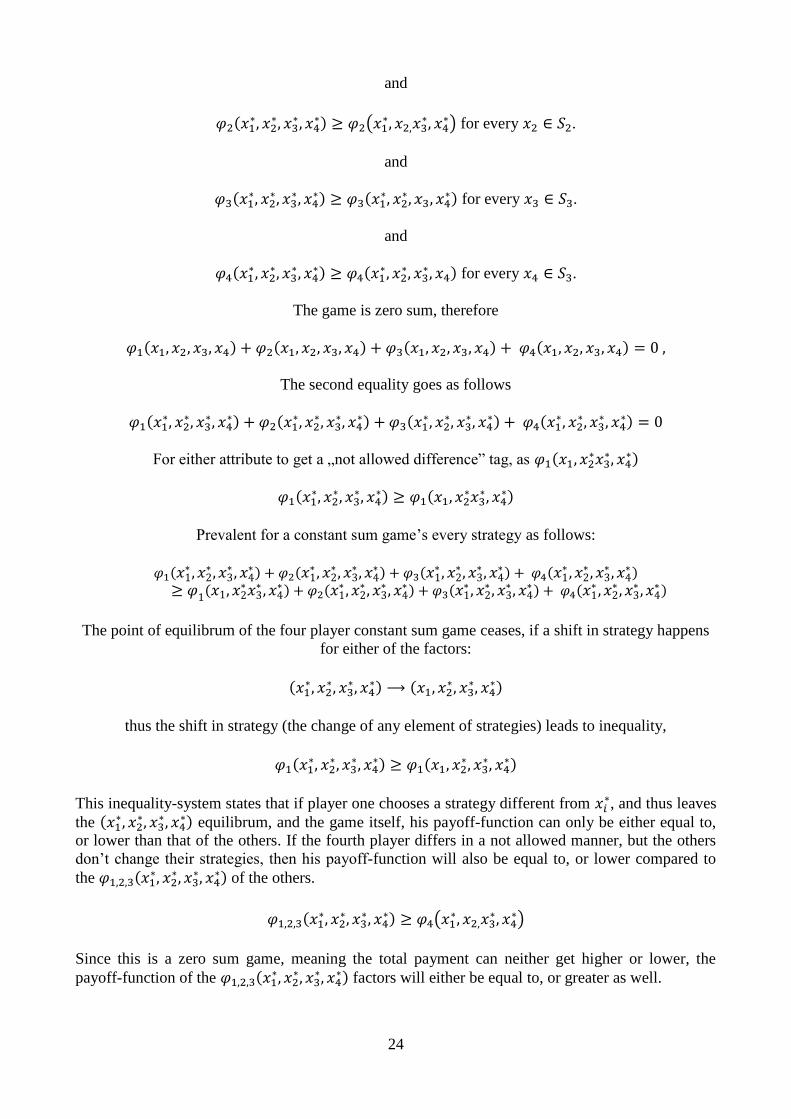
Verification:
I defined the points of Nash equilibrum for the mid cubes of Rubik’s Cube (four different fixed
attributes) by searching for the attributes which aren’t part of the Pareto optimal state.
player constant sum games can be used to demonstrate the points of equilibrum for the four
different attributes.
If we take a
point of equilibrum, we can define that
for every .
24
and
for every .
and
for every .
and
for every .
The game is zero sum, therefore
The second equality goes as follows
For either attribute to get a „not allowed difference” tag, as
Prevalent for a constant sum game’s every strategy as follows:
The point of equilibrum of the four player constant sum game ceases, if a shift in strategy happens
for either of the factors:
thus the shift in strategy (the change of any element of strategies) leads to inequality,
This inequality-system states that if player one chooses a strategy different from , and thus leaves
the
equilibrum, and the game itself, his payoff-function can only be either equal to,
or lower than that of the others. If the fourth player differs in a not allowed manner, but the others
don’t change their strategies, then his payoff-function will also be equal to, or lower compared to
the
of the others.
Since this is a zero sum game, meaning the total payment can neither get higher or lower, the
payoff-function of the
factors will either be equal to, or greater as well.

25
3.4.3. Imaging of Output-side algorithms
One of the popular types of non-cooperative Game Theory solutions is conflict alleviation
methods. From these, we can highlight the axiomatic solution system of Nash, which creates axiom
aggregations in order to assure the solution always places on the Pareto-line. The Kálai-
Smorodinsky solution defines the minimum reachable, or the last available point (meaning
acceptable worst) to the solution of the conflict by defining the worst possible leaving point of the
conflict.
GAME THEORY MODELING OF OUTUT SIDE (LEVEL 3)
The phase of setting the final equilibrum state by the corner switch we do on the leaving
side, the equilibrum search, and the finalisation of the sustainability criteria can usually only be
done with cooperative strategy.
Definition:
Cooperative games can be defined by the following concepts. as in
aggregation of players, where subset is known as a coalition: . Let be an aggregation of
the subsets, meaning the aggregation of possible coalitions. The main aggregation is called
coalition total.
Thesis: In low-carbon investment concepts, the project generates energy drawn from renewable
sources, but the produced electricity can only reach the consumer if the owners of both the green
electricity producer (Investor/B) and the electricity system (System/H) agree with each other that
the product reaches the consumer through the system. A criteria of cooperation is that the investor
pays a usage/transport fee to the owner of the system, and the owner acknowledges that instead of
the previous (fossilized) product, he transports private product via the system, and in a lower
volume. As compensation, the system gets the pay from the investor. This compromise, in essence,
means that there has to be a valid agreement on provisioning conditions on the market. We tried to
match the „green-yellow-orange” attribute cube of the previously established Rubik’s Cube project
planning method with the model, and to assign the proper strategy to the cooperation.
Verification:
We can introduce our conflict-alleviation method with a two-player game. In the example,
let the players’ strategies be represented by and , and the two payoff-functions by .
The aggregation of possible payoffs will therefre be 2D, and can be shown as follows:
In this case, as always, the payoff of both players aims at maximalisation, but naturally, the
various payoffs of one player depends on that of the other, and the fact that raising one player’s
payoff will lower the other’s stands as a rule. Therefore, the objective is to find a solution, which is
acceptable to both the investor and the system owner, meaning both parties simultaneously. We also
have to state that in case of the agreement not being „signed”, both parties get a lower payoff, or a
punishment.
Standard representations:
this will be our standard payoff vector, where we assume that there is a , where
, and . The problem is defined mathematically with the pair. On Illustration

26
5, this pair was defined. We also assume that aggregation H is not open, convex, and bounded, so in
case of:
and bounded in both coordinates, meaning
in case of .
Illustration 5: Illustration of conflict state with the position of the payoff-function
Source: self-made
We also assume that the limit of H is the graph of a function, which is strictly
falling in and is concave. The graph of function is usually called the Pareto line, therefore,
the conditions of satisfying the optimum criteria of sustainability can be met here. We must also
take into consideration with the game and solution criteria that no rational player will accept a
compromise that means a worse payoff than the payoff without agreement.
This way, we can tighten the payoff aggregation as follows:
Conclusion:
We concluded an unorthodox Game Theory optimum search on the different (cube) levels
for the low-carbon planning of the project development process. During the Game Theory optimum
search, I defined a theoretic model structure, which means fundamentally placing three different
types of Game Theory solutions after each other, while keeping tabs on which Game Theory
method is most efficient for featuring the various economic criteria systems:
1. Cube level one: non-cooperative three player game (for the correction of not allowed
differences on Input side),
2. Cube level two: non-cooperative zero sum game (for the correction of not allowed
differences of mid cube connections),
3. Cube level three: conflict alleviation method with two player game (for the correction of not
allowed differences on Output side).
The three different Game Theory models together can define the states of Nash equilibrum
required during project development, which help achieve sustainability during the realisation of the
project. The sufficient selection of Nash equilibrum is possible through the SMART value
definition based on the connection system of the cubes. An introduction to this will be given later in
this document. However, we must stress that the Game Theory row that I selected (three person
cooperative game, non-cooperative zero sum game, conflict-alleviation method) is applicable

27
mainly for typed energetic development, and a strictly defined economical environment (Hungary
and East- and Mid-east Europe). Therefore, we can say that economic externals or development
goals that differ from these can allow different Game Theory rows to be used as well.
3.5. SMART (Simple Multi Attribute Ranking Technic) analysis
To interpret the attributes of the cubes, and to define the attributes associable to the
smallcubes, I chose the SMART (Simple Multi Attribute Ranking System) method, which can
handle and illustrate 2D and 3D attributes at the same time. I chose the analysis method as defined
in the methodology segment, which method counts as a one of a kind software application in terms
of visually illustrating different attributes.
The process of the SMART analysis was as follows:
1. Evaluating the results of process of dominance conducted on main agents, input of data,
2. Defining the smallcube attributes of examination levels, and the estimated usefulness
values,
3. Creation of SMART charts and illustration in 3D.
Using the results of the Churchman-Ackoff process of dominance analysis, the beginning
data of the SMART evaluation is as follows (where I defined the color/attribute matches according
to the results of said process of dominance analysis):
Group1: weighting of attributes
Summarisation of monetary effects: 90 --------►orange
Adaptation of law and regulations: 70 -----------►green
Examination of market opportunities: 60 --------------►blue
Technological criteria system: 50 -----------------►red
Strategic program positioning: 30 -----------------►not present
In the first chapter, we answered the question, how we can match the solution algorithms
with the different levels for the process of project planning based on Rubik’s Cube, and with the
Churchman-Ackoff method, we get the four most important attributes from the list of attributes
which have an impact on it, namely those we can match to the cube’s sides. If white (W) is the
Input side, then the most dominant attribute group is matched with the orange (O) side, which gives
us our WO base sidepair, from where we continue clockwise around the white side, and the
following sidespairs of white-blue (WB), white-red (WR), and white-green (WG) will define the
relevant attributes (agents) in the planning process.
The assortment criteria is that the most dominant attribute gets placed on the top (in our
case, this is orange – O), and the least dominant attribute goes opposite to this side, meaning the
bottom (in our case, this is red – R). The reason for this is that the description of their connection
profiles (including the contradictions and errors) can be defined best, if it happens via a transaction
through two other attributes (left and right sides). In our dominance list, the weakening attributes
located in the middle are arranged by their „order of weakening”, namely counter-clockwise. The
gist of the ranking is that the attribute groups that show stronger dominance are supposedly in better
order, while the attribute group of weaker dominance is supposedly further from the point of
equilibrum. The attribute group with the strongest relevance will be placed on the top, the weakest
relevance attribute group will be opposite to this side, and finally, we define the remaining two
groups by their „order of dominance”, namely, counter-clockwise. Since the solution of the cube
usually happens clockwise in the various algorithms, the parts are optimalised towards the point of
equilibrum through the steps of process following the shortest route to solution, which explains why
we position the most dominant attribute groups to the green side on the right of our beginning

28
orange side, and the third strongest dominant attribute group to the green side on the left of our
beginning orange side.
Definition of Usefulness-functions
Compared to our analysation method, the SMART software offers a general function-
definition method. The data and criteria introduced in the next structure can be simply added to the
database of the program, and be evaluated with the help of the plugin algorithms.
SMALLCUBE
NUMBER
USEFULNESS
(1-100)
(assumed)
CONNECTION,
DIMENSION
VALUE
SMART
VALUE (V)
CUBE TYPE AND
DOMINANCE
MAIN AGENT INHERENT
ATTRIBUTES
After filling in the charts, the conversion of usefulness-functions into usefulness values is
conducted through the following steps:
1. the maximum value is assigned a score of 100,
2. the minimum value is assigned a score of 0,
3. after defining the two border values, we can also define the middle usefulness value (meaning
half-useful compared to the maximum), which is assigned a score of 50,
4. after defining the maximum border value and the middle value, we can also define the
usefulness value in-between them, which is assigned a score of 75,
5. after defining the minimum border value and the middle value, we can also define the
usefulness value in-between them, which is assigned a score of 25.
Using a similar method, we can get inner function values, and to the points we get this way,
we can mathematically assign an interpolation. The sufficience of the alternatives is defined by the
weighted mean of the usefulness value. I indicated the connection dimension values (which is also
clearly visible in Chart 10) as follows: 3/3 for the three-level connections (cornercubes), 2/3 for
three-level connections (outer cubes), and 1/3 for the fixed cubes. In regards to this, the usefulness-
function for main graph or main attribute is as follows:
,….
According to the equation above, by portraying the SMART values for the various levels, we obtain
clear knowledge on the attributes which have an impact on the different dimensions of usefulness
for the main agent. We can wiew the inherent attributes of the main agents (O,R,G,B), their
relations to each other, and the usefulness attributes of the Input side in Chart 10.
Chart 10: Generating SMART input values for data insertion (’►X’ = usefulness) MID WHITE (1D) – energy rationalisation Dominance:100 (100) max value
OUTER WHITE (2D) Dominance: Orange/ 90; Green/70; Blue/60; Red/50
strategy, regulation base connection (WG), 100/70 ► 85,0
basic technological requirement (WR), 100/50 ► 75,0
financing expectations (WO), 100/90 ► 95,0
basic market positioning (WB) 100/60 ► 80,0
CORNER WHITE (3D) –
basic criteria of market payoff (WOB), 100/90/60 ► 83,3
eligibility to monetary tools and regulation criteria (WOG), 100/90/70 ► 86,6
syncing basic goals with technological threats and market priorities (WBR), 100/60/50 ► 70,0
basic criteria designation of matching set of strategies and technologies (WGR), 100/70/50 ► 73,3
Source: self-researched

29
After the input of data generated in Chart 10, the SMART Bubble Chart Pro (demo version) creates
the attribute illustrations via the „Value Score” point rating system, which is useful because the
attributes compared to each other can be differentiated visually as well, regardless of that happening
by their correctness or their strategic usefulness. Illustration 6 shows the input datachart of the
SMART program.
Illustration 6: 2D Illustration of the results chart of the SMART program
Source: self-made based on SMART program
The equilibrum state of the Input side is unstable, evidenced by the F1 attribute, which is the basic
attribute designation of matching set of strategies and technologies (WGR/white-green-red).
Illustration 7 shows the attributes, and their position in the attribute group. If we click on the sphere,
we get the coordinates (x,y,z) for it, which translate to special usefulness-functions. Because of the
3D depiction, both the connection of attributes, and the depth of said connections can be easily
interpreted on Illustration 7.
Illustration 7: Depiction of results and non-equilibrum attributes of SMART program output
Source: self-made

30
With the aid of the SMART program, I evaluated the Input side (as seen on Illustrations 6
and 7), the mid cube side-attributes, and the Output side.
To summarise the analysis, we can say that I was successful in assigning the project
development factors to the side colors of Rubik’s Cube going by the dominance of the attribute
groups. The process of dominance analysis conducted with the SMART pilot program, and the
summary of its results is as follows:
The definition of input and output sides of project attributes by picturing them to the
white and yellow cube sides was completed,
In case of the main attributes, orange was the most dominant, while red was the lesast
dominant, therefore, the dominance values are the highest for orange, and the lowest for
red. If the orange side is in the front, then we find the red side opposite to it, where green
goes to the right, and blue goes to the left of orange,
Going by the dominance, defined in the methodology part, the strongest attribute was
assigned to orange, the second strongest assigned to green, the third strongest assigned to
blue, while the weakest assigned to red, following the strength of dominance,
I separated the analysis method (including the various attribute groups) into three
different parts – 1) Input ► 2) Mid Cube ►3) Output – for the sake of applicability of
the Game Theory methods, and the SMART analysis,
We can set the Game Theory optimalisaion for the „selection of technology for base
criteria” attribute of the Input side, because this is where the SMART program showed a
not allowed difference,
We can set the Game Theory optimalisaion for the „monetary value of the project, and
the time needed for payoff” attribute of the Mid cube side, because this is where the
SMART program showed a not allowed difference,
We can set the Game Theory optimalisaion for the „market criteria system, balancing of
market instruments and provisions” attribute of the Output side, because this is where the
SMART program showed a not allowed difference,
Therefore, the results of the analyses on project evaluation of project planning processes
for projects which aim at advancement from fossilized energy sources to renewable ones
is that the attributes with the most impact are as follows: selection of technology for base
criteria (Input side), which has the biggest impact on reaching equilibrum, monetary
value of the project, and the time needed for payoff (Mid side, or connection attribute
group) which if interpreted in a manner more suited to sustainability, will get us closer to
the sustainable economical value, and market criteria system, balancing of market
instruments and provisions (Output side), which needs proper and balanced planning, for
the imbalances it causes may lead to a failed project.

31
3.6. NEW AND NOVEL SCIENTIFIC RESULTS
During the analysis of the sources, and the completed methodical analyses, I will introduce
the results in two groups. Mn (New scientific conclusions) for the scientific results which can later
be introduced as theses after further research or proper expansion of the analysed data, and Tn (New
scientific results) for the ones that can be defined as scientific theses in the current research.
3.6.1. New scientific conclusions
M1: The connection systems of project specifics which have an impact on the „shelf-life”
and sustainability of enviro-orientated investments, or investments that have a positive impact on
climate change can be defined through Rubik’s Cube’s „Layer by layer” solution method, and the
Game Theory models assigned to the various phases of the method.
M2: The actual use of – including the designation of correct points of equilibrum for – Game
Theory models for sustainable modeling of economical events often becomes harder, due to the
many criteria which come into play. During the search for sustainable points of equilibrum with
Game Theory models, the simple function-like definition of the connection systems of compared
attributes, and the level-by-level handling of said connection systems based on simple planning
phases makes realisation easier and more sufficient.
M3: I used multi-variable trial functions for the selection of attribute groups which can be
defined as „having a negative impact on equilibrum of sustainable project planning and realisation”.
In the various phases of project development – using process of dominance and usefulness-
functions – helps correct this, and lead the project’s successful realisation towards the proper
process.
M4: According to my hypotheses, low-carbon project development or planning processes
can be called paralel with the layer by layer solution method of Rubik’s Cube. By assigning the
various sides and colors to project attributes, we can realise a special and sustainable project
development process, where the specifics of development and the process is achieved through the
fact that the various attributes or attribute groups can be regarded as either one, two or three-
dimensional system elements in the development programs. The same guiding theory is followed by
low-carbon development and the solution system of Rubik’s Cube, which strives to reach the point
of equilibrum through logic, and low energy input.
3.6.2. New scientific results
T1: My comparison assessments verified that the various sustainability logics can be
synchronised with the 3×3×3 Rubik’s Cube’s solution algorithms, where the relations of the cube’s
sides define a planning strategy that provides a new scientific approach for investment planning.
The first two solution algorithms out of the seven correlate with the Input factors of the investment
planning process, the third and fourth describe the connection system of the starting and the
finishing phases, while the remaining three can be associated with the attributes of the Output side.
T2: My analyses verified that the state of equilibrum for the Input side of the project
development process, which also guarantees sustainability, can also be defined using a simple
constant sum game, or non-cooperative game of finite kind. The connection systems, and the
relative points of equilibrum of the Input and Outpus sides can also be described with conflict
alleviation method, zero sum game, or oligopolistic game of finite kind. The point of equilibrum for
the Output side of the development process can also be described with cooperative oligopolistic
game, or cooperative strategies for Nash equilibrum.

32
T3: I verified with different calculations that the cornercubes of the 3×3×3 Rubik’s Cube
have a key role in the search process for point of equilibrum, or sustainability optimum. Their
rotation combination, based on synchronising three attributes may offer investment programs a
perfect Nash equilibrum. Without setting this, there’s no final balance between the Input and Output
sides, and the flexibility of the system is greatly lowered, since it didn’t adapt the criteria which
mean the ability of adapting to the possible changes in system attributes, and the relative elongation
of „shelf-life”.
T4: One of the most valuable characteristics of the sustainability evaluation using the 3×3×3
Rubik’s Cube is that it can handle the connection system and various usefulnesses assigned to the
attributes defining the evaluation, simultaneously with all the other defining attributes (which are
assigned to the remaining sides of the cube). It can define both the two-dimensional (x,y) and three-
dimensional (x,y,z) connections, and can identify the attributes which have an impact on the various
factors using the order of rotation. We can associate dual-colored outer cubes with 2D attributes,
and tri-colored cornercubes with 3D interpretations, meaning it can also handle attributes which
simultaneously belong to two, or three main agents.
T5: I also showed that the process of sustainable business planning can be defined with
Game Theory models aptly, which model a sustainable project development process for the layer by
layer solution method algorithms of Rubik’s Cube. My examinations verified that a project
development process can be considered sustainable, if the following criteria are met:
A. The existence of a technologically sufficient planning option (to avoid over-planning and
obsoletion)
B. Optimalisation of liquidity and financial sustainability is met (safe self-suffieience and
revenue for at least 10 years)
C. Avoiding detrimental project effects on the relevant product areas (functionally self-
sufficient system).

33
4. Conclusions and Suggestions
As it became obvious from the process of cited literature, we can find very different
approaches on interpretations on sustainability in economics. It is therefore a basic dilemma when
defining sustainability systems/strategies, if we should employ the theoretical connections of either
weak or strong sustainability for the various interpretations. The difference between weak and
strong sustainability is basically defined by the relations between environmental and artificial funds.
The theory of weak sustainability states that environmental and artificial funds can replace each
other. However, the relatively new index of total economic value (TEV) – which is an up-to-date
economic adaptation which includes environmental value as well – still can’t properly handle the
resource transformation questions on the time-value of money. This question was sufficiently
answered by the sustainable economic value (abbreviated as SEV), which is an estimation method
that can – with the inclusion and goal-oriented use of local information – portray the changes in
both environmental, social and technological fund-elements in an integrated manner, which is only
partially realised by total economic value. Said total economic value (abbreviated as TEV) supports
one of the newer economic branches, the so-called system of „low-carbon economy”.
The gist of the low-carbon economy concept is that it prefers structures which operate with
low energy- and matter input on the level of the local economy or market, therefore wiewing the
criterir for long-term proper handling of resources as assured. Therefore, we can rightfully rely on
the priority system of low carbon economy during the interpretation of criteria connected to
sustainability, which is a concept aiming for equilibrum defined with what we can call the currently
most advanced approach. Obviously, the sustainability interpretations search for solutions on the
usage of resources, realisable concepts and actual models, the use of which will result in
equilibrum. We may therefore think that to model sustainability in the future, the only sufficient
scientific approaches are the ones that can offer well-defined and clear-cut solutions.
Main conclusions of process of cited literature:
- The economic interpretation of sustainability still has many inherent troubles, which take its
imaging far from the level of operative realisation. Today, the sustainability criteria and
economic criteria can most definetly be caught in the professional guides on low-carbon
economy, which are considered acceptable enviro- or climate strategy guides by both political
decision-makers and market participants.
- The question of handling and sustainable use of resources opened new possibilities on the
front of economic equilibrum search in the last few years, one of which was the highly
interesting and amusing solution of using Game Theory methods. Despite the many
disappointments and losses of trust Game Theory strategy models suffered in terms of
economical decisions, we can say that the new theoretical approaches, new ways on finding
the proper Nash equilibrum, and the use of simplified models is a reassuring occurence
coming from the field of mathematic modeling.
- During the process of cited literature, I alredy mentioned the new low-carbon software
development approach, which can mean a new recycling method for old and out-of-date
software. We can satisfy new consumer needs with our software applications with this
solution, while using much less input of materials and effort, which means re-entering the
market with our „dead” product. The secret of this software-regeneration is using the layer by
layer, meaning row by row solution method of Rubik’s Cube as a base, which imitates the
solution of the 3×3×3 Rubik’s Cube, thereby „knocking” the development process into the
proper state of equilibrum through a multitude of short interactions, which also correlates with
the new consumer needs.

34
Main conclusions of my personal research:
- The sustainability criteria and the classic „layer by layer” solution method of Rubik’s Cube
can be synchronised with each other. The analysis of connections between the basic build, the
sustainability interpretation, and the solution algorithms of Rubik’s Cube verify that the
process leading to the cube’s configurational balance is a process of search for equilibrum,
which in our case is also applicable to model the equilibrum search of enviro-defense
processes.
- My analyses on Game Theory strategy models show that in today’s practice, we can find a
multitude of economic strategy models that don’t really work as intended. The reason for this
is basically the over-complication of the models, and the inclusion of the many-many factors,
and criteria. In order to save the process of modeling and the actual mechanisms of the models
from falling into the category of „too complicated, no thanks”, we require a simplified, and
yet correctly working model that is easily interpretable, properly loadable with different data,
and easily correctable. My three-level, usable with Game Theory models „unorthodox Game
Theory optimum search” model offers a solution for this challenge.
- During the analysation of the Game Theory models, and the strategic optimum search
systems, I made the conclusion that it’s more beneficial to use smaller, individual and unique
Game Theory solutions which have different reactions in a business environment to describe
the process of equilibrum search, instead of using complex multi-factor model-structures to
functionate the entire process. In case of development processes for renewable energy
production, in other words, advancement from fossilized to renewable energy sources, by
dividing the development program to three levels, then using non-cooperative Game Theory
method for the first, constant or zero sum game for the second, and finally, to define output
criteria, cooperative Nash-equilibrum search with multi-player oligopolistic game for the
third offers a more beneficial result.
The unorthodox Game Theory method I described suggests – during the phase of actual use – that
we use function characteristics which are flexible time-wise for the various levels (input, mid
cube/connection, and output), therefore, it may prove applicable to model more complicated
processes, if we form an optimum search process by a consecutive use of many simple Game
Theory models. These methods/games can also be changed, and flexibly adapted to different
economic criteria systems, according to the changes in business environment.
CITED SOURCES:
CIE (2012-2014) Cleantech Incubation Europe program, Documents for downloads.
http://cleantechincubation.eu/downloads
LAUNONEN, M. (2011) Hubconcepts - The Global Best Practice for Managing Innovation
Ecosystems and Hubs, Hiilikatu 3, 00180 Helsinki,Finland www.hubeconcept.com pp. 5-25
LIGETI, Gy. (2006) Sztereotípiák és előítéletek. Társadalmi Riport/2006 pp. 382-399
http://www.tarsadalomkutatas.hu/kkk.php?TPUBL-A-717/publikaciok/tpubl_a_717.pdf
LCE LTD. (2011) About a Low-carbon Economy. http://www.lowcarboneconomy.com/ LCE/ pp. 3-5
KÉRDŐ, A. (2008) A tartalomelemzés elmélete és gyakorlata. BGF Budapest, 2008
http://elib.kkf.hu/edip/D_13763.pdf p. 7-10
RUSSELL, S. – NORVIN, P. (2003) Artificial intelligence. A modern approach. 2nd Edition. 2003,
1995 Pearson Education, MEA, 2005 pp. 11.6 http://project.mit.bme.hu/mi_almanach/books/aima/index
RUBIK, E. (szerk.) (1981) A bűvös kocka. Műszaki Kiadó, Budapest, 1981 pp. 2-22

35
5. Publications relevant to the present topic
SCIENTIFIC BOOKS (ENG/HUN)
(14 pcs)
1. Fogarassy, Cs. - Neubauer, E. (2014) Water value and water resource evaluation in Hungary.
In: Ugrósdy, G. - Molnár, J. - Szűcs, I. (Edited by) The Evaluation of Natural Resources.
Agroinform Publising and Printing Ltd., Budapest, 2014 pp. 103-127
2. Fogarassy, C. (2012) Karbongazdaság (low-carbon economy). Monográfia. L’Harmattan
Kiadó, Budapest, 2012, ISBN: 978-963-236-541-1 pp. 1-262
3. Tóth, L. – Fogarassy, C. (2012) Low-carbon energiaellátási rendszerek a gyakorlatban. A
megújuló energiatermelés technológiái Magyarországon. Szaktudás Kiadó Ház Zrt., Budapest,
2012 ISBN: 978-615-5224-37-9 pp. 1-156.
4. Fogarassy, C. – Neubauer, E. (2011) Vízgazdaságtan, avagy a vízlábnyom mérése és gazdasági
összefüggései, In.: Sebezhetőség és adaptáció, Bp. MTA Szociológiai Intézet, 2011, p. 215-237
5. Fogarassy, C. – Slihte, S. – Böröcz, Bakos, M. (2011) Heat pump practice and future
opportunities in Europe. Szűcs, I. – Zsarnóczai, J. S. (Edited by) In: Economics of sustainable
agriculture. Szent István University Publishing, Gödöllő, 2011 pp. 44-55 HU ISSN 2062-445x
6. Fogarassy, C. Lukács, A. (2009) Karbongazdaságtan. OBEKK Tudományos Közlemények -
Szent István Egyetemi Kiadó, Gödöllő, 2009, ISBN 978-963-269-140-4
http://www.rgvi.gtk.szie.hu/upload_files/KarbongazdasagtanFogarassy.pdf
7. Fogarassy C. (2009) Az emisszió-kereskedelem hatása a biomassza alapú alternatív energetikai
projektek finanszírozására. OBEKK Tudományos Kiadványok Sorozat, Szent István Egyetemi
Kiadó, Gödöllő, 2009 (1/12) ISBN 978-963-269-147-3
8. Fogarassy C. (2009) Az alternatív energetikai projektek fejlesztéséhez kapcsolódó emisszió-
csökkentés elszámolásának lehetőségei és feltételei a projektfinanszírozásban. OBEKK
Tudományos Kiadványok Sorozat, Szent István Egyetemi Kiadó, Gödöllő, 2009 (2/12) ISBN
978-963-269-148-0
9. Fogarassy C. (2009) Fenntartható pénzügyi modellek és pénzpiaci termékek az alternatív
energiatermelés és fogyasztás ösztönzésére. OBEKK Tudományos Kiadványok Sorozat, Szent
István Egyetemi Kiadó, Gödöllő, 2009 (3/12) ISBN 978-963-269-149-7
10. Farkas, F. M. - Fogarassy, C. – Szucs, I. (2008) Allowance for external effects in efficiency
calculations. In: Edited by Szucs. I. –Fekete. F. M. - Efficiency in the agriculture (Theory in
practice) Agroinform Publisher, Budapest, 2008 p. 114-122 ISBN 978-963-502-899-3
11. Farkasné Fekete, M. - Fogarassy C. – Szűcs, I. (2008) Az externális hatások figyelembevétele a
hatékonysági számításoknál. In: Szűcs István - Farkasné Fekete Mária (szerk.) Hatékonyság a
mezőgazdaságban: elmélet és gyakorlat. Budapest: Agroinform Kiadó, 2008. pp. 114-122.
ISBN:978-963-502-889-4
12. Kerekes, S. – Fogarassy, C. (2007) Bevezetés a Környezetgazdaságtanba. SZIE GTK HEM
Távoktatási Tankönyv, Szent István Egyetemi Kiadó, Gödöllő, 2007 ISBN 978 963 9483 76 7
13. Kerekes, S. - Fogarassy, C. (2006) Környezetgazdálkodás, fenntartható fejlődés. HEFOP - DE
ATC AVK Tankönyv, Debrecen, 2006
http://users3.ml.mindenkilapja.hu/users/rgkmsc/uploads/Kornygazd-pro-1.pdf
14. Fogarassy, C. (2001) Energianövények a szántóföldön. Tudományos Szakkönyv. Szent István
Egyetem Európai Tanulmányok Központja, Gödöllő, 2001 ISBN 963 9256471 pp. 1-144
SCIENTIFIC JOURNAL (ENG)
(8 pcs)
1. Fogarassy, C. – Herczeg, B. – Szőke, L. – Balogh, K. (2012) Low-carbon project development
protocol (Rubik’s cube solutions) – sustainable energy and material management. In: Hungarian
Agricultural Engineering (HAE) № 24/2012 Gödöllő, 2012 p. 5-12
2. Fogarassy, C. – Lukacs, A. – Ferge, G. (2009) Sustainable Bussines – Green Banking and
Carbon Crediting. In: Delhi Business Review – An International Journal of Society for Human
Transformation & Research. Vol. 10, No.2, July-December, 2009 p. 99-102. IF: 3,0

36
3. Lukács, A. - Fogarassy, C. – Borocz, M. (2009) Carbon management in the agricultural
production and consumption: Foodstuff production vs. nonfood agricultural production
utilisation. In: Delhi Business Review – An International Journal of Society for Human
Transformation & Research. Vol. 10, No.2, July-December, 2009 p. 105. IF: 3,0
4. Gemesi, Zs. – Fogarassy, C. – Lukacs, A. – Hollo, G. (2009) Pyrolytic char in climate
mitigation and soil improvement: possible technical and economical scenarios to utilise biomass
in Hungary, In: Hungarian Agricultural Engineering (HAE) № 22/2009 Gödöllő, 2009 p.
5. Kovacs, A. - Borocz, M. – Fogarassy, C. – Halasz, R. (2009) Biogas production possibilities
and technological background (manure management) in the Hungarian animal husbandry. In:
Hungarian Agricultural Engineering (HAE) № 22/2009 Gödöllő, 2009 p.
6. Fogarassy, C. – Lukacs, A. – Gemesi, Zs. (2009) Professional and training needs in the area of
hybrid power system - Alternative energy conditions overview in Hungary to identify the
vocational training priorities and information content levels, In: Hungarian Agricultural
Engineering (HAE) № 22/2009 Gödöllő, 2009 p.
7. Tóth, K. – Bárczi, J. – Fogarassy, C. (2005): The role of extension in the technical
improvement of agricultural enterprises In: Hungarian Agricultural Engineering Gödöllő, №
18/2005 p. 61-63.
8. Fogarassy, C. (2001) Rationalisation of production structure of plow-land energy crops in
Hungary. Die Bodenkultur - Austrian Journal of Agricultural Research. 52. Band/Heft 3/ p. 225-
231. IF: 1,5
SCIENTIFIC JOURNAL (HUN)
(5 pcs)
1. Fogarassy, C. - Neubauer, E. (2013) Vízérték és vízvagyon értékelés. Journal of Central
European Green Innovation 1 (1) pp. 53-69 (2013)
http://greeneconomy.karolyrobert.hu/sites/greeneconomy.foiskola.krf/files/upload/Fogarassy-
Neubauer.pdf
2. Fogarassy, C. (2012) « low-carbon » rubik kockás projektfejlesztési módszer az energia- és
anyaghatékonyságot javító projektekben. Mezőgazdasági Technika, Budapest ser. 2012/Climate-
KIC low-carbon különszám, Budapest 2012/2013 p. 5-26
3. Böröcz, M. - Fogarassy, C. (2011) A hazai húsmarha tartás környezeti értékelése és
externáliáinak vizsgálata benchmarking módszerrel. Budapest, Gazdálkodás 55. évfolyam 2.
szám p. 181-186.
4. Fogarassy, C. – Lukács, Á. (2010) Magyarországi alternatív energetikai adottságok áttekintése
a képzési prioritások és tartalmi szintek meghatározásához. Mezőgazdasági Technika, Budapest
ser. 2010/02 p. m.a HU ISSN 0026 1890
5. Grónás V. - Fogarassy, C. (2001) Védett területek mezőgazdasági földterület hasznosításának
értékelése térinformatikai eszközökkel. Fölrajzi értesítő.2001/I/3. p 235-245.
SCIENTIFIC CONFERENCE (ENG)
(4 pcs)
1. Fogarassy, C. (2011) Rubik’s Cube low-carbon project development protocol - energy and
material saving innovation process. Global Management Conference: Globalisation,
Sustainability and Development. 4-7 May 2011, Gödöllő, 2011
2. Fogarassy, C. – Neubauer, E. (2011) Regional distribution of the wheat production with water
footprint relevancies. Development Prospects of rural areas lagging behind int he CEE Region –
Visegrad Fund Conference 2011 - 24-27 May, Gödöllő, 2011
3. Fogarassy, C. – Lukacs, A. (2011) Rubic Cube based theoretical model - Rubik’s Cube low-
carbon project development protocol - energy and material saving innovation process. Climate-
KIC Innovation Festival /Scientific Exhibition/, Budapest, Hungary, 28-29 szeptember, 2011
4. Fogarassy, C. (2011) Externalities in the agriculture - commodity and non-commodity outputs
in the local food providing systems. Development Prospect of Rural Areas Lagging behind in
the CEE Region, Visegrad Found Conference, Plenary Section 24-27 May, Gödöllő, 2011