the internet backbone and the american metropolis … · the internet backbone and the american...
TRANSCRIPT

The Information Society 1635ndash47 2000Copyright cdeg 2000 Taylor amp Francis0197-224300 $1200 + 00
The Internet Backbone and the American Metropolis
Mitchell L MossTaub Urban Research Center Robert F Wagner Graduate School of Public Service New YorkUniversity New York New York USA
Anthony M TownsendDepartment of Urban Studies and Planning Massachusetts Institute of Technology CambridgeMassachusetts USA
Despite the rapid growth of advanced telecommunications ser-vices there is a lack of knowledge about the geographic diffu-sion of these new technologies The Internet presents an impor-tant challenge to communications researchers as it threatens torede ne the production and delivery of vital services including -nance retailing and education This article seeks to address thegap in the current literature by analyzing the development of In-ternet backbone networks in the United States between 1997 and1999 We focus upon the intermetropolitan links that have pro-vided transcontinental data transport services since the demiseof the federally subsidized networks deployed in the 1970s and1980s We nd that a select group of seven highly interconnectedmetropolitan areas consistently dominated the geography of na-tional data networks despite massive investment in this infra-structure over the study period Furthermore while prosperousand internationally oriented American cities lead the nation inadopting and deploying Internet technologies interior regions andeconomically distressed cities have failed to keep up As informa-tion-based industries and services account for an increasing shareof economic activity this evidence suggests that the Internet mayaggravatethe economicdisparitiesamongregionsratherthan levelthem Although the capacity of the backbone system has slowlydiffused throughout the metropolitansystem the geographicstruc-ture of interconnecting links has changed little Finally the contin-ued persistence of the metropolis as the center for telecommunica-
Received 20 September 1998 accepted 20 September 1999This researchwas generouslysupportedby National Science Foun-
dation award 9817778 ldquoInformation Technology and the Future ofUrban Environmentsrdquo
Address correspondence to Anthony M Townsend Department ofUrban Studies and Planning Massachusetts Institute of TechnologyRoom 7-337 77 MassachusettsAvenue Cambridge MA 02139 USAE-mail amtmitedu
tions networks illustrates the need for a more sophisticated under-standing of the interaction between societies and technologicalinnovations
Keywords cities Internet backbone metropolitan areas technologydiffusion
CITIES AND TELECOMMUNICATIONS
Telecommunications technology has had a powerful in- uence on the organization of urban space since SamuelMorse rst demonstrated the telegraph in 1844 sendinga message from Baltimore to Washington By providingan alternative to the physical movement of messages thetelegraph and later the telephone permitted the central-ization of corporate headquarters in the central businessdistricts of cities as well as the decentralization of manu-facturing and distribution activities (Gottman 1977) Byincreasing locational and organizational exibility withinregions communications technologies have also extendedthe functional geographicde nition of a city to encompasslarge-scale metropolitan areas a trend rst noted by Lynch(1960) nearly four decades ago
Major cities are points of intense investment in tele-communications technology because the production ex-change and dissemination of information arecritical to thefunction and purpose of the modern metropolis As Abler(1970) notes ldquo[C]ities are communications systems functionally identical to intercommunications media likethe telephone and postal systemsrdquo As the function ofcentral cities has quickly shifted from goods-handling toservice- and information-based industries major urbancenters have emerged as key participants in the network of
35
36 M L MOSS AND A M TOWNSEND
data nodes and ows that mediate the transactions of anintegrated global economy For Hall (1997) the rapidand massive ow of information through urban areas isone of the de ning characteristics of the ldquopostindustrialcityrdquo
The Internet represents the most fundamental advancein the distribution and exchange of information since thetelephone As the capacity of the Internet has rapidly in-creased during the 1990s each of the traditional media1
has been subsumed into this new technological frame-work This versatility for conveying such a broad range ofcontent has contributed to its immense popularity Mul-timedia online news services integrate traditional printedmedia with videoandaudio broadcast as well as interactivefeatures and survey data indicate that television news out-lets are rapidly losing viewers particularly young ones toInternet news sources (Pew Research Center 1997) Inter-net telephony threatens the effectiveness of internationaltelephone tariffs by passing digitized voice traf c overunregulated data networks While this technology oncerequired a personal computer and expensive hardware ac-cess codes are now readily available that route standardvoice calls across the Internet from any telephone Thisinnovation is driving an unregulated industry that is ex-pected to reach nearly $2 billion in revenues worldwideby 2001 (de Repentigny amp Khanna 1997) As a FederalCommunications Commission report observes ldquoThe In-ternet potential proposes a threat for every provider of tele-phony broadcasting and data communications servicesrdquo(Werbach 1997)
Clearly these new technologies will in uence the formfunction and evolution of cities and metropolitan areasas they are woven into the urban fabric Yet the urbanplanning profession has remained blissfully ignorant ofboth the negative implications and the potential bene ts ofnew telecommunications technologies In fact comparedto the effort devoted to the study of transportation systemsor housing markets the eld of telecommunications hasnot been a subject of interest to urban planners (Grahamamp Marvin 1996)
How can the Internet affect the future of cities andmetropolitan areas Two major explanations of the geo-graphic consequences of telecommunications technologyon cities can be found in the recent literature The rstwhich has grown out of the urban studies community ar-gues that telecommunications have facilitated the central-ization of corporate headquarters in a handful of globalcities such as Tokyo New York and London On theother hand a growing number of voices from other eldshold that telecommunications technologies will cause thecentrifugal scattering of human settlements and wholesaleurban dissolution
Friedmann and Wolff (1982) were the rst to systemat-ically articulate the concept of ldquoglobalrdquo or ldquoworldrdquo cities
and lay out a long-term research agenda At the core oftheir argument was the observation that for a small groupof special cities it had become impossible to disentangleor understand their internal dynamics without consideringthe much broader processes of global economic restruc-turing Advances in information and telecommunicationstechnology are universally identi ed as a crucial factor inthe process of globalization and world city developmentproviding themeans for corporate control andcoordinationof far- ungproductionnetworksand increasingly complexbusiness transactions (Sassen 1995)
In opposition to the global cities concept a long tra-dition of antiurban utopian thought has been resurrectedarguing that the rapidly declining cost andexpandingcapa-bility of telecommunications eliminates the need for theface-to-face interactions that are the lifeblood of citiesThis view has gained widespread acceptance in academicpolitical and media discourse due to its direct appeal to along tradition of American antiurbanism and its usefulnessin marketing a wide variety of communications productsand services
In the1960s as the powerof television delivered graphicimages of urban riots into newly built suburbanhomes me-dia scholar Marshall McLuhan ldquorepeatedly announced theobsolescence of the built city in the electronically me-diated futurerdquo (Campanella 1998) In the early 1980sTof er (1980) described a future in which the telemedi-ation of social and economic activities by the ldquoelectroniccottagerdquo the advanced home of the future would usher ina radical decentralization of population and production Anew generation of voices has reintroduced this languageof urban dissolution with the Internet replacing televisionas the technological determinant Futurist George Gilder(1996)announces that cities are ldquoleftover baggagefrom theindustrial erardquo while Negroponte (1995) authoritativelystates that ldquothe post-information age will remove the limi-tations of geography and the transmission of place itselfwill start to become possiblerdquo Most recently Cairncross(1997) resurrected Tof errsquos ldquoelectronic cottagerdquo forecast-ing a drop in crime and revitalization of suburban com-munities as homes reemerge as the center of economicactivity
Both of these views are overly simplistic The urbandissolution viewpoint is the most awed as it is overlydeterministic attributing inevitable consequences to tech-nology that has yet to be adapted discarded regulatedor subjected to the dozens of social decision-making pro-cesses that will ultimately shape its role in society As aresult ldquoTechnological determinism has dominated debateon the social and economic impact of new telecommuni-cations technologiesrdquo (Thrift 1996) On the other handwhile the global cities framework sees the geographicdistribution of telecommunications technology largely asa consequence of corporate decisions it does not leave
THE INTERNET BACKBONE AND THE AMERICAN METROPOLIS 37
room to account for the uniquecharacteristics of individualtechnologies instead seeing all as subservient to socioeco-nomic forces The economics of communications systemsbased on packet switching (like the Internet) are clearly aresult of their technical design and as Shapiro (1999) ar-gues the cost structure of these technologies now offersindividuals an unprecedented control over their own lives
On the urban question however Hall (1997) offers amiddle ground suggesting that ldquochanges in political eco-nomic and technologicalrdquo frameworksmight dramaticallyaffect the selection and location of global cities This ar-ticle argues that the rapid growth of the Internet in thesecond half of the 1990s is an example of just such achange in technological framework However althoughInternet technologies do represent a fundamentally newtype of communications technology rather than dictate anentirely new spatial pattern these technologies have andwill continue to evolve within and transform the existingnetwork of metropolitan areas in the United States
THE GEOGRAPHY OF THE INTERNET
The geographicdiffusion of recent innovations in telecom-munications and the Internet in particular has eludedsystematic analysis from the urban planning communityThere is a growing recognition of this lack of knowl-edge yet while geographers have been more responsiveto the challenges of cyberspace to understanding spacendashtime relationships ldquoThere is still an unfortunate dearthof research on the geography of telecommunications andits attendant implications for urban and regional develop-mentrdquo (Hepworth 1989) Furthermore sociologists suchas Castells (1996) speak of a ldquonew spatial process thespace of ows that is becoming the dominant spatial man-ifestation of power and function in our societiesrdquo yet offerevidence lacking in scope and depth
One might suspect that this oversight is due to a lackof exploration of these issues yet the record indicates arich history of research in this area during earlier eras oftransformation Several important studies have describedthe magnitude and character of intermetropolitan infor-mation exchanges among various mediamdashtelephone mes-sages overnight delivery parcels and air transportationGottman (1961) analyzed daily telephone calling patternsin the sprawling BostonndashWashington metropolis whileAbler (1970) expanded this technique to the entire UnitedStates Predrsquos (1973) work systematically examined the ow of information among cities in colonial Americaand was creative in its use of measures such as the diffu-sion of foreign news the structure of postal systems andthe speed of interurban travel However because ows ofinformation across the Internet are now extremely sensi-tive proprietary information the few studies of this natureare now hopelessly outdated (see GVU 1995) While new
techniques for active geographic measurement of the In-ternet such as Murnionrsquos (1998) analysis of network delaysare slowly emerging measures of Internet activity of in-terest beyond the computer science community are rareinconsistent and often lack a geographical component
So how can we study the geography of the Internetand more speci cally variations in diffusion rates amongcities and metropolitan areas In the United States es-pecially where the telecommunications industry is highlycompetitive the empirical study of Internet geographyhasprovennearly impossible The bulk of useful data has beenpublished by a variety of trade magazines and nonpro torganizations in scattered locations and often with ques-tionable accuracy This section reviews two measures thatare currently in use
The most widely used geographic measurement of In-ternet activity is the number of hosts or computers con-nected to the Internet Matrix Information and Demogra-phy Services (MIDS) of Austin TX is the primary sourceof these data However there are fundamental concep-tual problems with using this type of measurement forresearch As Orlikowski (1999) reminds us the analysisof technology is better served when it focuses upon the ldquoin-userdquo properties of technology rather than the ldquoespousedrdquofunctions built into it by designers Host computers havebeen adapted for a multitude of purposes and at so manydifferent scales as to render these measures almost mean-ingless However despite its aws because these datahave been collected for many years and appear fairly com-plete they are the best available archive of information onthe geographical diffusion of the Internet since the early1990s We utilized this data set in the past in our rst lookat geographic patterns of Internet activity in the UnitedStates (Moss amp Townsend 1996) but rapidly abandonedit in favor of more meaningful measures
Using a different approach to coax geographical infor-mation out of the technical systems that permit the Inter-netrsquos addressing schemes to function Imperative of Pitts-burgh PA and the defunct Internet Info of Falls ChurchVA have tracked the growth of the Internet based onthe number of domain names registered by geographicarea The domain name is a form of Internet addressingthat maps groups of numeric Internet addresses to intu-itive names like nyuedu or attcom We nd this tech-nique vastly superior as the domain name represents asocial constructmdasha rm government agency educationalinstitution or nonpro t organizationmdashrather than a tech-nological one (Moss amp Townsend 1997) This measurehas produced a remarkably similar and consistent set ofresults across independently collected data sets (Kolko1998 Zook 1998 Moss amp Townsend 1998) While thereare several shortcomings to this measure these ndingswere within reasonable expectations based on the analysisof contemporary ldquocyberregionsrdquo (Saxenian 1994 Nunn
38 M L MOSS AND A M TOWNSEND
amp Warren 1997 Joint Venture Silicon Valley Network1998)
Finally while it is not feasible to obtain data on the ow of information between cities or points on nationaldata networks the geographic structure and capacity ofbackbone networks offer a third aspect of the developingInternet that can be measured relatively easily More in-terestingly if we consider that these networks are beingbuilt in a fairly well-functioning competitive market theirgeography can be used as an indicator of new communi-cations relationships emerging among regions as a resultof the Internet that could not detected by conventionalmethods
The only primary source of information on the ge-ography of Internet backbone networks at the time ofthis study was Boardwatch Magazinersquos Internet ServiceProviders Quarterly Directory (1997 1999) This publi-cation includes corporate pro les and network maps in-dicating intermetropolitan links and capacity for approxi-mately two dozen major national data networks This workhas been an important resource to us as a source of dataand well-written analysis of the technical underpinningsof the modern Internet The Cooperative Association forInternet Data Analysis (CAIDA) has published similardata and has developed tools such as MapNet2 whichpermit a computerized visualization of network geogra-phy (Claffy amp Huffaker) However CAIDA has not keptits network data as current as has Boardwatch as its goal isto develop visualization tools for improved network man-agement rather than to accurately and comprehensivelymap the geographic diffusion of Internet networks Themaps compiled by Boardwatch are useful as a base pointfor data on backbone networks Unfortunately their re-liability is based upon network operatorsrsquo willingness todivulge accurate and timely information Thus while thedata used are not suitable for making ne distinctions thelarge number of networks and the sheer magnitude of over-all trends mitigate these irregularities Ongoing efforts todevelop more accurate time-sensitive independent data-gathering tools on Internet backbone networks should im-prove these barriers to research in the future (Townsendet al 1999)
This study explores the geographic structure of back-bone networks The backbone network can be seen asa market response to localized demand for long-distancedata transport services The next section discusses thismeasure and the following section presents the ndingsof our analysis
INTERNET BACKBONE NETWORKSmdashTHE NEWURBAN INFRASTRUCTURE
In the past economic transformations have been accom-panied by the development of new infrastructure networks
that enable the ow of goods throughout the nation In theearly 19th century rivers and canals formed the backboneof the economic infrastructure permitting the raw com-modities of the hinterlands to be transported to the cityfor manufacture shipment or resale Industrialization de- ned the need for reliable rapid transportation of vastlymore goods and people among the rapidly growing urbancenters spurring the construction of the railway networkLater as the federal government sought to decentralizepopulation and productive capacity during the nuclear erasuburban development and the Interstate Highway Systemaccompanied each other into the countryside
The Internet backbone system represents a new urbaninfrastructure designed to transport the valuable goods ofthe digital economymdashinformation knowledge and com-municationsmdashfrom production sites to markets Howeverin contrast to the urban dissolution view discussed previ-ously new technologies do not necessarily dictate theirown spatial manifestation Just as the geographic struc-ture of these earlier infrastructure networks both re ectedand in uenced existing and desired settlement patterns thegeography of the backbone system has in part been shapedby the economic and social realities of late 20th-centuryAmerica and the speci c properties of the technology
The Internet is particularly interesting when consideredthis way as it has evolved through three distinct periodsduring which a different policy framework governed itsgeographicdiffusion Like the Interstate Highway Systemthe Internet originated from the concerns of defense plan-ners about the vulnerability of the nationrsquos infrastructuresystems in this case the communications gridResearchersat RAND the defense think tank wrote a series of in u-ential papers in the early 1960s that touted the merits ofdistributed networks which have many redundant path-ways for the delivery of messages versus decentralizedand centralized networks which have aggregating nodesthat are vulnerable to attack (Baran 1964) (Figure 1)
However as control of the evolving network passedfrom the Defense Department to the National ScienceFoundation (NSF) and nally to the private sector in 1994centralization of network infrastructure at regional nodesbecome increasingly necessary The rapid growth of thenetwork and dif culties in scaling the distributed structureled the NSF to establish a multitiered service model whichaggregated networks at regional levels and connected theregions with an interlinking superstructure dubbed theldquobackbonerdquo As a result by 1989 the Internet was moredecentralized than distributed (Figure 2)
While NSFNet began to stray from RANDrsquos ideal dis-tributed model toward a more decentralized structure geo-graphically it was still highly dispersed and uniformly soRegional networks sponsored by universities andnonpro torganizations linked nearly every state to the network witha similar level of service Additionally NSFNet connected
THE INTERNET BACKBONE AND THE AMERICAN METROPOLIS 39
FIG 1 Network topologies From Baran (1964)
13 sites to its backbone all at the same level of capacityOn the contrary the commercial Internet backbone systemis highly selective concentrating the bulk of capacity andconnections in a handful of metropolitan areas In manyways the present structure of the Internet backbone haslargely erased the decentralizing objectives of earlier net-works
The data presented in this article indicate that sevenmetropolitan areas dominate the structure of links andnodes of the backbone system in the United States De-spite the potential for the decentralization of economicactivity made possible by new technologies deploymentof backbone networks is concentrated in a group of largemetropolitan areas for a variety of historical economicand geographical reasons This article measures the ag-gregate capacity of the national backbone networks thatmake up approximately 95 of the wholesale Internet ac-cess market Using maps and data from Boardwatch Mag-azinersquos Quarterly Directory of Internet Service Providerswe compiled a list of every unique linkage between metro-
politan areas for each of the networks This list was thenaggregated by metropolitan area There were 29 networksidenti ed by Boardwatch as operating at a national scalein the summer of 1997 and 39 in the spring of 1999
Internet backbone networks traverse private and pub-lic rights-of-way often alongside highways or railroadlines to connect metropolitan areas across the countryEach network is constructed to serve perceived marketdemand and often contains redundant links between apair of cities and to eliminate bottlenecks bypasses lessimportant intermediate locations Network providers alsoinstall different amounts of capacity or bandwidth to pro-vide an information pipeline suf cient for their customersLike much else on the Internet backbones are often onlyldquovirtualrdquomdashoperated on high-speed data lines leased fromlong-distance or regional telephone companies In manycases the only physical infrastructure actually owned bybackboneproviders is routers the powerful computers thatmanage the ow of data packets at junctions in the network(Rickard 1997)
40 M L MOSS AND A M TOWNSEND
FIG 2 NSFNet backbone and regional research networks 1989 Compiled from individual maps in Quarterman (1989) andSalus (1995) Gbps gigabits per second
Although any one city connected to any of the backbonenetworks is theoretically as accessible as any city on anyother network (because data travels at the speed of lightover ber-optic networks) there is signi cant congestionat network hubs and junctions We focus solely upon thedirect links vendors provide between pairs of cities Inthis way we capture both the geographic and market ad-vantages that bene t particular cities Important pairs ofmetropolitan areas will be joined directly to minimize de-lay of transmission while less important pairs will haveintermediate hubs between them in a location convenientfor the aggregation and switching of other traf c Theseassumptions are derived from the observed structure ofthese networks which indicate the importance of directlinks between key metropolitan areas
The economics of high-speed data networks dictate thatspeed and capacity bottlenecks typically occur in the long-distance intermetropolitan rather than local intrametro-politan backbone links3 For the purposes of this studywe have assumed that backbones terminating in a metro-politan area are equally accessible to all parts of a metro-politan area via local telecommunications infrastructurewhich is typically more robust than that which connects
metropolitan areas to each other4 Based on this assump-tion we aggregated the network data at the metropolitanarea level rather than at the level of individual cities orlocalities5 This allowed us to focus on the largest capacity ber-optic networks constructed of DS-3 (45 megabits persecond [Mbps]) OC-3 (155Mbps) andOC-12(622Mbps)technology6 The smaller capacity DS-1 lines (15 Mbps)which link many smaller cities and outlying areas to theInternet were excluded from this analysis as they are nolonger used as primary transcontinental network links
Several questions arise regarding what an analysis ofbackbone network structure and capacity indicates Weconcede that backbone structure has little effect upon Webbrowsing speed and responsiveness to the average homeuser connected to the Internet via telephone and modemThis type of service is nearly universally available through-out the United States (Greenstein 1998) However thelocation and capacity of backbone networks and particu-larly interconnection points has a powerful effect on theability of rms in any metropolitan area to distribute largeamounts of data and information via the Internet The ro-bustness of the Washington DC metropolitan arearsquos In-ternet infrastructure was well demonstrated after the Starr
THE INTERNET BACKBONE AND THE AMERICAN METROPOLIS 41
Report was released on 11 September 1998 Accordingto one source traf c at the MAE-East exchange pointsurged over 100 Mbps after the document became avail-able through the Library of Congressrsquo website at 2 pm(Dawson 1998)
Finally mergers acquisitions and bankruptcies are re-shaping the national ber backboneindustry and networkscan quickly become obsolete when new technology isdeployed to gain comparative advantage Therefore thisanalysis must be considered within the temporal context ofthe Internetrsquos growthand developmentFor example whileMCI Sprint and ATampT are major providers of long-haulInternet data transport Qwest Inc is currently deployinga ber network that is believed to have a greater capacitythan those three networks combined
In summary this analysis of the capacity of data net-works that connect metropolitan areas provides a frame-work for understanding the communications landscape ofthe American metropolitan system The pattern of linksbetween and among American cities and metropolitan ar-eas establishes a hierarchy of information ows that in- uence development patterns The Internet because of itsversatility and explosive popularity has the potential torede ne this hierarchy more rapidly and fundamentallythan any recent technological development The geogra-phyand topographyofbackbonenetworksare increasinglythe subject of scholarly attention yet we have identi edonly a single published study that analyzes the aggregateintermetropolitan capacity in a similar fashion Maleckiand Gorman (forthcoming) used techniques of networkanalysis to further analyze the signi cance of locationscentrally located within the topological structure of net-works As such this represents an expansion of our tech-nique which does not consider the ldquodistancerdquo of indirectlinkages However their results do not make any effortto explain the concentration of backbone links other thannoting the proximity of these clusters to the continentalcoasts We feel that rooting an analysis of current Internetbackbone infrastructure in historical social and economicframework is necessary to extract meaning from what isultimately a collection of ber-optic cables and packetrouters
THE GEOGRAPHY OF THE INTERNET BACKBONE
Network Capacity
In this section we present the major ndings of our anal-ysis Between 1997 and 1999 the average capacity ofintermetropolitan backbone links grew from 378 Mbpsto 1968 Mbps However despite this vefold explosionin network construction and deployment the number ofmetropolitan areas with a direct link to national backbonesincreased much less rapidly from 72 to 105 Furthermorethe hierarchy of metropolitan areas has changed little dur-
ing this period of rapid growth A core group of sevenmetropolitan areas (San FranciscoSan Jose WashingtonDC Chicago New York Dallas Los Angeles and At-lanta) maintained their dominance as the central nodes ofthe Internet in the United States
Table 1 lists the top 20 metropolitan areas by total ca-pacity of all backbone links to other metropolitan areas infall 1997 and spring 1999 In 1997 the dominance of thetop seven metropolitan areas is clearly distinct from otherregions Los Angeles with the smallest capacity of thiscore group still had two-thirds greater backbone capacitythan Denver the next largest hub Additionally these top20 metropolitan areas contained the bulk of all backbonecapacity with 856 of all capacity in the United Statespassing through them
However backbone infrastructure has spread to aslightly more inclusive group of metropolitan areas overthe study period In 1997 fully 604 of nationwide back-bone capacity originated in these seven regions By 1999these top seven metropolitan areas contained only 415of total national backbone capacity This simple measurehowever obscures the nature of the diffusion which is dueto two trends
First new ultra-high-capacity networks such as AGISand PSINetrsquos 2048-Mbps OC-48 systems have installedseveral additional routing points at intermediate locationson their paths between major metropolitan areas presum-ably in order to capture these marginal but unserved mar-kets For example while one segment of the AGIS OC-48network has intermediate nodes in Mexia TX and BryanTX it is clear that its main purpose is to connectDallas andHouston which are the linkrsquos endpoints This analysis hastried to catch as many circumstances of this type of struc-ture as possible but there is little beyond educated guess-work to determine which nodes actually generate traf c
The second and more important reason that backbonecapacity appears to have diffused is that a whole rangeof centrally located metropolitan areas like St LouisKansas City Indianapolis Houston and Salt Lake Cityhave rapidly grown as hubs for new large network links(Table 2) These metropolitan areas have replaced moreeconomically successful regions such as Seattle DenverPhoenix and Miami as the second tier of backbone hubsbelow the top seven metropolitan areas and have sappedmuch of the growth that might have occurred in the topseven metropolitan areas However these regions have notbeen shown to possess large locally generated levels of de-mand for Internet services based on both the number ofdomain name registrations among businesses and the pen-etration of Internet use among consumers (Zook 1998Inetco 1999) It is therefore likely that these metropolitanareas are also merely waypoints on the important transcon-tinental links
The growth of these secondary hubs illustrates a pro-cess of diffusion of Internet backbone capacity across the
42 M L MOSS AND A M TOWNSEND
TABLE 1Internet backbone capacity by metropolitan area
Fall 1997 Winterspring 1999
Backbone capacity Percent of Backbone capacity Percent ofMetropolitan area (Mbps) national capacity Metropolitan area (Mbps) national capacity
Washington DC 7826 104 Washington DC 28370 72Chicago IL 7663 101 Dallas TX 25343 64San Francisco CA 7506 99 San Francisco CA 25297 64New York NY 6766 89 Atlanta GA 23861 61Dallas TX 5646 75 Chicago IL 23340 59Atlanta GA 5196 69 New York NY 22232 56Los Angeles CA 5056 67 Los Angeles CA 14868 38Denver CO 2901 38 Kansas City MO 13525 34Seattle WA 1972 26 Houston TX 11522 29Phoenix AZ 1890 25 St Louis MO 10342 26Houston TX 1890 25 Salt Lake City UT 9867 25Philadelphia PA 1610 21 Indianapolis IN 9307 24Miami FL 1567 21 Denver CO 8674 22St Louis MO 1350 18 Boston MA 8001 20Boston MA 1325 18 Seattle WA 7288 19Kansas City MO 1080 14 Phoenix AZ 6701 17Cleveland OH 1080 14 Cleveland OH 6201 16Detroit MI 900 12 Columbus OH 5641 14San Diego CA 870 12 Charlotte NC 5191 13Baltimore MD 810 11 Las Vegas NV 4791 12
Rest of United States 10702 142 Rest of United States 123212 313Entire nation 75606 1000 Entire nation 393574 1000
metropolitan system in the United States but also high-lights the need for more sophisticated data Figure 3 showsa comparison of the Internet backbone system in 1997 and1999 indicating the location of the largest links repre-senting 85 of capacity (this limit is to make them morelegible) Clearly the structure of the Internet backbonesystem in the United States is a great deal more concen-trated and organized in 1999 than in 1997 As alluded toearlier many of the secondary hubs such as St LouisKansas City and Salt Lake City appear to be function-ing as hubs for supplementary routes to complement thedirect routes between the top seven metropolitan areasUntil we understand the points between which informa-tion and messages ow along these network links it willbecome increasingly dif cult to decipher the meaning ofthese structures
Network Links
While our measures of network capacity have indeedshown the rapid emergence of a group of secondary cen-tralized hubs the distribution of the number of links across
metropolitan areas (irrespective of capacity) tells a verydifferent story The distribution of network links amongmetropolitan areas has been extremely consistent over thestudy period While the total number of backbone linksin the country doubled from 641 to 1209 over the studyperiod the top seven metropolitan areas were still the end-points of 505 of all links in 1999 declining just slightlyfrom 556 in 1997 Figure 4 shows a rank-size distribu-tion plot for network links showing the number of linksfor each city ranked by total number of links The dis-tribution of links follows a similar exponential curve forboth 1997 and 1999 and the proportion between the topseven metropolitan areas and the rest has remained stableover the study period Thus despite the vefold growthof network capacity over the 18-month study period therehas been no signi cant shift in the geographic structureof network connections among the metropolitan areas Astable hierarchy of network hubs and spokes apparentlyhas emerged
It is still unclear how to compare the importance of ca-pacity versus a diversity of linkages to the value of Internetaccess and use in a particular region On one hand it is
THE INTERNET BACKBONE AND THE AMERICAN METROPOLIS 43
TABLE 2Growth in backbone capacity 1997ndash1999
1997 Capacity 1999 Capacity Growth rateMetropolitan area (Mbps) (Mbps) (relative to nation)
Washington DC 7826 28370 696Dallas TX 5646 25343 862San Francisco CA 7506 25297 647Atlanta GA 5196 23861 882Chicago IL 7663 23340 585New York NY 6766 22232 631Los Angeles CA 5056 14868 565Kansas City MO 1080 13525 2406Houston TX 1890 11522 1171St Louis MO 1350 10342 1472Salt Lake City UT 270 9867 7020Indianapolis IN 90 9217 19673Denver CO 2901 8674 574Boston MA 1325 8001 1160Seattle WA 1972 7288 710Phoenix AZ 1890 6701 681Cleveland OH 1080 6201 1103Columbus OH 495 5641 2189Charlotte NC 90 5191 11080
reasonable to argue that links are a more important rep-resentation of intermetropolitan relationships in the net-worked information economy As Table 3 shows largermore well-established metropolitan areas should tend tobene t from an agglomeration of network links as thisindicates a greater level of competition The top sevenmetropolitan areas clearly lead in the level of competitionin the market to provide direct network links from them to
FIG 3 US Internet backbone 1997 and 1999 Compiled from individual network maps in Boardwatch Magazine InternetService Providers Quarterly Directory (1997 1999)
other metropolitan areas The emerging secondary hubswhich were identi ed earlier in the analysis of backbonecapacity do not experience a similar level of competitionbecause much of their growth in capacity is attributable tothe construction of large-capacity networks by a handfulof companies However it is interesting to note that whilemetropolitan areas such as Philadelphia and Baltimorewhich do not boast very large capacities or diversity of
44 M L MOSS AND A M TOWNSEND
FIG 4 Distribution of backbone links among metropolitan areas
backbone links bene t from their geographic position be-tween large backbonecenters such as New York and Wash-ington DC providers often tap these markets using indi-rect backup links that supplement their main direct linksbetween the major hubs
Individual Metropolitan Areas
This subsection brie y summarizes our observations onthe position of individual regions in the geography of theaggregate Internet backbone network
Washington DC and the San Francisco Bay Area un-doubtedly serve as the major hubs for their respectivecoasts We are not surprised by the role of San Franciscosince it was the part of the nation that started the trends thatare just now beginning to transform our society Howeverthe important role of Washington DC greatly exceedsits traditional position in the communications hierarchyof the United States One explanation may be that muchof this capacity is dedicated to distributing content fromthe enormous Internet presence maintained by the federalgovernment Additionally several large Internet compa-nies such as America Online and Network Solutions Incare located in the Virginia suburbs Finally Washingtonserves as an aggregation point for traf c from not only the
Northeast but also the Southeast as well as internationally(Townsend forthcoming)
The relative weakness of the three metropolitan areasin the United States that are most commonly identi ed asldquoglobal citiesrdquomdashNewYork Chicago andLosAngelesmdashisone of the most striking ndings of this analysis Amongurban scholars there is a growing consensus that theseglobal cities have become increasingly isolated from theirnational economies while increasingly integrating opera-tions andactivities with each other (Sassen 1995 Castells1996) Thus an examination of Internet backbone net-works on a national scale is inappropriate for understand-ing these citiesrsquo roles in global telecommunications net-works We are currently gathering an independent set ofdata on international backbone links to determine whetherglobal cities have retained their traditional roles as hubsfor international communications infrastructure or if thishistorical pattern has begun to erode as well due to the newcapabilities of the Internet
Los Angeles is a global entertainment high technologyand media center and it is the second largest metropoli-tan area in the United States Furthermore Los AngelesCounty ranked third in the nation in the number of comput-ers connected to the Internet in 1996 (Moss amp Townsend1996) However the region ranks lowest among the major
THE INTERNET BACKBONE AND THE AMERICAN METROPOLIS 45
TABLE 3Average number of competing backbone
operators per link to other metropolitan areas
Number of competitorsMetro per external link
Los Angeles CA 76Baltimore MD 68Austin TX 63New York NY 61San Francisco CA 58Dallas TX 57Chicago IL 56Washington DC 55Seattle WA 49Atlanta GA 47Portland OR 46Philadelphia PA 40Houston TX 39San Diego CA 37Cleveland OH 35St Louis MO 35Boston MA 35Kansas City MO 33Phoenix AZ 31Las Vegas NV 30
metropolitan backbone nodes One possible explanationis that the regionrsquos entertainment industry is strongly con-centrated in ctional visual programming which has notyet been suitably adapted to distribution over the Inter-net We expect to see dramatically increased deploymentof backbone capacity in southern California as emergingldquobroadbandrdquo technologies increase the ability to deliverlarge amounts of data directly to the home
Seattle and Boston have far greater reputations as cen-ters for technological innovation yet they are trumped inthis analysis by hubs such as Atlanta and Dallas Someof the most interesting questions about this study mustgo answered because we lack data on the ows of infor-mation that actually take place over the potential pathwayswe have measured and mapped But because remote citieslike Seattle and Boston lie at the end of network pathwaysinstead of at the center like Atlanta and Dallas we can in-fer that their backbone capacity is being used entirely forlocal activity and not as a transiting facility Until data areavailable on the ows of information between points onthe backbone system there may be little hope of resolvingthis puzzle
CONCLUSIONS
This article highlights the need for experimentation withnew empirical techniques and measurements to study therelationships between information technology and urban
systems While a substantial legacy of research in the geog-raphy of communications networks and information owsexists contemporary scholars have not aggressively pur-sued similar lines of inquiry regarding the Internet
First the data presented in this article suggest that agroup of seven metropolitan areas has been established asa core communications switchboard for the long-distancetransport of communications across the Internet Despitethe deliberate design of the Internet as a distributed net-work the collective behavior of dozens of backbone net-work companies has created a highly organized systemAlthough the Network Access Points established at theend of the NSFNet era were important in providing seedpoints for private networks to converge we have seen com-mercial backbone providers establish private connectionsin these same regions as well
As a result the Internet has neither reinforced the im-portance of a few global cities nor ushered in a radicaldecentralization of the population into rural areas In theUnited States the three commonly identi ed global citiesof New York Los Angeles and Chicago have less back-bone capacity than either the San FranciscoSan Jose orWashington DC metropolitan areas However while theInternet has erased many of the geographic barriers thatpreviously isolated remote locations it hasnotunderminedthe need to cluster people and businesses in metropoli-tan areas Despite vefold expansion of Internet backbonecapacity in the United States during the study period in1999 67 of this capacity remained concentrated in thetop 20 metropolitan areas down only slightly from 86 in1997 Thus while some diffusion has occurred it hardlywarns of a doomsday scenario for cities
Second the empirical evidence presented here chal-lenges the conventional wisdom that telecommunicationstechnology will undermine some of the comparative ad-vantages of large centrally located metropolitan areasThe decisive shift from satellite to ber-optic technol-ogy for long-distance data transmissions has reintroducedphysical geography into the decision-making process gov-erning telecommunications infrastructure deploymentCentral locations like Atlanta Chicago and Dallas canbene t by serving as regional hubs for telecommunica-tions infrastructure in a way that is similar to the way inwhich their airports serve the transportation sector Whenconsidered with our past analysis of Internet domain regis-trations the structure of the Internet backbone illustrates astrong relationship between the concentration of informa-tion industries and physical and virtual telecommunica-tions infrastructure The deregulation of the telecommu-nications industry in the United States is favoring focusedmarket-based investment decisions in new telecommuni-cations technologies over universal deployments and as aresult there is a great disparity among cities with regardto the telecommunications capabilities that are availablefor businesses and homes However as has been shownproviders are often prone to segment their networks by
46 M L MOSS AND A M TOWNSEND
using intermediate nodes on long-distance links Distres-sed cities and remote areas can and should lobby regulatorsand corporations to provide these types of arrangementswhenever possible Although there is no clear evidencethat merely providing access to telecommunications infra-structure will generate economic development at the veryleast it is a prerequisite for competition in attracting andfostering new businesses
Third public of cials and urban planners should recog-nize the importance of information infrastructure in eco-nomic development and formulate research agendas thatinclude systematic data collection about investment anddeploymentof new telecommunications technologies TheInternet backbone has grown from a handful of federallysubsidized sites exchanginga few thousand e-mails per dayto a major industry threatening the viability of century-oldcommunications companies The ow of information inthrough and out of a city is an essential element of urbaneconomic life yet we lack both the political desire andthe necessary tools to gather this data The physical infra-structure that helped to shape earlier urban formsmdashthe sea-port the railroad and the highwaymdashis being supercededby a new network of optical bers Cisco routers cellularantennas and mobile telephones yet we have not turnedour attention to meeting this challenge
Fourth the unevengeographicdiffusion of Internet tech-nologies can no longer be doubted it exists not just be-tween rural and urban areas to which some attention hasbeen paid but also among the largest cities and metropoli-tan areas There is a compelling need for public policiesthat can foster investment in telecommunications infra-structure and the creation of a skilled workforce that willallow workers to utilize it Those without adequate skillsto process and handle information will not be able to com-pete in the labor market as higher levels of technologicalskill become essential to gain and hold employment Thewidespread deployment of advanced telecommunicationssystems is affecting all urban activities and illiteracy ininformation and communications technologies may con-tribute to an increasing ldquodigital dividerdquo in the social andpolitical sphere as well
Finally our ndings show that the infrastructure thatsupports the production and movement of information isnow a major unifying structure within our cities and metro-politan areas rather than a contributor to their destruc-tion The data presented in this article refute claims thatadvances in telecommunications technology will lead tourban decline yet these misleading explanations remainpowerfully simple On the contrary Internet backbonenetworks are rapidly integrating the social and economicmetabolism of major metropolitan areas using speed toovercome distance These same technological advancesare permitting individuals and rms in urban areas to adapttheir activities creatively in highly complex ways bothorganizationally and spatially and thus to remain com-
petitive and vital in the global economy Our cities andmetropolitan areas are undergoing a massive transforma-tion due to the introduction of these technologies yet wehave barely begun to take notice let alone understand andreact
NOTES
1 Post print radio telephony and television2 MapNet httpwwwcaidaorgToolsMapnet3 While the bottleneck between the telephone companyrsquos central
switching of ces and the home (the so-called ldquolast milerdquo) has receivedfar more attention in recent years the intermetropolitan capacity bot-tleneck has been an issue since at least the early 1980s
4 Metropolitan Fiber Systems ldquoMetropolitan Area Ethernetsrdquo(MAEs) are the best example of this type of local infrastructure How-ever the bernetworksof regionalBell OperatingCompaniesas well asemerging data networks providedby cable televisionoperatorsare alsosubstantialcomponentsof metropolitandata networkinginfrastructure
5 The following is a list of backbone nodes aggregated at themetropolitan area level Links between cities in the same metropolitanarea were excluded from this analysis Los Angeles CA AnaheimCA Orange CA and Rialto CA Washington DC Bethesda MDHerndonVA McLean VA Reston VA and Vienna VA Boston MACambridgeMAMiamiFL Fort LauderdaleFL PompanoBeach FLChicago IL Downers Grove IL Schaumburg IL Willow Springs ILNew York NY Whippany NJ Trenton NJ Hackensack NJ NewarkNJ Pennsauken NJ West Orange NJ White Plains NY and TroyNY San Francisco CA Concord CA Hayward CA Oakland CAPalo Alto CA San Jose CA San Rafael CA Santa Clara CA andSanta Rosa CA
6 Mbps megabits per second A DS-3 line operating at 45 Mbpsis over 1600 times as fast as the typical 288-kilobitsper second modemnow standard on most personal computers
REFERENCES
Abler Ron 1970 What makes cities important Bell TelephoneMagazine
Baran Paul 1964 On distributed communications I Introduction todistributed communications networks RAND Memorandum RM-3420-PR Santa Monica CA RAND
BoardwatchMagazine Internet ServiceProvidersQuarterlyDirectory1997 Fall Littleton CO
BoardwatchMagazine Internet ServiceProvidersQuarterlyDirectory1999 WinterSpring Littleton CO
Cairncross Frances 1997 The death of distance Cambridge MAHarvard Business School Press
Campanella Thomas J 1998 Antiurbanism and the image of the cityin new media culture Paper given at Imaging the City faculty collo-quium Department of Urban Studies and Planning MassachusettsInstitute of Technology Cambridge MA fall lthttpwebmiteduimagingthecitywwwabstractshtmlgt
Castells Manuel 1996 The rise of the network society Vol I Cam-bridge MA Blackwell
Claffy K and Huffaker Brad Macroscopic Internet visualizationandmeasurement National Laboratory for Applied Network ResearchlthttpwwwcaidaorgToolsMapnetsummaryhtmlgt
THE INTERNET BACKBONE AND THE AMERICAN METROPOLIS 47
Dawson Keith 1998 The Net handles the Starr Report in strideTasty Bits from the Technology Front September 14 lthttpwwwtbtfcomarchive0161htmls01gt
de RepentignyFrancois and Khanna Kiran 1997 Internet telephonyForm andfunctionalityFrostamp Young July lthttpwwwfrostcomveritynewslettertelecom97-07art01htmgt
Freidmann John and Wolff Goetz 1982 World city formation Anagenda for research and action International Journal of Urban andRegional Research 6309ndash344
Gilder George 1995 Forbes ASAP February 2756Gottman Jean 1961 Megalopolis Cambridge MA MIT PressGottman Jean 1977 Megalopolis and antipolis The telephone and
the structure of the city In The social impact of the telephone edIthia de Sola Pool Cambridge MA MIT Press
Graphics Visualization and Usability Center Georgia Institute ofTechnology 1995 GVUrsquos NSFNET backbone statistics lthttpwwwccgatechedugvustatsNSFExtrapGIFgt
GreensteinShane 1998Universal service in the digital age The com-mercializationand geographyof US Internetaccess Januarylthttpskew2kelloggnwueduraquo greensteresearchpapersISPACCES2pdfgt
Hall Peter 1997 Modeling the post-industrialcity Futures 29(45)Hepworth Mark 1990 The geography of the information economy
New York Guilford PressInetco Corporation 1999 San Francisco Bay Area tops list of
wired cities INETCO survey nds 1 February lthttpwwwinetcocompublicpu990201htmgt
Joint Venture Silicon Valley Network 1998 Silicon Valley com-parative analysis January lthttpwwwjointventureorgresourcesanalysisintrohtmlgt
Kolko Jed 1998The death of cities The death of distance Evidencefrom the geography of commercial Internet usage Unpublished pa-per Harvard University Cambridge MA
Lynch Kevin 1960 The image of a city Cambridge MA MIT PressMalecki E J and Gorman S P In press Maybe the death of distance
but not the end of geography The Internet as a network In Wiredworlds of electroniccommerce eds S D Brunn and T R Leinbach
Moss MitchellL andTownsendAnthonyM 1996Leadersand loserson the Internet Taub Urban Research Center New York UniversitySeptember lthttpurbannyuedugt
Moss MitchellL andTownsendAnthonyM 1997Trackingthe rsquoNetUsing domain names to measure the growth of the Internet in UScities Journal of Urban Technology4(3)
Moss MitchellL and TownsendAnthonyM 1998Spatialanalysisofthe Internet in US cities and states Paper given at Urban FuturemdashTechnological Futures Conference at Newcastle England 23ndash25April lthttpurbannyuedugt
Murnion Shane 1999 Cyber-spatial analysis Modelling web serverinformation ows Paper given at NCGIA Project Varenius Spe-
cialist Meeting on Accessibility in the Information Age Paci cGrove CA 20ndash22 November ltftpwwwartsciwashingtonedunsfPapersmurniondocgt
Negroponte Nicholas 1995 Being digital New York KnopfNunn Samuel and Warren Robert 1997 Metropolitan telematics in-
frastructure and capacity for economic development in the informa-tion society Bloomington Center for Urban Policy and the Envi-ronment Indiana University
Orlikowski Wanda 1999 The truth is not out there An enacted viewof the ldquodigital economyrdquo Paper given at Understanding the DigitalEconomy25 May US Departmentof Commerce WashingtonDClthttpmitpressmiteduUDEorlikowskirtfgt
Pew ResearchCenter for the People and the Press 1996Fall off greaterfor youngadults and computersusers TV news viewershipdeclines13 May WashingtonDC
Pred Allan R 1973 Urban growth and the circulationof informationCambridge MA Harvard University Press
Quarterman John S 1990 The matrix Computer networks and con-ferencing systems worldwide Bedford MA Digital Press
RickardJack1997The InternetmdashWhat is itBoardwatchMagazinemdashInternet Service Providers Quarterly Directory Fall LittletonCO
Salus Peter H 1995 Casting the Net From ARPANET to INTERNETand beyond New York Addison-Wesley
Sassen Saskia 1995 On concentration and centrality in the globalcity In World cities in a world system eds Paul L Knox and PeterJ Taylor Cambridge England Cambridge University Press
Saxenian Annalee 1994 Regional advantage Culture and compe-tition in Silicon Valley and Route 128 Cambridge MA HarvardUniversity Press
Shapiro Andrew 1999 The Net that binds Using cyberspace to cre-ate real communities The Nation 21 June lthttpwwwthenationcomissue9906210621shapiroshtmlgt
Thrift Nigel 1996 New urban eras and old technological fears Re-con guring the goodwill of electronic things Urban Studies 33(8)
Tof er Alvin 1980 The third wave New York William MorrowTownsend Anthony In Press Networkedcities and the global structure
of the internet American Behavioral ScientistTownsend Anthony M Murnion Shane and Dodge Martin 1999
NetCensus Planning for an Internet census April lthttpwwwnetcensusorggt
Werbach Kevin 1997 Digital tornado The Internet and telecommu-nications policy March WashingtonDC Federal CommunicationsCommission
Zook Matthew 1988 The web of consumption The spatial organi-zation of the Internet industry in the United States Paper preparedfor the Association of Schools of Planning Conference PasadenaCA 5ndash8 November lthttpsocratesberkeleyeduraquo zookpubsacsp1998htmlgt
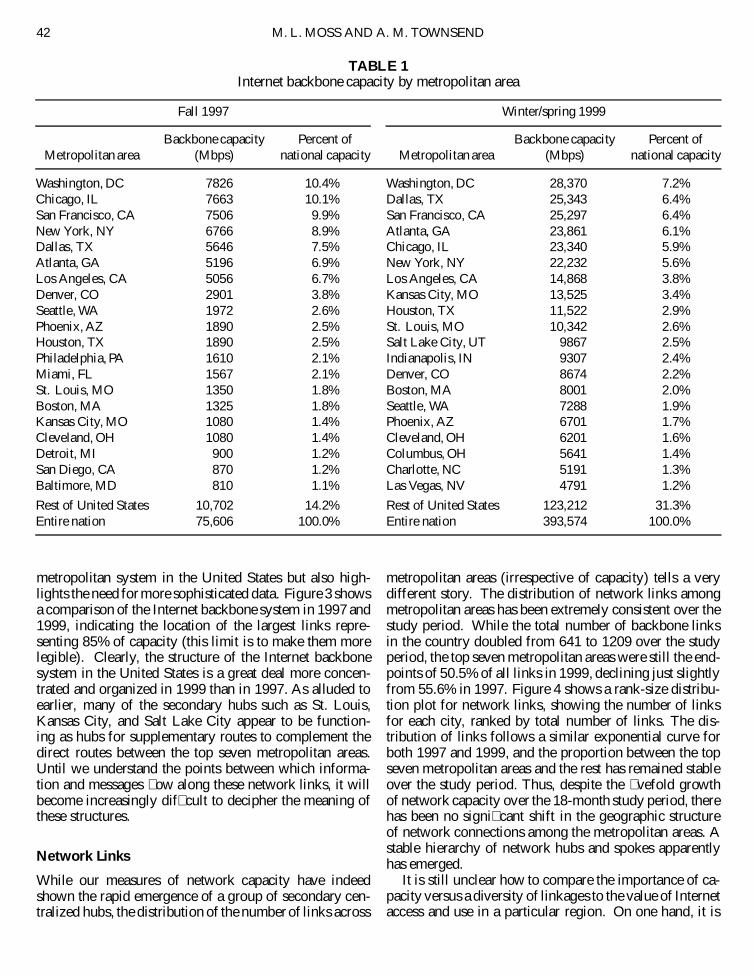
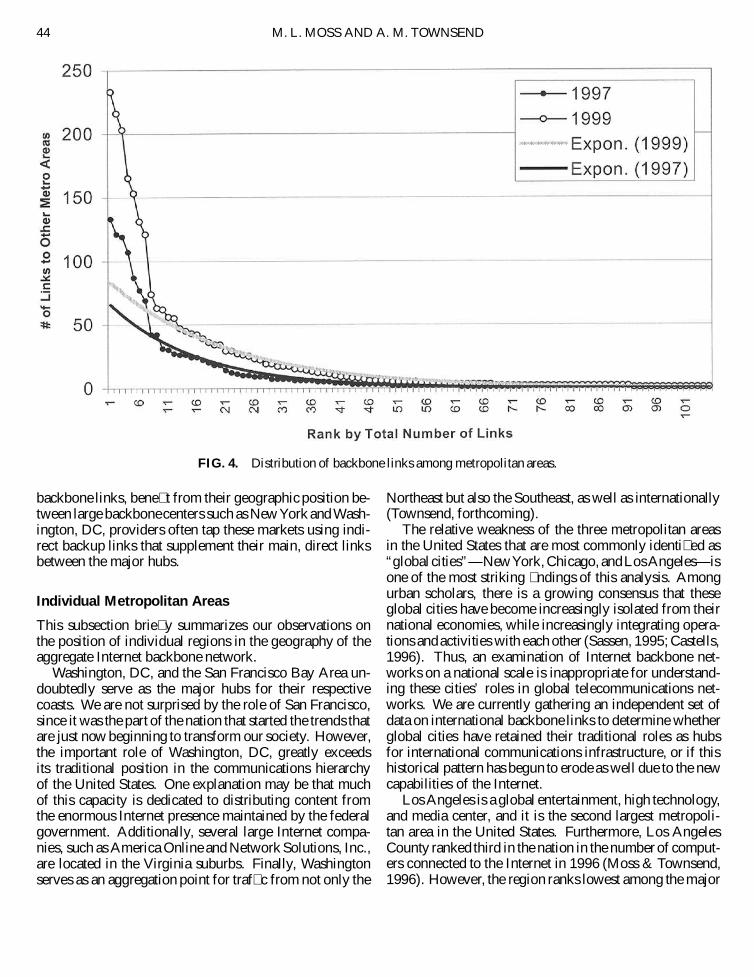
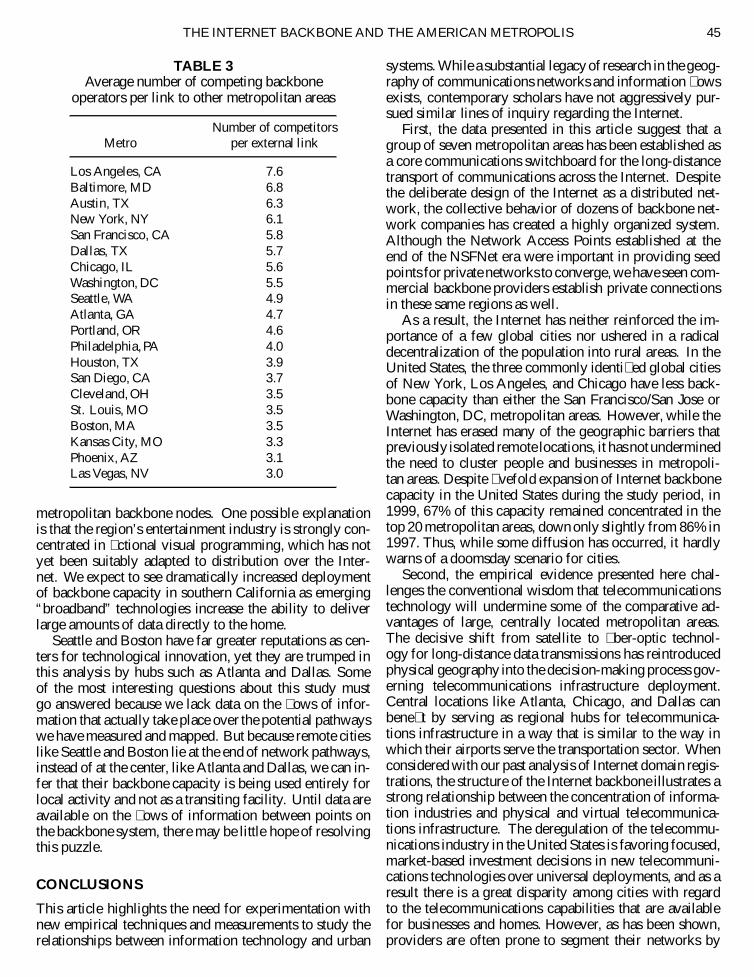