the international bank for reconstruction and development
TRANSCRIPT
© 2011 The International Bank for Reconstruction and Development/The World Bank 1818H Street, NW Washington, DC 20433 Telephone: 202-473-1000 Internet www.worldbank.org E-mail [email protected] All rights reserved. This volume is a product of the Chief Economist’s Office of the Middle East and North Africa Region and the Concessional Finance and Global Partnerships Vice Presidency of the World Bank. The findings, interpretations, and conclusions expressed herein are those of the author(s) and do not necessarily reflect the views of the Board of Executive Directors of the World Bank or the governments they represent. The World Bank does not guarantee the accuracy of the data included in this work. The boundaries, colors, denominations, and other information shown on any map in this work do not imply any judgment on the part of the World Bank concerning the legal status of any territory or the endorsement or acceptance of such boundaries. Rights and Permissions The material in this work is copyrighted. Copying and/or transmitting portions or all of this work without permission may be a violation of applicable law. The World Bank encourages dissemination of its work and will normally grant permission promptly. For permission to photocopy or reprint any part of this work, please send a request with complete information to the Copyright Clearance Center, Inc, 222 Rosewood Drive, Danvers, MA 09123, USA, telephone 978-750-8400, fax 978-750-4470, www.copyright.com. All other queries on rights and licenses, including subsidiary rights, should be addressed to the Office of the Publisher, World Bank, 1818H Street, NW, Washington, DC 20433, USA, fax 202-522-2422, e-mail [email protected]. ISBN (electronic): 978-0-8213-9888-3 DOI: 10.1596/978-0-8213-9888-3 Photograph: © GETTYIMAGES

i
TABLE OF CONTENTS
ACRONYMS .................................................................................................................................................. V
EXECUTIVE SUMMARY .............................................................................................................................. VII
INTRODUCTION ........................................................................................................................................... 1
MENA’S MACROECONOMIC OUTLOOK ................................................................................................... 5
Growth outlook for 2011 – better than expected in May ............................................................... 5 Fiscal outlook for 2011 – worse than expected in May .................................................................. 9 Risks to the outlook ......................................................................................................................... 16
INVESTING FOR GROWTH .......................................................................................................................... 21
MENA’s investment record ............................................................................................................. 21 Investment and growth .................................................................................................................... 24 Should the dominant role of public investment in MENA be a cause for concern? ....................... 25 Investment efficiency in MENA ....................................................................................................... 29 Foreign direct investment, growth and employment ....................................................................... 30
GROWTH AND JOB CREATION .................................................................................................................... 35
Pace of job creation relative to growth .......................................................................................... 35 Economic activities and employment ............................................................................................. 39 Engines of economic and employment growth ............................................................................... 42
KEY MESSAGES ........................................................................................................................................... 47
REFERENCES ............................................................................................................................................... 51
ANNEX ......................................................................................................................................................... 53
LIST OF BOXES
Box 4.1 Maintaining and building infrastructure as a vehicle for job creation .................................. 45
LIST OF FIGURES
Figure 1.1 Average growth and investment performance during typical successful transition .............. 2 Figure 2.1 GDP growth outlook (percent) .............................................................................................. 5 Figure 2.2 Industrial production (% change, 3m/3m, seasonally adjusted annualized rate) .................. 7 Figure 2.3 Tourist arrivals (percent change over same period of the previous year) ............................. 7 Figure 2.4 Unemployment rates (percent) .............................................................................................. 8 Figure 2.5 Fiscal outlook for 2011 (fiscal balance as a share of GDP) .................................................. 9 Figure 2.6 Inflation rates (percent) ......................................................................................................... 15 Figure 2.7 Real growth in MENA, US and EU .................................................................................... 16 Figure 2.8 Equity markets (indexes) ....................................................................................................... 19 Figure 2.9 Sovereign Credit Default Swaps (CDS) ................................................................................ 19 Figure 3.1 Gross fixed capital formation (average, % of GDP) ............................................................. 21 Figure 3.2 Private gross fixed capital formation (averages, % of GDP) ................................................ 22 Figure 3.3 Private gross fixed capital formation by country (averages, % of GDP) .............................. 22 Figure 3.4 Foreign and other investment (averages, % of GDP) ............................................................ 23 Figure 3.5 Growth in oil prices and FDI inflows to MENA ................................................................... 24
Figure 3.6 Changes in average private investment and growth rates in MENA .................................... 25 Figure 3.7 Public gross fixed capital formation (averages, % of GDP) ................................................. 25 Figure 3.8 Public gross fixed capital formation by country (averages, % of GDP) ............................... 26 Figure 3.9 Ratio of private to public investment .................................................................................... 26 Figure 3.10 Annual per capita GDP growth and public investment, 2000-05 ........................................ 28 Figure 3.11 Investment efficiency in MENA region (average ICORs for the 2000s) .............................. 29 Figure 3.12 Private investment and growth ............................................................................................. 30 Figure 3.13 FDI inflows and FDI-related job in MENA by sector during 2003-11 ................................. 32 Figure 3.14 FDI-related jobs by country during 2003-11 ......................................................................... 34 Figure 4.1 Employment-growth elasticities for 2004-08 ...................................................................... 36 Figure 4.2 Value added shares by sector in the oil exporters (period averages in the 2000s, percent) .. 36 Figure 4.3 Employment elasticity to GDP growth vs. share of informal workers in developing
MENA in the 2000s .............................................................................................................. 37 Figure 4.4 Average GDP growth rates in developing MENA countries in the 2000s (percent) ............ 38 Figure 4.5 Employment shares by sector (period averages in the 2000s, percent) ................................. 39 Figure 4.6 Employment shares – a comparison with fast growing, middle-income developing countries
(period averages in the 2000s, percent) ................................................................................. 40 Figure 4.7 Value added share of government and all other services (period averages in the 2000s,
percent) .................................................................................................................................. 41 Figure 4.8 Sectoral contributions to average annual value added growth (percentage points) .............. 42 Figure 4.9 Sectoral contribution to average, annual employment growth (percentage points) .............. 43 Figure 4.10 Services sectors’ contribution to average annual value added growth (percentage points) .. 44 Figure 4.11 Sectoral contribution to annual employment and value added growth - an international
comparison (percent) ............................................................................................................. 44 LIST OF TABLES Table 2.1. Macro Economic Outlook ..................................................................................................... 6 Table 2.2. Social measures implemented in the region in 2011 ............................................................. 10 Table 2.3. GCC Investment Programs and Projects ............................................................................... 14 LIST OF ANNEX FIGURES Figure 1. Annual per capita GDP growth and public investment, 1995-99 .......................................... 54 LIST OF ANNEX TABLES Table 1. Economies with successful transitions .................................................................................. 54 Table 2. Macroeconomic Outlook as of May 2011 ............................................................................. 55 Table 3. MENA’s employment elasticity to growth ........................................................................... 56
iii
WORLD BANK MIDDLE EAST AND NORTH AFRICA REGION
Economic Developments and Prospects Report, September 2011
MENA INVESTING FOR GROWTH AND JOBS
This report was prepared by a team led by Elena Ianchovichina (Lead Economist, MNACE and principal author) under the guidance of Caroline Freund (Chief Economist, Middle East and North Africa Region). We acknowledge contributions by the following team members: Lili Mottaghi (MNACE) worked on investment and growth as well as the regional macroeconomic outlook, jointly with country economists in MNSED. Christina A. Wood (MNACE) made contributions on the employment and growth section. Ravindra Yatawara (MNACE) contributed inputs on foreign direct investment, while Bob Rijker (MNACE) worked on foreign direct investment and employment. We received useful data from Sharmaine Yap Yu (CICIN), Maros Ivanic (DECRG), Jian Zhan (MNACE), Subika Farasi (FPDCE), Elliot (Mick) Riordan (DECPG), and Nadia Spivak (DECPG). Isabelle Chaal-Dabi (MNACE) provided excellent administrative assistance and Malika Drissi (MNSSO) worked on the design of the report’s cover. We are grateful to Manuela Ferro (Sector Director, MNSED), Stefanie Brodmann (MNSSP), Diego Angel-Urdinola (MNSSP) and Anne Hilger (MNSHD) for their useful comments. We would also like to thank Bernard Funck (Sector Manager, MNSED) and Roberta Gatti (Social Sector Protection Sector Manager and Lead Economist, MNSHD) for their assistance, suggestions and support. The following group of MNSED country economists provided valuable country-specific inputs: Antonio Nucifora, Chadi Bou Habib, Daniela Marotta, Hania Sahnoun, Ibrahim Al Ghelaiqah, John Nasir, Jorge Araujo, Karim Badr, Kevin Carey, Khalid El Massnaoui, Marc Schiffbauer, Nancy Claire Benjamin, Ndiame Diop, Santiago Herrera, Sherine H. El-Shawarby, Sibel Kulaksiz, Stefano Paternostro, Wael Mansour, and Wilfried Engelke. For ease of analysis and exposition, the region is divided into three main groups: the GCC oil exporters, developing oil exporters and oil importers. The first group contains the Gulf Cooperation Council (GCC) countries, namely, Bahrain, Kuwait, Oman, Qatar, Saudi Arabia, and the United Arab Emirates. The second group comprises the developing oil exporters such as Algeria, the Islamic Republic of Iran, Iraq, Libya, the Syrian Arab Republic, and the Republic of Yemen. Oil importers include countries with strong GCC links (Djibouti, Jordan, and Lebanon) and those with strong EU links and located in North Africa (Morocco, Tunisia and the Arab Republic of Egypt). Developing MENA represents all MENA countries except the GCC oil exporters.

iv
2011 Economic Developments and Prospects – MENA Investing for Growth and Jobs
v
ACRONYMS CDS Credit Default Swap EAP East Asia and Pacific ECA Europe and Central Asia ECB European Central Bank EDP Economic Developments and Prospects report EMBI Emerging Market Bond Index EU European Union FDI Foreign Direct Investment GCC Gulf Cooperation Council GDP Gross Domestic Product GTAP The Global Trade Analysis Project HIC High Income Countries ICOR Incremental Capital Output Ratio IFS International Financial Statistics IMF International Monetary Fund ID Iraqi Dinar ILO International Labor Organization IMF JD
International Monetary Fund Jordanian Dinar
KD Kuwaiti Dinar LAC LE LNG
Latin America and the Caribbean Egyptian Pound Liquefied Natural Gas
MAD Moroccan Dirham MENA Middle East and North Africa MoF Ministry of Finance MSCI Emerging Markets index NPISH Non-Profit Institutions Services Households OECD Organization for Economic Cooperation and Development PDS Public Distribution System S&P Standard and Poor SA/SAS South Asia SR Saudi Arabia Riyal SSA Sub-Saharan Africa SWF Sovereign Wealth Funds TDN Tunisian Dinar UK United Kingdom UNCTAD United Nations Conference on Trade and Development UNSTAT United Nation Statistics US United States of America WBG WDI
West Bank and Gaza World Development Indicators

vi

2011 Economic Developments and Prospects – MENA Investing for Growth and Jobs
vii
EXECUTIVE SUMMARY
Economic growth in the Middle East and North Africa (MENA) region is expected to average 4.1 percent in 2011 and improve by half a percentage point from our May forecast for the year. This positive development is largely due to increases in public spending which have boosted demand across the region, increases in oil production in most MENA oil exporters, and a quicker than expected upturn in industrial production in the Arab Republic of Egypt. In addition, the growth prospects of the Islamic Republic of Iran improved as subsidy reform took effect and efficiency gains started taking place. The slight deceleration in regional growth to 3.8 percent in 2012 is mainly linked to an anticipated global slowdown, which is likely to depress oil production and prices.
While this year’s regional growth outlook has improved relative to the May forecast, uncertainty has increased in line with growing risks for a global downturn. Declining demand from Europe would negatively affect North African oil importers as it would threaten their export revenues and remittances. Falling oil prices would reduce growth in MENA’s oil exporters, but would be a relief to developing oil importers. Unlike in 2008, when MENA countries had ample fiscal space to respond to the challenges brought about by the global economic and financial crisis, current political and economic developments have weakened many countries’ fiscal positions and their ability to respond with additional spending in the event of another global crisis. Within the region, a move to political and macroeconomic stability is therefore critical in order to reduce regional uncertainty and revive investment and economic activity.
There is some evidence of expanded activity in the transition countries in recent months. Industrial production in Egypt and Tunisia returned to pre-Arab-Spring levels, suggesting that these countries might follow the standard path of political transition. On average, economic growth returns quickly following smooth transitions to democracy. Specifically, growth declined by 3 percentage points during past successful transitions but rebounded to or above its pre-transition rate within a year or two. Uncertainty during transition also has important implications for investment. Experiences from successful transitions suggest that there is a delayed decline in investment which takes longer to recover than economic activity. Investment declines are moderate, on average 2 percentage points, but typically investment activity takes at least 5 years to recover.
As in these experiences from other regions, the rise in uncertainty stemming from the Arab Spring transitions translated into higher risk premiums in countries affected by unrest. As capital became more costly, private investment and growth declined. In countries with limited fiscal space such as Morocco and Jordan, expansions of social programs in response to popular demand have occurred at the expense of public investment programs. By contrast, investment in the GCC countries has not been affected significantly given the dominant role of public

Executive Summary
viii
investment. The risks there include anemic credit growth in the private sector and implementation constraints related to public investment projects.
Given these recent developments, it is imperative to understand whether public investment is likely to facilitate private investment or whether it is likely to crowd it out in MENA countries during this period. To improve long-run prospects, it is also important to understand why investment has failed to create enough jobs and robust growth in the past. This EDP report explores these issues.
A look at MENA’s investment record over the past decade suggests that the region has been investing at rates which compare favorably with those of other regions. However, in oil exporting countries, investment has been mainly supported by large and expanding public investment. Oil importers have shown more strength in private investment which increased in recent years.
The expanding role of public investment is a cause for concern in developing oil exporters, as in economies with weak rule of law there is no evidence that public investment stimulates private investment and growth. In contrast, in countries with an adequate level of property rights protection, accountability, and legal institutions, public investment is strongly linked to growth. In addition, good rule of law helps attract private investment and countries with strong rule of law show higher levels of investment efficiency.
As with oversized public investment, many countries in the region record a large share of jobs in government services as compared with other countries. Of concern is the fact that the contribution of government services to GDP is relatively small. Moreover, in recent years this sector has been unable to support job or income growth. The oil sector shows a pattern opposite to that in government services, accounting for a large share of value added but not jobs. Consequently, the number of jobs created in the last decade was considerably less than the number needed to address key challenges, such as high youth unemployment, low labor force participation rates, especially among women, and fast-growing labor forces.
This report investigates the region’s job creation problem in light of income growth. Our analysis shows that the region’s job problem cannot be attributed solely to a slow pace of job creation relative to economic growth. On average the region has been creating jobs at a faster pace, relative to income growth, than other middle-income countries in the 2000s. However, there is some variation within the region, with oil importing countries recording a slower rate of job creation relative to income growth.
Several factors have been associated with this fast pace of job creation in oil exporting countries. Informal employment is highly prevalent in developing MENA countries. In such economies, new entrants to the labor force can generally find low-productivity, low-quality jobs in the informal sector. Another reason has been the use of special employment programs to support job creation in recent years. This has been the case in Algeria and other countries where there has

2011 Economic Developments and Prospects – MENA Investing for Growth and Jobs
ix
been sufficient fiscal space and oil wealth. The report also shows that the past decade has been a period of rapid growth in several labor-intensive sectors, including construction, trade, tourism, logistics and communication services. However, many of the jobs have proved unattractive to domestic residents in oil exporting countries and have been performed by migrant workers.
Thus, in developing oil exporters, the main job problem is one of insufficient growth, while oil importers have a job creation problem. In all countries, job quality has been a particular concern. Jobs in government services have been increasingly difficult to obtain, while finding similar quality jobs in the private sector has been hard.
The report shows that nongovernment services and manufacturing can serve as engines of both job creation and income growth. Services have been a source of strength both in income and jobs, in levels and growth, especially in oil importers. Manufacturing has contributed to growth in income and jobs, but, on average, the size of this sector is small in MENA relative to other countries, such as Brazil, Indonesia, Malaysia and Turkey.
The analysis shows that there is scope for improvement. The report presents evidence that, while the majority of FDI received by the MENA region flows into the real estate and fuels sectors, the majority of FDI-related jobs are generated in the manufacturing sector. In the 2000s, manufacturing received just around one fifth of all regional FDI inflows but created 55 percent of all FDI-related jobs.
Overall, the report highlights the importance of a strong rule of law. Better governance is necessary for public investment to support income growth, and better governance attracts private investment in areas such as services and manufacturing, which are the main drivers of both income growth and job creation. Improving government institutions is necessary for voice and accountability, and it is also necessary for growth and efficient use of resources.

2011 Economic Developments and Prospects – MENA Investing for Growth and Jobs
1
INTRODUCTION
Many countries in the Middle East and North Africa are going through a period of unprecedented political change. A series of pro-democracy movements resulted in quick regime change in Tunisia and Egypt, but triggered conflict in Libya, the Syrian Arab Republic and the Republic of Yemen, and demonstrations in a number other MENA countries, including Oman, Bahrain and Morocco.
This report first examines how these transitions are affecting the short run macroeconomic outlook for the region, also taking into account fragility in the global outlook. The remainder of the report takes a longer-term perspective, examining the effects of private and public investment on growth, and in turn the relationship between growth and jobs.
As highlighted in the previous macroeconomic outlook presented in World Bank (2011c), the challenges and uncertainty of political change brought about a drop in expected growth in the region. While regional uncertainty has changed little since May 2011, the global economic environment has deteriorated. Growth perceptions changed in August, reflecting downward data revision in high-income countries and weaker than anticipated growth in the second quarter of the year. Turmoil in financial markets reflects these negative changes in perceptions and debt woes in high-income countries, especially high-income Europe. With growing uncertainty, investment and growth are expected to weaken, while concerns about inflation from high commodity prices are expected to become less pronounced.
Domestic and global developments subject MENA countries’ macroeconomic outlook to significant uncertainty and downside risks. Disruptions to business and uncertainty in the region, coupled with strong demand from emerging markets in the first half of the year, pushed up oil prices. This led to a divergence in the growth rates expected in 2011, with stable oil exporters growing more rapidly than anticipated, while those experiencing short-run challenges of transition slowing down. Going forward, however, this divergence is expected to narrow as the global slowdown depresses oil prices and growth rebounds in countries where political stability returns quickly.
The rise in uncertainty stemming from Arab Spring transitions has translated into higher risk premiums in countries affected by unrest, including Egypt, Tunisia, Libya, Syria and the Republic of Yemen. In these countries capital has become more costly while private investment, including foreign direct investment (FDI), and growth have declined. In some countries with limited fiscal space, such as Morocco, expansions in social programs in response to popular demand have occurred at the expense of public investment programs. By contrast, investment in the GCC countries has not been affected significantly given the dominant role of public investment. The risks there include continued anemic credit growth in the private sector and implementation constraints related to public investment projects.
Introduction
2
Given the important implications of the Arab Spring events for investment, this issue of MENA’s Economic Developments and Prospects report focuses on investment and its role in creating growth and jobs over the past decade. The objective is to take a comprehensive look at investment, paying special attention to its composition and efficiency, as well as its effects on growth and employment. Such analytical study is overdue in light of the developments in the region and the absence of recent regional studies on the topic.
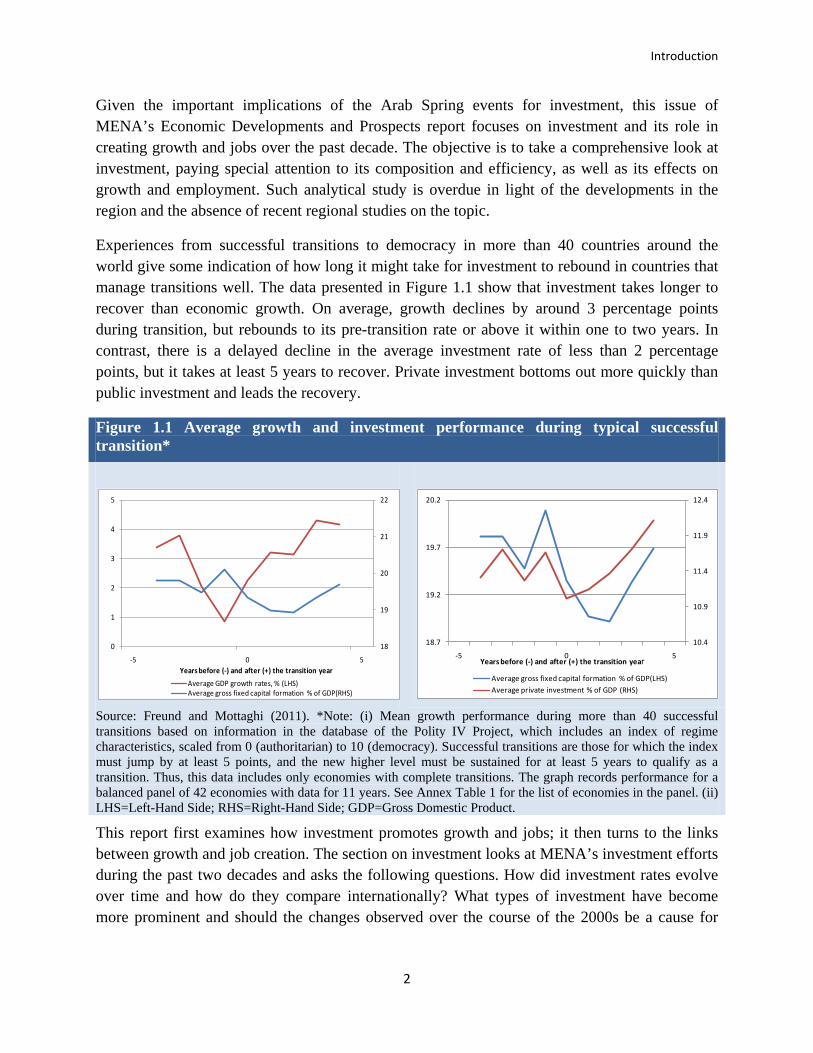
Experiences from successful transitions to democracy in more than 40 countries around the world give some indication of how long it might take for investment to rebound in countries that manage transitions well. The data presented in Figure 1.1 show that investment takes longer to recover than economic growth. On average, growth declines by around 3 percentage points during transition, but rebounds to its pre-transition rate or above it within one to two years. In contrast, there is a delayed decline in the average investment rate of less than 2 percentage points, but it takes at least 5 years to recover. Private investment bottoms out more quickly than public investment and leads the recovery.
Figure 1.1 Average growth and investment performance during typical successful transition*
Source: Freund and Mottaghi (2011). *Note: (i) Mean growth performance during more than 40 successful transitions based on information in the database of the Polity IV Project, which includes an index of regime characteristics, scaled from 0 (authoritarian) to 10 (democracy). Successful transitions are those for which the index must jump by at least 5 points, and the new higher level must be sustained for at least 5 years to qualify as a transition. Thus, this data includes only economies with complete transitions. The graph records performance for a balanced panel of 42 economies with data for 11 years. See Annex Table 1 for the list of economies in the panel. (ii) LHS=Left-Hand Side; RHS=Right-Hand Side; GDP=Gross Domestic Product. This report first examines how investment promotes growth and jobs; it then turns to the links between growth and job creation. The section on investment looks at MENA’s investment efforts during the past two decades and asks the following questions. How did investment rates evolve over time and how do they compare internationally? What types of investment have become more prominent and should the changes observed over the course of the 2000s be a cause for
18
19
20
21
22
0
1
2
3
4
5
-5 0 5Years before (-) and after (+) the transition year
Average GDP growth rates, % (LHS)Average gross fixed capital formation % of GDP(RHS)
10.4
10.9
11.4
11.9
12.4
18.7
19.2
19.7
20.2
-5 0 5
Average gross fixed capital formation % of GDP(LHS)Average private investment % of GDP (RHS)
Years before (-) and after (+) the transition year

2011 Economic Developments and Prospects – MENA Investing for Growth and Jobs
3
concern? Does the answer to this question differ by country? What should countries do to increase investment’s potential to create growth and jobs in a sustainable way?
The section on employment turns to the question of why growth has failed to deliver the jobs needed in MENA. It also looks at the sectoral distribution of employment and employment growth, and compares these with sector’s contributions to income and income growth. The motivation is to understand which sectors provide employment and income, which sectors have contributed to employment growth and income growth, and to compare them with those in other countries to determine whether some sectors could offer promise as regional job creators.

4

2011 Economic Developments and Prospects – MENA Investing for Growth and Jobs
5
MENA’S MACROECONOMIC OUTLOOK
Growth outlook for 2011 – better than expected in May Despite short-term challenges and uncertainty about political transitions, economic growth in the Middle East and North Africa region is expected to average 4.1 percent in 2011 (Figure 2.1) and improve by half a percentage point from our May forecast for the year (see Annex Table 2). This positive development is due to increases in public spending that have boosted demand across the region, increases in oil production in most MENA oil exporters, and quicker than expected upturn in industrial production in Egypt. In the Islamic Republic of Iran, growth prospects improved as subsidy reform took effect and efficiency gains started taking place. The short-term costs of the subsidy reform were also minimized by a system of cash transfers.
In oil exporters (excluding Libya), growth is expected to reach 4.6 percent in 2011 (Table 2.1) largely due to increases in oil production in an environment of high oil prices. Growth in oil importers is still estimated to be close to 2.5 percent this year with oil importers in North Africa growing slightly faster than expected in May, and those in the Middle East growing slightly slower than the May forecast. The growth deceleration expected in 2012 is primarily linked to the global slowdown which is likely to depress oil production and prices, but also to continued political uncertainties in the region. Oil prices have started moving downwards since August when doubts started growing about the recovery in high-income countries.
Industrial production in Egypt and Tunisia slowed sharply in the first quarter of 2011 (Figure 2.2). A large share of the decline in these two countries is explained by contraction in tourism activity, but also construction and manufacturing in Egypt slowed. Industrial production – which in the oil exporters is dominated by oil – has been less volatile than industrial production in the oil importers. Some of the oil exporters increased production in order to compensate for the collapse of Libya’s oil output (Figure 2.2).
Figure 2.1 GDP growth outlook (percent)
Source: World Bank data. Note: May forecast published in World Bank (2011c). MENA=Middle East and North Africa; $/bbl=US dollars per barrel of crude oil.
0.0
1.0
2.0
3.0
4.0
5.0
6.0
2008 2009 2010 2011 est. 2012 proj.
Real growth (percent)
MENA (as of Fall 2011)
MENA (as of May 2011)
020406080
100120140
2008
M01
2008
M04
2008
M07
2008
M10
2009
M01
2009
M04
2009
M07
2009
M10
2010
M01
2010
M04
2010
M07
2010
M10
2011
M01
2011
M04
2011
M07
Oil prices
Petroleum, crude ($/bbl)

MENA’s Macroeconomic Outlook
6
Table 2.1. Macroeconomic Outlook Real GDP growth Fiscal balance Current account balance
2008 2009 2010 2011 est.
2012 proj. 2008 2009 2010 2011
est. 2012 proj. 2008 2009 2010 2011
est. 2012 proj.
(Annual percentage change) (in percentage of GDP) (in percentage of GDP) MENA region 5.6 2.1 4.3 4.1 3.8 12.0 -3.7 -0.5 1.4 1.9 14.8 2.3 6.0 8.0 8.5
Oil Exporters 5.2 1.1 4.1 4.6 3.7 15.3 -3.3 0.9 3.6 4.1 18.5 4.2 8.7 11.3 12.0 GCC 7.0 -0.3 4.5 5.8 3.9 23.2 -2.6 2.6 6.4 7.1 23.3 7.4 11.6 15.0 15.2
Bahrain 6.3 3.1 4.5 0.7 2.5 4.9 -8.7 -5.2 -2.4 -0.3 10.6 1.6 3.6 6.0 6.2 Kuwait 6.4 -4.4 2.3 4.5 3.8 19.9 19.3 16.5 17.2 20.9 40.7 26.3 32.0 30.2 31.4 Oman 12.8 1.1 4.8 3.5 3.0 13.9 2.2 6.9 7.6 6.5 8.4 -0.6 8.2 13.9 10.1 Qatar 25.4 8.6 16.3 20.0 7.1 10.6 14.2 9.7 10.2 9.9 29.1 10.2 17.3 24.2 22.6 Saudi Arabia 4.2 0.6 3.3 5.0 3.5 32.5 -6.1 -0.8 2.7 3.3 27.8 6.0 8.1 11.7 12.7 United Arab Emirates 5.3 -3.2 3.2 3.3 3.8 16.5 -12.6 -1.3 6.5 6.9 7.4 3.0 7.7 10.4 10.5
Developing Oil Exporters 1.9 3.5 3.4 2.4 3.3 1.8 -4.3 -1.7 -0.3 -0.4 10.3 -0.5 4.5 6.1 7.2 Algeria 2.4 2.4 3.3 3.6 3.5 7.7 -6.8 -3.9 -1.1 3.0 20.2 0.3 9.4 9.5 17.4 Iran, Islamic Republic of 0.6 3.5 3.2 2.5 3.4 0.7 1.0 1.7 2.8 1.3 6.5 3.0 6.0 8.7 8.2 Iraq 9.5 4.2 0.8 9.6 12.6 -1.3 -22.1 -9.1 -8.4 -11.6 19.2 -13.8 -3.2 -1.5 -4.5 Syrian Arab Republic 4.5 6.0 3.2 0.0 -1.0 -2.9 -2.9 -4.8 -7.1 -6.3 0.1 -2.2 -5.7 -8.9 -6.3 Yemen, Rep. 3.6 3.8 7.8 -5.0 2.5 -3.4 -8.6 -7.0 -5.9 -3.2 -4.1 -6.2 -3.4 -2.2 -3.4
Oil Importers 6.7 4.9 4.7 2.5 3.9 -4.2 -5.5 -6.1 -7.5 -6.7 -3.3 -4.8 -5.1 -5.4 -5.2 Oil Importers with GCC links 8.5 7.4 5.3 3.5 4.5 -5.9 -8.3 -4.9 -5.5 -5.1 -12.1 -13.4 -16.3 -17.2 -16.1
Djibouti 5.8 5.0 3.5 4.8 5.1 1.3 -4.6 -0.5 0.4 0.0 -24.3 -9.1 -4.8 -10.4 -11.6 Jordan 7.2 5.5 2.3 2.5 3.5 -2.2 -8.9 -5.6 -5.7 -4.9 -9.3 -4.7 -5.0 -9.5 -8.3 Lebanon 9.3 8.5 7.0 4.0 5.0 -8.8 -8.0 -4.7 -5.5 -5.5 -13.8 -19.3 -24.1 -22.4 -21.3
Oil Importers with EU links 6.5 4.5 4.6 2.4 3.8 -3.9 -5.0 -6.3 -7.9 -7.0 -1.8 -3.3 -3.0 -3.2 -3.2 Egypt, Arab Rep. 7.2 4.7 5.2 1.8 3.5 -6.8 -6.9 -8.2 -9.5 -8.6 0.5 -2.3 -2.0 -1.2 -2.0 Morocco 5.6 4.8 3.7 4.5 4.8 0.4 -2.2 -4.6 -5.5 -4.5 -5.2 -5.4 -4.3 -6.7 -5.4 Tunisia 4.5 3.1 3.0 1.1 3.4 -1.1 -3.0 -1.3 -5.1 -4.7 -3.8 -2.8 -4.8 -5.3 -4.4 Source: World Bank data. Note: MENA=Middle East and North Africa; GCC= Gulf Cooperation Council; EU= European Union; GDP=Gross Domestic Product; est.=estimate; proj.=projection.

2011 Economic Developments and Prospects – MENA Investing for Growth and Jobs
7
Industrial production in oil importers started recovering rapidly in the second quarter of 2011. The recovery was driven mainly by rapid expansion of industrial production in Egypt and, to a
Figure 2.2 Industrial production (% change, 3m/3m, seasonally adjusted annualized rate)
Source: Datastream. Note: GCC= Gulf Cooperation Council.
Figure 2.3 Tourist arrivals (percent change over same period of the previous year)
Source: UNWTO.
80
90
100
110
120
130
140
150
2008
M01
2008
M03
2008
M05
2008
M07
2008
M09
2008
M11
2009
M01
2009
M03
2009
M05
2009
M07
2009
M09
2009
M11
2010
M01
2010
M03
2010
M05
2010
M07
2010
M09
2010
M11
2011
M01
2011
M03
2011
M05
United Arab EmiratesOmanQatarSaudi Arabia
GCC oil exporters
0
20
40
60
80
100
120
140
2008
M01
2008
M03
2008
M05
2008
M07
2008
M09
2008
M11
2009
M01
2009
M03
2009
M05
2009
M07
2009
M09
2009
M11
2010
M01
2010
M03
2010
M05
2010
M07
2010
M09
2010
M11
2011
M01
2011
M03
2011
M05
Algeria
Iran, Islamic Rep.
Iraq
Libya
Syrian Arab Republic
Developing oil exporters
70
75
80
85
90
95
100
105
110
2008
M01
2008
M03
2008
M05
2008
M07
2008
M09
2008
M11
2009
M01
2009
M03
2009
M05
2009
M07
2009
M09
2009
M11
2010
M01
2010
M03
2010
M05
2010
M07
2010
M09
2010
M11
2011
M01
2011
M03
2011
M05
Egypt, Arab Rep.JordanMoroccoTunisia
Oil importers
MENA’s Macroeconomic Outlook
8
lesser extent, Tunisia. Recovery was observed in construction, trade and transport in Egypt, and in textiles, electrical and mechanical activities in Tunisia. The agricultural season is also expected to improve in Tunisia, where cereals production at the end of July was double that registered during the same period last year.
The tourism sector has registered losses since the onset of the Arab uprisings and continued uncertainty will weigh on the sector in coming months. MENA countries experienced sharp declines in tourist arrivals following the unrest as travel warnings were issued; tour operators cancelled holidays and repatriated customers. Within MENA, North African countries experienced the largest declines in the numbers of tourist arrivals in the first three months of the year. The total number of arrivals fell by 10 percent in January and February of this year and by another 20 percent in March while most travelers switched to safer routes in the Middle East (Figure 2.3). However, not all countries in North Africa suffered losses in 2011. Morocco’s tourism sector gained as travelers avoided countries in turmoil. As tensions in Syria escalated, the negative impact on tourism spread to the Middle East.
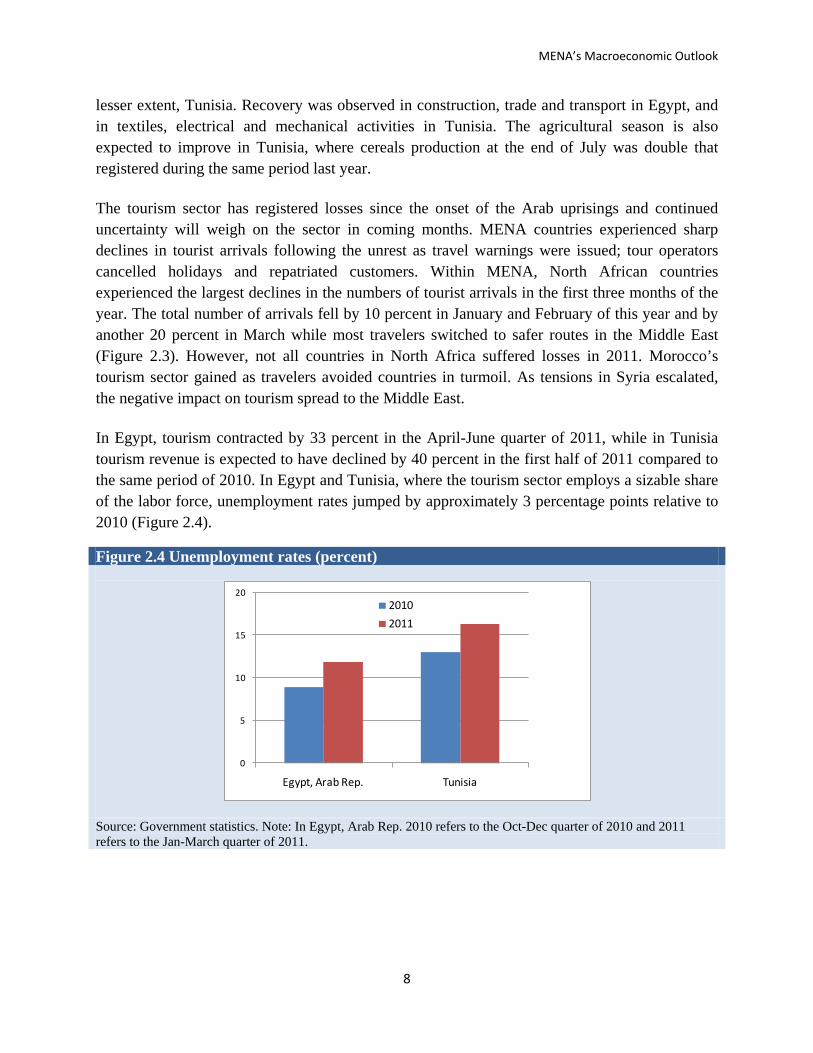
In Egypt, tourism contracted by 33 percent in the April-June quarter of 2011, while in Tunisia tourism revenue is expected to have declined by 40 percent in the first half of 2011 compared to the same period of 2010. In Egypt and Tunisia, where the tourism sector employs a sizable share of the labor force, unemployment rates jumped by approximately 3 percentage points relative to 2010 (Figure 2.4).
Figure 2.4 Unemployment rates (percent)
Source: Government statistics. Note: In Egypt, Arab Rep. 2010 refers to the Oct-Dec quarter of 2010 and 2011 refers to the Jan-March quarter of 2011.
0
5
10
15
20
Egypt, Arab Rep. Tunisia
20102011
2011 Economic Developments and Prospects – MENA Investing for Growth and Jobs
9
Fiscal outlook for 2011 – worse than expected in May
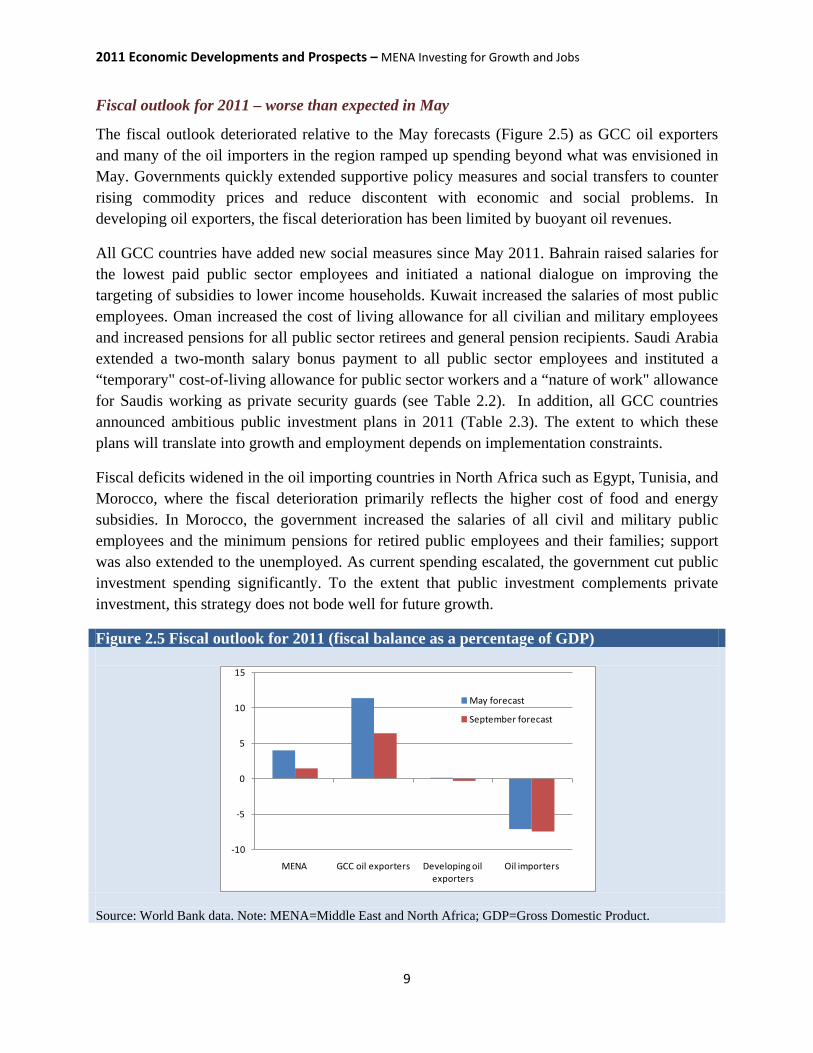
The fiscal outlook deteriorated relative to the May forecasts (Figure 2.5) as GCC oil exporters and many of the oil importers in the region ramped up spending beyond what was envisioned in May. Governments quickly extended supportive policy measures and social transfers to counter rising commodity prices and reduce discontent with economic and social problems. In developing oil exporters, the fiscal deterioration has been limited by buoyant oil revenues.
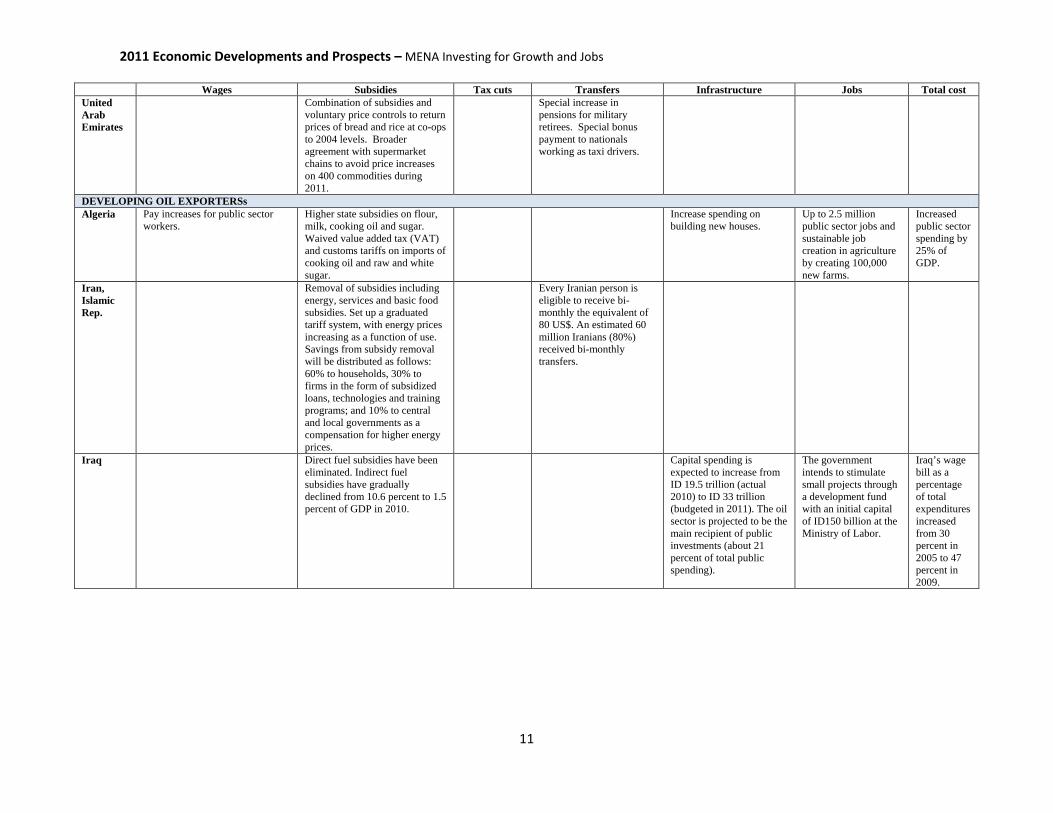
All GCC countries have added new social measures since May 2011. Bahrain raised salaries for the lowest paid public sector employees and initiated a national dialogue on improving the targeting of subsidies to lower income households. Kuwait increased the salaries of most public employees. Oman increased the cost of living allowance for all civilian and military employees and increased pensions for all public sector retirees and general pension recipients. Saudi Arabia extended a two-month salary bonus payment to all public sector employees and instituted a “temporary" cost-of-living allowance for public sector workers and a “nature of work" allowance for Saudis working as private security guards (see Table 2.2). In addition, all GCC countries announced ambitious public investment plans in 2011 (Table 2.3). The extent to which these plans will translate into growth and employment depends on implementation constraints.
Fiscal deficits widened in the oil importing countries in North Africa such as Egypt, Tunisia, and Morocco, where the fiscal deterioration primarily reflects the higher cost of food and energy subsidies. In Morocco, the government increased the salaries of all civil and military public employees and the minimum pensions for retired public employees and their families; support was also extended to the unemployed. As current spending escalated, the government cut public investment spending significantly. To the extent that public investment complements private investment, this strategy does not bode well for future growth.
Figure 2.5 Fiscal outlook for 2011 (fiscal balance as a percentage of GDP)
Source: World Bank data. Note: MENA=Middle East and North Africa; GDP=Gross Domestic Product.
-10
-5
0
5
10
15
MENA GCC oil exporters Developing oil exporters
Oil importers
May forecast
September forecast

MENA’s Macroeconomic Outlook
10
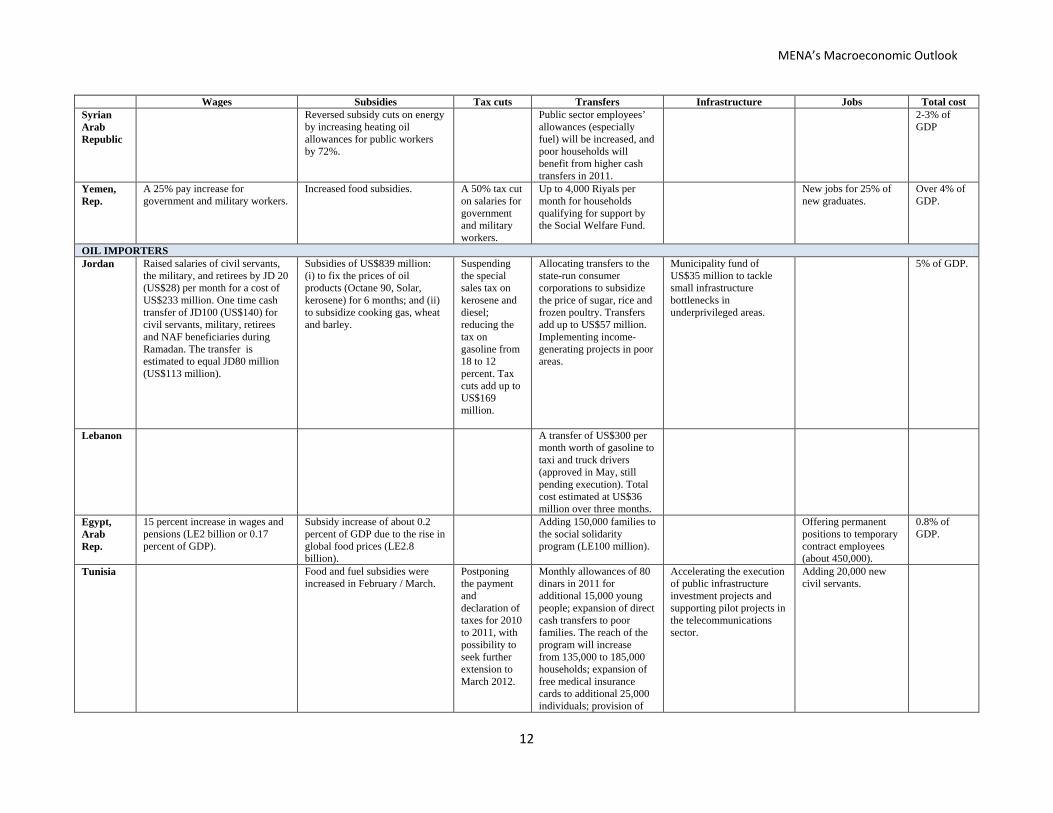
Table 2.2. Social measures implemented in the region in 2011 Wages Subsidies Tax cuts Transfers Infrastructure Jobs Total cost
GCC OIL EXPORTERS Bahrain
Public sector pay increases of up to 37 percent for the lowest paid public employees.
Increase in food subsidies, including flour and meat by 44 million dinars. National Dialogue proposals include better targeting of subsidies towards lower income households, but measures are still being studied.
25% cut in housing installment payments. Expatriate labor fee of US$27/ worker/month suspended for 6 months.
Transfers of US$2600 per family.
Construction of at least 6000 public housing units per year.
Creation of 20,000 new jobs at Ministry of Interior. One year tenure required before expatriate workers can switch jobs without employer approval (previously no time limit).
Total cost of pay increase in public sector at 2.5% of GDP.
Kuwait
Flat pay increase of KD100 (US$360) per month for most public employees. Additional increases in allowances for qualifications.
An offer of free food for 13 months through a discount price program.
A grant of US$3600 to all Kuwaiti citizens and a special increase in pensions for military retirees.
An allocation of US$4 billion for construction of new housing.
Oman
Increase in cost of living allowances for all civilian and military employees. Unemployment benefit program of US$390 per month and a minimum wage of US$520 per month.
All increases in prices of consumer goods and services subject to approval by Public Authority for Consumer Protection.
Increase in pensions for all public sector retirees and general pension recipients (bigger % increase for lower level pensions).
A new public sector employment program covering 50,000 citizens.
Ministry of Finance estimates total cost of new measures at 4.5% of GDP or 12% increase in fiscal budget.
Qatar Salary, social allowance, and pension increases of 60% (state employees), 120% (military officers) and 50% (general military).
Saudi Arabia
Unemployment allowance was set at SR2000 (US$530) per month, and SR3000 (US$800) per month. Minimum wage was instituted for nationals working in the public sector. Two months’ salary bonus payment to all public sector employees. "Temporary" cost of living allowance for public sector workers from 2008 incorporated in basic pay, and 15% "nature of work" allowance for Saudis working as private security guards.
Grants for charities and needy students of US$300 million; a bonus payment equal to 2 months of salary/stipend to all public employees and scholarship students; two month bonus for all public and state pension recipients; and higher stipends for tertiary education students.
An allocation of SR250 billion (US$67 billion) to build 0.5 million new houses.
Add 60,000 new security jobs at the Ministry of Interior; add 500 new jobs at Ministry of Commerce and Industry.
Cost of measures equivalent to 25% of GDP.
2011 Economic Developments and Prospects – MENA Investing for Growth and Jobs
11
Wages Subsidies Tax cuts Transfers Infrastructure Jobs Total cost United Arab Emirates
Combination of subsidies and voluntary price controls to return prices of bread and rice at co-ops to 2004 levels. Broader agreement with supermarket chains to avoid price increases on 400 commodities during 2011.
Special increase in pensions for military retirees. Special bonus payment to nationals working as taxi drivers.
DEVELOPING OIL EXPORTERSs Algeria Pay increases for public sector
workers. Higher state subsidies on flour, milk, cooking oil and sugar. Waived value added tax (VAT) and customs tariffs on imports of cooking oil and raw and white sugar.
Increase spending on building new houses.
Up to 2.5 million public sector jobs and sustainable job creation in agriculture by creating 100,000 new farms.
Increased public sector spending by 25% of GDP.
Iran, Islamic Rep.
Removal of subsidies including energy, services and basic food subsidies. Set up a graduated tariff system, with energy prices increasing as a function of use. Savings from subsidy removal will be distributed as follows: 60% to households, 30% to firms in the form of subsidized loans, technologies and training programs; and 10% to central and local governments as a compensation for higher energy prices.
Every Iranian person is eligible to receive bi-monthly the equivalent of 80 US$. An estimated 60 million Iranians (80%) received bi-monthly transfers.
Iraq Direct fuel subsidies have been eliminated. Indirect fuel subsidies have gradually declined from 10.6 percent to 1.5 percent of GDP in 2010.
Capital spending is expected to increase from ID 19.5 trillion (actual 2010) to ID 33 trillion (budgeted in 2011). The oil sector is projected to be the main recipient of public investments (about 21 percent of total public spending).
The government intends to stimulate small projects through a development fund with an initial capital of ID150 billion at the Ministry of Labor.
Iraq’s wage bill as a percentage of total expenditures increased from 30 percent in 2005 to 47 percent in 2009.
MENA’s Macroeconomic Outlook
12
Wages Subsidies Tax cuts Transfers Infrastructure Jobs Total cost Syrian Arab Republic
Reversed subsidy cuts on energy by increasing heating oil allowances for public workers by 72%.
Public sector employees’ allowances (especially fuel) will be increased, and poor households will benefit from higher cash transfers in 2011.
2-3% of GDP
Yemen, Rep.
A 25% pay increase for government and military workers.
Increased food subsidies. A 50% tax cut on salaries for government and military workers.
Up to 4,000 Riyals per month for households qualifying for support by the Social Welfare Fund.
New jobs for 25% of new graduates.
Over 4% of GDP.
OIL IMPORTERS Jordan Raised salaries of civil servants,
the military, and retirees by JD 20 (US$28) per month for a cost of US$233 million. One time cash transfer of JD100 (US$140) for civil servants, military, retirees and NAF beneficiaries during Ramadan. The transfer is estimated to equal JD80 million (US$113 million).
Subsidies of US$839 million: (i) to fix the prices of oil products (Octane 90, Solar, kerosene) for 6 months; and (ii) to subsidize cooking gas, wheat and barley.
Suspending the special sales tax on kerosene and diesel; reducing the tax on gasoline from 18 to 12 percent. Tax cuts add up to US$169 million.
Allocating transfers to the state-run consumer corporations to subsidize the price of sugar, rice and frozen poultry. Transfers add up to US$57 million. Implementing income-generating projects in poor areas.
Municipality fund of US$35 million to tackle small infrastructure bottlenecks in underprivileged areas.
5% of GDP.
Lebanon A transfer of US$300 per month worth of gasoline to taxi and truck drivers (approved in May, still pending execution). Total cost estimated at US$36 million over three months.
Egypt, Arab Rep.
15 percent increase in wages and pensions (LE2 billion or 0.17 percent of GDP).
Subsidy increase of about 0.2 percent of GDP due to the rise in global food prices (LE2.8 billion).
Adding 150,000 families to the social solidarity program (LE100 million).
Offering permanent positions to temporary contract employees (about 450,000).
0.8% of GDP.
Tunisia Food and fuel subsidies were increased in February / March.
Postponing the payment and declaration of taxes for 2010 to 2011, with possibility to seek further extension to March 2012.
Monthly allowances of 80 dinars in 2011 for additional 15,000 young people; expansion of direct cash transfers to poor families. The reach of the program will increase from 135,000 to 185,000 households; expansion of free medical insurance cards to additional 25,000 individuals; provision of
Accelerating the execution of public infrastructure investment projects and supporting pilot projects in the telecommunications sector.
Adding 20,000 new civil servants.
2011 Economic Developments and Prospects – MENA Investing for Growth and Jobs
13
Wages Subsidies Tax cuts Transfers Infrastructure Jobs Total cost microcredit or gifts to support home improvements of 20,000 households; one-off lump sum transfer of TDN 400 per person and TDN 600 per family to Tunisians coming back from Libya.
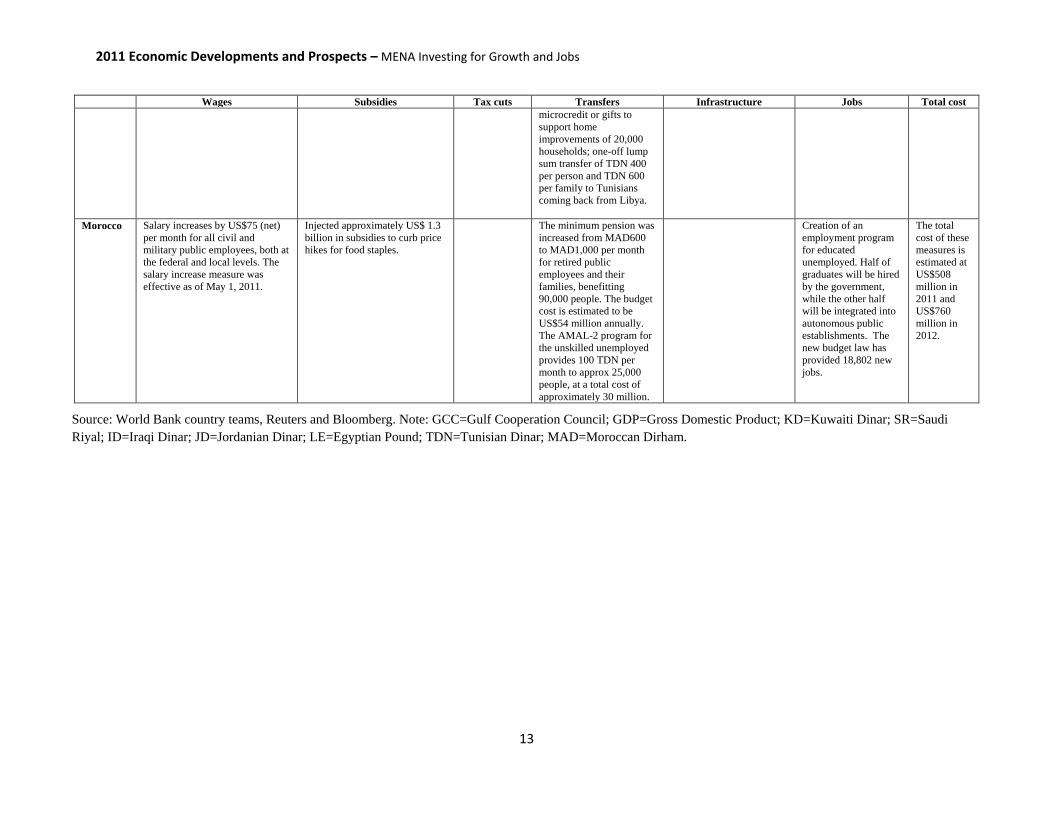
Morocco Salary increases by US$75 (net) per month for all civil and military public employees, both at the federal and local levels. The salary increase measure was effective as of May 1, 2011.
Injected approximately US$ 1.3 billion in subsidies to curb price hikes for food staples.
The minimum pension was increased from MAD600 to MAD1,000 per month for retired public employees and their families, benefitting 90,000 people. The budget cost is estimated to be US$54 million annually. The AMAL-2 program for the unskilled unemployed provides 100 TDN per month to approx 25,000 people, at a total cost of approximately 30 million.
Creation of an employment program for educated unemployed. Half of graduates will be hired by the government, while the other half will be integrated into autonomous public establishments. The new budget law has provided 18,802 new jobs.
The total cost of these measures is estimated at US$508 million in 2011 and US$760 million in 2012.
Source: World Bank country teams, Reuters and Bloomberg. Note: GCC=Gulf Cooperation Council; GDP=Gross Domestic Product; KD=Kuwaiti Dinar; SR=Saudi Riyal; ID=Iraqi Dinar; JD=Jordanian Dinar; LE=Egyptian Pound; TDN=Tunisian Dinar; MAD=Moroccan Dirham.
MENA’s Macroeconomic Outlook
14
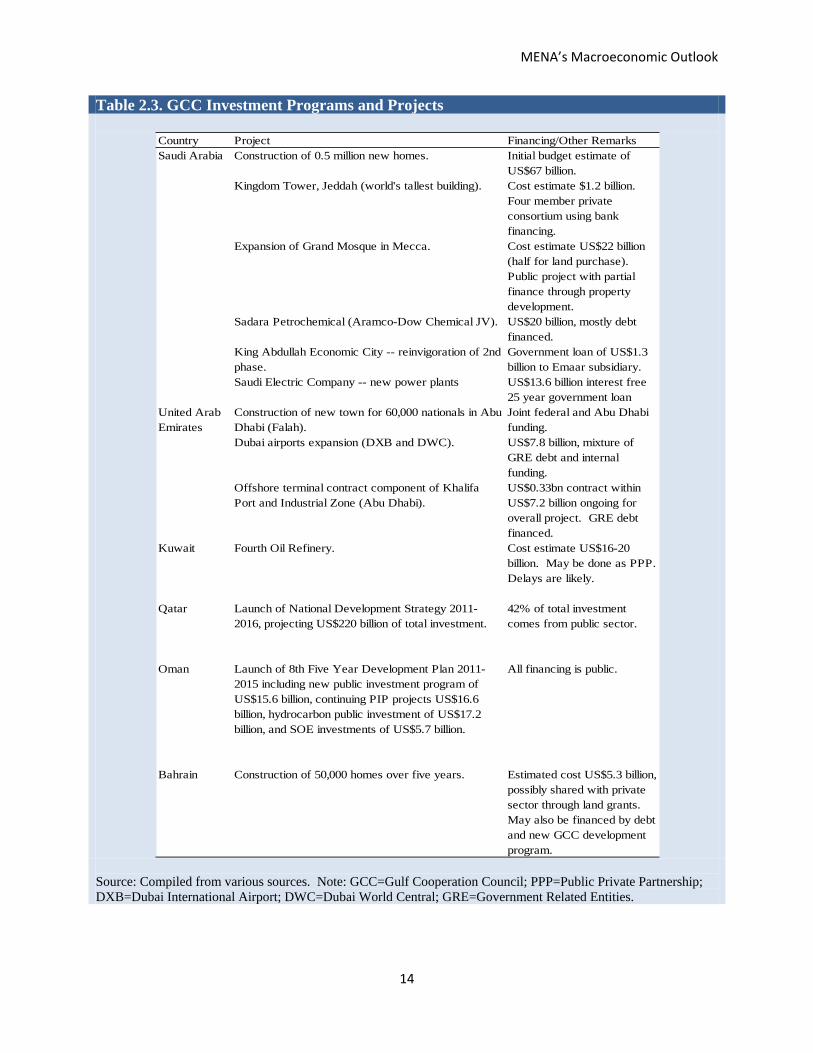
Table 2.3. GCC Investment Programs and Projects
Source: Compiled from various sources. Note: GCC=Gulf Cooperation Council; PPP=Public Private Partnership; DXB=Dubai International Airport; DWC=Dubai World Central; GRE=Government Related Entities.
Country Project Financing/Other RemarksSaudi Arabia Construction of 0.5 million new homes. Initial budget estimate of
US$67 billion.Kingdom Tower, Jeddah (world's tallest building). Cost estimate $1.2 billion.
Four member private consortium using bank financing.
Expansion of Grand Mosque in Mecca. Cost estimate US$22 billion (half for land purchase). Public project with partial finance through property development.
Sadara Petrochemical (Aramco-Dow Chemical JV). US$20 billion, mostly debt financed.
King Abdullah Economic City -- reinvigoration of 2nd phase.
Government loan of US$1.3 billion to Emaar subsidiary.
Saudi Electric Company -- new power plants US$13.6 billion interest free 25 year government loan
United Arab Emirates
Construction of new town for 60,000 nationals in Abu Dhabi (Falah).
Joint federal and Abu Dhabi funding.
Dubai airports expansion (DXB and DWC). US$7.8 billion, mixture of GRE debt and internal funding.
Offshore terminal contract component of Khalifa Port and Industrial Zone (Abu Dhabi).
US$0.33bn contract within US$7.2 billion ongoing for overall project. GRE debt financed.
Kuwait Fourth Oil Refinery. Cost estimate US$16-20 billion. May be done as PPP. Delays are likely.
Qatar Launch of National Development Strategy 2011-2016, projecting US$220 billion of total investment.
42% of total investment comes from public sector.
Oman Launch of 8th Five Year Development Plan 2011-2015 including new public investment program of US$15.6 billion, continuing PIP projects US$16.6 billion, hydrocarbon public investment of US$17.2 billion, and SOE investments of US$5.7 billion.
All financing is public.
Bahrain Construction of 50,000 homes over five years. Estimated cost US$5.3 billion, possibly shared with private sector through land grants. May also be financed by debt and new GCC development program.

2011 Economic Developments and Prospects – MENA Investing for Growth and Jobs
15
Inflation is projected to increase slightly in the region in 2011, in line with increases in fuel and food prices, expansionary fiscal policies, and in some countries the dollar peg, which contributes to inflation in times of dollar weakness and robust domestic demand.1 With a fixed exchange rate, when the anchor is weak and domestic conditions are good, imports will be strong and at a relatively high dollar price, which will feed into the inflation rate.
The largest increases in inflation rates are registered in the developing oil exporters (Figure 2.6). These increases reflect mainly price increases related to the impact of energy subsidies in the Islamic Republic of Iran and steep price increase of key food staples related to security issues and the protracted political crisis in the Republic of Yemen.
Figure 2.6 Inflation rates (percent)
Source: National statistical offices, IMF/IFS and ILO. Note: (i) The figure presents mean inflation rates for the region and sub-regional groups. The GCC group includes Kuwait, Oman, Qatar and Saudi Arabia; developing oil exporters – the Islamic Republic of Iran, Iraq, the Syrian Arab Republic and the Republic of Yemen; oil importers – Jordan, the Arab Republic of Egypt, Morocco, and Tunisia. (ii) MENA=Middle East and North Africa; GCC=Gulf Cooperation Council. In the GCC and some oil importing countries the inflationary impacts of expansionary fiscal policy, high food and fuel prices, and imported inflation were limited to some extent by expensive subsidies. However, the inflation situation differs by country. Inflation has been more of an issue in Qatar which is one of the fastest growing economies in the world. Inflation may be less of a risk for MENA’s oil importers where economic activity has slowed considerably due to the social turmoil. In the United Arab Emirates and other GCC economies housing prices remain depressed, yet they are a source of inflationary pressures in Saudi Arabia where there are supply shortages and high demand from the growing population.
1 Countries with pegs to the dollar include Bahrain, Jordan, Lebanon, Oman, Qatar, Saudi Arabia, the United Arab Emirates, Yemen, Djibouti and Iraq. Countries with pegs to a composite include Kuwait, Libya, Morocco, Tunisia, Syria, Iran and Algeria. Egypt follows a managed float with no pre-determined path for the exchange rate.
0
2
4
6
8
10
12
14
GCC economies Developing oil exporters
Oil importers MENA
2010 2011
MENA’s Macroeconomic Outlook
16
Going forward the expectation is that inflation will ease as a result of a global slowdown and the associated, expected decline in commodity prices, including food and oil. The decline implies fiscal savings in those MENA countries where governments extend food and fuel subsidies.
Risks to the outlook
While uncertainty within the region remains high, the main change since the last forecast is the deterioration in the global outlook. Contagion from developments in high income countries remains limited, but risks have risen in recent months. Worries about the spread of European sovereign debt beyond Greece and Ireland intensified over the summer, while disappointing growth and employment reports in the US, as well as Standard and Poor’s downgrade of the US credit rating in August, have raised doubts about the US recovery and the global growth outlook. As a result, the probability of a double-dip recession in the US and Europe is higher now than just a few months ago.
For more than a year, developing countries were not affected by the EU debt crisis, but in August contagion spread globally, including to emerging economies. Capital flows to developing countries declined sharply, CDS spreads jumped relative to the beginning of August, and stock-market declines were similar to those in high income countries.
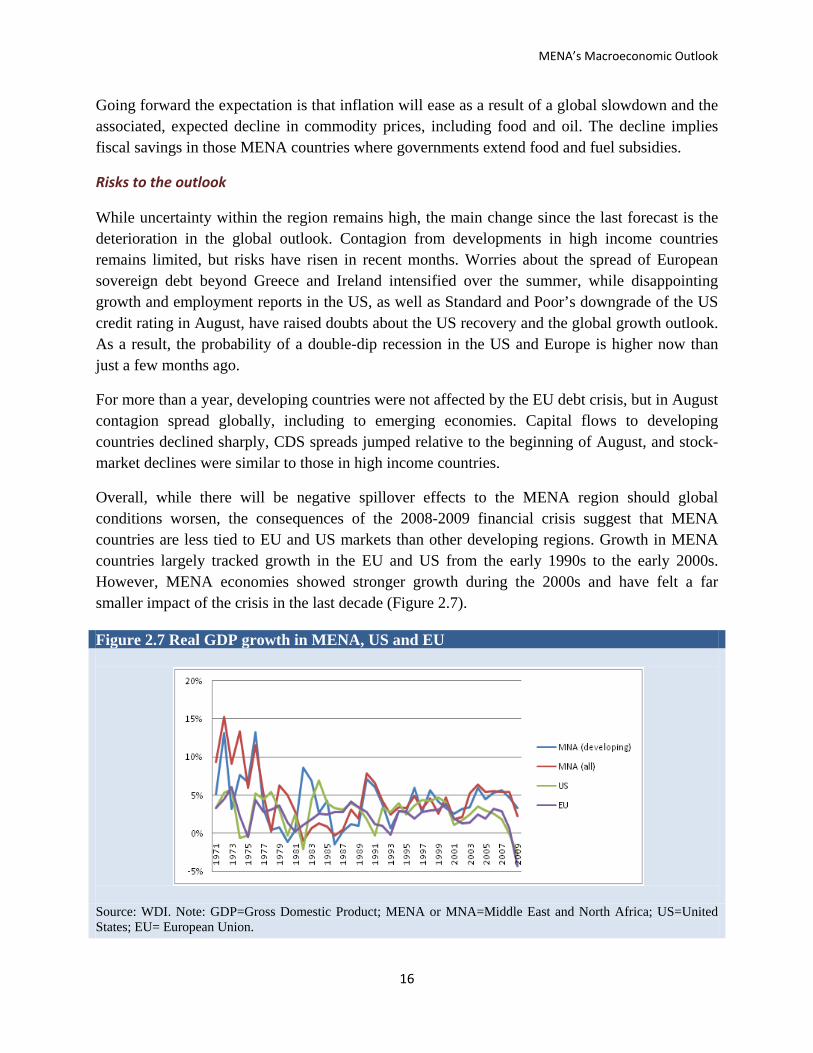
Overall, while there will be negative spillover effects to the MENA region should global conditions worsen, the consequences of the 2008-2009 financial crisis suggest that MENA countries are less tied to EU and US markets than other developing regions. Growth in MENA countries largely tracked growth in the EU and US from the early 1990s to the early 2000s. However, MENA economies showed stronger growth during the 2000s and have felt a far smaller impact of the crisis in the last decade (Figure 2.7).
Figure 2.7 Real GDP growth in MENA, US and EU
Source: WDI. Note: GDP=Gross Domestic Product; MENA or MNA=Middle East and North Africa; US=United States; EU= European Union.
2011 Economic Developments and Prospects – MENA Investing for Growth and Jobs
17
That said, many MENA countries are already facing difficult economic conditions because of the recent uprisings, implying that a global downturn would be felt more severely now than in 2008 when economic growth in the region was robust.
The MENA region will feel the effects of a global recession mainly through the trade channel, especially oil, rather than the financial channel. Oil exporters will face lower demand and weakened growth. Oil importers with EU links will feel the weakness mainly through trade in goods, and in some cases, through remittances. Oil importers with GCC links will be more shielded, but will still feel indirect effects from lower activity in the GCC.
A global recession will primarily be felt through lower oil prices. This process has already started and oil prices have fallen 14 percent since their April peak.2 Growth in GCC economies will slow down and their fiscal and current accounts will weaken. For these countries oil exports account for more than 50 percent of GDP so a negative terms-of-trade shock will have sizable negative growth consequences. Growth in developing oil exporters will be reduced but to a lesser extent than growth in the GCC oil exporters as these economies have bigger nonoil sectors. Oil importers will benefit from the decline in oil prices and this will be reflected in improvement in their import bill.
The region has reduced its exposure to EU and US markets over the past decade and has increased exports to Asia. The share of non-oil merchandise exports from the region to Asia grew from 14 percent in 1998 to 25 percent in 2008. However, exposure to the EU remains significant for MENA’s oil importing countries. In 2008 roughly half of oil importers’ merchandise exports were sent to EU markets, compared to 65 percent in 1998 (World Bank, 2011a). A possible future slowdown in Europe and the US is expected to have a moderate effect on developing oil exporters as only about one-fifth of exports go the EU. GCC countries are the least exposed to EU and US markets, having sent less than 15 percent of nonoil merchandise exports to the EU and the US in 2008.
In addition to trade linkages, migration to the EU and the associated remittances are important in some of the North African countries. Morocco and Tunisia, especially, are much more dependent on the EU for their remittance flows than the rest of the oil importers. According to data for 2000, 72 percent of Morocco’s emigrants and 75 percent of Tunisia’s emigrants were located in the EU, compared to just 10 percent of Egypt’s.3 Remittances account for 9.5 and 5 percent of GDP in Morocco and Tunisia, respectively. Developing MENA countries which rely on remittances from the GCC might be somewhat shielded, but they too might feel the impact of second-round effects as a negative terms-of-trade effect in the GCC would imply fiscal contraction and therefore a decline in demand for foreign workers.
2 The change in oil prices refers to the period between April and August 2011. 3 Source: World Bank (2010).
MENA’s Macroeconomic Outlook
18
MENA countries’ financial sectors tend to be small and are relatively less integrated into the EU and global financial markets than other regions’ financial sectors. Indeed, a sizable share of capital flows in MENA countries is intra-regional, suggesting that the MENA economies have a buffer insulating them, to some degree, from turmoil in global markets (World Bank, 2011d). Within the MENA region, the GCC countries are the most integrated into global financial markets, and therefore a global downturn and financial turmoil in Europe could have a negative impact on financial markets and growth in the GCC economies. The GCC countries also face wealth effects through sovereign wealth funds. Nonetheless, compared with Asia, their funds are relatively diversified, with roughly one third each in the US, the EU, and emerging markets.4
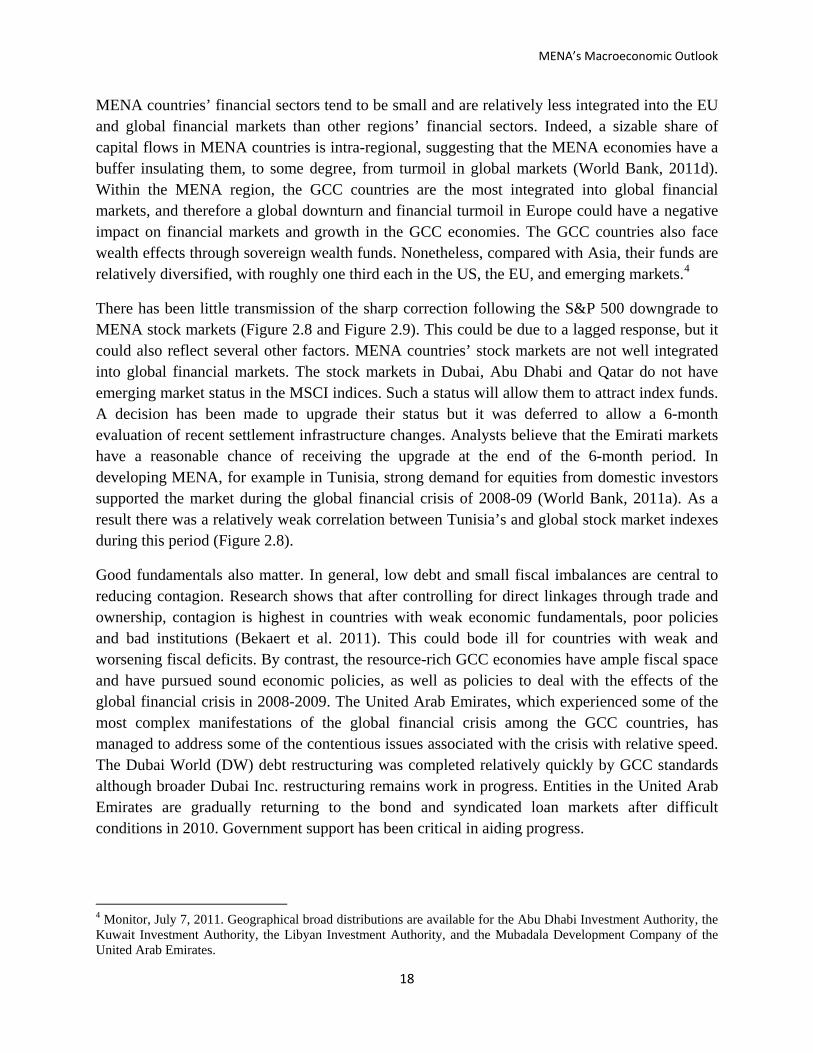
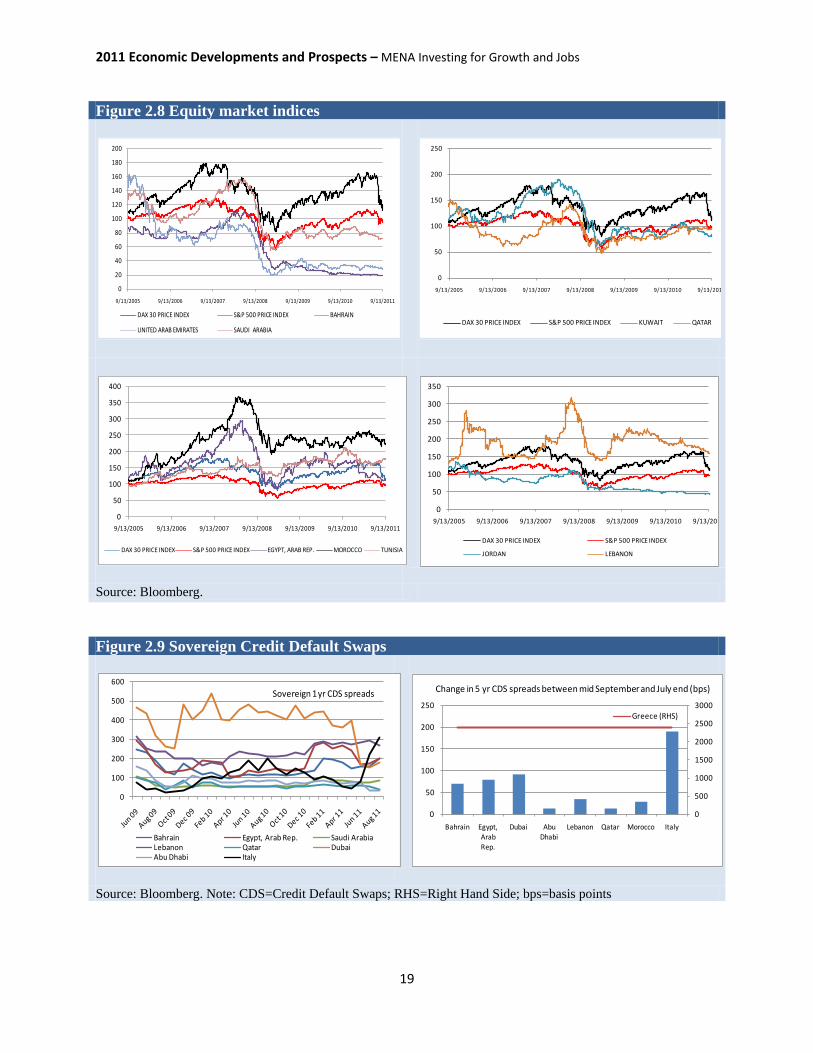
There has been little transmission of the sharp correction following the S&P 500 downgrade to MENA stock markets (Figure 2.8 and Figure 2.9). This could be due to a lagged response, but it could also reflect several other factors. MENA countries’ stock markets are not well integrated into global financial markets. The stock markets in Dubai, Abu Dhabi and Qatar do not have emerging market status in the MSCI indices. Such a status will allow them to attract index funds. A decision has been made to upgrade their status but it was deferred to allow a 6-month evaluation of recent settlement infrastructure changes. Analysts believe that the Emirati markets have a reasonable chance of receiving the upgrade at the end of the 6-month period. In developing MENA, for example in Tunisia, strong demand for equities from domestic investors supported the market during the global financial crisis of 2008-09 (World Bank, 2011a). As a result there was a relatively weak correlation between Tunisia’s and global stock market indexes during this period (Figure 2.8).
Good fundamentals also matter. In general, low debt and small fiscal imbalances are central to reducing contagion. Research shows that after controlling for direct linkages through trade and ownership, contagion is highest in countries with weak economic fundamentals, poor policies and bad institutions (Bekaert et al. 2011). This could bode ill for countries with weak and worsening fiscal deficits. By contrast, the resource-rich GCC economies have ample fiscal space and have pursued sound economic policies, as well as policies to deal with the effects of the global financial crisis in 2008-2009. The United Arab Emirates, which experienced some of the most complex manifestations of the global financial crisis among the GCC countries, has managed to address some of the contentious issues associated with the crisis with relative speed. The Dubai World (DW) debt restructuring was completed relatively quickly by GCC standards although broader Dubai Inc. restructuring remains work in progress. Entities in the United Arab Emirates are gradually returning to the bond and syndicated loan markets after difficult conditions in 2010. Government support has been critical in aiding progress.
4 Monitor, July 7, 2011. Geographical broad distributions are available for the Abu Dhabi Investment Authority, the Kuwait Investment Authority, the Libyan Investment Authority, and the Mubadala Development Company of the United Arab Emirates.
2011 Economic Developments and Prospects – MENA Investing for Growth and Jobs
19
Figure 2.8 Equity market indices
Source: Bloomberg.
Figure 2.9 Sovereign Credit Default Swaps
Source: Bloomberg. Note: CDS=Credit Default Swaps; RHS=Right Hand Side; bps=basis points
0
20
40
60
80
100
120
140
160
180
200
9/13/2005 9/13/2006 9/13/2007 9/13/2008 9/13/2009 9/13/2010 9/13/2011
DAX 30 PRICE INDEX S&P 500 PRICE INDEX BAHRAIN
UNITED ARAB EMIRATES SAUDI ARABIA
0
50
100
150
200
250
9/13/2005 9/13/2006 9/13/2007 9/13/2008 9/13/2009 9/13/2010 9/13/201
DAX 30 PRICE INDEX S&P 500 PRICE INDEX KUWAIT QATAR
0
50
100
150
200
250
300
350
400
9/13/2005 9/13/2006 9/13/2007 9/13/2008 9/13/2009 9/13/2010 9/13/2011
DAX 30 PRICE INDEX S&P 500 PRICE INDEX EGYPT, ARAB REP. MOROCCO TUNISIA
0
50
100
150
200
250
300
350
9/13/2005 9/13/2006 9/13/2007 9/13/2008 9/13/2009 9/13/2010 9/13/201
DAX 30 PRICE INDEX S&P 500 PRICE INDEX
JORDAN LEBANON
0
100
200
300
400
500
600
Bahrain Egypt, Arab Rep. Saudi ArabiaLebanon Qatar DubaiAbu Dhabi Italy
Sovereign 1 yr CDS spreads
0
500
1000
1500
2000
2500
3000
0
50
100
150
200
250
Bahrain Egypt, Arab Rep.
Dubai Abu Dhabi
Lebanon Qatar Morocco Italy
Greece (RHS)
Change in 5 yr CDS spreads between mid September and July end (bps)

MENA’s Macroeconomic Outlook
20
The MENA countries are shielded from some of the concerns plaguing other emerging markets. Weakness in both the US and the EU has led to appreciation and overvaluation in a number of emerging markets with strong fundamentals and flexible exchange rates, especially in Latin America. In Brazil, for example, concerns over appreciation have led to the implementation of new capital controls. This is not an issue in the region, largely because exchange rates are tied to the dollar or a dollar-Euro composite.
A recent concern in countries with a dollar peg, however, is imported inflation. While pegs are employed precisely to avoid inflation, US weakness and loose monetary policy in the current environment means dollar pegs may now transmit inflation. In recent months, inflation has picked up in the oil exporters (Figure 2.6) and is running at well above 10 percent in the developing oil exporters. There is a risk that the current strong fiscal stimulus combined with a weaker dollar will enhance inflationary pressures in these countries. Imported inflation is less of a risk in oil importers which face a lower oil price (and hence also food prices) and where economic activity has slowed considerably.
Debt service will be little affected in the short run. To the extent that external debt is denominated in dollars (Euro), there is little immediate gain to the MENA countries from dollar (Euro) depreciation for countries pegged to that currency. As prices adjust, existing debt could become easier to service. For Egypt and Tunisia, about 40 percent of debt is in dollars and 30 percent is in Euros.5
In sum, the forecast has changed little for the region since May, but uncertainty has increased, largely as a result of global conditions. While the elevated regional uncertainty remains roughly unchanged, global risk expanded sharply during this period. This puts more emphasis on the downward risk to the forecast, as a global downturn would exacerbate the balance of payments weaknesses already present in the region. Those countries in transition are also among those most affected by Eurozone weakness.
5 Source: Central Bank of Egypt, External Position of the Egyptian Economy 2010/2011 and World Bank data.
2011 Economic Developments and Prospects – MENA Investing for Growth and Jobs
21
INVESTING FOR GROWTH
MENA’s investment record
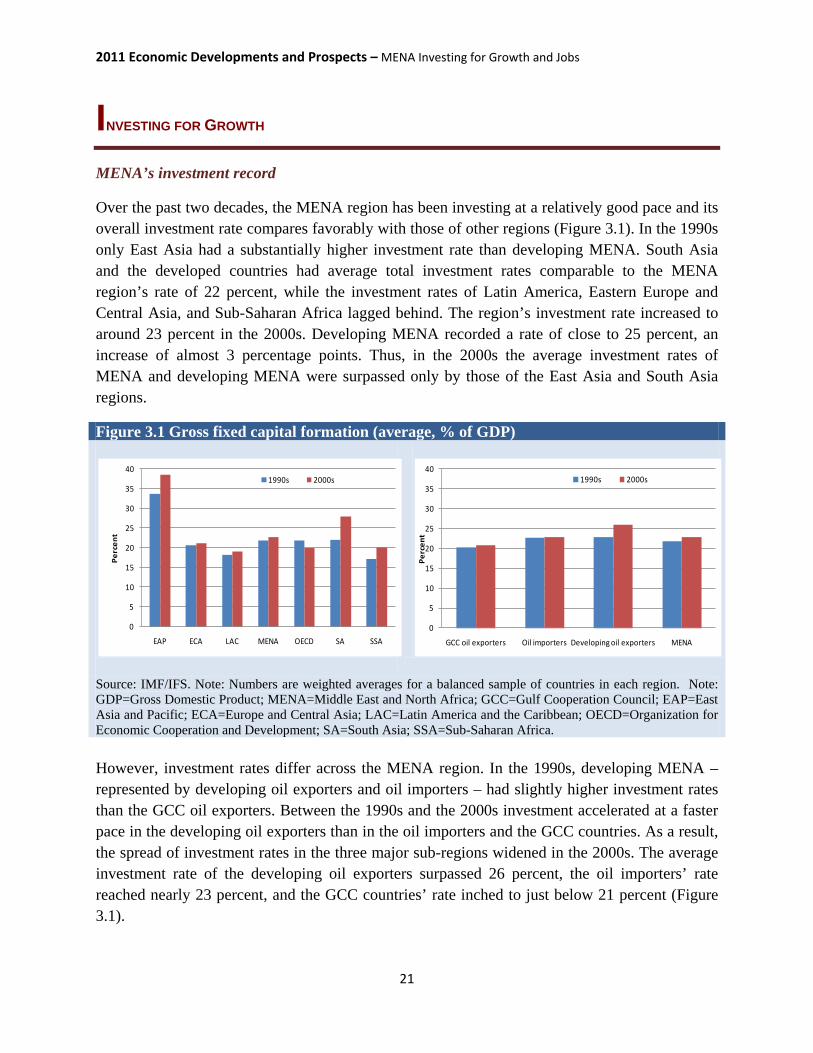
Over the past two decades, the MENA region has been investing at a relatively good pace and its overall investment rate compares favorably with those of other regions (Figure 3.1). In the 1990s only East Asia had a substantially higher investment rate than developing MENA. South Asia and the developed countries had average total investment rates comparable to the MENA region’s rate of 22 percent, while the investment rates of Latin America, Eastern Europe and Central Asia, and Sub-Saharan Africa lagged behind. The region’s investment rate increased to around 23 percent in the 2000s. Developing MENA recorded a rate of close to 25 percent, an increase of almost 3 percentage points. Thus, in the 2000s the average investment rates of MENA and developing MENA were surpassed only by those of the East Asia and South Asia regions.
Figure 3.1 Gross fixed capital formation (average, % of GDP)
Source: IMF/IFS. Note: Numbers are weighted averages for a balanced sample of countries in each region. Note: GDP=Gross Domestic Product; MENA=Middle East and North Africa; GCC=Gulf Cooperation Council; EAP=East Asia and Pacific; ECA=Europe and Central Asia; LAC=Latin America and the Caribbean; OECD=Organization for Economic Cooperation and Development; SA=South Asia; SSA=Sub-Saharan Africa. However, investment rates differ across the MENA region. In the 1990s, developing MENA – represented by developing oil exporters and oil importers – had slightly higher investment rates than the GCC oil exporters. Between the 1990s and the 2000s investment accelerated at a faster pace in the developing oil exporters than in the oil importers and the GCC countries. As a result, the spread of investment rates in the three major sub-regions widened in the 2000s. The average investment rate of the developing oil exporters surpassed 26 percent, the oil importers’ rate reached nearly 23 percent, and the GCC countries’ rate inched to just below 21 percent (Figure 3.1).
0
5
10
15
20
25
30
35
40
EAP ECA LAC MENA OECD SA SSA
Perc
ent
1990s 2000s
0
5
10
15
20
25
30
35
40
GCC oil exporters Oil importers Developing oil exporters MENA
Perc
ent
1990s 2000s
Investing for Growth
22
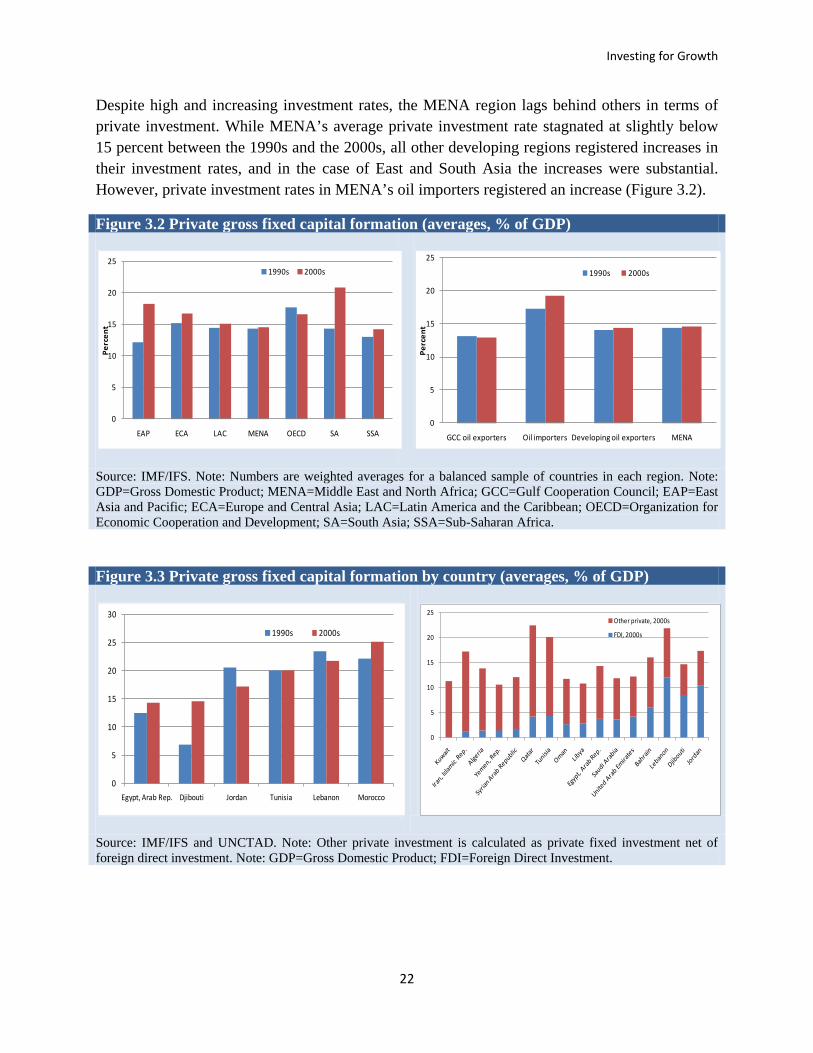
Despite high and increasing investment rates, the MENA region lags behind others in terms of private investment. While MENA’s average private investment rate stagnated at slightly below 15 percent between the 1990s and the 2000s, all other developing regions registered increases in their investment rates, and in the case of East and South Asia the increases were substantial. However, private investment rates in MENA’s oil importers registered an increase (Figure 3.2).
Figure 3.2 Private gross fixed capital formation (averages, % of GDP)
Source: IMF/IFS. Note: Numbers are weighted averages for a balanced sample of countries in each region. Note: GDP=Gross Domestic Product; MENA=Middle East and North Africa; GCC=Gulf Cooperation Council; EAP=East Asia and Pacific; ECA=Europe and Central Asia; LAC=Latin America and the Caribbean; OECD=Organization for Economic Cooperation and Development; SA=South Asia; SSA=Sub-Saharan Africa.
0
5
10
15
20
25
EAP ECA LAC MENA OECD SA SSA
Perc
ent
1990s 2000s
0
5
10
15
20
25
GCC oil exporters Oil importers Developing oil exporters MENA
Perc
ent
1990s 2000s
Figure 3.3 Private gross fixed capital formation by country (averages, % of GDP)
Source: IMF/IFS and UNCTAD. Note: Other private investment is calculated as private fixed investment net of foreign direct investment. Note: GDP=Gross Domestic Product; FDI=Foreign Direct Investment.
0
5
10
15
20
25
30
Egypt, Arab Rep. Djibouti Jordan Tunisia Lebanon Morocco
1990s 2000s
0
5
10
15
20
25Other private, 2000s
FDI, 2000s

2011 Economic Developments and Prospects – MENA Investing for Growth and Jobs
23
In the 1990s private investment rates were considerably higher in MENA’s oil importers than in the rest of MENA. At slightly more than 17 percent, the private investment rates of the oil importers were even higher than those of other developing regions in this decade. Reforms encouraged private investment in some of the oil importers in the 2000s, pushing the average private investment rate during the decade to just above 19 percent (Figure 3.2). Several countries have been particularly successful in enhancing private sector investment in the 2000s, including Egypt, Morocco and Djibouti (Figure 3.3).
In many MENA countries foreign direct investment (FDI) increased markedly between the 1990s and the 2000s (Figure 3.4). The FDI takeoff in the region was apparent after 2002, and in most cases increases in FDI flows happened from a low base. In the oil importers with strong GCC links – Djibouti, Lebanon and Jordan – foreign direct investment has increased so much that it represents a major share of private investment (Figure 3.3).
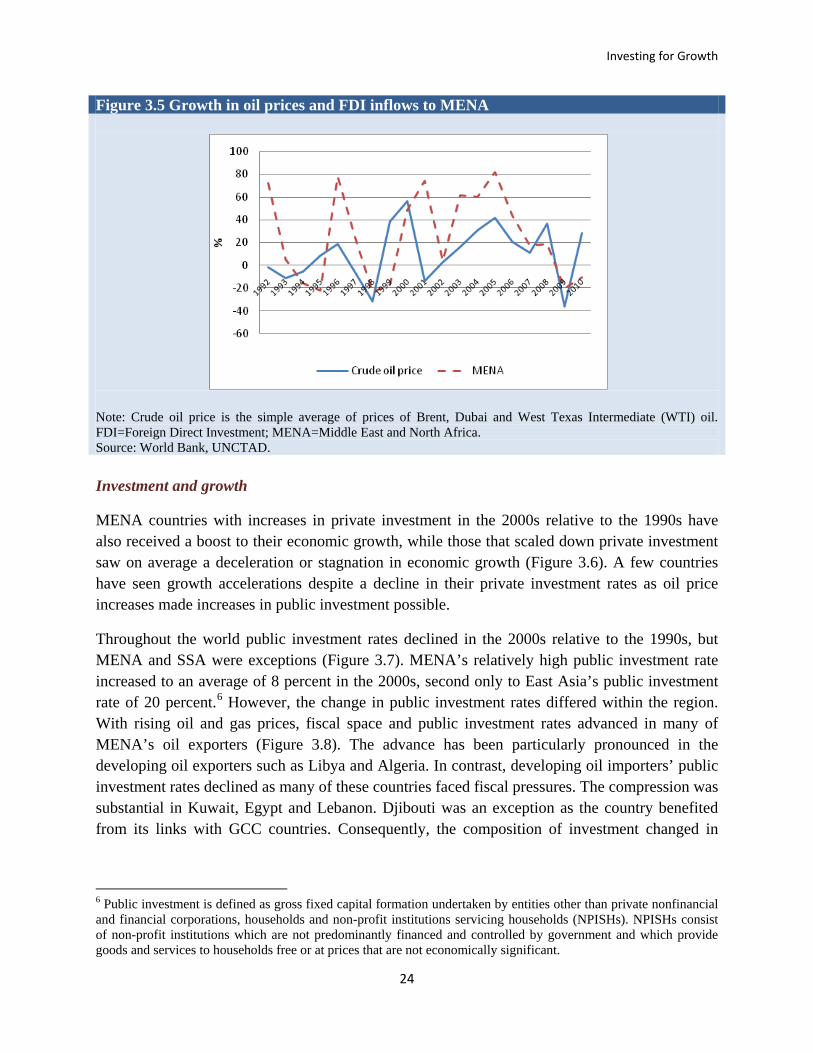
However, most FDI has gone to the rich GCC countries, accounting for 56 percent of inflows to MENA during 2003-2007. Developing oil importers received 30 percent of the region’s FDI inflows during the same period. Furthermore, FDI flows have been concentrated in three countries – Saudi Arabia and the United Arab Emirates, which received respectively 23 percent and 22 percent of all MENA FDI inflows, and Egypt, which attracted 12.3 percent during this period. There has been a shift in the destination of FDI from MENA’s oil importers which received over half of all MENA FDI during 1993-1997 to MENA’s oil exporters which received 70 percent of all MENA FDI during 2003-2007. The shift towards oil exporters is not surprising given the rising oil prices during most of the 2000s. There is a strong positive relationship between the growth in oil prices and growth of MENA FDI (Figure 3.5). High oil prices make oil exploration more attractive and thus attract FDI into the fuel sector. Other factors that stimulated the rise of foreign investment in the MENA region were excess liquidity in global financial markets, reforms in the business environments and the launch of privatization initiatives.
Figure 3.4 Foreign and other investment (averages, % of GDP)
Source: UNCTAD. Note: GDP=Gross Domestic Product; FDI=Foreign Direct Investment; MENA=Middle East and North Africa; EAP=East Asia and Pacific; ECA=Europe and Central Asia; LAC=Latin America and the Caribbean; SAS=South Asia; SSA=Sub-Saharan Africa.
-2
0
2
4
6
8
10
12
14FDI, 1990s FDI, 2000s
Investing for Growth
24
Figure 3.5 Growth in oil prices and FDI inflows to MENA
Note: Crude oil price is the simple average of prices of Brent, Dubai and West Texas Intermediate (WTI) oil. FDI=Foreign Direct Investment; MENA=Middle East and North Africa. Source: World Bank, UNCTAD. Investment and growth
MENA countries with increases in private investment in the 2000s relative to the 1990s have also received a boost to their economic growth, while those that scaled down private investment saw on average a deceleration or stagnation in economic growth (Figure 3.6). A few countries have seen growth accelerations despite a decline in their private investment rates as oil price increases made increases in public investment possible.
Throughout the world public investment rates declined in the 2000s relative to the 1990s, but MENA and SSA were exceptions (Figure 3.7). MENA’s relatively high public investment rate increased to an average of 8 percent in the 2000s, second only to East Asia’s public investment rate of 20 percent.6 However, the change in public investment rates differed within the region. With rising oil and gas prices, fiscal space and public investment rates advanced in many of MENA’s oil exporters (Figure 3.8). The advance has been particularly pronounced in the developing oil exporters such as Libya and Algeria. In contrast, developing oil importers’ public investment rates declined as many of these countries faced fiscal pressures. The compression was substantial in Kuwait, Egypt and Lebanon. Djibouti was an exception as the country benefited from its links with GCC countries. Consequently, the composition of investment changed in
6 Public investment is defined as gross fixed capital formation undertaken by entities other than private nonfinancial and financial corporations, households and non-profit institutions servicing households (NPISHs). NPISHs consist of non-profit institutions which are not predominantly financed and controlled by government and which provide goods and services to households free or at prices that are not economically significant.

2011 Economic Developments and Prospects – MENA Investing for Growth and Jobs
25
favor of private investment in oil importers and towards public investment in oil exporters (Figure 3.9).
Figure 3.6 Changes in average private investment and GDP growth rates in MENA
Source: IMF/IFS on private investment and WDI for GDP. Note: MENA=Middle East and North Africa; GDP=Gross Domestic Product.
Figure 3.7 Public gross fixed capital formation (averages, % of GDP)
Source: Authors’ calculations using IMF/IFS. Note: Numbers are weighted averages for a balanced sample of countries in each region. Note: GDP=Gross Domestic Product; MENA=Middle East and North Africa; GCC=Gulf Cooperation Council; EAP=East Asia and Pacific; ECA=Europe and Central Asia; LAC=Latin America and the Caribbean; OECD=Organization for Economic Cooperation and Development; SA=South Asia; SSA=Sub-Saharan Africa.
Should the dominant role of public investment in MENA be a cause for concern?
The literature suggests that the impact of public investment on economic growth is ambiguous as public investment might crowd out or crowd in private investment. If crowding out is an issue,
y = 0.3263x + 1.0602R² = 0.3212
-4
-2
0
2
4
6
8
-6 -4 -2 0 2 4 6 8 10
Chan
ge in
mea
n gr
owth
bet
wee
n 19
90s
and
2000
s
Change in mean private investment rates between 1990s and 2000s
Qatar Djibouti
Libya
Bahrain
Oman
Morocco
Egypt, Arab Rep.Iran, Islamic Rep.
Syrian ArabRepublic
Tunisia
Lebanon
Saudi ArabiaKuwait
Algeria
Jordan
United Arab Emirates
Yemen, Rep.
0
5
10
15
20
25
EAP ECA LAC MENA OECD SA SSA
Perc
ent
1990s 2000s
0
5
10
15
20
25
GCC oil exporters Oil importers Developing oil exporters MENA
Perc
ent
1990s 2000s
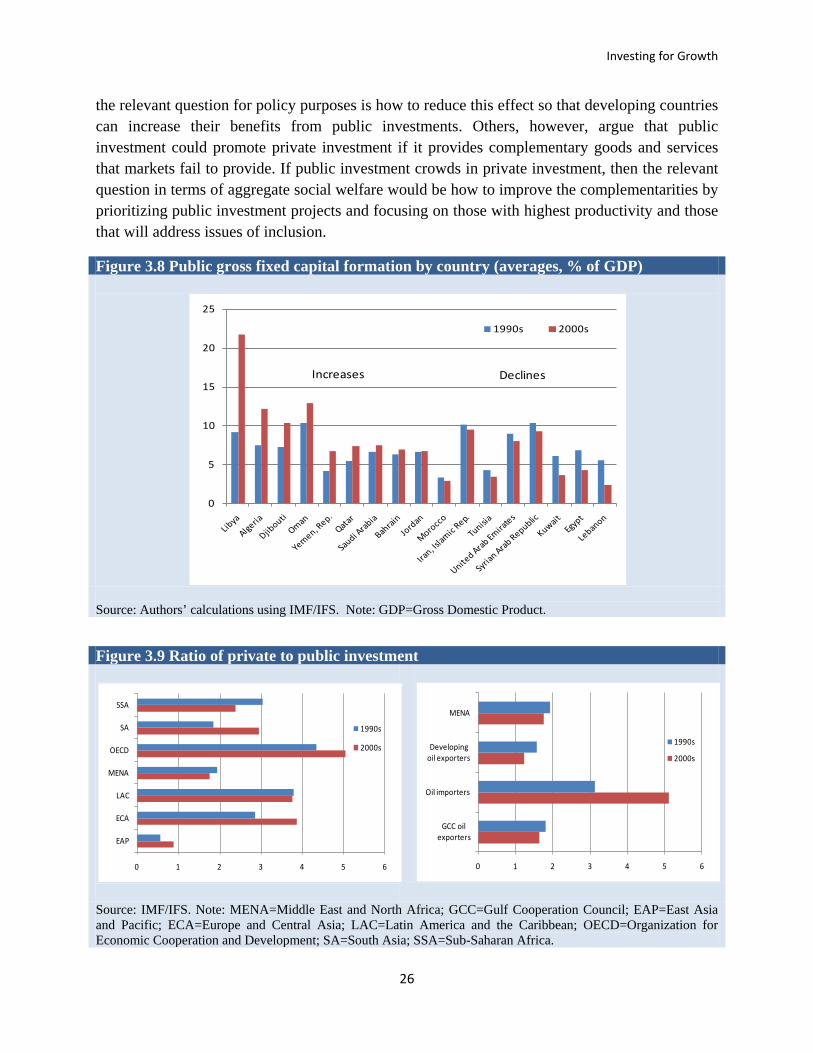
Investing for Growth
26
the relevant question for policy purposes is how to reduce this effect so that developing countries can increase their benefits from public investments. Others, however, argue that public investment could promote private investment if it provides complementary goods and services that markets fail to provide. If public investment crowds in private investment, then the relevant question in terms of aggregate social welfare would be how to improve the complementarities by prioritizing public investment projects and focusing on those with highest productivity and those that will address issues of inclusion.
Figure 3.8 Public gross fixed capital formation by country (averages, % of GDP)
Source: Authors’ calculations using IMF/IFS. Note: GDP=Gross Domestic Product.
Figure 3.9 Ratio of private to public investment
Source: IMF/IFS. Note: MENA=Middle East and North Africa; GCC=Gulf Cooperation Council; EAP=East Asia and Pacific; ECA=Europe and Central Asia; LAC=Latin America and the Caribbean; OECD=Organization for Economic Cooperation and Development; SA=South Asia; SSA=Sub-Saharan Africa.
0
5
10
15
20
25
1990s 2000s
DeclinesIncreases
0 1 2 3 4 5 6
EAP
ECA
LAC
MENA
OECD
SA
SSA
1990s
2000s
0 1 2 3 4 5 6
GCC oil exporters
Oil importers
Developing oil exporters
MENA
1990s
2000s
2011 Economic Developments and Prospects – MENA Investing for Growth and Jobs
27
Another concern is that public investment might be less efficient than private investment. This is likely to be especially relevant in economies characterized by a high level of rent-seeking behavior and where special interests dominate. In particular, under these circumstances, a large share of public funds may be spent on low-productivity projects or bloated budgets. If this is the case, an increase in (measured) public investment would contribute less to growth than an equivalent amount of private investment. Thus, a third issue – a combination of the first two – is about the role of public investment versus private investment in growth.
A large body of literature has examined the effect of public expenditure on medium- to long-term growth. The results are mixed, but the majority of papers that use regressions on large cross-sections of countries find some evidence of positive growth effects, especially for infrastructure (see IMF 2004 for a survey). A handful of studies that employ VAR techniques on developed countries are similar, overall offering some evidence of a causal effect of public investment on output.
A related body of literature examines the relationship between public and private investment. Cavallo and Daude (2011) analyze the linkages between public and private investment using a large sample of 116 developing countries with annual observations between 1980 and 2006. Their empirical results – obtained using dynamic panel data techniques which exploit both time series and cross sectional variation in the data – suggest that, on average, the crowding-out effect dominates, but that this effect is dampened or even reversed in countries with better institutions and that are better integrated with world markets so that there is no financing constraint. Blejer and Khan (1984)7 and Odedokun (1997)8 show that public infrastructure investment is complementary to private investment, while other types of public investment lead to crowding out of private investment. Some studies report evidence on the effect of government expenditure on investment efficiency as proxied by the incremental capital-output ratio. Gallagher (1991)9 and King and Levine (1992)10 report a negative effect of government expenditure on investment efficiency. Odedokun (1997) finds that public infrastructure investment promotes efficiency, while other types of public investment do the reverse.
To examine the likely effects of public investment in MENA, we show correlations between per capita growth and public investment rates for countries with a strong rule of law and those with a weak rule of law. We use the governance indicator for rule of law in Kaufmann, Kraay, and Mastruzzi (2010) averaged over the 2000s. Countries with a strong rule of law are defined to be those with an index above the median of the country sample. Countries with a weak rule of law are those with an index below the median of the country sample. During the 2000s all the GCC countries and four oil importers – Morocco, Tunisia, Egypt and Jordan – fall into the category of
7 Blejer and Khan (1984) use a sample of 24 developing countries over the period 1971-1979. 8 Odedokun (1997) uses the approach proposed by Blejer and Khan (1984) but applies it to a larger sample of 48 developing countries over the period 1970-90. 9 Gallagher (1991) uses a cross-section of African countries. 10 King and Levine (1992) employ annual time-series data for the period 1960-1989 for 80 developing countries.

Investing for Growth
28
countries with a relatively strong rule of law, while all MENA developing oil exporters are considered countries with a weak rule of law.
For countries with a strong rule of law, we find a positive and significant correlation between public investment and growth (Figure 3.10).11 For countries with a weak rule of law, we find no correlation between public investment and growth (Figure 3.10). In these countries poor governance weakens the impact of public investment on growth. Since the 2000s was a period of extra-ordinary economic fluctuations, we tested the relationship between public investment and growth over the period 1995-2005. We find that the same conclusion can be drawn based on the relationship between public investment and growth over the 1995-2005 period, as shown in the figures below (see Appendix Figure 1).
Figure 3.10 Annual per capita GDP growth and public investment, 2000-05
Source: Authors’ estimates. Note: t-statistics in parenthesis below trend equation. GDP=Gross Domestic Product. These results suggest that in developing oil exporters which represent countries with a weak rule of law and relatively small private sectors, the growth impact of public investment is likely to be weakened (Figure 3.10) and investment efficiency is likely to be relatively low. In oil importers which rely mostly on private investment for growth, public investment is likely to encourage private investment and reinforce the positive relation observed between private investment and growth.
This result builds on the growing literature signalling the need for complementary reforms to stimulate growth. Freund and Bolaky (2008) show that trade does not promote growth when business conditions are poor. The intuition is that resources cannot move to their most productive uses, subsequent to trade liberalization, when firm entry is restricted and labor mobility is poor. Similarly, in the case of public investment, a lack of accountability means that
11 This section discusses public investment, but does not analyze sources of investment finance and public spending issues such as investments in human capital. These issues are beyond the scope of this report.
y = 0.2074x + 1.1709(2.21) (2.08)
R² = 0.0766
-2
-1
0
1
2
3
4
5
6
7
8
9
0 2 4 6 8 10 12 14
GD
P p
er
cap
it g
row
th r
ate,
%, 2
006
-09
Public investment % of GDP, 2000-05
Countries with good rule of lawy = -0.0361x + 3.3069
(-.43) (5.05)R² = 0.0023
-10
-5
0
5
10
15
20
0 5 10 15 20 25
GD
P p
er
cap
ita
grow
th r
ate,
%, 2
006
-09
Public investment % of GDP, 2000-05
Countries with weak rule of law

2011 Economic Developments and Prospects – MENA Investing for Growth and Jobs
29
public investment may flow to low-return projects and is more likely to crowd out private investment. Moreover, weak governance is a double blow to investment, as private investment requires protection of property rights and transparency in legal administration.
This report next examines the efficiency of investment using incremental capital output ratios (ICORs).12
Investment efficiency in MENA
Investment efficiency improved in all three MENA groups and was much higher in the oil importers and the GCC economies than in the developing oil exporters in the 2000s (Figure 3.11). Weak governance and a host of other policies13 have hurt private returns and growth in developing oil exporters, thus discouraging private investment, while public investment has grown but its impact on growth has been weakened. Libya, the Islamic Republic of Iran and Algeria stand out as the developing oil exporters with the least efficient investments in the 2000s (Figure 3.11). MENA oil importers and GCC oil exporters used investment more efficiently than the developing oil exporters (Figure 3.11). These countries have a stronger rule of law than the developing oil exporters, suggesting that they have a better environment for investment and growth. The GCC oil exporters compare favorably with other emerging economies in terms of investment efficiency in the 2000s, while oil importers as a group compare favorably with Turkey, Malaysia and Brazil, but not China and India. By contrast, developing oil exporters are far behind successful emerging economies in efficient use of investment (Figure 3.11).
Figure 3.11 Investment efficiency in MENA region (average ICORs for the 2000s)
Source: Calculations of ICORs using IFS/IMF data on fixed capital formation and GDP. Note: (i) A higher ICOR implies less efficiency. Average ICORs are computed as the ratio of the average investment rates for the period 2000-2004 to average GDP growth for the period 2005-2009. (ii) ICOR=Incremental Capital Output Ratios; MENA=Middle East and North Africa; GCC=Gulf Cooperation Council. 12 ICORs are defined as the ratio between investment in previous periods and the growth in output in the subsequent periods. 13 World Bank (2011) provides a discussion of problems constraining growth.
0
2
4
6
8
10
12
Average MENA
0
1
2
3
4
5
6
7
8
Developing oil exporters
Turkey Malaysia Brazil Oil importers
GCC oil exporters
China India
Average MENA
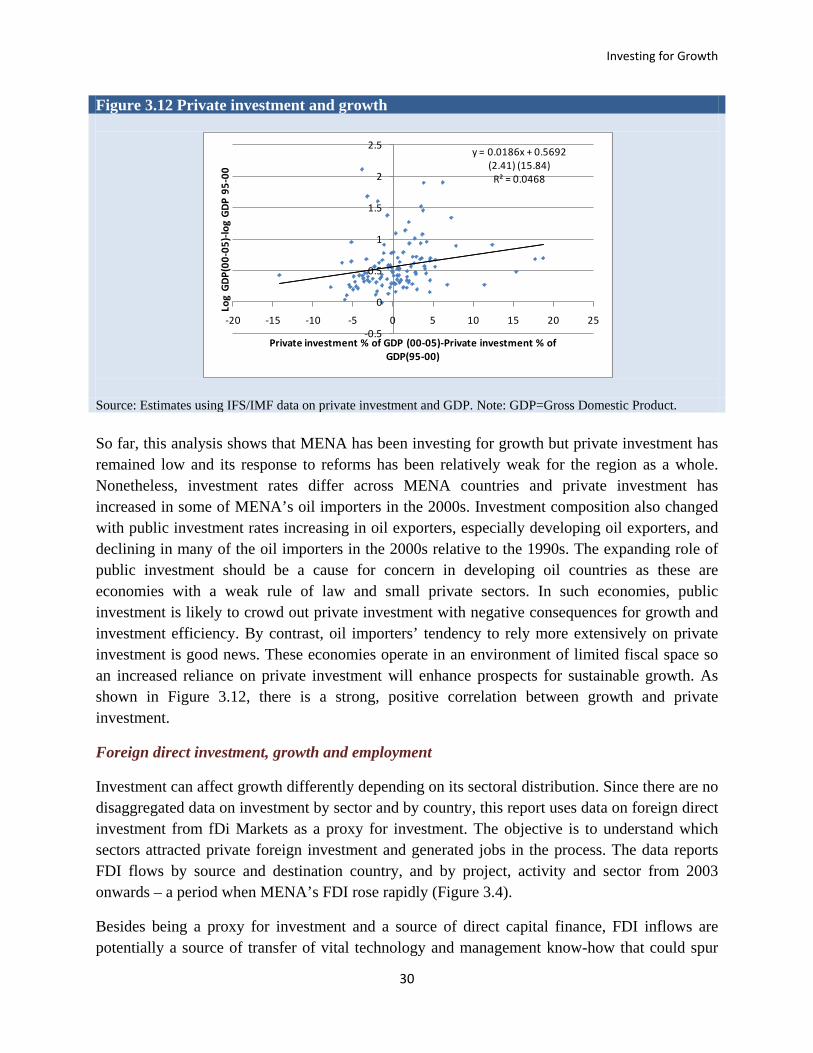
Investing for Growth
30
Figure 3.12 Private investment and growth
Source: Estimates using IFS/IMF data on private investment and GDP. Note: GDP=Gross Domestic Product. So far, this analysis shows that MENA has been investing for growth but private investment has remained low and its response to reforms has been relatively weak for the region as a whole. Nonetheless, investment rates differ across MENA countries and private investment has increased in some of MENA’s oil importers in the 2000s. Investment composition also changed with public investment rates increasing in oil exporters, especially developing oil exporters, and declining in many of the oil importers in the 2000s relative to the 1990s. The expanding role of public investment should be a cause for concern in developing oil countries as these are economies with a weak rule of law and small private sectors. In such economies, public investment is likely to crowd out private investment with negative consequences for growth and investment efficiency. By contrast, oil importers’ tendency to rely more extensively on private investment is good news. These economies operate in an environment of limited fiscal space so an increased reliance on private investment will enhance prospects for sustainable growth. As shown in Figure 3.12, there is a strong, positive correlation between growth and private investment.
Foreign direct investment, growth and employment
Investment can affect growth differently depending on its sectoral distribution. Since there are no disaggregated data on investment by sector and by country, this report uses data on foreign direct investment from fDi Markets as a proxy for investment. The objective is to understand which sectors attracted private foreign investment and generated jobs in the process. The data reports FDI flows by source and destination country, and by project, activity and sector from 2003 onwards – a period when MENA’s FDI rose rapidly (Figure 3.4).
Besides being a proxy for investment and a source of direct capital finance, FDI inflows are potentially a source of transfer of vital technology and management know-how that could spur
y = 0.0186x + 0.5692(2.41) (15.84)
R² = 0.0468
-0.5
0
0.5
1
1.5
2
2.5
-20 -15 -10 -5 0 5 10 15 20 25
Log
GDP(
00-0
5)-lo
g GD
P 95
-00
Private investment % of GDP (00-05)-Private investment % of GDP(95-00)
2011 Economic Developments and Prospects – MENA Investing for Growth and Jobs
31
certain activities and allow a country to catch up technologically. Foreign firms tend to be larger, more productive and have better access to markets. Thus, they may be more successful than domestic firms in creating jobs. By fostering links with domestic firms, FDI has the potential to have spillover benefits to other firms within and outside the sector which receives foreign investment.
The literature, however, suggests that the relationship between FDI, growth, and employment is not stable.14 The implications of FDI for productivity growth and employment depend on the particular sector and industry receiving FDI, the impact on employment in competing domestic firms, the nature of FDI, and the scope for spillovers. The analysis presented here focuses on the distribution of FDI by sector and its job creation potential, and not on the net impact of FDI on aggregate economic growth and job creation.
This report employs fDi Markets data on FDI flows by country and sector drawing on FDI values and FDI-related jobs for 39 sectors during the period 2003-2011. For ease of exposition, the 39 sectors are aggregated into 5 sectors: mining, real estate, tourism, other services and manufacturing.15 Mining, also referred to in the text as fuels, represents coal, oil, natural gas and minerals. Real estate stands for real estate activities, building and construction materials. Tourism includes hotels, tourism, leisure, entertainment, and transportation services.16 Other services include communications, business services, financial services, software and IT services, healthcare, space and defense. Manufacturing includes the remaining sectors in the fDi Markets data.17
14 See Harrison and Rodriguez-Clare (2010) for a review. 15 Alternative aggregations suggest that business services, communication, construction, government services, transportation, high-tech activities receive negligible shares of FDI at the regional and sub-regional levels. Therefore, these sectors were aggregated with other services. 16 Transportation includes warehousing and storage. 17 These include food and tobacco, automotive OEM and components, non-automotive transport OEM, metals, consumer products, textiles, electronic components, industrial machinery, equipment and tools, consumer electronics, chemicals, business machines and equipment, semiconductors, engines and turbines, plastics, paper, printing and packaging, aerospace, alternative/renewable energy, rubber, pharmaceuticals beverages, wood products, ceramics and glass, medical devices, and biotechnology.

Investing for Growth
32
Figure 3.13 FDI inflows and FDI-related jobs in MENA by sector during 2003-1118
Source: fDi Markets data. Note: FDI=Foreign Direct Investment; MENA=Middle East and North Africa; GCC=Gulf Cooperation Council. Two sectors – real estate and fuels – attracted the majority of FDI in MENA in the period 2003-2011. Each of these sectors received close to a third of FDI inflows during the decade (see top left chart in Figure 3.13). Manufacturing and tourism also attracted FDI flows but the shares attributed to them are much smaller than those accruing to real estate and mining. In the GCC economies, real estate, fuels and manufacturing each attracted approximately one fourth of all FDI inflows received by these countries in the 2000s, while tourism attracted close to a fifth (see top right chart in Figure 3.13). Over the same period, the developing oil exporters’ fuels sector attracted close to half of all FDI inflows, while their real estate sector received a third of all FDI inflows. In oil importers, the real estate sector was the top FDI recipient accounting for half of all inflows, while the FDI shares of mining, manufacturing and tourism were between 10 and 15 percent.
FDI in manufacturing created most of the FDI-related jobs in the region in the 2000s. FDI in manufacturing created 55 percent of all FDI-related jobs. In particular, the labor-intensive food
18 The mining sector includes coal, oil and gas industries, including petroleum refining.
20%
30%
5%
33%
13%
55%
7%
19%
5%
14%
Manufacturing Mining Other Services Real Estate Tourism
FDI flows Jobs
0%
20%
40%
60%
80%
100%
120%
Developing oil exporters
GCC oil exporters Oil importers
FDI inflows by sector and by region
Manufacturing Mining Other Services Real Estate Tourism
31%
46%
23%19%
46%
36%
Developing oil exporters
GCC Developing Oil importers
FDI flows Employment
020000400006000080000
100000120000140000160000180000200000 Number of FDI-related jobs
GCC Oil exporters Oil importers

2011 Economic Developments and Prospects – MENA Investing for Growth and Jobs
33
processing, consumer products and textile industries accounted for the largest shares of FDI-related jobs created in MENA’s manufacturing sector during the period 2003-2011. By contrast, FDI in mining and real estate accounted for just 7 and 5 percent of all FDI-related jobs, respectively (see top left chart in Figure 3.13).
The beneficial role of manufacturing FDI for job creation is clear in all three regional sub-groups, with the developing oil exporters showing the smallest share of FDI-related jobs in manufacturing. Given that manufacturing accounts for just a fifth of all FDI inflows in the region, there is a scope for increasing manufacturing-related FDI inflows in the future, and thus boosting job creation in the region, not to mention other likely beneficial impacts including a boost to non-oil exports, access to new technology, and productivity gains.19
The GCC economies attracted nearly half of all FDI and gained nearly half of all FDI-related jobs (see bottom left chart in Figure 3.13). The countries which gained the highest number of FDI-related jobs are the United Arab Emirates (approximately 66 thousand) and Saudi Arabia (42 thousand) (Figure 3.14). Developing oil exporters attracted close to a third of all regional FDI inflows, but this FDI generated under a fifth of all FDI-related jobs in MENA (see bottom left chart of Figure 3.13). FDI inflows into developing oil exporters favored the oil and gas sector, and a relatively small share of FDI inflows was directed to manufacturing activities (see bottom right chart in Figure 3.13). Developing oil importers attracted FDI which had the highest payoff in terms of jobs. With less than a quarter of regional FDI, they generated nearly 40 percent of all MENA FDI-related jobs. They achieved this outcome largely because of FDI-linked jobs in manufacturing (see bottom charts in Figure 3.13). The oil importers with EU links, such as Egypt, Morocco and Tunisia benefited the most (Figure 3.14).
This section showed that, while the majority of FDI goes to real estate and fuels, the majority of FDI-related jobs are generated in the manufacturing sector. In the 2000s manufacturing received just around one fifth of all regional FDI inflows but created 55 percent of all FDI-related jobs, so there is scope for improvement and potential for manufacturing FDI to play a much larger role in job creation in the region. Private services other than tourism also have the potential to contribute to job creation. In the 2000s, these sectors received only 5 percent of FDI inflows, but these inflows created almost a fifth of all FDI-related jobs in the region. The next section looks at the employment intensity of growth in the MENA countries and the drivers of value added and employment growth in the 2000s.
19 These results are indicative only. They are not derived based on the estimation of a full model with sectoral determinants of employment and foreign capital. Additionally, data issues arise because FDI inflows data may refer to commitments as opposed to actual flows. Further, employment data refer to actual or estimated job creation associated with the FDI inflow, and do not reflect any job losses in already existing firms, as well as positive job spillovers into sectors other than the sector receiving the capital inflows.

Investing for Growth
34
Figure 3.14 FDI-related jobs by country during 2003-11
Source: fDi Markets data. Note: FDI=Foreign Direct Investment. In sum, this chapter finds that investment has been disproportionately tilted towards public investment in oil exporters and that it is not growth-enhancing without good governance. We also saw that investment efficiency has been low in precisely those countries that rely excessively on public investment. Finally, FDI has predominantly gone to just 3 countries, and its job-creating potential has been highest in manufacturing.
19198
27211
359
39019
9648 11747
20918
136871164511260
37943
1861
24595
42418
13327
26901
65933
6357
0
10000
20000
30000
40000
50000
60000
70000
2011 Economic Developments and Prospects – MENA Investing for Growth and Jobs
35
GROWTH AND JOB CREATION
One of the MENA region’s key and long-lasting concerns has been job creation. A study by the World Bank (2004) conducted in the early 2000s argued that the region would need to create about 6 million new jobs each year over the next two decades in order to absorb new labor market entrants and bring down unemployment, especially among youth. The region has been affected by a demographic bulge, which has led to a steep increase in the labor force. Furthermore, the MENA countries’ labor force participation rates, particularly for women, have been among the lowest in the world, and are expected to rise in coming decades. So far the record has been disappointing. In the 2000s, MENA created only 3.2 million jobs per year, considerably less than the estimated 6 to 7 million identified as needed by the region. Has MENA failed to create jobs because of insufficient growth or a low pace of job creation relative to growth?
Pace of job creation relative to growth
The region has been creating jobs at a higher pace than other parts of the world, as measured by the average of MENA countries’ employment-growth elasticities in the 2000s. These elasticities, discussed less frequently than other key labor market indicators, measure how total employment growth varies with growth in economic output (GDP). An elasticity of one implies that every single percentage point of GDP growth is associated with employment growth of one percentage point over a given period. There is no single accepted benchmark to which countries’ historical elasticities should be compared. The value of the elasticities depends on the rate of a country’s economic growth, amount of surplus labor and labor force growth rate, unemployment and labor force participation rates, level and growth rate of labor productivity, and the structure of production.
All other things being equal, countries with relatively high economic growth rates do not need as high employment-growth elasticities as countries with low economic growth rates. Countries with high labor force growth and low participation rates require higher employment elasticities than others. Consequently, MENA countries and other developing countries, where population and labor force growth rates are high, often require higher employment elasticities for a given economic growth rate than high-income economies, as the former typically have a surplus of labor. Countries with capital-intensive production structures are expected to have lower employment elasticities than countries with relatively labor-intensive production structures.
MENA’s employment-growth elasticity of 0.65 in the second half of the 2000s compares favorably with the employment-growth elasticities of nearly all regions (Figure 4.1, see also Annex Table 3). The elasticity has been especially high in the developing oil exporters and has averaged 0.91 during the same period. This finding is somewhat surprising given that oil exporters’ production is skewed toward capital-intensive industries because of the dominance of the oil sector. The oil sector accounts for nearly half of GCC countries’ GDP and approximately
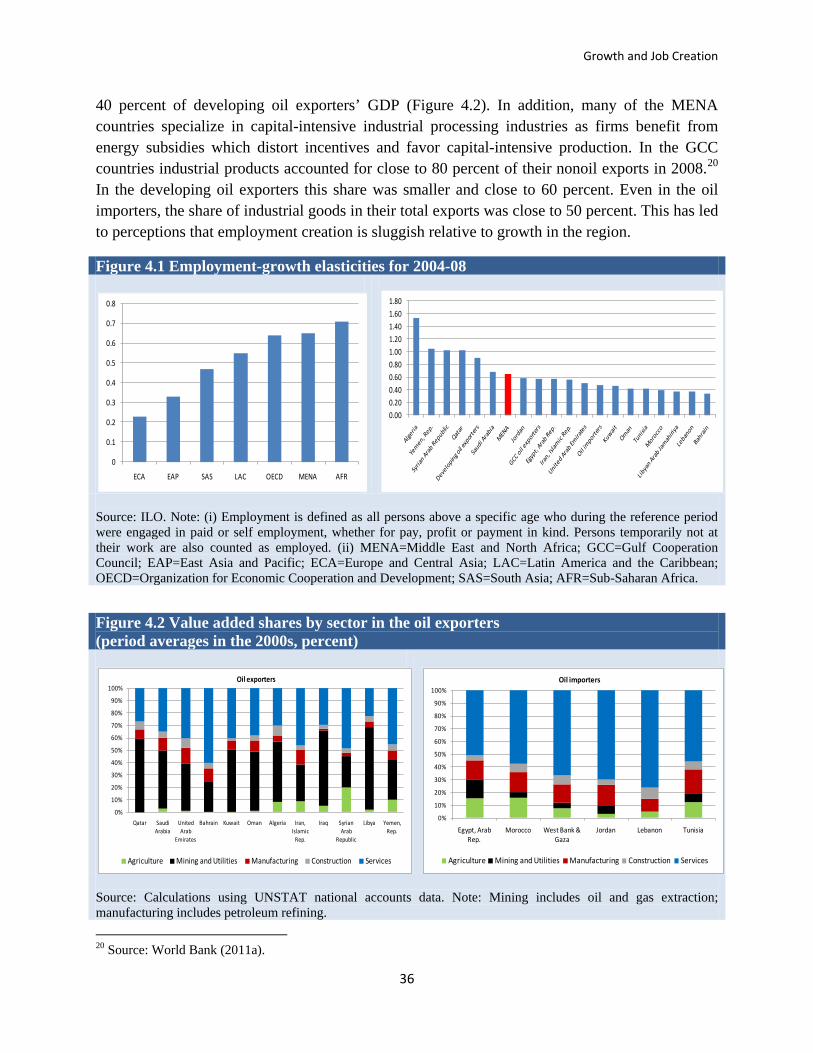
Growth and Job Creation
36
40 percent of developing oil exporters’ GDP (Figure 4.2). In addition, many of the MENA countries specialize in capital-intensive industrial processing industries as firms benefit from energy subsidies which distort incentives and favor capital-intensive production. In the GCC countries industrial products accounted for close to 80 percent of their nonoil exports in 2008.20 In the developing oil exporters this share was smaller and close to 60 percent. Even in the oil importers, the share of industrial goods in their total exports was close to 50 percent. This has led to perceptions that employment creation is sluggish relative to growth in the region.
Figure 4.1 Employment-growth elasticities for 2004-08
Source: ILO. Note: (i) Employment is defined as all persons above a specific age who during the reference period were engaged in paid or self employment, whether for pay, profit or payment in kind. Persons temporarily not at their work are also counted as employed. (ii) MENA=Middle East and North Africa; GCC=Gulf Cooperation Council; EAP=East Asia and Pacific; ECA=Europe and Central Asia; LAC=Latin America and the Caribbean; OECD=Organization for Economic Cooperation and Development; SAS=South Asia; AFR=Sub-Saharan Africa.
20 Source: World Bank (2011a).
0
0.1
0.2
0.3
0.4
0.5
0.6
0.7
0.8
ECA EAP SAS LAC OECD MENA AFR
0.000.200.400.600.801.001.201.401.601.80
Figure 4.2 Value added shares by sector in the oil exporters (period averages in the 2000s, percent)
Source: Calculations using UNSTAT national accounts data. Note: Mining includes oil and gas extraction; manufacturing includes petroleum refining.
0%
10%
20%
30%
40%
50%
60%
70%
80%
90%
100%
Qatar Saudi Arabia
United Arab
Emirates
Bahrain Kuwait Oman Algeria Iran, Islamic
Rep.
Iraq Syrian Arab
Republic
Libya Yemen, Rep.
Agriculture Mining and Utilities Manufacturing Construction Services
Oil exporters
0%
10%
20%
30%
40%
50%
60%
70%
80%
90%
100%
Egypt, Arab Rep.
Morocco West Bank & Gaza
Jordan Lebanon Tunisia
Agriculture Mining and Utilities Manufacturing Construction Services
Oil importers
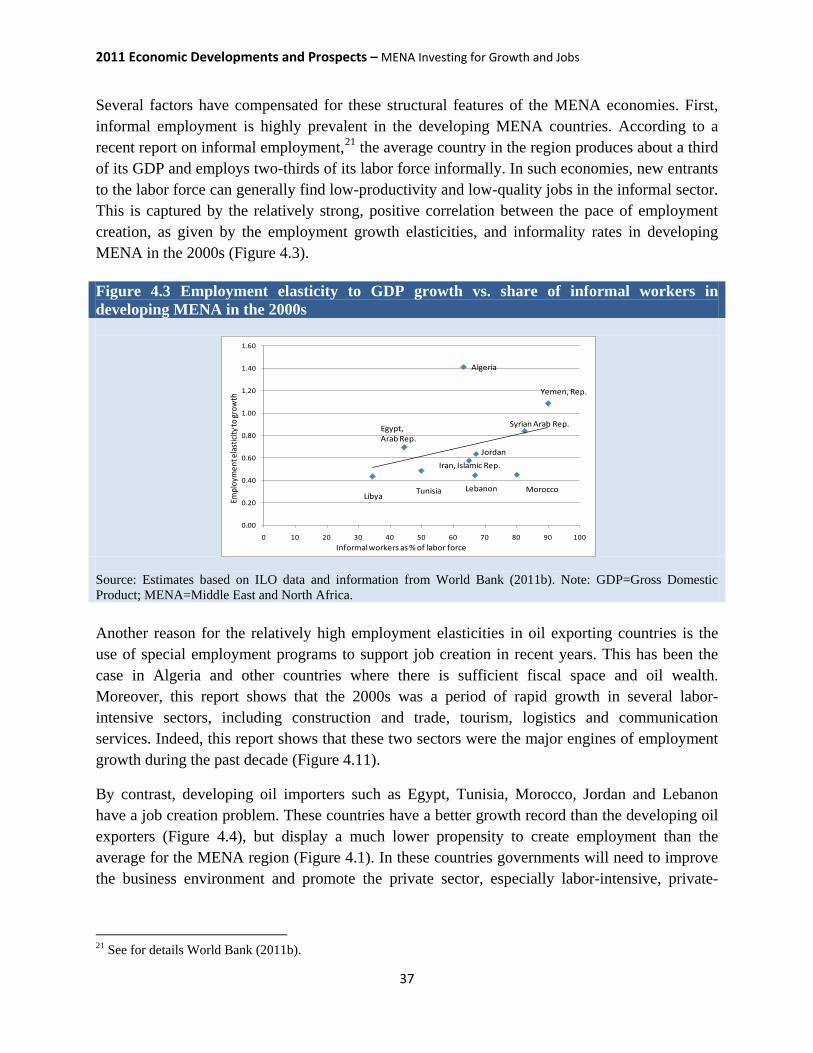
2011 Economic Developments and Prospects – MENA Investing for Growth and Jobs
37
Several factors have compensated for these structural features of the MENA economies. First, informal employment is highly prevalent in the developing MENA countries. According to a recent report on informal employment,21 the average country in the region produces about a third of its GDP and employs two-thirds of its labor force informally. In such economies, new entrants to the labor force can generally find low-productivity and low-quality jobs in the informal sector. This is captured by the relatively strong, positive correlation between the pace of employment creation, as given by the employment growth elasticities, and informality rates in developing MENA in the 2000s (Figure 4.3).
Another reason for the relatively high employment elasticities in oil exporting countries is the use of special employment programs to support job creation in recent years. This has been the case in Algeria and other countries where there is sufficient fiscal space and oil wealth. Moreover, this report shows that the 2000s was a period of rapid growth in several labor-intensive sectors, including construction and trade, tourism, logistics and communication services. Indeed, this report shows that these two sectors were the major engines of employment growth during the past decade (Figure 4.11).
By contrast, developing oil importers such as Egypt, Tunisia, Morocco, Jordan and Lebanon have a job creation problem. These countries have a better growth record than the developing oil exporters (Figure 4.4), but display a much lower propensity to create employment than the average for the MENA region (Figure 4.1). In these countries governments will need to improve the business environment and promote the private sector, especially labor-intensive, private-
21 See for details World Bank (2011b).
Figure 4.3 Employment elasticity to GDP growth vs. share of informal workers in developing MENA in the 2000s
Source: Estimates based on ILO data and information from World Bank (2011b). Note: GDP=Gross Domestic Product; MENA=Middle East and North Africa.
0.00
0.20
0.40
0.60
0.80
1.00
1.20
1.40
1.60
0 10 20 30 40 50 60 70 80 90 100
Algeria
Syrian Arab Rep.
Yemen, Rep.
MoroccoLebanon
JordanIran, Islamic Rep.
Egypt, Arab Rep.
TunisiaLibya
Informal workers as % of labor force
Empl
oym
ent e
lastic
ityto
grow
th

Growth and Job Creation
38
sector initiatives. Importantly, emphasis should be placed on the fair implementation of current regulations in order to level the playing field and encourage entrepreneurship.
Thus, in MENA’s oil exporting countries the main problem in terms of job is one of insufficient economic growth, while oil importers have a job creation problem. Recent simulation analysis22 suggests that economic growth will have to rise above the 4.8 percent achieved in the period 1999-200923 and average 6 percent per year over the next decades in order to address MENA’s job issue.24 The developing oil exporters in particular will need to grow faster than in the past in order to create the jobs required by a rapidly growing labor force.
In all MENA countries, poor job quality is a major challenge. Resolving this issue will require increasing access to opportunities to upgrade skills and improving the business environment so that all firms get a chance to compete and innovate. It will also involve redesigning pension systems, addressing regulatory barriers in labor markets, realigning pay and benefits packages in the public sector, and removing distortions biasing production towards capital-intensive activities. The Islamic Republic of Iran has already moved in this direction by cutting fuel subsidies and replacing them with targeted cash transfers to the poor. This reform is expected to encourage a switch to labor-intensive and energy-efficient production, and enable the economy to raise oil exports by consuming less oil domestically.
22 The analysis by Ianchovichina and Mottaghi (2011) assumes that employment response to growth will remain close to the one experienced during the past decade. 23 If growth and the employment response to growth remain close to the ones experienced during the past decade, the region is projected to add 4.8 million jobs per year during the period 2010-20. 24 An increase of the growth rate to 6 percent per annum translates to 6.7 million new jobs per year during the period 2010-20 or more than twice the number of new jobs added per year during the period 1999-2009.
Figure 4.4 Average GDP growth rates in developing MENA countries in the 2000s (percent)
Source: World Bank. Note: GDP=Gross Domestic Product; MENA=Middle East and North Africa.
0
1
2
3
4
5
6
7

2011 Economic Developments and Prospects – MENA Investing for Growth and Jobs
39
One potential issue with taking an elasticity approach is that employment elasticities only take into account information pertaining to historical employment and output growth. The past relationship may not be a good predictor of future trends. Employment elasticities at the country and even at the regional level can display considerable volatility from one period to the next.25 Finally, employment-growth elasticities do not provide information as to how other variables influence employment or overall economic performance.
For the purposes of gaining further insight into the relationship between output and employment growth, the next section discusses the structure of production and employment by sector, and the engines of employment and output growth. The report uses a sectoral lens and does not address important issues of labor market policy, including labor market segmentation, wage policy in the public sector, migrant versus domestic workers and performance incentives, and energy subsidy reform.
Economic activities and employment
The sectoral breakdown of employment and value added enables us to understand more fully the roles of different sectors in employment and output growth in MENA. The mining sector, which represents the oil industry and accounts for roughly 50 percent of value added (Figure 4.2), employs directly a negligible share of the labor force in all oil exporting countries (Figure 4.5). Only in Qatar, where gas dominates the fuels industry, is the sector’s share around 5 percent of total employment (Figure 4.5). The services sector is a major contributor to value added and employment in all MENA countries, with agriculture playing an important role in employment in developing MENA countries and construction playing a role in the GCC oil exporters (Figure 4.5 and Figure 4.2).
25 We chose to look at period averages rather than annual values of elasticities.
Figure 4.5 Employment shares by sector (period averages in the 2000s, percent)
Source: ILO.
0%10%20%30%40%50%60%70%80%90%
100%
Qatar Saudi Arabia
United Arab
Emirates
Algeria Iran, Islamic
Rep.
Iraq Syrian Arab
Republic
Egypt, Arab Rep.
Morocco Jordan West Bank & Gaza
Agriculture Mining and Utilities Manufacturing Construction Services
0102030405060708090
Gov't administration and social servicesTrade, tourism, logistics and comunicationFinancial and real estate services
Share in total employment in services

Growth and Job Creation
40
Further decomposition of service sector employment into public sector employment26 and employment in other, mostly commercial, services, including trade, transport, communications, tourism, hotels, finance, insurance and real estate, indicates that the government services sector is indeed a large employer in many MENA economies. It accounts for at least half of employment in the services sectors in Jordan, Saudi Arabia, WBG, Algeria, Syria and Egypt (Figure 4.5). The government services sector’s share is relatively small in the United Arab Emirates, Qatar, the Islamic Republic of Iran and Morocco. Trade, tourism, logistics and communications employ the majority of people working outside the public services sector (Figure 4.5). The exceptions are Qatar, Saudi Arabia and the United Arab Emirates where the financial, insurance and real estate sectors’ share in total employment is sizable.
The employment share of the government services sector in a typical MENA country is much larger than the corresponding share in some fast-growing, resource-rich, middle-income countries such as Brazil, Malaysia, and Indonesia (Figure 4.6). Notable exceptions are the United Arab Emirates, the Islamic Republic of Iran, Qatar and Morocco. In these countries the public sector’s share in total employment is below 18 percent and is smaller than the public services’ employment shares in Brazil, Malaysia, and even Turkey. At the other end of the spectrum are Jordan, Saudi Arabia, WBG, Iraq and Algeria where the government services sector employs more than 30 percent of the labor force. In these economies, there is scope to reduce recurrent expenditures by reducing employment in public services to norms prevailing in other middle-income economies. The comparison also suggests that the employment share of nongovernment services in a typical MENA country is similar to the corresponding share of the comparators shown in Figure 4.6.
26 Public sector employment refers here only to employment in government administration and public services sector and does not include employment in state-owned entities in other sectors of the economy.
Figure 4.6 Employment shares – a comparison with fast growing, middle-income developing economies (period averages in the 2000s, percent)
Source: ILO. Note: MENA=Middle East and North Africa.
0
10
20
30
40
50
Gov't admin. and Social Services Other services
MENA average government share MENA average commercial services
0102030405060708090
100110
Typical MENA Turkey Malaysia Indonesia BrazilAgriculture Mining and Utilities
Manufacturing Construction
Trade, Tourism, Logistics and Comunication Financial and Real estate services
Gov't admin. and Social Services
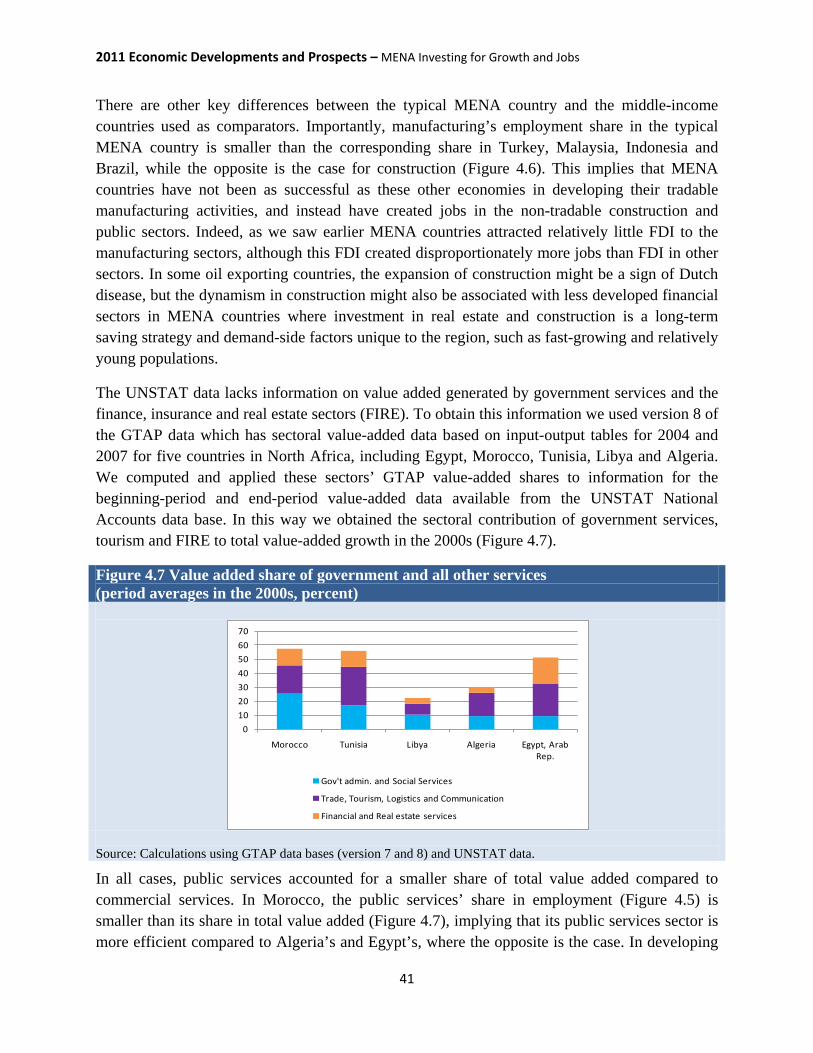
2011 Economic Developments and Prospects – MENA Investing for Growth and Jobs
41
There are other key differences between the typical MENA country and the middle-income countries used as comparators. Importantly, manufacturing’s employment share in the typical MENA country is smaller than the corresponding share in Turkey, Malaysia, Indonesia and Brazil, while the opposite is the case for construction (Figure 4.6). This implies that MENA countries have not been as successful as these other economies in developing their tradable manufacturing activities, and instead have created jobs in the non-tradable construction and public sectors. Indeed, as we saw earlier MENA countries attracted relatively little FDI to the manufacturing sectors, although this FDI created disproportionately more jobs than FDI in other sectors. In some oil exporting countries, the expansion of construction might be a sign of Dutch disease, but the dynamism in construction might also be associated with less developed financial sectors in MENA countries where investment in real estate and construction is a long-term saving strategy and demand-side factors unique to the region, such as fast-growing and relatively young populations.
The UNSTAT data lacks information on value added generated by government services and the finance, insurance and real estate sectors (FIRE). To obtain this information we used version 8 of the GTAP data which has sectoral value-added data based on input-output tables for 2004 and 2007 for five countries in North Africa, including Egypt, Morocco, Tunisia, Libya and Algeria. We computed and applied these sectors’ GTAP value-added shares to information for the beginning-period and end-period value-added data available from the UNSTAT National Accounts data base. In this way we obtained the sectoral contribution of government services, tourism and FIRE to total value-added growth in the 2000s (Figure 4.7).
Figure 4.7 Value added share of government and all other services (period averages in the 2000s, percent)
Source: Calculations using GTAP data bases (version 7 and 8) and UNSTAT data. In all cases, public services accounted for a smaller share of total value added compared to commercial services. In Morocco, the public services’ share in employment (Figure 4.5) is smaller than its share in total value added (Figure 4.7), implying that its public services sector is more efficient compared to Algeria’s and Egypt’s, where the opposite is the case. In developing
010203040506070
Morocco Tunisia Libya Algeria Egypt, Arab Rep.
Gov't admin. and Social Services
Trade, Tourism, Logistics and Communication
Financial and Real estate services

Growth and Job Creation
42
oil exporters such as Algeria and Libya the financial sectors are dominated by the state, and their value added shares are relatively small (Figure 4.7).
Engines of economic and employment growth
In MENA’s oil exporters, the two major income generating sectors – fuels and services – were also the major engines of value-added growth in the 2000s (Figure 4.8), while services and construction, and in some cases agriculture, drove employment growth (Figure 4.9). In MENA’s oil importers, manufacturing, and in some cases agriculture, in addition to services, were the engines of value-added growth in the past decade (Figure 4.8), while employment creation was boosted by expansion in services (Figure 4.9).
Figure 4.8 Sectoral contributions to average annual value added growth (percentage points)
Source: Estimates using UNSTAT data on value added by sector. Only services unambiguously matter for growth and employment, but the role of public services differs from that of nongovernment services. The contribution of government services to value added growth was small relative to the contributions of private services, especially the trade, tourism, logistics and communication sectors, and in the case of Egypt, the financial sector (Figure 4.10). Similarly, the contribution of government services to employment was relatively minor, except in Iraq and the West Bank and Gaza (Figure 4.9). Most economies in the region, especially the MENA oil importers which have relatively limited fiscal space, have seen limited expansion in public employment. In Morocco, for example, the government sector contributed negatively to total employment growth during the mid-2000s. In most economies, it was the trade, tourism, logistics and communications sectors that accounted for the major share of employment creation.
-5
0
5
10
15
20
Qatar Saudi Arabia
United Arab
Emirates
Bahrain Kuwait Oman Algeria Iran, Islamic
Rep.
Iraq Syrian Arab
Republic
LibyaYemen,
Rep.
Agriculture Mining and Utilities Manufacturing Construction Services
-1
0
1
2
3
4
5
6
7
8
Egypt, Arab Rep. Morocco West Bank & Gaza Jordan Lebanon Tunisia
Agriculture Mining and Utilities Manufacturing Construction Services
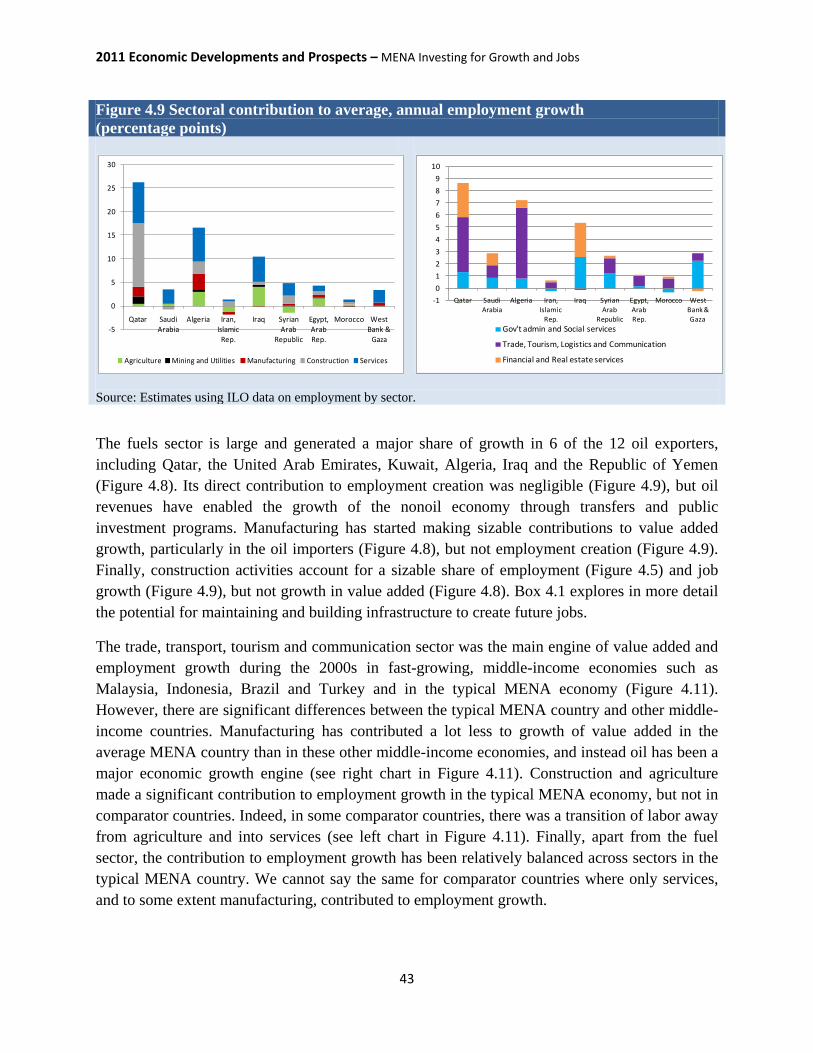
2011 Economic Developments and Prospects – MENA Investing for Growth and Jobs
43
The fuels sector is large and generated a major share of growth in 6 of the 12 oil exporters, including Qatar, the United Arab Emirates, Kuwait, Algeria, Iraq and the Republic of Yemen (Figure 4.8). Its direct contribution to employment creation was negligible (Figure 4.9), but oil revenues have enabled the growth of the nonoil economy through transfers and public investment programs. Manufacturing has started making sizable contributions to value added growth, particularly in the oil importers (Figure 4.8), but not employment creation (Figure 4.9). Finally, construction activities account for a sizable share of employment (Figure 4.5) and job growth (Figure 4.9), but not growth in value added (Figure 4.8). Box 4.1 explores in more detail the potential for maintaining and building infrastructure to create future jobs.
The trade, transport, tourism and communication sector was the main engine of value added and employment growth during the 2000s in fast-growing, middle-income economies such as Malaysia, Indonesia, Brazil and Turkey and in the typical MENA economy (Figure 4.11). However, there are significant differences between the typical MENA country and other middle-income countries. Manufacturing has contributed a lot less to growth of value added in the average MENA country than in these other middle-income economies, and instead oil has been a major economic growth engine (see right chart in Figure 4.11). Construction and agriculture made a significant contribution to employment growth in the typical MENA economy, but not in comparator countries. Indeed, in some comparator countries, there was a transition of labor away from agriculture and into services (see left chart in Figure 4.11). Finally, apart from the fuel sector, the contribution to employment growth has been relatively balanced across sectors in the typical MENA country. We cannot say the same for comparator countries where only services, and to some extent manufacturing, contributed to employment growth.
Figure 4.9 Sectoral contribution to average, annual employment growth (percentage points)
Source: Estimates using ILO data on employment by sector.
-5
0
5
10
15
20
25
30
Qatar Saudi Arabia
Algeria Iran, Islamic
Rep.
Iraq Syrian Arab
Republic
Egypt, Arab Rep.
Morocco West Bank &
Gaza
Agriculture Mining and Utilities Manufacturing Construction Services
-10123456789
10
Qatar Saudi Arabia
Algeria Iran, Islamic
Rep.
Iraq Syrian Arab
Republic
Egypt, Arab Rep.
Morocco West Bank & Gaza
Gov't admin and Social services
Trade, Tourism, Logistics and Communication
Financial and Real estate services

Growth and Job Creation
44
Figure 4.11 Sectoral contribution to annual employment and value added growth - an international comparison (percent)
Source: Estimates using ILO data on employment by sector and GTAP and UNSTAT data on value added by sector. Note: MENA=Middle East and North Africa.
-40
-20
0
20
40
60
80
100
120
140
Typical MENA Malaysia Indonesia Brazil
Agriculture Mining and Utilities
Manufacturing Construction
Trade, Tourism, Logistics and Communication Financial and Real estate services
Gov't admin and Social services
Contribution to employment growth
0%
20%
40%
60%
80%
100%
Typical MENA country
Turkey Malaysia Indonesia Brazil
Agriculture Mining and UtilitiesManufacturing ConstructionTrade, transport, tourism Financial and Real estate servicesGov't admin. and Social Services
Contribution to value added growth
Figure 4.10 Services sectors’ contribution to average annual value added growth (percentage points)
Source: Estimates using GTAP and UNSTAT data on value added by sector.
0.0
0.5
1.0
1.5
2.0
2.5
3.0
3.5
4.0
Algeria Libya Egypt, Arab Rep. Morocco Tunisia
Gov't admin. and social servicesTrade, tourism, logistics and communicationFinancial and real estate services

2011 Economic Developments and Prospects – MENA Investing for Growth and Jobs
45
Box 4.1 Maintaining and building infrastructure as a vehicle for job creation Infrastructure services and construction activities provide a significant number of jobs in MENA. In 2009, MENA employed roughly 18 million people in these sectors, of which 10.5 million worked in construction and 7.5 million provided infrastructure services. Most of these 18 million jobs were in the developing oil exporters (9 million), followed by the oil importers (7 million) and the GCC oil exporters (2 million). On average, jobs in infrastructure services in MENA represent around 8 percent of the region’s employment, while construction jobs represent around 11 percent. Construction and infrastructure services account for 13 percent and 10 percent of employment in the developing oil exporting countries, compared to 11 percent and 8 percent in the world at large, respectively. GCC oil exporters and even oil importers also display above average employment share in construction but below average share in infrastructure services.
Relative Importance of infrastructure services and construction jobs in MENA (2009)
Infrastructure services
Share in total employment
Construction
Share in total employment
Total infrastructure and construction shares
GCC 5.8% 12.0% 17.7%
Developing oil exporters 9.6% 13.0% 22.6%
Oil importers 7.1% 9.4% 16.5%
TOTAL for MENA 8.0% 11.3% 19.3%
World Average 7.7% 8.4% 16.1%
Developed countries 7.2% 8.2% 15.4%
Developing countries 7.6% 8.6% 16.2%
Infrastructure investment has the potential to generate jobs, while meeting country needs for better infrastructure services. With estimated annual infrastructure needs of about US$ 106 billion, the region could generate 2.5 million jobs by addressing infrastructure gaps. In the short run, every US$ 1 billion invested in infrastructure has the potential to generate on average, 110,000 infrastructure-related jobs in the oil-importing countries; 26,000 jobs in the GCC economies; and 49,000 jobs in the developing oil-exporting countries. Infrastructure investment can provide a quick boost to job creation, but it alone cannot resolve the substantial employment challenge in the region. Countries will also need to implement a broader set of reforms aimed at generating a more dynamic private sector. While such reforms take time to demonstrate results, infrastructure investment can help maintain confidence, providing immediate gains on jobs and tangible improvements in the environment. Source: Estache, Ianchovichina, Bacon and Salamon (2013). Note: MENA=Middle East and North Africa; GCC=Gulf Cooperation Council.
Growth and Job Creation
46
This section shows that the region’s job problem cannot be attributed solely to a slow pace of job creation relative to economic growth. On average the region has been creating jobs at a higher pace relative to income growth than other middle-income countries in the 2000s. There is however significant variation within the region. In the oil importing countries the pace of job creation relative to income growth has been relatively slow. These economies have had a job-creation problem. In contrast, the pace of job creation has been high in the developing oil exporters. In these countries the main problem in terms of jobs is insufficient economic growth. In all MENA countries, job quality has been a particular concern. Jobs in government services have been increasingly hard to get while finding similar quality jobs in the private sector has been hard too. The report shows that nongovernment services and manufacturing can serve as engines of both job creation and income growth. Services have been a source of strength both on income and jobs, in levels and growth, especially in the oil importing economies. Manufacturing has contributed to growth in income and jobs, but its size is small on average in MENA relative to comparators.
2011 Economic Developments and Prospects – MENA Investing for Growth and Jobs
47
KEY MESSAGES
Economic growth in the Middle East and North Africa (MENA) region is expected to average 4.1 percent in 2011 and improve by half a percentage point from the May forecast for the year.
• The forecast for 2011 is up by half a percentage point relative to the May forecast due to expansionary domestic fiscal policies, expanded oil production (excluding Libya), better than expected growth in the Islamic Republic of Iran, and a quicker than anticipated pickup in industrial production in Egypt.
• Growth is expected to decline by half a percentage point in 2012 because of lower expected oil prices and slower global growth.
While this year’s regional growth outlook has improved relative to the May forecast, uncertainty about it has increased, in line with growing risks.
• Within the region, failure to achieve political and macroeconomic stability would extend the uncertainty and investment and economic activity would continue to be weak, while fiscal balances will deteriorate.
• On top of regional concerns, the probability of a global downturn has increased. • The ongoing political and economic uncertainties have put a number of countries in a
weaker position in terms of responding to another global downturn. • With contracting global demand, lower oil prices will put further pressure on fiscal
balances in many oil exporters, especially in a period of expanded government spending. Lower oil prices will be a relief to developing oil importers, but this will be offset by lower exports and remittances.
The events of the Arab Spring affected investment in the MENA regions.
• Risk premiums rose, especially in counties affected by unrest. As capital became more costly, private investment, including foreign direct investment, and growth declined.
• In countries with limited fiscal space such as Morocco and Jordan, expansions in social programs in response to popular demand have occurred at the expense of public investment programs.
• Investment in the GCC countries has not been affected significantly given the dominant role of public investment. The risks there include continued anemic credit growth in the private sector and implementation constraints related to public investment projects.
A look at MENA’s investment record over the past decade suggests that the region has been investing at rates which compare favorably with those of other regions.
• In oil exporting countries, however, investment has been supported mainly by large and expanding public investment.

Key Messages
48
• Oil importers have shown more strength in private investment which has increased in recent years.
The expanding role of public investment is a cause for concern in developing oil exporters.
• In economies with a weak rule of law there is no evidence that public investment stimulates private investment and growth.
• In contrast, in countries with an adequate level of property rights protection and legal institutions, public investment is strongly linked to growth.
• In addition, a strong rule of law helps attract private investment. • Moreover, countries with a strong rule of law show higher levels of investment
efficiency.
Similar to oversized public investment, many countries in the region record a large share of jobs in government services as compared with other countries.
• Of concern is the fact that the contribution of government services to GDP is relatively small.
• Moreover, in recent years this sector has been unable to support job or income growth.
The oil sector shows a pattern opposite to government services, accounting for a large share of value added but not jobs.
Consequently, the number of jobs created in the last decade was considerably less than the number needed to address key challenges, such as high youth unemployment, low labor force participation rates, especially among women, and fast-growing labor forces.
This report investigates the region’s job creation problem in light of its growth pace and pattern. Our analysis shows that the region’s job problem cannot be attributed solely to a slow pace of job creation relative to economic growth. On average the region has been creating jobs at a higher pace, relative to income growth, than other middle-income countries in the 2000s. However, there is significant variation within the region. The oil importers show a relatively slow response of jobs to growth as compared with the oil exporters.
Several factors have been associated with this fast pace of job creation in oil exporting countries.
• Informal employment is highly prevalent in developing MENA. In such economies, new entrants to the labor force can generally find low-productivity, low-quality jobs in the informal sector.
• Another reason has been the use of special employment programs to support job creation in recent years. This has been the case in Algeria and other countries where there has been sufficient fiscal space and oil wealth.

2011 Economic Developments and Prospects – MENA Investing for Growth and Jobs
49
• This report also shows that the past decade has been a period of rapid growth in several labor-intensive sectors, including construction, trade, tourism, logistics and communication services.
• But, many of the jobs have been unattractive to domestic residents in oil exporting countries and have been done by migrant workers.
Thus, in developing oil exporters, the main problem in terms of jobs is one of insufficient growth, while oil importers have a job creation issue. In all countries, job quality has been a particular concern. Jobs in government services have been increasingly difficult to obtain while finding similar quality jobs in the private sector has been hard too.
The report shows that nongovernment services and manufacturing can serve as engines of both job creation and income growth.
• Services have been a source of strength both in terms of income and jobs, in levels and growth, especially in oil importers.
• Manufacturing has contributed to growth in income and jobs, but its size is small on average in MENA relative to comparator countries, such as Brazil, Indonesia, Malaysia and Turkey.
The report highlights the importance of strong rule of law.
• Better governance is necessary for public investment to support income growth. • Better governance attracts private investment in areas such as services and
manufacturing, which are the main drivers of both income growth and job creation. • Improving government institutions is necessary for voice and accountability; it is also
necessary for growth and efficient use of resources.

50
2011 Economic Developments and Prospects – MENA Investing for Growth and Jobs
51
REFERENCES Bekaert, G., Harvey, C.R. and C. Lundblad (2011) “Financial Openness and Productivity,” World Development 39(1): 1-19.
Blejer, M.I. and M.S. Khan (1984) “Government Policy and Private Investment in Developing Countries,” International Monetary Fund Staff Papers 31(2): 379-403.
Cavallo, E. and C. Daude (2011) “Public investment in developing countries: A blessing or a curse?” Journal of Comparative Economics 39(1): 65-81.
Freund C. and B. Bolaky (2008) “Trade, Regulations, and Income,” Journal of Development Economics 87(2): 309-321.
Freund, C. and L. Mottaghi (2011) “Transition to Democracy”, World Bank, processed.
Gallagher, M. (1991) Rent-Seeking and Economic Growth, Westview Press, Boulder, Colorado.
Harrison, A. and A. Rodríguez-Clare (2010) “Trade, Foreign Investment, and Industrial Policy for Developing Countries”, in D. Rodrik (editor) Handbook of Economic Growth 4.
Ianchovichina, E. and L. Mottaghi (2011) “Employment-growth scenarios for the Middle East and North Africa region”, World Bank, processed.
International Monetary Fund (2004) Public Investment and Fiscal Policy, Washington DC, March.
Kaufmann, D., Kraay, A., and M. Mastruzzi (2010) “The Worldwide Governance Indicators”, World Bank, processed.
King, R. G. and R. Levine (1992) “Financial Indicators and Growth in the Cross Section of Countries”, Policy Research Working Paper 819, World Bank, Washington, D.C.
Odedokun, M. O. (1997) “Relative Effects of Public Versus Private Investment Spending on Economic Efficiency and Growth in Developing Countries,” Applied Economics 29(6): 1325–1336.
World Bank (2004) Unlocking the Employment Potential in the Middle East and North Africa: Toward a New Social Contract, Washington DC.
World Bank (2010) Middle East and North Africa: Recovering From the Crisis, Economic Developments and Prospects Report, Washington DC, April.

References
52
World Bank (2011a) Middle East and North Africa: Sustaining the Recovery and Looking Beyond, Economic Developments and Prospects Report, Washington DC, January
World Bank (2011b) The Challenge of Informality in the Middle East and North Africa: Promoting Inclusion and Reducing Vulnerability, Washington DC.
World Bank (2011c) Middle East and North Africa: Facing Challenges and Opportunities, Economic Developments and Prospects Report, Washington DC, May.
World Bank (2011d) Financial Access and Stability for the MENA Region-A Roadmap, World Bank, March.
Estache, A., E. Ianchovichina, R. Bacon, I. Salamon (2013) Infrastructure and Employment Creation in the Middle East and North Africa, World Bank, Washington DC.

2011 Economic Developments and Prospects – MENA Investing for Growth and Jobs
53
ANNEX

Annex
54
Annex Figure 1. Annual per capita GDP growth and public investment, 1995-99
Note: t-statistics in parenthesis below trend equation. GDP=Gross Domestic Product. Annex Table 1. Economies with successful transitions
SSA EAP ECA LAC MENA OECD SA Benin Fiji Armenia Argentina Lebanon Greece Bangladesh Burundi Indonesia Bulgaria Bolivia Korea, Rep. Pakistan Central African Republic Philippines Croatia Brazil Portugal Comoros Thailand Hungary Chile Spain Guinea-Bissau Romania Dominican Republic Taiwan, China Kenya Turkey Ecuador Liberia El Salvador Madagascar Guyana Malawi Honduras Mali Nicaragua Mozambique Panama Niger Peru Senegal Uruguay Sierra Leone South Africa Zambia
Note: Selection of economies explained in Figure 1.1.
y = 0.1456x + 2.0094(2.17) (4.61)R² = 0.0833
-1
0
1
2
3
4
5
6
7
8
9
10
0 5 10 15 20
GD
P p
er
cap
it g
row
th r
ate,
%, 2
000
-05
Public investment % of GDP, 1995-99
Countries with good rules of law
y = -0.1271x + 3.7008(-1.23) (4.79)
R² = 0.0254
-6
-4
-2
0
2
4
6
8
10
12
14
0 5 10 15 20 25 30
GD
P pe
r ca
pita
gro
wth
,%,
2000
-05
Public investment % of GDP, 1995-99
Countries with weak rule of law

2011 Economic Developments and Prospects – MENA Investing for Growth and Jobs
55
Annex Table 2. Macroeconomic Outlook as of May 2011
Real GDP growth Fiscal balance Current account balance
2008 2009 2010 2011 est.
2012 proj. 2008 2009 2010
2011 est.
2012 proj. 2008 2009 2010
2011 est.
2012 proj.
(Annual percentage change) (in percentage of GDP) (in percentage of GDP) MENA region 5.2 1.8 3.9 3.6 4.2 12.4 -2.8 1.7 4.0 4.7 15.1 1.5 6.3 10.4 9.9
Oil Exporters 4.6 0.7 3.5 4.0 4.3 15.8 -2.1 3.7 6.8 7.6 18.8 3.2 8.9 14.3 13.4 GCC 6.0 0.2 4.2 5.2 4.6 24.2 0.8 7.8 11.3 11.5 23.9 6.7 12.1 17.6 16.5
Bahrain 6.1 2.6 4.0 1.0 3.0 4.9 -8.7 -7.8 0.5 -1.0 10.6 1.6 4.6 9.0 8.0 Kuwait 5.6 -4.4 2.3 4.0 4.0 19.9 19.3 17.5 20.0 22.0 40.7 29.2 31.8 33.0 35.0 Oman 12.3 3.6 4.8 1.0 3.0 13.9 2.2 7.5 11.0 9.0 9.1 -2.2 11.6 12.0 11.0 Qatar 15.8 9.0 16.0 18.6 9.2 10.9 13.0 11.4 12.2 14.3 33.0 15.7 18.7 38.0 34.9 Saudi Arabia 4.2 0.6 3.4 4.5 4.4 32.5 -6.1 7.7 9.0 8.0 27.8 6.1 8.7 14.0 12.0 United Arab Emirates 5.1 -2.0 2.4 3.2 4.0 20.4 0.4 3.3 12.0 13.0 8.5 -2.7 7.3 9.0 9.0
Developing Oil Exporters 2.1 1.6 2.2 1.7 3.6 1.5 -6.3 -2.3 0.1 1.9 10.0 -1.9 4.2 9.5 8.9 Algeria 2.4 2.4 3.3 3.7 3.6 7.7 -6.8 -3.9 -3.3 -1.1 20.2 0.3 9.4 17.8 17.4 Iran, Islamic Republic of 1.0 0.1 1.0 0.0 3.0 0.0 -2.7 0.6 3.7 4.3 7.3 4.2 6.0 11.7 10.4 Iraq 9.5 4.2 0.8 9.6 12.6 -1.2 -21.8 -10.8 -4.0 3.5 12.8 -26.6 -6.2 -3.0 -0.4 Syrian Arab Republic 4.5 6.0 3.2 1.7 3.0 -2.8 -2.9 -4.8 -7.3 -5.1 0.1 -5.7 -4.4 -5.3 -4.8 Yemen, Rep. 3.6 3.9 8.0 3.0 4.0 -3.2 -10.2 -4.0 -7.0 -5.6 -4.6 -10.7 -4.4 -4.0 -4.0
Oil Importers 6.8 4.8 4.7 2.3 3.9 -4.3 -5.5 -6.1 -7.1 -6.9 -3.3 -4.9 -4.2 -5.0 -4.3 Oil Importers with GCC Links 8.6 6.3 5.6 4.4 4.7 -6.8 -8.1 -4.8 -6.1 -5.7 -12.2 -14.8 -10.9 -12.7 -12.2
Djibouti 5.8 5.0 4.5 5.5 5.7 1.3 -4.6 -0.5 -0.1 0.0 -24.3 -9.1 -6.9 -18.2 -15.7 Jordan 7.6 2.3 3.1 3.5 4.0 -4.3 -8.5 -5.3 -6.2 -5.2 -9.6 -5.1 -4.3 -8.0 -6.8 Lebanon 9.3 8.5 7.0 4.8 5.0 -8.8 -8.0 -4.6 -6.2 -6.2 -13.6 -21.5 -15.4 -15.6 -15.6
Oil Importers with EU Links 6.5 4.5 4.6 1.9 3.7 -3.9 -5.0 -6.3 -7.3 -7.1 -1.8 -3.2 -3.0 -3.6 -2.9 Egypt, Arab Rep. 7.2 4.7 5.2 1.0 3.5 -6.8 -6.9 -8.2 -9.0 -9.0 0.5 -2.3 -2.0 -2.9 -2.4 Morocco 5.6 4.9 3.3 4.3 4.5 0.4 -2.2 -4.6 -4.5 -4.0 -5.2 -5.0 -4.2 -4.0 -3.5 Tunisia 4.5 3.1 3.7 1.5 3.5 -1.0 -3.0 -1.3 -4.8 -4.1 -3.8 -2.9 -4.8 -6.2 -4.0 Source: World Bank (2011c). Note: GCC=Gulf Cooperation Council; GDP=Gross Domestic Product; MENA=Middle East and North Africa.
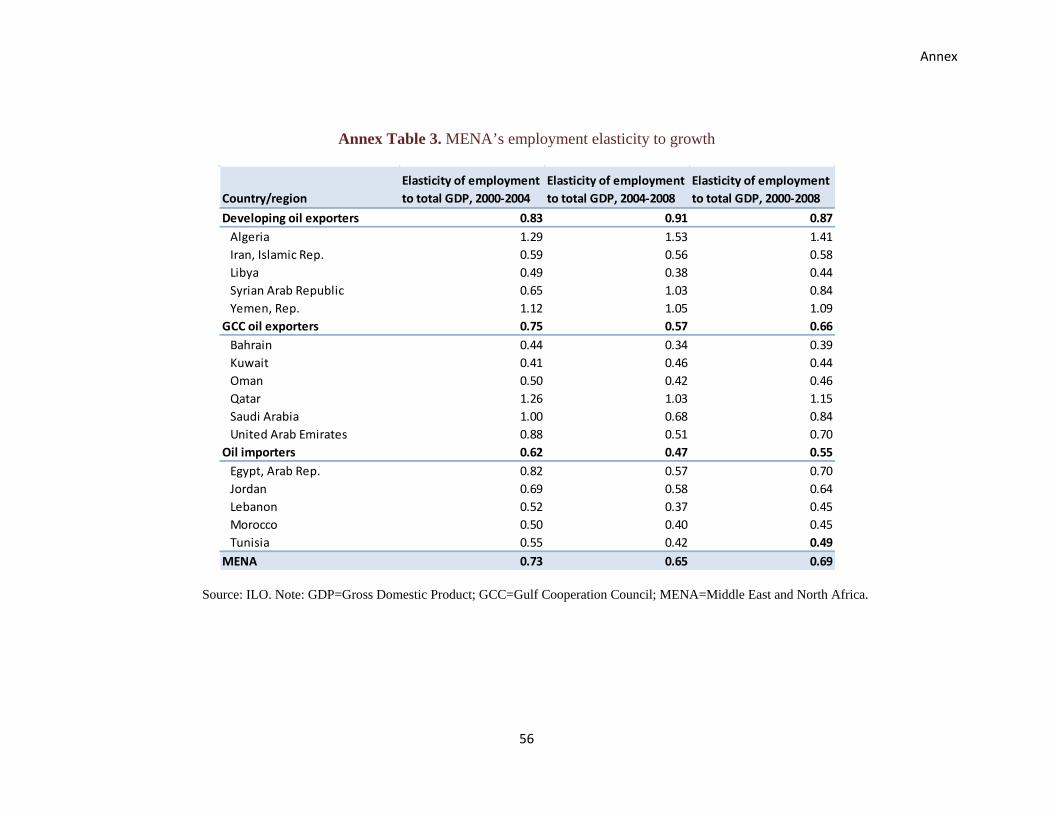
Annex
56
Annex Table 3. MENA’s employment elasticity to growth
Source: ILO. Note: GDP=Gross Domestic Product; GCC=Gulf Cooperation Council; MENA=Middle East and North Africa.
Country/regionElasticity of employment to total GDP, 2000-2004
Elasticity of employment to total GDP, 2004-2008
Elasticity of employment to total GDP, 2000-2008
Developing oil exporters 0.83 0.91 0.87Algeria 1.29 1.53 1.41Iran, Islamic Rep. 0.59 0.56 0.58Libya 0.49 0.38 0.44Syrian Arab Republic 0.65 1.03 0.84Yemen, Rep. 1.12 1.05 1.09
GCC oil exporters 0.75 0.57 0.66Bahrain 0.44 0.34 0.39Kuwait 0.41 0.46 0.44Oman 0.50 0.42 0.46Qatar 1.26 1.03 1.15Saudi Arabia 1.00 0.68 0.84United Arab Emirates 0.88 0.51 0.70
Oil importers 0.62 0.47 0.55Egypt, Arab Rep. 0.82 0.57 0.70Jordan 0.69 0.58 0.64Lebanon 0.52 0.37 0.45Morocco 0.50 0.40 0.45Tunisia 0.55 0.42 0.49
MENA 0.73 0.65 0.69