the interaction between minimum wages, income support, and
TRANSCRIPT

Manos Matsaganis Maacuterton Medgyesi and Alexandros Karakitsios December ndash 2015
The interaction between minimum wages income
support and poverty
Research note 102015
EUROPEAN COMMISSION
Directorate-General for Employment Social Affairs and Inclusion
Directorate A mdash Employment amp Social Governance Unit A4 ndash Thematic analysis
Contact Maria VAALAVUO E-mail MariaVAALAVUOeceuropaeu European Commission B-1049 Brussels
EUROPEAN COMMISSION
Directorate-General for Employment Social Affairs and Inclusion 2015
SOCIAL SITUATION MONITOR
APPLICA (BE) ATHENS UNIVERSITY OF ECONOMICS AND BUSINESS (EL) EUROPEAN CENTRE FOR SOCIAL WELFARE POLICY AND RESEARCH (AT)
ISER ndash UNIVERSITY OF ESSEX (UK) AND TAacuteRKI (HU)
The interaction between minimum wages income
support and poverty
Research note 102015
Manos Matsaganis AUEB
Maacuterton Medgyesi TAacuteRKI
Alexandros Karakitsios AUEB
Acknowledgements
We thank Terry Ward (Applica) Istvaacuten Toacuteth (TAacuteRKI) and Maria Vaalavuo (DG-EMPL)
for comments and suggestions at various stages of the preparation of this manuscript
LEGAL NOTICE
This document has been prepared for the European Commission however it reflects the views only of the authors and the Commission cannot be held responsible for any use which may be made of the information contained therein
More information on the European Union is available on the Internet (httpwwweuropaeu)
copy European Union 2015 Reproduction is authorised provided the source is acknowledged
Europe Direct is a service to help you find answers
to your questions about the European Union
Freephone number ()
00 800 6 7 8 9 10 11
() The information given is free as are most calls (though some operators phone boxes or hotels may charge you)
The interaction between minimum wages income support and poverty
5
Table of Contents
ABSTRACT 6
INTRODUCTION 7
PART I THE HOUSEHOLD CIRCUMSTANCES OF LOW EARNERS IN THE EU 9
Methodology 9
Household circumstances of low earners 10
The risk of poverty in households with low earners 12
PART II SIMULATING THE POVERTY EFFECTS OF AN EU MINIMUM WAGE 16
Methodology 16
Minimum wages in the EU 17
Simulating an EU minimum wage 17
Poverty effects of an EU minimum wage 18
Inequality effects of an EU minimum wage 20
CONCLUDING REMARKS 21
REFERENCES 23
ANNEX 24
The interaction between minimum wages income support and poverty
6
Abstract
Minimum wages have emerged as a key policy issue in several countries in Europe (for
example in Germany and Italy) and beyond (for example in the US) Furthermore at
EU level discussions on a common European benchmark have gained momentum since
European Commission President J-C Juncker came out in favour of an EU minimum
wage as an essential component of the European Social Model This Research Note
attempts to throw light on the interaction between minimum wages income support
and poverty It focuses on two closely connected aspects of this issue On the one hand
the latest EU-SILC data is used to examine the relationship between low wages and
poverty looking at the individual characteristics and household circumstances of those
workers earning less than 50 of average hourly wages On the other hand the
European tax-benefit model EUROMOD is deployed to simulate the effects on poverty of
raising national minimum wages to that threshold (ie 50 of average hourly wages)
taking into account interactions with social assistance and other tax-benefit policies and
assuming no negative impact on employment or behavioural effects The main finding
is that raising minimum wages to that level would have at best modest effects in terms
of poverty reduction though better coordination of minimum wages with other tax-
benefit policies and in particular with in-work benefits could improve overall anti-
poverty performance
The interaction between minimum wages income support and poverty
7
Introduction
Minimum wage policies have been brought to the top of the political agenda in a number
of EU Member States In Germany a national minimum wage of euro850 per hour has
been gradually phased in since January 2015 and will be fully in place in 2017 In Italy
the recent lsquoJobs Actrsquo has put in place a framework for the future introduction of a national
minimum wage for those workers (including the lsquodependent self-employedrsquo) not already
covered by a collective bargaining agreement That leaves Austria Cyprus and the
Nordic countries (Denmark Finland and Sweden) as the only EU members without a
national minimum wage1 In the other 23 EU Member States with a national minimum
wage its current level (January 2016) varied widely from euro215 per month in Bulgaria
to euro1923 per month in Luxembourg2
Renewed interest in minimum wages is also evident at EU level where discussions on
the feasibility and desirability of setting a common threshold applicable throughout the
EU gained momentum when European Commission President J-C Juncker came out in
favour of an EU minimum wage (for example set at 60 of national median wages) as
an essential component along with a minimum guaranteed income of the European
Social Model3
The relationship between low wages and the risk of poverty has gained in salience as it
has become increasingly clear that in the years before the economic and financial crisis
rising employment levels failed to engineer a decline in relative poverty rates (Cantillon
2011 Gaacutebos et al 2015) As recent work has established in-work poverty and the
ldquoerosion of minimum income protectionrdquo for the working-age population (and
especially for families with children) was in most countries associated not with cuts in
benefit levels (nor with rising taxation levels) but rather with ldquosinking gross low wages
compared to median household incomesrdquo (Cantillon et al 2015)
The notion that raising the minimum wage would cause the risk of poverty to fall has
intuitive appeal Nevertheless economic theory suggests that the effectiveness of
minimum wages as an anti-poverty tool is in fact questionable (Boeri amp van Ours 2013)
On the one hand many of those at risk of poverty are either not employed (ie are
retired inactive or unemployed) work part-time (ie would not gain as much from a
rise in the hourly minimum wage) or are self-employed or in the informal sector (ie
beyond the scope of minimum wage legislation) On the other hand a number of
minimum wage earners live in households with income above the at-risk-of-poverty
threshold in many cases because they are secondary earners (eg women caring for
children or grown-up children living with their parents)4 Furthermore raising the
1 In most of these countries industry-level minimum wages are typically in place resulting from collective bargaining and extended to all workers in the relevant industries No minimum wage applies for workers not covered by an industry-level agreement 2 For more information on minimum wages in the EU and candidate countries see Eurostat ldquoMinimum wage statisticsldquo
3 These developments are mirrored across the Atlantic in the United States where President Obama called on Congress to raise the federal minimum wage to $1010 per hour (from its current
level of $725) Even though the presidential proposal was not endorsed by Congress the minimum wage for federal contract workers was raised to that level in January 2015 Meanwhile several states have legislated minimum wage increases well above the level indicated by the President with California and New York now both committed to moving towards a minimum hourly wage of $15 (In California the $15 minimum hourly wage will apply to the entire state with all large businesses phased in by 2022 and all those with fewer than 26 employees by 2023 New York City will get to $15 by the end 2018 and the cityrsquos suburbs by the end of 2021 while in
upstate areas the hourly minimum wage will be raised to $1250 by the end of 2020) 4 ldquoAssortative matingrdquo or the tendency of some individuals to select a spouse from within their own group (defined by occupational educational ethnic or other characteristics) will have the opposite effect leading to minimum wage earners being clustered in low-income households For more analysis see OECD (2011) where it is pointed out that assortative mating is on the increase in the United Kingdom Poland Sweden and other EU Member States We thank Maria Vaalavuo
for pointing this out
The interaction between minimum wages income support and poverty
8
minimum wage may cause adverse effects on employment in which case some workers
will suffer from a loss of earnings as they move from low-wage employment to no
employment at all
Given that the employment and poverty effects of minimum wages as predicted by
theory are ambiguous (and contingent on other factors) the relevant questions can only
be resolved empirically As it happens evidence (mainly though not exclusively from
North America) abounds ldquoThe employment effect of the minimum wage is one of the
most studied topics in all of economicsrdquo (Schmitt 2014) In large part this can be traced
to the seminal work by Card amp Krueger (1994 1995) which inspired a vast and often
contradictory body of research The key finding of the lsquoNew Economics of the Minimum
Wagersquo was that earlier assumptions based mostly on theory needed to be revised
ldquoThe weight of the evidence suggests that it is very unlikely that the minimum wage
has a large negative employment effectrdquo (Card amp Krueger 1995) In dissent some later
studies found strong adverse employment effects (Neumark amp Wascher 2008)
Nevertheless a more recent crop of empirical work (Dube et al 2010) appears to
confirm that moderate increases of the minimum wages have little or no effect on
employment
Strikingly a lsquometa-analysisrsquo of 64 studies published between 1972 and 2007 yielding
over 1000 estimates specifically measuring the impact of the minimum wage on
teenage employment in the US found that the most precise estimates were heavily
clustered at or near zero employment effects Keeping in mind that teenagers are the
one category of workers most likely to be lsquopriced outrsquo by a hike in the minimum wage
the authors concluded ldquoTwo scenarios are consistent with this empirical research
record First minimum wages may simply have no effect on employment [hellip] Second
minimum-wage effects might exist but they may be too difficult to detect andor are
very smallrdquo (Doucouliagos amp Stanley 2009) Similar conclusions were reached by a more
recent meta-analysis of 201 estimates from 27 studies published since 2000 (Wolfson
amp Belman 2014)
The poverty effects of changes in the minimum wage are somewhat less researched
though most economists would argue that minimum wages (on their own) are a blunt
instrument for reducing poverty Nevertheless a comprehensive recent study (Dube
2013) using microlevel data from the US has actually suggested that under certain
conditions (growing labour demand no or small disemployment effects) minimum wage
rises can be effective in reducing poverty Specifically the poverty rate elasticity of the
minimum wage estimated in the study ranged from -012 to -037 with the best
estimate being -024 implying that raising the minimum wage by 10 will reduce the
number of people living in poverty by 24 The same study also reviewed the existing
literature and concluded it was lsquobroadly consistentrsquo with the above range of estimates
This Research Note attempts to throw light on the interaction between minimum wages
income support and poverty The focus is on two closely connected aspects of this issue
In Part I the relationship between low wages and poverty is examined on the basis of
the latest EU-SILC (2013) data looking at the individual characteristics and household
circumstances of those workers earning less than 50 of average (mean) hourly wages
In Part II the European tax-benefit model EUROMOD is used to simulate the effects on
poverty of raising national minimum wages to that threshold (ie 50 of average hourly
wages) taking into account interactions with social assistance and other tax-benefit
policies assuming no adverse effects on employment or behavioural impact
The interaction between minimum wages income support and poverty
9
Part I The household circumstances of low earners in the EU
Methodology
Low wages are defined here in line with Oumlzdemir and Ward (2015) as hourly wages
below 50 of average (mean) hourly wages The focus is on employees for obvious
reasons (ie the self-employed are not covered by minimum wage legislation) The
analysis is based on data from the latest available wave of EU-SILC at the time of writing
(survey carried out in 2013 information on incomes earned in 2012)
Since information on current monthly earnings for employees (PY200G) is only available
in the case of 10 countries in EU-SILC this variable is not suitable to study differences
over all Member States of the EU EU-SILC however records yearly employee cash and
non-cash income (PY010G) over the income reference year To study low wages among
individuals with different working hours hourly wage rates were calculated using the
information on yearly employee income the number of months the respondent was in
employment (PL070 PL072) and the hours they typically work in their main job (PL060)
One limitation of the data is that information on hours of work relates to the current
situation whereas there is no information on hours of work in earlier periods of the
year5 Thus the calculation of hourly wage rates had to be restricted to employees who
have been working full-time over the whole year or have been working part-time over
the whole year Employees who have changed job during the reference year have also
been excluded since in this case hours of work at the previous job are not known6 The
assumption here is that individuals who have been working through the entire year at
the same job have been working the same hours as currently reported in variable
PL060
As noted above low wages are defined as gross hourly wages below 50 of the average
(mean) both to be in line with the parallel study referred to above and to increase the
number of people covered (in most countries very few people earn the minimum wage
or below)
It is important to keep in mind that because of data limitations the definition of
lowearners used in the study is restricted to those in stable employment (either full-
time or part-time) so that those whose employment has fluctuated over the year are
not included This is of course a serious limitation in the study since workers with
unstable employment are also likely to be affected by low wages and high poverty risk
Nevertheless the share of employees in stable employment in the 18-64 age group is
rather high in all countries ranging from 77 in Estonia to 95 in Romania (see Annex
Table A1 for further details)
The analysis focuses on household incomes so that the relationship between low wages
and poverty risk is affected by labour market status and the incomes of all household
members as well as the number of dependants in the household As poverty is best
defined at the household level the sample used will include all those who live in
households with a low-wage household member The at-risk-of-poverty threshold is
defined as 60 of median equivalised household income in the country concerned Two
indicators relating to this are used the at-risk-of-poverty rate (showing the percentage
of those with income below the threshold) and the at-risk-of-poverty gap (showing the
income shortfall of those below the poverty threshold relative to that threshold in
percentage terms)
5 This approach is similar to that taken by other studies in the literature For instance Maicirctre et al (2012) focus on those working full-year full-time when studying low pay 6 This was omitted from the definition in the case of countries where there was no information in this variable (PL160) for example Bulgaria Sweden and Finland and also in the case of countries where it was only asked from the selected respondents (and not all household members
above 16 years of age) such as Denmark the Netherlands and Slovenia
The interaction between minimum wages income support and poverty
10
Figure 1 shows the proportion of the population living in the households of low earners
The proportion ranges from 26 in Finland to 206 in Lithuania7
Figure 1 Population share of low earners in the EU ()
Source own calculation using EU-SILC 2013 UDB August 2015
The proportion of households with low-wage employees ranges from 2 to 16 In
Lithuania Latvia Luxembourg and Cyprus that proportion is between 14 and 16
In contrast it is below 3 in Belgium Finland and Denmark
Household circumstances of low earners
As shown by Oumlzdemir and Ward (2015) low earners are over-represented among the
young women those working part-time and those with temporary contracts According
to the conclusions of that study based on data from the European Labour Force Survey
low pay is not necessarily associated with low education or low-skilled occupations
though low-wage workers are disproportionately employed in sectors like basic services
retailing hotels and restaurants and social work In most Member States migrants
defined as those born outside their country of residence are more likely to have low
pay than those born in the country
In this section the focus is on households of those in low-wage employment Households
of low-wage employees are described from the point of view of the employment situation
of household members and the number of dependants as these factors are the main
determinants of the risk of poverty First households will be described with respect to
the concentration of low pay in them before other indicators of the labour market
situation of household members are examined such as the identity of the low earner in
the household and work intensity of the household The other issue that is relevant for
the risk of poverty is the number of dependants in the households of those with low
pay
There is little evidence of a concentration of low-paid workers in households the
proportion of households with several low-wage employees being around 1 in
households where the head is of working age (between 18 and 64) The largest
proportions are found in countries with a higher share of households with low-wage
7 The absolute sample size of those living in households of low earners is shown by Table A2 in the Annex Sample sizes depend of course on overall sample size in the country and the percentage of individuals with low wages The lowest sample size is found in Belgium (N=413)
while the highest in Poland (N=5093)
The interaction between minimum wages income support and poverty
11
employees Luxembourg (28 of households with at least two low-wage members)
Latvia (26) Cyprus (19) and Lithuania (17)
From the perspective of the income situation in the household it is important to know
which members are earning a low wage If the household head is a low-wage earner
this might have a more serious effect on household income than if a young adult living
with parents is Households with low-wage earners are divided in three groups (i) those
where the household head is a low earner8 (ii) those where the household head is not
a low earner but the spouse is and (iii) those where the low earner is neither the
household head nor their spouse but another member of the household9
Figure 2 Composition of households with low earners ( of individuals)
Source own calculation using EU-SILC 2013 UDB August 2015
To capture the labour market status of all household members the concept of household
work intensity is used This is shown in Annex Table A5 We measure work intensity as
the ratio of the number of months spent in employment during the year by household
members of working age (ie those aged 16-64) - adjusted for part-time working (ie
weighted by the number of hours worked per week relative to 35) - to the number of
months they would work if they were all employed full time (defined as working 35
hours a week or more) throughout the year10 Households where every member of
working age is employed full time throughout the year are given a work intensity of 1
while those where no one of working age is employed have a work intensity of 0 (jobless
households) In the population of households with low earners the proportion of those
8 This group is not limited to households where only the head is a low earner but includes also those households where the head and other members of the household have low earnings
9 This 3-group variable is a simplified version of a 5-group variable in which the first group is composed of single-adult households where the only adult is a low-wage earner Among
households with more adults we differentiate according to whether the low earner is the household head or not Each group is divided in two subgroups in the former we distinguish according to whether only the head is low earner or other members also are in the latter according to whether the spouse is low earner or other household members are Figure 2 shows the distribution of the 3-group variable in which three groups (single adult on low wage only head on low wage head as well as another member on low wage) are conflated into one (household head on low wage) The full distribution of all individuals living in households with low earners by the position of the
low earner(s) in the household using the 5-group variable is shown in Annex Table A4 10 Note that our work intensity definition is different from the one used by Eurostat In EU-SILC the work intensity of a household is the total number of months all working-age household members have actually worked during the income reference year divided by the total number of months the same household members could theoretically have worked over the same period Our indicator adjusts work intensity by whether household members worked full-time or part-time
For more detail see Ward amp Oumlzdemir (2016)
The interaction between minimum wages income support and poverty
12
living in households with low work intensity (ie below 05) ranges from 2 in Denmark
to 38 in Greece Other countries with relatively low figures are Sweden Slovenia and
Finland (3-7) while other countries with relatively high figures are Ireland and the
Netherlands (30-34) The reason for low work intensity can of course be different in
these cases in the case of Greece it is related to a high number of unemployed and
inactive persons in low-wage households while in the Netherlands it is more related to
a relatively high number of part-time workers
Other than the labour market situation of household members the number of
dependants also affects the risk of falling into poverty The demographic composition of
households with low earners is shown in Annex Table A6 The proportion of those living
in households with children is the smallest in Greece (36) and the Czech Republic
(40) while the largest is in Sweden where 67 of those in households with low-wage
earners live in households with children The proportion of those living in households
with children is also relatively large in Luxembourg Romania Slovenia and Portugal
Low-wage households with children can be further divided into three groups lone-
person households with children households with two or more adults and one or two
children and households with two or more adults and three or more children The
proportion of lone parents is small in all countries though it reaches almost 5 in the
UK The proportion of those living in households with three or more children is largest
in Denmark (19) Luxembourg (15) and Sweden (15) and smallest in Greece
Portugal and Slovakia (2-3) The third group households with at least two adults and
one or two children is the most widespread the proportion varying between 31 in
Finland and 57 in Portugal
The risk of poverty in households with low earners
Our main concern here is to compare the extent and depth of the risk of poverty among
households with low-wage workers with those prevailing in the working-age population
as a whole We also examine the factors associated with a risk of poverty among low
earners as well as the role of social transfers in alleviating this risk
Extent and depth of monetary poverty in households of low earners
The at-risk-of-poverty rate among those living in households with low earners was
highest in Greece in 2012 at 38 (see Figure 3)
Figure 3 At-risk-of-poverty rate 2012
Source own calculation using EU-SILC 2013 UDB August 2015
The interaction between minimum wages income support and poverty
13
The at-risk-of-poverty rate was also above 30 in Luxembourg and Italy while the rate
was only 6 in the Netherlands and below 10 in Ireland and Slovenia In most EU
Member States households with low earners have a higher at-risk-of-poverty rate than
the average for all households with working-age heads The few exceptions are mostly
countries where the at-risk-of-poverty rate among those living in households with a low
earner was relatively small the Netherlands Ireland Slovenia and Finland (though
also Croatia Belgium and Romania) The biggest difference in rates can be found in
Greece Luxembourg Italy Hungary and France where the at-risk-of-poverty rate is
at least 10 points higher in the case of individuals living in households with low-wage
members Even though households with a low-wage earner face a higher-than-average
poverty risk that risk is much higher still for jobless households
The at-risk-of-poverty gap is widest among those living in households with low earners
in Denmark where those at risk of poverty had on average income of 42 below the
threshold while in Italy Bulgaria Romania and Greece the rate was also above 30
(see Figure 4) In Finland Slovenia the Czech Republic and the Netherlands on the
other hand the average income of those at risk of poverty was only 14-15 lower than
the threshold
Figure 4 At-risk-of-poverty gap 2012
Source own calculation using EU-SILC 2013 UDB August 2015
With the exception of Denmark the poverty gap is higher among jobless households
than among households with low-wage earners Moreover the at-risk-of-poverty gap
was lower for households with low earners than for all working-age households in all
countries except Denmark and Cyprus This may look surprising at first sight It should
be recalled however that low-wage earners here include only those employed
throughout the year As a result households of low-wage earners below the poverty
threshold may well have higher average incomes than other households below the same
threshold
Poverty risk in subgroups
In this section we analyse the relationship between the risk of poverty of households
with low earners and household composition The expectation is that the risk will be
higher than average for households where the head has a low wage where household
work intensity is low and where the number of dependants is relatively high
As a rule the at-risk-of-poverty rate is higher when the low-wage earner is the
household head than when he or she is another household member (see Annex Table
A9) This is the case in all countries The differential (relative to the average of all those
living in households with a low-wage household member) was largest in Denmark
The interaction between minimum wages income support and poverty
14
Germany and Bulgaria (around 20 points in 2012) while it was also quite large in
another 10 countries (over 10 percentage points) In Latvia and the Czech Republic on
the other hand the differential was smallest (below 3 percentage points) Having a low
earner as household head thus tends to increase the at-risk-of-poverty rate as
compared with cases where the spouse or some other member is a low earner
The at-risk-of-poverty rate is also associated with low work intensity at household level
The definition of low-wage earners adopted in this study means that low earners in the
household work during the whole year (although not necessarily in full-time jobs) Other
household members on the other hand can have spells of inactivity or unemployment
and thus might be employed for only a few months during the year Household work
intensity thus varies among households with low earners As Figure 5 shows among
households with low-wage earners the poverty risk is higher than average among
households with a work intensity lower than 05 The difference is especially large in
Bulgaria Denmark Lithuania and Hungary where the at-risk-of-poverty rate among
households with work intensity below 05 exceeds by over 30 percentage points the
average for those in all households with low-wage earners (see Annex Table A10)
It is also evident that having a low-wage earner in the household represents an
additional poverty risk factor even among households with low work intensity Figure 5
shows that the at-risk-of poverty rate is higher in the case of households with a work
intensity below 05 where there is a low-wage household member Having a low-wage
earner increases the risk of poverty especially in Luxembourg Hungary and Denmark
but also in several other countries A few exceptions do exist in the Netherlands
Ireland Slovenia Finland and Croatia the at-risk-of-poverty rate is actually lower
among households with low work intensity where there is a low earner
Figure 5 At-risk-of-poverty rate in households with work intensity below 05
Source own calculation using EU-SILC 2013 UDB August 2015
As indicated in Figure 6 having children is also associated with a higher-than-average
poverty risk among those living in households with low-wage earners The biggest
difference is in Greece and France where the at-risk-of-poverty rate of those living in
households with children exceeds the average for households with low-wage earners by
some 10 percentage points The only exceptions are a few countries with a relatively
low at-risk-of-poverty rate for households with children such as Cyprus Germany
Sweden and the Czech Republic In these countries the risk of poverty is lower in the
case of low-wage households with children
The interaction between minimum wages income support and poverty
15
Figure 6 At-risk-of-poverty rate in households with children
Source own calculation using EU-SILC 2013 UDB August 2015
It is also clear that having a low-wage household member increases the poverty risk
among households with children in the majority of EU Member States In Greece France
and Denmark families with low earner(s) and children face at-risk-of-poverty rates that
are more than 15 points higher than they are for all families with children On the other
hand there are certain countries (especially Ireland Croatia Romania and Slovenia)
where the opposite is true there the risk of poverty is actually lower for households
with low earner(s) and children than it is for all households with children
The role of social transfers in reducing poverty risk
The income structure of households with low-wage earners differs greatly among EU
Member States (see Annex Table A12) The two extreme cases are the Netherlands
(where 92 of all incomes are either labour or capital earnings with only 8 coming
from social transfers) and Slovenia (where the respective shares of market incomes and
social transfers are 73 and 27) Relatively low shares of social transfer income are
also found in Germany Malta and Finland (12-13) and high shares in Ireland
Sweden and France (22-23) In the case of Greece and some other countries (Poland
Slovakia Romania Cyprus Latvia and Bulgaria) old-age pensions are the most
important social transfer in households with low-wage earners The share of family
benefits in total income is the highest in Slovenia (14) Sweden (11) and
Luxembourg (9) while the share of unemployment benefits is highest in Spain (9)
and Ireland (8) Sickness and disability benefits make up the highest share of total
income in Slovenia (8) and Sweden (7) Social assistance and housing allowances
are only a small part of the total income of households with low earners the highest
share of these being found in the UK and France (3)
Social benefits play an important role in moderating the risk of poverty of those living
in households with low earners Figure 7 shows that social transfers reduce the at-risk-
of-poverty rate (relative to a ldquono social transfersrdquo counterfactual) by over 30 percentage
points in Ireland Slovenia and Sweden The smallest reduction is seen in the
Netherlands Denmark Cyprus and Greece where the rate is lowered by 14-16 points
The effect of social transfers can also be assessed relative to the pre-transfer at-risk-
of-poverty rate This indicator varies from 27 in Greece to 84 in Ireland (see also
Annex Table A7)
The effect of social transfers on the depth of the risk of poverty can be measured by
comparing the poverty gap before and after social transfers The gap before social
transfers is naturally larger than after transfers in all countries The biggest difference
is in France where the inclusion of social transfers reduces the gap by 26 percentage
points The poverty gap after social transfers is lowered by 20-25 percentage points in
The interaction between minimum wages income support and poverty
16
the UK Cyprus Hungary Germany and Ireland The reduction is smallest in Latvia
Austria Romania and Denmark (see Annex Table A8)
Figure 7 Impact of social transfers on at-risk-of-poverty rate in households
with low earners 2012
Source own calculation using EU-SILC 2013 UDB August 2015
Note absolute poverty reduction is the difference between the pre-transfer and post-transfer at-risk-of-poverty rate Relative poverty reduction equals absolute poverty reduction divided by pre-transfer at-risk-of-poverty rate
Part II Simulating the poverty effects of an EU minimum wage
Methodology
The aim here is to simulate the poverty effects of raising national (hourly) minimum
wages to 50 of national average (hourly) wages taking account of interactions of low
earnings with social assistance other benefits and taxes using the European tax-benefit
model EUROMOD11 We assume no employment or behavioural effects
As in Part I the analysis is confined to employees who have been working either full-
time or part-time over the whole year Average hourly earnings are calculated as gross
monthly earnings divided by usual working hours per month (ie usual working hours
per week multiplied by 5212)
In three Member States (Bulgaria France and Italy) where information on whether
employees had worked full-time or part-time is missing all employees with an
employment record of 12 months over the year are covered In the UK where
information on months of employment is missing all employees are covered
The simulated EU minimum wage is equal to 50 of national average hourly wages but
is set on a monthly basis (multiplying minimum hourly wages by usual working hours
per week by 5212) Where national legislation dictates that monthly wages are paid
1314 times a year this is assumed also to be the case with the new minimum
In those Member States where a youth sub-minimum wage is currently in force it is
assumed that the EU minimum wage applies to all workers irrespective of age
11 Specifically we use version G275+ running on EU-SILC 2012 data uprated to 2014 incomes
and tax-benefit policies
The interaction between minimum wages income support and poverty
17
Minimum wages in the EU
As pointed out earlier in 2014 most Member States had a national minimum wage the
exceptions being Germany Austria Italy Cyprus Denmark Finland and Sweden (In
the meantime the introduction of a minimum wage has been phased-in gradually in
Germany and has been legislated in Italy)
Obviously the level of the minimum wage varied considerably from euro174 a month in
Bulgaria to euro1921 in Luxembourg In terms of the ratio of the minimum to average
wages the variation was also significant though less wide ‒ from 33 in the Czech
Republic to 53 in Slovenia This is shown in Figure 8
Figure 8 Minimum wages in the EU 2014
Source Eurostat (OECD for average earnings in Belgium France Greece the Netherlands and
Romania)
Simulating an EU minimum wage
A hypothetical EU minimum wage at 50 of national average wages is simulated The
latter are estimated from the EU-SILC data restricting the sample to those employees
who had been working either full-time or part-time throughout the previous year except
in the case of Bulgaria France Italy and the UK (see above)
Comparing the threshold of 50 of national average wages with actual minimum wage
levels in 2014 the required increase would be relatively large in a number of countries
reaching 50 in the Czech Republic and 51 in Estonia Note that in two Member States
(France and Hungary) where actual minimum wages were above the threshold of 50
of national average wages as estimated from the data12 the actual minimum wage level
is assumed when simulating a hypothetical EU minimum wage This is shown in Annex
Table A13
The proportion of workers (narrowly defined) affected by the increase in earnings
following the introduction of a minimum wage at 50 of national average wages is
shown in Figure 9 On the whole the proportion of workers affected would range from
around 4 to 5 in Belgium and Finland to around 21 to 22 in Cyprus Lithuania
and Latvia The level of the resulting adjustment also varies In Belgium Bulgaria and
12 Note that this is slightly different from Figure 8 where the countries in which minimum wages were above 50 of national average wages were Luxembourg and Slovenia The discrepancy is due to the fact that as explained earlier our analysis here is restricted to employees working
continuously throughout the year (except in the UK)
The interaction between minimum wages income support and poverty
18
Hungary13 for over 40 of workers affected by the hypothetical introduction of a
minimum wage at this level the rise in wages would be below 10 Conversely in
France Denmark Austria Cyprus and Lithuania between 64 and 78 of workers
currently below the new minimum wage threshold would receive a pay rise of over 20
with the proportion reaching 71 in Italy and 75 in Sweden The distribution of
workers by level of the required increase is shown in Annex Table A14
Figure 9 Distribution of workers affected by a minimum hourly wage at 50
of national average hourly wage by level of implicit pay rise
Source EUROMOD 2014 model on SILC 2012 input data
Notes Average hourly wages are calculated as gross monthly wages divided by usual working hours per month Our analysis is limited to workers employed either full-time or part-time over the whole year Because of missing information all employees working 12 months over the year (irrespective of whether full-time or part-time) are covered in Bulgaria France and Italy while
all employees (irrespective of whether full-time or part-time and of whether full-year or part-
year) are covered in the UK In France and Luxembourg EUROMOD ran on SILC 2010 data
The above figures need to be interpreted with caution Notwithstanding differences in
definitions years of reference and sources the finding that in Sweden more than 8
of all employees working permanently over the previous 12 months were paid less than
385 of average wages14 differs from the estimates from the Structure of Earnings
Survey that no more than 25 of workers in firms with at least 10 employees in that
country were paid less than 67 of national median gross hourly earnings in 2010 It
should be noted however that this excludes large sections of the economy ‒ those
working in agriculture and the public sector as well as those in firms with fewer than 10
employees many of whom are likely to be low paid
Poverty effects of an EU minimum wage
The effectiveness of the minimum wage as an anti-poverty tool depends on a variety of
factors over and above its level To start with if the minimum wage is set in hourly
terms the number of hours a worker is employed is clearly important On the other
hand compliance also matters if the minimum wage is not enforceable (as in informal
labour markets or segments thereof) raising it may well fail to improve the incomes of
low-paid workers Finally if increases to the minimum wage lsquopricersquo some workers out of
13 Note that although in Hungary the minimum wage is formally above 50 of national average wages the data show that a number of low-wage workers actually work long hours In their case dividing monthly pay by hours worked (as explained in the Methodology section) results in an hourly wage that is below the statutory minimum 14 A wage increase from 385 to 50 of average earnings amounts to a relative increase of 30 In Annex Table A14 introducing a minimum wage at 50 of average hourly earnings would
result in hourly wage increases of 30 or more for 81 of workers in our sample in Sweden
The interaction between minimum wages income support and poverty
19
the labour market then to them a higher minimum wage will mean lower not higher
incomes
While the above considerations concern the effectiveness of minimum wages in raising
the earnings of low-paid workers poverty effects will also depend on their household
circumstances ndash in other words on
(i) The position of minimum-wage earners in the household ie whether they
are primary earners (ie heads of household) or secondary earners (eg
spouses or working-age children living in the parental home)
(ii) The contribution to household income by other household members
Furthermore the poverty effect of changes to the minimum wage will also depend on
interactions with the tax and benefit system specifically on the extent to which
improvements in market incomes (in this case labour earnings) resulting from higher
minimum wages may be partly offset by
(iii) Increases in income taxes and social contributions
(iv) Reductions in social assistance and other cash benefits
Such interactions can be decisive For example it has been estimated that ldquoin Ireland
[hellip] without any accompanying measures such as raising means-tested benefits in line
with the minimum wage less than a tenth of a minimum wage increase would end up
in the pockets of single-parent minimum wage earners [while in] Luxembourg a
minimum-wage increase could actually make a single parent worse off as benefit
reductions and higher social contributions can outweigh the wage increaserdquo (OECD
2015a) Elsewhere the culprit is the lsquotax wedgersquo between labour costs and workersrsquo
take-home pay which exceeds 45 of the gross minimum wage in countries where
social contributions are high as in Germany Poland and Slovenia or where income tax
schedules are flat as in Hungary and Latvia (OECD 2015b)
In Part I it was established that between a quarter and a half of all those living in
households where at least one member earned below 50 of average earnings lived in
households where that member was not the head (see Figure 2 and Annex Table A4)
Moreover even though in some countries (Greece Luxembourg Italy Hungary and
France) the poverty rate of households with low earners was 10 or more points above
the average for all households with a head aged below 65 in most other Member States
the difference was small What is more in as many as 7 countries (Ireland the
Netherlands Slovenia Finland Croatia Belgium and Romania) households with low
earners actually reported below-average poverty rates (see Figure 3)
Here in Part II the picture is completed by simulating the poverty effects of raising the
minimum wage to 50 of average hourly earnings (or introducing one at that level
where none exists) We do so taking into account the household circumstances of
minimum-wage earners as well as interactions with taxes and benefits Also we
assume no employment effects or behavioural responses Finally to focus on genuine
improvements in low incomes we fix the poverty line at the baseline15
A useful point of departure is to establish the extent to which low earnings actually
overlap with income poverty As seen in Table A15 this is rather limited across the EU
among all persons living in households with low earners only 177 were poor and
among all persons in our reference group (households of employees who worked for 12
months full-time or 12 months part-time during the previous year) only 23 lived in
poor households with low earners So the scope for reducing in-work poverty via an
increase in the minimum wage may not be great
15 In fact if the hike in minimum wages is entirely absorbed by employers taking lower profits assuming no shifting of higher labour costs onto consumers in the form of higher prices and no job losses then the first effect of the policy change will necessarily be to raise real disposal incomes at aggregate level and quite probably the income of the median person too in which
case the increase in the minimum wage will also raise the poverty threshold
The interaction between minimum wages income support and poverty
20
Having said that our results show that the poverty effects of higher minimum wages
may not be entirely negligible either As shown in Table A16 in-work poverty would
decline by 22 percentage points in Austria and by 16 to 19 points in another four
countries (Cyprus Malta Estonia and Luxembourg) In most Member States poverty
reduction would be between 06 and 13 percentage points (around 10 point in France
Germany and Spain) At the other extreme at-risk-of-poverty rates would fall by 02
to 04 of a percentage point in four countries (Croatia Romania Latvia and Finland)
and would remain unchanged in another four (Slovenia Slovakia Bulgaria and Poland)
With the exception of Cyprus where raising the minimum wage to 50 of average
hourly earnings would reduce poverty rates for women by 10 percentage point more
than it would for men gender effects were rather small At one end of the scale female
poverty rates in Sweden would fall by 03 of a percentage point more than male ones
At the other end female poverty rates in Denmark would fall by 04 of a percentage
point less than male ones
In terms of age the reduction in poverty following an increase in the minimum wage
would least benefit the elderly (see Table A17) Only in Cyprus where a large number
of pensioners lived with their working children would the rise in the minimum wage
significantly reduce the at-risk-of-poverty rate among older people (by 32 percentage
points) Elsewhere poverty in old age would fall by less than half percentage point
Conversely in most Member States (16 out of 28) child poverty would decline by at
least one percentage point following an increase in the minimum wage In Austria the
size of child poverty reduction would be 34 percentage points In Luxembourg and
Malta it would be 26 points Child poverty would also fall appreciably in Estonia (by 2
percentage points) in France (18) and in Portugal and Sweden (both 15 points)
Young people (aged 18-29) would appear to be the greatest beneficiaries of a rise in
the minimum wage in terms of a reduction in at-risk-of-poverty rates In 19 Member
States the size of poverty reduction for that age group would be at least 12 percentage
points In Germany and Sweden it would be 25 points in Greece 27 and in Denmark
31 In Austria youth poverty would fall by as much as 38 percentage points16
Inequality effects of an EU minimum wage
Finally another effect of an EU-wide minimum hourly wage set at 50 of average hourly
earnings assuming no adverse employment effects would be to reduce income
inequality in most Member States As seen in Table A18 the reduction in inequality as
measured by the Gini index would be largest in Portugal (09 percentage points)
followed by Austria and Cyprus (07 pp) Sweden Hungary and Estonia (06 pp) then
France Spain Malta Lithuania and Luxembourg (05 pp) Although in another 13
countries the reduction would be small (01 to 04 percentage points) only in Poland
Bulgaria Slovenia and Slovakia would the Gini index remain unchanged
While the Gini index is known to be most sensitive to changes around the middle of the
income distribution by definition the opposite is the case with the income quintile share
ratio (S80S20) which measures the total income received by the top quintile relative
to that received by the bottom quintile Our results show that raising minimum hourly
wages to 50 of average hourly earnings would reduce the S80S20 ratio in 24 out of
28 Member States This may be interpreted as evidence that at the very least the
increase in minimum wages would benefit poorer households more than it would richer
ones The effect would be greatest in three South European countries in Spain the
ratio would fall by 024 in Portugal and Greece by 018 and 016 respectively17
16 In Annex Tables A16 and A17 only differences in poverty rates are presented (ie before and after raising the minimum wage to 50 of average hourly earnings)
17 Note however that in Italy the S80S20 ratio would decline by a mere 002
The interaction between minimum wages income support and poverty
21
Concluding remarks
This Research Note set out to answer two distinct but closely related questions
(i) What is the relationship between low wages and poverty
(ii) Would an EU-wide minimum wage at 50 of national average hourly wages
be effective in reducing poverty
Clearly poverty analysis requires shifting the focus to the household circumstances of
low-wage workers which provides the rationale for analysing EU-SILC data The
analysis here complements Oumlzdemir amp Ward (2015) who examined the individual
characteristics of low-wage workers using LFS data
Working with EU-SILC data to identify workers on low hourly wages has important
drawbacks such as possible measurement errors affecting both earnings and working
hours and discrepancies between the reference periods of the variables involved (the
survey year for usual working hours the previous year for labour earnings and full-
timepart-time employment status) To minimise errors in estimates the analysis was
restricted to a subset of households with employees who had worked throughout the
income year
With these caveats in mind the findings can be summarised as follows
With respect to the first question there is little evidence of a concentration of low pay
in households in EU Member States The proportion of households with two or more low-
wage employees turns out to be below 3 in all Member States Put differently among
all persons living in working-age households with at least one low earner the proportion
of those living in households with two or more low earners is below 20 in all Member
States and is usually below 10 (in 16 out of 28 Member States)
Furthermore most low earners are not lsquoprimary earnersrsquo among all individuals living in
low-wage households the majority (51-75) are in households where the low earner
is either the spouse or another person but not the household head
Households with a low earner typically face higher at-risk-of-poverty rates than other
working-age households (in 21 out 28 Member States) The rate among those living in
households with low-wage earners is highest in Greece Luxembourg and Italy (over
30) and is lowest in the Netherlands Ireland and Slovenia (below 10)
The risk of poverty is higher still where the person earning a low wage is the household
head most especially in Denmark Germany and Bulgaria The risk of poverty among
households with low earners is also increased by low work intensity the effect being
most pronounced in Bulgaria Lithuania and Hungary The number of dependants
children especially is also associated with a higher risk this being particularly the case
in Greece and France
A tentative attempt was made to answer the second question using EUROMOD to
estimate the effects on the risk of poverty of introducing a minimum wage in all
countries at 50 of national average wages taking into account interactions with tax-
benefit policies and assuming no effects on employment Setting a minimum wage at
this level is estimated to affect under 5 of employees in Belgium and Finland but over
20 in Latvia and Lithuania In some Member States a large proportion of those
affected (over 60 in Italy and Sweden) would appear to receive significant pay rises
(in excess of 30) a finding which may in part be attributed to measurement error
The anti-poverty effect of raising the minimum wage (as measured relative to a fixed
poverty threshold) would be small but not trivial The at-risk-of-poverty rate would fall
by at least 10 percentage point in 13 out of 28 Member States The size of poverty
reduction would be largest among working households with children and young adults
Our findings suggest that given the household circumstances of low-wage workers and
the current rules of tax and benefit systems raising minimum wages to 50 of national
average hourly wages is likely to have positive but modest effects in terms of reducing
the number of people at risk of poverty
The interaction between minimum wages income support and poverty
22
Our analysis is limited to households of employees who worked for 12 months full-time
or 12 months part-time during the previous year This inevitably excludes several
employees working intermittently18 (ie less than 12 months over the previous year)
or those switching from part-time to full-time work or vice versa While the latter
category might benefit from the increase in minimum wages simulated here the former
would probably benefit less
More generally minimum wage increases would do little directly to improve the living
standards of the self-employed including ldquothe so-called lsquobogus self-employedrsquo who do
similar work to regular employees but whose contracts are not protected by the same
safeguards and regulationsrdquo (OECD 2015b) Nor would minimum wage increases raise
the earnings of informal workers except possibly in the context of the lsquolighthouse
effectrsquo19
Nevertheless setting the minimum wage at 50 of national average hourly wages EU-
wide can also be supported on grounds other than poverty reduction In particular a
higher minimum wage will by definition reduce earnings inequality at individual level
(while as shown earlier in most countries it would also reduce income inequality at
household level) Also setting a wage floor may address considerations of fairness and
counterbalance the monopsony power of some employers Moreover the minimum
wage may act as a lsquobeneficial constraintrsquo increasing the value of the job for both workers
and employers limiting costly turnover providing incentives for training and altogether
raising productivity
Finally while the minimum wage may be a blunt instrument for poverty reduction on its
own better coordination with other tax-benefit policies may significantly increase its
overall effect For instance a broader targeting of means-tested assistance and a lower
tax wedge will make work pay more even when pay is low enhancing the extent to
which minimum wage increases can improve take-home pay In-work benefits20 have
often proved effective in this respect Conversely the case for minimum wages becomes
stronger in the presence of in-work benefits as the former prevent the latter from being
captured by employers rather than by their intended beneficiaries
18 Note that employees working intermittently were included if they lived in a household with a member who worked for 12 months full-time or 12 months part-time during the previous year 19 A lsquolighthouse effectrsquo is said to be observed when employers and workers in the informal sector (where minimum wages are not legally enforced) set pay by reference to the level of the minimum wage in the formal sector When this is the case wages in the informal sector will move in line with minimum wages in the formal sector In contrast under the standard model workers
displaced from the formal sector after the introduction or increase of a minimum wage will seek employment in the informal sector causing wages there to fall For a recent analysis see Boeri et al (2011) 20 The Earned Income Tax Credit in the US and the Working Tax Credit in the UK are the best known such schemes For a formal analysis of in-work benefits in an optimal tax design setting see Brewer et al (2010) For a comprehensive review of schemes in a variety of countries see
Immervoll amp Pearson (2009)
The interaction between minimum wages income support and poverty
23
References
Boeri T amp van Ours J (2013) The economics of imperfect labor markets (2nd edition)
Princeton NJ Princeton University Press
Boeri T Garibaldi P amp Ribeiro M (2011) The lighthouse effect and beyond Review of
Income and Wealth 57 S54-S78
Brewer M Saez E amp Shephard A (2010) Means testing and tax rates on earnings In
Dimensions of tax design the Mirrlees Review Oxford Oxford University Press
Cantillon B (2011) The paradox of the social investment state growth employment
and poverty in the Lisbon era Journal of European Social Policy 21 (5) 432-449
Cantillon B Collado D amp Van Mechelen N (2015) The end of decent social protection
for the poor The dynamics of low wages minimum income packages and median
household incomes ImPRovE Working Paper No 1503 University of Antwerp
Card D amp Krueger A (1994) Minimum wages and employment a case study of the fast-
food industry in New Jersey and Pennsylvania American Economic Review 48 (4) 772-
793
Card D amp Krueger A (1995) Myth and measurement the new economics of the
minimum wage Princeton NJ Princeton University Press
Doucouliagos H amp Stanley TD (2009) Publication selection bias in minimum-wage
research A meta-regression analysis British Journal of Industrial Relations 47 (2) 406-
428
Dube A (2013) Minimum wages and the distribution of family incomes (mimeo)
Dube A Lester W amp Reich M (2010) Minimum wage effects across state borders
Estimates using contiguous counties Review of Economics and Statistics 92 (4) 945-
964
Gaacutebos A Branyiczki R Lange B amp Toacuteth IG (2015) Employment and poverty dynamics
in the EU countries before during and after the crisis ImPRovE Working Paper 1506
University of Antwerp
Immervoll H amp Pearson M (2009) A good time for making work pay Taking stock of
in-work benefits and related measures across the OECD Social Employment and
Migration Working Paper 81 Paris Organisation for Economic Co-operation and
Development
Maicirctre B Nolan B amp Whelan CT (2012) Low pay in-work poverty and economic
vulnerability a comparative analysis using EU-SILC Manchester School 80 (1) 99-116
Neumark D amp Wascher W (2008) Minimum wages Cambridge MA The MIT Press
OECD (2011) Divided We Stand Why inequality keeps rising Paris Organisation for
Economic Co-operation and Development
OECD (2015a) Employment Outlook Paris Organisation for Economic Co-operation and
Development
OECD (2015b) Minimum wages after the crisis making them pay Paris Organisation
for Economic Co-operation and Development
Oumlzdemir E amp Ward T (2015) The characteristics of workers on low wages Social
Situation Monitor Research Note 92015 Brussels European Commission
Schmitt J (2013) Why does the minimum wage have no discernible effect on
employment Washington DC Center for Economic and Policy Research
Ward T amp Oumlzdemir E (2009) Measuring work intensity Social Situation Monitor
Research Note 92009 Brussels European Commission
Wolfson P amp Belman D (2014) What does the minimum wage do Kalamazoo MI
Upjohn Institute for Employment Research
The interaction between minimum wages income support and poverty
24
Annex
Table A1 Percentage of full-year employees among all employees
full-year employees
(either full-time or part-time)
employees with spells of self-
employment or employment
change during the year
employees with
spells of inactivity during the year
low-wage non-low wage
BE 28 816 71 85 1000
BG 67 823 06 103 1000
CZ 83 811 34 72 1000
DK 35 844 16 105 1000
DE 123 740 79 60 1000
EE 124 643 113 120 1000
IE 153 666 61 120 1000
EL 88 760 53 99 1000
ES 126 712 50 113 1000
FR 51 793 76 80 1000
HR 97 791 23 90 1000
IT 93 779 66 61 1000
CY 181 666 39 115 1000
LV 201 644 58 97 1000
LT 190 691 17 103 1000
LU 169 688 70 73 1000
HU 47 770 72 111 1000
MT 81 778 85 56 1000
NL 68 831 20 81 1000
AT 92 714 69 126 1000
PL 139 703 76 82 1000
PT 126 768 49 58 1000
RO 71 888 28 13 1000
SI 73 831 45 52 1000
SK 49 850 42 58 1000
FI 31 756 33 180 1000
SE 75 803 41 81 1000
UK 136 719 99 46 1000
Source EU-SILC 2013 UDB August 2015
The interaction between minimum wages income support and poverty
25
Table A2 Number of low earners in the sample
number of low
earners number of all
workers
no of individuals in households
with low earners
number of individuals
BE 143 4238 34 413 14623 28
BG 293 3876 75 982 12425 79
CZ 561 6064 93 1688 19105 88
DK 171 4185 41 477 13910 34
DE 1334 9242 144 3381 26709 127
EE 709 4406 161 1999 15053 133
IE 574 3065 187 1683 12663 133
EL 317 3025 105 955 18030 53
ES 1146 7589 151 3271 32162 102
FR 461 7524 61 1378 26353 52
HR 373 3411 109 1328 13897 96
IT 1154 10841 106 3290 44622 74
CY 839 3931 213 2546 13277 192
LV 1044 4367 239 2865 14624 196
LT 804 3731 216 2427 11754 206
LU 651 3288 198 1805 9994 181
HU 408 6957 59 1258 25441 49
MT 341 3570 95 1135 11965 95
NL 589 7849 75 1630 24629 66
AT 476 3867 123 1538 13250 116
PL 1482 8975 165 5093 36438 140
PT 665 4715 141 2093 16410 128
RO 392 5297 74 1271 17672 72
SI 692 8605 80 2191 27265 80
SK 284 5231 54 969 15456 63
FI 299 7661 39 733 27910 26
SE 438 5155 85 1230 15218 81
UK 1114 7012 159 3217 23251 138
Note Low earners are defined as those earning less than 50 of average hourly wages The reference group is households of employees who worked for 12 months full-time or 12 months part-time during the previous year Source EU-SILC 2013 UDB August 2015
The interaction between minimum wages income support and poverty
26
Table A3 Concentration of low earners in households
households () individuals ()
no low earners
one low earner
more
than one low earners
total no low earners
one low earner
more
than one low earners
total
BE 972 27 01 1000 967 32 01 1000
BG 924 68 08 1000 910 77 13 1000
CZ 912 83 05 1000 898 96 06 1000
DK 968 32 00 1000 959 41 01 1000
DE 872 117 11 1000 843 141 16 1000
EE 871 120 09 1000 854 134 12 1000
IE 863 124 13 1000 853 131 16 1000
EL 945 51 04 1000 940 56 04 1000
ES 897 94 09 1000 885 103 12 1000
FR 948 50 01 1000 938 61 02 1000
HR 912 79 09 1000 894 92 14 1000
IT 920 76 04 1000 913 82 05 1000
CY 809 172 19 1000 789 187 24 1000
LV 804 171 26 1000 779 186 35 1000
LT 806 176 17 1000 761 216 23 1000
LU 833 140 28 1000 798 162 41 1000
HU 952 43 05 1000 944 50 06 1000
MT 913 80 07 1000 894 96 10 1000
NL 935 62 04 1000 921 73 06 1000
AT 898 92 10 1000 864 118 18 1000
PL 875 110 15 1000 846 132 22 1000
PT 869 122 10 1000 851 136 14 1000
RO 934 56 11 1000 919 66 15 1000
SI 922 74 04 1000 908 87 05 1000
SK 939 56 05 1000 931 63 06 1000
FI 970 30 00 1000 968 32 00 1000
SE 919 78 03 1000 902 94 04 1000
UK 862 126 12 1000 839 147 14 1000
Note Low earners are defined as those earning less than 50 of average hourly wages The reference group is households of employees who worked for 12 months full-time or 12 months part-time during the previous year Source EU-SILC 2013 UDB August 2015
The interaction between minimum wages income support and poverty
27
Table A4 Distribution of individuals living in households with low earners ()
by the position of the low earner(s) in the household
single adult on low wage
households with two or more adults
total spouse (not head) on
low wage
other member
(not head) on low wage
only head on low wage
head and other
member on low wage
BE 59 472 233 199 37 1000
BG 34 380 250 227 110 1000
CZ 31 579 173 180 37 1000
DK 89 274 309 325 03 1000
DE 88 424 265 178 46 1000
EE 70 524 138 213 55 1000
IE 49 347 264 267 73 1000
EL 47 270 404 248 31 1000
ES 49 319 266 303 64 1000
FR 68 436 220 259 17 1000
HR 09 386 287 234 83 1000
IT 86 248 285 328 53 1000
CY 27 298 351 252 72 1000
LV 63 287 222 294 134 1000
LT 55 432 123 314 76 1000
LU 72 332 184 252 160 1000
HU 30 369 178 366 57 1000
MT 45 257 415 249 33 1000
NL 80 381 372 160 08 1000
AT 61 328 382 199 31 1000
PL 16 292 310 296 86 1000
PT 31 406 200 304 59 1000
RO 12 378 257 205 149 1000
SI 39 480 197 242 41 1000
SK 21 426 239 249 65 1000
FI 126 373 146 348 06 1000
SE 97 514 139 215 35 1000
UK 79 390 186 283 63 1000
Note Low earners are defined as those earning less than 50 of average hourly wages The reference group is households of employees who worked for 12 months full-time or 12 months part-time during the previous year
Source EU-SILC 2013 UDB August 2015
The interaction between minimum wages income support and poverty
28
Table A5 Distribution of individuals living in households with low earners ()
by work intensity
work intensity
001-049 05 051-080 081-099 10
BE 168 74 273 152 333 1000
BG 215 137 261 66 321 1000
CZ 73 94 335 60 437 1000
DK 18 175 153 160 495 1000
DE 131 96 361 197 215 1000
EE 90 152 278 102 377 1000
IE 339 111 271 95 184 1000
EL 381 169 226 58 165 1000
ES 235 156 281 104 225 1000
FR 171 103 241 128 357 1000
HR 148 222 289 61 281 1000
IT 240 158 251 122 228 1000
CY 158 104 276 85 378 1000
LV 90 172 311 61 367 1000
LT 110 125 238 51 476 1000
LU 100 116 339 148 297 1000
HU 212 116 289 92 291 1000
MT 216 139 354 134 157 1000
NL 300 66 359 198 77 1000
AT 98 111 330 251 209 1000
PL 135 153 302 86 325 1000
PT 143 131 299 54 372 1000
RO 108 168 379 56 289 1000
SI 63 151 238 74 473 1000
SK 80 151 397 106 266 1000
FI 68 156 197 158 422 1000
SE 36 74 158 220 512 1000
UK 165 88 300 164 284 1000
Note Low earners are defined as those earning less than 50 of average hourly wages The reference group is households of employees who worked for 12 months full-time or 12 months part-time during the previous year Source EU-SILC 2013 UDB August 2015
The interaction between minimum wages income support and poverty
29
Table A6 Distribution of individuals living in households with low earners ()
by household type
households with working-age head households with elderly
head total one or more
adult no
children
single adult with
children
two or more adults one
or two children
two or more adults three
or more children
BE 431 17 446 95 11 1000
BG 455 14 410 111 11 1000
CZ 584 08 356 38 14 1000
DK 460 00 335 186 18 1000
DE 549 23 366 54 08 1000
EE 510 10 383 41 56 1000
IE 395 34 480 78 12 1000
EL 609 03 336 19 33 1000
ES 499 19 421 50 11 1000
FR 443 22 431 92 12 1000
HR 393 05 495 81 27 1000
IT 514 18 380 69 20 1000
CY 496 05 435 50 15 1000
LV 497 27 387 68 21 1000
LT 409 27 459 91 14 1000
LU 344 24 475 148 09 1000
HU 475 10 417 93 05 1000
MT 397 28 528 35 12 1000
NL 551 17 359 67 05 1000
AT 393 17 500 77 13 1000
PL 423 05 472 87 14 1000
PT 380 11 573 28 09 1000
RO 363 03 562 72 00 1000
SI 369 09 522 94 06 1000
SK 514 07 433 31 15 1000
FI 528 37 306 117 12 1000
SE 315 23 505 145 12 1000
UK 421 48 398 97 37 1000
Note Low earners are defined as those earning less than 50 of average hourly wages The reference group is households of employees who worked for 12 months full-time or 12 months part-time during the previous year
Source EU-SILC 2013 UDB August 2015
The interaction between minimum wages income support and poverty
30
Table A7 At risk-of-poverty rate before and after social transfers ()
individuals living in households with low
earner(s) individuals living in all households with
head of working age
after social transfers
before social transfers
number of observations
after social transfers
before social transfers
number of observations
BE 139 388 413 142 293 12347
BG 281 465 982 189 319 10758
CZ 114 324 1688 91 223 16341
DK 168 325 477 119 233 11401
DE 194 358 3381 160 249 21428
EE 191 417 1999 172 277 12919
IE 74 460 1683 144 333 11313
EL 383 525 955 244 369 15473
ES 266 469 3271 213 369 28077
FR 243 509 1378 146 329 21871
HR 127 392 1328 183 309 12156
IT 310 477 3290 193 336 37058
CY 201 354 2546 152 271 11891
LV 216 453 2865 196 320 12681
LT 240 460 2427 202 337 10002
LU 313 593 1805 170 366 8836
HU 254 520 1258 156 377 22402
MT 173 339 1135 153 303 10554
NL 58 193 1630 111 243 20607
AT 145 380 1538 140 332 11165
PL 195 428 5093 180 337 32690
PT 199 393 2093 195 315 13916
RO 201 460 1271 233 368 15752
SI 96 466 2191 134 327 23665
SK 128 358 969 106 244 13769
FI 102 366 733 107 274 22741
SE 166 476 1230 140 266 12356
UK 166 416 3217 153 293 19220
Note Low earners are defined as those earning less than 50 of average hourly wages The reference group is households of employees who worked for 12 months full-time or 12 months part-time during the previous year Source EU-SILC 2013 UDB August 2015
The interaction between minimum wages income support and poverty
31
Table A8 At risk-of-poverty gap before and after social transfers ()
individuals living in households with low
earners individuals living in all households with
head of working age
after social transfers
before social transfers
after social transfers
before social transfers
BE 213 388 253 535
BG 341 427 372 451
CZ 148 309 247 352
DK 422 438 293 460
DE 207 410 244 446
EE 206 359 320 457
IE 219 420 246 491
EL 305 394 368 452
ES 275 403 353 509
FR 224 488 223 465
HR 264 338 324 427
IT 348 445 354 451
CY 222 435 216 381
LV 270 330 339 452
LT 237 391 304 481
LU 186 348 216 439
HU 216 421 255 457
MT 216 413 230 500
NL 151 328 228 492
AT 280 334 295 476
PL 222 331 276 431
PT 244 345 341 412
RO 315 360 377 445
SI 148 346 250 435
SK 214 337 304 409
FI 143 257 230 459
SE 283 410 288 444
UK 225 440 249 461
Note Low earners are defined as those earning less than 50 of average hourly wages The reference group is households of employees who worked for 12 months full-time or 12 months part-time during the previous year Source EU-SILC 2013 UDB August 2015
The interaction between minimum wages income support and poverty
32
Table A9 At-risk-of-poverty rate of households with low earners () by the
position of the low earner in the household
at-risk-of-poverty rate () number of observations
head on low wage
spouse (not
head) on
low wage
other member
(not head) on low wage
total head on low wage
spouse (not
head) on
low wage
other member
(not head) on low wage
total
BE 177 166 34 139 122 195 96 413
BG 471 178 166 283 361 370 244 976
CZ 139 82 188 114 419 977 292 1688
DK 413 05 00 174 192 126 142 460
DE 403 119 72 195 1044 1422 889 3355
EE 259 133 194 184 655 1018 268 1941
IE 108 65 36 74 655 585 443 1683
EL 534 310 299 378 309 256 383 948
ES 345 206 221 268 1341 1029 858 3228
FR 360 179 188 243 467 593 299 1360
HR 230 82 71 127 434 513 382 1328
IT 448 231 152 310 1529 814 938 3281
CY 343 210 52 201 892 759 895 2546
LV 235 165 240 216 1368 800 620 2787
LT 305 184 220 242 1059 1029 292 2379
LU 400 252 191 313 874 597 326 1798
HU 358 192 119 254 570 464 225 1258
MT 343 101 85 173 372 292 472 1135
NL 144 42 19 59 395 605 597 1598
AT 299 79 80 143 445 503 585 1533
PL 298 175 108 203 1906 1399 1486 4791
PT 247 161 179 199 814 839 414 2067
RO 239 156 216 201 465 480 326 1271
SI 148 61 96 96 701 1042 428 2171
SK 238 87 47 128 324 413 232 969
FI 170 56 00 103 350 272 107 728
SE 305 74 136 163 419 622 168 1209
UK 199 153 117 166 1359 1249 596 3204
Note Low earners are defined as those earning less than 50 of average hourly wages The
reference group is households of employees who worked for 12 months full-time or 12 months part-time during the previous year
Source EU-SILC 2013 UDB August 2015
The interaction between minimum wages income support and poverty
33
Table A10 At-risk-of-poverty rate of households with low earners () by
work intensity
at risk-of-poverty rate () number of observations
0-049 05-099 1 total 0-049 05-099 1 total
BE 383 72 46 139 100 175 137 413
BG 603 111 104 282 344 320 313 977
CZ 331 88 57 115 281 664 735 1681
DK 556 21 114 170 91 147 233 471
DE 345 132 199 194 764 1885 727 3377
EE 437 97 138 195 470 736 731 1938
IE 120 41 29 74 754 613 308 1675
EL 589 134 120 382 524 271 158 953
ES 402 188 163 266 1277 1256 734 3266
FR 462 190 131 243 378 507 492 1377
HR 288 33 32 127 491 464 373 1328
IT 517 172 173 310 1306 1218 742 3266
CY 369 93 188 201 664 917 960 2541
LV 457 148 119 218 742 1051 1040 2833
LT 551 236 93 242 563 696 1143 2403
LU 600 293 135 313 391 872 535 1798
HU 562 109 96 254 413 479 367 1258
MT 373 60 66 172 403 553 178 1134
NL 105 35 00 58 592 908 125 1625
AT 330 89 115 145 322 894 322 1537
PL 381 143 94 196 1462 1972 1650 5084
PT 453 114 96 200 571 737 775 2083
RO 421 172 37 201 351 553 367 1271
SI 270 63 39 96 469 685 1037 2191
SK 269 80 97 128 223 485 257 965
FI 154 94 81 102 164 260 309 733
SE 421 105 159 167 135 461 626 1222
UK 383 122 57 169 789 1447 888 3124 Note Low earners are defined as those earning less than 50 of average hourly wages The reference group is households of employees who worked for 12 months full-time or 12 months part-time during the previous year Source EU-SILC 2013 UDB August 2015
The interaction between minimum wages income support and poverty
34
Table A11 At-risk-of-poverty rate of households with low earners () by
number of children
at risk-of-poverty rate () number of observations in dataset
without children
with children
total without children
with children
total
BE 100 171 139 178 230 413
BG 185 367 281 446 525 982
CZ 121 108 114 987 678 1688
DK 98 235 168 220 249 477
DE 211 173 194 1854 1499 3380
EE 157 250 191 1019 868 1998
IE 60 85 74 665 997 1683
EL 333 490 383 582 342 955
ES 191 346 266 1632 1602 3270
FR 133 338 243 610 752 1378
HR 120 138 127 521 771 1328
IT 267 367 310 1682 1535 3281
CY 237 168 201 1262 1247 2546
LV 159 283 216 1424 1380 2865
LT 153 307 240 993 1400 2427
LU 223 361 313 614 1168 1798
HU 247 263 254 598 654 1258
MT 79 238 173 451 671 1135
NL 25 94 58 893 723 1625
AT 105 174 145 605 914 1538
PL 121 254 195 2152 2872 5093
PT 133 243 199 794 1281 2093
RO 105 256 201 461 810 1271
SI 98 96 96 809 1369 2191
SK 127 133 128 498 457 969
FI 75 136 102 387 337 733
SE 189 155 166 388 828 1230
UK 132 199 166 1354 1741 3213
Note Low earners are defined as those earning less than 50 of average hourly wages The reference group is households of employees who worked for 12 months full-time or 12 months part-time during the previous year Source EU-SILC 2013 UDB August 2015
The interaction between minimum wages income support and poverty
35
Table A12 Share of social benefits in total income of households with low
earners
old-age pensions
family benefits
unemployment
benefits
housing benefits
social assistance
other benefits
total social benefits
BE 3 6 4 0 0 3 15
BG 10 2 2 0 0 3 18
CZ 7 1 0 0 0 6 15
DK 1 2 5 0 0 5 14
DE 3 5 2 1 0 1 12
EE 10 3 0 0 0 5 19
IE 3 8 8 0 0 3 23
EL 14 1 1 0 0 1 16
ES 8 0 9 0 1 3 21
FR 9 4 5 2 1 1 22
HR 8 5 1 0 0 6 20
IT 8 2 5 0 0 2 17
CY 10 2 4 0 0 3 19
LV 11 2 1 0 0 4 18
LT 6 5 1 0 1 6 19
LU 5 9 2 1 1 2 21
HU 9 7 1 0 0 3 19
MT 5 3 0 0 2 2 12
NL 2 1 1 1 1 2 8
AT 4 6 2 0 0 2 14
PL 12 2 1 0 0 3 17
PT 9 2 3 0 0 2 16
RO 11 4 0 0 0 3 18
SI 3 14 1 0 1 8 27
SK 11 3 0 0 0 5 20
FI 3 4 3 1 0 3 13
SE 2 11 2 0 0 7 23
UK 6 5 1 1 1 2 16
Note Other benefits include sickness disability and education-related benefits Low earners are defined as those earning less than 50 of average hourly wages The reference group is households of employees who worked for 12 months full-time or 12 months part-time during the previous year Source EU-SILC 2013 UDB August 2015
The interaction between minimum wages income support and poverty
36
Table A13 National minimum wages vs 50 of average earnings 2014
average hourly
earnings (euro)
average monthly
earnings (euro)
50 of average
monthly earnings (euro)
national monthly
minimum wage (euro)
required increase
()
BE 1954 3480 1740 1502 16
BG 237 417 208 174 20
CZ 537 987 494 329 50
DK 2622 4524 2262
DE 1756 3506 1753
EE 592 1070 535 355 51
IE 2227 3854 1927 1462 32
EL 846 1457 729 684 7
ES 1079 1925 963 753 28
FR 1531 2511 1256 1445 -13
HR 506 908 454 406 12
IT 1370 2255 1128
CY 1155 2032 1016
LV 494 897 448 320 40
LT 407 716 358 290 24
LU 2687 4918 2459 1921 28
HU 317 562 281 328 -14
MT 960 1744 872 718 21
NL 2221 3964 1982 1490 33
AT 1900 3546 1773
PL 477 858 429 404 6
PT 742 1333 666 566 18
RO 230 414 207 198 5
SI 957 1688 844 789 7
SK 485 869 435 352 23
FI 2080 3620 1810
SE 2512 3596 1798
UK 1771 2766 1383 1303 6
Note The reference group is households of employees who worked for 12 months full-time or 12 months part-time during the previous year Source EUROMOD version G275+ running on EU-SILC 2012 data uprated to 2014 (except for France and Luxembourg EU-SILC 2010 data uprated to 2014) Figures on current monthly minimum wages (in 2014) from Eurostat
The interaction between minimum wages income support and poverty
37
Table A14 Distribution of workers affected by the increase in minimum wages
to 50 of average hourly earnings by level of increase ()
total
affected
increase in earnings to 50 of average earnings not affected
lt10 1001-20 2001-30 gt30
BE 40 16 04 05 16 960
BG 104 42 46 04 11 896
CZ 85 31 20 12 22 915
DK 61 10 10 09 31 939
DE 167 35 21 17 94 833
EE 176 36 41 31 68 824
IE 178 57 45 28 48 822
EL 116 35 23 20 38 884
ES 96 29 18 11 38 904
FR 77 15 10 06 47 923
HR 93 32 28 12 21 907
IT 113 18 15 10 70 887
CY 210 45 30 26 109 790
LV 220 46 52 38 83 780
LT 209 40 36 31 103 791
LU 183 57 48 34 44 817
HU 90 36 33 09 12 910
MT 93 34 25 07 27 907
NL 83 24 16 11 33 917
AT 131 28 16 13 73 869
PL 153 46 33 22 53 847
PT 173 50 48 22 53 827
RO 93 29 16 12 36 907
SI 86 28 12 05 41 914
SK 62 20 14 08 19 938
FI 42 16 08 06 13 958
SE 121 18 12 09 81 879
UK 188 60 43 19 66 812
Note The reference group is households of employees who worked for 12 months full-time or 12 months part-time during the previous year Source EUROMOD version G275+ running on EU-SILC 2012 data uprated to 2014 (except for France and Luxembourg EU-SILC 2010 data uprated to 2014) Figures on current monthly minimum wages (in 2014) from Eurostat
The interaction between minimum wages income support and poverty
38
Table A15 Poverty risk in households of low earners 2014
total earners
(1) low earners
(2)
of which in
poor households (3)
poverty rate of
low earners (4) = (3) (2)
low earners in poor households
as of all earners
(4) = (3) (1)
BE 3353261 134026 17970 134 05
BG 2362137 244588 63961 262 27
CZ 3331428 282085 29516 105 09
DK 1749226 106300 25224 237 14
DE 30271881 5068452 793234 157 26
EE 427162 75190 17895 238 42
IE 1164123 207729 17405 84 15
EL 2084532 242333 72889 301 35
ES 12258632 1177421 309078 263 25
FR 19911322 1535080 234136 153 12
HR 1063434 98966 12125 123 11
IT 15503093 1749434 488952 279 32
CY 284162 59795 10793 180 38
LV 628621 138371 27466 198 44
LT 928391 194150 37148 191 40
LU 184141 33673 6327 188 34
HU 2775484 250535 45132 180 16
MT 129372 12027 2446 203 19
NL 5544901 462701 60572 131 11
AT 2596626 341187 63808 187 25
PL 10166671 1558698 280035 180 28
PT 3303603 571146 80247 141 24
RO 6214151 580179 99679 172 16
SI 647095 55639 7210 130 11
SK 1807568 111931 21873 195 12
FI 1514848 63844 6723 105 04
SE 3232371 390717 64719 166 20
UK 22093617 4156506 633675 152 29
EU-28
155531853 19902703 3530237 177 23
Note Low earners are those earning less than 50 of average hourly wages The reference group is households of employees who worked for 12 months full-time or 12 months part-time during
the previous year The poverty threshold is at 60 of national household disposable equivalised income The poverty rate is the share of population (or population group) below that threshold Source EUROMOD version G275+ running on EU-SILC 2012 data uprated to 2014 (except for France and Luxembourg EU-SILC 2010 data uprated to 2014) Figures on current monthly minimum wages (in 2014) from Eurostat
The interaction between minimum wages income support and poverty
39
Table A16 Effects of a minimum wage at 50 of average hourly wages on at-
risk-of-poverty rates by gender 2014
change in at-risk-of-poverty rates
total men women
BE -08 -08 -08
BG 00 00 00
CZ -12 -11 -13
DK -06 -08 -04
DE -10 -09 -11
EE -18 -16 -19
IE -06 -06 -07
EL -11 -10 -11
ES -09 -08 -10
FR -11 -10 -11
HR -04 -04 -05
IT -08 -07 -08
CY -19 -14 -24
LV -03 -04 -03
LT -10 -10 -10
LU -16 -16 -16
HU -12 -12 -11
MT -18 -20 -17
NL -07 -09 -06
AT -22 -22 -22
PL 00 00 00
PT -13 -13 -12
RO -04 -04 -04
SI 00 00 00
SK 00 00 00
FI -02 -02 -03
SE -12 -11 -14
UK -06 -06 -05
Note The change in poverty rates is the percentage point difference before and after the introduction of a minimum wage at 50 of average hourly earnings The poverty rate is the share of population (or population group) below that threshold The poverty threshold is at 60 of national household disposable equivalised income The reference group is households of employees who worked for 12 months full-time or 12 months part-time during the previous year
Source EUROMOD version G275+ running on EU-SILC 2012 data uprated to 2014 (except for France and Luxembourg EU-SILC 2010 data uprated to 2014) Figures on current monthly
minimum wages (in 2014) from Eurostat
The interaction between minimum wages income support and poverty
40
Table A17 Effects of a minimum wage at 50 of average hourly wages on at-
risk-of-poverty rates by age 2014
change in at-risk-of-poverty rates
aged lt18 aged 18-29 aged 30-44 aged 45-64 aged 65+
BE -10 -19 -08 -04 00
BG 00 00 00 00 00
CZ -14 -17 -11 -14 -03
DK -02 -31 -01 -04 00
DE -08 -25 -09 -09 -03
EE -20 -20 -16 -25 -04
IE -05 -20 -02 -06 00
EL -12 -27 -10 -10 00
ES -10 -12 -10 -10 -01
FR -18 -17 -12 -06 -01
HR -05 -07 -04 -05 -01
IT -10 -13 -10 -07 00
CY -10 -23 -23 -13 -32
LV -07 -05 -13 -03 00
LT -13 -12 -11 -11 -03
LU -26 -21 -18 -12 -03
HU -14 -18 -12 -12 -01
MT -26 -23 -20 -16 -05
NL -12 -17 -05 -04 00
AT -34 -38 -28 -13 -02
PL 00 00 00 00 00
PT -15 -23 -11 -15 -01
RO -05 -05 -04 -04 -02
SI 00 00 00 00 00
SK 00 00 00 00 00
FI -02 -04 -02 -03 -01
SE -15 -25 -14 -07 -04
UK -06 -09 -07 -06 -01
Note The change in poverty rates is the percentage point difference before and after the introduction of a minimum wage at 50 of average hourly earnings The poverty rate is the share of population (or population group) below that threshold The poverty threshold is at 60 of national household disposable equivalised income The reference group is households of employees who worked for 12 months full-time or 12 months part-time during the previous year
Source EUROMOD version G275+ running on EU-SILC 2012 data uprated to 2014 (except for France and Luxembourg EU-SILC 2010 data uprated to 2014) Figures on current monthly
minimum wages (in 2014) from Eurostat
The interaction between minimum wages income support and poverty
41
Table A18 Effects of a minimum wage at 50 of average hourly wages on
inequality 2014
change in inequality
Gini coefficient income quintile share ratio
(S80S20)
BE -02 -004
BG 00 000
CZ -04 -008
DK -03 -009
DE -04 -006
EE -06 -014
IE -02 -003
EL -04 -016
ES -05 -024
FR -05 -006
HR -01 -002
IT -01 -002
CY -07 -014
LV -02 -007
LT -05 -009
LU -05 -007
HU -06 -012
MT -05 -010
NL -02 -004
AT -07 -012
PL 00 000
PT -09 -018
RO -02 -005
SI 00 000
SK 00 000
FI -01 -002
SE -06 -007
UK -03 -006
Note The change in inequality is the difference in the index concerned before and after the introduction of a minimum wage at 50 of average hourly earnings The Gini coefficient ranges from 0 to 100 where 0 represents perfect equality in a given country and 100 represents the maximum level of inequality The income quintile share ratio (S80S20) is the ratio of the total income received by the 20 of the countryrsquos population with the highest disposable income (top
quintile) to that received by the 20 of the countryrsquos population with the lowest disposable income (bottom quintile) The reference group is households of employees who worked for 12 months full-time or 12 months part-time during the previous year Source EUROMOD version G275+ running on EU-SILC 2012 data uprated to 2014 (except for France and Luxembourg EU-SILC 2010 data uprated to 2014) Figures on current monthly minimum wages (in 2014) from Eurostat

EUROPEAN COMMISSION
Directorate-General for Employment Social Affairs and Inclusion 2015
SOCIAL SITUATION MONITOR
APPLICA (BE) ATHENS UNIVERSITY OF ECONOMICS AND BUSINESS (EL) EUROPEAN CENTRE FOR SOCIAL WELFARE POLICY AND RESEARCH (AT)
ISER ndash UNIVERSITY OF ESSEX (UK) AND TAacuteRKI (HU)
The interaction between minimum wages income
support and poverty
Research note 102015
Manos Matsaganis AUEB
Maacuterton Medgyesi TAacuteRKI
Alexandros Karakitsios AUEB
Acknowledgements
We thank Terry Ward (Applica) Istvaacuten Toacuteth (TAacuteRKI) and Maria Vaalavuo (DG-EMPL)
for comments and suggestions at various stages of the preparation of this manuscript
LEGAL NOTICE
This document has been prepared for the European Commission however it reflects the views only of the authors and the Commission cannot be held responsible for any use which may be made of the information contained therein
More information on the European Union is available on the Internet (httpwwweuropaeu)
copy European Union 2015 Reproduction is authorised provided the source is acknowledged
Europe Direct is a service to help you find answers
to your questions about the European Union
Freephone number ()
00 800 6 7 8 9 10 11
() The information given is free as are most calls (though some operators phone boxes or hotels may charge you)
The interaction between minimum wages income support and poverty
5
Table of Contents
ABSTRACT 6
INTRODUCTION 7
PART I THE HOUSEHOLD CIRCUMSTANCES OF LOW EARNERS IN THE EU 9
Methodology 9
Household circumstances of low earners 10
The risk of poverty in households with low earners 12
PART II SIMULATING THE POVERTY EFFECTS OF AN EU MINIMUM WAGE 16
Methodology 16
Minimum wages in the EU 17
Simulating an EU minimum wage 17
Poverty effects of an EU minimum wage 18
Inequality effects of an EU minimum wage 20
CONCLUDING REMARKS 21
REFERENCES 23
ANNEX 24
The interaction between minimum wages income support and poverty
6
Abstract
Minimum wages have emerged as a key policy issue in several countries in Europe (for
example in Germany and Italy) and beyond (for example in the US) Furthermore at
EU level discussions on a common European benchmark have gained momentum since
European Commission President J-C Juncker came out in favour of an EU minimum
wage as an essential component of the European Social Model This Research Note
attempts to throw light on the interaction between minimum wages income support
and poverty It focuses on two closely connected aspects of this issue On the one hand
the latest EU-SILC data is used to examine the relationship between low wages and
poverty looking at the individual characteristics and household circumstances of those
workers earning less than 50 of average hourly wages On the other hand the
European tax-benefit model EUROMOD is deployed to simulate the effects on poverty of
raising national minimum wages to that threshold (ie 50 of average hourly wages)
taking into account interactions with social assistance and other tax-benefit policies and
assuming no negative impact on employment or behavioural effects The main finding
is that raising minimum wages to that level would have at best modest effects in terms
of poverty reduction though better coordination of minimum wages with other tax-
benefit policies and in particular with in-work benefits could improve overall anti-
poverty performance
The interaction between minimum wages income support and poverty
7
Introduction
Minimum wage policies have been brought to the top of the political agenda in a number
of EU Member States In Germany a national minimum wage of euro850 per hour has
been gradually phased in since January 2015 and will be fully in place in 2017 In Italy
the recent lsquoJobs Actrsquo has put in place a framework for the future introduction of a national
minimum wage for those workers (including the lsquodependent self-employedrsquo) not already
covered by a collective bargaining agreement That leaves Austria Cyprus and the
Nordic countries (Denmark Finland and Sweden) as the only EU members without a
national minimum wage1 In the other 23 EU Member States with a national minimum
wage its current level (January 2016) varied widely from euro215 per month in Bulgaria
to euro1923 per month in Luxembourg2
Renewed interest in minimum wages is also evident at EU level where discussions on
the feasibility and desirability of setting a common threshold applicable throughout the
EU gained momentum when European Commission President J-C Juncker came out in
favour of an EU minimum wage (for example set at 60 of national median wages) as
an essential component along with a minimum guaranteed income of the European
Social Model3
The relationship between low wages and the risk of poverty has gained in salience as it
has become increasingly clear that in the years before the economic and financial crisis
rising employment levels failed to engineer a decline in relative poverty rates (Cantillon
2011 Gaacutebos et al 2015) As recent work has established in-work poverty and the
ldquoerosion of minimum income protectionrdquo for the working-age population (and
especially for families with children) was in most countries associated not with cuts in
benefit levels (nor with rising taxation levels) but rather with ldquosinking gross low wages
compared to median household incomesrdquo (Cantillon et al 2015)
The notion that raising the minimum wage would cause the risk of poverty to fall has
intuitive appeal Nevertheless economic theory suggests that the effectiveness of
minimum wages as an anti-poverty tool is in fact questionable (Boeri amp van Ours 2013)
On the one hand many of those at risk of poverty are either not employed (ie are
retired inactive or unemployed) work part-time (ie would not gain as much from a
rise in the hourly minimum wage) or are self-employed or in the informal sector (ie
beyond the scope of minimum wage legislation) On the other hand a number of
minimum wage earners live in households with income above the at-risk-of-poverty
threshold in many cases because they are secondary earners (eg women caring for
children or grown-up children living with their parents)4 Furthermore raising the
1 In most of these countries industry-level minimum wages are typically in place resulting from collective bargaining and extended to all workers in the relevant industries No minimum wage applies for workers not covered by an industry-level agreement 2 For more information on minimum wages in the EU and candidate countries see Eurostat ldquoMinimum wage statisticsldquo
3 These developments are mirrored across the Atlantic in the United States where President Obama called on Congress to raise the federal minimum wage to $1010 per hour (from its current
level of $725) Even though the presidential proposal was not endorsed by Congress the minimum wage for federal contract workers was raised to that level in January 2015 Meanwhile several states have legislated minimum wage increases well above the level indicated by the President with California and New York now both committed to moving towards a minimum hourly wage of $15 (In California the $15 minimum hourly wage will apply to the entire state with all large businesses phased in by 2022 and all those with fewer than 26 employees by 2023 New York City will get to $15 by the end 2018 and the cityrsquos suburbs by the end of 2021 while in
upstate areas the hourly minimum wage will be raised to $1250 by the end of 2020) 4 ldquoAssortative matingrdquo or the tendency of some individuals to select a spouse from within their own group (defined by occupational educational ethnic or other characteristics) will have the opposite effect leading to minimum wage earners being clustered in low-income households For more analysis see OECD (2011) where it is pointed out that assortative mating is on the increase in the United Kingdom Poland Sweden and other EU Member States We thank Maria Vaalavuo
for pointing this out
The interaction between minimum wages income support and poverty
8
minimum wage may cause adverse effects on employment in which case some workers
will suffer from a loss of earnings as they move from low-wage employment to no
employment at all
Given that the employment and poverty effects of minimum wages as predicted by
theory are ambiguous (and contingent on other factors) the relevant questions can only
be resolved empirically As it happens evidence (mainly though not exclusively from
North America) abounds ldquoThe employment effect of the minimum wage is one of the
most studied topics in all of economicsrdquo (Schmitt 2014) In large part this can be traced
to the seminal work by Card amp Krueger (1994 1995) which inspired a vast and often
contradictory body of research The key finding of the lsquoNew Economics of the Minimum
Wagersquo was that earlier assumptions based mostly on theory needed to be revised
ldquoThe weight of the evidence suggests that it is very unlikely that the minimum wage
has a large negative employment effectrdquo (Card amp Krueger 1995) In dissent some later
studies found strong adverse employment effects (Neumark amp Wascher 2008)
Nevertheless a more recent crop of empirical work (Dube et al 2010) appears to
confirm that moderate increases of the minimum wages have little or no effect on
employment
Strikingly a lsquometa-analysisrsquo of 64 studies published between 1972 and 2007 yielding
over 1000 estimates specifically measuring the impact of the minimum wage on
teenage employment in the US found that the most precise estimates were heavily
clustered at or near zero employment effects Keeping in mind that teenagers are the
one category of workers most likely to be lsquopriced outrsquo by a hike in the minimum wage
the authors concluded ldquoTwo scenarios are consistent with this empirical research
record First minimum wages may simply have no effect on employment [hellip] Second
minimum-wage effects might exist but they may be too difficult to detect andor are
very smallrdquo (Doucouliagos amp Stanley 2009) Similar conclusions were reached by a more
recent meta-analysis of 201 estimates from 27 studies published since 2000 (Wolfson
amp Belman 2014)
The poverty effects of changes in the minimum wage are somewhat less researched
though most economists would argue that minimum wages (on their own) are a blunt
instrument for reducing poverty Nevertheless a comprehensive recent study (Dube
2013) using microlevel data from the US has actually suggested that under certain
conditions (growing labour demand no or small disemployment effects) minimum wage
rises can be effective in reducing poverty Specifically the poverty rate elasticity of the
minimum wage estimated in the study ranged from -012 to -037 with the best
estimate being -024 implying that raising the minimum wage by 10 will reduce the
number of people living in poverty by 24 The same study also reviewed the existing
literature and concluded it was lsquobroadly consistentrsquo with the above range of estimates
This Research Note attempts to throw light on the interaction between minimum wages
income support and poverty The focus is on two closely connected aspects of this issue
In Part I the relationship between low wages and poverty is examined on the basis of
the latest EU-SILC (2013) data looking at the individual characteristics and household
circumstances of those workers earning less than 50 of average (mean) hourly wages
In Part II the European tax-benefit model EUROMOD is used to simulate the effects on
poverty of raising national minimum wages to that threshold (ie 50 of average hourly
wages) taking into account interactions with social assistance and other tax-benefit
policies assuming no adverse effects on employment or behavioural impact
The interaction between minimum wages income support and poverty
9
Part I The household circumstances of low earners in the EU
Methodology
Low wages are defined here in line with Oumlzdemir and Ward (2015) as hourly wages
below 50 of average (mean) hourly wages The focus is on employees for obvious
reasons (ie the self-employed are not covered by minimum wage legislation) The
analysis is based on data from the latest available wave of EU-SILC at the time of writing
(survey carried out in 2013 information on incomes earned in 2012)
Since information on current monthly earnings for employees (PY200G) is only available
in the case of 10 countries in EU-SILC this variable is not suitable to study differences
over all Member States of the EU EU-SILC however records yearly employee cash and
non-cash income (PY010G) over the income reference year To study low wages among
individuals with different working hours hourly wage rates were calculated using the
information on yearly employee income the number of months the respondent was in
employment (PL070 PL072) and the hours they typically work in their main job (PL060)
One limitation of the data is that information on hours of work relates to the current
situation whereas there is no information on hours of work in earlier periods of the
year5 Thus the calculation of hourly wage rates had to be restricted to employees who
have been working full-time over the whole year or have been working part-time over
the whole year Employees who have changed job during the reference year have also
been excluded since in this case hours of work at the previous job are not known6 The
assumption here is that individuals who have been working through the entire year at
the same job have been working the same hours as currently reported in variable
PL060
As noted above low wages are defined as gross hourly wages below 50 of the average
(mean) both to be in line with the parallel study referred to above and to increase the
number of people covered (in most countries very few people earn the minimum wage
or below)
It is important to keep in mind that because of data limitations the definition of
lowearners used in the study is restricted to those in stable employment (either full-
time or part-time) so that those whose employment has fluctuated over the year are
not included This is of course a serious limitation in the study since workers with
unstable employment are also likely to be affected by low wages and high poverty risk
Nevertheless the share of employees in stable employment in the 18-64 age group is
rather high in all countries ranging from 77 in Estonia to 95 in Romania (see Annex
Table A1 for further details)
The analysis focuses on household incomes so that the relationship between low wages
and poverty risk is affected by labour market status and the incomes of all household
members as well as the number of dependants in the household As poverty is best
defined at the household level the sample used will include all those who live in
households with a low-wage household member The at-risk-of-poverty threshold is
defined as 60 of median equivalised household income in the country concerned Two
indicators relating to this are used the at-risk-of-poverty rate (showing the percentage
of those with income below the threshold) and the at-risk-of-poverty gap (showing the
income shortfall of those below the poverty threshold relative to that threshold in
percentage terms)
5 This approach is similar to that taken by other studies in the literature For instance Maicirctre et al (2012) focus on those working full-year full-time when studying low pay 6 This was omitted from the definition in the case of countries where there was no information in this variable (PL160) for example Bulgaria Sweden and Finland and also in the case of countries where it was only asked from the selected respondents (and not all household members
above 16 years of age) such as Denmark the Netherlands and Slovenia
The interaction between minimum wages income support and poverty
10
Figure 1 shows the proportion of the population living in the households of low earners
The proportion ranges from 26 in Finland to 206 in Lithuania7
Figure 1 Population share of low earners in the EU ()
Source own calculation using EU-SILC 2013 UDB August 2015
The proportion of households with low-wage employees ranges from 2 to 16 In
Lithuania Latvia Luxembourg and Cyprus that proportion is between 14 and 16
In contrast it is below 3 in Belgium Finland and Denmark
Household circumstances of low earners
As shown by Oumlzdemir and Ward (2015) low earners are over-represented among the
young women those working part-time and those with temporary contracts According
to the conclusions of that study based on data from the European Labour Force Survey
low pay is not necessarily associated with low education or low-skilled occupations
though low-wage workers are disproportionately employed in sectors like basic services
retailing hotels and restaurants and social work In most Member States migrants
defined as those born outside their country of residence are more likely to have low
pay than those born in the country
In this section the focus is on households of those in low-wage employment Households
of low-wage employees are described from the point of view of the employment situation
of household members and the number of dependants as these factors are the main
determinants of the risk of poverty First households will be described with respect to
the concentration of low pay in them before other indicators of the labour market
situation of household members are examined such as the identity of the low earner in
the household and work intensity of the household The other issue that is relevant for
the risk of poverty is the number of dependants in the households of those with low
pay
There is little evidence of a concentration of low-paid workers in households the
proportion of households with several low-wage employees being around 1 in
households where the head is of working age (between 18 and 64) The largest
proportions are found in countries with a higher share of households with low-wage
7 The absolute sample size of those living in households of low earners is shown by Table A2 in the Annex Sample sizes depend of course on overall sample size in the country and the percentage of individuals with low wages The lowest sample size is found in Belgium (N=413)
while the highest in Poland (N=5093)
The interaction between minimum wages income support and poverty
11
employees Luxembourg (28 of households with at least two low-wage members)
Latvia (26) Cyprus (19) and Lithuania (17)
From the perspective of the income situation in the household it is important to know
which members are earning a low wage If the household head is a low-wage earner
this might have a more serious effect on household income than if a young adult living
with parents is Households with low-wage earners are divided in three groups (i) those
where the household head is a low earner8 (ii) those where the household head is not
a low earner but the spouse is and (iii) those where the low earner is neither the
household head nor their spouse but another member of the household9
Figure 2 Composition of households with low earners ( of individuals)
Source own calculation using EU-SILC 2013 UDB August 2015
To capture the labour market status of all household members the concept of household
work intensity is used This is shown in Annex Table A5 We measure work intensity as
the ratio of the number of months spent in employment during the year by household
members of working age (ie those aged 16-64) - adjusted for part-time working (ie
weighted by the number of hours worked per week relative to 35) - to the number of
months they would work if they were all employed full time (defined as working 35
hours a week or more) throughout the year10 Households where every member of
working age is employed full time throughout the year are given a work intensity of 1
while those where no one of working age is employed have a work intensity of 0 (jobless
households) In the population of households with low earners the proportion of those
8 This group is not limited to households where only the head is a low earner but includes also those households where the head and other members of the household have low earnings
9 This 3-group variable is a simplified version of a 5-group variable in which the first group is composed of single-adult households where the only adult is a low-wage earner Among
households with more adults we differentiate according to whether the low earner is the household head or not Each group is divided in two subgroups in the former we distinguish according to whether only the head is low earner or other members also are in the latter according to whether the spouse is low earner or other household members are Figure 2 shows the distribution of the 3-group variable in which three groups (single adult on low wage only head on low wage head as well as another member on low wage) are conflated into one (household head on low wage) The full distribution of all individuals living in households with low earners by the position of the
low earner(s) in the household using the 5-group variable is shown in Annex Table A4 10 Note that our work intensity definition is different from the one used by Eurostat In EU-SILC the work intensity of a household is the total number of months all working-age household members have actually worked during the income reference year divided by the total number of months the same household members could theoretically have worked over the same period Our indicator adjusts work intensity by whether household members worked full-time or part-time
For more detail see Ward amp Oumlzdemir (2016)
The interaction between minimum wages income support and poverty
12
living in households with low work intensity (ie below 05) ranges from 2 in Denmark
to 38 in Greece Other countries with relatively low figures are Sweden Slovenia and
Finland (3-7) while other countries with relatively high figures are Ireland and the
Netherlands (30-34) The reason for low work intensity can of course be different in
these cases in the case of Greece it is related to a high number of unemployed and
inactive persons in low-wage households while in the Netherlands it is more related to
a relatively high number of part-time workers
Other than the labour market situation of household members the number of
dependants also affects the risk of falling into poverty The demographic composition of
households with low earners is shown in Annex Table A6 The proportion of those living
in households with children is the smallest in Greece (36) and the Czech Republic
(40) while the largest is in Sweden where 67 of those in households with low-wage
earners live in households with children The proportion of those living in households
with children is also relatively large in Luxembourg Romania Slovenia and Portugal
Low-wage households with children can be further divided into three groups lone-
person households with children households with two or more adults and one or two
children and households with two or more adults and three or more children The
proportion of lone parents is small in all countries though it reaches almost 5 in the
UK The proportion of those living in households with three or more children is largest
in Denmark (19) Luxembourg (15) and Sweden (15) and smallest in Greece
Portugal and Slovakia (2-3) The third group households with at least two adults and
one or two children is the most widespread the proportion varying between 31 in
Finland and 57 in Portugal
The risk of poverty in households with low earners
Our main concern here is to compare the extent and depth of the risk of poverty among
households with low-wage workers with those prevailing in the working-age population
as a whole We also examine the factors associated with a risk of poverty among low
earners as well as the role of social transfers in alleviating this risk
Extent and depth of monetary poverty in households of low earners
The at-risk-of-poverty rate among those living in households with low earners was
highest in Greece in 2012 at 38 (see Figure 3)
Figure 3 At-risk-of-poverty rate 2012
Source own calculation using EU-SILC 2013 UDB August 2015
The interaction between minimum wages income support and poverty
13
The at-risk-of-poverty rate was also above 30 in Luxembourg and Italy while the rate
was only 6 in the Netherlands and below 10 in Ireland and Slovenia In most EU
Member States households with low earners have a higher at-risk-of-poverty rate than
the average for all households with working-age heads The few exceptions are mostly
countries where the at-risk-of-poverty rate among those living in households with a low
earner was relatively small the Netherlands Ireland Slovenia and Finland (though
also Croatia Belgium and Romania) The biggest difference in rates can be found in
Greece Luxembourg Italy Hungary and France where the at-risk-of-poverty rate is
at least 10 points higher in the case of individuals living in households with low-wage
members Even though households with a low-wage earner face a higher-than-average
poverty risk that risk is much higher still for jobless households
The at-risk-of-poverty gap is widest among those living in households with low earners
in Denmark where those at risk of poverty had on average income of 42 below the
threshold while in Italy Bulgaria Romania and Greece the rate was also above 30
(see Figure 4) In Finland Slovenia the Czech Republic and the Netherlands on the
other hand the average income of those at risk of poverty was only 14-15 lower than
the threshold
Figure 4 At-risk-of-poverty gap 2012
Source own calculation using EU-SILC 2013 UDB August 2015
With the exception of Denmark the poverty gap is higher among jobless households
than among households with low-wage earners Moreover the at-risk-of-poverty gap
was lower for households with low earners than for all working-age households in all
countries except Denmark and Cyprus This may look surprising at first sight It should
be recalled however that low-wage earners here include only those employed
throughout the year As a result households of low-wage earners below the poverty
threshold may well have higher average incomes than other households below the same
threshold
Poverty risk in subgroups
In this section we analyse the relationship between the risk of poverty of households
with low earners and household composition The expectation is that the risk will be
higher than average for households where the head has a low wage where household
work intensity is low and where the number of dependants is relatively high
As a rule the at-risk-of-poverty rate is higher when the low-wage earner is the
household head than when he or she is another household member (see Annex Table
A9) This is the case in all countries The differential (relative to the average of all those
living in households with a low-wage household member) was largest in Denmark
The interaction between minimum wages income support and poverty
14
Germany and Bulgaria (around 20 points in 2012) while it was also quite large in
another 10 countries (over 10 percentage points) In Latvia and the Czech Republic on
the other hand the differential was smallest (below 3 percentage points) Having a low
earner as household head thus tends to increase the at-risk-of-poverty rate as
compared with cases where the spouse or some other member is a low earner
The at-risk-of-poverty rate is also associated with low work intensity at household level
The definition of low-wage earners adopted in this study means that low earners in the
household work during the whole year (although not necessarily in full-time jobs) Other
household members on the other hand can have spells of inactivity or unemployment
and thus might be employed for only a few months during the year Household work
intensity thus varies among households with low earners As Figure 5 shows among
households with low-wage earners the poverty risk is higher than average among
households with a work intensity lower than 05 The difference is especially large in
Bulgaria Denmark Lithuania and Hungary where the at-risk-of-poverty rate among
households with work intensity below 05 exceeds by over 30 percentage points the
average for those in all households with low-wage earners (see Annex Table A10)
It is also evident that having a low-wage earner in the household represents an
additional poverty risk factor even among households with low work intensity Figure 5
shows that the at-risk-of poverty rate is higher in the case of households with a work
intensity below 05 where there is a low-wage household member Having a low-wage
earner increases the risk of poverty especially in Luxembourg Hungary and Denmark
but also in several other countries A few exceptions do exist in the Netherlands
Ireland Slovenia Finland and Croatia the at-risk-of-poverty rate is actually lower
among households with low work intensity where there is a low earner
Figure 5 At-risk-of-poverty rate in households with work intensity below 05
Source own calculation using EU-SILC 2013 UDB August 2015
As indicated in Figure 6 having children is also associated with a higher-than-average
poverty risk among those living in households with low-wage earners The biggest
difference is in Greece and France where the at-risk-of-poverty rate of those living in
households with children exceeds the average for households with low-wage earners by
some 10 percentage points The only exceptions are a few countries with a relatively
low at-risk-of-poverty rate for households with children such as Cyprus Germany
Sweden and the Czech Republic In these countries the risk of poverty is lower in the
case of low-wage households with children
The interaction between minimum wages income support and poverty
15
Figure 6 At-risk-of-poverty rate in households with children
Source own calculation using EU-SILC 2013 UDB August 2015
It is also clear that having a low-wage household member increases the poverty risk
among households with children in the majority of EU Member States In Greece France
and Denmark families with low earner(s) and children face at-risk-of-poverty rates that
are more than 15 points higher than they are for all families with children On the other
hand there are certain countries (especially Ireland Croatia Romania and Slovenia)
where the opposite is true there the risk of poverty is actually lower for households
with low earner(s) and children than it is for all households with children
The role of social transfers in reducing poverty risk
The income structure of households with low-wage earners differs greatly among EU
Member States (see Annex Table A12) The two extreme cases are the Netherlands
(where 92 of all incomes are either labour or capital earnings with only 8 coming
from social transfers) and Slovenia (where the respective shares of market incomes and
social transfers are 73 and 27) Relatively low shares of social transfer income are
also found in Germany Malta and Finland (12-13) and high shares in Ireland
Sweden and France (22-23) In the case of Greece and some other countries (Poland
Slovakia Romania Cyprus Latvia and Bulgaria) old-age pensions are the most
important social transfer in households with low-wage earners The share of family
benefits in total income is the highest in Slovenia (14) Sweden (11) and
Luxembourg (9) while the share of unemployment benefits is highest in Spain (9)
and Ireland (8) Sickness and disability benefits make up the highest share of total
income in Slovenia (8) and Sweden (7) Social assistance and housing allowances
are only a small part of the total income of households with low earners the highest
share of these being found in the UK and France (3)
Social benefits play an important role in moderating the risk of poverty of those living
in households with low earners Figure 7 shows that social transfers reduce the at-risk-
of-poverty rate (relative to a ldquono social transfersrdquo counterfactual) by over 30 percentage
points in Ireland Slovenia and Sweden The smallest reduction is seen in the
Netherlands Denmark Cyprus and Greece where the rate is lowered by 14-16 points
The effect of social transfers can also be assessed relative to the pre-transfer at-risk-
of-poverty rate This indicator varies from 27 in Greece to 84 in Ireland (see also
Annex Table A7)
The effect of social transfers on the depth of the risk of poverty can be measured by
comparing the poverty gap before and after social transfers The gap before social
transfers is naturally larger than after transfers in all countries The biggest difference
is in France where the inclusion of social transfers reduces the gap by 26 percentage
points The poverty gap after social transfers is lowered by 20-25 percentage points in
The interaction between minimum wages income support and poverty
16
the UK Cyprus Hungary Germany and Ireland The reduction is smallest in Latvia
Austria Romania and Denmark (see Annex Table A8)
Figure 7 Impact of social transfers on at-risk-of-poverty rate in households
with low earners 2012
Source own calculation using EU-SILC 2013 UDB August 2015
Note absolute poverty reduction is the difference between the pre-transfer and post-transfer at-risk-of-poverty rate Relative poverty reduction equals absolute poverty reduction divided by pre-transfer at-risk-of-poverty rate
Part II Simulating the poverty effects of an EU minimum wage
Methodology
The aim here is to simulate the poverty effects of raising national (hourly) minimum
wages to 50 of national average (hourly) wages taking account of interactions of low
earnings with social assistance other benefits and taxes using the European tax-benefit
model EUROMOD11 We assume no employment or behavioural effects
As in Part I the analysis is confined to employees who have been working either full-
time or part-time over the whole year Average hourly earnings are calculated as gross
monthly earnings divided by usual working hours per month (ie usual working hours
per week multiplied by 5212)
In three Member States (Bulgaria France and Italy) where information on whether
employees had worked full-time or part-time is missing all employees with an
employment record of 12 months over the year are covered In the UK where
information on months of employment is missing all employees are covered
The simulated EU minimum wage is equal to 50 of national average hourly wages but
is set on a monthly basis (multiplying minimum hourly wages by usual working hours
per week by 5212) Where national legislation dictates that monthly wages are paid
1314 times a year this is assumed also to be the case with the new minimum
In those Member States where a youth sub-minimum wage is currently in force it is
assumed that the EU minimum wage applies to all workers irrespective of age
11 Specifically we use version G275+ running on EU-SILC 2012 data uprated to 2014 incomes
and tax-benefit policies
The interaction between minimum wages income support and poverty
17
Minimum wages in the EU
As pointed out earlier in 2014 most Member States had a national minimum wage the
exceptions being Germany Austria Italy Cyprus Denmark Finland and Sweden (In
the meantime the introduction of a minimum wage has been phased-in gradually in
Germany and has been legislated in Italy)
Obviously the level of the minimum wage varied considerably from euro174 a month in
Bulgaria to euro1921 in Luxembourg In terms of the ratio of the minimum to average
wages the variation was also significant though less wide ‒ from 33 in the Czech
Republic to 53 in Slovenia This is shown in Figure 8
Figure 8 Minimum wages in the EU 2014
Source Eurostat (OECD for average earnings in Belgium France Greece the Netherlands and
Romania)
Simulating an EU minimum wage
A hypothetical EU minimum wage at 50 of national average wages is simulated The
latter are estimated from the EU-SILC data restricting the sample to those employees
who had been working either full-time or part-time throughout the previous year except
in the case of Bulgaria France Italy and the UK (see above)
Comparing the threshold of 50 of national average wages with actual minimum wage
levels in 2014 the required increase would be relatively large in a number of countries
reaching 50 in the Czech Republic and 51 in Estonia Note that in two Member States
(France and Hungary) where actual minimum wages were above the threshold of 50
of national average wages as estimated from the data12 the actual minimum wage level
is assumed when simulating a hypothetical EU minimum wage This is shown in Annex
Table A13
The proportion of workers (narrowly defined) affected by the increase in earnings
following the introduction of a minimum wage at 50 of national average wages is
shown in Figure 9 On the whole the proportion of workers affected would range from
around 4 to 5 in Belgium and Finland to around 21 to 22 in Cyprus Lithuania
and Latvia The level of the resulting adjustment also varies In Belgium Bulgaria and
12 Note that this is slightly different from Figure 8 where the countries in which minimum wages were above 50 of national average wages were Luxembourg and Slovenia The discrepancy is due to the fact that as explained earlier our analysis here is restricted to employees working
continuously throughout the year (except in the UK)
The interaction between minimum wages income support and poverty
18
Hungary13 for over 40 of workers affected by the hypothetical introduction of a
minimum wage at this level the rise in wages would be below 10 Conversely in
France Denmark Austria Cyprus and Lithuania between 64 and 78 of workers
currently below the new minimum wage threshold would receive a pay rise of over 20
with the proportion reaching 71 in Italy and 75 in Sweden The distribution of
workers by level of the required increase is shown in Annex Table A14
Figure 9 Distribution of workers affected by a minimum hourly wage at 50
of national average hourly wage by level of implicit pay rise
Source EUROMOD 2014 model on SILC 2012 input data
Notes Average hourly wages are calculated as gross monthly wages divided by usual working hours per month Our analysis is limited to workers employed either full-time or part-time over the whole year Because of missing information all employees working 12 months over the year (irrespective of whether full-time or part-time) are covered in Bulgaria France and Italy while
all employees (irrespective of whether full-time or part-time and of whether full-year or part-
year) are covered in the UK In France and Luxembourg EUROMOD ran on SILC 2010 data
The above figures need to be interpreted with caution Notwithstanding differences in
definitions years of reference and sources the finding that in Sweden more than 8
of all employees working permanently over the previous 12 months were paid less than
385 of average wages14 differs from the estimates from the Structure of Earnings
Survey that no more than 25 of workers in firms with at least 10 employees in that
country were paid less than 67 of national median gross hourly earnings in 2010 It
should be noted however that this excludes large sections of the economy ‒ those
working in agriculture and the public sector as well as those in firms with fewer than 10
employees many of whom are likely to be low paid
Poverty effects of an EU minimum wage
The effectiveness of the minimum wage as an anti-poverty tool depends on a variety of
factors over and above its level To start with if the minimum wage is set in hourly
terms the number of hours a worker is employed is clearly important On the other
hand compliance also matters if the minimum wage is not enforceable (as in informal
labour markets or segments thereof) raising it may well fail to improve the incomes of
low-paid workers Finally if increases to the minimum wage lsquopricersquo some workers out of
13 Note that although in Hungary the minimum wage is formally above 50 of national average wages the data show that a number of low-wage workers actually work long hours In their case dividing monthly pay by hours worked (as explained in the Methodology section) results in an hourly wage that is below the statutory minimum 14 A wage increase from 385 to 50 of average earnings amounts to a relative increase of 30 In Annex Table A14 introducing a minimum wage at 50 of average hourly earnings would
result in hourly wage increases of 30 or more for 81 of workers in our sample in Sweden
The interaction between minimum wages income support and poverty
19
the labour market then to them a higher minimum wage will mean lower not higher
incomes
While the above considerations concern the effectiveness of minimum wages in raising
the earnings of low-paid workers poverty effects will also depend on their household
circumstances ndash in other words on
(i) The position of minimum-wage earners in the household ie whether they
are primary earners (ie heads of household) or secondary earners (eg
spouses or working-age children living in the parental home)
(ii) The contribution to household income by other household members
Furthermore the poverty effect of changes to the minimum wage will also depend on
interactions with the tax and benefit system specifically on the extent to which
improvements in market incomes (in this case labour earnings) resulting from higher
minimum wages may be partly offset by
(iii) Increases in income taxes and social contributions
(iv) Reductions in social assistance and other cash benefits
Such interactions can be decisive For example it has been estimated that ldquoin Ireland
[hellip] without any accompanying measures such as raising means-tested benefits in line
with the minimum wage less than a tenth of a minimum wage increase would end up
in the pockets of single-parent minimum wage earners [while in] Luxembourg a
minimum-wage increase could actually make a single parent worse off as benefit
reductions and higher social contributions can outweigh the wage increaserdquo (OECD
2015a) Elsewhere the culprit is the lsquotax wedgersquo between labour costs and workersrsquo
take-home pay which exceeds 45 of the gross minimum wage in countries where
social contributions are high as in Germany Poland and Slovenia or where income tax
schedules are flat as in Hungary and Latvia (OECD 2015b)
In Part I it was established that between a quarter and a half of all those living in
households where at least one member earned below 50 of average earnings lived in
households where that member was not the head (see Figure 2 and Annex Table A4)
Moreover even though in some countries (Greece Luxembourg Italy Hungary and
France) the poverty rate of households with low earners was 10 or more points above
the average for all households with a head aged below 65 in most other Member States
the difference was small What is more in as many as 7 countries (Ireland the
Netherlands Slovenia Finland Croatia Belgium and Romania) households with low
earners actually reported below-average poverty rates (see Figure 3)
Here in Part II the picture is completed by simulating the poverty effects of raising the
minimum wage to 50 of average hourly earnings (or introducing one at that level
where none exists) We do so taking into account the household circumstances of
minimum-wage earners as well as interactions with taxes and benefits Also we
assume no employment effects or behavioural responses Finally to focus on genuine
improvements in low incomes we fix the poverty line at the baseline15
A useful point of departure is to establish the extent to which low earnings actually
overlap with income poverty As seen in Table A15 this is rather limited across the EU
among all persons living in households with low earners only 177 were poor and
among all persons in our reference group (households of employees who worked for 12
months full-time or 12 months part-time during the previous year) only 23 lived in
poor households with low earners So the scope for reducing in-work poverty via an
increase in the minimum wage may not be great
15 In fact if the hike in minimum wages is entirely absorbed by employers taking lower profits assuming no shifting of higher labour costs onto consumers in the form of higher prices and no job losses then the first effect of the policy change will necessarily be to raise real disposal incomes at aggregate level and quite probably the income of the median person too in which
case the increase in the minimum wage will also raise the poverty threshold
The interaction between minimum wages income support and poverty
20
Having said that our results show that the poverty effects of higher minimum wages
may not be entirely negligible either As shown in Table A16 in-work poverty would
decline by 22 percentage points in Austria and by 16 to 19 points in another four
countries (Cyprus Malta Estonia and Luxembourg) In most Member States poverty
reduction would be between 06 and 13 percentage points (around 10 point in France
Germany and Spain) At the other extreme at-risk-of-poverty rates would fall by 02
to 04 of a percentage point in four countries (Croatia Romania Latvia and Finland)
and would remain unchanged in another four (Slovenia Slovakia Bulgaria and Poland)
With the exception of Cyprus where raising the minimum wage to 50 of average
hourly earnings would reduce poverty rates for women by 10 percentage point more
than it would for men gender effects were rather small At one end of the scale female
poverty rates in Sweden would fall by 03 of a percentage point more than male ones
At the other end female poverty rates in Denmark would fall by 04 of a percentage
point less than male ones
In terms of age the reduction in poverty following an increase in the minimum wage
would least benefit the elderly (see Table A17) Only in Cyprus where a large number
of pensioners lived with their working children would the rise in the minimum wage
significantly reduce the at-risk-of-poverty rate among older people (by 32 percentage
points) Elsewhere poverty in old age would fall by less than half percentage point
Conversely in most Member States (16 out of 28) child poverty would decline by at
least one percentage point following an increase in the minimum wage In Austria the
size of child poverty reduction would be 34 percentage points In Luxembourg and
Malta it would be 26 points Child poverty would also fall appreciably in Estonia (by 2
percentage points) in France (18) and in Portugal and Sweden (both 15 points)
Young people (aged 18-29) would appear to be the greatest beneficiaries of a rise in
the minimum wage in terms of a reduction in at-risk-of-poverty rates In 19 Member
States the size of poverty reduction for that age group would be at least 12 percentage
points In Germany and Sweden it would be 25 points in Greece 27 and in Denmark
31 In Austria youth poverty would fall by as much as 38 percentage points16
Inequality effects of an EU minimum wage
Finally another effect of an EU-wide minimum hourly wage set at 50 of average hourly
earnings assuming no adverse employment effects would be to reduce income
inequality in most Member States As seen in Table A18 the reduction in inequality as
measured by the Gini index would be largest in Portugal (09 percentage points)
followed by Austria and Cyprus (07 pp) Sweden Hungary and Estonia (06 pp) then
France Spain Malta Lithuania and Luxembourg (05 pp) Although in another 13
countries the reduction would be small (01 to 04 percentage points) only in Poland
Bulgaria Slovenia and Slovakia would the Gini index remain unchanged
While the Gini index is known to be most sensitive to changes around the middle of the
income distribution by definition the opposite is the case with the income quintile share
ratio (S80S20) which measures the total income received by the top quintile relative
to that received by the bottom quintile Our results show that raising minimum hourly
wages to 50 of average hourly earnings would reduce the S80S20 ratio in 24 out of
28 Member States This may be interpreted as evidence that at the very least the
increase in minimum wages would benefit poorer households more than it would richer
ones The effect would be greatest in three South European countries in Spain the
ratio would fall by 024 in Portugal and Greece by 018 and 016 respectively17
16 In Annex Tables A16 and A17 only differences in poverty rates are presented (ie before and after raising the minimum wage to 50 of average hourly earnings)
17 Note however that in Italy the S80S20 ratio would decline by a mere 002
The interaction between minimum wages income support and poverty
21
Concluding remarks
This Research Note set out to answer two distinct but closely related questions
(i) What is the relationship between low wages and poverty
(ii) Would an EU-wide minimum wage at 50 of national average hourly wages
be effective in reducing poverty
Clearly poverty analysis requires shifting the focus to the household circumstances of
low-wage workers which provides the rationale for analysing EU-SILC data The
analysis here complements Oumlzdemir amp Ward (2015) who examined the individual
characteristics of low-wage workers using LFS data
Working with EU-SILC data to identify workers on low hourly wages has important
drawbacks such as possible measurement errors affecting both earnings and working
hours and discrepancies between the reference periods of the variables involved (the
survey year for usual working hours the previous year for labour earnings and full-
timepart-time employment status) To minimise errors in estimates the analysis was
restricted to a subset of households with employees who had worked throughout the
income year
With these caveats in mind the findings can be summarised as follows
With respect to the first question there is little evidence of a concentration of low pay
in households in EU Member States The proportion of households with two or more low-
wage employees turns out to be below 3 in all Member States Put differently among
all persons living in working-age households with at least one low earner the proportion
of those living in households with two or more low earners is below 20 in all Member
States and is usually below 10 (in 16 out of 28 Member States)
Furthermore most low earners are not lsquoprimary earnersrsquo among all individuals living in
low-wage households the majority (51-75) are in households where the low earner
is either the spouse or another person but not the household head
Households with a low earner typically face higher at-risk-of-poverty rates than other
working-age households (in 21 out 28 Member States) The rate among those living in
households with low-wage earners is highest in Greece Luxembourg and Italy (over
30) and is lowest in the Netherlands Ireland and Slovenia (below 10)
The risk of poverty is higher still where the person earning a low wage is the household
head most especially in Denmark Germany and Bulgaria The risk of poverty among
households with low earners is also increased by low work intensity the effect being
most pronounced in Bulgaria Lithuania and Hungary The number of dependants
children especially is also associated with a higher risk this being particularly the case
in Greece and France
A tentative attempt was made to answer the second question using EUROMOD to
estimate the effects on the risk of poverty of introducing a minimum wage in all
countries at 50 of national average wages taking into account interactions with tax-
benefit policies and assuming no effects on employment Setting a minimum wage at
this level is estimated to affect under 5 of employees in Belgium and Finland but over
20 in Latvia and Lithuania In some Member States a large proportion of those
affected (over 60 in Italy and Sweden) would appear to receive significant pay rises
(in excess of 30) a finding which may in part be attributed to measurement error
The anti-poverty effect of raising the minimum wage (as measured relative to a fixed
poverty threshold) would be small but not trivial The at-risk-of-poverty rate would fall
by at least 10 percentage point in 13 out of 28 Member States The size of poverty
reduction would be largest among working households with children and young adults
Our findings suggest that given the household circumstances of low-wage workers and
the current rules of tax and benefit systems raising minimum wages to 50 of national
average hourly wages is likely to have positive but modest effects in terms of reducing
the number of people at risk of poverty
The interaction between minimum wages income support and poverty
22
Our analysis is limited to households of employees who worked for 12 months full-time
or 12 months part-time during the previous year This inevitably excludes several
employees working intermittently18 (ie less than 12 months over the previous year)
or those switching from part-time to full-time work or vice versa While the latter
category might benefit from the increase in minimum wages simulated here the former
would probably benefit less
More generally minimum wage increases would do little directly to improve the living
standards of the self-employed including ldquothe so-called lsquobogus self-employedrsquo who do
similar work to regular employees but whose contracts are not protected by the same
safeguards and regulationsrdquo (OECD 2015b) Nor would minimum wage increases raise
the earnings of informal workers except possibly in the context of the lsquolighthouse
effectrsquo19
Nevertheless setting the minimum wage at 50 of national average hourly wages EU-
wide can also be supported on grounds other than poverty reduction In particular a
higher minimum wage will by definition reduce earnings inequality at individual level
(while as shown earlier in most countries it would also reduce income inequality at
household level) Also setting a wage floor may address considerations of fairness and
counterbalance the monopsony power of some employers Moreover the minimum
wage may act as a lsquobeneficial constraintrsquo increasing the value of the job for both workers
and employers limiting costly turnover providing incentives for training and altogether
raising productivity
Finally while the minimum wage may be a blunt instrument for poverty reduction on its
own better coordination with other tax-benefit policies may significantly increase its
overall effect For instance a broader targeting of means-tested assistance and a lower
tax wedge will make work pay more even when pay is low enhancing the extent to
which minimum wage increases can improve take-home pay In-work benefits20 have
often proved effective in this respect Conversely the case for minimum wages becomes
stronger in the presence of in-work benefits as the former prevent the latter from being
captured by employers rather than by their intended beneficiaries
18 Note that employees working intermittently were included if they lived in a household with a member who worked for 12 months full-time or 12 months part-time during the previous year 19 A lsquolighthouse effectrsquo is said to be observed when employers and workers in the informal sector (where minimum wages are not legally enforced) set pay by reference to the level of the minimum wage in the formal sector When this is the case wages in the informal sector will move in line with minimum wages in the formal sector In contrast under the standard model workers
displaced from the formal sector after the introduction or increase of a minimum wage will seek employment in the informal sector causing wages there to fall For a recent analysis see Boeri et al (2011) 20 The Earned Income Tax Credit in the US and the Working Tax Credit in the UK are the best known such schemes For a formal analysis of in-work benefits in an optimal tax design setting see Brewer et al (2010) For a comprehensive review of schemes in a variety of countries see
Immervoll amp Pearson (2009)
The interaction between minimum wages income support and poverty
23
References
Boeri T amp van Ours J (2013) The economics of imperfect labor markets (2nd edition)
Princeton NJ Princeton University Press
Boeri T Garibaldi P amp Ribeiro M (2011) The lighthouse effect and beyond Review of
Income and Wealth 57 S54-S78
Brewer M Saez E amp Shephard A (2010) Means testing and tax rates on earnings In
Dimensions of tax design the Mirrlees Review Oxford Oxford University Press
Cantillon B (2011) The paradox of the social investment state growth employment
and poverty in the Lisbon era Journal of European Social Policy 21 (5) 432-449
Cantillon B Collado D amp Van Mechelen N (2015) The end of decent social protection
for the poor The dynamics of low wages minimum income packages and median
household incomes ImPRovE Working Paper No 1503 University of Antwerp
Card D amp Krueger A (1994) Minimum wages and employment a case study of the fast-
food industry in New Jersey and Pennsylvania American Economic Review 48 (4) 772-
793
Card D amp Krueger A (1995) Myth and measurement the new economics of the
minimum wage Princeton NJ Princeton University Press
Doucouliagos H amp Stanley TD (2009) Publication selection bias in minimum-wage
research A meta-regression analysis British Journal of Industrial Relations 47 (2) 406-
428
Dube A (2013) Minimum wages and the distribution of family incomes (mimeo)
Dube A Lester W amp Reich M (2010) Minimum wage effects across state borders
Estimates using contiguous counties Review of Economics and Statistics 92 (4) 945-
964
Gaacutebos A Branyiczki R Lange B amp Toacuteth IG (2015) Employment and poverty dynamics
in the EU countries before during and after the crisis ImPRovE Working Paper 1506
University of Antwerp
Immervoll H amp Pearson M (2009) A good time for making work pay Taking stock of
in-work benefits and related measures across the OECD Social Employment and
Migration Working Paper 81 Paris Organisation for Economic Co-operation and
Development
Maicirctre B Nolan B amp Whelan CT (2012) Low pay in-work poverty and economic
vulnerability a comparative analysis using EU-SILC Manchester School 80 (1) 99-116
Neumark D amp Wascher W (2008) Minimum wages Cambridge MA The MIT Press
OECD (2011) Divided We Stand Why inequality keeps rising Paris Organisation for
Economic Co-operation and Development
OECD (2015a) Employment Outlook Paris Organisation for Economic Co-operation and
Development
OECD (2015b) Minimum wages after the crisis making them pay Paris Organisation
for Economic Co-operation and Development
Oumlzdemir E amp Ward T (2015) The characteristics of workers on low wages Social
Situation Monitor Research Note 92015 Brussels European Commission
Schmitt J (2013) Why does the minimum wage have no discernible effect on
employment Washington DC Center for Economic and Policy Research
Ward T amp Oumlzdemir E (2009) Measuring work intensity Social Situation Monitor
Research Note 92009 Brussels European Commission
Wolfson P amp Belman D (2014) What does the minimum wage do Kalamazoo MI
Upjohn Institute for Employment Research
The interaction between minimum wages income support and poverty
24
Annex
Table A1 Percentage of full-year employees among all employees
full-year employees
(either full-time or part-time)
employees with spells of self-
employment or employment
change during the year
employees with
spells of inactivity during the year
low-wage non-low wage
BE 28 816 71 85 1000
BG 67 823 06 103 1000
CZ 83 811 34 72 1000
DK 35 844 16 105 1000
DE 123 740 79 60 1000
EE 124 643 113 120 1000
IE 153 666 61 120 1000
EL 88 760 53 99 1000
ES 126 712 50 113 1000
FR 51 793 76 80 1000
HR 97 791 23 90 1000
IT 93 779 66 61 1000
CY 181 666 39 115 1000
LV 201 644 58 97 1000
LT 190 691 17 103 1000
LU 169 688 70 73 1000
HU 47 770 72 111 1000
MT 81 778 85 56 1000
NL 68 831 20 81 1000
AT 92 714 69 126 1000
PL 139 703 76 82 1000
PT 126 768 49 58 1000
RO 71 888 28 13 1000
SI 73 831 45 52 1000
SK 49 850 42 58 1000
FI 31 756 33 180 1000
SE 75 803 41 81 1000
UK 136 719 99 46 1000
Source EU-SILC 2013 UDB August 2015
The interaction between minimum wages income support and poverty
25
Table A2 Number of low earners in the sample
number of low
earners number of all
workers
no of individuals in households
with low earners
number of individuals
BE 143 4238 34 413 14623 28
BG 293 3876 75 982 12425 79
CZ 561 6064 93 1688 19105 88
DK 171 4185 41 477 13910 34
DE 1334 9242 144 3381 26709 127
EE 709 4406 161 1999 15053 133
IE 574 3065 187 1683 12663 133
EL 317 3025 105 955 18030 53
ES 1146 7589 151 3271 32162 102
FR 461 7524 61 1378 26353 52
HR 373 3411 109 1328 13897 96
IT 1154 10841 106 3290 44622 74
CY 839 3931 213 2546 13277 192
LV 1044 4367 239 2865 14624 196
LT 804 3731 216 2427 11754 206
LU 651 3288 198 1805 9994 181
HU 408 6957 59 1258 25441 49
MT 341 3570 95 1135 11965 95
NL 589 7849 75 1630 24629 66
AT 476 3867 123 1538 13250 116
PL 1482 8975 165 5093 36438 140
PT 665 4715 141 2093 16410 128
RO 392 5297 74 1271 17672 72
SI 692 8605 80 2191 27265 80
SK 284 5231 54 969 15456 63
FI 299 7661 39 733 27910 26
SE 438 5155 85 1230 15218 81
UK 1114 7012 159 3217 23251 138
Note Low earners are defined as those earning less than 50 of average hourly wages The reference group is households of employees who worked for 12 months full-time or 12 months part-time during the previous year Source EU-SILC 2013 UDB August 2015
The interaction between minimum wages income support and poverty
26
Table A3 Concentration of low earners in households
households () individuals ()
no low earners
one low earner
more
than one low earners
total no low earners
one low earner
more
than one low earners
total
BE 972 27 01 1000 967 32 01 1000
BG 924 68 08 1000 910 77 13 1000
CZ 912 83 05 1000 898 96 06 1000
DK 968 32 00 1000 959 41 01 1000
DE 872 117 11 1000 843 141 16 1000
EE 871 120 09 1000 854 134 12 1000
IE 863 124 13 1000 853 131 16 1000
EL 945 51 04 1000 940 56 04 1000
ES 897 94 09 1000 885 103 12 1000
FR 948 50 01 1000 938 61 02 1000
HR 912 79 09 1000 894 92 14 1000
IT 920 76 04 1000 913 82 05 1000
CY 809 172 19 1000 789 187 24 1000
LV 804 171 26 1000 779 186 35 1000
LT 806 176 17 1000 761 216 23 1000
LU 833 140 28 1000 798 162 41 1000
HU 952 43 05 1000 944 50 06 1000
MT 913 80 07 1000 894 96 10 1000
NL 935 62 04 1000 921 73 06 1000
AT 898 92 10 1000 864 118 18 1000
PL 875 110 15 1000 846 132 22 1000
PT 869 122 10 1000 851 136 14 1000
RO 934 56 11 1000 919 66 15 1000
SI 922 74 04 1000 908 87 05 1000
SK 939 56 05 1000 931 63 06 1000
FI 970 30 00 1000 968 32 00 1000
SE 919 78 03 1000 902 94 04 1000
UK 862 126 12 1000 839 147 14 1000
Note Low earners are defined as those earning less than 50 of average hourly wages The reference group is households of employees who worked for 12 months full-time or 12 months part-time during the previous year Source EU-SILC 2013 UDB August 2015
The interaction between minimum wages income support and poverty
27
Table A4 Distribution of individuals living in households with low earners ()
by the position of the low earner(s) in the household
single adult on low wage
households with two or more adults
total spouse (not head) on
low wage
other member
(not head) on low wage
only head on low wage
head and other
member on low wage
BE 59 472 233 199 37 1000
BG 34 380 250 227 110 1000
CZ 31 579 173 180 37 1000
DK 89 274 309 325 03 1000
DE 88 424 265 178 46 1000
EE 70 524 138 213 55 1000
IE 49 347 264 267 73 1000
EL 47 270 404 248 31 1000
ES 49 319 266 303 64 1000
FR 68 436 220 259 17 1000
HR 09 386 287 234 83 1000
IT 86 248 285 328 53 1000
CY 27 298 351 252 72 1000
LV 63 287 222 294 134 1000
LT 55 432 123 314 76 1000
LU 72 332 184 252 160 1000
HU 30 369 178 366 57 1000
MT 45 257 415 249 33 1000
NL 80 381 372 160 08 1000
AT 61 328 382 199 31 1000
PL 16 292 310 296 86 1000
PT 31 406 200 304 59 1000
RO 12 378 257 205 149 1000
SI 39 480 197 242 41 1000
SK 21 426 239 249 65 1000
FI 126 373 146 348 06 1000
SE 97 514 139 215 35 1000
UK 79 390 186 283 63 1000
Note Low earners are defined as those earning less than 50 of average hourly wages The reference group is households of employees who worked for 12 months full-time or 12 months part-time during the previous year
Source EU-SILC 2013 UDB August 2015
The interaction between minimum wages income support and poverty
28
Table A5 Distribution of individuals living in households with low earners ()
by work intensity
work intensity
001-049 05 051-080 081-099 10
BE 168 74 273 152 333 1000
BG 215 137 261 66 321 1000
CZ 73 94 335 60 437 1000
DK 18 175 153 160 495 1000
DE 131 96 361 197 215 1000
EE 90 152 278 102 377 1000
IE 339 111 271 95 184 1000
EL 381 169 226 58 165 1000
ES 235 156 281 104 225 1000
FR 171 103 241 128 357 1000
HR 148 222 289 61 281 1000
IT 240 158 251 122 228 1000
CY 158 104 276 85 378 1000
LV 90 172 311 61 367 1000
LT 110 125 238 51 476 1000
LU 100 116 339 148 297 1000
HU 212 116 289 92 291 1000
MT 216 139 354 134 157 1000
NL 300 66 359 198 77 1000
AT 98 111 330 251 209 1000
PL 135 153 302 86 325 1000
PT 143 131 299 54 372 1000
RO 108 168 379 56 289 1000
SI 63 151 238 74 473 1000
SK 80 151 397 106 266 1000
FI 68 156 197 158 422 1000
SE 36 74 158 220 512 1000
UK 165 88 300 164 284 1000
Note Low earners are defined as those earning less than 50 of average hourly wages The reference group is households of employees who worked for 12 months full-time or 12 months part-time during the previous year Source EU-SILC 2013 UDB August 2015
The interaction between minimum wages income support and poverty
29
Table A6 Distribution of individuals living in households with low earners ()
by household type
households with working-age head households with elderly
head total one or more
adult no
children
single adult with
children
two or more adults one
or two children
two or more adults three
or more children
BE 431 17 446 95 11 1000
BG 455 14 410 111 11 1000
CZ 584 08 356 38 14 1000
DK 460 00 335 186 18 1000
DE 549 23 366 54 08 1000
EE 510 10 383 41 56 1000
IE 395 34 480 78 12 1000
EL 609 03 336 19 33 1000
ES 499 19 421 50 11 1000
FR 443 22 431 92 12 1000
HR 393 05 495 81 27 1000
IT 514 18 380 69 20 1000
CY 496 05 435 50 15 1000
LV 497 27 387 68 21 1000
LT 409 27 459 91 14 1000
LU 344 24 475 148 09 1000
HU 475 10 417 93 05 1000
MT 397 28 528 35 12 1000
NL 551 17 359 67 05 1000
AT 393 17 500 77 13 1000
PL 423 05 472 87 14 1000
PT 380 11 573 28 09 1000
RO 363 03 562 72 00 1000
SI 369 09 522 94 06 1000
SK 514 07 433 31 15 1000
FI 528 37 306 117 12 1000
SE 315 23 505 145 12 1000
UK 421 48 398 97 37 1000
Note Low earners are defined as those earning less than 50 of average hourly wages The reference group is households of employees who worked for 12 months full-time or 12 months part-time during the previous year
Source EU-SILC 2013 UDB August 2015
The interaction between minimum wages income support and poverty
30
Table A7 At risk-of-poverty rate before and after social transfers ()
individuals living in households with low
earner(s) individuals living in all households with
head of working age
after social transfers
before social transfers
number of observations
after social transfers
before social transfers
number of observations
BE 139 388 413 142 293 12347
BG 281 465 982 189 319 10758
CZ 114 324 1688 91 223 16341
DK 168 325 477 119 233 11401
DE 194 358 3381 160 249 21428
EE 191 417 1999 172 277 12919
IE 74 460 1683 144 333 11313
EL 383 525 955 244 369 15473
ES 266 469 3271 213 369 28077
FR 243 509 1378 146 329 21871
HR 127 392 1328 183 309 12156
IT 310 477 3290 193 336 37058
CY 201 354 2546 152 271 11891
LV 216 453 2865 196 320 12681
LT 240 460 2427 202 337 10002
LU 313 593 1805 170 366 8836
HU 254 520 1258 156 377 22402
MT 173 339 1135 153 303 10554
NL 58 193 1630 111 243 20607
AT 145 380 1538 140 332 11165
PL 195 428 5093 180 337 32690
PT 199 393 2093 195 315 13916
RO 201 460 1271 233 368 15752
SI 96 466 2191 134 327 23665
SK 128 358 969 106 244 13769
FI 102 366 733 107 274 22741
SE 166 476 1230 140 266 12356
UK 166 416 3217 153 293 19220
Note Low earners are defined as those earning less than 50 of average hourly wages The reference group is households of employees who worked for 12 months full-time or 12 months part-time during the previous year Source EU-SILC 2013 UDB August 2015
The interaction between minimum wages income support and poverty
31
Table A8 At risk-of-poverty gap before and after social transfers ()
individuals living in households with low
earners individuals living in all households with
head of working age
after social transfers
before social transfers
after social transfers
before social transfers
BE 213 388 253 535
BG 341 427 372 451
CZ 148 309 247 352
DK 422 438 293 460
DE 207 410 244 446
EE 206 359 320 457
IE 219 420 246 491
EL 305 394 368 452
ES 275 403 353 509
FR 224 488 223 465
HR 264 338 324 427
IT 348 445 354 451
CY 222 435 216 381
LV 270 330 339 452
LT 237 391 304 481
LU 186 348 216 439
HU 216 421 255 457
MT 216 413 230 500
NL 151 328 228 492
AT 280 334 295 476
PL 222 331 276 431
PT 244 345 341 412
RO 315 360 377 445
SI 148 346 250 435
SK 214 337 304 409
FI 143 257 230 459
SE 283 410 288 444
UK 225 440 249 461
Note Low earners are defined as those earning less than 50 of average hourly wages The reference group is households of employees who worked for 12 months full-time or 12 months part-time during the previous year Source EU-SILC 2013 UDB August 2015
The interaction between minimum wages income support and poverty
32
Table A9 At-risk-of-poverty rate of households with low earners () by the
position of the low earner in the household
at-risk-of-poverty rate () number of observations
head on low wage
spouse (not
head) on
low wage
other member
(not head) on low wage
total head on low wage
spouse (not
head) on
low wage
other member
(not head) on low wage
total
BE 177 166 34 139 122 195 96 413
BG 471 178 166 283 361 370 244 976
CZ 139 82 188 114 419 977 292 1688
DK 413 05 00 174 192 126 142 460
DE 403 119 72 195 1044 1422 889 3355
EE 259 133 194 184 655 1018 268 1941
IE 108 65 36 74 655 585 443 1683
EL 534 310 299 378 309 256 383 948
ES 345 206 221 268 1341 1029 858 3228
FR 360 179 188 243 467 593 299 1360
HR 230 82 71 127 434 513 382 1328
IT 448 231 152 310 1529 814 938 3281
CY 343 210 52 201 892 759 895 2546
LV 235 165 240 216 1368 800 620 2787
LT 305 184 220 242 1059 1029 292 2379
LU 400 252 191 313 874 597 326 1798
HU 358 192 119 254 570 464 225 1258
MT 343 101 85 173 372 292 472 1135
NL 144 42 19 59 395 605 597 1598
AT 299 79 80 143 445 503 585 1533
PL 298 175 108 203 1906 1399 1486 4791
PT 247 161 179 199 814 839 414 2067
RO 239 156 216 201 465 480 326 1271
SI 148 61 96 96 701 1042 428 2171
SK 238 87 47 128 324 413 232 969
FI 170 56 00 103 350 272 107 728
SE 305 74 136 163 419 622 168 1209
UK 199 153 117 166 1359 1249 596 3204
Note Low earners are defined as those earning less than 50 of average hourly wages The
reference group is households of employees who worked for 12 months full-time or 12 months part-time during the previous year
Source EU-SILC 2013 UDB August 2015
The interaction between minimum wages income support and poverty
33
Table A10 At-risk-of-poverty rate of households with low earners () by
work intensity
at risk-of-poverty rate () number of observations
0-049 05-099 1 total 0-049 05-099 1 total
BE 383 72 46 139 100 175 137 413
BG 603 111 104 282 344 320 313 977
CZ 331 88 57 115 281 664 735 1681
DK 556 21 114 170 91 147 233 471
DE 345 132 199 194 764 1885 727 3377
EE 437 97 138 195 470 736 731 1938
IE 120 41 29 74 754 613 308 1675
EL 589 134 120 382 524 271 158 953
ES 402 188 163 266 1277 1256 734 3266
FR 462 190 131 243 378 507 492 1377
HR 288 33 32 127 491 464 373 1328
IT 517 172 173 310 1306 1218 742 3266
CY 369 93 188 201 664 917 960 2541
LV 457 148 119 218 742 1051 1040 2833
LT 551 236 93 242 563 696 1143 2403
LU 600 293 135 313 391 872 535 1798
HU 562 109 96 254 413 479 367 1258
MT 373 60 66 172 403 553 178 1134
NL 105 35 00 58 592 908 125 1625
AT 330 89 115 145 322 894 322 1537
PL 381 143 94 196 1462 1972 1650 5084
PT 453 114 96 200 571 737 775 2083
RO 421 172 37 201 351 553 367 1271
SI 270 63 39 96 469 685 1037 2191
SK 269 80 97 128 223 485 257 965
FI 154 94 81 102 164 260 309 733
SE 421 105 159 167 135 461 626 1222
UK 383 122 57 169 789 1447 888 3124 Note Low earners are defined as those earning less than 50 of average hourly wages The reference group is households of employees who worked for 12 months full-time or 12 months part-time during the previous year Source EU-SILC 2013 UDB August 2015
The interaction between minimum wages income support and poverty
34
Table A11 At-risk-of-poverty rate of households with low earners () by
number of children
at risk-of-poverty rate () number of observations in dataset
without children
with children
total without children
with children
total
BE 100 171 139 178 230 413
BG 185 367 281 446 525 982
CZ 121 108 114 987 678 1688
DK 98 235 168 220 249 477
DE 211 173 194 1854 1499 3380
EE 157 250 191 1019 868 1998
IE 60 85 74 665 997 1683
EL 333 490 383 582 342 955
ES 191 346 266 1632 1602 3270
FR 133 338 243 610 752 1378
HR 120 138 127 521 771 1328
IT 267 367 310 1682 1535 3281
CY 237 168 201 1262 1247 2546
LV 159 283 216 1424 1380 2865
LT 153 307 240 993 1400 2427
LU 223 361 313 614 1168 1798
HU 247 263 254 598 654 1258
MT 79 238 173 451 671 1135
NL 25 94 58 893 723 1625
AT 105 174 145 605 914 1538
PL 121 254 195 2152 2872 5093
PT 133 243 199 794 1281 2093
RO 105 256 201 461 810 1271
SI 98 96 96 809 1369 2191
SK 127 133 128 498 457 969
FI 75 136 102 387 337 733
SE 189 155 166 388 828 1230
UK 132 199 166 1354 1741 3213
Note Low earners are defined as those earning less than 50 of average hourly wages The reference group is households of employees who worked for 12 months full-time or 12 months part-time during the previous year Source EU-SILC 2013 UDB August 2015
The interaction between minimum wages income support and poverty
35
Table A12 Share of social benefits in total income of households with low
earners
old-age pensions
family benefits
unemployment
benefits
housing benefits
social assistance
other benefits
total social benefits
BE 3 6 4 0 0 3 15
BG 10 2 2 0 0 3 18
CZ 7 1 0 0 0 6 15
DK 1 2 5 0 0 5 14
DE 3 5 2 1 0 1 12
EE 10 3 0 0 0 5 19
IE 3 8 8 0 0 3 23
EL 14 1 1 0 0 1 16
ES 8 0 9 0 1 3 21
FR 9 4 5 2 1 1 22
HR 8 5 1 0 0 6 20
IT 8 2 5 0 0 2 17
CY 10 2 4 0 0 3 19
LV 11 2 1 0 0 4 18
LT 6 5 1 0 1 6 19
LU 5 9 2 1 1 2 21
HU 9 7 1 0 0 3 19
MT 5 3 0 0 2 2 12
NL 2 1 1 1 1 2 8
AT 4 6 2 0 0 2 14
PL 12 2 1 0 0 3 17
PT 9 2 3 0 0 2 16
RO 11 4 0 0 0 3 18
SI 3 14 1 0 1 8 27
SK 11 3 0 0 0 5 20
FI 3 4 3 1 0 3 13
SE 2 11 2 0 0 7 23
UK 6 5 1 1 1 2 16
Note Other benefits include sickness disability and education-related benefits Low earners are defined as those earning less than 50 of average hourly wages The reference group is households of employees who worked for 12 months full-time or 12 months part-time during the previous year Source EU-SILC 2013 UDB August 2015
The interaction between minimum wages income support and poverty
36
Table A13 National minimum wages vs 50 of average earnings 2014
average hourly
earnings (euro)
average monthly
earnings (euro)
50 of average
monthly earnings (euro)
national monthly
minimum wage (euro)
required increase
()
BE 1954 3480 1740 1502 16
BG 237 417 208 174 20
CZ 537 987 494 329 50
DK 2622 4524 2262
DE 1756 3506 1753
EE 592 1070 535 355 51
IE 2227 3854 1927 1462 32
EL 846 1457 729 684 7
ES 1079 1925 963 753 28
FR 1531 2511 1256 1445 -13
HR 506 908 454 406 12
IT 1370 2255 1128
CY 1155 2032 1016
LV 494 897 448 320 40
LT 407 716 358 290 24
LU 2687 4918 2459 1921 28
HU 317 562 281 328 -14
MT 960 1744 872 718 21
NL 2221 3964 1982 1490 33
AT 1900 3546 1773
PL 477 858 429 404 6
PT 742 1333 666 566 18
RO 230 414 207 198 5
SI 957 1688 844 789 7
SK 485 869 435 352 23
FI 2080 3620 1810
SE 2512 3596 1798
UK 1771 2766 1383 1303 6
Note The reference group is households of employees who worked for 12 months full-time or 12 months part-time during the previous year Source EUROMOD version G275+ running on EU-SILC 2012 data uprated to 2014 (except for France and Luxembourg EU-SILC 2010 data uprated to 2014) Figures on current monthly minimum wages (in 2014) from Eurostat
The interaction between minimum wages income support and poverty
37
Table A14 Distribution of workers affected by the increase in minimum wages
to 50 of average hourly earnings by level of increase ()
total
affected
increase in earnings to 50 of average earnings not affected
lt10 1001-20 2001-30 gt30
BE 40 16 04 05 16 960
BG 104 42 46 04 11 896
CZ 85 31 20 12 22 915
DK 61 10 10 09 31 939
DE 167 35 21 17 94 833
EE 176 36 41 31 68 824
IE 178 57 45 28 48 822
EL 116 35 23 20 38 884
ES 96 29 18 11 38 904
FR 77 15 10 06 47 923
HR 93 32 28 12 21 907
IT 113 18 15 10 70 887
CY 210 45 30 26 109 790
LV 220 46 52 38 83 780
LT 209 40 36 31 103 791
LU 183 57 48 34 44 817
HU 90 36 33 09 12 910
MT 93 34 25 07 27 907
NL 83 24 16 11 33 917
AT 131 28 16 13 73 869
PL 153 46 33 22 53 847
PT 173 50 48 22 53 827
RO 93 29 16 12 36 907
SI 86 28 12 05 41 914
SK 62 20 14 08 19 938
FI 42 16 08 06 13 958
SE 121 18 12 09 81 879
UK 188 60 43 19 66 812
Note The reference group is households of employees who worked for 12 months full-time or 12 months part-time during the previous year Source EUROMOD version G275+ running on EU-SILC 2012 data uprated to 2014 (except for France and Luxembourg EU-SILC 2010 data uprated to 2014) Figures on current monthly minimum wages (in 2014) from Eurostat
The interaction between minimum wages income support and poverty
38
Table A15 Poverty risk in households of low earners 2014
total earners
(1) low earners
(2)
of which in
poor households (3)
poverty rate of
low earners (4) = (3) (2)
low earners in poor households
as of all earners
(4) = (3) (1)
BE 3353261 134026 17970 134 05
BG 2362137 244588 63961 262 27
CZ 3331428 282085 29516 105 09
DK 1749226 106300 25224 237 14
DE 30271881 5068452 793234 157 26
EE 427162 75190 17895 238 42
IE 1164123 207729 17405 84 15
EL 2084532 242333 72889 301 35
ES 12258632 1177421 309078 263 25
FR 19911322 1535080 234136 153 12
HR 1063434 98966 12125 123 11
IT 15503093 1749434 488952 279 32
CY 284162 59795 10793 180 38
LV 628621 138371 27466 198 44
LT 928391 194150 37148 191 40
LU 184141 33673 6327 188 34
HU 2775484 250535 45132 180 16
MT 129372 12027 2446 203 19
NL 5544901 462701 60572 131 11
AT 2596626 341187 63808 187 25
PL 10166671 1558698 280035 180 28
PT 3303603 571146 80247 141 24
RO 6214151 580179 99679 172 16
SI 647095 55639 7210 130 11
SK 1807568 111931 21873 195 12
FI 1514848 63844 6723 105 04
SE 3232371 390717 64719 166 20
UK 22093617 4156506 633675 152 29
EU-28
155531853 19902703 3530237 177 23
Note Low earners are those earning less than 50 of average hourly wages The reference group is households of employees who worked for 12 months full-time or 12 months part-time during
the previous year The poverty threshold is at 60 of national household disposable equivalised income The poverty rate is the share of population (or population group) below that threshold Source EUROMOD version G275+ running on EU-SILC 2012 data uprated to 2014 (except for France and Luxembourg EU-SILC 2010 data uprated to 2014) Figures on current monthly minimum wages (in 2014) from Eurostat
The interaction between minimum wages income support and poverty
39
Table A16 Effects of a minimum wage at 50 of average hourly wages on at-
risk-of-poverty rates by gender 2014
change in at-risk-of-poverty rates
total men women
BE -08 -08 -08
BG 00 00 00
CZ -12 -11 -13
DK -06 -08 -04
DE -10 -09 -11
EE -18 -16 -19
IE -06 -06 -07
EL -11 -10 -11
ES -09 -08 -10
FR -11 -10 -11
HR -04 -04 -05
IT -08 -07 -08
CY -19 -14 -24
LV -03 -04 -03
LT -10 -10 -10
LU -16 -16 -16
HU -12 -12 -11
MT -18 -20 -17
NL -07 -09 -06
AT -22 -22 -22
PL 00 00 00
PT -13 -13 -12
RO -04 -04 -04
SI 00 00 00
SK 00 00 00
FI -02 -02 -03
SE -12 -11 -14
UK -06 -06 -05
Note The change in poverty rates is the percentage point difference before and after the introduction of a minimum wage at 50 of average hourly earnings The poverty rate is the share of population (or population group) below that threshold The poverty threshold is at 60 of national household disposable equivalised income The reference group is households of employees who worked for 12 months full-time or 12 months part-time during the previous year
Source EUROMOD version G275+ running on EU-SILC 2012 data uprated to 2014 (except for France and Luxembourg EU-SILC 2010 data uprated to 2014) Figures on current monthly
minimum wages (in 2014) from Eurostat
The interaction between minimum wages income support and poverty
40
Table A17 Effects of a minimum wage at 50 of average hourly wages on at-
risk-of-poverty rates by age 2014
change in at-risk-of-poverty rates
aged lt18 aged 18-29 aged 30-44 aged 45-64 aged 65+
BE -10 -19 -08 -04 00
BG 00 00 00 00 00
CZ -14 -17 -11 -14 -03
DK -02 -31 -01 -04 00
DE -08 -25 -09 -09 -03
EE -20 -20 -16 -25 -04
IE -05 -20 -02 -06 00
EL -12 -27 -10 -10 00
ES -10 -12 -10 -10 -01
FR -18 -17 -12 -06 -01
HR -05 -07 -04 -05 -01
IT -10 -13 -10 -07 00
CY -10 -23 -23 -13 -32
LV -07 -05 -13 -03 00
LT -13 -12 -11 -11 -03
LU -26 -21 -18 -12 -03
HU -14 -18 -12 -12 -01
MT -26 -23 -20 -16 -05
NL -12 -17 -05 -04 00
AT -34 -38 -28 -13 -02
PL 00 00 00 00 00
PT -15 -23 -11 -15 -01
RO -05 -05 -04 -04 -02
SI 00 00 00 00 00
SK 00 00 00 00 00
FI -02 -04 -02 -03 -01
SE -15 -25 -14 -07 -04
UK -06 -09 -07 -06 -01
Note The change in poverty rates is the percentage point difference before and after the introduction of a minimum wage at 50 of average hourly earnings The poverty rate is the share of population (or population group) below that threshold The poverty threshold is at 60 of national household disposable equivalised income The reference group is households of employees who worked for 12 months full-time or 12 months part-time during the previous year
Source EUROMOD version G275+ running on EU-SILC 2012 data uprated to 2014 (except for France and Luxembourg EU-SILC 2010 data uprated to 2014) Figures on current monthly
minimum wages (in 2014) from Eurostat
The interaction between minimum wages income support and poverty
41
Table A18 Effects of a minimum wage at 50 of average hourly wages on
inequality 2014
change in inequality
Gini coefficient income quintile share ratio
(S80S20)
BE -02 -004
BG 00 000
CZ -04 -008
DK -03 -009
DE -04 -006
EE -06 -014
IE -02 -003
EL -04 -016
ES -05 -024
FR -05 -006
HR -01 -002
IT -01 -002
CY -07 -014
LV -02 -007
LT -05 -009
LU -05 -007
HU -06 -012
MT -05 -010
NL -02 -004
AT -07 -012
PL 00 000
PT -09 -018
RO -02 -005
SI 00 000
SK 00 000
FI -01 -002
SE -06 -007
UK -03 -006
Note The change in inequality is the difference in the index concerned before and after the introduction of a minimum wage at 50 of average hourly earnings The Gini coefficient ranges from 0 to 100 where 0 represents perfect equality in a given country and 100 represents the maximum level of inequality The income quintile share ratio (S80S20) is the ratio of the total income received by the 20 of the countryrsquos population with the highest disposable income (top
quintile) to that received by the 20 of the countryrsquos population with the lowest disposable income (bottom quintile) The reference group is households of employees who worked for 12 months full-time or 12 months part-time during the previous year Source EUROMOD version G275+ running on EU-SILC 2012 data uprated to 2014 (except for France and Luxembourg EU-SILC 2010 data uprated to 2014) Figures on current monthly minimum wages (in 2014) from Eurostat

The interaction between minimum wages income support and poverty
12
living in households with low work intensity (ie below 05) ranges from 2 in Denmark
to 38 in Greece Other countries with relatively low figures are Sweden Slovenia and
Finland (3-7) while other countries with relatively high figures are Ireland and the
Netherlands (30-34) The reason for low work intensity can of course be different in
these cases in the case of Greece it is related to a high number of unemployed and
inactive persons in low-wage households while in the Netherlands it is more related to
a relatively high number of part-time workers
Other than the labour market situation of household members the number of
dependants also affects the risk of falling into poverty The demographic composition of
households with low earners is shown in Annex Table A6 The proportion of those living
in households with children is the smallest in Greece (36) and the Czech Republic
(40) while the largest is in Sweden where 67 of those in households with low-wage
earners live in households with children The proportion of those living in households
with children is also relatively large in Luxembourg Romania Slovenia and Portugal
Low-wage households with children can be further divided into three groups lone-
person households with children households with two or more adults and one or two
children and households with two or more adults and three or more children The
proportion of lone parents is small in all countries though it reaches almost 5 in the
UK The proportion of those living in households with three or more children is largest
in Denmark (19) Luxembourg (15) and Sweden (15) and smallest in Greece
Portugal and Slovakia (2-3) The third group households with at least two adults and
one or two children is the most widespread the proportion varying between 31 in
Finland and 57 in Portugal
The risk of poverty in households with low earners
Our main concern here is to compare the extent and depth of the risk of poverty among
households with low-wage workers with those prevailing in the working-age population
as a whole We also examine the factors associated with a risk of poverty among low
earners as well as the role of social transfers in alleviating this risk
Extent and depth of monetary poverty in households of low earners
The at-risk-of-poverty rate among those living in households with low earners was
highest in Greece in 2012 at 38 (see Figure 3)
Figure 3 At-risk-of-poverty rate 2012
Source own calculation using EU-SILC 2013 UDB August 2015
The interaction between minimum wages income support and poverty
13
The at-risk-of-poverty rate was also above 30 in Luxembourg and Italy while the rate
was only 6 in the Netherlands and below 10 in Ireland and Slovenia In most EU
Member States households with low earners have a higher at-risk-of-poverty rate than
the average for all households with working-age heads The few exceptions are mostly
countries where the at-risk-of-poverty rate among those living in households with a low
earner was relatively small the Netherlands Ireland Slovenia and Finland (though
also Croatia Belgium and Romania) The biggest difference in rates can be found in
Greece Luxembourg Italy Hungary and France where the at-risk-of-poverty rate is
at least 10 points higher in the case of individuals living in households with low-wage
members Even though households with a low-wage earner face a higher-than-average
poverty risk that risk is much higher still for jobless households
The at-risk-of-poverty gap is widest among those living in households with low earners
in Denmark where those at risk of poverty had on average income of 42 below the
threshold while in Italy Bulgaria Romania and Greece the rate was also above 30
(see Figure 4) In Finland Slovenia the Czech Republic and the Netherlands on the
other hand the average income of those at risk of poverty was only 14-15 lower than
the threshold
Figure 4 At-risk-of-poverty gap 2012
Source own calculation using EU-SILC 2013 UDB August 2015
With the exception of Denmark the poverty gap is higher among jobless households
than among households with low-wage earners Moreover the at-risk-of-poverty gap
was lower for households with low earners than for all working-age households in all
countries except Denmark and Cyprus This may look surprising at first sight It should
be recalled however that low-wage earners here include only those employed
throughout the year As a result households of low-wage earners below the poverty
threshold may well have higher average incomes than other households below the same
threshold
Poverty risk in subgroups
In this section we analyse the relationship between the risk of poverty of households
with low earners and household composition The expectation is that the risk will be
higher than average for households where the head has a low wage where household
work intensity is low and where the number of dependants is relatively high
As a rule the at-risk-of-poverty rate is higher when the low-wage earner is the
household head than when he or she is another household member (see Annex Table
A9) This is the case in all countries The differential (relative to the average of all those
living in households with a low-wage household member) was largest in Denmark
The interaction between minimum wages income support and poverty
14
Germany and Bulgaria (around 20 points in 2012) while it was also quite large in
another 10 countries (over 10 percentage points) In Latvia and the Czech Republic on
the other hand the differential was smallest (below 3 percentage points) Having a low
earner as household head thus tends to increase the at-risk-of-poverty rate as
compared with cases where the spouse or some other member is a low earner
The at-risk-of-poverty rate is also associated with low work intensity at household level
The definition of low-wage earners adopted in this study means that low earners in the
household work during the whole year (although not necessarily in full-time jobs) Other
household members on the other hand can have spells of inactivity or unemployment
and thus might be employed for only a few months during the year Household work
intensity thus varies among households with low earners As Figure 5 shows among
households with low-wage earners the poverty risk is higher than average among
households with a work intensity lower than 05 The difference is especially large in
Bulgaria Denmark Lithuania and Hungary where the at-risk-of-poverty rate among
households with work intensity below 05 exceeds by over 30 percentage points the
average for those in all households with low-wage earners (see Annex Table A10)
It is also evident that having a low-wage earner in the household represents an
additional poverty risk factor even among households with low work intensity Figure 5
shows that the at-risk-of poverty rate is higher in the case of households with a work
intensity below 05 where there is a low-wage household member Having a low-wage
earner increases the risk of poverty especially in Luxembourg Hungary and Denmark
but also in several other countries A few exceptions do exist in the Netherlands
Ireland Slovenia Finland and Croatia the at-risk-of-poverty rate is actually lower
among households with low work intensity where there is a low earner
Figure 5 At-risk-of-poverty rate in households with work intensity below 05
Source own calculation using EU-SILC 2013 UDB August 2015
As indicated in Figure 6 having children is also associated with a higher-than-average
poverty risk among those living in households with low-wage earners The biggest
difference is in Greece and France where the at-risk-of-poverty rate of those living in
households with children exceeds the average for households with low-wage earners by
some 10 percentage points The only exceptions are a few countries with a relatively
low at-risk-of-poverty rate for households with children such as Cyprus Germany
Sweden and the Czech Republic In these countries the risk of poverty is lower in the
case of low-wage households with children
The interaction between minimum wages income support and poverty
15
Figure 6 At-risk-of-poverty rate in households with children
Source own calculation using EU-SILC 2013 UDB August 2015
It is also clear that having a low-wage household member increases the poverty risk
among households with children in the majority of EU Member States In Greece France
and Denmark families with low earner(s) and children face at-risk-of-poverty rates that
are more than 15 points higher than they are for all families with children On the other
hand there are certain countries (especially Ireland Croatia Romania and Slovenia)
where the opposite is true there the risk of poverty is actually lower for households
with low earner(s) and children than it is for all households with children
The role of social transfers in reducing poverty risk
The income structure of households with low-wage earners differs greatly among EU
Member States (see Annex Table A12) The two extreme cases are the Netherlands
(where 92 of all incomes are either labour or capital earnings with only 8 coming
from social transfers) and Slovenia (where the respective shares of market incomes and
social transfers are 73 and 27) Relatively low shares of social transfer income are
also found in Germany Malta and Finland (12-13) and high shares in Ireland
Sweden and France (22-23) In the case of Greece and some other countries (Poland
Slovakia Romania Cyprus Latvia and Bulgaria) old-age pensions are the most
important social transfer in households with low-wage earners The share of family
benefits in total income is the highest in Slovenia (14) Sweden (11) and
Luxembourg (9) while the share of unemployment benefits is highest in Spain (9)
and Ireland (8) Sickness and disability benefits make up the highest share of total
income in Slovenia (8) and Sweden (7) Social assistance and housing allowances
are only a small part of the total income of households with low earners the highest
share of these being found in the UK and France (3)
Social benefits play an important role in moderating the risk of poverty of those living
in households with low earners Figure 7 shows that social transfers reduce the at-risk-
of-poverty rate (relative to a ldquono social transfersrdquo counterfactual) by over 30 percentage
points in Ireland Slovenia and Sweden The smallest reduction is seen in the
Netherlands Denmark Cyprus and Greece where the rate is lowered by 14-16 points
The effect of social transfers can also be assessed relative to the pre-transfer at-risk-
of-poverty rate This indicator varies from 27 in Greece to 84 in Ireland (see also
Annex Table A7)
The effect of social transfers on the depth of the risk of poverty can be measured by
comparing the poverty gap before and after social transfers The gap before social
transfers is naturally larger than after transfers in all countries The biggest difference
is in France where the inclusion of social transfers reduces the gap by 26 percentage
points The poverty gap after social transfers is lowered by 20-25 percentage points in
The interaction between minimum wages income support and poverty
16
the UK Cyprus Hungary Germany and Ireland The reduction is smallest in Latvia
Austria Romania and Denmark (see Annex Table A8)
Figure 7 Impact of social transfers on at-risk-of-poverty rate in households
with low earners 2012
Source own calculation using EU-SILC 2013 UDB August 2015
Note absolute poverty reduction is the difference between the pre-transfer and post-transfer at-risk-of-poverty rate Relative poverty reduction equals absolute poverty reduction divided by pre-transfer at-risk-of-poverty rate
Part II Simulating the poverty effects of an EU minimum wage
Methodology
The aim here is to simulate the poverty effects of raising national (hourly) minimum
wages to 50 of national average (hourly) wages taking account of interactions of low
earnings with social assistance other benefits and taxes using the European tax-benefit
model EUROMOD11 We assume no employment or behavioural effects
As in Part I the analysis is confined to employees who have been working either full-
time or part-time over the whole year Average hourly earnings are calculated as gross
monthly earnings divided by usual working hours per month (ie usual working hours
per week multiplied by 5212)
In three Member States (Bulgaria France and Italy) where information on whether
employees had worked full-time or part-time is missing all employees with an
employment record of 12 months over the year are covered In the UK where
information on months of employment is missing all employees are covered
The simulated EU minimum wage is equal to 50 of national average hourly wages but
is set on a monthly basis (multiplying minimum hourly wages by usual working hours
per week by 5212) Where national legislation dictates that monthly wages are paid
1314 times a year this is assumed also to be the case with the new minimum
In those Member States where a youth sub-minimum wage is currently in force it is
assumed that the EU minimum wage applies to all workers irrespective of age
11 Specifically we use version G275+ running on EU-SILC 2012 data uprated to 2014 incomes
and tax-benefit policies
The interaction between minimum wages income support and poverty
17
Minimum wages in the EU
As pointed out earlier in 2014 most Member States had a national minimum wage the
exceptions being Germany Austria Italy Cyprus Denmark Finland and Sweden (In
the meantime the introduction of a minimum wage has been phased-in gradually in
Germany and has been legislated in Italy)
Obviously the level of the minimum wage varied considerably from euro174 a month in
Bulgaria to euro1921 in Luxembourg In terms of the ratio of the minimum to average
wages the variation was also significant though less wide ‒ from 33 in the Czech
Republic to 53 in Slovenia This is shown in Figure 8
Figure 8 Minimum wages in the EU 2014
Source Eurostat (OECD for average earnings in Belgium France Greece the Netherlands and
Romania)
Simulating an EU minimum wage
A hypothetical EU minimum wage at 50 of national average wages is simulated The
latter are estimated from the EU-SILC data restricting the sample to those employees
who had been working either full-time or part-time throughout the previous year except
in the case of Bulgaria France Italy and the UK (see above)
Comparing the threshold of 50 of national average wages with actual minimum wage
levels in 2014 the required increase would be relatively large in a number of countries
reaching 50 in the Czech Republic and 51 in Estonia Note that in two Member States
(France and Hungary) where actual minimum wages were above the threshold of 50
of national average wages as estimated from the data12 the actual minimum wage level
is assumed when simulating a hypothetical EU minimum wage This is shown in Annex
Table A13
The proportion of workers (narrowly defined) affected by the increase in earnings
following the introduction of a minimum wage at 50 of national average wages is
shown in Figure 9 On the whole the proportion of workers affected would range from
around 4 to 5 in Belgium and Finland to around 21 to 22 in Cyprus Lithuania
and Latvia The level of the resulting adjustment also varies In Belgium Bulgaria and
12 Note that this is slightly different from Figure 8 where the countries in which minimum wages were above 50 of national average wages were Luxembourg and Slovenia The discrepancy is due to the fact that as explained earlier our analysis here is restricted to employees working
continuously throughout the year (except in the UK)
The interaction between minimum wages income support and poverty
18
Hungary13 for over 40 of workers affected by the hypothetical introduction of a
minimum wage at this level the rise in wages would be below 10 Conversely in
France Denmark Austria Cyprus and Lithuania between 64 and 78 of workers
currently below the new minimum wage threshold would receive a pay rise of over 20
with the proportion reaching 71 in Italy and 75 in Sweden The distribution of
workers by level of the required increase is shown in Annex Table A14
Figure 9 Distribution of workers affected by a minimum hourly wage at 50
of national average hourly wage by level of implicit pay rise
Source EUROMOD 2014 model on SILC 2012 input data
Notes Average hourly wages are calculated as gross monthly wages divided by usual working hours per month Our analysis is limited to workers employed either full-time or part-time over the whole year Because of missing information all employees working 12 months over the year (irrespective of whether full-time or part-time) are covered in Bulgaria France and Italy while
all employees (irrespective of whether full-time or part-time and of whether full-year or part-
year) are covered in the UK In France and Luxembourg EUROMOD ran on SILC 2010 data
The above figures need to be interpreted with caution Notwithstanding differences in
definitions years of reference and sources the finding that in Sweden more than 8
of all employees working permanently over the previous 12 months were paid less than
385 of average wages14 differs from the estimates from the Structure of Earnings
Survey that no more than 25 of workers in firms with at least 10 employees in that
country were paid less than 67 of national median gross hourly earnings in 2010 It
should be noted however that this excludes large sections of the economy ‒ those
working in agriculture and the public sector as well as those in firms with fewer than 10
employees many of whom are likely to be low paid
Poverty effects of an EU minimum wage
The effectiveness of the minimum wage as an anti-poverty tool depends on a variety of
factors over and above its level To start with if the minimum wage is set in hourly
terms the number of hours a worker is employed is clearly important On the other
hand compliance also matters if the minimum wage is not enforceable (as in informal
labour markets or segments thereof) raising it may well fail to improve the incomes of
low-paid workers Finally if increases to the minimum wage lsquopricersquo some workers out of
13 Note that although in Hungary the minimum wage is formally above 50 of national average wages the data show that a number of low-wage workers actually work long hours In their case dividing monthly pay by hours worked (as explained in the Methodology section) results in an hourly wage that is below the statutory minimum 14 A wage increase from 385 to 50 of average earnings amounts to a relative increase of 30 In Annex Table A14 introducing a minimum wage at 50 of average hourly earnings would
result in hourly wage increases of 30 or more for 81 of workers in our sample in Sweden
The interaction between minimum wages income support and poverty
19
the labour market then to them a higher minimum wage will mean lower not higher
incomes
While the above considerations concern the effectiveness of minimum wages in raising
the earnings of low-paid workers poverty effects will also depend on their household
circumstances ndash in other words on
(i) The position of minimum-wage earners in the household ie whether they
are primary earners (ie heads of household) or secondary earners (eg
spouses or working-age children living in the parental home)
(ii) The contribution to household income by other household members
Furthermore the poverty effect of changes to the minimum wage will also depend on
interactions with the tax and benefit system specifically on the extent to which
improvements in market incomes (in this case labour earnings) resulting from higher
minimum wages may be partly offset by
(iii) Increases in income taxes and social contributions
(iv) Reductions in social assistance and other cash benefits
Such interactions can be decisive For example it has been estimated that ldquoin Ireland
[hellip] without any accompanying measures such as raising means-tested benefits in line
with the minimum wage less than a tenth of a minimum wage increase would end up
in the pockets of single-parent minimum wage earners [while in] Luxembourg a
minimum-wage increase could actually make a single parent worse off as benefit
reductions and higher social contributions can outweigh the wage increaserdquo (OECD
2015a) Elsewhere the culprit is the lsquotax wedgersquo between labour costs and workersrsquo
take-home pay which exceeds 45 of the gross minimum wage in countries where
social contributions are high as in Germany Poland and Slovenia or where income tax
schedules are flat as in Hungary and Latvia (OECD 2015b)
In Part I it was established that between a quarter and a half of all those living in
households where at least one member earned below 50 of average earnings lived in
households where that member was not the head (see Figure 2 and Annex Table A4)
Moreover even though in some countries (Greece Luxembourg Italy Hungary and
France) the poverty rate of households with low earners was 10 or more points above
the average for all households with a head aged below 65 in most other Member States
the difference was small What is more in as many as 7 countries (Ireland the
Netherlands Slovenia Finland Croatia Belgium and Romania) households with low
earners actually reported below-average poverty rates (see Figure 3)
Here in Part II the picture is completed by simulating the poverty effects of raising the
minimum wage to 50 of average hourly earnings (or introducing one at that level
where none exists) We do so taking into account the household circumstances of
minimum-wage earners as well as interactions with taxes and benefits Also we
assume no employment effects or behavioural responses Finally to focus on genuine
improvements in low incomes we fix the poverty line at the baseline15
A useful point of departure is to establish the extent to which low earnings actually
overlap with income poverty As seen in Table A15 this is rather limited across the EU
among all persons living in households with low earners only 177 were poor and
among all persons in our reference group (households of employees who worked for 12
months full-time or 12 months part-time during the previous year) only 23 lived in
poor households with low earners So the scope for reducing in-work poverty via an
increase in the minimum wage may not be great
15 In fact if the hike in minimum wages is entirely absorbed by employers taking lower profits assuming no shifting of higher labour costs onto consumers in the form of higher prices and no job losses then the first effect of the policy change will necessarily be to raise real disposal incomes at aggregate level and quite probably the income of the median person too in which
case the increase in the minimum wage will also raise the poverty threshold
The interaction between minimum wages income support and poverty
20
Having said that our results show that the poverty effects of higher minimum wages
may not be entirely negligible either As shown in Table A16 in-work poverty would
decline by 22 percentage points in Austria and by 16 to 19 points in another four
countries (Cyprus Malta Estonia and Luxembourg) In most Member States poverty
reduction would be between 06 and 13 percentage points (around 10 point in France
Germany and Spain) At the other extreme at-risk-of-poverty rates would fall by 02
to 04 of a percentage point in four countries (Croatia Romania Latvia and Finland)
and would remain unchanged in another four (Slovenia Slovakia Bulgaria and Poland)
With the exception of Cyprus where raising the minimum wage to 50 of average
hourly earnings would reduce poverty rates for women by 10 percentage point more
than it would for men gender effects were rather small At one end of the scale female
poverty rates in Sweden would fall by 03 of a percentage point more than male ones
At the other end female poverty rates in Denmark would fall by 04 of a percentage
point less than male ones
In terms of age the reduction in poverty following an increase in the minimum wage
would least benefit the elderly (see Table A17) Only in Cyprus where a large number
of pensioners lived with their working children would the rise in the minimum wage
significantly reduce the at-risk-of-poverty rate among older people (by 32 percentage
points) Elsewhere poverty in old age would fall by less than half percentage point
Conversely in most Member States (16 out of 28) child poverty would decline by at
least one percentage point following an increase in the minimum wage In Austria the
size of child poverty reduction would be 34 percentage points In Luxembourg and
Malta it would be 26 points Child poverty would also fall appreciably in Estonia (by 2
percentage points) in France (18) and in Portugal and Sweden (both 15 points)
Young people (aged 18-29) would appear to be the greatest beneficiaries of a rise in
the minimum wage in terms of a reduction in at-risk-of-poverty rates In 19 Member
States the size of poverty reduction for that age group would be at least 12 percentage
points In Germany and Sweden it would be 25 points in Greece 27 and in Denmark
31 In Austria youth poverty would fall by as much as 38 percentage points16
Inequality effects of an EU minimum wage
Finally another effect of an EU-wide minimum hourly wage set at 50 of average hourly
earnings assuming no adverse employment effects would be to reduce income
inequality in most Member States As seen in Table A18 the reduction in inequality as
measured by the Gini index would be largest in Portugal (09 percentage points)
followed by Austria and Cyprus (07 pp) Sweden Hungary and Estonia (06 pp) then
France Spain Malta Lithuania and Luxembourg (05 pp) Although in another 13
countries the reduction would be small (01 to 04 percentage points) only in Poland
Bulgaria Slovenia and Slovakia would the Gini index remain unchanged
While the Gini index is known to be most sensitive to changes around the middle of the
income distribution by definition the opposite is the case with the income quintile share
ratio (S80S20) which measures the total income received by the top quintile relative
to that received by the bottom quintile Our results show that raising minimum hourly
wages to 50 of average hourly earnings would reduce the S80S20 ratio in 24 out of
28 Member States This may be interpreted as evidence that at the very least the
increase in minimum wages would benefit poorer households more than it would richer
ones The effect would be greatest in three South European countries in Spain the
ratio would fall by 024 in Portugal and Greece by 018 and 016 respectively17
16 In Annex Tables A16 and A17 only differences in poverty rates are presented (ie before and after raising the minimum wage to 50 of average hourly earnings)
17 Note however that in Italy the S80S20 ratio would decline by a mere 002
The interaction between minimum wages income support and poverty
21
Concluding remarks
This Research Note set out to answer two distinct but closely related questions
(i) What is the relationship between low wages and poverty
(ii) Would an EU-wide minimum wage at 50 of national average hourly wages
be effective in reducing poverty
Clearly poverty analysis requires shifting the focus to the household circumstances of
low-wage workers which provides the rationale for analysing EU-SILC data The
analysis here complements Oumlzdemir amp Ward (2015) who examined the individual
characteristics of low-wage workers using LFS data
Working with EU-SILC data to identify workers on low hourly wages has important
drawbacks such as possible measurement errors affecting both earnings and working
hours and discrepancies between the reference periods of the variables involved (the
survey year for usual working hours the previous year for labour earnings and full-
timepart-time employment status) To minimise errors in estimates the analysis was
restricted to a subset of households with employees who had worked throughout the
income year
With these caveats in mind the findings can be summarised as follows
With respect to the first question there is little evidence of a concentration of low pay
in households in EU Member States The proportion of households with two or more low-
wage employees turns out to be below 3 in all Member States Put differently among
all persons living in working-age households with at least one low earner the proportion
of those living in households with two or more low earners is below 20 in all Member
States and is usually below 10 (in 16 out of 28 Member States)
Furthermore most low earners are not lsquoprimary earnersrsquo among all individuals living in
low-wage households the majority (51-75) are in households where the low earner
is either the spouse or another person but not the household head
Households with a low earner typically face higher at-risk-of-poverty rates than other
working-age households (in 21 out 28 Member States) The rate among those living in
households with low-wage earners is highest in Greece Luxembourg and Italy (over
30) and is lowest in the Netherlands Ireland and Slovenia (below 10)
The risk of poverty is higher still where the person earning a low wage is the household
head most especially in Denmark Germany and Bulgaria The risk of poverty among
households with low earners is also increased by low work intensity the effect being
most pronounced in Bulgaria Lithuania and Hungary The number of dependants
children especially is also associated with a higher risk this being particularly the case
in Greece and France
A tentative attempt was made to answer the second question using EUROMOD to
estimate the effects on the risk of poverty of introducing a minimum wage in all
countries at 50 of national average wages taking into account interactions with tax-
benefit policies and assuming no effects on employment Setting a minimum wage at
this level is estimated to affect under 5 of employees in Belgium and Finland but over
20 in Latvia and Lithuania In some Member States a large proportion of those
affected (over 60 in Italy and Sweden) would appear to receive significant pay rises
(in excess of 30) a finding which may in part be attributed to measurement error
The anti-poverty effect of raising the minimum wage (as measured relative to a fixed
poverty threshold) would be small but not trivial The at-risk-of-poverty rate would fall
by at least 10 percentage point in 13 out of 28 Member States The size of poverty
reduction would be largest among working households with children and young adults
Our findings suggest that given the household circumstances of low-wage workers and
the current rules of tax and benefit systems raising minimum wages to 50 of national
average hourly wages is likely to have positive but modest effects in terms of reducing
the number of people at risk of poverty
The interaction between minimum wages income support and poverty
22
Our analysis is limited to households of employees who worked for 12 months full-time
or 12 months part-time during the previous year This inevitably excludes several
employees working intermittently18 (ie less than 12 months over the previous year)
or those switching from part-time to full-time work or vice versa While the latter
category might benefit from the increase in minimum wages simulated here the former
would probably benefit less
More generally minimum wage increases would do little directly to improve the living
standards of the self-employed including ldquothe so-called lsquobogus self-employedrsquo who do
similar work to regular employees but whose contracts are not protected by the same
safeguards and regulationsrdquo (OECD 2015b) Nor would minimum wage increases raise
the earnings of informal workers except possibly in the context of the lsquolighthouse
effectrsquo19
Nevertheless setting the minimum wage at 50 of national average hourly wages EU-
wide can also be supported on grounds other than poverty reduction In particular a
higher minimum wage will by definition reduce earnings inequality at individual level
(while as shown earlier in most countries it would also reduce income inequality at
household level) Also setting a wage floor may address considerations of fairness and
counterbalance the monopsony power of some employers Moreover the minimum
wage may act as a lsquobeneficial constraintrsquo increasing the value of the job for both workers
and employers limiting costly turnover providing incentives for training and altogether
raising productivity
Finally while the minimum wage may be a blunt instrument for poverty reduction on its
own better coordination with other tax-benefit policies may significantly increase its
overall effect For instance a broader targeting of means-tested assistance and a lower
tax wedge will make work pay more even when pay is low enhancing the extent to
which minimum wage increases can improve take-home pay In-work benefits20 have
often proved effective in this respect Conversely the case for minimum wages becomes
stronger in the presence of in-work benefits as the former prevent the latter from being
captured by employers rather than by their intended beneficiaries
18 Note that employees working intermittently were included if they lived in a household with a member who worked for 12 months full-time or 12 months part-time during the previous year 19 A lsquolighthouse effectrsquo is said to be observed when employers and workers in the informal sector (where minimum wages are not legally enforced) set pay by reference to the level of the minimum wage in the formal sector When this is the case wages in the informal sector will move in line with minimum wages in the formal sector In contrast under the standard model workers
displaced from the formal sector after the introduction or increase of a minimum wage will seek employment in the informal sector causing wages there to fall For a recent analysis see Boeri et al (2011) 20 The Earned Income Tax Credit in the US and the Working Tax Credit in the UK are the best known such schemes For a formal analysis of in-work benefits in an optimal tax design setting see Brewer et al (2010) For a comprehensive review of schemes in a variety of countries see
Immervoll amp Pearson (2009)
The interaction between minimum wages income support and poverty
23
References
Boeri T amp van Ours J (2013) The economics of imperfect labor markets (2nd edition)
Princeton NJ Princeton University Press
Boeri T Garibaldi P amp Ribeiro M (2011) The lighthouse effect and beyond Review of
Income and Wealth 57 S54-S78
Brewer M Saez E amp Shephard A (2010) Means testing and tax rates on earnings In
Dimensions of tax design the Mirrlees Review Oxford Oxford University Press
Cantillon B (2011) The paradox of the social investment state growth employment
and poverty in the Lisbon era Journal of European Social Policy 21 (5) 432-449
Cantillon B Collado D amp Van Mechelen N (2015) The end of decent social protection
for the poor The dynamics of low wages minimum income packages and median
household incomes ImPRovE Working Paper No 1503 University of Antwerp
Card D amp Krueger A (1994) Minimum wages and employment a case study of the fast-
food industry in New Jersey and Pennsylvania American Economic Review 48 (4) 772-
793
Card D amp Krueger A (1995) Myth and measurement the new economics of the
minimum wage Princeton NJ Princeton University Press
Doucouliagos H amp Stanley TD (2009) Publication selection bias in minimum-wage
research A meta-regression analysis British Journal of Industrial Relations 47 (2) 406-
428
Dube A (2013) Minimum wages and the distribution of family incomes (mimeo)
Dube A Lester W amp Reich M (2010) Minimum wage effects across state borders
Estimates using contiguous counties Review of Economics and Statistics 92 (4) 945-
964
Gaacutebos A Branyiczki R Lange B amp Toacuteth IG (2015) Employment and poverty dynamics
in the EU countries before during and after the crisis ImPRovE Working Paper 1506
University of Antwerp
Immervoll H amp Pearson M (2009) A good time for making work pay Taking stock of
in-work benefits and related measures across the OECD Social Employment and
Migration Working Paper 81 Paris Organisation for Economic Co-operation and
Development
Maicirctre B Nolan B amp Whelan CT (2012) Low pay in-work poverty and economic
vulnerability a comparative analysis using EU-SILC Manchester School 80 (1) 99-116
Neumark D amp Wascher W (2008) Minimum wages Cambridge MA The MIT Press
OECD (2011) Divided We Stand Why inequality keeps rising Paris Organisation for
Economic Co-operation and Development
OECD (2015a) Employment Outlook Paris Organisation for Economic Co-operation and
Development
OECD (2015b) Minimum wages after the crisis making them pay Paris Organisation
for Economic Co-operation and Development
Oumlzdemir E amp Ward T (2015) The characteristics of workers on low wages Social
Situation Monitor Research Note 92015 Brussels European Commission
Schmitt J (2013) Why does the minimum wage have no discernible effect on
employment Washington DC Center for Economic and Policy Research
Ward T amp Oumlzdemir E (2009) Measuring work intensity Social Situation Monitor
Research Note 92009 Brussels European Commission
Wolfson P amp Belman D (2014) What does the minimum wage do Kalamazoo MI
Upjohn Institute for Employment Research
The interaction between minimum wages income support and poverty
24
Annex
Table A1 Percentage of full-year employees among all employees
full-year employees
(either full-time or part-time)
employees with spells of self-
employment or employment
change during the year
employees with
spells of inactivity during the year
low-wage non-low wage
BE 28 816 71 85 1000
BG 67 823 06 103 1000
CZ 83 811 34 72 1000
DK 35 844 16 105 1000
DE 123 740 79 60 1000
EE 124 643 113 120 1000
IE 153 666 61 120 1000
EL 88 760 53 99 1000
ES 126 712 50 113 1000
FR 51 793 76 80 1000
HR 97 791 23 90 1000
IT 93 779 66 61 1000
CY 181 666 39 115 1000
LV 201 644 58 97 1000
LT 190 691 17 103 1000
LU 169 688 70 73 1000
HU 47 770 72 111 1000
MT 81 778 85 56 1000
NL 68 831 20 81 1000
AT 92 714 69 126 1000
PL 139 703 76 82 1000
PT 126 768 49 58 1000
RO 71 888 28 13 1000
SI 73 831 45 52 1000
SK 49 850 42 58 1000
FI 31 756 33 180 1000
SE 75 803 41 81 1000
UK 136 719 99 46 1000
Source EU-SILC 2013 UDB August 2015
The interaction between minimum wages income support and poverty
25
Table A2 Number of low earners in the sample
number of low
earners number of all
workers
no of individuals in households
with low earners
number of individuals
BE 143 4238 34 413 14623 28
BG 293 3876 75 982 12425 79
CZ 561 6064 93 1688 19105 88
DK 171 4185 41 477 13910 34
DE 1334 9242 144 3381 26709 127
EE 709 4406 161 1999 15053 133
IE 574 3065 187 1683 12663 133
EL 317 3025 105 955 18030 53
ES 1146 7589 151 3271 32162 102
FR 461 7524 61 1378 26353 52
HR 373 3411 109 1328 13897 96
IT 1154 10841 106 3290 44622 74
CY 839 3931 213 2546 13277 192
LV 1044 4367 239 2865 14624 196
LT 804 3731 216 2427 11754 206
LU 651 3288 198 1805 9994 181
HU 408 6957 59 1258 25441 49
MT 341 3570 95 1135 11965 95
NL 589 7849 75 1630 24629 66
AT 476 3867 123 1538 13250 116
PL 1482 8975 165 5093 36438 140
PT 665 4715 141 2093 16410 128
RO 392 5297 74 1271 17672 72
SI 692 8605 80 2191 27265 80
SK 284 5231 54 969 15456 63
FI 299 7661 39 733 27910 26
SE 438 5155 85 1230 15218 81
UK 1114 7012 159 3217 23251 138
Note Low earners are defined as those earning less than 50 of average hourly wages The reference group is households of employees who worked for 12 months full-time or 12 months part-time during the previous year Source EU-SILC 2013 UDB August 2015
The interaction between minimum wages income support and poverty
26
Table A3 Concentration of low earners in households
households () individuals ()
no low earners
one low earner
more
than one low earners
total no low earners
one low earner
more
than one low earners
total
BE 972 27 01 1000 967 32 01 1000
BG 924 68 08 1000 910 77 13 1000
CZ 912 83 05 1000 898 96 06 1000
DK 968 32 00 1000 959 41 01 1000
DE 872 117 11 1000 843 141 16 1000
EE 871 120 09 1000 854 134 12 1000
IE 863 124 13 1000 853 131 16 1000
EL 945 51 04 1000 940 56 04 1000
ES 897 94 09 1000 885 103 12 1000
FR 948 50 01 1000 938 61 02 1000
HR 912 79 09 1000 894 92 14 1000
IT 920 76 04 1000 913 82 05 1000
CY 809 172 19 1000 789 187 24 1000
LV 804 171 26 1000 779 186 35 1000
LT 806 176 17 1000 761 216 23 1000
LU 833 140 28 1000 798 162 41 1000
HU 952 43 05 1000 944 50 06 1000
MT 913 80 07 1000 894 96 10 1000
NL 935 62 04 1000 921 73 06 1000
AT 898 92 10 1000 864 118 18 1000
PL 875 110 15 1000 846 132 22 1000
PT 869 122 10 1000 851 136 14 1000
RO 934 56 11 1000 919 66 15 1000
SI 922 74 04 1000 908 87 05 1000
SK 939 56 05 1000 931 63 06 1000
FI 970 30 00 1000 968 32 00 1000
SE 919 78 03 1000 902 94 04 1000
UK 862 126 12 1000 839 147 14 1000
Note Low earners are defined as those earning less than 50 of average hourly wages The reference group is households of employees who worked for 12 months full-time or 12 months part-time during the previous year Source EU-SILC 2013 UDB August 2015
The interaction between minimum wages income support and poverty
27
Table A4 Distribution of individuals living in households with low earners ()
by the position of the low earner(s) in the household
single adult on low wage
households with two or more adults
total spouse (not head) on
low wage
other member
(not head) on low wage
only head on low wage
head and other
member on low wage
BE 59 472 233 199 37 1000
BG 34 380 250 227 110 1000
CZ 31 579 173 180 37 1000
DK 89 274 309 325 03 1000
DE 88 424 265 178 46 1000
EE 70 524 138 213 55 1000
IE 49 347 264 267 73 1000
EL 47 270 404 248 31 1000
ES 49 319 266 303 64 1000
FR 68 436 220 259 17 1000
HR 09 386 287 234 83 1000
IT 86 248 285 328 53 1000
CY 27 298 351 252 72 1000
LV 63 287 222 294 134 1000
LT 55 432 123 314 76 1000
LU 72 332 184 252 160 1000
HU 30 369 178 366 57 1000
MT 45 257 415 249 33 1000
NL 80 381 372 160 08 1000
AT 61 328 382 199 31 1000
PL 16 292 310 296 86 1000
PT 31 406 200 304 59 1000
RO 12 378 257 205 149 1000
SI 39 480 197 242 41 1000
SK 21 426 239 249 65 1000
FI 126 373 146 348 06 1000
SE 97 514 139 215 35 1000
UK 79 390 186 283 63 1000
Note Low earners are defined as those earning less than 50 of average hourly wages The reference group is households of employees who worked for 12 months full-time or 12 months part-time during the previous year
Source EU-SILC 2013 UDB August 2015
The interaction between minimum wages income support and poverty
28
Table A5 Distribution of individuals living in households with low earners ()
by work intensity
work intensity
001-049 05 051-080 081-099 10
BE 168 74 273 152 333 1000
BG 215 137 261 66 321 1000
CZ 73 94 335 60 437 1000
DK 18 175 153 160 495 1000
DE 131 96 361 197 215 1000
EE 90 152 278 102 377 1000
IE 339 111 271 95 184 1000
EL 381 169 226 58 165 1000
ES 235 156 281 104 225 1000
FR 171 103 241 128 357 1000
HR 148 222 289 61 281 1000
IT 240 158 251 122 228 1000
CY 158 104 276 85 378 1000
LV 90 172 311 61 367 1000
LT 110 125 238 51 476 1000
LU 100 116 339 148 297 1000
HU 212 116 289 92 291 1000
MT 216 139 354 134 157 1000
NL 300 66 359 198 77 1000
AT 98 111 330 251 209 1000
PL 135 153 302 86 325 1000
PT 143 131 299 54 372 1000
RO 108 168 379 56 289 1000
SI 63 151 238 74 473 1000
SK 80 151 397 106 266 1000
FI 68 156 197 158 422 1000
SE 36 74 158 220 512 1000
UK 165 88 300 164 284 1000
Note Low earners are defined as those earning less than 50 of average hourly wages The reference group is households of employees who worked for 12 months full-time or 12 months part-time during the previous year Source EU-SILC 2013 UDB August 2015
The interaction between minimum wages income support and poverty
29
Table A6 Distribution of individuals living in households with low earners ()
by household type
households with working-age head households with elderly
head total one or more
adult no
children
single adult with
children
two or more adults one
or two children
two or more adults three
or more children
BE 431 17 446 95 11 1000
BG 455 14 410 111 11 1000
CZ 584 08 356 38 14 1000
DK 460 00 335 186 18 1000
DE 549 23 366 54 08 1000
EE 510 10 383 41 56 1000
IE 395 34 480 78 12 1000
EL 609 03 336 19 33 1000
ES 499 19 421 50 11 1000
FR 443 22 431 92 12 1000
HR 393 05 495 81 27 1000
IT 514 18 380 69 20 1000
CY 496 05 435 50 15 1000
LV 497 27 387 68 21 1000
LT 409 27 459 91 14 1000
LU 344 24 475 148 09 1000
HU 475 10 417 93 05 1000
MT 397 28 528 35 12 1000
NL 551 17 359 67 05 1000
AT 393 17 500 77 13 1000
PL 423 05 472 87 14 1000
PT 380 11 573 28 09 1000
RO 363 03 562 72 00 1000
SI 369 09 522 94 06 1000
SK 514 07 433 31 15 1000
FI 528 37 306 117 12 1000
SE 315 23 505 145 12 1000
UK 421 48 398 97 37 1000
Note Low earners are defined as those earning less than 50 of average hourly wages The reference group is households of employees who worked for 12 months full-time or 12 months part-time during the previous year
Source EU-SILC 2013 UDB August 2015
The interaction between minimum wages income support and poverty
30
Table A7 At risk-of-poverty rate before and after social transfers ()
individuals living in households with low
earner(s) individuals living in all households with
head of working age
after social transfers
before social transfers
number of observations
after social transfers
before social transfers
number of observations
BE 139 388 413 142 293 12347
BG 281 465 982 189 319 10758
CZ 114 324 1688 91 223 16341
DK 168 325 477 119 233 11401
DE 194 358 3381 160 249 21428
EE 191 417 1999 172 277 12919
IE 74 460 1683 144 333 11313
EL 383 525 955 244 369 15473
ES 266 469 3271 213 369 28077
FR 243 509 1378 146 329 21871
HR 127 392 1328 183 309 12156
IT 310 477 3290 193 336 37058
CY 201 354 2546 152 271 11891
LV 216 453 2865 196 320 12681
LT 240 460 2427 202 337 10002
LU 313 593 1805 170 366 8836
HU 254 520 1258 156 377 22402
MT 173 339 1135 153 303 10554
NL 58 193 1630 111 243 20607
AT 145 380 1538 140 332 11165
PL 195 428 5093 180 337 32690
PT 199 393 2093 195 315 13916
RO 201 460 1271 233 368 15752
SI 96 466 2191 134 327 23665
SK 128 358 969 106 244 13769
FI 102 366 733 107 274 22741
SE 166 476 1230 140 266 12356
UK 166 416 3217 153 293 19220
Note Low earners are defined as those earning less than 50 of average hourly wages The reference group is households of employees who worked for 12 months full-time or 12 months part-time during the previous year Source EU-SILC 2013 UDB August 2015
The interaction between minimum wages income support and poverty
31
Table A8 At risk-of-poverty gap before and after social transfers ()
individuals living in households with low
earners individuals living in all households with
head of working age
after social transfers
before social transfers
after social transfers
before social transfers
BE 213 388 253 535
BG 341 427 372 451
CZ 148 309 247 352
DK 422 438 293 460
DE 207 410 244 446
EE 206 359 320 457
IE 219 420 246 491
EL 305 394 368 452
ES 275 403 353 509
FR 224 488 223 465
HR 264 338 324 427
IT 348 445 354 451
CY 222 435 216 381
LV 270 330 339 452
LT 237 391 304 481
LU 186 348 216 439
HU 216 421 255 457
MT 216 413 230 500
NL 151 328 228 492
AT 280 334 295 476
PL 222 331 276 431
PT 244 345 341 412
RO 315 360 377 445
SI 148 346 250 435
SK 214 337 304 409
FI 143 257 230 459
SE 283 410 288 444
UK 225 440 249 461
Note Low earners are defined as those earning less than 50 of average hourly wages The reference group is households of employees who worked for 12 months full-time or 12 months part-time during the previous year Source EU-SILC 2013 UDB August 2015
The interaction between minimum wages income support and poverty
32
Table A9 At-risk-of-poverty rate of households with low earners () by the
position of the low earner in the household
at-risk-of-poverty rate () number of observations
head on low wage
spouse (not
head) on
low wage
other member
(not head) on low wage
total head on low wage
spouse (not
head) on
low wage
other member
(not head) on low wage
total
BE 177 166 34 139 122 195 96 413
BG 471 178 166 283 361 370 244 976
CZ 139 82 188 114 419 977 292 1688
DK 413 05 00 174 192 126 142 460
DE 403 119 72 195 1044 1422 889 3355
EE 259 133 194 184 655 1018 268 1941
IE 108 65 36 74 655 585 443 1683
EL 534 310 299 378 309 256 383 948
ES 345 206 221 268 1341 1029 858 3228
FR 360 179 188 243 467 593 299 1360
HR 230 82 71 127 434 513 382 1328
IT 448 231 152 310 1529 814 938 3281
CY 343 210 52 201 892 759 895 2546
LV 235 165 240 216 1368 800 620 2787
LT 305 184 220 242 1059 1029 292 2379
LU 400 252 191 313 874 597 326 1798
HU 358 192 119 254 570 464 225 1258
MT 343 101 85 173 372 292 472 1135
NL 144 42 19 59 395 605 597 1598
AT 299 79 80 143 445 503 585 1533
PL 298 175 108 203 1906 1399 1486 4791
PT 247 161 179 199 814 839 414 2067
RO 239 156 216 201 465 480 326 1271
SI 148 61 96 96 701 1042 428 2171
SK 238 87 47 128 324 413 232 969
FI 170 56 00 103 350 272 107 728
SE 305 74 136 163 419 622 168 1209
UK 199 153 117 166 1359 1249 596 3204
Note Low earners are defined as those earning less than 50 of average hourly wages The
reference group is households of employees who worked for 12 months full-time or 12 months part-time during the previous year
Source EU-SILC 2013 UDB August 2015
The interaction between minimum wages income support and poverty
33
Table A10 At-risk-of-poverty rate of households with low earners () by
work intensity
at risk-of-poverty rate () number of observations
0-049 05-099 1 total 0-049 05-099 1 total
BE 383 72 46 139 100 175 137 413
BG 603 111 104 282 344 320 313 977
CZ 331 88 57 115 281 664 735 1681
DK 556 21 114 170 91 147 233 471
DE 345 132 199 194 764 1885 727 3377
EE 437 97 138 195 470 736 731 1938
IE 120 41 29 74 754 613 308 1675
EL 589 134 120 382 524 271 158 953
ES 402 188 163 266 1277 1256 734 3266
FR 462 190 131 243 378 507 492 1377
HR 288 33 32 127 491 464 373 1328
IT 517 172 173 310 1306 1218 742 3266
CY 369 93 188 201 664 917 960 2541
LV 457 148 119 218 742 1051 1040 2833
LT 551 236 93 242 563 696 1143 2403
LU 600 293 135 313 391 872 535 1798
HU 562 109 96 254 413 479 367 1258
MT 373 60 66 172 403 553 178 1134
NL 105 35 00 58 592 908 125 1625
AT 330 89 115 145 322 894 322 1537
PL 381 143 94 196 1462 1972 1650 5084
PT 453 114 96 200 571 737 775 2083
RO 421 172 37 201 351 553 367 1271
SI 270 63 39 96 469 685 1037 2191
SK 269 80 97 128 223 485 257 965
FI 154 94 81 102 164 260 309 733
SE 421 105 159 167 135 461 626 1222
UK 383 122 57 169 789 1447 888 3124 Note Low earners are defined as those earning less than 50 of average hourly wages The reference group is households of employees who worked for 12 months full-time or 12 months part-time during the previous year Source EU-SILC 2013 UDB August 2015
The interaction between minimum wages income support and poverty
34
Table A11 At-risk-of-poverty rate of households with low earners () by
number of children
at risk-of-poverty rate () number of observations in dataset
without children
with children
total without children
with children
total
BE 100 171 139 178 230 413
BG 185 367 281 446 525 982
CZ 121 108 114 987 678 1688
DK 98 235 168 220 249 477
DE 211 173 194 1854 1499 3380
EE 157 250 191 1019 868 1998
IE 60 85 74 665 997 1683
EL 333 490 383 582 342 955
ES 191 346 266 1632 1602 3270
FR 133 338 243 610 752 1378
HR 120 138 127 521 771 1328
IT 267 367 310 1682 1535 3281
CY 237 168 201 1262 1247 2546
LV 159 283 216 1424 1380 2865
LT 153 307 240 993 1400 2427
LU 223 361 313 614 1168 1798
HU 247 263 254 598 654 1258
MT 79 238 173 451 671 1135
NL 25 94 58 893 723 1625
AT 105 174 145 605 914 1538
PL 121 254 195 2152 2872 5093
PT 133 243 199 794 1281 2093
RO 105 256 201 461 810 1271
SI 98 96 96 809 1369 2191
SK 127 133 128 498 457 969
FI 75 136 102 387 337 733
SE 189 155 166 388 828 1230
UK 132 199 166 1354 1741 3213
Note Low earners are defined as those earning less than 50 of average hourly wages The reference group is households of employees who worked for 12 months full-time or 12 months part-time during the previous year Source EU-SILC 2013 UDB August 2015
The interaction between minimum wages income support and poverty
35
Table A12 Share of social benefits in total income of households with low
earners
old-age pensions
family benefits
unemployment
benefits
housing benefits
social assistance
other benefits
total social benefits
BE 3 6 4 0 0 3 15
BG 10 2 2 0 0 3 18
CZ 7 1 0 0 0 6 15
DK 1 2 5 0 0 5 14
DE 3 5 2 1 0 1 12
EE 10 3 0 0 0 5 19
IE 3 8 8 0 0 3 23
EL 14 1 1 0 0 1 16
ES 8 0 9 0 1 3 21
FR 9 4 5 2 1 1 22
HR 8 5 1 0 0 6 20
IT 8 2 5 0 0 2 17
CY 10 2 4 0 0 3 19
LV 11 2 1 0 0 4 18
LT 6 5 1 0 1 6 19
LU 5 9 2 1 1 2 21
HU 9 7 1 0 0 3 19
MT 5 3 0 0 2 2 12
NL 2 1 1 1 1 2 8
AT 4 6 2 0 0 2 14
PL 12 2 1 0 0 3 17
PT 9 2 3 0 0 2 16
RO 11 4 0 0 0 3 18
SI 3 14 1 0 1 8 27
SK 11 3 0 0 0 5 20
FI 3 4 3 1 0 3 13
SE 2 11 2 0 0 7 23
UK 6 5 1 1 1 2 16
Note Other benefits include sickness disability and education-related benefits Low earners are defined as those earning less than 50 of average hourly wages The reference group is households of employees who worked for 12 months full-time or 12 months part-time during the previous year Source EU-SILC 2013 UDB August 2015
The interaction between minimum wages income support and poverty
36
Table A13 National minimum wages vs 50 of average earnings 2014
average hourly
earnings (euro)
average monthly
earnings (euro)
50 of average
monthly earnings (euro)
national monthly
minimum wage (euro)
required increase
()
BE 1954 3480 1740 1502 16
BG 237 417 208 174 20
CZ 537 987 494 329 50
DK 2622 4524 2262
DE 1756 3506 1753
EE 592 1070 535 355 51
IE 2227 3854 1927 1462 32
EL 846 1457 729 684 7
ES 1079 1925 963 753 28
FR 1531 2511 1256 1445 -13
HR 506 908 454 406 12
IT 1370 2255 1128
CY 1155 2032 1016
LV 494 897 448 320 40
LT 407 716 358 290 24
LU 2687 4918 2459 1921 28
HU 317 562 281 328 -14
MT 960 1744 872 718 21
NL 2221 3964 1982 1490 33
AT 1900 3546 1773
PL 477 858 429 404 6
PT 742 1333 666 566 18
RO 230 414 207 198 5
SI 957 1688 844 789 7
SK 485 869 435 352 23
FI 2080 3620 1810
SE 2512 3596 1798
UK 1771 2766 1383 1303 6
Note The reference group is households of employees who worked for 12 months full-time or 12 months part-time during the previous year Source EUROMOD version G275+ running on EU-SILC 2012 data uprated to 2014 (except for France and Luxembourg EU-SILC 2010 data uprated to 2014) Figures on current monthly minimum wages (in 2014) from Eurostat
The interaction between minimum wages income support and poverty
37
Table A14 Distribution of workers affected by the increase in minimum wages
to 50 of average hourly earnings by level of increase ()
total
affected
increase in earnings to 50 of average earnings not affected
lt10 1001-20 2001-30 gt30
BE 40 16 04 05 16 960
BG 104 42 46 04 11 896
CZ 85 31 20 12 22 915
DK 61 10 10 09 31 939
DE 167 35 21 17 94 833
EE 176 36 41 31 68 824
IE 178 57 45 28 48 822
EL 116 35 23 20 38 884
ES 96 29 18 11 38 904
FR 77 15 10 06 47 923
HR 93 32 28 12 21 907
IT 113 18 15 10 70 887
CY 210 45 30 26 109 790
LV 220 46 52 38 83 780
LT 209 40 36 31 103 791
LU 183 57 48 34 44 817
HU 90 36 33 09 12 910
MT 93 34 25 07 27 907
NL 83 24 16 11 33 917
AT 131 28 16 13 73 869
PL 153 46 33 22 53 847
PT 173 50 48 22 53 827
RO 93 29 16 12 36 907
SI 86 28 12 05 41 914
SK 62 20 14 08 19 938
FI 42 16 08 06 13 958
SE 121 18 12 09 81 879
UK 188 60 43 19 66 812
Note The reference group is households of employees who worked for 12 months full-time or 12 months part-time during the previous year Source EUROMOD version G275+ running on EU-SILC 2012 data uprated to 2014 (except for France and Luxembourg EU-SILC 2010 data uprated to 2014) Figures on current monthly minimum wages (in 2014) from Eurostat
The interaction between minimum wages income support and poverty
38
Table A15 Poverty risk in households of low earners 2014
total earners
(1) low earners
(2)
of which in
poor households (3)
poverty rate of
low earners (4) = (3) (2)
low earners in poor households
as of all earners
(4) = (3) (1)
BE 3353261 134026 17970 134 05
BG 2362137 244588 63961 262 27
CZ 3331428 282085 29516 105 09
DK 1749226 106300 25224 237 14
DE 30271881 5068452 793234 157 26
EE 427162 75190 17895 238 42
IE 1164123 207729 17405 84 15
EL 2084532 242333 72889 301 35
ES 12258632 1177421 309078 263 25
FR 19911322 1535080 234136 153 12
HR 1063434 98966 12125 123 11
IT 15503093 1749434 488952 279 32
CY 284162 59795 10793 180 38
LV 628621 138371 27466 198 44
LT 928391 194150 37148 191 40
LU 184141 33673 6327 188 34
HU 2775484 250535 45132 180 16
MT 129372 12027 2446 203 19
NL 5544901 462701 60572 131 11
AT 2596626 341187 63808 187 25
PL 10166671 1558698 280035 180 28
PT 3303603 571146 80247 141 24
RO 6214151 580179 99679 172 16
SI 647095 55639 7210 130 11
SK 1807568 111931 21873 195 12
FI 1514848 63844 6723 105 04
SE 3232371 390717 64719 166 20
UK 22093617 4156506 633675 152 29
EU-28
155531853 19902703 3530237 177 23
Note Low earners are those earning less than 50 of average hourly wages The reference group is households of employees who worked for 12 months full-time or 12 months part-time during
the previous year The poverty threshold is at 60 of national household disposable equivalised income The poverty rate is the share of population (or population group) below that threshold Source EUROMOD version G275+ running on EU-SILC 2012 data uprated to 2014 (except for France and Luxembourg EU-SILC 2010 data uprated to 2014) Figures on current monthly minimum wages (in 2014) from Eurostat
The interaction between minimum wages income support and poverty
39
Table A16 Effects of a minimum wage at 50 of average hourly wages on at-
risk-of-poverty rates by gender 2014
change in at-risk-of-poverty rates
total men women
BE -08 -08 -08
BG 00 00 00
CZ -12 -11 -13
DK -06 -08 -04
DE -10 -09 -11
EE -18 -16 -19
IE -06 -06 -07
EL -11 -10 -11
ES -09 -08 -10
FR -11 -10 -11
HR -04 -04 -05
IT -08 -07 -08
CY -19 -14 -24
LV -03 -04 -03
LT -10 -10 -10
LU -16 -16 -16
HU -12 -12 -11
MT -18 -20 -17
NL -07 -09 -06
AT -22 -22 -22
PL 00 00 00
PT -13 -13 -12
RO -04 -04 -04
SI 00 00 00
SK 00 00 00
FI -02 -02 -03
SE -12 -11 -14
UK -06 -06 -05
Note The change in poverty rates is the percentage point difference before and after the introduction of a minimum wage at 50 of average hourly earnings The poverty rate is the share of population (or population group) below that threshold The poverty threshold is at 60 of national household disposable equivalised income The reference group is households of employees who worked for 12 months full-time or 12 months part-time during the previous year
Source EUROMOD version G275+ running on EU-SILC 2012 data uprated to 2014 (except for France and Luxembourg EU-SILC 2010 data uprated to 2014) Figures on current monthly
minimum wages (in 2014) from Eurostat
The interaction between minimum wages income support and poverty
40
Table A17 Effects of a minimum wage at 50 of average hourly wages on at-
risk-of-poverty rates by age 2014
change in at-risk-of-poverty rates
aged lt18 aged 18-29 aged 30-44 aged 45-64 aged 65+
BE -10 -19 -08 -04 00
BG 00 00 00 00 00
CZ -14 -17 -11 -14 -03
DK -02 -31 -01 -04 00
DE -08 -25 -09 -09 -03
EE -20 -20 -16 -25 -04
IE -05 -20 -02 -06 00
EL -12 -27 -10 -10 00
ES -10 -12 -10 -10 -01
FR -18 -17 -12 -06 -01
HR -05 -07 -04 -05 -01
IT -10 -13 -10 -07 00
CY -10 -23 -23 -13 -32
LV -07 -05 -13 -03 00
LT -13 -12 -11 -11 -03
LU -26 -21 -18 -12 -03
HU -14 -18 -12 -12 -01
MT -26 -23 -20 -16 -05
NL -12 -17 -05 -04 00
AT -34 -38 -28 -13 -02
PL 00 00 00 00 00
PT -15 -23 -11 -15 -01
RO -05 -05 -04 -04 -02
SI 00 00 00 00 00
SK 00 00 00 00 00
FI -02 -04 -02 -03 -01
SE -15 -25 -14 -07 -04
UK -06 -09 -07 -06 -01
Note The change in poverty rates is the percentage point difference before and after the introduction of a minimum wage at 50 of average hourly earnings The poverty rate is the share of population (or population group) below that threshold The poverty threshold is at 60 of national household disposable equivalised income The reference group is households of employees who worked for 12 months full-time or 12 months part-time during the previous year
Source EUROMOD version G275+ running on EU-SILC 2012 data uprated to 2014 (except for France and Luxembourg EU-SILC 2010 data uprated to 2014) Figures on current monthly
minimum wages (in 2014) from Eurostat
The interaction between minimum wages income support and poverty
41
Table A18 Effects of a minimum wage at 50 of average hourly wages on
inequality 2014
change in inequality
Gini coefficient income quintile share ratio
(S80S20)
BE -02 -004
BG 00 000
CZ -04 -008
DK -03 -009
DE -04 -006
EE -06 -014
IE -02 -003
EL -04 -016
ES -05 -024
FR -05 -006
HR -01 -002
IT -01 -002
CY -07 -014
LV -02 -007
LT -05 -009
LU -05 -007
HU -06 -012
MT -05 -010
NL -02 -004
AT -07 -012
PL 00 000
PT -09 -018
RO -02 -005
SI 00 000
SK 00 000
FI -01 -002
SE -06 -007
UK -03 -006
Note The change in inequality is the difference in the index concerned before and after the introduction of a minimum wage at 50 of average hourly earnings The Gini coefficient ranges from 0 to 100 where 0 represents perfect equality in a given country and 100 represents the maximum level of inequality The income quintile share ratio (S80S20) is the ratio of the total income received by the 20 of the countryrsquos population with the highest disposable income (top
quintile) to that received by the 20 of the countryrsquos population with the lowest disposable income (bottom quintile) The reference group is households of employees who worked for 12 months full-time or 12 months part-time during the previous year Source EUROMOD version G275+ running on EU-SILC 2012 data uprated to 2014 (except for France and Luxembourg EU-SILC 2010 data uprated to 2014) Figures on current monthly minimum wages (in 2014) from Eurostat
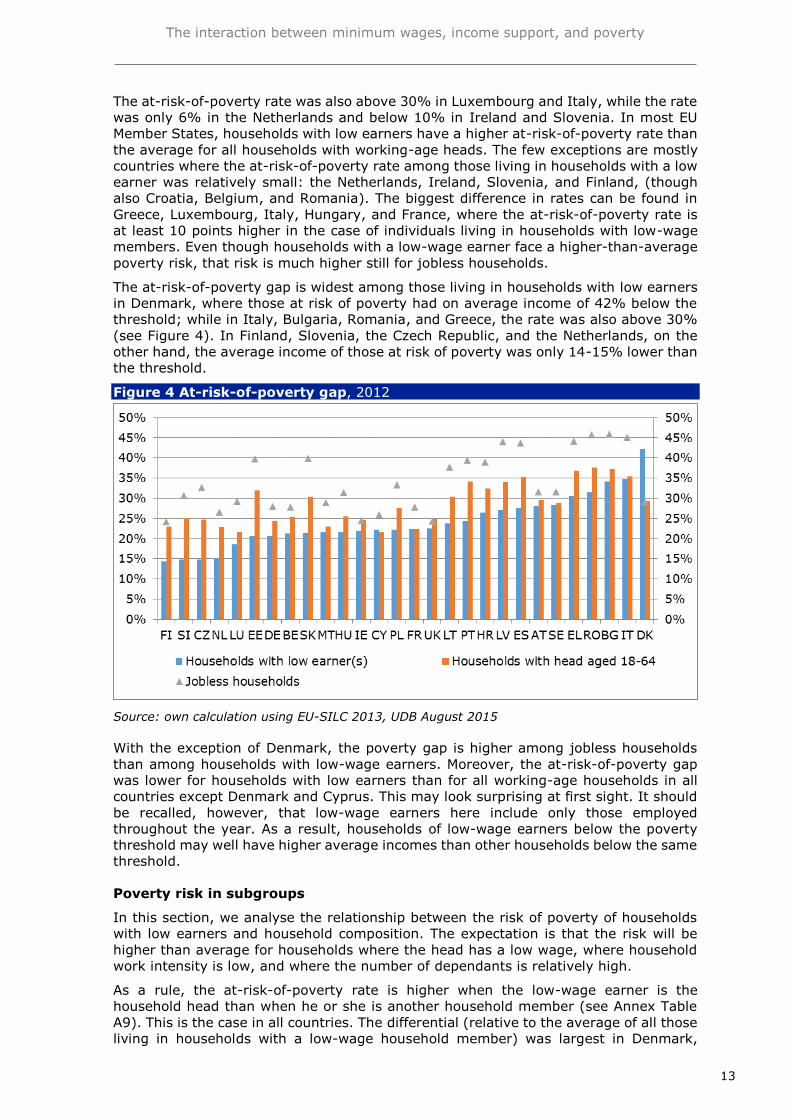
The interaction between minimum wages income support and poverty
14
Germany and Bulgaria (around 20 points in 2012) while it was also quite large in
another 10 countries (over 10 percentage points) In Latvia and the Czech Republic on
the other hand the differential was smallest (below 3 percentage points) Having a low
earner as household head thus tends to increase the at-risk-of-poverty rate as
compared with cases where the spouse or some other member is a low earner
The at-risk-of-poverty rate is also associated with low work intensity at household level
The definition of low-wage earners adopted in this study means that low earners in the
household work during the whole year (although not necessarily in full-time jobs) Other
household members on the other hand can have spells of inactivity or unemployment
and thus might be employed for only a few months during the year Household work
intensity thus varies among households with low earners As Figure 5 shows among
households with low-wage earners the poverty risk is higher than average among
households with a work intensity lower than 05 The difference is especially large in
Bulgaria Denmark Lithuania and Hungary where the at-risk-of-poverty rate among
households with work intensity below 05 exceeds by over 30 percentage points the
average for those in all households with low-wage earners (see Annex Table A10)
It is also evident that having a low-wage earner in the household represents an
additional poverty risk factor even among households with low work intensity Figure 5
shows that the at-risk-of poverty rate is higher in the case of households with a work
intensity below 05 where there is a low-wage household member Having a low-wage
earner increases the risk of poverty especially in Luxembourg Hungary and Denmark
but also in several other countries A few exceptions do exist in the Netherlands
Ireland Slovenia Finland and Croatia the at-risk-of-poverty rate is actually lower
among households with low work intensity where there is a low earner
Figure 5 At-risk-of-poverty rate in households with work intensity below 05
Source own calculation using EU-SILC 2013 UDB August 2015
As indicated in Figure 6 having children is also associated with a higher-than-average
poverty risk among those living in households with low-wage earners The biggest
difference is in Greece and France where the at-risk-of-poverty rate of those living in
households with children exceeds the average for households with low-wage earners by
some 10 percentage points The only exceptions are a few countries with a relatively
low at-risk-of-poverty rate for households with children such as Cyprus Germany
Sweden and the Czech Republic In these countries the risk of poverty is lower in the
case of low-wage households with children
The interaction between minimum wages income support and poverty
15
Figure 6 At-risk-of-poverty rate in households with children
Source own calculation using EU-SILC 2013 UDB August 2015
It is also clear that having a low-wage household member increases the poverty risk
among households with children in the majority of EU Member States In Greece France
and Denmark families with low earner(s) and children face at-risk-of-poverty rates that
are more than 15 points higher than they are for all families with children On the other
hand there are certain countries (especially Ireland Croatia Romania and Slovenia)
where the opposite is true there the risk of poverty is actually lower for households
with low earner(s) and children than it is for all households with children
The role of social transfers in reducing poverty risk
The income structure of households with low-wage earners differs greatly among EU
Member States (see Annex Table A12) The two extreme cases are the Netherlands
(where 92 of all incomes are either labour or capital earnings with only 8 coming
from social transfers) and Slovenia (where the respective shares of market incomes and
social transfers are 73 and 27) Relatively low shares of social transfer income are
also found in Germany Malta and Finland (12-13) and high shares in Ireland
Sweden and France (22-23) In the case of Greece and some other countries (Poland
Slovakia Romania Cyprus Latvia and Bulgaria) old-age pensions are the most
important social transfer in households with low-wage earners The share of family
benefits in total income is the highest in Slovenia (14) Sweden (11) and
Luxembourg (9) while the share of unemployment benefits is highest in Spain (9)
and Ireland (8) Sickness and disability benefits make up the highest share of total
income in Slovenia (8) and Sweden (7) Social assistance and housing allowances
are only a small part of the total income of households with low earners the highest
share of these being found in the UK and France (3)
Social benefits play an important role in moderating the risk of poverty of those living
in households with low earners Figure 7 shows that social transfers reduce the at-risk-
of-poverty rate (relative to a ldquono social transfersrdquo counterfactual) by over 30 percentage
points in Ireland Slovenia and Sweden The smallest reduction is seen in the
Netherlands Denmark Cyprus and Greece where the rate is lowered by 14-16 points
The effect of social transfers can also be assessed relative to the pre-transfer at-risk-
of-poverty rate This indicator varies from 27 in Greece to 84 in Ireland (see also
Annex Table A7)
The effect of social transfers on the depth of the risk of poverty can be measured by
comparing the poverty gap before and after social transfers The gap before social
transfers is naturally larger than after transfers in all countries The biggest difference
is in France where the inclusion of social transfers reduces the gap by 26 percentage
points The poverty gap after social transfers is lowered by 20-25 percentage points in
The interaction between minimum wages income support and poverty
16
the UK Cyprus Hungary Germany and Ireland The reduction is smallest in Latvia
Austria Romania and Denmark (see Annex Table A8)
Figure 7 Impact of social transfers on at-risk-of-poverty rate in households
with low earners 2012
Source own calculation using EU-SILC 2013 UDB August 2015
Note absolute poverty reduction is the difference between the pre-transfer and post-transfer at-risk-of-poverty rate Relative poverty reduction equals absolute poverty reduction divided by pre-transfer at-risk-of-poverty rate
Part II Simulating the poverty effects of an EU minimum wage
Methodology
The aim here is to simulate the poverty effects of raising national (hourly) minimum
wages to 50 of national average (hourly) wages taking account of interactions of low
earnings with social assistance other benefits and taxes using the European tax-benefit
model EUROMOD11 We assume no employment or behavioural effects
As in Part I the analysis is confined to employees who have been working either full-
time or part-time over the whole year Average hourly earnings are calculated as gross
monthly earnings divided by usual working hours per month (ie usual working hours
per week multiplied by 5212)
In three Member States (Bulgaria France and Italy) where information on whether
employees had worked full-time or part-time is missing all employees with an
employment record of 12 months over the year are covered In the UK where
information on months of employment is missing all employees are covered
The simulated EU minimum wage is equal to 50 of national average hourly wages but
is set on a monthly basis (multiplying minimum hourly wages by usual working hours
per week by 5212) Where national legislation dictates that monthly wages are paid
1314 times a year this is assumed also to be the case with the new minimum
In those Member States where a youth sub-minimum wage is currently in force it is
assumed that the EU minimum wage applies to all workers irrespective of age
11 Specifically we use version G275+ running on EU-SILC 2012 data uprated to 2014 incomes
and tax-benefit policies
The interaction between minimum wages income support and poverty
17
Minimum wages in the EU
As pointed out earlier in 2014 most Member States had a national minimum wage the
exceptions being Germany Austria Italy Cyprus Denmark Finland and Sweden (In
the meantime the introduction of a minimum wage has been phased-in gradually in
Germany and has been legislated in Italy)
Obviously the level of the minimum wage varied considerably from euro174 a month in
Bulgaria to euro1921 in Luxembourg In terms of the ratio of the minimum to average
wages the variation was also significant though less wide ‒ from 33 in the Czech
Republic to 53 in Slovenia This is shown in Figure 8
Figure 8 Minimum wages in the EU 2014
Source Eurostat (OECD for average earnings in Belgium France Greece the Netherlands and
Romania)
Simulating an EU minimum wage
A hypothetical EU minimum wage at 50 of national average wages is simulated The
latter are estimated from the EU-SILC data restricting the sample to those employees
who had been working either full-time or part-time throughout the previous year except
in the case of Bulgaria France Italy and the UK (see above)
Comparing the threshold of 50 of national average wages with actual minimum wage
levels in 2014 the required increase would be relatively large in a number of countries
reaching 50 in the Czech Republic and 51 in Estonia Note that in two Member States
(France and Hungary) where actual minimum wages were above the threshold of 50
of national average wages as estimated from the data12 the actual minimum wage level
is assumed when simulating a hypothetical EU minimum wage This is shown in Annex
Table A13
The proportion of workers (narrowly defined) affected by the increase in earnings
following the introduction of a minimum wage at 50 of national average wages is
shown in Figure 9 On the whole the proportion of workers affected would range from
around 4 to 5 in Belgium and Finland to around 21 to 22 in Cyprus Lithuania
and Latvia The level of the resulting adjustment also varies In Belgium Bulgaria and
12 Note that this is slightly different from Figure 8 where the countries in which minimum wages were above 50 of national average wages were Luxembourg and Slovenia The discrepancy is due to the fact that as explained earlier our analysis here is restricted to employees working
continuously throughout the year (except in the UK)
The interaction between minimum wages income support and poverty
18
Hungary13 for over 40 of workers affected by the hypothetical introduction of a
minimum wage at this level the rise in wages would be below 10 Conversely in
France Denmark Austria Cyprus and Lithuania between 64 and 78 of workers
currently below the new minimum wage threshold would receive a pay rise of over 20
with the proportion reaching 71 in Italy and 75 in Sweden The distribution of
workers by level of the required increase is shown in Annex Table A14
Figure 9 Distribution of workers affected by a minimum hourly wage at 50
of national average hourly wage by level of implicit pay rise
Source EUROMOD 2014 model on SILC 2012 input data
Notes Average hourly wages are calculated as gross monthly wages divided by usual working hours per month Our analysis is limited to workers employed either full-time or part-time over the whole year Because of missing information all employees working 12 months over the year (irrespective of whether full-time or part-time) are covered in Bulgaria France and Italy while
all employees (irrespective of whether full-time or part-time and of whether full-year or part-
year) are covered in the UK In France and Luxembourg EUROMOD ran on SILC 2010 data
The above figures need to be interpreted with caution Notwithstanding differences in
definitions years of reference and sources the finding that in Sweden more than 8
of all employees working permanently over the previous 12 months were paid less than
385 of average wages14 differs from the estimates from the Structure of Earnings
Survey that no more than 25 of workers in firms with at least 10 employees in that
country were paid less than 67 of national median gross hourly earnings in 2010 It
should be noted however that this excludes large sections of the economy ‒ those
working in agriculture and the public sector as well as those in firms with fewer than 10
employees many of whom are likely to be low paid
Poverty effects of an EU minimum wage
The effectiveness of the minimum wage as an anti-poverty tool depends on a variety of
factors over and above its level To start with if the minimum wage is set in hourly
terms the number of hours a worker is employed is clearly important On the other
hand compliance also matters if the minimum wage is not enforceable (as in informal
labour markets or segments thereof) raising it may well fail to improve the incomes of
low-paid workers Finally if increases to the minimum wage lsquopricersquo some workers out of
13 Note that although in Hungary the minimum wage is formally above 50 of national average wages the data show that a number of low-wage workers actually work long hours In their case dividing monthly pay by hours worked (as explained in the Methodology section) results in an hourly wage that is below the statutory minimum 14 A wage increase from 385 to 50 of average earnings amounts to a relative increase of 30 In Annex Table A14 introducing a minimum wage at 50 of average hourly earnings would
result in hourly wage increases of 30 or more for 81 of workers in our sample in Sweden
The interaction between minimum wages income support and poverty
19
the labour market then to them a higher minimum wage will mean lower not higher
incomes
While the above considerations concern the effectiveness of minimum wages in raising
the earnings of low-paid workers poverty effects will also depend on their household
circumstances ndash in other words on
(i) The position of minimum-wage earners in the household ie whether they
are primary earners (ie heads of household) or secondary earners (eg
spouses or working-age children living in the parental home)
(ii) The contribution to household income by other household members
Furthermore the poverty effect of changes to the minimum wage will also depend on
interactions with the tax and benefit system specifically on the extent to which
improvements in market incomes (in this case labour earnings) resulting from higher
minimum wages may be partly offset by
(iii) Increases in income taxes and social contributions
(iv) Reductions in social assistance and other cash benefits
Such interactions can be decisive For example it has been estimated that ldquoin Ireland
[hellip] without any accompanying measures such as raising means-tested benefits in line
with the minimum wage less than a tenth of a minimum wage increase would end up
in the pockets of single-parent minimum wage earners [while in] Luxembourg a
minimum-wage increase could actually make a single parent worse off as benefit
reductions and higher social contributions can outweigh the wage increaserdquo (OECD
2015a) Elsewhere the culprit is the lsquotax wedgersquo between labour costs and workersrsquo
take-home pay which exceeds 45 of the gross minimum wage in countries where
social contributions are high as in Germany Poland and Slovenia or where income tax
schedules are flat as in Hungary and Latvia (OECD 2015b)
In Part I it was established that between a quarter and a half of all those living in
households where at least one member earned below 50 of average earnings lived in
households where that member was not the head (see Figure 2 and Annex Table A4)
Moreover even though in some countries (Greece Luxembourg Italy Hungary and
France) the poverty rate of households with low earners was 10 or more points above
the average for all households with a head aged below 65 in most other Member States
the difference was small What is more in as many as 7 countries (Ireland the
Netherlands Slovenia Finland Croatia Belgium and Romania) households with low
earners actually reported below-average poverty rates (see Figure 3)
Here in Part II the picture is completed by simulating the poverty effects of raising the
minimum wage to 50 of average hourly earnings (or introducing one at that level
where none exists) We do so taking into account the household circumstances of
minimum-wage earners as well as interactions with taxes and benefits Also we
assume no employment effects or behavioural responses Finally to focus on genuine
improvements in low incomes we fix the poverty line at the baseline15
A useful point of departure is to establish the extent to which low earnings actually
overlap with income poverty As seen in Table A15 this is rather limited across the EU
among all persons living in households with low earners only 177 were poor and
among all persons in our reference group (households of employees who worked for 12
months full-time or 12 months part-time during the previous year) only 23 lived in
poor households with low earners So the scope for reducing in-work poverty via an
increase in the minimum wage may not be great
15 In fact if the hike in minimum wages is entirely absorbed by employers taking lower profits assuming no shifting of higher labour costs onto consumers in the form of higher prices and no job losses then the first effect of the policy change will necessarily be to raise real disposal incomes at aggregate level and quite probably the income of the median person too in which
case the increase in the minimum wage will also raise the poverty threshold
The interaction between minimum wages income support and poverty
20
Having said that our results show that the poverty effects of higher minimum wages
may not be entirely negligible either As shown in Table A16 in-work poverty would
decline by 22 percentage points in Austria and by 16 to 19 points in another four
countries (Cyprus Malta Estonia and Luxembourg) In most Member States poverty
reduction would be between 06 and 13 percentage points (around 10 point in France
Germany and Spain) At the other extreme at-risk-of-poverty rates would fall by 02
to 04 of a percentage point in four countries (Croatia Romania Latvia and Finland)
and would remain unchanged in another four (Slovenia Slovakia Bulgaria and Poland)
With the exception of Cyprus where raising the minimum wage to 50 of average
hourly earnings would reduce poverty rates for women by 10 percentage point more
than it would for men gender effects were rather small At one end of the scale female
poverty rates in Sweden would fall by 03 of a percentage point more than male ones
At the other end female poverty rates in Denmark would fall by 04 of a percentage
point less than male ones
In terms of age the reduction in poverty following an increase in the minimum wage
would least benefit the elderly (see Table A17) Only in Cyprus where a large number
of pensioners lived with their working children would the rise in the minimum wage
significantly reduce the at-risk-of-poverty rate among older people (by 32 percentage
points) Elsewhere poverty in old age would fall by less than half percentage point
Conversely in most Member States (16 out of 28) child poverty would decline by at
least one percentage point following an increase in the minimum wage In Austria the
size of child poverty reduction would be 34 percentage points In Luxembourg and
Malta it would be 26 points Child poverty would also fall appreciably in Estonia (by 2
percentage points) in France (18) and in Portugal and Sweden (both 15 points)
Young people (aged 18-29) would appear to be the greatest beneficiaries of a rise in
the minimum wage in terms of a reduction in at-risk-of-poverty rates In 19 Member
States the size of poverty reduction for that age group would be at least 12 percentage
points In Germany and Sweden it would be 25 points in Greece 27 and in Denmark
31 In Austria youth poverty would fall by as much as 38 percentage points16
Inequality effects of an EU minimum wage
Finally another effect of an EU-wide minimum hourly wage set at 50 of average hourly
earnings assuming no adverse employment effects would be to reduce income
inequality in most Member States As seen in Table A18 the reduction in inequality as
measured by the Gini index would be largest in Portugal (09 percentage points)
followed by Austria and Cyprus (07 pp) Sweden Hungary and Estonia (06 pp) then
France Spain Malta Lithuania and Luxembourg (05 pp) Although in another 13
countries the reduction would be small (01 to 04 percentage points) only in Poland
Bulgaria Slovenia and Slovakia would the Gini index remain unchanged
While the Gini index is known to be most sensitive to changes around the middle of the
income distribution by definition the opposite is the case with the income quintile share
ratio (S80S20) which measures the total income received by the top quintile relative
to that received by the bottom quintile Our results show that raising minimum hourly
wages to 50 of average hourly earnings would reduce the S80S20 ratio in 24 out of
28 Member States This may be interpreted as evidence that at the very least the
increase in minimum wages would benefit poorer households more than it would richer
ones The effect would be greatest in three South European countries in Spain the
ratio would fall by 024 in Portugal and Greece by 018 and 016 respectively17
16 In Annex Tables A16 and A17 only differences in poverty rates are presented (ie before and after raising the minimum wage to 50 of average hourly earnings)
17 Note however that in Italy the S80S20 ratio would decline by a mere 002
The interaction between minimum wages income support and poverty
21
Concluding remarks
This Research Note set out to answer two distinct but closely related questions
(i) What is the relationship between low wages and poverty
(ii) Would an EU-wide minimum wage at 50 of national average hourly wages
be effective in reducing poverty
Clearly poverty analysis requires shifting the focus to the household circumstances of
low-wage workers which provides the rationale for analysing EU-SILC data The
analysis here complements Oumlzdemir amp Ward (2015) who examined the individual
characteristics of low-wage workers using LFS data
Working with EU-SILC data to identify workers on low hourly wages has important
drawbacks such as possible measurement errors affecting both earnings and working
hours and discrepancies between the reference periods of the variables involved (the
survey year for usual working hours the previous year for labour earnings and full-
timepart-time employment status) To minimise errors in estimates the analysis was
restricted to a subset of households with employees who had worked throughout the
income year
With these caveats in mind the findings can be summarised as follows
With respect to the first question there is little evidence of a concentration of low pay
in households in EU Member States The proportion of households with two or more low-
wage employees turns out to be below 3 in all Member States Put differently among
all persons living in working-age households with at least one low earner the proportion
of those living in households with two or more low earners is below 20 in all Member
States and is usually below 10 (in 16 out of 28 Member States)
Furthermore most low earners are not lsquoprimary earnersrsquo among all individuals living in
low-wage households the majority (51-75) are in households where the low earner
is either the spouse or another person but not the household head
Households with a low earner typically face higher at-risk-of-poverty rates than other
working-age households (in 21 out 28 Member States) The rate among those living in
households with low-wage earners is highest in Greece Luxembourg and Italy (over
30) and is lowest in the Netherlands Ireland and Slovenia (below 10)
The risk of poverty is higher still where the person earning a low wage is the household
head most especially in Denmark Germany and Bulgaria The risk of poverty among
households with low earners is also increased by low work intensity the effect being
most pronounced in Bulgaria Lithuania and Hungary The number of dependants
children especially is also associated with a higher risk this being particularly the case
in Greece and France
A tentative attempt was made to answer the second question using EUROMOD to
estimate the effects on the risk of poverty of introducing a minimum wage in all
countries at 50 of national average wages taking into account interactions with tax-
benefit policies and assuming no effects on employment Setting a minimum wage at
this level is estimated to affect under 5 of employees in Belgium and Finland but over
20 in Latvia and Lithuania In some Member States a large proportion of those
affected (over 60 in Italy and Sweden) would appear to receive significant pay rises
(in excess of 30) a finding which may in part be attributed to measurement error
The anti-poverty effect of raising the minimum wage (as measured relative to a fixed
poverty threshold) would be small but not trivial The at-risk-of-poverty rate would fall
by at least 10 percentage point in 13 out of 28 Member States The size of poverty
reduction would be largest among working households with children and young adults
Our findings suggest that given the household circumstances of low-wage workers and
the current rules of tax and benefit systems raising minimum wages to 50 of national
average hourly wages is likely to have positive but modest effects in terms of reducing
the number of people at risk of poverty
The interaction between minimum wages income support and poverty
22
Our analysis is limited to households of employees who worked for 12 months full-time
or 12 months part-time during the previous year This inevitably excludes several
employees working intermittently18 (ie less than 12 months over the previous year)
or those switching from part-time to full-time work or vice versa While the latter
category might benefit from the increase in minimum wages simulated here the former
would probably benefit less
More generally minimum wage increases would do little directly to improve the living
standards of the self-employed including ldquothe so-called lsquobogus self-employedrsquo who do
similar work to regular employees but whose contracts are not protected by the same
safeguards and regulationsrdquo (OECD 2015b) Nor would minimum wage increases raise
the earnings of informal workers except possibly in the context of the lsquolighthouse
effectrsquo19
Nevertheless setting the minimum wage at 50 of national average hourly wages EU-
wide can also be supported on grounds other than poverty reduction In particular a
higher minimum wage will by definition reduce earnings inequality at individual level
(while as shown earlier in most countries it would also reduce income inequality at
household level) Also setting a wage floor may address considerations of fairness and
counterbalance the monopsony power of some employers Moreover the minimum
wage may act as a lsquobeneficial constraintrsquo increasing the value of the job for both workers
and employers limiting costly turnover providing incentives for training and altogether
raising productivity
Finally while the minimum wage may be a blunt instrument for poverty reduction on its
own better coordination with other tax-benefit policies may significantly increase its
overall effect For instance a broader targeting of means-tested assistance and a lower
tax wedge will make work pay more even when pay is low enhancing the extent to
which minimum wage increases can improve take-home pay In-work benefits20 have
often proved effective in this respect Conversely the case for minimum wages becomes
stronger in the presence of in-work benefits as the former prevent the latter from being
captured by employers rather than by their intended beneficiaries
18 Note that employees working intermittently were included if they lived in a household with a member who worked for 12 months full-time or 12 months part-time during the previous year 19 A lsquolighthouse effectrsquo is said to be observed when employers and workers in the informal sector (where minimum wages are not legally enforced) set pay by reference to the level of the minimum wage in the formal sector When this is the case wages in the informal sector will move in line with minimum wages in the formal sector In contrast under the standard model workers
displaced from the formal sector after the introduction or increase of a minimum wage will seek employment in the informal sector causing wages there to fall For a recent analysis see Boeri et al (2011) 20 The Earned Income Tax Credit in the US and the Working Tax Credit in the UK are the best known such schemes For a formal analysis of in-work benefits in an optimal tax design setting see Brewer et al (2010) For a comprehensive review of schemes in a variety of countries see
Immervoll amp Pearson (2009)
The interaction between minimum wages income support and poverty
23
References
Boeri T amp van Ours J (2013) The economics of imperfect labor markets (2nd edition)
Princeton NJ Princeton University Press
Boeri T Garibaldi P amp Ribeiro M (2011) The lighthouse effect and beyond Review of
Income and Wealth 57 S54-S78
Brewer M Saez E amp Shephard A (2010) Means testing and tax rates on earnings In
Dimensions of tax design the Mirrlees Review Oxford Oxford University Press
Cantillon B (2011) The paradox of the social investment state growth employment
and poverty in the Lisbon era Journal of European Social Policy 21 (5) 432-449
Cantillon B Collado D amp Van Mechelen N (2015) The end of decent social protection
for the poor The dynamics of low wages minimum income packages and median
household incomes ImPRovE Working Paper No 1503 University of Antwerp
Card D amp Krueger A (1994) Minimum wages and employment a case study of the fast-
food industry in New Jersey and Pennsylvania American Economic Review 48 (4) 772-
793
Card D amp Krueger A (1995) Myth and measurement the new economics of the
minimum wage Princeton NJ Princeton University Press
Doucouliagos H amp Stanley TD (2009) Publication selection bias in minimum-wage
research A meta-regression analysis British Journal of Industrial Relations 47 (2) 406-
428
Dube A (2013) Minimum wages and the distribution of family incomes (mimeo)
Dube A Lester W amp Reich M (2010) Minimum wage effects across state borders
Estimates using contiguous counties Review of Economics and Statistics 92 (4) 945-
964
Gaacutebos A Branyiczki R Lange B amp Toacuteth IG (2015) Employment and poverty dynamics
in the EU countries before during and after the crisis ImPRovE Working Paper 1506
University of Antwerp
Immervoll H amp Pearson M (2009) A good time for making work pay Taking stock of
in-work benefits and related measures across the OECD Social Employment and
Migration Working Paper 81 Paris Organisation for Economic Co-operation and
Development
Maicirctre B Nolan B amp Whelan CT (2012) Low pay in-work poverty and economic
vulnerability a comparative analysis using EU-SILC Manchester School 80 (1) 99-116
Neumark D amp Wascher W (2008) Minimum wages Cambridge MA The MIT Press
OECD (2011) Divided We Stand Why inequality keeps rising Paris Organisation for
Economic Co-operation and Development
OECD (2015a) Employment Outlook Paris Organisation for Economic Co-operation and
Development
OECD (2015b) Minimum wages after the crisis making them pay Paris Organisation
for Economic Co-operation and Development
Oumlzdemir E amp Ward T (2015) The characteristics of workers on low wages Social
Situation Monitor Research Note 92015 Brussels European Commission
Schmitt J (2013) Why does the minimum wage have no discernible effect on
employment Washington DC Center for Economic and Policy Research
Ward T amp Oumlzdemir E (2009) Measuring work intensity Social Situation Monitor
Research Note 92009 Brussels European Commission
Wolfson P amp Belman D (2014) What does the minimum wage do Kalamazoo MI
Upjohn Institute for Employment Research
The interaction between minimum wages income support and poverty
24
Annex
Table A1 Percentage of full-year employees among all employees
full-year employees
(either full-time or part-time)
employees with spells of self-
employment or employment
change during the year
employees with
spells of inactivity during the year
low-wage non-low wage
BE 28 816 71 85 1000
BG 67 823 06 103 1000
CZ 83 811 34 72 1000
DK 35 844 16 105 1000
DE 123 740 79 60 1000
EE 124 643 113 120 1000
IE 153 666 61 120 1000
EL 88 760 53 99 1000
ES 126 712 50 113 1000
FR 51 793 76 80 1000
HR 97 791 23 90 1000
IT 93 779 66 61 1000
CY 181 666 39 115 1000
LV 201 644 58 97 1000
LT 190 691 17 103 1000
LU 169 688 70 73 1000
HU 47 770 72 111 1000
MT 81 778 85 56 1000
NL 68 831 20 81 1000
AT 92 714 69 126 1000
PL 139 703 76 82 1000
PT 126 768 49 58 1000
RO 71 888 28 13 1000
SI 73 831 45 52 1000
SK 49 850 42 58 1000
FI 31 756 33 180 1000
SE 75 803 41 81 1000
UK 136 719 99 46 1000
Source EU-SILC 2013 UDB August 2015
The interaction between minimum wages income support and poverty
25
Table A2 Number of low earners in the sample
number of low
earners number of all
workers
no of individuals in households
with low earners
number of individuals
BE 143 4238 34 413 14623 28
BG 293 3876 75 982 12425 79
CZ 561 6064 93 1688 19105 88
DK 171 4185 41 477 13910 34
DE 1334 9242 144 3381 26709 127
EE 709 4406 161 1999 15053 133
IE 574 3065 187 1683 12663 133
EL 317 3025 105 955 18030 53
ES 1146 7589 151 3271 32162 102
FR 461 7524 61 1378 26353 52
HR 373 3411 109 1328 13897 96
IT 1154 10841 106 3290 44622 74
CY 839 3931 213 2546 13277 192
LV 1044 4367 239 2865 14624 196
LT 804 3731 216 2427 11754 206
LU 651 3288 198 1805 9994 181
HU 408 6957 59 1258 25441 49
MT 341 3570 95 1135 11965 95
NL 589 7849 75 1630 24629 66
AT 476 3867 123 1538 13250 116
PL 1482 8975 165 5093 36438 140
PT 665 4715 141 2093 16410 128
RO 392 5297 74 1271 17672 72
SI 692 8605 80 2191 27265 80
SK 284 5231 54 969 15456 63
FI 299 7661 39 733 27910 26
SE 438 5155 85 1230 15218 81
UK 1114 7012 159 3217 23251 138
Note Low earners are defined as those earning less than 50 of average hourly wages The reference group is households of employees who worked for 12 months full-time or 12 months part-time during the previous year Source EU-SILC 2013 UDB August 2015
The interaction between minimum wages income support and poverty
26
Table A3 Concentration of low earners in households
households () individuals ()
no low earners
one low earner
more
than one low earners
total no low earners
one low earner
more
than one low earners
total
BE 972 27 01 1000 967 32 01 1000
BG 924 68 08 1000 910 77 13 1000
CZ 912 83 05 1000 898 96 06 1000
DK 968 32 00 1000 959 41 01 1000
DE 872 117 11 1000 843 141 16 1000
EE 871 120 09 1000 854 134 12 1000
IE 863 124 13 1000 853 131 16 1000
EL 945 51 04 1000 940 56 04 1000
ES 897 94 09 1000 885 103 12 1000
FR 948 50 01 1000 938 61 02 1000
HR 912 79 09 1000 894 92 14 1000
IT 920 76 04 1000 913 82 05 1000
CY 809 172 19 1000 789 187 24 1000
LV 804 171 26 1000 779 186 35 1000
LT 806 176 17 1000 761 216 23 1000
LU 833 140 28 1000 798 162 41 1000
HU 952 43 05 1000 944 50 06 1000
MT 913 80 07 1000 894 96 10 1000
NL 935 62 04 1000 921 73 06 1000
AT 898 92 10 1000 864 118 18 1000
PL 875 110 15 1000 846 132 22 1000
PT 869 122 10 1000 851 136 14 1000
RO 934 56 11 1000 919 66 15 1000
SI 922 74 04 1000 908 87 05 1000
SK 939 56 05 1000 931 63 06 1000
FI 970 30 00 1000 968 32 00 1000
SE 919 78 03 1000 902 94 04 1000
UK 862 126 12 1000 839 147 14 1000
Note Low earners are defined as those earning less than 50 of average hourly wages The reference group is households of employees who worked for 12 months full-time or 12 months part-time during the previous year Source EU-SILC 2013 UDB August 2015
The interaction between minimum wages income support and poverty
27
Table A4 Distribution of individuals living in households with low earners ()
by the position of the low earner(s) in the household
single adult on low wage
households with two or more adults
total spouse (not head) on
low wage
other member
(not head) on low wage
only head on low wage
head and other
member on low wage
BE 59 472 233 199 37 1000
BG 34 380 250 227 110 1000
CZ 31 579 173 180 37 1000
DK 89 274 309 325 03 1000
DE 88 424 265 178 46 1000
EE 70 524 138 213 55 1000
IE 49 347 264 267 73 1000
EL 47 270 404 248 31 1000
ES 49 319 266 303 64 1000
FR 68 436 220 259 17 1000
HR 09 386 287 234 83 1000
IT 86 248 285 328 53 1000
CY 27 298 351 252 72 1000
LV 63 287 222 294 134 1000
LT 55 432 123 314 76 1000
LU 72 332 184 252 160 1000
HU 30 369 178 366 57 1000
MT 45 257 415 249 33 1000
NL 80 381 372 160 08 1000
AT 61 328 382 199 31 1000
PL 16 292 310 296 86 1000
PT 31 406 200 304 59 1000
RO 12 378 257 205 149 1000
SI 39 480 197 242 41 1000
SK 21 426 239 249 65 1000
FI 126 373 146 348 06 1000
SE 97 514 139 215 35 1000
UK 79 390 186 283 63 1000
Note Low earners are defined as those earning less than 50 of average hourly wages The reference group is households of employees who worked for 12 months full-time or 12 months part-time during the previous year
Source EU-SILC 2013 UDB August 2015
The interaction between minimum wages income support and poverty
28
Table A5 Distribution of individuals living in households with low earners ()
by work intensity
work intensity
001-049 05 051-080 081-099 10
BE 168 74 273 152 333 1000
BG 215 137 261 66 321 1000
CZ 73 94 335 60 437 1000
DK 18 175 153 160 495 1000
DE 131 96 361 197 215 1000
EE 90 152 278 102 377 1000
IE 339 111 271 95 184 1000
EL 381 169 226 58 165 1000
ES 235 156 281 104 225 1000
FR 171 103 241 128 357 1000
HR 148 222 289 61 281 1000
IT 240 158 251 122 228 1000
CY 158 104 276 85 378 1000
LV 90 172 311 61 367 1000
LT 110 125 238 51 476 1000
LU 100 116 339 148 297 1000
HU 212 116 289 92 291 1000
MT 216 139 354 134 157 1000
NL 300 66 359 198 77 1000
AT 98 111 330 251 209 1000
PL 135 153 302 86 325 1000
PT 143 131 299 54 372 1000
RO 108 168 379 56 289 1000
SI 63 151 238 74 473 1000
SK 80 151 397 106 266 1000
FI 68 156 197 158 422 1000
SE 36 74 158 220 512 1000
UK 165 88 300 164 284 1000
Note Low earners are defined as those earning less than 50 of average hourly wages The reference group is households of employees who worked for 12 months full-time or 12 months part-time during the previous year Source EU-SILC 2013 UDB August 2015
The interaction between minimum wages income support and poverty
29
Table A6 Distribution of individuals living in households with low earners ()
by household type
households with working-age head households with elderly
head total one or more
adult no
children
single adult with
children
two or more adults one
or two children
two or more adults three
or more children
BE 431 17 446 95 11 1000
BG 455 14 410 111 11 1000
CZ 584 08 356 38 14 1000
DK 460 00 335 186 18 1000
DE 549 23 366 54 08 1000
EE 510 10 383 41 56 1000
IE 395 34 480 78 12 1000
EL 609 03 336 19 33 1000
ES 499 19 421 50 11 1000
FR 443 22 431 92 12 1000
HR 393 05 495 81 27 1000
IT 514 18 380 69 20 1000
CY 496 05 435 50 15 1000
LV 497 27 387 68 21 1000
LT 409 27 459 91 14 1000
LU 344 24 475 148 09 1000
HU 475 10 417 93 05 1000
MT 397 28 528 35 12 1000
NL 551 17 359 67 05 1000
AT 393 17 500 77 13 1000
PL 423 05 472 87 14 1000
PT 380 11 573 28 09 1000
RO 363 03 562 72 00 1000
SI 369 09 522 94 06 1000
SK 514 07 433 31 15 1000
FI 528 37 306 117 12 1000
SE 315 23 505 145 12 1000
UK 421 48 398 97 37 1000
Note Low earners are defined as those earning less than 50 of average hourly wages The reference group is households of employees who worked for 12 months full-time or 12 months part-time during the previous year
Source EU-SILC 2013 UDB August 2015
The interaction between minimum wages income support and poverty
30
Table A7 At risk-of-poverty rate before and after social transfers ()
individuals living in households with low
earner(s) individuals living in all households with
head of working age
after social transfers
before social transfers
number of observations
after social transfers
before social transfers
number of observations
BE 139 388 413 142 293 12347
BG 281 465 982 189 319 10758
CZ 114 324 1688 91 223 16341
DK 168 325 477 119 233 11401
DE 194 358 3381 160 249 21428
EE 191 417 1999 172 277 12919
IE 74 460 1683 144 333 11313
EL 383 525 955 244 369 15473
ES 266 469 3271 213 369 28077
FR 243 509 1378 146 329 21871
HR 127 392 1328 183 309 12156
IT 310 477 3290 193 336 37058
CY 201 354 2546 152 271 11891
LV 216 453 2865 196 320 12681
LT 240 460 2427 202 337 10002
LU 313 593 1805 170 366 8836
HU 254 520 1258 156 377 22402
MT 173 339 1135 153 303 10554
NL 58 193 1630 111 243 20607
AT 145 380 1538 140 332 11165
PL 195 428 5093 180 337 32690
PT 199 393 2093 195 315 13916
RO 201 460 1271 233 368 15752
SI 96 466 2191 134 327 23665
SK 128 358 969 106 244 13769
FI 102 366 733 107 274 22741
SE 166 476 1230 140 266 12356
UK 166 416 3217 153 293 19220
Note Low earners are defined as those earning less than 50 of average hourly wages The reference group is households of employees who worked for 12 months full-time or 12 months part-time during the previous year Source EU-SILC 2013 UDB August 2015
The interaction between minimum wages income support and poverty
31
Table A8 At risk-of-poverty gap before and after social transfers ()
individuals living in households with low
earners individuals living in all households with
head of working age
after social transfers
before social transfers
after social transfers
before social transfers
BE 213 388 253 535
BG 341 427 372 451
CZ 148 309 247 352
DK 422 438 293 460
DE 207 410 244 446
EE 206 359 320 457
IE 219 420 246 491
EL 305 394 368 452
ES 275 403 353 509
FR 224 488 223 465
HR 264 338 324 427
IT 348 445 354 451
CY 222 435 216 381
LV 270 330 339 452
LT 237 391 304 481
LU 186 348 216 439
HU 216 421 255 457
MT 216 413 230 500
NL 151 328 228 492
AT 280 334 295 476
PL 222 331 276 431
PT 244 345 341 412
RO 315 360 377 445
SI 148 346 250 435
SK 214 337 304 409
FI 143 257 230 459
SE 283 410 288 444
UK 225 440 249 461
Note Low earners are defined as those earning less than 50 of average hourly wages The reference group is households of employees who worked for 12 months full-time or 12 months part-time during the previous year Source EU-SILC 2013 UDB August 2015
The interaction between minimum wages income support and poverty
32
Table A9 At-risk-of-poverty rate of households with low earners () by the
position of the low earner in the household
at-risk-of-poverty rate () number of observations
head on low wage
spouse (not
head) on
low wage
other member
(not head) on low wage
total head on low wage
spouse (not
head) on
low wage
other member
(not head) on low wage
total
BE 177 166 34 139 122 195 96 413
BG 471 178 166 283 361 370 244 976
CZ 139 82 188 114 419 977 292 1688
DK 413 05 00 174 192 126 142 460
DE 403 119 72 195 1044 1422 889 3355
EE 259 133 194 184 655 1018 268 1941
IE 108 65 36 74 655 585 443 1683
EL 534 310 299 378 309 256 383 948
ES 345 206 221 268 1341 1029 858 3228
FR 360 179 188 243 467 593 299 1360
HR 230 82 71 127 434 513 382 1328
IT 448 231 152 310 1529 814 938 3281
CY 343 210 52 201 892 759 895 2546
LV 235 165 240 216 1368 800 620 2787
LT 305 184 220 242 1059 1029 292 2379
LU 400 252 191 313 874 597 326 1798
HU 358 192 119 254 570 464 225 1258
MT 343 101 85 173 372 292 472 1135
NL 144 42 19 59 395 605 597 1598
AT 299 79 80 143 445 503 585 1533
PL 298 175 108 203 1906 1399 1486 4791
PT 247 161 179 199 814 839 414 2067
RO 239 156 216 201 465 480 326 1271
SI 148 61 96 96 701 1042 428 2171
SK 238 87 47 128 324 413 232 969
FI 170 56 00 103 350 272 107 728
SE 305 74 136 163 419 622 168 1209
UK 199 153 117 166 1359 1249 596 3204
Note Low earners are defined as those earning less than 50 of average hourly wages The
reference group is households of employees who worked for 12 months full-time or 12 months part-time during the previous year
Source EU-SILC 2013 UDB August 2015
The interaction between minimum wages income support and poverty
33
Table A10 At-risk-of-poverty rate of households with low earners () by
work intensity
at risk-of-poverty rate () number of observations
0-049 05-099 1 total 0-049 05-099 1 total
BE 383 72 46 139 100 175 137 413
BG 603 111 104 282 344 320 313 977
CZ 331 88 57 115 281 664 735 1681
DK 556 21 114 170 91 147 233 471
DE 345 132 199 194 764 1885 727 3377
EE 437 97 138 195 470 736 731 1938
IE 120 41 29 74 754 613 308 1675
EL 589 134 120 382 524 271 158 953
ES 402 188 163 266 1277 1256 734 3266
FR 462 190 131 243 378 507 492 1377
HR 288 33 32 127 491 464 373 1328
IT 517 172 173 310 1306 1218 742 3266
CY 369 93 188 201 664 917 960 2541
LV 457 148 119 218 742 1051 1040 2833
LT 551 236 93 242 563 696 1143 2403
LU 600 293 135 313 391 872 535 1798
HU 562 109 96 254 413 479 367 1258
MT 373 60 66 172 403 553 178 1134
NL 105 35 00 58 592 908 125 1625
AT 330 89 115 145 322 894 322 1537
PL 381 143 94 196 1462 1972 1650 5084
PT 453 114 96 200 571 737 775 2083
RO 421 172 37 201 351 553 367 1271
SI 270 63 39 96 469 685 1037 2191
SK 269 80 97 128 223 485 257 965
FI 154 94 81 102 164 260 309 733
SE 421 105 159 167 135 461 626 1222
UK 383 122 57 169 789 1447 888 3124 Note Low earners are defined as those earning less than 50 of average hourly wages The reference group is households of employees who worked for 12 months full-time or 12 months part-time during the previous year Source EU-SILC 2013 UDB August 2015
The interaction between minimum wages income support and poverty
34
Table A11 At-risk-of-poverty rate of households with low earners () by
number of children
at risk-of-poverty rate () number of observations in dataset
without children
with children
total without children
with children
total
BE 100 171 139 178 230 413
BG 185 367 281 446 525 982
CZ 121 108 114 987 678 1688
DK 98 235 168 220 249 477
DE 211 173 194 1854 1499 3380
EE 157 250 191 1019 868 1998
IE 60 85 74 665 997 1683
EL 333 490 383 582 342 955
ES 191 346 266 1632 1602 3270
FR 133 338 243 610 752 1378
HR 120 138 127 521 771 1328
IT 267 367 310 1682 1535 3281
CY 237 168 201 1262 1247 2546
LV 159 283 216 1424 1380 2865
LT 153 307 240 993 1400 2427
LU 223 361 313 614 1168 1798
HU 247 263 254 598 654 1258
MT 79 238 173 451 671 1135
NL 25 94 58 893 723 1625
AT 105 174 145 605 914 1538
PL 121 254 195 2152 2872 5093
PT 133 243 199 794 1281 2093
RO 105 256 201 461 810 1271
SI 98 96 96 809 1369 2191
SK 127 133 128 498 457 969
FI 75 136 102 387 337 733
SE 189 155 166 388 828 1230
UK 132 199 166 1354 1741 3213
Note Low earners are defined as those earning less than 50 of average hourly wages The reference group is households of employees who worked for 12 months full-time or 12 months part-time during the previous year Source EU-SILC 2013 UDB August 2015
The interaction between minimum wages income support and poverty
35
Table A12 Share of social benefits in total income of households with low
earners
old-age pensions
family benefits
unemployment
benefits
housing benefits
social assistance
other benefits
total social benefits
BE 3 6 4 0 0 3 15
BG 10 2 2 0 0 3 18
CZ 7 1 0 0 0 6 15
DK 1 2 5 0 0 5 14
DE 3 5 2 1 0 1 12
EE 10 3 0 0 0 5 19
IE 3 8 8 0 0 3 23
EL 14 1 1 0 0 1 16
ES 8 0 9 0 1 3 21
FR 9 4 5 2 1 1 22
HR 8 5 1 0 0 6 20
IT 8 2 5 0 0 2 17
CY 10 2 4 0 0 3 19
LV 11 2 1 0 0 4 18
LT 6 5 1 0 1 6 19
LU 5 9 2 1 1 2 21
HU 9 7 1 0 0 3 19
MT 5 3 0 0 2 2 12
NL 2 1 1 1 1 2 8
AT 4 6 2 0 0 2 14
PL 12 2 1 0 0 3 17
PT 9 2 3 0 0 2 16
RO 11 4 0 0 0 3 18
SI 3 14 1 0 1 8 27
SK 11 3 0 0 0 5 20
FI 3 4 3 1 0 3 13
SE 2 11 2 0 0 7 23
UK 6 5 1 1 1 2 16
Note Other benefits include sickness disability and education-related benefits Low earners are defined as those earning less than 50 of average hourly wages The reference group is households of employees who worked for 12 months full-time or 12 months part-time during the previous year Source EU-SILC 2013 UDB August 2015
The interaction between minimum wages income support and poverty
36
Table A13 National minimum wages vs 50 of average earnings 2014
average hourly
earnings (euro)
average monthly
earnings (euro)
50 of average
monthly earnings (euro)
national monthly
minimum wage (euro)
required increase
()
BE 1954 3480 1740 1502 16
BG 237 417 208 174 20
CZ 537 987 494 329 50
DK 2622 4524 2262
DE 1756 3506 1753
EE 592 1070 535 355 51
IE 2227 3854 1927 1462 32
EL 846 1457 729 684 7
ES 1079 1925 963 753 28
FR 1531 2511 1256 1445 -13
HR 506 908 454 406 12
IT 1370 2255 1128
CY 1155 2032 1016
LV 494 897 448 320 40
LT 407 716 358 290 24
LU 2687 4918 2459 1921 28
HU 317 562 281 328 -14
MT 960 1744 872 718 21
NL 2221 3964 1982 1490 33
AT 1900 3546 1773
PL 477 858 429 404 6
PT 742 1333 666 566 18
RO 230 414 207 198 5
SI 957 1688 844 789 7
SK 485 869 435 352 23
FI 2080 3620 1810
SE 2512 3596 1798
UK 1771 2766 1383 1303 6
Note The reference group is households of employees who worked for 12 months full-time or 12 months part-time during the previous year Source EUROMOD version G275+ running on EU-SILC 2012 data uprated to 2014 (except for France and Luxembourg EU-SILC 2010 data uprated to 2014) Figures on current monthly minimum wages (in 2014) from Eurostat
The interaction between minimum wages income support and poverty
37
Table A14 Distribution of workers affected by the increase in minimum wages
to 50 of average hourly earnings by level of increase ()
total
affected
increase in earnings to 50 of average earnings not affected
lt10 1001-20 2001-30 gt30
BE 40 16 04 05 16 960
BG 104 42 46 04 11 896
CZ 85 31 20 12 22 915
DK 61 10 10 09 31 939
DE 167 35 21 17 94 833
EE 176 36 41 31 68 824
IE 178 57 45 28 48 822
EL 116 35 23 20 38 884
ES 96 29 18 11 38 904
FR 77 15 10 06 47 923
HR 93 32 28 12 21 907
IT 113 18 15 10 70 887
CY 210 45 30 26 109 790
LV 220 46 52 38 83 780
LT 209 40 36 31 103 791
LU 183 57 48 34 44 817
HU 90 36 33 09 12 910
MT 93 34 25 07 27 907
NL 83 24 16 11 33 917
AT 131 28 16 13 73 869
PL 153 46 33 22 53 847
PT 173 50 48 22 53 827
RO 93 29 16 12 36 907
SI 86 28 12 05 41 914
SK 62 20 14 08 19 938
FI 42 16 08 06 13 958
SE 121 18 12 09 81 879
UK 188 60 43 19 66 812
Note The reference group is households of employees who worked for 12 months full-time or 12 months part-time during the previous year Source EUROMOD version G275+ running on EU-SILC 2012 data uprated to 2014 (except for France and Luxembourg EU-SILC 2010 data uprated to 2014) Figures on current monthly minimum wages (in 2014) from Eurostat
The interaction between minimum wages income support and poverty
38
Table A15 Poverty risk in households of low earners 2014
total earners
(1) low earners
(2)
of which in
poor households (3)
poverty rate of
low earners (4) = (3) (2)
low earners in poor households
as of all earners
(4) = (3) (1)
BE 3353261 134026 17970 134 05
BG 2362137 244588 63961 262 27
CZ 3331428 282085 29516 105 09
DK 1749226 106300 25224 237 14
DE 30271881 5068452 793234 157 26
EE 427162 75190 17895 238 42
IE 1164123 207729 17405 84 15
EL 2084532 242333 72889 301 35
ES 12258632 1177421 309078 263 25
FR 19911322 1535080 234136 153 12
HR 1063434 98966 12125 123 11
IT 15503093 1749434 488952 279 32
CY 284162 59795 10793 180 38
LV 628621 138371 27466 198 44
LT 928391 194150 37148 191 40
LU 184141 33673 6327 188 34
HU 2775484 250535 45132 180 16
MT 129372 12027 2446 203 19
NL 5544901 462701 60572 131 11
AT 2596626 341187 63808 187 25
PL 10166671 1558698 280035 180 28
PT 3303603 571146 80247 141 24
RO 6214151 580179 99679 172 16
SI 647095 55639 7210 130 11
SK 1807568 111931 21873 195 12
FI 1514848 63844 6723 105 04
SE 3232371 390717 64719 166 20
UK 22093617 4156506 633675 152 29
EU-28
155531853 19902703 3530237 177 23
Note Low earners are those earning less than 50 of average hourly wages The reference group is households of employees who worked for 12 months full-time or 12 months part-time during
the previous year The poverty threshold is at 60 of national household disposable equivalised income The poverty rate is the share of population (or population group) below that threshold Source EUROMOD version G275+ running on EU-SILC 2012 data uprated to 2014 (except for France and Luxembourg EU-SILC 2010 data uprated to 2014) Figures on current monthly minimum wages (in 2014) from Eurostat
The interaction between minimum wages income support and poverty
39
Table A16 Effects of a minimum wage at 50 of average hourly wages on at-
risk-of-poverty rates by gender 2014
change in at-risk-of-poverty rates
total men women
BE -08 -08 -08
BG 00 00 00
CZ -12 -11 -13
DK -06 -08 -04
DE -10 -09 -11
EE -18 -16 -19
IE -06 -06 -07
EL -11 -10 -11
ES -09 -08 -10
FR -11 -10 -11
HR -04 -04 -05
IT -08 -07 -08
CY -19 -14 -24
LV -03 -04 -03
LT -10 -10 -10
LU -16 -16 -16
HU -12 -12 -11
MT -18 -20 -17
NL -07 -09 -06
AT -22 -22 -22
PL 00 00 00
PT -13 -13 -12
RO -04 -04 -04
SI 00 00 00
SK 00 00 00
FI -02 -02 -03
SE -12 -11 -14
UK -06 -06 -05
Note The change in poverty rates is the percentage point difference before and after the introduction of a minimum wage at 50 of average hourly earnings The poverty rate is the share of population (or population group) below that threshold The poverty threshold is at 60 of national household disposable equivalised income The reference group is households of employees who worked for 12 months full-time or 12 months part-time during the previous year
Source EUROMOD version G275+ running on EU-SILC 2012 data uprated to 2014 (except for France and Luxembourg EU-SILC 2010 data uprated to 2014) Figures on current monthly
minimum wages (in 2014) from Eurostat
The interaction between minimum wages income support and poverty
40
Table A17 Effects of a minimum wage at 50 of average hourly wages on at-
risk-of-poverty rates by age 2014
change in at-risk-of-poverty rates
aged lt18 aged 18-29 aged 30-44 aged 45-64 aged 65+
BE -10 -19 -08 -04 00
BG 00 00 00 00 00
CZ -14 -17 -11 -14 -03
DK -02 -31 -01 -04 00
DE -08 -25 -09 -09 -03
EE -20 -20 -16 -25 -04
IE -05 -20 -02 -06 00
EL -12 -27 -10 -10 00
ES -10 -12 -10 -10 -01
FR -18 -17 -12 -06 -01
HR -05 -07 -04 -05 -01
IT -10 -13 -10 -07 00
CY -10 -23 -23 -13 -32
LV -07 -05 -13 -03 00
LT -13 -12 -11 -11 -03
LU -26 -21 -18 -12 -03
HU -14 -18 -12 -12 -01
MT -26 -23 -20 -16 -05
NL -12 -17 -05 -04 00
AT -34 -38 -28 -13 -02
PL 00 00 00 00 00
PT -15 -23 -11 -15 -01
RO -05 -05 -04 -04 -02
SI 00 00 00 00 00
SK 00 00 00 00 00
FI -02 -04 -02 -03 -01
SE -15 -25 -14 -07 -04
UK -06 -09 -07 -06 -01
Note The change in poverty rates is the percentage point difference before and after the introduction of a minimum wage at 50 of average hourly earnings The poverty rate is the share of population (or population group) below that threshold The poverty threshold is at 60 of national household disposable equivalised income The reference group is households of employees who worked for 12 months full-time or 12 months part-time during the previous year
Source EUROMOD version G275+ running on EU-SILC 2012 data uprated to 2014 (except for France and Luxembourg EU-SILC 2010 data uprated to 2014) Figures on current monthly
minimum wages (in 2014) from Eurostat
The interaction between minimum wages income support and poverty
41
Table A18 Effects of a minimum wage at 50 of average hourly wages on
inequality 2014
change in inequality
Gini coefficient income quintile share ratio
(S80S20)
BE -02 -004
BG 00 000
CZ -04 -008
DK -03 -009
DE -04 -006
EE -06 -014
IE -02 -003
EL -04 -016
ES -05 -024
FR -05 -006
HR -01 -002
IT -01 -002
CY -07 -014
LV -02 -007
LT -05 -009
LU -05 -007
HU -06 -012
MT -05 -010
NL -02 -004
AT -07 -012
PL 00 000
PT -09 -018
RO -02 -005
SI 00 000
SK 00 000
FI -01 -002
SE -06 -007
UK -03 -006
Note The change in inequality is the difference in the index concerned before and after the introduction of a minimum wage at 50 of average hourly earnings The Gini coefficient ranges from 0 to 100 where 0 represents perfect equality in a given country and 100 represents the maximum level of inequality The income quintile share ratio (S80S20) is the ratio of the total income received by the 20 of the countryrsquos population with the highest disposable income (top
quintile) to that received by the 20 of the countryrsquos population with the lowest disposable income (bottom quintile) The reference group is households of employees who worked for 12 months full-time or 12 months part-time during the previous year Source EUROMOD version G275+ running on EU-SILC 2012 data uprated to 2014 (except for France and Luxembourg EU-SILC 2010 data uprated to 2014) Figures on current monthly minimum wages (in 2014) from Eurostat
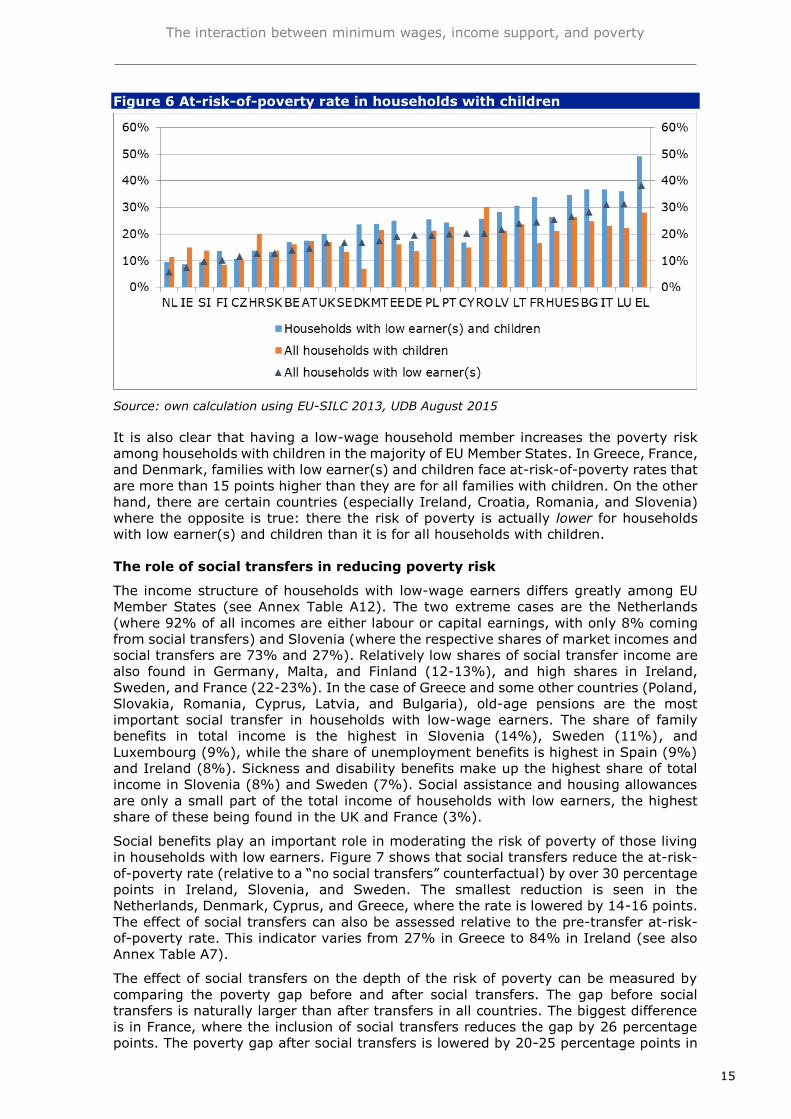
The interaction between minimum wages income support and poverty
22
Our analysis is limited to households of employees who worked for 12 months full-time
or 12 months part-time during the previous year This inevitably excludes several
employees working intermittently18 (ie less than 12 months over the previous year)
or those switching from part-time to full-time work or vice versa While the latter
category might benefit from the increase in minimum wages simulated here the former
would probably benefit less
More generally minimum wage increases would do little directly to improve the living
standards of the self-employed including ldquothe so-called lsquobogus self-employedrsquo who do
similar work to regular employees but whose contracts are not protected by the same
safeguards and regulationsrdquo (OECD 2015b) Nor would minimum wage increases raise
the earnings of informal workers except possibly in the context of the lsquolighthouse
effectrsquo19
Nevertheless setting the minimum wage at 50 of national average hourly wages EU-
wide can also be supported on grounds other than poverty reduction In particular a
higher minimum wage will by definition reduce earnings inequality at individual level
(while as shown earlier in most countries it would also reduce income inequality at
household level) Also setting a wage floor may address considerations of fairness and
counterbalance the monopsony power of some employers Moreover the minimum
wage may act as a lsquobeneficial constraintrsquo increasing the value of the job for both workers
and employers limiting costly turnover providing incentives for training and altogether
raising productivity
Finally while the minimum wage may be a blunt instrument for poverty reduction on its
own better coordination with other tax-benefit policies may significantly increase its
overall effect For instance a broader targeting of means-tested assistance and a lower
tax wedge will make work pay more even when pay is low enhancing the extent to
which minimum wage increases can improve take-home pay In-work benefits20 have
often proved effective in this respect Conversely the case for minimum wages becomes
stronger in the presence of in-work benefits as the former prevent the latter from being
captured by employers rather than by their intended beneficiaries
18 Note that employees working intermittently were included if they lived in a household with a member who worked for 12 months full-time or 12 months part-time during the previous year 19 A lsquolighthouse effectrsquo is said to be observed when employers and workers in the informal sector (where minimum wages are not legally enforced) set pay by reference to the level of the minimum wage in the formal sector When this is the case wages in the informal sector will move in line with minimum wages in the formal sector In contrast under the standard model workers
displaced from the formal sector after the introduction or increase of a minimum wage will seek employment in the informal sector causing wages there to fall For a recent analysis see Boeri et al (2011) 20 The Earned Income Tax Credit in the US and the Working Tax Credit in the UK are the best known such schemes For a formal analysis of in-work benefits in an optimal tax design setting see Brewer et al (2010) For a comprehensive review of schemes in a variety of countries see
Immervoll amp Pearson (2009)
The interaction between minimum wages income support and poverty
23
References
Boeri T amp van Ours J (2013) The economics of imperfect labor markets (2nd edition)
Princeton NJ Princeton University Press
Boeri T Garibaldi P amp Ribeiro M (2011) The lighthouse effect and beyond Review of
Income and Wealth 57 S54-S78
Brewer M Saez E amp Shephard A (2010) Means testing and tax rates on earnings In
Dimensions of tax design the Mirrlees Review Oxford Oxford University Press
Cantillon B (2011) The paradox of the social investment state growth employment
and poverty in the Lisbon era Journal of European Social Policy 21 (5) 432-449
Cantillon B Collado D amp Van Mechelen N (2015) The end of decent social protection
for the poor The dynamics of low wages minimum income packages and median
household incomes ImPRovE Working Paper No 1503 University of Antwerp
Card D amp Krueger A (1994) Minimum wages and employment a case study of the fast-
food industry in New Jersey and Pennsylvania American Economic Review 48 (4) 772-
793
Card D amp Krueger A (1995) Myth and measurement the new economics of the
minimum wage Princeton NJ Princeton University Press
Doucouliagos H amp Stanley TD (2009) Publication selection bias in minimum-wage
research A meta-regression analysis British Journal of Industrial Relations 47 (2) 406-
428
Dube A (2013) Minimum wages and the distribution of family incomes (mimeo)
Dube A Lester W amp Reich M (2010) Minimum wage effects across state borders
Estimates using contiguous counties Review of Economics and Statistics 92 (4) 945-
964
Gaacutebos A Branyiczki R Lange B amp Toacuteth IG (2015) Employment and poverty dynamics
in the EU countries before during and after the crisis ImPRovE Working Paper 1506
University of Antwerp
Immervoll H amp Pearson M (2009) A good time for making work pay Taking stock of
in-work benefits and related measures across the OECD Social Employment and
Migration Working Paper 81 Paris Organisation for Economic Co-operation and
Development
Maicirctre B Nolan B amp Whelan CT (2012) Low pay in-work poverty and economic
vulnerability a comparative analysis using EU-SILC Manchester School 80 (1) 99-116
Neumark D amp Wascher W (2008) Minimum wages Cambridge MA The MIT Press
OECD (2011) Divided We Stand Why inequality keeps rising Paris Organisation for
Economic Co-operation and Development
OECD (2015a) Employment Outlook Paris Organisation for Economic Co-operation and
Development
OECD (2015b) Minimum wages after the crisis making them pay Paris Organisation
for Economic Co-operation and Development
Oumlzdemir E amp Ward T (2015) The characteristics of workers on low wages Social
Situation Monitor Research Note 92015 Brussels European Commission
Schmitt J (2013) Why does the minimum wage have no discernible effect on
employment Washington DC Center for Economic and Policy Research
Ward T amp Oumlzdemir E (2009) Measuring work intensity Social Situation Monitor
Research Note 92009 Brussels European Commission
Wolfson P amp Belman D (2014) What does the minimum wage do Kalamazoo MI
Upjohn Institute for Employment Research
The interaction between minimum wages income support and poverty
24
Annex
Table A1 Percentage of full-year employees among all employees
full-year employees
(either full-time or part-time)
employees with spells of self-
employment or employment
change during the year
employees with
spells of inactivity during the year
low-wage non-low wage
BE 28 816 71 85 1000
BG 67 823 06 103 1000
CZ 83 811 34 72 1000
DK 35 844 16 105 1000
DE 123 740 79 60 1000
EE 124 643 113 120 1000
IE 153 666 61 120 1000
EL 88 760 53 99 1000
ES 126 712 50 113 1000
FR 51 793 76 80 1000
HR 97 791 23 90 1000
IT 93 779 66 61 1000
CY 181 666 39 115 1000
LV 201 644 58 97 1000
LT 190 691 17 103 1000
LU 169 688 70 73 1000
HU 47 770 72 111 1000
MT 81 778 85 56 1000
NL 68 831 20 81 1000
AT 92 714 69 126 1000
PL 139 703 76 82 1000
PT 126 768 49 58 1000
RO 71 888 28 13 1000
SI 73 831 45 52 1000
SK 49 850 42 58 1000
FI 31 756 33 180 1000
SE 75 803 41 81 1000
UK 136 719 99 46 1000
Source EU-SILC 2013 UDB August 2015
The interaction between minimum wages income support and poverty
25
Table A2 Number of low earners in the sample
number of low
earners number of all
workers
no of individuals in households
with low earners
number of individuals
BE 143 4238 34 413 14623 28
BG 293 3876 75 982 12425 79
CZ 561 6064 93 1688 19105 88
DK 171 4185 41 477 13910 34
DE 1334 9242 144 3381 26709 127
EE 709 4406 161 1999 15053 133
IE 574 3065 187 1683 12663 133
EL 317 3025 105 955 18030 53
ES 1146 7589 151 3271 32162 102
FR 461 7524 61 1378 26353 52
HR 373 3411 109 1328 13897 96
IT 1154 10841 106 3290 44622 74
CY 839 3931 213 2546 13277 192
LV 1044 4367 239 2865 14624 196
LT 804 3731 216 2427 11754 206
LU 651 3288 198 1805 9994 181
HU 408 6957 59 1258 25441 49
MT 341 3570 95 1135 11965 95
NL 589 7849 75 1630 24629 66
AT 476 3867 123 1538 13250 116
PL 1482 8975 165 5093 36438 140
PT 665 4715 141 2093 16410 128
RO 392 5297 74 1271 17672 72
SI 692 8605 80 2191 27265 80
SK 284 5231 54 969 15456 63
FI 299 7661 39 733 27910 26
SE 438 5155 85 1230 15218 81
UK 1114 7012 159 3217 23251 138
Note Low earners are defined as those earning less than 50 of average hourly wages The reference group is households of employees who worked for 12 months full-time or 12 months part-time during the previous year Source EU-SILC 2013 UDB August 2015
The interaction between minimum wages income support and poverty
26
Table A3 Concentration of low earners in households
households () individuals ()
no low earners
one low earner
more
than one low earners
total no low earners
one low earner
more
than one low earners
total
BE 972 27 01 1000 967 32 01 1000
BG 924 68 08 1000 910 77 13 1000
CZ 912 83 05 1000 898 96 06 1000
DK 968 32 00 1000 959 41 01 1000
DE 872 117 11 1000 843 141 16 1000
EE 871 120 09 1000 854 134 12 1000
IE 863 124 13 1000 853 131 16 1000
EL 945 51 04 1000 940 56 04 1000
ES 897 94 09 1000 885 103 12 1000
FR 948 50 01 1000 938 61 02 1000
HR 912 79 09 1000 894 92 14 1000
IT 920 76 04 1000 913 82 05 1000
CY 809 172 19 1000 789 187 24 1000
LV 804 171 26 1000 779 186 35 1000
LT 806 176 17 1000 761 216 23 1000
LU 833 140 28 1000 798 162 41 1000
HU 952 43 05 1000 944 50 06 1000
MT 913 80 07 1000 894 96 10 1000
NL 935 62 04 1000 921 73 06 1000
AT 898 92 10 1000 864 118 18 1000
PL 875 110 15 1000 846 132 22 1000
PT 869 122 10 1000 851 136 14 1000
RO 934 56 11 1000 919 66 15 1000
SI 922 74 04 1000 908 87 05 1000
SK 939 56 05 1000 931 63 06 1000
FI 970 30 00 1000 968 32 00 1000
SE 919 78 03 1000 902 94 04 1000
UK 862 126 12 1000 839 147 14 1000
Note Low earners are defined as those earning less than 50 of average hourly wages The reference group is households of employees who worked for 12 months full-time or 12 months part-time during the previous year Source EU-SILC 2013 UDB August 2015
The interaction between minimum wages income support and poverty
27
Table A4 Distribution of individuals living in households with low earners ()
by the position of the low earner(s) in the household
single adult on low wage
households with two or more adults
total spouse (not head) on
low wage
other member
(not head) on low wage
only head on low wage
head and other
member on low wage
BE 59 472 233 199 37 1000
BG 34 380 250 227 110 1000
CZ 31 579 173 180 37 1000
DK 89 274 309 325 03 1000
DE 88 424 265 178 46 1000
EE 70 524 138 213 55 1000
IE 49 347 264 267 73 1000
EL 47 270 404 248 31 1000
ES 49 319 266 303 64 1000
FR 68 436 220 259 17 1000
HR 09 386 287 234 83 1000
IT 86 248 285 328 53 1000
CY 27 298 351 252 72 1000
LV 63 287 222 294 134 1000
LT 55 432 123 314 76 1000
LU 72 332 184 252 160 1000
HU 30 369 178 366 57 1000
MT 45 257 415 249 33 1000
NL 80 381 372 160 08 1000
AT 61 328 382 199 31 1000
PL 16 292 310 296 86 1000
PT 31 406 200 304 59 1000
RO 12 378 257 205 149 1000
SI 39 480 197 242 41 1000
SK 21 426 239 249 65 1000
FI 126 373 146 348 06 1000
SE 97 514 139 215 35 1000
UK 79 390 186 283 63 1000
Note Low earners are defined as those earning less than 50 of average hourly wages The reference group is households of employees who worked for 12 months full-time or 12 months part-time during the previous year
Source EU-SILC 2013 UDB August 2015
The interaction between minimum wages income support and poverty
28
Table A5 Distribution of individuals living in households with low earners ()
by work intensity
work intensity
001-049 05 051-080 081-099 10
BE 168 74 273 152 333 1000
BG 215 137 261 66 321 1000
CZ 73 94 335 60 437 1000
DK 18 175 153 160 495 1000
DE 131 96 361 197 215 1000
EE 90 152 278 102 377 1000
IE 339 111 271 95 184 1000
EL 381 169 226 58 165 1000
ES 235 156 281 104 225 1000
FR 171 103 241 128 357 1000
HR 148 222 289 61 281 1000
IT 240 158 251 122 228 1000
CY 158 104 276 85 378 1000
LV 90 172 311 61 367 1000
LT 110 125 238 51 476 1000
LU 100 116 339 148 297 1000
HU 212 116 289 92 291 1000
MT 216 139 354 134 157 1000
NL 300 66 359 198 77 1000
AT 98 111 330 251 209 1000
PL 135 153 302 86 325 1000
PT 143 131 299 54 372 1000
RO 108 168 379 56 289 1000
SI 63 151 238 74 473 1000
SK 80 151 397 106 266 1000
FI 68 156 197 158 422 1000
SE 36 74 158 220 512 1000
UK 165 88 300 164 284 1000
Note Low earners are defined as those earning less than 50 of average hourly wages The reference group is households of employees who worked for 12 months full-time or 12 months part-time during the previous year Source EU-SILC 2013 UDB August 2015
The interaction between minimum wages income support and poverty
29
Table A6 Distribution of individuals living in households with low earners ()
by household type
households with working-age head households with elderly
head total one or more
adult no
children
single adult with
children
two or more adults one
or two children
two or more adults three
or more children
BE 431 17 446 95 11 1000
BG 455 14 410 111 11 1000
CZ 584 08 356 38 14 1000
DK 460 00 335 186 18 1000
DE 549 23 366 54 08 1000
EE 510 10 383 41 56 1000
IE 395 34 480 78 12 1000
EL 609 03 336 19 33 1000
ES 499 19 421 50 11 1000
FR 443 22 431 92 12 1000
HR 393 05 495 81 27 1000
IT 514 18 380 69 20 1000
CY 496 05 435 50 15 1000
LV 497 27 387 68 21 1000
LT 409 27 459 91 14 1000
LU 344 24 475 148 09 1000
HU 475 10 417 93 05 1000
MT 397 28 528 35 12 1000
NL 551 17 359 67 05 1000
AT 393 17 500 77 13 1000
PL 423 05 472 87 14 1000
PT 380 11 573 28 09 1000
RO 363 03 562 72 00 1000
SI 369 09 522 94 06 1000
SK 514 07 433 31 15 1000
FI 528 37 306 117 12 1000
SE 315 23 505 145 12 1000
UK 421 48 398 97 37 1000
Note Low earners are defined as those earning less than 50 of average hourly wages The reference group is households of employees who worked for 12 months full-time or 12 months part-time during the previous year
Source EU-SILC 2013 UDB August 2015
The interaction between minimum wages income support and poverty
30
Table A7 At risk-of-poverty rate before and after social transfers ()
individuals living in households with low
earner(s) individuals living in all households with
head of working age
after social transfers
before social transfers
number of observations
after social transfers
before social transfers
number of observations
BE 139 388 413 142 293 12347
BG 281 465 982 189 319 10758
CZ 114 324 1688 91 223 16341
DK 168 325 477 119 233 11401
DE 194 358 3381 160 249 21428
EE 191 417 1999 172 277 12919
IE 74 460 1683 144 333 11313
EL 383 525 955 244 369 15473
ES 266 469 3271 213 369 28077
FR 243 509 1378 146 329 21871
HR 127 392 1328 183 309 12156
IT 310 477 3290 193 336 37058
CY 201 354 2546 152 271 11891
LV 216 453 2865 196 320 12681
LT 240 460 2427 202 337 10002
LU 313 593 1805 170 366 8836
HU 254 520 1258 156 377 22402
MT 173 339 1135 153 303 10554
NL 58 193 1630 111 243 20607
AT 145 380 1538 140 332 11165
PL 195 428 5093 180 337 32690
PT 199 393 2093 195 315 13916
RO 201 460 1271 233 368 15752
SI 96 466 2191 134 327 23665
SK 128 358 969 106 244 13769
FI 102 366 733 107 274 22741
SE 166 476 1230 140 266 12356
UK 166 416 3217 153 293 19220
Note Low earners are defined as those earning less than 50 of average hourly wages The reference group is households of employees who worked for 12 months full-time or 12 months part-time during the previous year Source EU-SILC 2013 UDB August 2015
The interaction between minimum wages income support and poverty
31
Table A8 At risk-of-poverty gap before and after social transfers ()
individuals living in households with low
earners individuals living in all households with
head of working age
after social transfers
before social transfers
after social transfers
before social transfers
BE 213 388 253 535
BG 341 427 372 451
CZ 148 309 247 352
DK 422 438 293 460
DE 207 410 244 446
EE 206 359 320 457
IE 219 420 246 491
EL 305 394 368 452
ES 275 403 353 509
FR 224 488 223 465
HR 264 338 324 427
IT 348 445 354 451
CY 222 435 216 381
LV 270 330 339 452
LT 237 391 304 481
LU 186 348 216 439
HU 216 421 255 457
MT 216 413 230 500
NL 151 328 228 492
AT 280 334 295 476
PL 222 331 276 431
PT 244 345 341 412
RO 315 360 377 445
SI 148 346 250 435
SK 214 337 304 409
FI 143 257 230 459
SE 283 410 288 444
UK 225 440 249 461
Note Low earners are defined as those earning less than 50 of average hourly wages The reference group is households of employees who worked for 12 months full-time or 12 months part-time during the previous year Source EU-SILC 2013 UDB August 2015
The interaction between minimum wages income support and poverty
32
Table A9 At-risk-of-poverty rate of households with low earners () by the
position of the low earner in the household
at-risk-of-poverty rate () number of observations
head on low wage
spouse (not
head) on
low wage
other member
(not head) on low wage
total head on low wage
spouse (not
head) on
low wage
other member
(not head) on low wage
total
BE 177 166 34 139 122 195 96 413
BG 471 178 166 283 361 370 244 976
CZ 139 82 188 114 419 977 292 1688
DK 413 05 00 174 192 126 142 460
DE 403 119 72 195 1044 1422 889 3355
EE 259 133 194 184 655 1018 268 1941
IE 108 65 36 74 655 585 443 1683
EL 534 310 299 378 309 256 383 948
ES 345 206 221 268 1341 1029 858 3228
FR 360 179 188 243 467 593 299 1360
HR 230 82 71 127 434 513 382 1328
IT 448 231 152 310 1529 814 938 3281
CY 343 210 52 201 892 759 895 2546
LV 235 165 240 216 1368 800 620 2787
LT 305 184 220 242 1059 1029 292 2379
LU 400 252 191 313 874 597 326 1798
HU 358 192 119 254 570 464 225 1258
MT 343 101 85 173 372 292 472 1135
NL 144 42 19 59 395 605 597 1598
AT 299 79 80 143 445 503 585 1533
PL 298 175 108 203 1906 1399 1486 4791
PT 247 161 179 199 814 839 414 2067
RO 239 156 216 201 465 480 326 1271
SI 148 61 96 96 701 1042 428 2171
SK 238 87 47 128 324 413 232 969
FI 170 56 00 103 350 272 107 728
SE 305 74 136 163 419 622 168 1209
UK 199 153 117 166 1359 1249 596 3204
Note Low earners are defined as those earning less than 50 of average hourly wages The
reference group is households of employees who worked for 12 months full-time or 12 months part-time during the previous year
Source EU-SILC 2013 UDB August 2015
The interaction between minimum wages income support and poverty
33
Table A10 At-risk-of-poverty rate of households with low earners () by
work intensity
at risk-of-poverty rate () number of observations
0-049 05-099 1 total 0-049 05-099 1 total
BE 383 72 46 139 100 175 137 413
BG 603 111 104 282 344 320 313 977
CZ 331 88 57 115 281 664 735 1681
DK 556 21 114 170 91 147 233 471
DE 345 132 199 194 764 1885 727 3377
EE 437 97 138 195 470 736 731 1938
IE 120 41 29 74 754 613 308 1675
EL 589 134 120 382 524 271 158 953
ES 402 188 163 266 1277 1256 734 3266
FR 462 190 131 243 378 507 492 1377
HR 288 33 32 127 491 464 373 1328
IT 517 172 173 310 1306 1218 742 3266
CY 369 93 188 201 664 917 960 2541
LV 457 148 119 218 742 1051 1040 2833
LT 551 236 93 242 563 696 1143 2403
LU 600 293 135 313 391 872 535 1798
HU 562 109 96 254 413 479 367 1258
MT 373 60 66 172 403 553 178 1134
NL 105 35 00 58 592 908 125 1625
AT 330 89 115 145 322 894 322 1537
PL 381 143 94 196 1462 1972 1650 5084
PT 453 114 96 200 571 737 775 2083
RO 421 172 37 201 351 553 367 1271
SI 270 63 39 96 469 685 1037 2191
SK 269 80 97 128 223 485 257 965
FI 154 94 81 102 164 260 309 733
SE 421 105 159 167 135 461 626 1222
UK 383 122 57 169 789 1447 888 3124 Note Low earners are defined as those earning less than 50 of average hourly wages The reference group is households of employees who worked for 12 months full-time or 12 months part-time during the previous year Source EU-SILC 2013 UDB August 2015
The interaction between minimum wages income support and poverty
34
Table A11 At-risk-of-poverty rate of households with low earners () by
number of children
at risk-of-poverty rate () number of observations in dataset
without children
with children
total without children
with children
total
BE 100 171 139 178 230 413
BG 185 367 281 446 525 982
CZ 121 108 114 987 678 1688
DK 98 235 168 220 249 477
DE 211 173 194 1854 1499 3380
EE 157 250 191 1019 868 1998
IE 60 85 74 665 997 1683
EL 333 490 383 582 342 955
ES 191 346 266 1632 1602 3270
FR 133 338 243 610 752 1378
HR 120 138 127 521 771 1328
IT 267 367 310 1682 1535 3281
CY 237 168 201 1262 1247 2546
LV 159 283 216 1424 1380 2865
LT 153 307 240 993 1400 2427
LU 223 361 313 614 1168 1798
HU 247 263 254 598 654 1258
MT 79 238 173 451 671 1135
NL 25 94 58 893 723 1625
AT 105 174 145 605 914 1538
PL 121 254 195 2152 2872 5093
PT 133 243 199 794 1281 2093
RO 105 256 201 461 810 1271
SI 98 96 96 809 1369 2191
SK 127 133 128 498 457 969
FI 75 136 102 387 337 733
SE 189 155 166 388 828 1230
UK 132 199 166 1354 1741 3213
Note Low earners are defined as those earning less than 50 of average hourly wages The reference group is households of employees who worked for 12 months full-time or 12 months part-time during the previous year Source EU-SILC 2013 UDB August 2015
The interaction between minimum wages income support and poverty
35
Table A12 Share of social benefits in total income of households with low
earners
old-age pensions
family benefits
unemployment
benefits
housing benefits
social assistance
other benefits
total social benefits
BE 3 6 4 0 0 3 15
BG 10 2 2 0 0 3 18
CZ 7 1 0 0 0 6 15
DK 1 2 5 0 0 5 14
DE 3 5 2 1 0 1 12
EE 10 3 0 0 0 5 19
IE 3 8 8 0 0 3 23
EL 14 1 1 0 0 1 16
ES 8 0 9 0 1 3 21
FR 9 4 5 2 1 1 22
HR 8 5 1 0 0 6 20
IT 8 2 5 0 0 2 17
CY 10 2 4 0 0 3 19
LV 11 2 1 0 0 4 18
LT 6 5 1 0 1 6 19
LU 5 9 2 1 1 2 21
HU 9 7 1 0 0 3 19
MT 5 3 0 0 2 2 12
NL 2 1 1 1 1 2 8
AT 4 6 2 0 0 2 14
PL 12 2 1 0 0 3 17
PT 9 2 3 0 0 2 16
RO 11 4 0 0 0 3 18
SI 3 14 1 0 1 8 27
SK 11 3 0 0 0 5 20
FI 3 4 3 1 0 3 13
SE 2 11 2 0 0 7 23
UK 6 5 1 1 1 2 16
Note Other benefits include sickness disability and education-related benefits Low earners are defined as those earning less than 50 of average hourly wages The reference group is households of employees who worked for 12 months full-time or 12 months part-time during the previous year Source EU-SILC 2013 UDB August 2015
The interaction between minimum wages income support and poverty
36
Table A13 National minimum wages vs 50 of average earnings 2014
average hourly
earnings (euro)
average monthly
earnings (euro)
50 of average
monthly earnings (euro)
national monthly
minimum wage (euro)
required increase
()
BE 1954 3480 1740 1502 16
BG 237 417 208 174 20
CZ 537 987 494 329 50
DK 2622 4524 2262
DE 1756 3506 1753
EE 592 1070 535 355 51
IE 2227 3854 1927 1462 32
EL 846 1457 729 684 7
ES 1079 1925 963 753 28
FR 1531 2511 1256 1445 -13
HR 506 908 454 406 12
IT 1370 2255 1128
CY 1155 2032 1016
LV 494 897 448 320 40
LT 407 716 358 290 24
LU 2687 4918 2459 1921 28
HU 317 562 281 328 -14
MT 960 1744 872 718 21
NL 2221 3964 1982 1490 33
AT 1900 3546 1773
PL 477 858 429 404 6
PT 742 1333 666 566 18
RO 230 414 207 198 5
SI 957 1688 844 789 7
SK 485 869 435 352 23
FI 2080 3620 1810
SE 2512 3596 1798
UK 1771 2766 1383 1303 6
Note The reference group is households of employees who worked for 12 months full-time or 12 months part-time during the previous year Source EUROMOD version G275+ running on EU-SILC 2012 data uprated to 2014 (except for France and Luxembourg EU-SILC 2010 data uprated to 2014) Figures on current monthly minimum wages (in 2014) from Eurostat
The interaction between minimum wages income support and poverty
37
Table A14 Distribution of workers affected by the increase in minimum wages
to 50 of average hourly earnings by level of increase ()
total
affected
increase in earnings to 50 of average earnings not affected
lt10 1001-20 2001-30 gt30
BE 40 16 04 05 16 960
BG 104 42 46 04 11 896
CZ 85 31 20 12 22 915
DK 61 10 10 09 31 939
DE 167 35 21 17 94 833
EE 176 36 41 31 68 824
IE 178 57 45 28 48 822
EL 116 35 23 20 38 884
ES 96 29 18 11 38 904
FR 77 15 10 06 47 923
HR 93 32 28 12 21 907
IT 113 18 15 10 70 887
CY 210 45 30 26 109 790
LV 220 46 52 38 83 780
LT 209 40 36 31 103 791
LU 183 57 48 34 44 817
HU 90 36 33 09 12 910
MT 93 34 25 07 27 907
NL 83 24 16 11 33 917
AT 131 28 16 13 73 869
PL 153 46 33 22 53 847
PT 173 50 48 22 53 827
RO 93 29 16 12 36 907
SI 86 28 12 05 41 914
SK 62 20 14 08 19 938
FI 42 16 08 06 13 958
SE 121 18 12 09 81 879
UK 188 60 43 19 66 812
Note The reference group is households of employees who worked for 12 months full-time or 12 months part-time during the previous year Source EUROMOD version G275+ running on EU-SILC 2012 data uprated to 2014 (except for France and Luxembourg EU-SILC 2010 data uprated to 2014) Figures on current monthly minimum wages (in 2014) from Eurostat
The interaction between minimum wages income support and poverty
38
Table A15 Poverty risk in households of low earners 2014
total earners
(1) low earners
(2)
of which in
poor households (3)
poverty rate of
low earners (4) = (3) (2)
low earners in poor households
as of all earners
(4) = (3) (1)
BE 3353261 134026 17970 134 05
BG 2362137 244588 63961 262 27
CZ 3331428 282085 29516 105 09
DK 1749226 106300 25224 237 14
DE 30271881 5068452 793234 157 26
EE 427162 75190 17895 238 42
IE 1164123 207729 17405 84 15
EL 2084532 242333 72889 301 35
ES 12258632 1177421 309078 263 25
FR 19911322 1535080 234136 153 12
HR 1063434 98966 12125 123 11
IT 15503093 1749434 488952 279 32
CY 284162 59795 10793 180 38
LV 628621 138371 27466 198 44
LT 928391 194150 37148 191 40
LU 184141 33673 6327 188 34
HU 2775484 250535 45132 180 16
MT 129372 12027 2446 203 19
NL 5544901 462701 60572 131 11
AT 2596626 341187 63808 187 25
PL 10166671 1558698 280035 180 28
PT 3303603 571146 80247 141 24
RO 6214151 580179 99679 172 16
SI 647095 55639 7210 130 11
SK 1807568 111931 21873 195 12
FI 1514848 63844 6723 105 04
SE 3232371 390717 64719 166 20
UK 22093617 4156506 633675 152 29
EU-28
155531853 19902703 3530237 177 23
Note Low earners are those earning less than 50 of average hourly wages The reference group is households of employees who worked for 12 months full-time or 12 months part-time during
the previous year The poverty threshold is at 60 of national household disposable equivalised income The poverty rate is the share of population (or population group) below that threshold Source EUROMOD version G275+ running on EU-SILC 2012 data uprated to 2014 (except for France and Luxembourg EU-SILC 2010 data uprated to 2014) Figures on current monthly minimum wages (in 2014) from Eurostat
The interaction between minimum wages income support and poverty
39
Table A16 Effects of a minimum wage at 50 of average hourly wages on at-
risk-of-poverty rates by gender 2014
change in at-risk-of-poverty rates
total men women
BE -08 -08 -08
BG 00 00 00
CZ -12 -11 -13
DK -06 -08 -04
DE -10 -09 -11
EE -18 -16 -19
IE -06 -06 -07
EL -11 -10 -11
ES -09 -08 -10
FR -11 -10 -11
HR -04 -04 -05
IT -08 -07 -08
CY -19 -14 -24
LV -03 -04 -03
LT -10 -10 -10
LU -16 -16 -16
HU -12 -12 -11
MT -18 -20 -17
NL -07 -09 -06
AT -22 -22 -22
PL 00 00 00
PT -13 -13 -12
RO -04 -04 -04
SI 00 00 00
SK 00 00 00
FI -02 -02 -03
SE -12 -11 -14
UK -06 -06 -05
Note The change in poverty rates is the percentage point difference before and after the introduction of a minimum wage at 50 of average hourly earnings The poverty rate is the share of population (or population group) below that threshold The poverty threshold is at 60 of national household disposable equivalised income The reference group is households of employees who worked for 12 months full-time or 12 months part-time during the previous year
Source EUROMOD version G275+ running on EU-SILC 2012 data uprated to 2014 (except for France and Luxembourg EU-SILC 2010 data uprated to 2014) Figures on current monthly
minimum wages (in 2014) from Eurostat
The interaction between minimum wages income support and poverty
40
Table A17 Effects of a minimum wage at 50 of average hourly wages on at-
risk-of-poverty rates by age 2014
change in at-risk-of-poverty rates
aged lt18 aged 18-29 aged 30-44 aged 45-64 aged 65+
BE -10 -19 -08 -04 00
BG 00 00 00 00 00
CZ -14 -17 -11 -14 -03
DK -02 -31 -01 -04 00
DE -08 -25 -09 -09 -03
EE -20 -20 -16 -25 -04
IE -05 -20 -02 -06 00
EL -12 -27 -10 -10 00
ES -10 -12 -10 -10 -01
FR -18 -17 -12 -06 -01
HR -05 -07 -04 -05 -01
IT -10 -13 -10 -07 00
CY -10 -23 -23 -13 -32
LV -07 -05 -13 -03 00
LT -13 -12 -11 -11 -03
LU -26 -21 -18 -12 -03
HU -14 -18 -12 -12 -01
MT -26 -23 -20 -16 -05
NL -12 -17 -05 -04 00
AT -34 -38 -28 -13 -02
PL 00 00 00 00 00
PT -15 -23 -11 -15 -01
RO -05 -05 -04 -04 -02
SI 00 00 00 00 00
SK 00 00 00 00 00
FI -02 -04 -02 -03 -01
SE -15 -25 -14 -07 -04
UK -06 -09 -07 -06 -01
Note The change in poverty rates is the percentage point difference before and after the introduction of a minimum wage at 50 of average hourly earnings The poverty rate is the share of population (or population group) below that threshold The poverty threshold is at 60 of national household disposable equivalised income The reference group is households of employees who worked for 12 months full-time or 12 months part-time during the previous year
Source EUROMOD version G275+ running on EU-SILC 2012 data uprated to 2014 (except for France and Luxembourg EU-SILC 2010 data uprated to 2014) Figures on current monthly
minimum wages (in 2014) from Eurostat
The interaction between minimum wages income support and poverty
41
Table A18 Effects of a minimum wage at 50 of average hourly wages on
inequality 2014
change in inequality
Gini coefficient income quintile share ratio
(S80S20)
BE -02 -004
BG 00 000
CZ -04 -008
DK -03 -009
DE -04 -006
EE -06 -014
IE -02 -003
EL -04 -016
ES -05 -024
FR -05 -006
HR -01 -002
IT -01 -002
CY -07 -014
LV -02 -007
LT -05 -009
LU -05 -007
HU -06 -012
MT -05 -010
NL -02 -004
AT -07 -012
PL 00 000
PT -09 -018
RO -02 -005
SI 00 000
SK 00 000
FI -01 -002
SE -06 -007
UK -03 -006
Note The change in inequality is the difference in the index concerned before and after the introduction of a minimum wage at 50 of average hourly earnings The Gini coefficient ranges from 0 to 100 where 0 represents perfect equality in a given country and 100 represents the maximum level of inequality The income quintile share ratio (S80S20) is the ratio of the total income received by the 20 of the countryrsquos population with the highest disposable income (top
quintile) to that received by the 20 of the countryrsquos population with the lowest disposable income (bottom quintile) The reference group is households of employees who worked for 12 months full-time or 12 months part-time during the previous year Source EUROMOD version G275+ running on EU-SILC 2012 data uprated to 2014 (except for France and Luxembourg EU-SILC 2010 data uprated to 2014) Figures on current monthly minimum wages (in 2014) from Eurostat
The interaction between minimum wages income support and poverty
23
References
Boeri T amp van Ours J (2013) The economics of imperfect labor markets (2nd edition)
Princeton NJ Princeton University Press
Boeri T Garibaldi P amp Ribeiro M (2011) The lighthouse effect and beyond Review of
Income and Wealth 57 S54-S78
Brewer M Saez E amp Shephard A (2010) Means testing and tax rates on earnings In
Dimensions of tax design the Mirrlees Review Oxford Oxford University Press
Cantillon B (2011) The paradox of the social investment state growth employment
and poverty in the Lisbon era Journal of European Social Policy 21 (5) 432-449
Cantillon B Collado D amp Van Mechelen N (2015) The end of decent social protection
for the poor The dynamics of low wages minimum income packages and median
household incomes ImPRovE Working Paper No 1503 University of Antwerp
Card D amp Krueger A (1994) Minimum wages and employment a case study of the fast-
food industry in New Jersey and Pennsylvania American Economic Review 48 (4) 772-
793
Card D amp Krueger A (1995) Myth and measurement the new economics of the
minimum wage Princeton NJ Princeton University Press
Doucouliagos H amp Stanley TD (2009) Publication selection bias in minimum-wage
research A meta-regression analysis British Journal of Industrial Relations 47 (2) 406-
428
Dube A (2013) Minimum wages and the distribution of family incomes (mimeo)
Dube A Lester W amp Reich M (2010) Minimum wage effects across state borders
Estimates using contiguous counties Review of Economics and Statistics 92 (4) 945-
964
Gaacutebos A Branyiczki R Lange B amp Toacuteth IG (2015) Employment and poverty dynamics
in the EU countries before during and after the crisis ImPRovE Working Paper 1506
University of Antwerp
Immervoll H amp Pearson M (2009) A good time for making work pay Taking stock of
in-work benefits and related measures across the OECD Social Employment and
Migration Working Paper 81 Paris Organisation for Economic Co-operation and
Development
Maicirctre B Nolan B amp Whelan CT (2012) Low pay in-work poverty and economic
vulnerability a comparative analysis using EU-SILC Manchester School 80 (1) 99-116
Neumark D amp Wascher W (2008) Minimum wages Cambridge MA The MIT Press
OECD (2011) Divided We Stand Why inequality keeps rising Paris Organisation for
Economic Co-operation and Development
OECD (2015a) Employment Outlook Paris Organisation for Economic Co-operation and
Development
OECD (2015b) Minimum wages after the crisis making them pay Paris Organisation
for Economic Co-operation and Development
Oumlzdemir E amp Ward T (2015) The characteristics of workers on low wages Social
Situation Monitor Research Note 92015 Brussels European Commission
Schmitt J (2013) Why does the minimum wage have no discernible effect on
employment Washington DC Center for Economic and Policy Research
Ward T amp Oumlzdemir E (2009) Measuring work intensity Social Situation Monitor
Research Note 92009 Brussels European Commission
Wolfson P amp Belman D (2014) What does the minimum wage do Kalamazoo MI
Upjohn Institute for Employment Research
The interaction between minimum wages income support and poverty
24
Annex
Table A1 Percentage of full-year employees among all employees
full-year employees
(either full-time or part-time)
employees with spells of self-
employment or employment
change during the year
employees with
spells of inactivity during the year
low-wage non-low wage
BE 28 816 71 85 1000
BG 67 823 06 103 1000
CZ 83 811 34 72 1000
DK 35 844 16 105 1000
DE 123 740 79 60 1000
EE 124 643 113 120 1000
IE 153 666 61 120 1000
EL 88 760 53 99 1000
ES 126 712 50 113 1000
FR 51 793 76 80 1000
HR 97 791 23 90 1000
IT 93 779 66 61 1000
CY 181 666 39 115 1000
LV 201 644 58 97 1000
LT 190 691 17 103 1000
LU 169 688 70 73 1000
HU 47 770 72 111 1000
MT 81 778 85 56 1000
NL 68 831 20 81 1000
AT 92 714 69 126 1000
PL 139 703 76 82 1000
PT 126 768 49 58 1000
RO 71 888 28 13 1000
SI 73 831 45 52 1000
SK 49 850 42 58 1000
FI 31 756 33 180 1000
SE 75 803 41 81 1000
UK 136 719 99 46 1000
Source EU-SILC 2013 UDB August 2015
The interaction between minimum wages income support and poverty
25
Table A2 Number of low earners in the sample
number of low
earners number of all
workers
no of individuals in households
with low earners
number of individuals
BE 143 4238 34 413 14623 28
BG 293 3876 75 982 12425 79
CZ 561 6064 93 1688 19105 88
DK 171 4185 41 477 13910 34
DE 1334 9242 144 3381 26709 127
EE 709 4406 161 1999 15053 133
IE 574 3065 187 1683 12663 133
EL 317 3025 105 955 18030 53
ES 1146 7589 151 3271 32162 102
FR 461 7524 61 1378 26353 52
HR 373 3411 109 1328 13897 96
IT 1154 10841 106 3290 44622 74
CY 839 3931 213 2546 13277 192
LV 1044 4367 239 2865 14624 196
LT 804 3731 216 2427 11754 206
LU 651 3288 198 1805 9994 181
HU 408 6957 59 1258 25441 49
MT 341 3570 95 1135 11965 95
NL 589 7849 75 1630 24629 66
AT 476 3867 123 1538 13250 116
PL 1482 8975 165 5093 36438 140
PT 665 4715 141 2093 16410 128
RO 392 5297 74 1271 17672 72
SI 692 8605 80 2191 27265 80
SK 284 5231 54 969 15456 63
FI 299 7661 39 733 27910 26
SE 438 5155 85 1230 15218 81
UK 1114 7012 159 3217 23251 138
Note Low earners are defined as those earning less than 50 of average hourly wages The reference group is households of employees who worked for 12 months full-time or 12 months part-time during the previous year Source EU-SILC 2013 UDB August 2015
The interaction between minimum wages income support and poverty
26
Table A3 Concentration of low earners in households
households () individuals ()
no low earners
one low earner
more
than one low earners
total no low earners
one low earner
more
than one low earners
total
BE 972 27 01 1000 967 32 01 1000
BG 924 68 08 1000 910 77 13 1000
CZ 912 83 05 1000 898 96 06 1000
DK 968 32 00 1000 959 41 01 1000
DE 872 117 11 1000 843 141 16 1000
EE 871 120 09 1000 854 134 12 1000
IE 863 124 13 1000 853 131 16 1000
EL 945 51 04 1000 940 56 04 1000
ES 897 94 09 1000 885 103 12 1000
FR 948 50 01 1000 938 61 02 1000
HR 912 79 09 1000 894 92 14 1000
IT 920 76 04 1000 913 82 05 1000
CY 809 172 19 1000 789 187 24 1000
LV 804 171 26 1000 779 186 35 1000
LT 806 176 17 1000 761 216 23 1000
LU 833 140 28 1000 798 162 41 1000
HU 952 43 05 1000 944 50 06 1000
MT 913 80 07 1000 894 96 10 1000
NL 935 62 04 1000 921 73 06 1000
AT 898 92 10 1000 864 118 18 1000
PL 875 110 15 1000 846 132 22 1000
PT 869 122 10 1000 851 136 14 1000
RO 934 56 11 1000 919 66 15 1000
SI 922 74 04 1000 908 87 05 1000
SK 939 56 05 1000 931 63 06 1000
FI 970 30 00 1000 968 32 00 1000
SE 919 78 03 1000 902 94 04 1000
UK 862 126 12 1000 839 147 14 1000
Note Low earners are defined as those earning less than 50 of average hourly wages The reference group is households of employees who worked for 12 months full-time or 12 months part-time during the previous year Source EU-SILC 2013 UDB August 2015
The interaction between minimum wages income support and poverty
27
Table A4 Distribution of individuals living in households with low earners ()
by the position of the low earner(s) in the household
single adult on low wage
households with two or more adults
total spouse (not head) on
low wage
other member
(not head) on low wage
only head on low wage
head and other
member on low wage
BE 59 472 233 199 37 1000
BG 34 380 250 227 110 1000
CZ 31 579 173 180 37 1000
DK 89 274 309 325 03 1000
DE 88 424 265 178 46 1000
EE 70 524 138 213 55 1000
IE 49 347 264 267 73 1000
EL 47 270 404 248 31 1000
ES 49 319 266 303 64 1000
FR 68 436 220 259 17 1000
HR 09 386 287 234 83 1000
IT 86 248 285 328 53 1000
CY 27 298 351 252 72 1000
LV 63 287 222 294 134 1000
LT 55 432 123 314 76 1000
LU 72 332 184 252 160 1000
HU 30 369 178 366 57 1000
MT 45 257 415 249 33 1000
NL 80 381 372 160 08 1000
AT 61 328 382 199 31 1000
PL 16 292 310 296 86 1000
PT 31 406 200 304 59 1000
RO 12 378 257 205 149 1000
SI 39 480 197 242 41 1000
SK 21 426 239 249 65 1000
FI 126 373 146 348 06 1000
SE 97 514 139 215 35 1000
UK 79 390 186 283 63 1000
Note Low earners are defined as those earning less than 50 of average hourly wages The reference group is households of employees who worked for 12 months full-time or 12 months part-time during the previous year
Source EU-SILC 2013 UDB August 2015
The interaction between minimum wages income support and poverty
28
Table A5 Distribution of individuals living in households with low earners ()
by work intensity
work intensity
001-049 05 051-080 081-099 10
BE 168 74 273 152 333 1000
BG 215 137 261 66 321 1000
CZ 73 94 335 60 437 1000
DK 18 175 153 160 495 1000
DE 131 96 361 197 215 1000
EE 90 152 278 102 377 1000
IE 339 111 271 95 184 1000
EL 381 169 226 58 165 1000
ES 235 156 281 104 225 1000
FR 171 103 241 128 357 1000
HR 148 222 289 61 281 1000
IT 240 158 251 122 228 1000
CY 158 104 276 85 378 1000
LV 90 172 311 61 367 1000
LT 110 125 238 51 476 1000
LU 100 116 339 148 297 1000
HU 212 116 289 92 291 1000
MT 216 139 354 134 157 1000
NL 300 66 359 198 77 1000
AT 98 111 330 251 209 1000
PL 135 153 302 86 325 1000
PT 143 131 299 54 372 1000
RO 108 168 379 56 289 1000
SI 63 151 238 74 473 1000
SK 80 151 397 106 266 1000
FI 68 156 197 158 422 1000
SE 36 74 158 220 512 1000
UK 165 88 300 164 284 1000
Note Low earners are defined as those earning less than 50 of average hourly wages The reference group is households of employees who worked for 12 months full-time or 12 months part-time during the previous year Source EU-SILC 2013 UDB August 2015
The interaction between minimum wages income support and poverty
29
Table A6 Distribution of individuals living in households with low earners ()
by household type
households with working-age head households with elderly
head total one or more
adult no
children
single adult with
children
two or more adults one
or two children
two or more adults three
or more children
BE 431 17 446 95 11 1000
BG 455 14 410 111 11 1000
CZ 584 08 356 38 14 1000
DK 460 00 335 186 18 1000
DE 549 23 366 54 08 1000
EE 510 10 383 41 56 1000
IE 395 34 480 78 12 1000
EL 609 03 336 19 33 1000
ES 499 19 421 50 11 1000
FR 443 22 431 92 12 1000
HR 393 05 495 81 27 1000
IT 514 18 380 69 20 1000
CY 496 05 435 50 15 1000
LV 497 27 387 68 21 1000
LT 409 27 459 91 14 1000
LU 344 24 475 148 09 1000
HU 475 10 417 93 05 1000
MT 397 28 528 35 12 1000
NL 551 17 359 67 05 1000
AT 393 17 500 77 13 1000
PL 423 05 472 87 14 1000
PT 380 11 573 28 09 1000
RO 363 03 562 72 00 1000
SI 369 09 522 94 06 1000
SK 514 07 433 31 15 1000
FI 528 37 306 117 12 1000
SE 315 23 505 145 12 1000
UK 421 48 398 97 37 1000
Note Low earners are defined as those earning less than 50 of average hourly wages The reference group is households of employees who worked for 12 months full-time or 12 months part-time during the previous year
Source EU-SILC 2013 UDB August 2015
The interaction between minimum wages income support and poverty
30
Table A7 At risk-of-poverty rate before and after social transfers ()
individuals living in households with low
earner(s) individuals living in all households with
head of working age
after social transfers
before social transfers
number of observations
after social transfers
before social transfers
number of observations
BE 139 388 413 142 293 12347
BG 281 465 982 189 319 10758
CZ 114 324 1688 91 223 16341
DK 168 325 477 119 233 11401
DE 194 358 3381 160 249 21428
EE 191 417 1999 172 277 12919
IE 74 460 1683 144 333 11313
EL 383 525 955 244 369 15473
ES 266 469 3271 213 369 28077
FR 243 509 1378 146 329 21871
HR 127 392 1328 183 309 12156
IT 310 477 3290 193 336 37058
CY 201 354 2546 152 271 11891
LV 216 453 2865 196 320 12681
LT 240 460 2427 202 337 10002
LU 313 593 1805 170 366 8836
HU 254 520 1258 156 377 22402
MT 173 339 1135 153 303 10554
NL 58 193 1630 111 243 20607
AT 145 380 1538 140 332 11165
PL 195 428 5093 180 337 32690
PT 199 393 2093 195 315 13916
RO 201 460 1271 233 368 15752
SI 96 466 2191 134 327 23665
SK 128 358 969 106 244 13769
FI 102 366 733 107 274 22741
SE 166 476 1230 140 266 12356
UK 166 416 3217 153 293 19220
Note Low earners are defined as those earning less than 50 of average hourly wages The reference group is households of employees who worked for 12 months full-time or 12 months part-time during the previous year Source EU-SILC 2013 UDB August 2015
The interaction between minimum wages income support and poverty
31
Table A8 At risk-of-poverty gap before and after social transfers ()
individuals living in households with low
earners individuals living in all households with
head of working age
after social transfers
before social transfers
after social transfers
before social transfers
BE 213 388 253 535
BG 341 427 372 451
CZ 148 309 247 352
DK 422 438 293 460
DE 207 410 244 446
EE 206 359 320 457
IE 219 420 246 491
EL 305 394 368 452
ES 275 403 353 509
FR 224 488 223 465
HR 264 338 324 427
IT 348 445 354 451
CY 222 435 216 381
LV 270 330 339 452
LT 237 391 304 481
LU 186 348 216 439
HU 216 421 255 457
MT 216 413 230 500
NL 151 328 228 492
AT 280 334 295 476
PL 222 331 276 431
PT 244 345 341 412
RO 315 360 377 445
SI 148 346 250 435
SK 214 337 304 409
FI 143 257 230 459
SE 283 410 288 444
UK 225 440 249 461
Note Low earners are defined as those earning less than 50 of average hourly wages The reference group is households of employees who worked for 12 months full-time or 12 months part-time during the previous year Source EU-SILC 2013 UDB August 2015
The interaction between minimum wages income support and poverty
32
Table A9 At-risk-of-poverty rate of households with low earners () by the
position of the low earner in the household
at-risk-of-poverty rate () number of observations
head on low wage
spouse (not
head) on
low wage
other member
(not head) on low wage
total head on low wage
spouse (not
head) on
low wage
other member
(not head) on low wage
total
BE 177 166 34 139 122 195 96 413
BG 471 178 166 283 361 370 244 976
CZ 139 82 188 114 419 977 292 1688
DK 413 05 00 174 192 126 142 460
DE 403 119 72 195 1044 1422 889 3355
EE 259 133 194 184 655 1018 268 1941
IE 108 65 36 74 655 585 443 1683
EL 534 310 299 378 309 256 383 948
ES 345 206 221 268 1341 1029 858 3228
FR 360 179 188 243 467 593 299 1360
HR 230 82 71 127 434 513 382 1328
IT 448 231 152 310 1529 814 938 3281
CY 343 210 52 201 892 759 895 2546
LV 235 165 240 216 1368 800 620 2787
LT 305 184 220 242 1059 1029 292 2379
LU 400 252 191 313 874 597 326 1798
HU 358 192 119 254 570 464 225 1258
MT 343 101 85 173 372 292 472 1135
NL 144 42 19 59 395 605 597 1598
AT 299 79 80 143 445 503 585 1533
PL 298 175 108 203 1906 1399 1486 4791
PT 247 161 179 199 814 839 414 2067
RO 239 156 216 201 465 480 326 1271
SI 148 61 96 96 701 1042 428 2171
SK 238 87 47 128 324 413 232 969
FI 170 56 00 103 350 272 107 728
SE 305 74 136 163 419 622 168 1209
UK 199 153 117 166 1359 1249 596 3204
Note Low earners are defined as those earning less than 50 of average hourly wages The
reference group is households of employees who worked for 12 months full-time or 12 months part-time during the previous year
Source EU-SILC 2013 UDB August 2015
The interaction between minimum wages income support and poverty
33
Table A10 At-risk-of-poverty rate of households with low earners () by
work intensity
at risk-of-poverty rate () number of observations
0-049 05-099 1 total 0-049 05-099 1 total
BE 383 72 46 139 100 175 137 413
BG 603 111 104 282 344 320 313 977
CZ 331 88 57 115 281 664 735 1681
DK 556 21 114 170 91 147 233 471
DE 345 132 199 194 764 1885 727 3377
EE 437 97 138 195 470 736 731 1938
IE 120 41 29 74 754 613 308 1675
EL 589 134 120 382 524 271 158 953
ES 402 188 163 266 1277 1256 734 3266
FR 462 190 131 243 378 507 492 1377
HR 288 33 32 127 491 464 373 1328
IT 517 172 173 310 1306 1218 742 3266
CY 369 93 188 201 664 917 960 2541
LV 457 148 119 218 742 1051 1040 2833
LT 551 236 93 242 563 696 1143 2403
LU 600 293 135 313 391 872 535 1798
HU 562 109 96 254 413 479 367 1258
MT 373 60 66 172 403 553 178 1134
NL 105 35 00 58 592 908 125 1625
AT 330 89 115 145 322 894 322 1537
PL 381 143 94 196 1462 1972 1650 5084
PT 453 114 96 200 571 737 775 2083
RO 421 172 37 201 351 553 367 1271
SI 270 63 39 96 469 685 1037 2191
SK 269 80 97 128 223 485 257 965
FI 154 94 81 102 164 260 309 733
SE 421 105 159 167 135 461 626 1222
UK 383 122 57 169 789 1447 888 3124 Note Low earners are defined as those earning less than 50 of average hourly wages The reference group is households of employees who worked for 12 months full-time or 12 months part-time during the previous year Source EU-SILC 2013 UDB August 2015
The interaction between minimum wages income support and poverty
34
Table A11 At-risk-of-poverty rate of households with low earners () by
number of children
at risk-of-poverty rate () number of observations in dataset
without children
with children
total without children
with children
total
BE 100 171 139 178 230 413
BG 185 367 281 446 525 982
CZ 121 108 114 987 678 1688
DK 98 235 168 220 249 477
DE 211 173 194 1854 1499 3380
EE 157 250 191 1019 868 1998
IE 60 85 74 665 997 1683
EL 333 490 383 582 342 955
ES 191 346 266 1632 1602 3270
FR 133 338 243 610 752 1378
HR 120 138 127 521 771 1328
IT 267 367 310 1682 1535 3281
CY 237 168 201 1262 1247 2546
LV 159 283 216 1424 1380 2865
LT 153 307 240 993 1400 2427
LU 223 361 313 614 1168 1798
HU 247 263 254 598 654 1258
MT 79 238 173 451 671 1135
NL 25 94 58 893 723 1625
AT 105 174 145 605 914 1538
PL 121 254 195 2152 2872 5093
PT 133 243 199 794 1281 2093
RO 105 256 201 461 810 1271
SI 98 96 96 809 1369 2191
SK 127 133 128 498 457 969
FI 75 136 102 387 337 733
SE 189 155 166 388 828 1230
UK 132 199 166 1354 1741 3213
Note Low earners are defined as those earning less than 50 of average hourly wages The reference group is households of employees who worked for 12 months full-time or 12 months part-time during the previous year Source EU-SILC 2013 UDB August 2015
The interaction between minimum wages income support and poverty
35
Table A12 Share of social benefits in total income of households with low
earners
old-age pensions
family benefits
unemployment
benefits
housing benefits
social assistance
other benefits
total social benefits
BE 3 6 4 0 0 3 15
BG 10 2 2 0 0 3 18
CZ 7 1 0 0 0 6 15
DK 1 2 5 0 0 5 14
DE 3 5 2 1 0 1 12
EE 10 3 0 0 0 5 19
IE 3 8 8 0 0 3 23
EL 14 1 1 0 0 1 16
ES 8 0 9 0 1 3 21
FR 9 4 5 2 1 1 22
HR 8 5 1 0 0 6 20
IT 8 2 5 0 0 2 17
CY 10 2 4 0 0 3 19
LV 11 2 1 0 0 4 18
LT 6 5 1 0 1 6 19
LU 5 9 2 1 1 2 21
HU 9 7 1 0 0 3 19
MT 5 3 0 0 2 2 12
NL 2 1 1 1 1 2 8
AT 4 6 2 0 0 2 14
PL 12 2 1 0 0 3 17
PT 9 2 3 0 0 2 16
RO 11 4 0 0 0 3 18
SI 3 14 1 0 1 8 27
SK 11 3 0 0 0 5 20
FI 3 4 3 1 0 3 13
SE 2 11 2 0 0 7 23
UK 6 5 1 1 1 2 16
Note Other benefits include sickness disability and education-related benefits Low earners are defined as those earning less than 50 of average hourly wages The reference group is households of employees who worked for 12 months full-time or 12 months part-time during the previous year Source EU-SILC 2013 UDB August 2015
The interaction between minimum wages income support and poverty
36
Table A13 National minimum wages vs 50 of average earnings 2014
average hourly
earnings (euro)
average monthly
earnings (euro)
50 of average
monthly earnings (euro)
national monthly
minimum wage (euro)
required increase
()
BE 1954 3480 1740 1502 16
BG 237 417 208 174 20
CZ 537 987 494 329 50
DK 2622 4524 2262
DE 1756 3506 1753
EE 592 1070 535 355 51
IE 2227 3854 1927 1462 32
EL 846 1457 729 684 7
ES 1079 1925 963 753 28
FR 1531 2511 1256 1445 -13
HR 506 908 454 406 12
IT 1370 2255 1128
CY 1155 2032 1016
LV 494 897 448 320 40
LT 407 716 358 290 24
LU 2687 4918 2459 1921 28
HU 317 562 281 328 -14
MT 960 1744 872 718 21
NL 2221 3964 1982 1490 33
AT 1900 3546 1773
PL 477 858 429 404 6
PT 742 1333 666 566 18
RO 230 414 207 198 5
SI 957 1688 844 789 7
SK 485 869 435 352 23
FI 2080 3620 1810
SE 2512 3596 1798
UK 1771 2766 1383 1303 6
Note The reference group is households of employees who worked for 12 months full-time or 12 months part-time during the previous year Source EUROMOD version G275+ running on EU-SILC 2012 data uprated to 2014 (except for France and Luxembourg EU-SILC 2010 data uprated to 2014) Figures on current monthly minimum wages (in 2014) from Eurostat
The interaction between minimum wages income support and poverty
37
Table A14 Distribution of workers affected by the increase in minimum wages
to 50 of average hourly earnings by level of increase ()
total
affected
increase in earnings to 50 of average earnings not affected
lt10 1001-20 2001-30 gt30
BE 40 16 04 05 16 960
BG 104 42 46 04 11 896
CZ 85 31 20 12 22 915
DK 61 10 10 09 31 939
DE 167 35 21 17 94 833
EE 176 36 41 31 68 824
IE 178 57 45 28 48 822
EL 116 35 23 20 38 884
ES 96 29 18 11 38 904
FR 77 15 10 06 47 923
HR 93 32 28 12 21 907
IT 113 18 15 10 70 887
CY 210 45 30 26 109 790
LV 220 46 52 38 83 780
LT 209 40 36 31 103 791
LU 183 57 48 34 44 817
HU 90 36 33 09 12 910
MT 93 34 25 07 27 907
NL 83 24 16 11 33 917
AT 131 28 16 13 73 869
PL 153 46 33 22 53 847
PT 173 50 48 22 53 827
RO 93 29 16 12 36 907
SI 86 28 12 05 41 914
SK 62 20 14 08 19 938
FI 42 16 08 06 13 958
SE 121 18 12 09 81 879
UK 188 60 43 19 66 812
Note The reference group is households of employees who worked for 12 months full-time or 12 months part-time during the previous year Source EUROMOD version G275+ running on EU-SILC 2012 data uprated to 2014 (except for France and Luxembourg EU-SILC 2010 data uprated to 2014) Figures on current monthly minimum wages (in 2014) from Eurostat
The interaction between minimum wages income support and poverty
38
Table A15 Poverty risk in households of low earners 2014
total earners
(1) low earners
(2)
of which in
poor households (3)
poverty rate of
low earners (4) = (3) (2)
low earners in poor households
as of all earners
(4) = (3) (1)
BE 3353261 134026 17970 134 05
BG 2362137 244588 63961 262 27
CZ 3331428 282085 29516 105 09
DK 1749226 106300 25224 237 14
DE 30271881 5068452 793234 157 26
EE 427162 75190 17895 238 42
IE 1164123 207729 17405 84 15
EL 2084532 242333 72889 301 35
ES 12258632 1177421 309078 263 25
FR 19911322 1535080 234136 153 12
HR 1063434 98966 12125 123 11
IT 15503093 1749434 488952 279 32
CY 284162 59795 10793 180 38
LV 628621 138371 27466 198 44
LT 928391 194150 37148 191 40
LU 184141 33673 6327 188 34
HU 2775484 250535 45132 180 16
MT 129372 12027 2446 203 19
NL 5544901 462701 60572 131 11
AT 2596626 341187 63808 187 25
PL 10166671 1558698 280035 180 28
PT 3303603 571146 80247 141 24
RO 6214151 580179 99679 172 16
SI 647095 55639 7210 130 11
SK 1807568 111931 21873 195 12
FI 1514848 63844 6723 105 04
SE 3232371 390717 64719 166 20
UK 22093617 4156506 633675 152 29
EU-28
155531853 19902703 3530237 177 23
Note Low earners are those earning less than 50 of average hourly wages The reference group is households of employees who worked for 12 months full-time or 12 months part-time during
the previous year The poverty threshold is at 60 of national household disposable equivalised income The poverty rate is the share of population (or population group) below that threshold Source EUROMOD version G275+ running on EU-SILC 2012 data uprated to 2014 (except for France and Luxembourg EU-SILC 2010 data uprated to 2014) Figures on current monthly minimum wages (in 2014) from Eurostat
The interaction between minimum wages income support and poverty
39
Table A16 Effects of a minimum wage at 50 of average hourly wages on at-
risk-of-poverty rates by gender 2014
change in at-risk-of-poverty rates
total men women
BE -08 -08 -08
BG 00 00 00
CZ -12 -11 -13
DK -06 -08 -04
DE -10 -09 -11
EE -18 -16 -19
IE -06 -06 -07
EL -11 -10 -11
ES -09 -08 -10
FR -11 -10 -11
HR -04 -04 -05
IT -08 -07 -08
CY -19 -14 -24
LV -03 -04 -03
LT -10 -10 -10
LU -16 -16 -16
HU -12 -12 -11
MT -18 -20 -17
NL -07 -09 -06
AT -22 -22 -22
PL 00 00 00
PT -13 -13 -12
RO -04 -04 -04
SI 00 00 00
SK 00 00 00
FI -02 -02 -03
SE -12 -11 -14
UK -06 -06 -05
Note The change in poverty rates is the percentage point difference before and after the introduction of a minimum wage at 50 of average hourly earnings The poverty rate is the share of population (or population group) below that threshold The poverty threshold is at 60 of national household disposable equivalised income The reference group is households of employees who worked for 12 months full-time or 12 months part-time during the previous year
Source EUROMOD version G275+ running on EU-SILC 2012 data uprated to 2014 (except for France and Luxembourg EU-SILC 2010 data uprated to 2014) Figures on current monthly
minimum wages (in 2014) from Eurostat
The interaction between minimum wages income support and poverty
40
Table A17 Effects of a minimum wage at 50 of average hourly wages on at-
risk-of-poverty rates by age 2014
change in at-risk-of-poverty rates
aged lt18 aged 18-29 aged 30-44 aged 45-64 aged 65+
BE -10 -19 -08 -04 00
BG 00 00 00 00 00
CZ -14 -17 -11 -14 -03
DK -02 -31 -01 -04 00
DE -08 -25 -09 -09 -03
EE -20 -20 -16 -25 -04
IE -05 -20 -02 -06 00
EL -12 -27 -10 -10 00
ES -10 -12 -10 -10 -01
FR -18 -17 -12 -06 -01
HR -05 -07 -04 -05 -01
IT -10 -13 -10 -07 00
CY -10 -23 -23 -13 -32
LV -07 -05 -13 -03 00
LT -13 -12 -11 -11 -03
LU -26 -21 -18 -12 -03
HU -14 -18 -12 -12 -01
MT -26 -23 -20 -16 -05
NL -12 -17 -05 -04 00
AT -34 -38 -28 -13 -02
PL 00 00 00 00 00
PT -15 -23 -11 -15 -01
RO -05 -05 -04 -04 -02
SI 00 00 00 00 00
SK 00 00 00 00 00
FI -02 -04 -02 -03 -01
SE -15 -25 -14 -07 -04
UK -06 -09 -07 -06 -01
Note The change in poverty rates is the percentage point difference before and after the introduction of a minimum wage at 50 of average hourly earnings The poverty rate is the share of population (or population group) below that threshold The poverty threshold is at 60 of national household disposable equivalised income The reference group is households of employees who worked for 12 months full-time or 12 months part-time during the previous year
Source EUROMOD version G275+ running on EU-SILC 2012 data uprated to 2014 (except for France and Luxembourg EU-SILC 2010 data uprated to 2014) Figures on current monthly
minimum wages (in 2014) from Eurostat
The interaction between minimum wages income support and poverty
41
Table A18 Effects of a minimum wage at 50 of average hourly wages on
inequality 2014
change in inequality
Gini coefficient income quintile share ratio
(S80S20)
BE -02 -004
BG 00 000
CZ -04 -008
DK -03 -009
DE -04 -006
EE -06 -014
IE -02 -003
EL -04 -016
ES -05 -024
FR -05 -006
HR -01 -002
IT -01 -002
CY -07 -014
LV -02 -007
LT -05 -009
LU -05 -007
HU -06 -012
MT -05 -010
NL -02 -004
AT -07 -012
PL 00 000
PT -09 -018
RO -02 -005
SI 00 000
SK 00 000
FI -01 -002
SE -06 -007
UK -03 -006
Note The change in inequality is the difference in the index concerned before and after the introduction of a minimum wage at 50 of average hourly earnings The Gini coefficient ranges from 0 to 100 where 0 represents perfect equality in a given country and 100 represents the maximum level of inequality The income quintile share ratio (S80S20) is the ratio of the total income received by the 20 of the countryrsquos population with the highest disposable income (top
quintile) to that received by the 20 of the countryrsquos population with the lowest disposable income (bottom quintile) The reference group is households of employees who worked for 12 months full-time or 12 months part-time during the previous year Source EUROMOD version G275+ running on EU-SILC 2012 data uprated to 2014 (except for France and Luxembourg EU-SILC 2010 data uprated to 2014) Figures on current monthly minimum wages (in 2014) from Eurostat

The interaction between minimum wages income support and poverty
27
Table A4 Distribution of individuals living in households with low earners ()
by the position of the low earner(s) in the household
single adult on low wage
households with two or more adults
total spouse (not head) on
low wage
other member
(not head) on low wage
only head on low wage
head and other
member on low wage
BE 59 472 233 199 37 1000
BG 34 380 250 227 110 1000
CZ 31 579 173 180 37 1000
DK 89 274 309 325 03 1000
DE 88 424 265 178 46 1000
EE 70 524 138 213 55 1000
IE 49 347 264 267 73 1000
EL 47 270 404 248 31 1000
ES 49 319 266 303 64 1000
FR 68 436 220 259 17 1000
HR 09 386 287 234 83 1000
IT 86 248 285 328 53 1000
CY 27 298 351 252 72 1000
LV 63 287 222 294 134 1000
LT 55 432 123 314 76 1000
LU 72 332 184 252 160 1000
HU 30 369 178 366 57 1000
MT 45 257 415 249 33 1000
NL 80 381 372 160 08 1000
AT 61 328 382 199 31 1000
PL 16 292 310 296 86 1000
PT 31 406 200 304 59 1000
RO 12 378 257 205 149 1000
SI 39 480 197 242 41 1000
SK 21 426 239 249 65 1000
FI 126 373 146 348 06 1000
SE 97 514 139 215 35 1000
UK 79 390 186 283 63 1000
Note Low earners are defined as those earning less than 50 of average hourly wages The reference group is households of employees who worked for 12 months full-time or 12 months part-time during the previous year
Source EU-SILC 2013 UDB August 2015
The interaction between minimum wages income support and poverty
28
Table A5 Distribution of individuals living in households with low earners ()
by work intensity
work intensity
001-049 05 051-080 081-099 10
BE 168 74 273 152 333 1000
BG 215 137 261 66 321 1000
CZ 73 94 335 60 437 1000
DK 18 175 153 160 495 1000
DE 131 96 361 197 215 1000
EE 90 152 278 102 377 1000
IE 339 111 271 95 184 1000
EL 381 169 226 58 165 1000
ES 235 156 281 104 225 1000
FR 171 103 241 128 357 1000
HR 148 222 289 61 281 1000
IT 240 158 251 122 228 1000
CY 158 104 276 85 378 1000
LV 90 172 311 61 367 1000
LT 110 125 238 51 476 1000
LU 100 116 339 148 297 1000
HU 212 116 289 92 291 1000
MT 216 139 354 134 157 1000
NL 300 66 359 198 77 1000
AT 98 111 330 251 209 1000
PL 135 153 302 86 325 1000
PT 143 131 299 54 372 1000
RO 108 168 379 56 289 1000
SI 63 151 238 74 473 1000
SK 80 151 397 106 266 1000
FI 68 156 197 158 422 1000
SE 36 74 158 220 512 1000
UK 165 88 300 164 284 1000
Note Low earners are defined as those earning less than 50 of average hourly wages The reference group is households of employees who worked for 12 months full-time or 12 months part-time during the previous year Source EU-SILC 2013 UDB August 2015
The interaction between minimum wages income support and poverty
29
Table A6 Distribution of individuals living in households with low earners ()
by household type
households with working-age head households with elderly
head total one or more
adult no
children
single adult with
children
two or more adults one
or two children
two or more adults three
or more children
BE 431 17 446 95 11 1000
BG 455 14 410 111 11 1000
CZ 584 08 356 38 14 1000
DK 460 00 335 186 18 1000
DE 549 23 366 54 08 1000
EE 510 10 383 41 56 1000
IE 395 34 480 78 12 1000
EL 609 03 336 19 33 1000
ES 499 19 421 50 11 1000
FR 443 22 431 92 12 1000
HR 393 05 495 81 27 1000
IT 514 18 380 69 20 1000
CY 496 05 435 50 15 1000
LV 497 27 387 68 21 1000
LT 409 27 459 91 14 1000
LU 344 24 475 148 09 1000
HU 475 10 417 93 05 1000
MT 397 28 528 35 12 1000
NL 551 17 359 67 05 1000
AT 393 17 500 77 13 1000
PL 423 05 472 87 14 1000
PT 380 11 573 28 09 1000
RO 363 03 562 72 00 1000
SI 369 09 522 94 06 1000
SK 514 07 433 31 15 1000
FI 528 37 306 117 12 1000
SE 315 23 505 145 12 1000
UK 421 48 398 97 37 1000
Note Low earners are defined as those earning less than 50 of average hourly wages The reference group is households of employees who worked for 12 months full-time or 12 months part-time during the previous year
Source EU-SILC 2013 UDB August 2015
The interaction between minimum wages income support and poverty
30
Table A7 At risk-of-poverty rate before and after social transfers ()
individuals living in households with low
earner(s) individuals living in all households with
head of working age
after social transfers
before social transfers
number of observations
after social transfers
before social transfers
number of observations
BE 139 388 413 142 293 12347
BG 281 465 982 189 319 10758
CZ 114 324 1688 91 223 16341
DK 168 325 477 119 233 11401
DE 194 358 3381 160 249 21428
EE 191 417 1999 172 277 12919
IE 74 460 1683 144 333 11313
EL 383 525 955 244 369 15473
ES 266 469 3271 213 369 28077
FR 243 509 1378 146 329 21871
HR 127 392 1328 183 309 12156
IT 310 477 3290 193 336 37058
CY 201 354 2546 152 271 11891
LV 216 453 2865 196 320 12681
LT 240 460 2427 202 337 10002
LU 313 593 1805 170 366 8836
HU 254 520 1258 156 377 22402
MT 173 339 1135 153 303 10554
NL 58 193 1630 111 243 20607
AT 145 380 1538 140 332 11165
PL 195 428 5093 180 337 32690
PT 199 393 2093 195 315 13916
RO 201 460 1271 233 368 15752
SI 96 466 2191 134 327 23665
SK 128 358 969 106 244 13769
FI 102 366 733 107 274 22741
SE 166 476 1230 140 266 12356
UK 166 416 3217 153 293 19220
Note Low earners are defined as those earning less than 50 of average hourly wages The reference group is households of employees who worked for 12 months full-time or 12 months part-time during the previous year Source EU-SILC 2013 UDB August 2015
The interaction between minimum wages income support and poverty
31
Table A8 At risk-of-poverty gap before and after social transfers ()
individuals living in households with low
earners individuals living in all households with
head of working age
after social transfers
before social transfers
after social transfers
before social transfers
BE 213 388 253 535
BG 341 427 372 451
CZ 148 309 247 352
DK 422 438 293 460
DE 207 410 244 446
EE 206 359 320 457
IE 219 420 246 491
EL 305 394 368 452
ES 275 403 353 509
FR 224 488 223 465
HR 264 338 324 427
IT 348 445 354 451
CY 222 435 216 381
LV 270 330 339 452
LT 237 391 304 481
LU 186 348 216 439
HU 216 421 255 457
MT 216 413 230 500
NL 151 328 228 492
AT 280 334 295 476
PL 222 331 276 431
PT 244 345 341 412
RO 315 360 377 445
SI 148 346 250 435
SK 214 337 304 409
FI 143 257 230 459
SE 283 410 288 444
UK 225 440 249 461
Note Low earners are defined as those earning less than 50 of average hourly wages The reference group is households of employees who worked for 12 months full-time or 12 months part-time during the previous year Source EU-SILC 2013 UDB August 2015
The interaction between minimum wages income support and poverty
32
Table A9 At-risk-of-poverty rate of households with low earners () by the
position of the low earner in the household
at-risk-of-poverty rate () number of observations
head on low wage
spouse (not
head) on
low wage
other member
(not head) on low wage
total head on low wage
spouse (not
head) on
low wage
other member
(not head) on low wage
total
BE 177 166 34 139 122 195 96 413
BG 471 178 166 283 361 370 244 976
CZ 139 82 188 114 419 977 292 1688
DK 413 05 00 174 192 126 142 460
DE 403 119 72 195 1044 1422 889 3355
EE 259 133 194 184 655 1018 268 1941
IE 108 65 36 74 655 585 443 1683
EL 534 310 299 378 309 256 383 948
ES 345 206 221 268 1341 1029 858 3228
FR 360 179 188 243 467 593 299 1360
HR 230 82 71 127 434 513 382 1328
IT 448 231 152 310 1529 814 938 3281
CY 343 210 52 201 892 759 895 2546
LV 235 165 240 216 1368 800 620 2787
LT 305 184 220 242 1059 1029 292 2379
LU 400 252 191 313 874 597 326 1798
HU 358 192 119 254 570 464 225 1258
MT 343 101 85 173 372 292 472 1135
NL 144 42 19 59 395 605 597 1598
AT 299 79 80 143 445 503 585 1533
PL 298 175 108 203 1906 1399 1486 4791
PT 247 161 179 199 814 839 414 2067
RO 239 156 216 201 465 480 326 1271
SI 148 61 96 96 701 1042 428 2171
SK 238 87 47 128 324 413 232 969
FI 170 56 00 103 350 272 107 728
SE 305 74 136 163 419 622 168 1209
UK 199 153 117 166 1359 1249 596 3204
Note Low earners are defined as those earning less than 50 of average hourly wages The
reference group is households of employees who worked for 12 months full-time or 12 months part-time during the previous year
Source EU-SILC 2013 UDB August 2015
The interaction between minimum wages income support and poverty
33
Table A10 At-risk-of-poverty rate of households with low earners () by
work intensity
at risk-of-poverty rate () number of observations
0-049 05-099 1 total 0-049 05-099 1 total
BE 383 72 46 139 100 175 137 413
BG 603 111 104 282 344 320 313 977
CZ 331 88 57 115 281 664 735 1681
DK 556 21 114 170 91 147 233 471
DE 345 132 199 194 764 1885 727 3377
EE 437 97 138 195 470 736 731 1938
IE 120 41 29 74 754 613 308 1675
EL 589 134 120 382 524 271 158 953
ES 402 188 163 266 1277 1256 734 3266
FR 462 190 131 243 378 507 492 1377
HR 288 33 32 127 491 464 373 1328
IT 517 172 173 310 1306 1218 742 3266
CY 369 93 188 201 664 917 960 2541
LV 457 148 119 218 742 1051 1040 2833
LT 551 236 93 242 563 696 1143 2403
LU 600 293 135 313 391 872 535 1798
HU 562 109 96 254 413 479 367 1258
MT 373 60 66 172 403 553 178 1134
NL 105 35 00 58 592 908 125 1625
AT 330 89 115 145 322 894 322 1537
PL 381 143 94 196 1462 1972 1650 5084
PT 453 114 96 200 571 737 775 2083
RO 421 172 37 201 351 553 367 1271
SI 270 63 39 96 469 685 1037 2191
SK 269 80 97 128 223 485 257 965
FI 154 94 81 102 164 260 309 733
SE 421 105 159 167 135 461 626 1222
UK 383 122 57 169 789 1447 888 3124 Note Low earners are defined as those earning less than 50 of average hourly wages The reference group is households of employees who worked for 12 months full-time or 12 months part-time during the previous year Source EU-SILC 2013 UDB August 2015
The interaction between minimum wages income support and poverty
34
Table A11 At-risk-of-poverty rate of households with low earners () by
number of children
at risk-of-poverty rate () number of observations in dataset
without children
with children
total without children
with children
total
BE 100 171 139 178 230 413
BG 185 367 281 446 525 982
CZ 121 108 114 987 678 1688
DK 98 235 168 220 249 477
DE 211 173 194 1854 1499 3380
EE 157 250 191 1019 868 1998
IE 60 85 74 665 997 1683
EL 333 490 383 582 342 955
ES 191 346 266 1632 1602 3270
FR 133 338 243 610 752 1378
HR 120 138 127 521 771 1328
IT 267 367 310 1682 1535 3281
CY 237 168 201 1262 1247 2546
LV 159 283 216 1424 1380 2865
LT 153 307 240 993 1400 2427
LU 223 361 313 614 1168 1798
HU 247 263 254 598 654 1258
MT 79 238 173 451 671 1135
NL 25 94 58 893 723 1625
AT 105 174 145 605 914 1538
PL 121 254 195 2152 2872 5093
PT 133 243 199 794 1281 2093
RO 105 256 201 461 810 1271
SI 98 96 96 809 1369 2191
SK 127 133 128 498 457 969
FI 75 136 102 387 337 733
SE 189 155 166 388 828 1230
UK 132 199 166 1354 1741 3213
Note Low earners are defined as those earning less than 50 of average hourly wages The reference group is households of employees who worked for 12 months full-time or 12 months part-time during the previous year Source EU-SILC 2013 UDB August 2015
The interaction between minimum wages income support and poverty
35
Table A12 Share of social benefits in total income of households with low
earners
old-age pensions
family benefits
unemployment
benefits
housing benefits
social assistance
other benefits
total social benefits
BE 3 6 4 0 0 3 15
BG 10 2 2 0 0 3 18
CZ 7 1 0 0 0 6 15
DK 1 2 5 0 0 5 14
DE 3 5 2 1 0 1 12
EE 10 3 0 0 0 5 19
IE 3 8 8 0 0 3 23
EL 14 1 1 0 0 1 16
ES 8 0 9 0 1 3 21
FR 9 4 5 2 1 1 22
HR 8 5 1 0 0 6 20
IT 8 2 5 0 0 2 17
CY 10 2 4 0 0 3 19
LV 11 2 1 0 0 4 18
LT 6 5 1 0 1 6 19
LU 5 9 2 1 1 2 21
HU 9 7 1 0 0 3 19
MT 5 3 0 0 2 2 12
NL 2 1 1 1 1 2 8
AT 4 6 2 0 0 2 14
PL 12 2 1 0 0 3 17
PT 9 2 3 0 0 2 16
RO 11 4 0 0 0 3 18
SI 3 14 1 0 1 8 27
SK 11 3 0 0 0 5 20
FI 3 4 3 1 0 3 13
SE 2 11 2 0 0 7 23
UK 6 5 1 1 1 2 16
Note Other benefits include sickness disability and education-related benefits Low earners are defined as those earning less than 50 of average hourly wages The reference group is households of employees who worked for 12 months full-time or 12 months part-time during the previous year Source EU-SILC 2013 UDB August 2015
The interaction between minimum wages income support and poverty
36
Table A13 National minimum wages vs 50 of average earnings 2014
average hourly
earnings (euro)
average monthly
earnings (euro)
50 of average
monthly earnings (euro)
national monthly
minimum wage (euro)
required increase
()
BE 1954 3480 1740 1502 16
BG 237 417 208 174 20
CZ 537 987 494 329 50
DK 2622 4524 2262
DE 1756 3506 1753
EE 592 1070 535 355 51
IE 2227 3854 1927 1462 32
EL 846 1457 729 684 7
ES 1079 1925 963 753 28
FR 1531 2511 1256 1445 -13
HR 506 908 454 406 12
IT 1370 2255 1128
CY 1155 2032 1016
LV 494 897 448 320 40
LT 407 716 358 290 24
LU 2687 4918 2459 1921 28
HU 317 562 281 328 -14
MT 960 1744 872 718 21
NL 2221 3964 1982 1490 33
AT 1900 3546 1773
PL 477 858 429 404 6
PT 742 1333 666 566 18
RO 230 414 207 198 5
SI 957 1688 844 789 7
SK 485 869 435 352 23
FI 2080 3620 1810
SE 2512 3596 1798
UK 1771 2766 1383 1303 6
Note The reference group is households of employees who worked for 12 months full-time or 12 months part-time during the previous year Source EUROMOD version G275+ running on EU-SILC 2012 data uprated to 2014 (except for France and Luxembourg EU-SILC 2010 data uprated to 2014) Figures on current monthly minimum wages (in 2014) from Eurostat
The interaction between minimum wages income support and poverty
37
Table A14 Distribution of workers affected by the increase in minimum wages
to 50 of average hourly earnings by level of increase ()
total
affected
increase in earnings to 50 of average earnings not affected
lt10 1001-20 2001-30 gt30
BE 40 16 04 05 16 960
BG 104 42 46 04 11 896
CZ 85 31 20 12 22 915
DK 61 10 10 09 31 939
DE 167 35 21 17 94 833
EE 176 36 41 31 68 824
IE 178 57 45 28 48 822
EL 116 35 23 20 38 884
ES 96 29 18 11 38 904
FR 77 15 10 06 47 923
HR 93 32 28 12 21 907
IT 113 18 15 10 70 887
CY 210 45 30 26 109 790
LV 220 46 52 38 83 780
LT 209 40 36 31 103 791
LU 183 57 48 34 44 817
HU 90 36 33 09 12 910
MT 93 34 25 07 27 907
NL 83 24 16 11 33 917
AT 131 28 16 13 73 869
PL 153 46 33 22 53 847
PT 173 50 48 22 53 827
RO 93 29 16 12 36 907
SI 86 28 12 05 41 914
SK 62 20 14 08 19 938
FI 42 16 08 06 13 958
SE 121 18 12 09 81 879
UK 188 60 43 19 66 812
Note The reference group is households of employees who worked for 12 months full-time or 12 months part-time during the previous year Source EUROMOD version G275+ running on EU-SILC 2012 data uprated to 2014 (except for France and Luxembourg EU-SILC 2010 data uprated to 2014) Figures on current monthly minimum wages (in 2014) from Eurostat
The interaction between minimum wages income support and poverty
38
Table A15 Poverty risk in households of low earners 2014
total earners
(1) low earners
(2)
of which in
poor households (3)
poverty rate of
low earners (4) = (3) (2)
low earners in poor households
as of all earners
(4) = (3) (1)
BE 3353261 134026 17970 134 05
BG 2362137 244588 63961 262 27
CZ 3331428 282085 29516 105 09
DK 1749226 106300 25224 237 14
DE 30271881 5068452 793234 157 26
EE 427162 75190 17895 238 42
IE 1164123 207729 17405 84 15
EL 2084532 242333 72889 301 35
ES 12258632 1177421 309078 263 25
FR 19911322 1535080 234136 153 12
HR 1063434 98966 12125 123 11
IT 15503093 1749434 488952 279 32
CY 284162 59795 10793 180 38
LV 628621 138371 27466 198 44
LT 928391 194150 37148 191 40
LU 184141 33673 6327 188 34
HU 2775484 250535 45132 180 16
MT 129372 12027 2446 203 19
NL 5544901 462701 60572 131 11
AT 2596626 341187 63808 187 25
PL 10166671 1558698 280035 180 28
PT 3303603 571146 80247 141 24
RO 6214151 580179 99679 172 16
SI 647095 55639 7210 130 11
SK 1807568 111931 21873 195 12
FI 1514848 63844 6723 105 04
SE 3232371 390717 64719 166 20
UK 22093617 4156506 633675 152 29
EU-28
155531853 19902703 3530237 177 23
Note Low earners are those earning less than 50 of average hourly wages The reference group is households of employees who worked for 12 months full-time or 12 months part-time during
the previous year The poverty threshold is at 60 of national household disposable equivalised income The poverty rate is the share of population (or population group) below that threshold Source EUROMOD version G275+ running on EU-SILC 2012 data uprated to 2014 (except for France and Luxembourg EU-SILC 2010 data uprated to 2014) Figures on current monthly minimum wages (in 2014) from Eurostat
The interaction between minimum wages income support and poverty
39
Table A16 Effects of a minimum wage at 50 of average hourly wages on at-
risk-of-poverty rates by gender 2014
change in at-risk-of-poverty rates
total men women
BE -08 -08 -08
BG 00 00 00
CZ -12 -11 -13
DK -06 -08 -04
DE -10 -09 -11
EE -18 -16 -19
IE -06 -06 -07
EL -11 -10 -11
ES -09 -08 -10
FR -11 -10 -11
HR -04 -04 -05
IT -08 -07 -08
CY -19 -14 -24
LV -03 -04 -03
LT -10 -10 -10
LU -16 -16 -16
HU -12 -12 -11
MT -18 -20 -17
NL -07 -09 -06
AT -22 -22 -22
PL 00 00 00
PT -13 -13 -12
RO -04 -04 -04
SI 00 00 00
SK 00 00 00
FI -02 -02 -03
SE -12 -11 -14
UK -06 -06 -05
Note The change in poverty rates is the percentage point difference before and after the introduction of a minimum wage at 50 of average hourly earnings The poverty rate is the share of population (or population group) below that threshold The poverty threshold is at 60 of national household disposable equivalised income The reference group is households of employees who worked for 12 months full-time or 12 months part-time during the previous year
Source EUROMOD version G275+ running on EU-SILC 2012 data uprated to 2014 (except for France and Luxembourg EU-SILC 2010 data uprated to 2014) Figures on current monthly
minimum wages (in 2014) from Eurostat
The interaction between minimum wages income support and poverty
40
Table A17 Effects of a minimum wage at 50 of average hourly wages on at-
risk-of-poverty rates by age 2014
change in at-risk-of-poverty rates
aged lt18 aged 18-29 aged 30-44 aged 45-64 aged 65+
BE -10 -19 -08 -04 00
BG 00 00 00 00 00
CZ -14 -17 -11 -14 -03
DK -02 -31 -01 -04 00
DE -08 -25 -09 -09 -03
EE -20 -20 -16 -25 -04
IE -05 -20 -02 -06 00
EL -12 -27 -10 -10 00
ES -10 -12 -10 -10 -01
FR -18 -17 -12 -06 -01
HR -05 -07 -04 -05 -01
IT -10 -13 -10 -07 00
CY -10 -23 -23 -13 -32
LV -07 -05 -13 -03 00
LT -13 -12 -11 -11 -03
LU -26 -21 -18 -12 -03
HU -14 -18 -12 -12 -01
MT -26 -23 -20 -16 -05
NL -12 -17 -05 -04 00
AT -34 -38 -28 -13 -02
PL 00 00 00 00 00
PT -15 -23 -11 -15 -01
RO -05 -05 -04 -04 -02
SI 00 00 00 00 00
SK 00 00 00 00 00
FI -02 -04 -02 -03 -01
SE -15 -25 -14 -07 -04
UK -06 -09 -07 -06 -01
Note The change in poverty rates is the percentage point difference before and after the introduction of a minimum wage at 50 of average hourly earnings The poverty rate is the share of population (or population group) below that threshold The poverty threshold is at 60 of national household disposable equivalised income The reference group is households of employees who worked for 12 months full-time or 12 months part-time during the previous year
Source EUROMOD version G275+ running on EU-SILC 2012 data uprated to 2014 (except for France and Luxembourg EU-SILC 2010 data uprated to 2014) Figures on current monthly
minimum wages (in 2014) from Eurostat
The interaction between minimum wages income support and poverty
41
Table A18 Effects of a minimum wage at 50 of average hourly wages on
inequality 2014
change in inequality
Gini coefficient income quintile share ratio
(S80S20)
BE -02 -004
BG 00 000
CZ -04 -008
DK -03 -009
DE -04 -006
EE -06 -014
IE -02 -003
EL -04 -016
ES -05 -024
FR -05 -006
HR -01 -002
IT -01 -002
CY -07 -014
LV -02 -007
LT -05 -009
LU -05 -007
HU -06 -012
MT -05 -010
NL -02 -004
AT -07 -012
PL 00 000
PT -09 -018
RO -02 -005
SI 00 000
SK 00 000
FI -01 -002
SE -06 -007
UK -03 -006
Note The change in inequality is the difference in the index concerned before and after the introduction of a minimum wage at 50 of average hourly earnings The Gini coefficient ranges from 0 to 100 where 0 represents perfect equality in a given country and 100 represents the maximum level of inequality The income quintile share ratio (S80S20) is the ratio of the total income received by the 20 of the countryrsquos population with the highest disposable income (top
quintile) to that received by the 20 of the countryrsquos population with the lowest disposable income (bottom quintile) The reference group is households of employees who worked for 12 months full-time or 12 months part-time during the previous year Source EUROMOD version G275+ running on EU-SILC 2012 data uprated to 2014 (except for France and Luxembourg EU-SILC 2010 data uprated to 2014) Figures on current monthly minimum wages (in 2014) from Eurostat
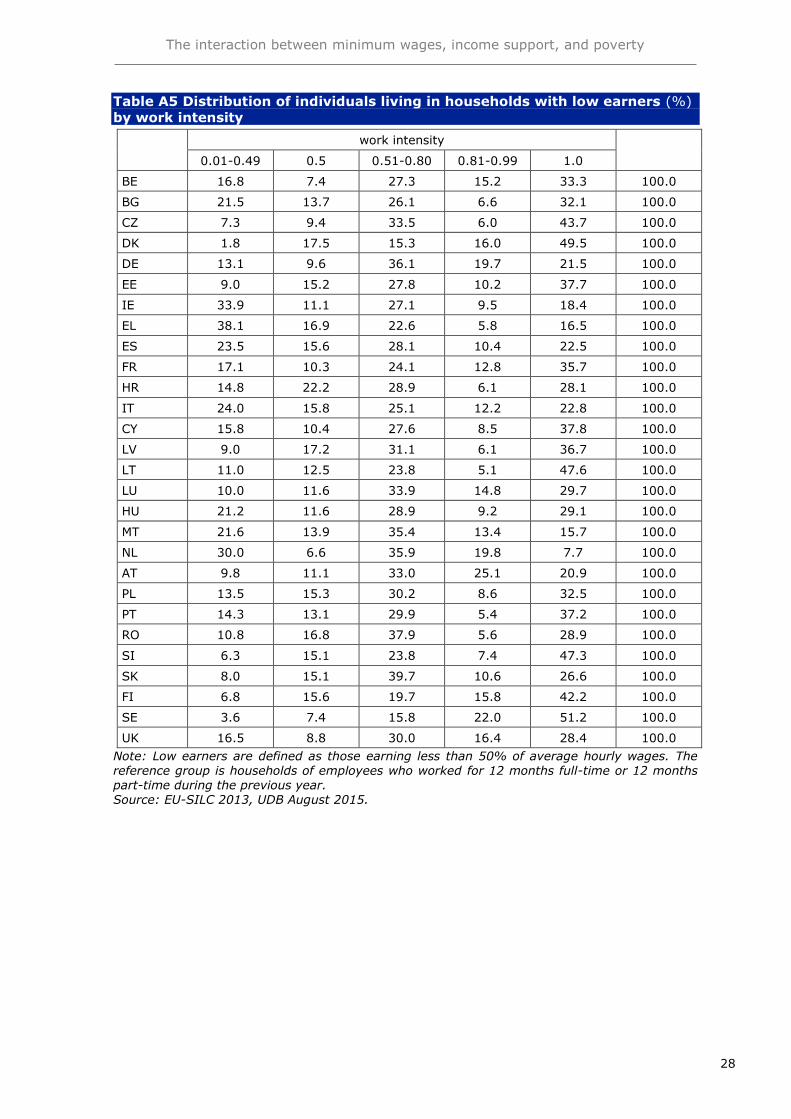
The interaction between minimum wages income support and poverty
29
Table A6 Distribution of individuals living in households with low earners ()
by household type
households with working-age head households with elderly
head total one or more
adult no
children
single adult with
children
two or more adults one
or two children
two or more adults three
or more children
BE 431 17 446 95 11 1000
BG 455 14 410 111 11 1000
CZ 584 08 356 38 14 1000
DK 460 00 335 186 18 1000
DE 549 23 366 54 08 1000
EE 510 10 383 41 56 1000
IE 395 34 480 78 12 1000
EL 609 03 336 19 33 1000
ES 499 19 421 50 11 1000
FR 443 22 431 92 12 1000
HR 393 05 495 81 27 1000
IT 514 18 380 69 20 1000
CY 496 05 435 50 15 1000
LV 497 27 387 68 21 1000
LT 409 27 459 91 14 1000
LU 344 24 475 148 09 1000
HU 475 10 417 93 05 1000
MT 397 28 528 35 12 1000
NL 551 17 359 67 05 1000
AT 393 17 500 77 13 1000
PL 423 05 472 87 14 1000
PT 380 11 573 28 09 1000
RO 363 03 562 72 00 1000
SI 369 09 522 94 06 1000
SK 514 07 433 31 15 1000
FI 528 37 306 117 12 1000
SE 315 23 505 145 12 1000
UK 421 48 398 97 37 1000
Note Low earners are defined as those earning less than 50 of average hourly wages The reference group is households of employees who worked for 12 months full-time or 12 months part-time during the previous year
Source EU-SILC 2013 UDB August 2015
The interaction between minimum wages income support and poverty
30
Table A7 At risk-of-poverty rate before and after social transfers ()
individuals living in households with low
earner(s) individuals living in all households with
head of working age
after social transfers
before social transfers
number of observations
after social transfers
before social transfers
number of observations
BE 139 388 413 142 293 12347
BG 281 465 982 189 319 10758
CZ 114 324 1688 91 223 16341
DK 168 325 477 119 233 11401
DE 194 358 3381 160 249 21428
EE 191 417 1999 172 277 12919
IE 74 460 1683 144 333 11313
EL 383 525 955 244 369 15473
ES 266 469 3271 213 369 28077
FR 243 509 1378 146 329 21871
HR 127 392 1328 183 309 12156
IT 310 477 3290 193 336 37058
CY 201 354 2546 152 271 11891
LV 216 453 2865 196 320 12681
LT 240 460 2427 202 337 10002
LU 313 593 1805 170 366 8836
HU 254 520 1258 156 377 22402
MT 173 339 1135 153 303 10554
NL 58 193 1630 111 243 20607
AT 145 380 1538 140 332 11165
PL 195 428 5093 180 337 32690
PT 199 393 2093 195 315 13916
RO 201 460 1271 233 368 15752
SI 96 466 2191 134 327 23665
SK 128 358 969 106 244 13769
FI 102 366 733 107 274 22741
SE 166 476 1230 140 266 12356
UK 166 416 3217 153 293 19220
Note Low earners are defined as those earning less than 50 of average hourly wages The reference group is households of employees who worked for 12 months full-time or 12 months part-time during the previous year Source EU-SILC 2013 UDB August 2015
The interaction between minimum wages income support and poverty
31
Table A8 At risk-of-poverty gap before and after social transfers ()
individuals living in households with low
earners individuals living in all households with
head of working age
after social transfers
before social transfers
after social transfers
before social transfers
BE 213 388 253 535
BG 341 427 372 451
CZ 148 309 247 352
DK 422 438 293 460
DE 207 410 244 446
EE 206 359 320 457
IE 219 420 246 491
EL 305 394 368 452
ES 275 403 353 509
FR 224 488 223 465
HR 264 338 324 427
IT 348 445 354 451
CY 222 435 216 381
LV 270 330 339 452
LT 237 391 304 481
LU 186 348 216 439
HU 216 421 255 457
MT 216 413 230 500
NL 151 328 228 492
AT 280 334 295 476
PL 222 331 276 431
PT 244 345 341 412
RO 315 360 377 445
SI 148 346 250 435
SK 214 337 304 409
FI 143 257 230 459
SE 283 410 288 444
UK 225 440 249 461
Note Low earners are defined as those earning less than 50 of average hourly wages The reference group is households of employees who worked for 12 months full-time or 12 months part-time during the previous year Source EU-SILC 2013 UDB August 2015
The interaction between minimum wages income support and poverty
32
Table A9 At-risk-of-poverty rate of households with low earners () by the
position of the low earner in the household
at-risk-of-poverty rate () number of observations
head on low wage
spouse (not
head) on
low wage
other member
(not head) on low wage
total head on low wage
spouse (not
head) on
low wage
other member
(not head) on low wage
total
BE 177 166 34 139 122 195 96 413
BG 471 178 166 283 361 370 244 976
CZ 139 82 188 114 419 977 292 1688
DK 413 05 00 174 192 126 142 460
DE 403 119 72 195 1044 1422 889 3355
EE 259 133 194 184 655 1018 268 1941
IE 108 65 36 74 655 585 443 1683
EL 534 310 299 378 309 256 383 948
ES 345 206 221 268 1341 1029 858 3228
FR 360 179 188 243 467 593 299 1360
HR 230 82 71 127 434 513 382 1328
IT 448 231 152 310 1529 814 938 3281
CY 343 210 52 201 892 759 895 2546
LV 235 165 240 216 1368 800 620 2787
LT 305 184 220 242 1059 1029 292 2379
LU 400 252 191 313 874 597 326 1798
HU 358 192 119 254 570 464 225 1258
MT 343 101 85 173 372 292 472 1135
NL 144 42 19 59 395 605 597 1598
AT 299 79 80 143 445 503 585 1533
PL 298 175 108 203 1906 1399 1486 4791
PT 247 161 179 199 814 839 414 2067
RO 239 156 216 201 465 480 326 1271
SI 148 61 96 96 701 1042 428 2171
SK 238 87 47 128 324 413 232 969
FI 170 56 00 103 350 272 107 728
SE 305 74 136 163 419 622 168 1209
UK 199 153 117 166 1359 1249 596 3204
Note Low earners are defined as those earning less than 50 of average hourly wages The
reference group is households of employees who worked for 12 months full-time or 12 months part-time during the previous year
Source EU-SILC 2013 UDB August 2015
The interaction between minimum wages income support and poverty
33
Table A10 At-risk-of-poverty rate of households with low earners () by
work intensity
at risk-of-poverty rate () number of observations
0-049 05-099 1 total 0-049 05-099 1 total
BE 383 72 46 139 100 175 137 413
BG 603 111 104 282 344 320 313 977
CZ 331 88 57 115 281 664 735 1681
DK 556 21 114 170 91 147 233 471
DE 345 132 199 194 764 1885 727 3377
EE 437 97 138 195 470 736 731 1938
IE 120 41 29 74 754 613 308 1675
EL 589 134 120 382 524 271 158 953
ES 402 188 163 266 1277 1256 734 3266
FR 462 190 131 243 378 507 492 1377
HR 288 33 32 127 491 464 373 1328
IT 517 172 173 310 1306 1218 742 3266
CY 369 93 188 201 664 917 960 2541
LV 457 148 119 218 742 1051 1040 2833
LT 551 236 93 242 563 696 1143 2403
LU 600 293 135 313 391 872 535 1798
HU 562 109 96 254 413 479 367 1258
MT 373 60 66 172 403 553 178 1134
NL 105 35 00 58 592 908 125 1625
AT 330 89 115 145 322 894 322 1537
PL 381 143 94 196 1462 1972 1650 5084
PT 453 114 96 200 571 737 775 2083
RO 421 172 37 201 351 553 367 1271
SI 270 63 39 96 469 685 1037 2191
SK 269 80 97 128 223 485 257 965
FI 154 94 81 102 164 260 309 733
SE 421 105 159 167 135 461 626 1222
UK 383 122 57 169 789 1447 888 3124 Note Low earners are defined as those earning less than 50 of average hourly wages The reference group is households of employees who worked for 12 months full-time or 12 months part-time during the previous year Source EU-SILC 2013 UDB August 2015
The interaction between minimum wages income support and poverty
34
Table A11 At-risk-of-poverty rate of households with low earners () by
number of children
at risk-of-poverty rate () number of observations in dataset
without children
with children
total without children
with children
total
BE 100 171 139 178 230 413
BG 185 367 281 446 525 982
CZ 121 108 114 987 678 1688
DK 98 235 168 220 249 477
DE 211 173 194 1854 1499 3380
EE 157 250 191 1019 868 1998
IE 60 85 74 665 997 1683
EL 333 490 383 582 342 955
ES 191 346 266 1632 1602 3270
FR 133 338 243 610 752 1378
HR 120 138 127 521 771 1328
IT 267 367 310 1682 1535 3281
CY 237 168 201 1262 1247 2546
LV 159 283 216 1424 1380 2865
LT 153 307 240 993 1400 2427
LU 223 361 313 614 1168 1798
HU 247 263 254 598 654 1258
MT 79 238 173 451 671 1135
NL 25 94 58 893 723 1625
AT 105 174 145 605 914 1538
PL 121 254 195 2152 2872 5093
PT 133 243 199 794 1281 2093
RO 105 256 201 461 810 1271
SI 98 96 96 809 1369 2191
SK 127 133 128 498 457 969
FI 75 136 102 387 337 733
SE 189 155 166 388 828 1230
UK 132 199 166 1354 1741 3213
Note Low earners are defined as those earning less than 50 of average hourly wages The reference group is households of employees who worked for 12 months full-time or 12 months part-time during the previous year Source EU-SILC 2013 UDB August 2015
The interaction between minimum wages income support and poverty
35
Table A12 Share of social benefits in total income of households with low
earners
old-age pensions
family benefits
unemployment
benefits
housing benefits
social assistance
other benefits
total social benefits
BE 3 6 4 0 0 3 15
BG 10 2 2 0 0 3 18
CZ 7 1 0 0 0 6 15
DK 1 2 5 0 0 5 14
DE 3 5 2 1 0 1 12
EE 10 3 0 0 0 5 19
IE 3 8 8 0 0 3 23
EL 14 1 1 0 0 1 16
ES 8 0 9 0 1 3 21
FR 9 4 5 2 1 1 22
HR 8 5 1 0 0 6 20
IT 8 2 5 0 0 2 17
CY 10 2 4 0 0 3 19
LV 11 2 1 0 0 4 18
LT 6 5 1 0 1 6 19
LU 5 9 2 1 1 2 21
HU 9 7 1 0 0 3 19
MT 5 3 0 0 2 2 12
NL 2 1 1 1 1 2 8
AT 4 6 2 0 0 2 14
PL 12 2 1 0 0 3 17
PT 9 2 3 0 0 2 16
RO 11 4 0 0 0 3 18
SI 3 14 1 0 1 8 27
SK 11 3 0 0 0 5 20
FI 3 4 3 1 0 3 13
SE 2 11 2 0 0 7 23
UK 6 5 1 1 1 2 16
Note Other benefits include sickness disability and education-related benefits Low earners are defined as those earning less than 50 of average hourly wages The reference group is households of employees who worked for 12 months full-time or 12 months part-time during the previous year Source EU-SILC 2013 UDB August 2015
The interaction between minimum wages income support and poverty
36
Table A13 National minimum wages vs 50 of average earnings 2014
average hourly
earnings (euro)
average monthly
earnings (euro)
50 of average
monthly earnings (euro)
national monthly
minimum wage (euro)
required increase
()
BE 1954 3480 1740 1502 16
BG 237 417 208 174 20
CZ 537 987 494 329 50
DK 2622 4524 2262
DE 1756 3506 1753
EE 592 1070 535 355 51
IE 2227 3854 1927 1462 32
EL 846 1457 729 684 7
ES 1079 1925 963 753 28
FR 1531 2511 1256 1445 -13
HR 506 908 454 406 12
IT 1370 2255 1128
CY 1155 2032 1016
LV 494 897 448 320 40
LT 407 716 358 290 24
LU 2687 4918 2459 1921 28
HU 317 562 281 328 -14
MT 960 1744 872 718 21
NL 2221 3964 1982 1490 33
AT 1900 3546 1773
PL 477 858 429 404 6
PT 742 1333 666 566 18
RO 230 414 207 198 5
SI 957 1688 844 789 7
SK 485 869 435 352 23
FI 2080 3620 1810
SE 2512 3596 1798
UK 1771 2766 1383 1303 6
Note The reference group is households of employees who worked for 12 months full-time or 12 months part-time during the previous year Source EUROMOD version G275+ running on EU-SILC 2012 data uprated to 2014 (except for France and Luxembourg EU-SILC 2010 data uprated to 2014) Figures on current monthly minimum wages (in 2014) from Eurostat
The interaction between minimum wages income support and poverty
37
Table A14 Distribution of workers affected by the increase in minimum wages
to 50 of average hourly earnings by level of increase ()
total
affected
increase in earnings to 50 of average earnings not affected
lt10 1001-20 2001-30 gt30
BE 40 16 04 05 16 960
BG 104 42 46 04 11 896
CZ 85 31 20 12 22 915
DK 61 10 10 09 31 939
DE 167 35 21 17 94 833
EE 176 36 41 31 68 824
IE 178 57 45 28 48 822
EL 116 35 23 20 38 884
ES 96 29 18 11 38 904
FR 77 15 10 06 47 923
HR 93 32 28 12 21 907
IT 113 18 15 10 70 887
CY 210 45 30 26 109 790
LV 220 46 52 38 83 780
LT 209 40 36 31 103 791
LU 183 57 48 34 44 817
HU 90 36 33 09 12 910
MT 93 34 25 07 27 907
NL 83 24 16 11 33 917
AT 131 28 16 13 73 869
PL 153 46 33 22 53 847
PT 173 50 48 22 53 827
RO 93 29 16 12 36 907
SI 86 28 12 05 41 914
SK 62 20 14 08 19 938
FI 42 16 08 06 13 958
SE 121 18 12 09 81 879
UK 188 60 43 19 66 812
Note The reference group is households of employees who worked for 12 months full-time or 12 months part-time during the previous year Source EUROMOD version G275+ running on EU-SILC 2012 data uprated to 2014 (except for France and Luxembourg EU-SILC 2010 data uprated to 2014) Figures on current monthly minimum wages (in 2014) from Eurostat
The interaction between minimum wages income support and poverty
38
Table A15 Poverty risk in households of low earners 2014
total earners
(1) low earners
(2)
of which in
poor households (3)
poverty rate of
low earners (4) = (3) (2)
low earners in poor households
as of all earners
(4) = (3) (1)
BE 3353261 134026 17970 134 05
BG 2362137 244588 63961 262 27
CZ 3331428 282085 29516 105 09
DK 1749226 106300 25224 237 14
DE 30271881 5068452 793234 157 26
EE 427162 75190 17895 238 42
IE 1164123 207729 17405 84 15
EL 2084532 242333 72889 301 35
ES 12258632 1177421 309078 263 25
FR 19911322 1535080 234136 153 12
HR 1063434 98966 12125 123 11
IT 15503093 1749434 488952 279 32
CY 284162 59795 10793 180 38
LV 628621 138371 27466 198 44
LT 928391 194150 37148 191 40
LU 184141 33673 6327 188 34
HU 2775484 250535 45132 180 16
MT 129372 12027 2446 203 19
NL 5544901 462701 60572 131 11
AT 2596626 341187 63808 187 25
PL 10166671 1558698 280035 180 28
PT 3303603 571146 80247 141 24
RO 6214151 580179 99679 172 16
SI 647095 55639 7210 130 11
SK 1807568 111931 21873 195 12
FI 1514848 63844 6723 105 04
SE 3232371 390717 64719 166 20
UK 22093617 4156506 633675 152 29
EU-28
155531853 19902703 3530237 177 23
Note Low earners are those earning less than 50 of average hourly wages The reference group is households of employees who worked for 12 months full-time or 12 months part-time during
the previous year The poverty threshold is at 60 of national household disposable equivalised income The poverty rate is the share of population (or population group) below that threshold Source EUROMOD version G275+ running on EU-SILC 2012 data uprated to 2014 (except for France and Luxembourg EU-SILC 2010 data uprated to 2014) Figures on current monthly minimum wages (in 2014) from Eurostat
The interaction between minimum wages income support and poverty
39
Table A16 Effects of a minimum wage at 50 of average hourly wages on at-
risk-of-poverty rates by gender 2014
change in at-risk-of-poverty rates
total men women
BE -08 -08 -08
BG 00 00 00
CZ -12 -11 -13
DK -06 -08 -04
DE -10 -09 -11
EE -18 -16 -19
IE -06 -06 -07
EL -11 -10 -11
ES -09 -08 -10
FR -11 -10 -11
HR -04 -04 -05
IT -08 -07 -08
CY -19 -14 -24
LV -03 -04 -03
LT -10 -10 -10
LU -16 -16 -16
HU -12 -12 -11
MT -18 -20 -17
NL -07 -09 -06
AT -22 -22 -22
PL 00 00 00
PT -13 -13 -12
RO -04 -04 -04
SI 00 00 00
SK 00 00 00
FI -02 -02 -03
SE -12 -11 -14
UK -06 -06 -05
Note The change in poverty rates is the percentage point difference before and after the introduction of a minimum wage at 50 of average hourly earnings The poverty rate is the share of population (or population group) below that threshold The poverty threshold is at 60 of national household disposable equivalised income The reference group is households of employees who worked for 12 months full-time or 12 months part-time during the previous year
Source EUROMOD version G275+ running on EU-SILC 2012 data uprated to 2014 (except for France and Luxembourg EU-SILC 2010 data uprated to 2014) Figures on current monthly
minimum wages (in 2014) from Eurostat
The interaction between minimum wages income support and poverty
40
Table A17 Effects of a minimum wage at 50 of average hourly wages on at-
risk-of-poverty rates by age 2014
change in at-risk-of-poverty rates
aged lt18 aged 18-29 aged 30-44 aged 45-64 aged 65+
BE -10 -19 -08 -04 00
BG 00 00 00 00 00
CZ -14 -17 -11 -14 -03
DK -02 -31 -01 -04 00
DE -08 -25 -09 -09 -03
EE -20 -20 -16 -25 -04
IE -05 -20 -02 -06 00
EL -12 -27 -10 -10 00
ES -10 -12 -10 -10 -01
FR -18 -17 -12 -06 -01
HR -05 -07 -04 -05 -01
IT -10 -13 -10 -07 00
CY -10 -23 -23 -13 -32
LV -07 -05 -13 -03 00
LT -13 -12 -11 -11 -03
LU -26 -21 -18 -12 -03
HU -14 -18 -12 -12 -01
MT -26 -23 -20 -16 -05
NL -12 -17 -05 -04 00
AT -34 -38 -28 -13 -02
PL 00 00 00 00 00
PT -15 -23 -11 -15 -01
RO -05 -05 -04 -04 -02
SI 00 00 00 00 00
SK 00 00 00 00 00
FI -02 -04 -02 -03 -01
SE -15 -25 -14 -07 -04
UK -06 -09 -07 -06 -01
Note The change in poverty rates is the percentage point difference before and after the introduction of a minimum wage at 50 of average hourly earnings The poverty rate is the share of population (or population group) below that threshold The poverty threshold is at 60 of national household disposable equivalised income The reference group is households of employees who worked for 12 months full-time or 12 months part-time during the previous year
Source EUROMOD version G275+ running on EU-SILC 2012 data uprated to 2014 (except for France and Luxembourg EU-SILC 2010 data uprated to 2014) Figures on current monthly
minimum wages (in 2014) from Eurostat
The interaction between minimum wages income support and poverty
41
Table A18 Effects of a minimum wage at 50 of average hourly wages on
inequality 2014
change in inequality
Gini coefficient income quintile share ratio
(S80S20)
BE -02 -004
BG 00 000
CZ -04 -008
DK -03 -009
DE -04 -006
EE -06 -014
IE -02 -003
EL -04 -016
ES -05 -024
FR -05 -006
HR -01 -002
IT -01 -002
CY -07 -014
LV -02 -007
LT -05 -009
LU -05 -007
HU -06 -012
MT -05 -010
NL -02 -004
AT -07 -012
PL 00 000
PT -09 -018
RO -02 -005
SI 00 000
SK 00 000
FI -01 -002
SE -06 -007
UK -03 -006
Note The change in inequality is the difference in the index concerned before and after the introduction of a minimum wage at 50 of average hourly earnings The Gini coefficient ranges from 0 to 100 where 0 represents perfect equality in a given country and 100 represents the maximum level of inequality The income quintile share ratio (S80S20) is the ratio of the total income received by the 20 of the countryrsquos population with the highest disposable income (top
quintile) to that received by the 20 of the countryrsquos population with the lowest disposable income (bottom quintile) The reference group is households of employees who worked for 12 months full-time or 12 months part-time during the previous year Source EUROMOD version G275+ running on EU-SILC 2012 data uprated to 2014 (except for France and Luxembourg EU-SILC 2010 data uprated to 2014) Figures on current monthly minimum wages (in 2014) from Eurostat
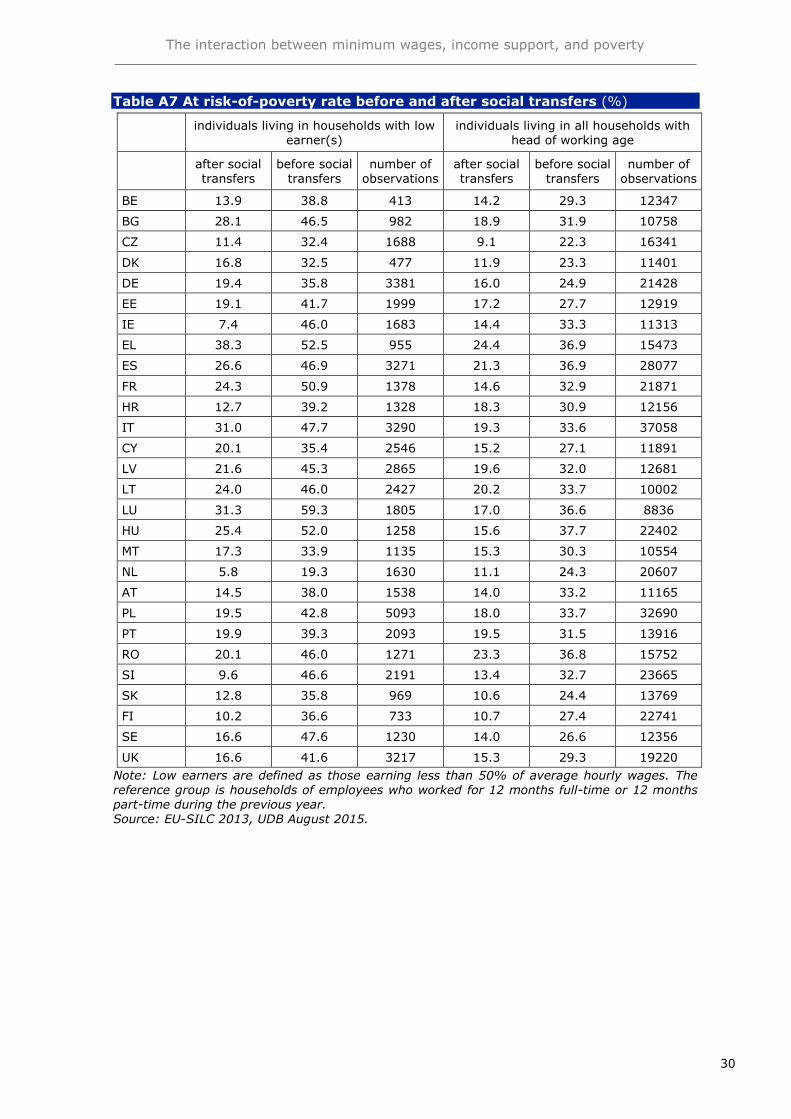
The interaction between minimum wages income support and poverty
36
Table A13 National minimum wages vs 50 of average earnings 2014
average hourly
earnings (euro)
average monthly
earnings (euro)
50 of average
monthly earnings (euro)
national monthly
minimum wage (euro)
required increase
()
BE 1954 3480 1740 1502 16
BG 237 417 208 174 20
CZ 537 987 494 329 50
DK 2622 4524 2262
DE 1756 3506 1753
EE 592 1070 535 355 51
IE 2227 3854 1927 1462 32
EL 846 1457 729 684 7
ES 1079 1925 963 753 28
FR 1531 2511 1256 1445 -13
HR 506 908 454 406 12
IT 1370 2255 1128
CY 1155 2032 1016
LV 494 897 448 320 40
LT 407 716 358 290 24
LU 2687 4918 2459 1921 28
HU 317 562 281 328 -14
MT 960 1744 872 718 21
NL 2221 3964 1982 1490 33
AT 1900 3546 1773
PL 477 858 429 404 6
PT 742 1333 666 566 18
RO 230 414 207 198 5
SI 957 1688 844 789 7
SK 485 869 435 352 23
FI 2080 3620 1810
SE 2512 3596 1798
UK 1771 2766 1383 1303 6
Note The reference group is households of employees who worked for 12 months full-time or 12 months part-time during the previous year Source EUROMOD version G275+ running on EU-SILC 2012 data uprated to 2014 (except for France and Luxembourg EU-SILC 2010 data uprated to 2014) Figures on current monthly minimum wages (in 2014) from Eurostat
The interaction between minimum wages income support and poverty
37
Table A14 Distribution of workers affected by the increase in minimum wages
to 50 of average hourly earnings by level of increase ()
total
affected
increase in earnings to 50 of average earnings not affected
lt10 1001-20 2001-30 gt30
BE 40 16 04 05 16 960
BG 104 42 46 04 11 896
CZ 85 31 20 12 22 915
DK 61 10 10 09 31 939
DE 167 35 21 17 94 833
EE 176 36 41 31 68 824
IE 178 57 45 28 48 822
EL 116 35 23 20 38 884
ES 96 29 18 11 38 904
FR 77 15 10 06 47 923
HR 93 32 28 12 21 907
IT 113 18 15 10 70 887
CY 210 45 30 26 109 790
LV 220 46 52 38 83 780
LT 209 40 36 31 103 791
LU 183 57 48 34 44 817
HU 90 36 33 09 12 910
MT 93 34 25 07 27 907
NL 83 24 16 11 33 917
AT 131 28 16 13 73 869
PL 153 46 33 22 53 847
PT 173 50 48 22 53 827
RO 93 29 16 12 36 907
SI 86 28 12 05 41 914
SK 62 20 14 08 19 938
FI 42 16 08 06 13 958
SE 121 18 12 09 81 879
UK 188 60 43 19 66 812
Note The reference group is households of employees who worked for 12 months full-time or 12 months part-time during the previous year Source EUROMOD version G275+ running on EU-SILC 2012 data uprated to 2014 (except for France and Luxembourg EU-SILC 2010 data uprated to 2014) Figures on current monthly minimum wages (in 2014) from Eurostat
The interaction between minimum wages income support and poverty
38
Table A15 Poverty risk in households of low earners 2014
total earners
(1) low earners
(2)
of which in
poor households (3)
poverty rate of
low earners (4) = (3) (2)
low earners in poor households
as of all earners
(4) = (3) (1)
BE 3353261 134026 17970 134 05
BG 2362137 244588 63961 262 27
CZ 3331428 282085 29516 105 09
DK 1749226 106300 25224 237 14
DE 30271881 5068452 793234 157 26
EE 427162 75190 17895 238 42
IE 1164123 207729 17405 84 15
EL 2084532 242333 72889 301 35
ES 12258632 1177421 309078 263 25
FR 19911322 1535080 234136 153 12
HR 1063434 98966 12125 123 11
IT 15503093 1749434 488952 279 32
CY 284162 59795 10793 180 38
LV 628621 138371 27466 198 44
LT 928391 194150 37148 191 40
LU 184141 33673 6327 188 34
HU 2775484 250535 45132 180 16
MT 129372 12027 2446 203 19
NL 5544901 462701 60572 131 11
AT 2596626 341187 63808 187 25
PL 10166671 1558698 280035 180 28
PT 3303603 571146 80247 141 24
RO 6214151 580179 99679 172 16
SI 647095 55639 7210 130 11
SK 1807568 111931 21873 195 12
FI 1514848 63844 6723 105 04
SE 3232371 390717 64719 166 20
UK 22093617 4156506 633675 152 29
EU-28
155531853 19902703 3530237 177 23
Note Low earners are those earning less than 50 of average hourly wages The reference group is households of employees who worked for 12 months full-time or 12 months part-time during
the previous year The poverty threshold is at 60 of national household disposable equivalised income The poverty rate is the share of population (or population group) below that threshold Source EUROMOD version G275+ running on EU-SILC 2012 data uprated to 2014 (except for France and Luxembourg EU-SILC 2010 data uprated to 2014) Figures on current monthly minimum wages (in 2014) from Eurostat
The interaction between minimum wages income support and poverty
39
Table A16 Effects of a minimum wage at 50 of average hourly wages on at-
risk-of-poverty rates by gender 2014
change in at-risk-of-poverty rates
total men women
BE -08 -08 -08
BG 00 00 00
CZ -12 -11 -13
DK -06 -08 -04
DE -10 -09 -11
EE -18 -16 -19
IE -06 -06 -07
EL -11 -10 -11
ES -09 -08 -10
FR -11 -10 -11
HR -04 -04 -05
IT -08 -07 -08
CY -19 -14 -24
LV -03 -04 -03
LT -10 -10 -10
LU -16 -16 -16
HU -12 -12 -11
MT -18 -20 -17
NL -07 -09 -06
AT -22 -22 -22
PL 00 00 00
PT -13 -13 -12
RO -04 -04 -04
SI 00 00 00
SK 00 00 00
FI -02 -02 -03
SE -12 -11 -14
UK -06 -06 -05
Note The change in poverty rates is the percentage point difference before and after the introduction of a minimum wage at 50 of average hourly earnings The poverty rate is the share of population (or population group) below that threshold The poverty threshold is at 60 of national household disposable equivalised income The reference group is households of employees who worked for 12 months full-time or 12 months part-time during the previous year
Source EUROMOD version G275+ running on EU-SILC 2012 data uprated to 2014 (except for France and Luxembourg EU-SILC 2010 data uprated to 2014) Figures on current monthly
minimum wages (in 2014) from Eurostat
The interaction between minimum wages income support and poverty
40
Table A17 Effects of a minimum wage at 50 of average hourly wages on at-
risk-of-poverty rates by age 2014
change in at-risk-of-poverty rates
aged lt18 aged 18-29 aged 30-44 aged 45-64 aged 65+
BE -10 -19 -08 -04 00
BG 00 00 00 00 00
CZ -14 -17 -11 -14 -03
DK -02 -31 -01 -04 00
DE -08 -25 -09 -09 -03
EE -20 -20 -16 -25 -04
IE -05 -20 -02 -06 00
EL -12 -27 -10 -10 00
ES -10 -12 -10 -10 -01
FR -18 -17 -12 -06 -01
HR -05 -07 -04 -05 -01
IT -10 -13 -10 -07 00
CY -10 -23 -23 -13 -32
LV -07 -05 -13 -03 00
LT -13 -12 -11 -11 -03
LU -26 -21 -18 -12 -03
HU -14 -18 -12 -12 -01
MT -26 -23 -20 -16 -05
NL -12 -17 -05 -04 00
AT -34 -38 -28 -13 -02
PL 00 00 00 00 00
PT -15 -23 -11 -15 -01
RO -05 -05 -04 -04 -02
SI 00 00 00 00 00
SK 00 00 00 00 00
FI -02 -04 -02 -03 -01
SE -15 -25 -14 -07 -04
UK -06 -09 -07 -06 -01
Note The change in poverty rates is the percentage point difference before and after the introduction of a minimum wage at 50 of average hourly earnings The poverty rate is the share of population (or population group) below that threshold The poverty threshold is at 60 of national household disposable equivalised income The reference group is households of employees who worked for 12 months full-time or 12 months part-time during the previous year
Source EUROMOD version G275+ running on EU-SILC 2012 data uprated to 2014 (except for France and Luxembourg EU-SILC 2010 data uprated to 2014) Figures on current monthly
minimum wages (in 2014) from Eurostat
The interaction between minimum wages income support and poverty
41
Table A18 Effects of a minimum wage at 50 of average hourly wages on
inequality 2014
change in inequality
Gini coefficient income quintile share ratio
(S80S20)
BE -02 -004
BG 00 000
CZ -04 -008
DK -03 -009
DE -04 -006
EE -06 -014
IE -02 -003
EL -04 -016
ES -05 -024
FR -05 -006
HR -01 -002
IT -01 -002
CY -07 -014
LV -02 -007
LT -05 -009
LU -05 -007
HU -06 -012
MT -05 -010
NL -02 -004
AT -07 -012
PL 00 000
PT -09 -018
RO -02 -005
SI 00 000
SK 00 000
FI -01 -002
SE -06 -007
UK -03 -006
Note The change in inequality is the difference in the index concerned before and after the introduction of a minimum wage at 50 of average hourly earnings The Gini coefficient ranges from 0 to 100 where 0 represents perfect equality in a given country and 100 represents the maximum level of inequality The income quintile share ratio (S80S20) is the ratio of the total income received by the 20 of the countryrsquos population with the highest disposable income (top
quintile) to that received by the 20 of the countryrsquos population with the lowest disposable income (bottom quintile) The reference group is households of employees who worked for 12 months full-time or 12 months part-time during the previous year Source EUROMOD version G275+ running on EU-SILC 2012 data uprated to 2014 (except for France and Luxembourg EU-SILC 2010 data uprated to 2014) Figures on current monthly minimum wages (in 2014) from Eurostat
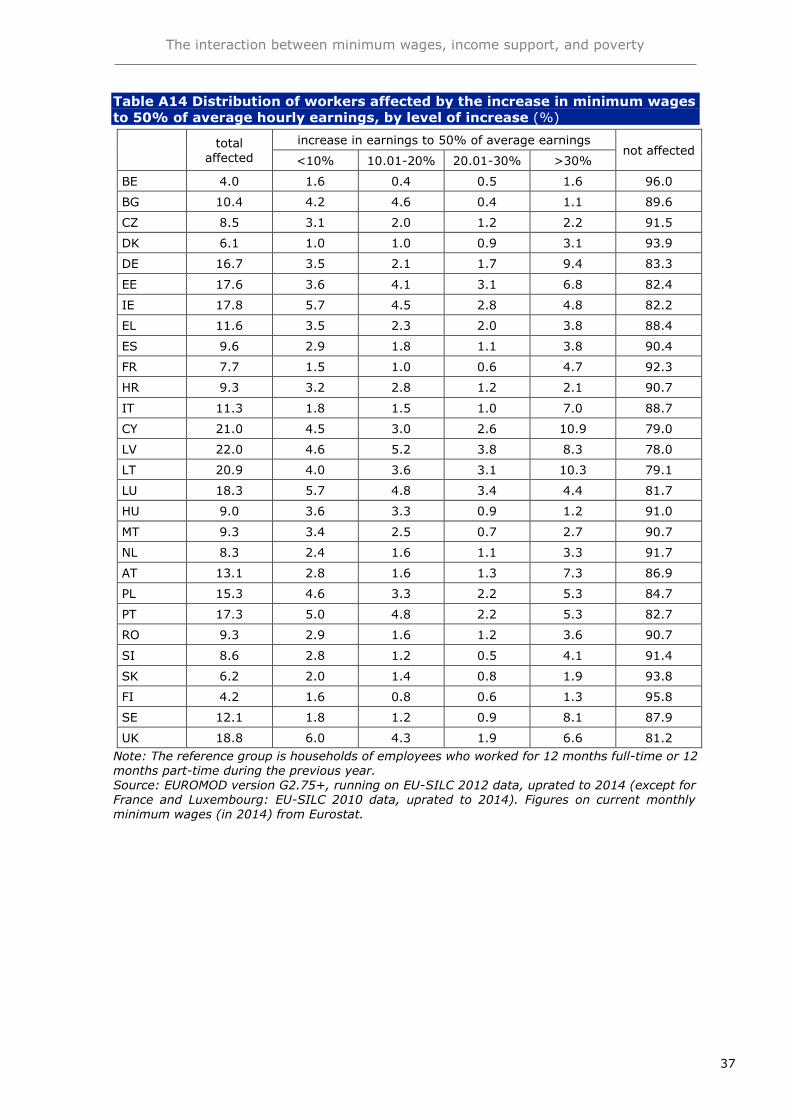
The interaction between minimum wages income support and poverty
39
Table A16 Effects of a minimum wage at 50 of average hourly wages on at-
risk-of-poverty rates by gender 2014
change in at-risk-of-poverty rates
total men women
BE -08 -08 -08
BG 00 00 00
CZ -12 -11 -13
DK -06 -08 -04
DE -10 -09 -11
EE -18 -16 -19
IE -06 -06 -07
EL -11 -10 -11
ES -09 -08 -10
FR -11 -10 -11
HR -04 -04 -05
IT -08 -07 -08
CY -19 -14 -24
LV -03 -04 -03
LT -10 -10 -10
LU -16 -16 -16
HU -12 -12 -11
MT -18 -20 -17
NL -07 -09 -06
AT -22 -22 -22
PL 00 00 00
PT -13 -13 -12
RO -04 -04 -04
SI 00 00 00
SK 00 00 00
FI -02 -02 -03
SE -12 -11 -14
UK -06 -06 -05
Note The change in poverty rates is the percentage point difference before and after the introduction of a minimum wage at 50 of average hourly earnings The poverty rate is the share of population (or population group) below that threshold The poverty threshold is at 60 of national household disposable equivalised income The reference group is households of employees who worked for 12 months full-time or 12 months part-time during the previous year
Source EUROMOD version G275+ running on EU-SILC 2012 data uprated to 2014 (except for France and Luxembourg EU-SILC 2010 data uprated to 2014) Figures on current monthly
minimum wages (in 2014) from Eurostat
The interaction between minimum wages income support and poverty
40
Table A17 Effects of a minimum wage at 50 of average hourly wages on at-
risk-of-poverty rates by age 2014
change in at-risk-of-poverty rates
aged lt18 aged 18-29 aged 30-44 aged 45-64 aged 65+
BE -10 -19 -08 -04 00
BG 00 00 00 00 00
CZ -14 -17 -11 -14 -03
DK -02 -31 -01 -04 00
DE -08 -25 -09 -09 -03
EE -20 -20 -16 -25 -04
IE -05 -20 -02 -06 00
EL -12 -27 -10 -10 00
ES -10 -12 -10 -10 -01
FR -18 -17 -12 -06 -01
HR -05 -07 -04 -05 -01
IT -10 -13 -10 -07 00
CY -10 -23 -23 -13 -32
LV -07 -05 -13 -03 00
LT -13 -12 -11 -11 -03
LU -26 -21 -18 -12 -03
HU -14 -18 -12 -12 -01
MT -26 -23 -20 -16 -05
NL -12 -17 -05 -04 00
AT -34 -38 -28 -13 -02
PL 00 00 00 00 00
PT -15 -23 -11 -15 -01
RO -05 -05 -04 -04 -02
SI 00 00 00 00 00
SK 00 00 00 00 00
FI -02 -04 -02 -03 -01
SE -15 -25 -14 -07 -04
UK -06 -09 -07 -06 -01
Note The change in poverty rates is the percentage point difference before and after the introduction of a minimum wage at 50 of average hourly earnings The poverty rate is the share of population (or population group) below that threshold The poverty threshold is at 60 of national household disposable equivalised income The reference group is households of employees who worked for 12 months full-time or 12 months part-time during the previous year
Source EUROMOD version G275+ running on EU-SILC 2012 data uprated to 2014 (except for France and Luxembourg EU-SILC 2010 data uprated to 2014) Figures on current monthly
minimum wages (in 2014) from Eurostat
The interaction between minimum wages income support and poverty
41
Table A18 Effects of a minimum wage at 50 of average hourly wages on
inequality 2014
change in inequality
Gini coefficient income quintile share ratio
(S80S20)
BE -02 -004
BG 00 000
CZ -04 -008
DK -03 -009
DE -04 -006
EE -06 -014
IE -02 -003
EL -04 -016
ES -05 -024
FR -05 -006
HR -01 -002
IT -01 -002
CY -07 -014
LV -02 -007
LT -05 -009
LU -05 -007
HU -06 -012
MT -05 -010
NL -02 -004
AT -07 -012
PL 00 000
PT -09 -018
RO -02 -005
SI 00 000
SK 00 000
FI -01 -002
SE -06 -007
UK -03 -006
Note The change in inequality is the difference in the index concerned before and after the introduction of a minimum wage at 50 of average hourly earnings The Gini coefficient ranges from 0 to 100 where 0 represents perfect equality in a given country and 100 represents the maximum level of inequality The income quintile share ratio (S80S20) is the ratio of the total income received by the 20 of the countryrsquos population with the highest disposable income (top
quintile) to that received by the 20 of the countryrsquos population with the lowest disposable income (bottom quintile) The reference group is households of employees who worked for 12 months full-time or 12 months part-time during the previous year Source EUROMOD version G275+ running on EU-SILC 2012 data uprated to 2014 (except for France and Luxembourg EU-SILC 2010 data uprated to 2014) Figures on current monthly minimum wages (in 2014) from Eurostat
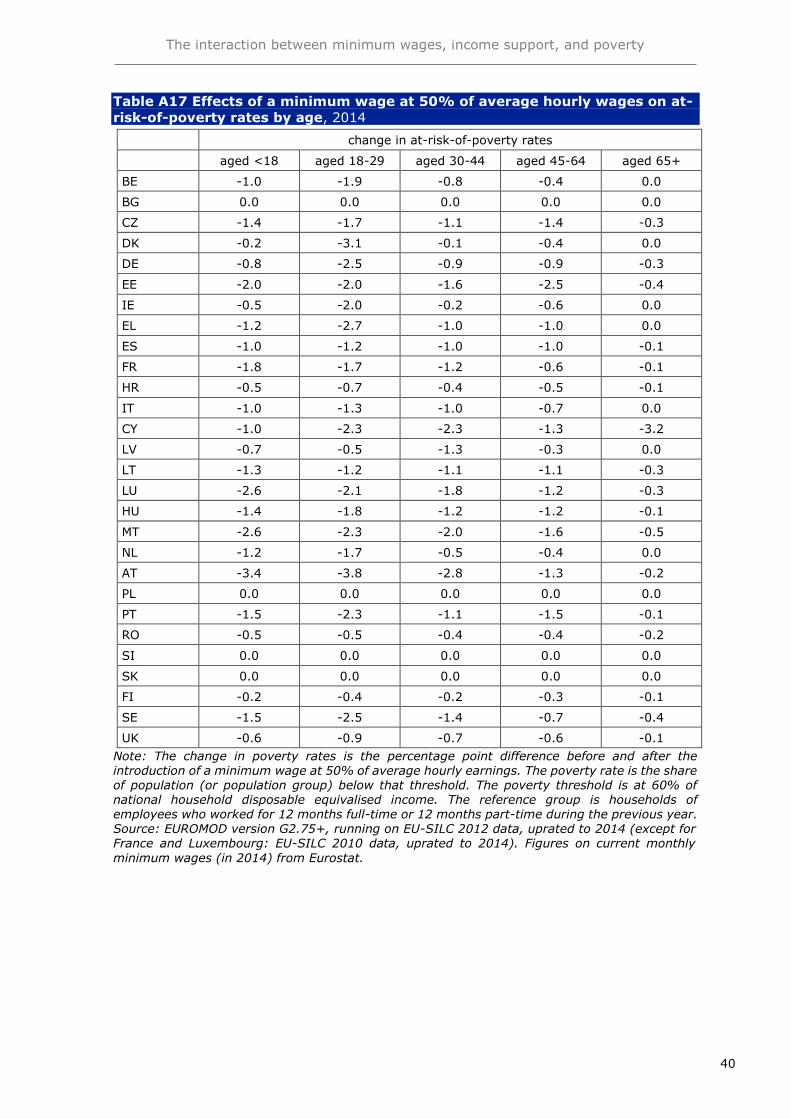
The interaction between minimum wages income support and poverty
41
Table A18 Effects of a minimum wage at 50 of average hourly wages on
inequality 2014
change in inequality
Gini coefficient income quintile share ratio
(S80S20)
BE -02 -004
BG 00 000
CZ -04 -008
DK -03 -009
DE -04 -006
EE -06 -014
IE -02 -003
EL -04 -016
ES -05 -024
FR -05 -006
HR -01 -002
IT -01 -002
CY -07 -014
LV -02 -007
LT -05 -009
LU -05 -007
HU -06 -012
MT -05 -010
NL -02 -004
AT -07 -012
PL 00 000
PT -09 -018
RO -02 -005
SI 00 000
SK 00 000
FI -01 -002
SE -06 -007
UK -03 -006
Note The change in inequality is the difference in the index concerned before and after the introduction of a minimum wage at 50 of average hourly earnings The Gini coefficient ranges from 0 to 100 where 0 represents perfect equality in a given country and 100 represents the maximum level of inequality The income quintile share ratio (S80S20) is the ratio of the total income received by the 20 of the countryrsquos population with the highest disposable income (top
quintile) to that received by the 20 of the countryrsquos population with the lowest disposable income (bottom quintile) The reference group is households of employees who worked for 12 months full-time or 12 months part-time during the previous year Source EUROMOD version G275+ running on EU-SILC 2012 data uprated to 2014 (except for France and Luxembourg EU-SILC 2010 data uprated to 2014) Figures on current monthly minimum wages (in 2014) from Eurostat
