the intensity of job search and search duration intensity of job search and search duration july...
TRANSCRIPT

FEDERAL RESERVE BANK OF SAN FRANCISCO
WORKING PAPER SERIES
The Intensity of Job Search and Search Duration
R. Jason Faberman Federal Reserve Bank of Chicago
Marianna Kudlyak
Federal Reserve Bank of San Francisco
July 2016
Working Paper 2016-13
http://www.frbsf.org/economic-research/publications/working-papers/wp2016-13.pdf
Suggested citation:
Faberman, R. Jason, Marianna Kudlyak. 2016. “The Intensity of Job Search and Search Duration.” Federal Reserve Bank of San Francisco Working Paper 2016-13. http://www.frbsf.org/economic-research/publications/working-papers/wp2016-13.pdf The views in this paper are solely the responsibility of the authors and should not be interpreted as reflecting the views of the Federal Reserve Bank of San Francisco or the Board of Governors of the Federal Reserve System. This paper was produced under the auspices of the Center for Pacific Basin Studies within the Economic Research Department of the Federal Reserve Bank of San Francisco.

The Intensity of Job Search and Search Duration
July 2016
R. Jason Faberman, Federal Reserve Bank of Chicago Marianna Kudlyak, Federal Reserve Bank of San Francisco
Abstract We use panel data on individual applications to job openings on a job search website to study search intensity and search duration. Our data allow us to control for the composition of job seekers and changes in the number of available job openings over the duration of search. We find that (1) the number of applications sent by a job seeker declines over the duration of search, and (2) longer-duration job seekers send relatively more applications per week throughout their entire search. The latter finding contradicts the implications of standard labor search models. We argue that these models fail to capture an income effect in search effort that causes job seekers with the lowest returns to search to exert the highest effort. We present evidence in support of this idea. Keywords: Job applications, vacancies, labor market search effort, search duration. JEL Codes: E24, J31, J24. Faberman: [email protected], Kudlyak: [email protected]. We thank Fabian Lange, Melinda Pitts, Andreas Mueller, Ija Trapeznikova, Paul Beaudry, Giuseppe Moscarini, seminar participants at Notre Dame, the Federal Reserve Bank of Kansas City, and the Federal Reserve Bank of Chicago, and participants at several conferences for helpful comments. The authors are thankful to Ann Macheras at the Federal Reserve Bank of Richmond and to Scott Hicks and Amanda Richardson at SnagAJob for providing access to the data and gratefully acknowledge their comments and suggestions. The views expressed here are of the authors and do not reflect the views of the Federal Reserve Bank of Chicago, the Federal Reserve Bank of San Francisco, or the Federal Reserve System.

1
1. Introduction
A large literature documents a negative relationship between unemployment duration and the
probability of finding a job (Jones, 1988; Machin and Manning, 1999; van den Berg and van Ours, 1996).
Variations in the search intensity of job seekers can be an important factor for explaining negative
duration dependence in job-finding probabilities.1 While there are models that incorporate a role for
search intensity, little empirical evidence exists on the relationship between search intensity and search
duration.
In this paper, we use a large, novel set of longitudinal micro data from an online job search engine to
examine the relationship between search intensity and search duration. Our data include all applications
made by job seekers to vacancies on the website at the daily frequency over one year. The data are
nationally representative and include basic information on the geography and characteristics of both job
seekers and vacancies.
Our findings are twofold. First, using the weekly number of applications sent on the engine as our
measure of search intensity, we find that an individual job seeker sends fewer applications per week as
search continues. Second, longer-term job seekers, on average, send relatively more applications per
week throughout the duration of their search spell. As such, controlling for unobservable job seeker
heterogeneity is critical to obtaining our first finding. Ignoring unobserved heterogeneity implies that the
average number of applications per week gradually increases after several weeks of search. These findings
are robust to a variety of controls, alternative subsamples of the data, and alternative specifications. The
findings also hold after controlling for proxy measures for a stock-flow matching process in search (e.g.,
1 Other causes proposed in the literature include models of unemployment duration as a signal of worker productivity (Blanchard and Diamond, 1994), models of unemployment duration as a stigma (Lockwood, 1991; and Pissarides, 1992; with empirical support by Addison and Portugal 1989; and Kroft, Lange, and Notowidigdo, 2013), and models of heterogeneity in the employability of job seekers (Hornstein, 2012).

2
as in Coles and Smith, 1998), albeit to a weaker degree. The findings also hold for a subsample of job
seekers that we identify as potentially finding a job through the website. Specifically, these are individuals
whose search spell ends with an application to a vacancy that expires during the same week.
Our finding that longer-duration job seekers exert the most search effort is a novel finding and it
contradicts standard models of labor market search. These models imply that higher search intensity
corresponds to a higher job-finding rate and thus shorter search spells. We argue that the higher search
effort of long-duration job seekers over the entire search spell is evidence of a dominant income effect in
search effort. Labor search models that include any notion of search intensity usually have no income
effect. Therefore, in a standard search model with endogenous search effort, such as Pissarides (2000),
job seekers with a lower expected return to searching exert lower effort. We show that one can consider
the choice of search effort as analogous to the choice of labor supply in a standard household model of
consumption and leisure. In such a setting, the implication of a standard search model is a substitution
effect in search effort — lower expected returns to search reduce the implicit price of leisure, leading to
lower search effort. We show that if there is curvature in a job seeker’s utility with respect to
consumption, or if there are complementarities between consumption and leisure, there will be both a
substitution effect and an income effect. The income effect makes the job seeker feel “richer” in response
to a rise in the expected returns to search. This causes the job seeker to cut back on her search effort and
consume more leisure. If the curvature of the utility function or the complementarity between
consumption and leisure are sufficiently strong, the income effect will dominate. If this holds in the cross-
section, then those with the lowest returns to search should feel “poorer” relative to other job seekers
and therefore exert relatively higher search effort.
We present evidence to support the argument of a dominant income effect in search effort. First, we
show that longer-duration job seekers tend to be older, male, non-employed job seekers who have

3
separated from a long-tenured job. The literature on job displacement (e.g., Jacobson, LaLonde, and
Sullivan, 1993; Couch and Placzek, 2010; Davis and von Wachter, 2011, among others) suggests that these
are precisely the people who face the poorest job prospects following a job loss. Next, we confirm that
these individuals send more applications per week regardless of their ultimate search outcome and
controlling for a variety of other factors. Conversely, those looking for work while employed at relatively
stable (i.e., long-tenured) jobs, send relatively fewer applications per week. Finally, job seekers in weaker
local labor markets, measured either using the local unemployment rate or the ratio of active vacancies
to job seekers on the website, send more applications per week throughout the duration of their search.
All findings are consistent with a dominant income effect in search effort, whereby job seekers exert more
effort when their job-finding prospects are poorer. We argue that this should be an integral part of search
models that incorporate some notion of search intensity going forward.
Our paper contributes to the literature that studies the relationship between job seeker search
behavior and job-finding outcomes. Of these, our paper is related to research on unemployment
insurance recipients in New Jersey by Krueger and Mueller (2011). Krueger and Mueller also find that
search effort declines with search duration, though they are only focused on the unemployed, while we
also have job search by employed individuals.2 It is worth noting that the decline in search effort is
consistent with the declining reservation wage found by Brown, Flinn, and Schotter (2011) and
characterized theoretically by Salop (1973). More broadly, our work is related to studies that examine the
relationship between the job-finding rate and unemployment duration. The salient finding among these
studies is the presence of negative duration dependence for the exit rate from unemployment. Our work
is also related to models of labor market search that allow for a notion of search intensity (Costain, 1997;
2 Due to the nature of their survey, Krueger and Mueller only follow a cohort of respondents for up to 12 weeks, staggered throughout their search spells. Consequently, they cannot speak to our finding of consistently higher search effort among those with longer completed spells.

4
Pissarides, 2000; Shimer, 2004; Christiansen et al., 2005; among others). Finally, our paper is related to
the growing literature that studies online job search (e.g., Kuhn and Skuterud, 2004; Kroft and Pope, 2014;
Brown and Matsa, 2012; Kudlyak, Lkhgvasuren, and Sysuyev, 2013; Marinescu and Wolthoff, 2015), and
to the literature that studies hiring and vacancies (Barron, Bishop, and Dunkelberg, 1985; Holzer, Katz,
and Krueger, 1991; Davis, Faberman, and Haltiwanger, 2013).
The rest of the paper is structured as follows. Section 2 describes the data, measurement, and
identification and provides some basic evidence on job seekers and vacancies on the website. Section 3
presents our results on application behavior over the duration of search. Section 4 presents our findings
showing that longer-duration job seekers send more applications throughout their search. Section 5
provides a mechanism to rationalize our empirical finding and presents evidence in support of a dominant
income effect in search effort. Section 6 presents robustness exercises using our sample of job seekers
who were potentially hired through the website, and Section 7 concludes.
2. Data and Measurement
2.A. Data and Sample
We use proprietary data from SnagAJob, an online private job search website. Job seekers browse
information on the website at no cost. To apply to a job posting (vacancy), a job seeker must register with
the website. Registration is free. At registration, job seekers provide their basic demographic and
geographic information. They can also create a profile that contains their self-reported employment
history. Once registered, job seekers can apply for posted job openings on the website by clicking an
application link associated with the online job posting.

5
Employers pay a fee to post vacancies on a per-period rather than a per-vacancy basis.3 Each
vacancy posting contains basic information on the geographic location and sector of the job. Postings also
contain a general description of job duties that can vary widely in its detail on skills required,
compensation offered, etc., though the dataset that we obtain from SnagAJob does not contain this
information. Most job postings on the website provide at least basic information on job duties (including
a job title or occupation), skills requirements, and hours, i.e., whether the job is full-time or part-time.
Listed skill requirements can vary from detailed education, experience, and certification requirements to
generic statements.
An important feature of the SnagAJob website is that its vacancies are predominantly hourly paid
jobs. Hourly jobs tend to be lower-skilled jobs and concentrated in services. These jobs have been growing
in importance and constitute a major part of the U.S. labor market (Autor, Katz, and Kearny, 2008;
Acemoglu and Autor, 2011). In the online appendix and in a related review article (Faberman and Kudlyak,
2016), we show that the composition of job seekers on the website is comparable to the composition of
the unemployed in the Current Population Survey (CPS), though the young and less-educated are
somewhat over-represented. We also show that the use of online job search is much more pervasive than
it was just a decade ago, and its effectiveness for job finding has increased as well.4 Thus, subject to the
noted differences in demographics and the types of jobs on the SnagAJob website, our results are
generalizable to a broader notion of job search during our sample period.
Our dataset contains daily micro data on all applications sent on the website between September
2010 and September 2011, including detailed information on both applicants and vacancies during this
period. The dataset contains basic demographic information for each job seeker and the zip code of their
3 Employers also have the option to post a vacancy for free for up to 10 days, though this option does not provide additional services, such as a simple screen, that the paid vacancies provide. 4 In addition, see Kuhn and Mansour (2014) who have similar findings, and Kuhn and Skuterud (2004) for earlier research on online job search.
6
residence. For vacancies, the dataset contains their location by zip code and the website’s classification
of each vacancy’s occupation. The SnagAJob occupation classification is actually an amalgamation of
industry and occupation (e.g., Construction is an “occupation” in our data). The occupation classification
is job-specific, so a sales position for a construction firm is listed as part of Sales and Marketing rather
than Construction.
The dataset also contains information on self-reported employment histories for most job
seekers. The employment history is a set of one or more jobs, with an entry for each job that includes its
start date, end date (or whether it is a current job), job title (i.e., occupation), employer, and type of job
(i.e., temporary, seasonal, part-time, etc.). We use the employment records to identify the employment
status of job seekers with at least one job record and to obtain information on their main job (i.e., their
current job if employed, or their most recent job if non-employed). This information includes the job
seeker’s tenure on either their current or most recent job, whether that job was part-time or full-time,
whether it was a temporary or seasonal job, whether the job seeker is (was) self-employed, and whether
the job-seeker is a multiple-jobholder. We detail these histories and how we use them to classify
individuals as either employed or non-employed in the data appendix. We are able to match 72.3 percent
of the job seekers in our sample to their employment history. Of these, our methodology identifies 33
percent of them as employed at the start of their search on the website.
The dataset does not contain information on the outcome of a job seeker’s application (i.e.,
whether the job seeker was contacted for an interview, hired, etc.), nor does it contain any information
on a job seeker’s job search effort outside of the website. We can, however, identify the first and last day
that an applicant applied to any position on the website within our sample period. As a robustness check
of our analysis, we attempt to identify potential hires as instances when an individual’s search spell ends
with an application to a vacancy that disappears from the website during the same week.

7
We restrict our attention to job seekers who registered on the website after the start of our
sample. We aggregate the daily application observations to the weekly interval, and allow for the fact that
some job seekers send no applications during a given week.5 The resulting sample has 10.11 million job
seeker-week observations, which represents 17.26 million applications to 1.41 million vacancies by 4.77
million job seekers. We provide more detail on how we assemble our data sample in the data appendix.
2.B. Measuring Job Search Spells and Local Vacancies
Identifying the current and completed duration of a job seeker’s search spell is crucial to our
analysis. We define an individual’s first search spell on the website as the period between their first
application date and any application date that is followed by more than five weeks of inactivity. We
consider an application after the five-week inactivity cutoff to be the beginning of a new search spell. The
five-week rule is roughly consistent with the notion of unemployment in the CPS, whereby an individual
is counted as unemployed if he/she has been actively searching for work within the past four weeks.6 For
reasons detailed in the online appendix and data appendices, we focus our analysis on the first identified
search spell.7
In the analysis, we control for the number of active vacancies in the job seeker’s labor market.
We define a job seeker’s labor market as her metropolitan area of residence. We restrict our sample to
applicants within 318 Core-Based Statistical Areas (CBSAs) that represent all U.S. metropolitan areas
except the smallest Micropolitan Statistical Areas. We count a vacancy as “active” during the period
between its first and last application received, i.e., the vacancy’s duration. Note that this approach allows
5 Job seekers typically send applications at seven-day intervals in the data (see Kudlyak, Lkhagvasuren, and Sysuyev (2012) for more details. 6 In the online appendix, we provide results using alternate cutoffs for identifying spell length. Because of the prevalence of long periods of inactivity, different cutoffs can produce different patterns for the relationship between search effort and search duration. We show that our results carry through once we add the controls used in our main analysis. 7 About 83 percent of job seekers have only one search spell. In fact, 66.4 percent of job seekers are observed on the website for one week or less and 40.3 percent of job seekers are observed applying to only one job.

8
us to distinguish between new and existing vacancies, which we exploit in our analysis. The dating method
also creates a censoring issue for vacancies that were potentially active before or after the sample period
under the study. To account for this, we condition out calendar week means from all vacancy statistics.
2.C. Descriptive Evidence
Table 1 provides descriptive statistics of the data. On average, a job seeker sends 1.9 applications
per week. The completed search spell lasts just over two weeks in the full sample, and 5.4 weeks in the
sample restricted to search spells that last longer than one week. Women tend to send slightly more
applications per week than men. The number of applications sent per week declines and the length of
completed search spells increases with age. The data do not show discernible patterns in applications or
search duration across education groups or by race, though nonwhites appear to send somewhat more
applications and spend somewhat more time per week on the website. Just under 95 percent of
applications are sent to vacancies within the job seekers’ own metropolitan area. In the sample of search
spells that last longer than a week, just over 60 percent of applications are sent to a job seeker’s modal
occupation, which is defined as the broad occupation they apply to most often during their tenure on the
website (including subsequent search spells after the first).8 Just under 14 percent of applications are sent
to newly-posted vacancies (i.e., vacancies that were posted in the same week that a job seeker applied to
it). There is surprisingly little variation in the share of applications to jobs outside of the job seekers’ own
metropolitan areas or outside of their modal occupation. Men, older workers, and more-educated
workers are more likely to apply to newly posted vacancies.
Table 2 reports the composition and basic characteristics of the vacancies in the sample. Retail
jobs are the most plentiful, accounting for 44.6 percent of all vacancies. They are followed by Food and
Restaurant jobs (16.2 percent) and Customer Service jobs (8.8 percent). These shares are
8 Just over 10 percent of job seekers have no modal occupation.

9
disproportionately higher than the employment shares of comparable occupations in the Occupational
Employment Statistics Survey and of comparable industries in the Current Employment Statistics. The
average vacancy receives 31 applications and is active in our sample for 6.5 weeks. There is large variation
in the number of applications per week across industries, from 1.2 per week for Management positions
to 9.5 per week in Warehousing positions.9
3. Individual Application Behavior over the Duration of Job Search
We now turn to the analysis of individual application behavior over the duration of job search.
This section contains our first main empirical result: that the number of individual applications declines
over the course of job search.
3.A. Applications per Week over the Duration of Job Search
The main focus of our analysis is a job seeker’s search behavior over the course of job search. We illustrate
this behavior by estimating the relationship between the number of applications that a job seeker sends
in each week and the number of weeks since the beginning of the job seeker’s search spell.
In the analysis, it is important to control for job seeker heterogeneity in search intensity. That is,
job seekers might differ in their average search intensity. If such heterogeneity is correlated with the total
duration of an individual’s job search in a systematic manner, then our estimates of the average number
of applications sent per week will change with duration of search, even if individual search intensity does
not vary. The longitudinal nature of our data allows us to control for individual heterogeneity in
application behavior over the course of job search.
9 In the online appendix, we also show that there is considerable dispersion in how long a vacancy is active on the website.

10
We estimate the following model, which controls for unobserved heterogeneity in job seeker
application behavior,
(1) 𝐴𝐴𝑖𝑖𝑖𝑖𝑖𝑖(𝑡𝑡) = 𝑑𝑑(𝑡𝑡) + 𝛼𝛼𝑖𝑖 + 𝛾𝛾𝑖𝑖 + 𝜂𝜂𝑇𝑇(𝑡𝑡) + 𝜂𝜂6(𝑡𝑡) + 𝜆𝜆𝑖𝑖 + 𝜀𝜀𝑖𝑖𝑖𝑖(𝑡𝑡).
For job seeker 𝑖𝑖 in metropolitan area 𝑗𝑗 who is 𝑡𝑡 weeks into her job search spell that started in calendar
week 𝜏𝜏, the model regresses total applications sent during the week, 𝐴𝐴𝑖𝑖𝑖𝑖𝑖𝑖(𝑡𝑡), on a set of dummy variables
for the current duration of search (in weeks), 𝑑𝑑(𝑡𝑡). The model controls for the fixed effect of the job
seeker’s metropolitan area, 𝛼𝛼𝑖𝑖 , the calendar week of a spell’s start, 𝛾𝛾𝑖𝑖 , an indicator for whether the
observation represents the last week of the spell, 𝜂𝜂𝑇𝑇(𝑡𝑡), where 𝑇𝑇 denotes the total length of the spell,
and an indicator for whether the observation represents the last week of the spell that lasted exactly six
weeks, 𝜂𝜂6(𝑡𝑡).10 We refer to these controls as the baseline controls. The latter two variables account for
the fact that, by construction, a search spell ends with at least one application, which produces a spike in
the number of applications sent during the last week of search, and that spells that last exactly six weeks
may have a disproportionately higher spike since they fall just within the bounds of the five-week inactivity
cutoff that we use to define spell length. We control for fixed job seeker characteristics with job seeker
fixed effects, 𝜆𝜆𝑖𝑖. In the results that follow, we report the estimated application-duration relationship, i.e.,
the �̂�𝑑(𝑡𝑡) coefficients, conditional on these controls.11
In Figure 1, we show the average number of applications per week by weeks spent searching for
job. We show this for two specifications: one that includes only the baseline controls and one that includes
the baseline controls plus observable job seeker characteristics (sex, a quadratic in age, fixed effects for
four educational categories and four race categories, and an indicator for whether the job seeker had any
10 These controls address the fact that our identification approach for the end date of a search spell creates a small spike in applications in the sixth week. Excluding these controls does not affect the reported estimates of the baseline specification in any other way. 11 Throughout the analysis, we report confidence intervals based on robust standard errors clustered by metropolitan area.

11
subsequent search spells) in lieu of 𝜆𝜆𝑖𝑖. Neither specification controls for individual-specific fixed effects in
search. The first specification suggests that job seekers, on average, send about 2.3 applications in their
first week of search. The number of applications falls to about 1.2 per week by the fourth week of search
but then slowly rises. After six months of search, job seekers on average send about 1.5 applications per
week. The second specification suggests that adding controls for observable job seeker characteristics
does not change the results.
In Figure 2, we present the results of estimating the full model specified in (1), which includes the
job-seeker fixed effects. These will account for both observable and unobservable job seeker
characteristics that can affect application behavior. Consider, for example, the case where job seekers
send a constant number of applications throughout their search but some job seekers send consistently
more applications each period than others. If the number of applications sent is positively correlated with
exit from job search, then our estimates of applications sent per week will decline over the duration of
job search even though individual job seekers do not alter their search intensity over time. Heterogeneity
in job seeker application behavior can occur for several reasons. For example, job seekers may differ in
their reservation value for accepting a job offer. Job seekers may also differ in their employability. Less-
employable job seekers may realize their poor hiring prospects and adjust their search effort accordingly.
Finally, job seekers may differ in their search efficiency or, more broadly, in how much they target their
job search. All of these factors can affect application behavior, and will be picked up by the job seeker
fixed effects, providing us with the within-job seeker relationship between applications per week and
search duration.12
Figure 2 shows the estimates for the baseline model from Figure 1 and the estimation of (1) using
job-seeker fixed effects. Once we control for fixed job seeker characteristics, the declining relationship
12 By construction, job seekers active for only one week do not contribute to the identification in this case.
12
between applications and the duration of search steepens. It still exhibits a steep decline after the first
week, from 2.9 to 0.8 applications per week, on average, but continues to decline thereafter, to an
average of just 0.1 application per week after six months of search. This in contrast to the results that do
not control for unobserved heterogeneity (Figure 1), in which case the average number of applications
begins to rise after several weeks of search. The estimates in Figure 2 suggest that accounting for
unobserved job seeker heterogeneity is important, but doing so actually steepens the negative
relationship between search effort and search duration.
3.B. Controlling for the Length of Completed Search Spell
When we include job seeker fixed effects, the average number of applications over the course of
job search go from being upward sloping in later weeks to being downward sloping throughout. Therefore,
it must be the case that unobserved individual heterogeneity is related to the total duration of job search.
There are economic reasons that reconcile this relationship. For example, individuals who exert
consistently lower effort, or are less employable (for whatever reason), or are less efficient in their search,
all else equal, should take longer to find a job. Consequently, controlling for the length of a job seeker’s
completed spell should account for at least some portion of the unobserved heterogeneity captured by
job seeker fixed effects.
We thus proceed by estimating models in a version of equation (1) with controls for the duration
of the completed search spell instead of the controls for individual-specific fixed effect, i.e.,
(2) 𝐴𝐴𝑖𝑖𝑖𝑖𝑖𝑖(𝑡𝑡) = 𝑑𝑑(𝑡𝑡) + 𝛼𝛼𝑖𝑖 + 𝛾𝛾𝑖𝑖 + 𝜂𝜂𝑇𝑇(𝑡𝑡) + 𝜂𝜂6(𝑡𝑡) + 𝑋𝑋𝑖𝑖𝜃𝜃 + 𝛿𝛿𝑇𝑇 + 𝜀𝜀𝑖𝑖𝑖𝑖(𝑡𝑡).
where the fixed effect for the length of each job seeker’s completed spell is 𝛿𝛿𝑇𝑇 and the observable job
seeker characteristics are 𝑋𝑋𝑖𝑖. The point of the exercise is to see how much of the effect of fixed job seeker
characteristics on the application-duration relationship is captured by completed spell length fixed effects.
That is, we want to see how much of the decline in the application-duration relationship caused by

13
inclusion of job seeker fixed effects is due to differences in effort, employability, search efficiency, and
any other factor that would affect the length an individual’s job search spell.
Our third specification in Figure 2 shows that we obtain identical results when we control for
completed spell length and instead control for job seeker fixed effects. The results suggest that completed
spell length is a sufficient statistic for the unobserved heterogeneity that affects the application-duration
relationship. We explore the factors that drive this finding further in Sections 4 and 5 below.
3.C. Controlling for the Local Stock and Flow of Vacancies
We conclude this section with an examination of whether a stock-flow process of job search can
account for the declining search effort estimated in Figure 2. The number of applications that an individual
sends may decline over the course of his search simply because the pool of vacancies relevant to the job
seeker shrinks over the duration of search. In stock-flow models of labor market search (Coles and Smith,
1998; Ebrahimy and Shimer, 2010), job seekers search over the full pool of available vacancies when they
begin their search (i.e., the “stock”). If job seekers do not find a job from the initial stock of vacancies,
they subsequently only search over newly-posted vacancies (i.e., the “flow”). Consequently, stock-flow
models predict that applications per week should drop precipitously after the first week of search and
remain roughly constant thereafter (assuming a roughly constant arrival rate of new vacancies).
Figure 2 shows a discontinuous drop in the number of applications after the first week of search
and a steady decline afterwards, consistent with the implications of a stock-flow model. Since we have
detailed data on the timing of applications to all vacancies on the website, we can construct measures of
the stocks of total and newly-posted vacancies within each metropolitan area during each calendar week
of the sample, as well as the duration of each vacancy on the website. These measures allow us to estimate
the effect that a stock-flow process of job search may have on the relation between application behavior

14
and search duration. We add these measures to our model in equation (2) in two ways. The first is a more
restrictive interpretation of stock-flow matching. The specification is as follows,
(3) 𝐴𝐴𝑖𝑖𝑖𝑖𝑖𝑖(𝑡𝑡) = 𝑑𝑑(𝑡𝑡) + 𝛼𝛼𝑖𝑖 + 𝛾𝛾𝑖𝑖 + 𝜂𝜂𝑇𝑇(𝑡𝑡) + 𝜂𝜂6(𝑡𝑡) + 𝑋𝑋𝑖𝑖𝜃𝜃 + 𝛿𝛿𝑇𝑇 + 𝛽𝛽0 ln𝑣𝑣𝑖𝑖𝑓𝑓(𝑡𝑡) + 𝛽𝛽1 ln 𝑣𝑣𝑖𝑖𝑠𝑠(𝑡𝑡)
+𝛽𝛽2𝑑𝑑(1) ∙ ln𝑣𝑣𝑖𝑖𝑠𝑠(𝑡𝑡) + 𝜀𝜀𝑖𝑖𝑖𝑖(𝑡𝑡).
where we control for active vacancies within a job seeker’s metropolitan area using the (log) number of
vacancies newly posted during the week (i.e., the flow), 𝑣𝑣𝑖𝑖𝑓𝑓(𝑡𝑡), the (log) number of incumbent vacancies
that existed prior to the week and remain active (i.e., the stock), 𝑣𝑣𝑖𝑖𝑠𝑠(𝑡𝑡), and the (log) number of incumbent
vacancies interacted with an indicator for the first week of search.13 In equation (3), a stock-flow search
process would imply that �̂�𝛽1 = 0 , with �̂�𝛽0 ≥ 0 and �̂�𝛽2 ≥ 0 . In other words, the initial stock and
subsequent flow of new vacancies may matter, but the subsequent stocks of pre-existing vacancies should
not matter. In contrast, a search process where the full stock of vacancies is sampled each period would
imply that �̂�𝛽2 = 0 . That is, both the stock and flow matter each period, so there is no additional
explanatory power from the initial stock of vacancies.
We can also estimate a broader interpretation of stock-flow matching. In the following
specification, we test the less restrictive implication that the average duration of the vacancies a job
seeker applies to should fall over time. Consequently, we replace the measures of new and existing
vacancies with the average duration of vacancies applied to, �̅�𝑣𝑖𝑖(𝑡𝑡). Since the measure requires individuals
to apply to at least one vacancy in each period, we estimate the following specification on the subset of
job seeker-week observations with at least one application sent,
(3′) 𝐴𝐴𝑖𝑖𝑖𝑖𝑖𝑖(𝑡𝑡) = 𝑑𝑑(𝑡𝑡) + 𝛼𝛼𝑖𝑖 + 𝛾𝛾𝑖𝑖 + 𝜂𝜂𝑇𝑇(𝑡𝑡) + 𝜂𝜂6(𝑡𝑡) + 𝑋𝑋𝑖𝑖𝜃𝜃 + 𝛿𝛿𝑇𝑇 + 𝛽𝛽3�̅�𝑣𝑖𝑖(𝑡𝑡) + 𝜀𝜀𝑖𝑖𝑖𝑖(𝑡𝑡).
13 As before, we can instead control for unobserved job seeker heterogeneity using job seeker fixed effects, 𝜆𝜆𝑖𝑖, in place of 𝑋𝑋𝑖𝑖𝜃𝜃 + 𝛿𝛿𝑇𝑇 as in (1).

15
Figure 3 presents the results of estimating equations (3) and (3′). For ease of comparison, we
report estimates of all specifications using the subset of job seeker-week observations with at least one
application sent and only report the results that control for unobserved job seeker characteristics using
completed spell length. Conditioning on weeks with only a positive number of applications sent produces
a flatter application-duration relationship in general. Adding in the number of newly-posted and
previously active vacancies, as in (3), does essentially nothing to affect the relationship. The coefficients
(with standard errors in parentheses) on incumbent and newly-posted vacancies are �̂�𝛽0 = 0.085 (0.044),
�̂�𝛽1 = 0.009 (0.026), and �̂�𝛽2 = 0.012 (0.005), respectively. These estimates are consistent with a stock-
flow process of search and application behavior, but they do little to affect the relationship. Adding in the
mean duration of vacancies applied to instead flattens out the application-duration relationship
somewhat, particularly in the later weeks of search. After 13 weeks of search, controlling for vacancy
duration raises the estimated number of applications sent by about 6 percent, and after 26 weeks, it raises
the estimated number sent by about 17 percent. The application-duration relationship still continues to
fall throughout the duration of search, though.
Figure 4 provides evidence for why the more restrictive measure of the stock and flow of
vacancies has almost no effect on the application-duration relationship. It shows the fraction of
applications sent to newly-posted vacancies over the duration of search. The fraction rises by about 3
percentage points over the first six months of search but never rises above 17 percent during this time.
Even though the fraction of applications to new vacancies rises with duration of search, consistent with a
stock-flow search process, it never rises to a level that is quantitatively large enough to affect the strong,
declining relationship between applications and search duration. The average duration of vacancies that
a job seeker applies to, however, does show notable movement over the duration of search, falling from
11 weeks at the start of search to just over 8 weeks after six months of search. Consequently, this less

16
restrictive proxy of stock-flow matching has a notable, albeit small, effect on the application-duration
relationship.
4. Job Seeker Heterogeneity in Application Behavior
In Section 3, we show that the number of applications a job seeker sends declines over the
duration of job search after controlling for individual heterogeneity. In the absence of these controls, the
average number of vacancies sent per week begins to rise after several weeks of search. In this section,
we show that this is because long-duration job seekers send more applications per week, on average,
throughout their search spell. That is, long-term job seekers have a larger fixed effect in terms of the
number of applications sent.
This finding, at face value, goes against the theoretical prediction for the effect of search effort
on search duration. Higher search effort should lead to a higher probability of finding a job and therefore
a shorter search spell, yet the data show the opposite.
To better understand this finding, we next estimate the relationship between the number of
applications job seekers send each week and the duration of their search separately for job seekers of
differing completed spell lengths. The results of the estimation are in Figure 5.
The top panel presents the application-search duration relationships by selected completed spell
lengths without any controls. The number of applications sent per week by a job seeker declines as search
continues, and this pattern holds independently of the duration of the completed spell length.14 More
importantly, Figure 5 shows that individuals with longer completed search spells send more applications
per week throughout the duration of their search spell. The average number of applications sent per week
14 The figure excludes the last week of search because, by construction, every job seeker sends at least one application on the last week of their identified search spell.

17
rises consistently with completed spell length. For example, in the third week of search, those with
completed spells of four weeks send an average of 0.8 applications, those with completed spells of 13
weeks send an average of 1.3 applications, while those with completed spells of 10 months or more send
an average of 2.3 applications. The slopes of the estimated application-search duration relationship are
almost identical across different durations of completed search spells. Thus, the differences in application
behavior by completed spell length are essentially a level effect. Job seekers who ultimately end up
searching on the website longer send out more applications per week throughout their entire search spell.
The bottom panel of Figure 5 presents the estimated relationships when using baseline controls,
controls for observable job seeker characteristics and controls for the local stock and flow of vacancies.
The initial decline in applications per week with duration becomes flatter, but otherwise the results are
the same as in the top panel of the figure. Most importantly, there is essentially no change in the finding
that job seekers with long completed search spells send more applications per week, on average,
throughout their entire search spell.
To eliminate a concern that long-duration job seekers on the website may be those that are more
committed to search on the website relative to search elsewhere, regardless of their job-finding
outcomes, we show in Section 6 that our results hold within a sample of “potential matches,” i.e., within
a subsample of job seekers who potentially found a job on the website. Furthermore, the magnitude of
the difference in application behavior between long-duration and short-duration job seekers should lead
to a higher job-finding rate for the long-duration job seekers if the only difference between them was a
taste for job search on the website. Within the first month of search, individuals who search for 10 months
or more send triple the number of applications as those who search for four weeks or less. In the online
appendix, we conduct further robustness checks on Figure 5 and show that the general patterns persist
when we restrict our sample to observations where at least one application was sent during the week (to

18
assess the effect of weeks of idle search on the results), or to observations of non-employed job seekers
only. In both cases, the general patterns in Figure 5 hold.
Thus, our results in Figure 5 suggest that understanding the nature of job seeker heterogeneity is
critical for reconciling the theory with our findings. For example, job seekers may differ in their
employability, with job seekers who are less desirable to prospective employers (as distinguished by the
characteristics observable to employers but not to the econometrician) taking longer to find a job. If job
seekers know their type, then low-employability job seekers may try to compensate for their type by
sending more applications.15 In the next section, we illustrate how a search model can account for our
findings by incorporating a dominant income effect in the behavior of search effort with respect to the
heterogeneous returns to job search.
5. Search Effort in the Presence of an Income Effect
Our evidence thus far shows that job seekers who search longer typically exert higher search
effort throughout their search. This appears at odds with the predictions of a standard search model. In
this section, we argue that modifying a standard model to allow for a dominant income effect in the
returns to search can account for the observed empirical findings. We then present evidence in support
of this argument. Specifically, we show that job seekers who arguably have the lowest expected returns
to search exert the most effort over the duration of their search, which is consistent with an income effect
dominating the relationship between search effort and the returns to search.
5.A. Theoretical Foundation for an Income Effect in Search Effort
15 Moscarini (2001) presents a model where workers are heterogeneous with respect to a multi-dimensional skill set. In equilibrium, individuals with specialized skills contact a relatively small, targeted set of vacancies where they are most likely to be hired, while those with weak comparative advantages contact many vacancies without regard to their job type.

19
We motivate our argument by starting with the model of endogenous search effort put forth by
Pissarides (2000, Chapter 5). In his model, unemployed job seekers face search frictions when looking for
work. They can counteract these frictions by endogenously choosing a level of search intensity, 𝑠𝑠, at some
increasing and convex cost, 𝜙𝜙(𝑠𝑠). In the model, employed workers earn a wage, 𝑤𝑤, while the unemployed
earn a flow value of unemployment, 𝑏𝑏 . Both sources of income enter an individual’s utility function
linearly. The job-finding probability per unit of search is 𝜆𝜆. In the Pissarides model, job seekers choose
search effort to satisfy
(5) 𝜙𝜙′(𝑠𝑠) = 𝜆𝜆�𝑊𝑊� − 𝑈𝑈�,
where 𝑊𝑊� is the value to the individual of being employed and 𝑈𝑈 is the value to the individual of being
unemployed. Given the convexity of the cost function, equation (5) suggests that higher returns to search,
depicted by the right-hand side of (5), will lead to greater search effort. In other words, job seekers will
search harder when the returns to that search are higher.
We now illustrate that this implication stems from the fact that the Pissarides model does not
include any income effect with respect to search. To see this, consider a discrete-time model of lifetime
utility maximization and focus on two periods, where the individual is unemployed in the first period.
Individuals choose consumption, 𝑐𝑐 , and leisure, 𝑙𝑙 (or equivalently, search effort), to maximize utility,
subject to their budget constraint and a time constraint. If unemployed, a job seeker allocates her time 𝑇𝑇
between search effort and leisure. If employed, a worker works an exogenously fixed amount of hours, 𝑛𝑛�,
and spends the rest of her time consuming leisure. The price of the consumption good is set to numeraire,
individuals discount the future at a rate 𝛽𝛽, and earn a return on savings of 𝑟𝑟.
The key departures from the Pissarides model are that utility is increasing and concave in both of
its arguments and consumption and leisure are assumed to be complements. We assume that individuals
have access to complete insurance markets for their income. Let the superscript 𝑤𝑤 represent a decision

20
outcome when the job seeker is employed in the second period, and let the superscript 𝑢𝑢 represent a
decision outcome when the job seeker remains unemployed in the second period. With the complete
markets assumption, second-period consumption will be equalized across the two states, so that 𝑐𝑐𝑤𝑤 =
𝑐𝑐𝑢𝑢 ≡ 𝑐𝑐′. The constrained utility maximization problem in this case is
𝑉𝑉(∙) = max𝑐𝑐,𝑐𝑐′,𝑙𝑙,𝑙𝑙𝑤𝑤,𝑙𝑙𝑢𝑢
{𝑢𝑢(𝑐𝑐, 𝑙𝑙) + 𝛽𝛽[𝑠𝑠𝜆𝜆𝑢𝑢(𝑐𝑐′, 𝑙𝑙𝑤𝑤) + (1 − 𝑠𝑠𝜆𝜆)𝑢𝑢(𝑐𝑐′, 𝑙𝑙𝑢𝑢)]},
Subject to (i) 𝑙𝑙 + 𝑠𝑠 = 𝑇𝑇,
(ii) �𝑙𝑙𝑤𝑤 + 𝑛𝑛� = 𝑇𝑇 if employed𝑙𝑙𝑢𝑢 + s = 𝑇𝑇 otherwise
,
(iii) 𝑐𝑐 + (1 + 𝑟𝑟)−1𝑐𝑐′ ≤ 𝑏𝑏 + (1 + 𝑟𝑟)−1[𝑠𝑠𝜆𝜆𝑤𝑤𝑛𝑛� + (1 − 𝑠𝑠𝜆𝜆)𝑏𝑏].
Note that, since neither the job-finding probability nor expected earnings change over time,
search effort will be the same in both periods, which is reflected in the time constraints. Note also, that
we can refer to the returns to search in this problem as 𝑊𝑊 = 𝜆𝜆(𝑤𝑤𝑛𝑛� − 𝑏𝑏). Given this setup, we can simplify
the problem by substituting the budget and time constraints into the maximization problem, making it an
unconstrained choice of the optimal first-period consumption and search effort
𝑉𝑉(∙) = max𝑐𝑐,𝑠𝑠
{𝑢𝑢(𝑐𝑐,𝑇𝑇 − 𝑠𝑠)
+ 𝛽𝛽[𝑠𝑠𝜆𝜆𝑢𝑢(𝑠𝑠𝑊𝑊 + (2 + 𝑟𝑟)𝑏𝑏 − (1 + 𝑟𝑟)𝑐𝑐,𝑇𝑇 − 𝑛𝑛�)
+ (1 − 𝑠𝑠𝜆𝜆)𝑢𝑢(𝑠𝑠𝑊𝑊 + (2 + 𝑟𝑟)𝑏𝑏 − (1 + 𝑟𝑟)𝑐𝑐,𝑇𝑇 − 𝑠𝑠)]}.
The relevant equation from this problem for our purposes is the first-order condition with respect to
search effort,
(6) 𝜕𝜕𝑉𝑉𝜕𝜕𝑠𝑠
:−𝑢𝑢𝑙𝑙(𝑐𝑐, 𝑙𝑙) + 𝛽𝛽𝜆𝜆[𝑢𝑢(𝑐𝑐′, 𝑙𝑙𝑤𝑤)− 𝑢𝑢(𝑐𝑐′, 𝑙𝑙𝑢𝑢)] + 𝛽𝛽[𝑊𝑊𝑢𝑢𝑐𝑐(𝑐𝑐′,∙)− (1 − 𝑠𝑠𝜆𝜆)𝑢𝑢𝑙𝑙(𝑐𝑐′, 𝑙𝑙𝑢𝑢)] = 0.
Subscripts on the utility function represent the derivative with respect to the listed argument. Note that
the first-order condition is simplified by the complete markets assumption, which ensures that
𝑢𝑢𝑐𝑐(𝑐𝑐′, 𝑙𝑙𝑤𝑤) = 𝑢𝑢𝑐𝑐(𝑐𝑐′, 𝑙𝑙𝑢𝑢) ≡ 𝑢𝑢𝑐𝑐(𝑐𝑐′,∙).

21
We use equation (6) to derive the Slutsky equation for the change in search effort with respect to
the returns to search, 𝑊𝑊. Let ∆ denote the second derivative of the value function with respect to search
effort. Under fairly weak conditions, ∆< 0.16 To derive the Slutsky equation, take the total derivative of
(6) with respect to search effort and the returns to search,
∆𝑑𝑑𝑠𝑠 + [𝛽𝛽𝑢𝑢𝑐𝑐(𝑐𝑐′,∙) + 𝛽𝛽𝑠𝑠𝑊𝑊𝑢𝑢𝑐𝑐𝑐𝑐(𝑐𝑐′,∙) − 𝛽𝛽𝑠𝑠(1 − 𝑠𝑠𝜆𝜆)𝑢𝑢𝑐𝑐𝑙𝑙(𝑐𝑐′, 𝑙𝑙𝑢𝑢)]𝑑𝑑𝑊𝑊 = 0, or
(7) 𝑑𝑑𝑠𝑠𝑑𝑑𝑊𝑊
=−𝛽𝛽𝑢𝑢𝑐𝑐(𝑐𝑐′,∙)
∆− 𝑠𝑠
𝛽𝛽[𝑊𝑊𝑢𝑢𝑐𝑐𝑐𝑐(𝑐𝑐′,∙) − (1 − 𝑠𝑠𝜆𝜆)𝑢𝑢𝑐𝑐𝑙𝑙(𝑐𝑐′, 𝑙𝑙𝑢𝑢)]∆
.
The first term on the right is the substitution effect, which is positive. Increases in the returns to search
cause the job seeker to exert more search effort. This is identical to the implication of the Pissarides (2000)
model. The second term on the right is the income effect. Equation (7) shows that a necessary condition
for it to exist is either curvature in consumption or complementarity (i.e., non-separability) between
consumption and leisure. For the income effect to be the dominant effect, it must be the case that
(8) 𝑢𝑢𝑐𝑐(𝑐𝑐′,∙) < 𝑠𝑠|𝑊𝑊𝑢𝑢𝑐𝑐𝑐𝑐(𝑐𝑐′,∙)− (1 − 𝑠𝑠𝜆𝜆)𝑢𝑢𝑙𝑙𝑐𝑐(𝑐𝑐′, 𝑙𝑙𝑢𝑢)|.
Thus, if the marginal utility of consumption is small, curvature of the utility function with respect to
consumption is sufficiently high, or the complementarity between consumption and leisure is sufficiently
strong, the income effect will dominate the search decision.
Returning to the Pissarides (2000) model, we can see why it only generates a substitution effect
that does not match the behavior we observe in the data. We can characterize utility from that model as
𝑢𝑢(∙) = 𝑐𝑐 − 𝜙𝜙(𝑠𝑠), with 𝜙𝜙′, 𝜙𝜙′′ > 0. The marginal utility of consumption, 𝑢𝑢𝑐𝑐(∙), is constant and equal to
one. The utility function with respect to search effort (leisure) is 𝑢𝑢𝑙𝑙(∙) = −𝜙𝜙′ and 𝑢𝑢𝑙𝑙𝑙𝑙(∙) = −𝜙𝜙′′ .
Furthermore, consumption and leisure are unrelated, 𝑢𝑢𝑐𝑐𝑙𝑙(∙) = 0 . If we plug these values into (7), it
becomes immediately clear that the second term disappears (i.e., there is no income effect). Instead, the
16 The second order condition is 𝑢𝑢𝑙𝑙𝑙𝑙(𝑐𝑐, 𝑙𝑙) + 𝛽𝛽[𝑊𝑊2𝑢𝑢𝑐𝑐𝑐𝑐(𝑐𝑐′,∙) − 2𝑊𝑊(1 − 𝑠𝑠𝜆𝜆)𝑢𝑢𝑐𝑐𝑙𝑙(𝑐𝑐′, 𝑙𝑙𝑢𝑢) − (1 − 𝑠𝑠𝜆𝜆)𝑢𝑢𝑙𝑙𝑙𝑙(𝑐𝑐′, 𝑙𝑙𝑢𝑢)] +2𝛽𝛽𝜆𝜆𝑢𝑢𝑙𝑙(𝑐𝑐′, 𝑙𝑙𝑢𝑢), and is negative so long as the first two terms are greater in absolute value than 2𝛽𝛽𝜆𝜆𝑢𝑢𝑙𝑙(𝑐𝑐′, 𝑙𝑙𝑢𝑢).

22
total change in search effort with respect 𝑊𝑊 is exactly equal to the substitution effect, which in this case
is
𝑑𝑑𝑠𝑠𝑑𝑑𝑊𝑊
=𝛽𝛽
𝜙𝜙′′(𝑠𝑠) + 2𝛽𝛽𝜆𝜆𝜙𝜙′(𝑠𝑠)> 0.
5.B. Evidence in Support of a Dominant Income Effect
We now turn to evidence that is consistent with the notion that long-duration job seekers are
those individuals who face relatively lower expected returns from search. We show that the job seekers
identified as having lower returns to search, regardless of duration, send relatively more applications per
week, consistent with an income effect dominating the search effort decision.
Table 3 presents summary statistics on the demographic composition and average employment
histories of job seekers by the length of their completed search spell. The table shows that longer-duration
job seekers tend to be older, male, and non-employed. Furthermore, those who are non-employed are
more likely to have separated from permanent, full-time jobs where their tenures were relatively long.
The characteristics of these individuals are similar to the characteristics of the job losers studied
extensively in the literature on mass layoffs and long-term joblessness (e.g., Jacobson, LaLonde, and
Sullivan, 1993; Couch and Placzek, 2010; Davis and von Wachter, 2011, among others). We know from
this literature that these individuals face very poor employment prospects years after a job loss. Thus, the
evidence from Figure 5 and Table 3 appear consistent with the notion that an income effect in search
effort dominates so that those with the poorest job-finding prospects search the hardest throughout the
duration of their search spell.
Figure 6 shows additional evidence in support of this notion. It plots the results from estimating
the model from equation (3) separately on the subsample of job seekers whom we identify as employed
and on the subsample of job seekers whom we identify as non-employed. The figure shows that the non-

23
employed consistently send significantly more applications per week throughout their duration of search.
If one believes that there is some market penalty to searching while unemployed, or that the unemployed
have a lower job-finding probability—consistent with findings by Kroft, Lange, and Notowidigdo (2013),
Blau and Robins (1990), and Faberman et al. (2016)—then this would also be consistent with the notion
that those with lower returns to search exert the most effort.
In Table 4, we present the results of augmenting our regression model in (3) with a variety of
demographic and labor force variables interacted with employment status. Specifically, we restrict our
sample to job seekers for whom we have employment history information. We then add to our model an
indicator for whether the job seeker is non-employed, and also interact it with our demographic
characteristics and the (log) tenure of the most recent job. The most recent job is the last reported job for
the non-employed and the current job for the employed (measured from the date of the job seeker’s first
application). We report estimation results with these variables added to the specifications in Figures 1-3,
i.e., the baseline specification, the specification with observable demographic characteristics added, the
specification that adds controls for completed spell length, and the specification that additionally controls
for the stock and flow of local vacancies.
Once we control for the observable demographic characteristics, the results are very similar
across the remaining specifications, so we focus our discussion on the final column of Table 4. The column
shows that, consistent with Figure 6, the non-employed send about 0.3 more applications per week than
the employed, all else equal. Employed job seekers in long-tenured jobs send fewer applications per week,
likely reflecting a higher level of job stability, but non-employed job seekers who separated from long-
tenured jobs send more applications per week. This is especially true for non-employed males. Among the
non-employed, applications sent per week increases with age. We find no notable differences in
application behavior by employment status and either race or education. Again, the evidence is consistent

24
with a story of a dominant income effect in search effort. Those who can be considered as having the
lowest returns to search—non-employed, older workers who have lost a long-tenured job—exert the
most effort even after controlling for search duration, completed spell length, and a variety of other
factors. Furthermore, employed workers in long-tenured jobs, i.e., those who we presume have the
highest returns to search, exert lower effort, all else equal.
5.C. Search Effort and Local Labor Market Conditions
Finally, we examine whether evidence at a more aggregated level is also consistent with a
dominant income effect in search effort. Specifically, we examine whether search effort is higher in
weaker labor markets. We do so by splitting the metropolitan areas in our sample into quartiles based on
two measures of labor market strength. The first is the CBSA unemployment rate, taken from the BLS
Local Area Unemployment Statistics (LAUS) data and averaged over September 2010 through September
2011. The second is a measure of labor market tightness derived from the website data. It is the ratio of
active vacancies to active job seekers, averaged across all weeks in the sample period. A higher ratio
represents a stronger (i.e., tighter) labor market. We focus on comparisons of CBSAs in the highest and
lowest quartile based on each measure, and we replicate our analysis for all job seekers in our sample and
a sample restricted to those identified as non-employed. The LAUS unemployment measure is a broad
measure of labor market strength, while the market tightness measure is specific to job seekers and
vacancies on the website.
Our estimates are in Figure 7. We report the results using the full specification of our model from
(2). The left panels report the results for high-unemployment and low-unemployment CBSAs while the
right panels report the results for high-market tightness and low-market tightness CBSAs. The top panels
report the results for all job seekers and the bottom panels report the results for non-employed job
seekers. In all cases, job seekers in weak labor markets send more applications per week throughout the

25
duration of their search spell. The differences in applications per week are somewhat small in absolute
value, averaging about 0.1 application per week (about 6 percent of the sample mean) over the first six
months of search and across the four exercises, depending on the duration of search, but they are
statistically significant throughout most of the search spell in each exercise. Again, the findings are
consistent with the notion that job seekers exert more effort when the returns to search are relatively
low. As with the earlier evidence, it supports the notion that an income effect dominates a job seeker’s
choice of search intensity.
6. Robustness: Application Behavior from a Sample of Potential Matches
In this section, we show that our finding regarding longer-duration job seekers exerting higher
effort is not an artifact of focusing on data on job search within a single online job website. Specifically, a
concern might be that our long-duration job seekers are those that search continuously and consistently
on the website because of a relatively strong preference for the SnagAJob website compared with other
methods. This can potentially generate a positive correlation between the completed duration of search
on the website and the number of applications sent that is not reflective of the job seeker’s overall search
effort. The supporting evidence based on a job seeker’s employment history in Section 5 allays some of
these concerns; however, website attrition might affect the estimates.
The biggest issue with attrition from the website is that we cannot identify it directly. To do so,
we would need information on application outcomes (i.e., whether or not the job seeker was hired). As a
next-best alternative, we replicate our main analysis using a subset of individuals who potentially ended
their search spell by finding a job through the website. We refer to this subset as our “potential match”

26
sample. Since this sample represents individuals who potentially found a job through the website, it
should minimize the effects of any heterogeneity in job seeker tastes for using the website for search.17
To identify the subsample of the individuals who potentially found a job on the website, we
restrict the subset to individuals who applied to at least one vacancy that expired during the same week
that their search spell ended. The working hypothesis is that, since the job seeker was one of the last
people to apply to the vacancy, and since the vacancy was one of the last positions the job seeker applied
to, these individuals are the most likely to have exited search by finding a job on the website. We find that
22 percent of all job seekers in our sample satisfy this criterion, and 25 percent of job seekers who
searched for over one week satisfy the criterion.18
Figure 8 provides compelling evidence that this selection criterion provides a good identification
of hiring through the website. The figure plots the average fraction of a job seeker’s applications that are
to an expiring vacancy each week, with job seekers grouped by their total spell length. We scale the
horizontal axis so that it plots the remaining weeks of a job seeker’s search spell. Week zero represents
the last week of the spell. On average, 17 percent of all applications are to a vacancy that ends the same
week that a job seeker applies to it. The fraction, however, increases sharply as job seekers reach the end
of their search spell, with a substantial spike in the last week of search. The spike is considerably larger
for job seekers with long search spells. Thus, we conclude that our selection criterion identifies potential
matches between a job seeker and a vacancy. The subset of job seekers who apply to an expiring vacancy
in week zero of Figure 8 constitutes our “potential match” sample.
17 In the appendix, we develop a simulation where job seekers face a common, stochastic job-finding process and differ only in their attachment to search on the website. We show that if this difference was the only factor driving our results, we would obtain very different patterns of application behavior from our potential match sample than what we observe in Figure 5. In other words, it would be impossible for us to replicate Figure 5 using the potential match sample of this section without some form of heterogeneity other than taste for search on the website. 18 In comparison, Stevenson (2008) finds that 22 percent of all job seekers in 2002 found employment through the internet.
27
Figure 9 plots the applications per week by completed spell length for the potential match sample.
It is a replication of Figure 5. As one can see, the main patterns from Figure 5 are also present in Figure 9.
In fact, they are nearly identical.
Finally, we replicate the regression estimates from Figure 2 using the potential match sample.
Figure 10 shows the estimates from our baseline model and the baseline model extended to include
controls for demographics and completed spell length, i.e., the regression model in (2). For comparison,
we report the estimates using our potential match sample as well as the full sample of job seekers. The
figure shows that the potential match sample yields qualitatively similar results. Quantitatively, it shows
a somewhat smaller effect of including completed spell length as a control, but there is still a
monotonically declining relationship between applications per week and search duration. Thus, we
conclude that our results on the effort of long-duration job seekers are not an artifact of job seekers who
are only marginally committed to search on the website.19
7. Conclusions
This paper examines the relationship between a job seeker’s search effort and the duration of her
search using data from an online job search website. We focus on the number of applications job seekers
send to vacancies posted on the website as our measure of search effort.
Our study contains two main findings. First, an individual job seeker’s search effort declines with
search duration. Second, job seekers with longer completed search spells send more applications per
week throughout the duration of search. For the first result, controlling for the unobserved heterogeneity
19 In results not reported here, we also experiment with a version of the potential match sample where we further restrict the sample to job seekers who are the only ones who send an application to an expiring vacancy in their last week of search. This more restrictive sample represents only 6 percent of all job seekers but nevertheless produces qualitatively similar results to those in Figures 9 and 10.

28
in search effort is crucial. Without controls for individual heterogeneity, the average search effort
increases with duration after several weeks of search. Our findings are robust to analyses that account for
various measurement issues, and they hold for a subsample of job seekers whom we identify as potentially
hired through the website.
Our finding that long-duration job seekers send more applications each period is at odds with the
prediction of a standard search theory that higher search effort should lead to a higher job-finding rate
and therefore shorter search durations. We argue that the theory fails to match the data because it
ignores an income effect in search effort that likely dominates individual search behavior. Job seekers
with low expected returns to search feel relatively “poorer” in terms of their returns to search, and
consequently a dominant income effect in their search efforts causes them to search for work more
intensely. We present further evidence that is consistent with this notion. Long-duration job seekers tend
to be older, non-employed, male job seekers who have separated from a long-tenured job. The literature
on job displacements suggests that these are precisely the individuals who face the poorest job-finding
prospects. We also find that these individuals, regardless of how long they search on the website, tend to
send more applications per week, all else equal. The same is true for individuals who are in weaker labor
markets.
Our evidence suggests that models of labor market search with endogenous search intensity must
allow for an income effect in search intensity if they are to match the empirical evidence on search effort
and search duration. We show that this requires extending these models to allow for either curvature in
job seekers’ utility or for non-separability between consumption (or income) and leisure (i.e., non-search
time). It is also worth noting that our evidence does not contradict the notion that increases in an
individual’s search intensity will increase her job-finding rate. Instead, it suggests that this mechanism is
dominated in the data by an income effect in search effort that varies in the cross-section of job seekers.

29
An important corollary to this is that heterogeneity in job seekers’ expected returns to search is an
important driver of the empirical relationship between search effort and search duration. Consequently,
heterogeneity in the returns to search is also an integral part of any model with endogenous search
intensity seeking to reconcile the theory with the evidence.
References
Acemoglu, Daron, and David Autor, 2011. "Skills, Tasks and Technologies: Implications for Employment and Earnings." Handbook of Labor Economics, Volume 4: 1043-1171.
Addison, John T., and Pedro Portugal, 1989. “Job Displacement, Relative Wage Changes, and Duration of Unemployment,” Journal of Labor Economics, Vol. 7(3): 281-302.
Autor, David H., Lawrence F. Katz, and Melissa S. Kearney, 2008. "Trends in US Wage Inequality: Revising the Revisionists." The Review of Economics and Statistics, Vol. 90(2): 300-323.
Barron, John M., John Bishop, and William C. Dunkelberg, 1985. “Employer Search: The Interviewing and Hiring of New Employees,” Review of Economics and Statistics, Vol. 67(1): 43-52.
Blanchard, Olivier Jean, and Peter Diamond. 1994. "Ranking, Unemployment Duration, and Wages." Review of Economic Studies, Vol.61(3): 417-434.
Blau, David M., and Philip K. Robins. 1990. Job Search Outcomes for the Employed and Unemployed, Journal of Political Economy, Vol. 98 (3): 637-655.
Brown, Jennifer, and David Matsa, 2012. “Boarding a Sinking Ship? An Investigation to Job Applications to Distressed Firms,” mimeo, Kellogg School of Business, Northwestern University.
Brown, Meta, Christopher J. Flinn, and Andrew Schotter, 2011. “Real-Time Search in the Laboratory and the Market,” American Economic Review, Vol. 101(2): 928-974.
Christensen, Bent Jesper, Rasmus Lentz, Dale T. Mortensen, George R. Neumann, and Axel Werwatz, 2005. "On-the-Job Search and the Wage Distribution." Journal of Labor Economics, Vol. 23 (1): 31-58.
Coles, Melvyn G., and Eric Smith, 1998. "Marketplaces and Matching," International Economic Review, Vol. 39(1): 239-54.
Costain, James S., 1997. "Unemployment Insurance with Endogenous Search Intensity and Precautionary Saving." Universitat Pompeu Fabra, Economics Working Paper No. 243.

30
Couch, Kenneth A., and Dana W. Placzek, 2010. "Earnings losses of displaced workers revisited." The American Economic Review 100(1): 572-589.
Davis, Steven J., R. Jason Faberman, and John C. Haltiwanger, 2013. “The Establishment-Level Behavior of Vacancies and Hiring,” Quarterly Journal of Economics, Vol. 128 (2): 581-622.
Davis, Steven J., and Till von Wachter, 2011. "Recessions and the Costs of Job Loss." Brookings Papers on Economic Activity, Vol. 42(2): 1-72.
Ebrahimy, Ehsan, and Robert Shimer, 2010. “Stock-Flow Matching,” Journal of Economic Theory, Vol. 145(4): 1325–1353.
Faberman, R. Jason, and Marianna Kudlyak, 2016. “Online Job Search,” Federal Reserve Bank of Chicago Economic Perspectives, forthcoming.
Faberman, R. Jason, Andreas Mueller, Aysegul Sahin, and Giorgio Topa, 2016. “Job Search Behavior Among the Employed and Non-Employed,” mimeo.
Holzer, Harry J., Lawrence F. Katz, and Alan B. Krueger, 1991. “Job Queues and Wages,” Quarterly Journal of Economics, Vol. 106(3): 739-768.
Hornstein, Andreas. 2012. “Accounting for Unemployment: The Long and Short of It”, The Federal Reserve Bank of Richmond, mimeo.
Jacobson, Louis S., Robert J. LaLonde, and Daniel G. Sullivan, 1993. "Earnings Losses of Displaced Workers." The American Economic Review, Vol. 83: 685-709.
Jones, Stephen R. G., 1988. “The Relationship between Unemployment Spells and Reservation Wages as a Test of Search Theory.” Quarterly Journal of Economics, Vol. 103 (4): 741-765.
Kroft, Kory, Fabian Lange, and Matthew J. Notowidigdo, 2013. “Duration Dependence and Labor Market Conditions: Theory and Evidence from a Field Experiment,” Quarterly Journal of Economics, Vol. 128(3), 1123-1167.
Kroft, Kory, and Devin Pope. 2014. “Does Online Search Crowd-out Traditional Search and Improve Matching Efficiency? Evidence from Craigslist“. Journal of Labor Economics, Vol. 32 (2), 259-303.
Krueger, Alan B., and Andreas Mueller, 2011. "Job Search, Emotional Well-Being, and Job Finding in a Period of Mass Unemployment: Evidence from High-Frequency Longitudinal Data," Brookings Papers on Economic Activity, Vol. 42 (1): 1-81.
Kudlyak, Marianna, Damba Lkhagvasuren, and Roman Sysuyev, 2012. “Sorting by Skill over the Course of Job Search,” Federal Reserve Bank of Richmond Working Paper No. 12-03. Kuhn, Peter, and Hani Mansour, 2014. "Is Internet Job Search Still Ineffective?" Economic Journal, Vol. 124, no. 581: 1213-1233.
Kuhn, Peter, and Mikal Skuterud, 2004. “Internet Job Search and Unemployment Durations,” American Economic Review, Vol. 94(1): 218-232.

31
Lockwood, Ben. 1991. "Information Externalities in the Labour Market and the Duration of Unemployment." Review of Economic Studies, Vol. 58(4): 733-753. Machin, Stephen, and Alan Manning. 1999. The Causes and Consequences of Long-term Unemployment in Europe. in: O. Ashenfelter and D. Card (ed.), Handbook of Labor Economics, Vol. 3, Ch. 47: 3085-3139. Marinescu, Ioana, and Ronald Wolthoff, 2015. “Opening the Black Box of the Matching Function: The Power of Words,” IZA Discussion Paper No. 9071.
Moscarini, Giuseppe. 2001. "Excess Worker Reallocation," Review of Economic Studies, Vol. 69(3): 593-612.
Pissarides, Christopher A., 1992. "Loss of Skill During Unemployment and the Persistence of Employment Shocks." Quarterly Journal of Economics, 107(4): 1371-1391. Pissarides, Christopher A., 2000. Equilibrium Unemployment Theory, 2nd Edition, MIT Press Books: The MIT Press.
Salop, Steven C., 1973. "Systematic Job Search and Unemployment." The Review of Economic Studies, Vol. 40(2): 191-201.
Shimer, Robert, 2004. "Search Intensity." University of Chicago, mimeo.
Stevenson, Betsey, 2008. “The Internet and Job Search,” NBER Working Paper No. 13886. van den Berg, Gerard, and Jan van Ours. 1996. "Unemployment Dynamics and Duration Dependence", Journal of Labor Economics, 14(1).

32
Data Appendix
Our dataset contains daily micro data on all applications sent on the website between September
2010 and September 2011, including detailed information on both applicants and vacancies during this
period. The dataset contains each applicant’s demographic information on age, education, race, and
gender, as well as geographic location at the zip code level. For vacancies, the dataset contains geographic
location at the zip code level and the website’s classification of each vacancy’s occupation, and as noted
in the text, the SnagAJob “occupation” classification is actually an amalgamation of industry and
occupation. We also have data on self-reported employment histories for nearly three-quarters of the job
seekers in the sample. These histories come from information the job seekers fill out in their online profile.
Sample Restrictions
The raw data in our sample period contain over 46 million applicant-vacancy observations for 8.0
million job seekers and over 1.8 million vacancies. We remove observations with missing geography or
occupation data (a negligible amount of observations) as well as applications to postings that are to “work
at home” jobs or similar postings that advertise positions that are self-employment opportunities rather
than a job opportunity with a particular employer. This procedure reduces the number of job seekers and
vacancies in the data by a negligible amount, but it reduces the number of application observations by 14
percent. In some cases, we observe repeat applications by the same individual to the same job posting.
We delete repeat applications that are within one week of each other on the presumption that these are
the result of an applicant error (i.e., erroneous multiple website clicks or forgetfulness). We retain repeat
applications further than one week apart on the presumption that applicants may find it worthwhile to
apply again if they observe that the job opening is still posted (and, presumably, unfilled). We also exclude
applicants with missing education and gender information, and restrict our attention to applicants aged
16 to 75 years. These restrictions remove a negligible amount of individuals. We focus our analysis on the
33
behavior of job seekers who register on the website after the beginning of our sample, September 1,,
2010, to ensure that we can follow applicants from the start of their search spell on the website. This
reduces the number of applications in our sample by about 31 percent. As noted in the main text, though,
we use information on the behavior of all job seekers in our sample to generate estimates of vacancy
characteristics, including total applications received. Finally, we drop observations during the first week
of our sample from our analysis because we cannot differentiate between new and incumbent vacancies
during that week (a necessary criterion for our test of stock-flow search behavior). We do, however, use
the first week of data when calculating the vacancy and job seeker statistics. When we aggregate the
sample to the job seeker-week level, we obtain 10.11 million observations, and observe job seekers
sending at least one application for 7.65 million of these observations.
Search Spell Identification
Identifying the current and completed duration of a job seeker’s search spell is crucial to our
analysis. The micro data contain information about when a job seeker registers with the search engine as
well as on all applications sent by the job seeker during the sample period, which allows a clean
identification to the start of a job seeker’s search on the website. The data, however, do not contain
information on why a job seeker stops applying to jobs on the website. They may have found a job (either
through the website or through other job search methods), stopped searching on the website but
continued search elsewhere, or stopped searching for a job altogether. A job seeker may also continue
searching even after finding employment in cases where the new job reflects “underemployment” relative
to the type of work a job seeker was seeking. In addition, job seekers often exhibit long spells of inactivity
on the website and then resume sending applications again. During this period, a job seeker may have
found work and become unemployed again, they may have become discouraged with the website and
decided to use other methods for a while, or they may have temporarily stopped searching for work
altogether. For example, Clark and Summers (1979) find that nearly half of all completed unemployment

34
spells end with an exit from the labor force. They may have also been employed or out of the labor force,
with only a marginal desire for (new) employment, and therefore searching intermittently.
Taking these considerations into account, we define an individual’s first search spell on the
website as the period between their first application date and any application date that is followed by
more than five weeks of inactivity. The first application occurs within a week of registering on the website
for 95 percent of our sample. For reasons we note in the main text, we consider an application after the
five-week inactivity cutoff to be the beginning of a new search spell. In an online appendix, we experiment
with alternate cutoffs for identifying spell length. Because of the prevalence of long periods of inactivity,
different cutoffs can produce different patterns for the relationship between search effort and search
duration. We show that, once add the controls used in our main analysis, the differences due to different
cutoff lengths essentially disappear. We restrict our main analysis to the first search spell on the website
for all job seekers. We do this because, given the range of reasons that can generate multiple search spells,
job seekers may not behave in the same way in subsequent search spells. In the online appendix, however,
we show that search behavior over the duration of search is very similar in the first and subsequent spells..
Employment History Identification
Our dataset contains information from self-reported employment histories for a majority of job
seekers on the website. These data come from the information that job seekers report in their online
profile. Job seekers can provide information about current and previous jobs. The information typically
includes occupation (based on the SnagAJob categorization), a more-detailed job title, the job’s start and
end dates, an indicator for whether the job seeker currently holds the reported job, and additional
information on the type of job (i.e., part-time, temporary or seasonal, etc.) The employment history
records have several measurement issues, including the typical issues with self-reported data and the
potential for non-random non-response (e.g., non-reporting of a recent job that one was fired from). To

35
ensure that the timing of each reported job is consistent with the start of each search spell, we use the
start and end date information for each employment record to identify its status as a current or previous
job.
Our main use of the employment history data is to identify a labor force status (i.e., employed or
non-employed) for each job seeker reporting at least one employment record. We also extract any
additional information on the type of employment and the job tenure of the job seeker’s current or most
recent job, with the latter measured using the reported starting and ending dates (or the date when the
job seeker registered with the website, for jobs that are reported as current). We can identify a labor force
status for about 72 percent of our sample. Of these, 77 percent report only one employment record.
Another 20 percent report multiple employment records, but do so in a way that the timing across jobs
allows a clean identification of labor force status. The remainder have multiple employment records either
active at the start of the search spell (i.e., a multiple job-holder) or that terminate within the same month
(multiple previous jobs). For these individuals, we identify a “main” job using a priority ranking based on
full-time vs. part-time status and how recent each job started. We measure the tenure of their current or
most recent job based on their “main” job.
We count an individual as employed if we identify one or more records as active at the start of
search. Non-employed job seekers are those whose employment records identify a final employment
record that ends before their search spell begins. About 3 percent of job seekers are identified as non-
employed using information about their current “job” that suggests non-employment (i.e., job titles listing
“volunteer,” “student,” “homemaker,” or even “never had a job” in their employment record).

36
Table 1. Search Behavior by Demographic Group
Applications per Week
Total Weeks Spent Searching
Percent of Applications to
Same CBSA Modal
Occupation New Vacancy Full Sample 1.91 2.13 94.7 75.8 13.7 Search Spell > 1 week 1.79 5.38 94.7 60.6 13.9 Conditional on Search Spell > 1 week Male 1.75 5.39 94.6 58.2 14.6 Female 1.82 5.38 94.7 62.3 13.4 16-24 Years Old 1.95 5.12 95.2 62.9 11.4 25-39 Years Old 1.78 5.22 94.2 57.8 15.3 40-54 Years Old 1.52 5.88 94.1 58.2 17.1 55+ Years Old 1.38 6.59 94.4 60.7 17.6 High School Degree 1.81 5.31 95.2 61.3 12.8 Certification 1.72 5.54 94.2 58.1 15.6 Associates Degree 1.78 5.58 94.4 60.0 15.0 Bachelor’s Degree + 1.75 5.36 93.2 60.1 15.7 White 1.71 5.29 93.6 60.8 14.3 Black 1.89 5.56 95.8 59.1 12.8 Hispanic 1.85 5.25 96.1 62.0 14.0 Other 1.80 5.40 95.2 60.8 14.9
Notes: Summary statistics are mean values across all job seekers in our website sample. Applications and search duration statistics are for the first identified search spell only. Modal occupation is defined as the broad occupational category that job seekers sent the most applications to (and is the industry of the sole application if the job seeker only applied to one job on the website). Newly-posted vacancies are those that first appeared on the website within a week of the job seeker’s application to it.
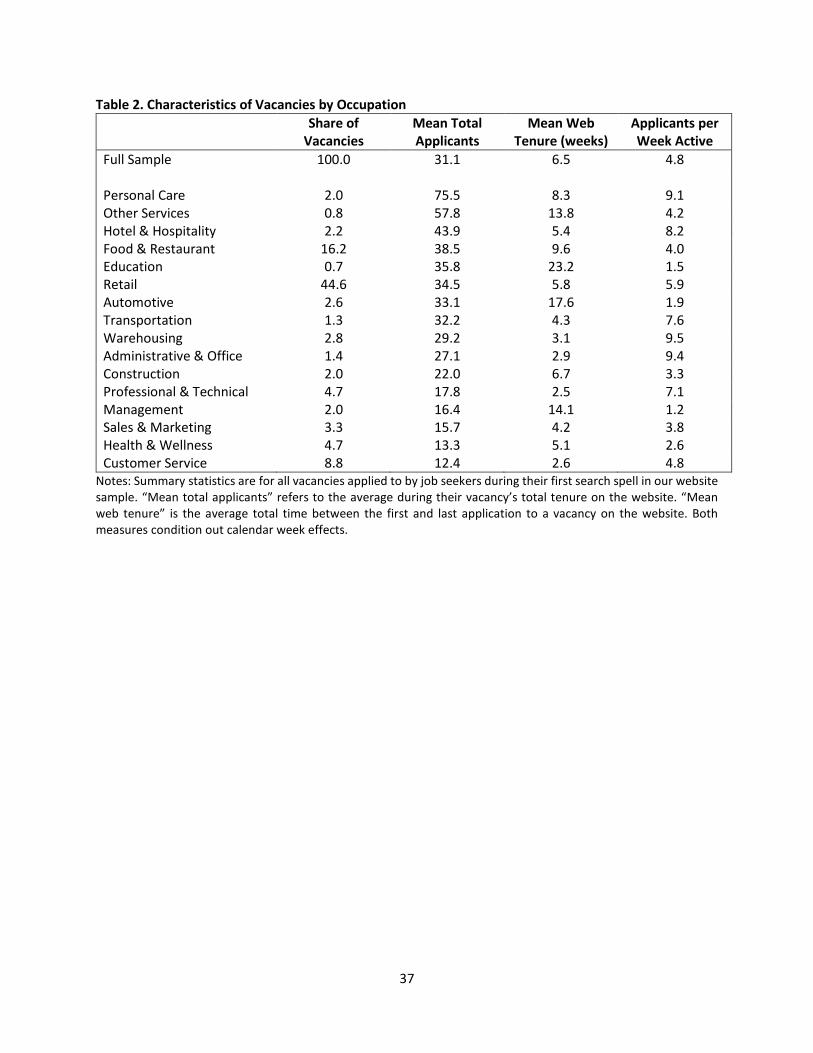
37
Table 2. Characteristics of Vacancies by Occupation Share of
Vacancies Mean Total Applicants
Mean Web Tenure (weeks)
Applicants per Week Active
Full Sample 100.0 31.1 6.5 4.8 Personal Care 2.0 75.5 8.3 9.1 Other Services 0.8 57.8 13.8 4.2 Hotel & Hospitality 2.2 43.9 5.4 8.2 Food & Restaurant 16.2 38.5 9.6 4.0 Education 0.7 35.8 23.2 1.5 Retail 44.6 34.5 5.8 5.9 Automotive 2.6 33.1 17.6 1.9 Transportation 1.3 32.2 4.3 7.6 Warehousing 2.8 29.2 3.1 9.5 Administrative & Office 1.4 27.1 2.9 9.4 Construction 2.0 22.0 6.7 3.3 Professional & Technical 4.7 17.8 2.5 7.1 Management 2.0 16.4 14.1 1.2 Sales & Marketing 3.3 15.7 4.2 3.8 Health & Wellness 4.7 13.3 5.1 2.6 Customer Service 8.8 12.4 2.6 4.8
Notes: Summary statistics are for all vacancies applied to by job seekers during their first search spell in our website sample. “Mean total applicants” refers to the average during their vacancy’s total tenure on the website. “Mean web tenure” is the average total time between the first and last application to a vacancy on the website. Both measures condition out calendar week effects.

38
Table 3. Demographics and Employment History by Completed Spell Length Completed Spell Length 0-6 Weeks 6 Weeks - 3 Months 3 - 6 Months > 6 Months Demographics Mean Age 30.0 32.7 35.6 40.1 Pct. Female 58.3 57.6 56.6 54.4 Pct. Nonwhite 48.5 51.9 53.1 51.0 Pct. Associates/Vocational 25.0 28.7 30.0 29.5 Pct. College or More 18.0 17.6 16.6 17.3 Employment History Pct. Currently Employed 35.9 27.7 25.2 23.3 Currently Non-Employed Pct. Part-Time/Temp Work 47.3 41.8 37.7 31.7 Mean Tenure of Last Job (mos.) 30.8 38.4 48.3 64.0 Currently Employed Pct. Self-Employed 1.4 1.8 1.8 1.4 Pct. Multiple Job-holder 3.1 5.3 6.1 6.2 Pct. Part-Time/Temp Work 54.4 55.7 56.9 56.3 Mean Job Tenure (mos.) 37.0 38.4 40.1 43.4 Observations 3,013,684 194,382 47,640 6,230

39
Table 4. Employment History and Application Outcomes Dependent Variable: Applications/Week (Mean = 1.762) (1) (2) (3) (4)
Nonemployed 0.524** (0.011)
0.365** (0.024)
0.324** (0.023)
0.323** (0.023)
ln(recent job tenure) -0.072** (0.002)
-0.036** (0.002)
-0.033** (0.002)
-0.033** (0.002)
Nonemployed × ln(recent tenure) -0.009** (0.002)
0.016** (0.002)
0.011** (0.002)
0.011** (0.002)
Nonemployed × Male -0.189** (0.010)
-0.177** (0.010)
-0.177** (0.010)
Nonemployed × ln(recent tenure) × Male 0.039**
(0.003) 0.038**
(0.003) 0.038**
(0.003)
Nonemployed × Age 0.007** (0.001)
0.006** (0.001)
0.006** (0.001)
Nonemployed × Age-squared (×100) -0.013** (0.002)
-0.011** (0.002)
-0.011** (0.002)
Nonemployed × Nonwhite -0.014** (0.007)
-0.003 (0.006)
-0.003 (0.006)
Nonemployed × High School -0.007 (0.006)
0.000 (0.006)
0.000 (0.006)
Nonemployed × Vocational -0.029** (0.008)
-0.024** (0.008)
-0.024** (0.008)
Nonemployed × Associates -0.012** (0.006)
-0.009 (0.006)
-0.009 (0.006)
Search Duration, Baseline Controls Y Y Y Y Employment Characteristics Y Y Y Y Demographic Characteristics Y Y Y Spell Length Fixed Effects Y Y Active Local Vacancies Controls Y
R-squared 0.415 0.427 0.450 0.451
N 7,594,686 Note: Table reports the results of regressing applications per week on the listed variables and controls for all job seeker-week observations of all job seekers with a self-reported employment history on the website. “Recent” job tenure refers to the tenure of the current job for the employed and the last reported job for the non-employed. Baseline controls include controls for the end of the spell, whether the job seeker had multiple search spells on the website, calendar week fixed effects, and metropolitan area fixed effects. Employment characteristics (for the employed only) include whether the current job is full-time or part-time, whether the job seeker is a multiple jobholder, and whether the job seeker is self-employed. Demographic characteristics include controls for gender, age, age-squared, race, and education. Standard errors, in parentheses, are clustered by metropolitan area. ** denotes significance at the 5% level

40
Figure 1. Applications over the Duration of Search, Controlling for Demographics
Notes: Figure shows estimated relation between applications per week and duration of search in our baseline model (which controls for the job seeker’s metropolitan area and the start and end of the job seeker’s spell) and a model that additionally controls for demographic characteristics (age, age squared, gender, education, and race). Dashed lines represent 95% confidence intervals (with standard errors clustered on job seeker’s metropolitan area). Figure 2. Applications over the Duration of Search, Controlling for Fixed Job seeker Characteristics
Notes: Figure shows the estimated relationship between applications per week and the duration of search for our baseline model, a model that additionally controls for total spell length, and a model that includes person fixed effects. Dashed lines represent 95% confidence intervals (with standard errors clustered on job seeker’s metropolitan area).
0.0
0.5
1.0
1.5
2.0
2.5
3.0
1 4 7 10 13 16 19 22 25
Applications
Search Duration (Weeks)
Baseline ModelBaseline + Jobseeker Characteristics
0.0
0.5
1.0
1.5
2.0
2.5
3.0
1 4 7 10 13 16 19 22 25
Applications
Search Duration (Weeks)
Baseline ModelControlling for Spell LengthControlling for Jobseeker Fixed Effects

41
Figure 3. Applications over the Duration of Search, Controlling for Active Vacancies and Completed Spell Length
Notes: Figure shows the estimated relationship between applications per week and the duration of search for our baseline model with demographic controls and spell length fixed effects, a model that additionally controls for the number of newly-posted and previously active vacancies, and a model that instead additionally controls for the average duration of vacancies applied to. Figure 4. Share of Applications to Newly-Posted Vacancies and Mean Duration of Vacancies Applied To
Notes: Figure shows the fraction of total applications to newly-posted vacancies and the mean duration of vacancies that the job seeker has applied to by the duration of search. Mean vacancy duration is adjusted by conditioning out calendar week fixed effects.

42
Figure 5. Applications over the Duration of Search by Completed Spell Length (a) Unconditional Relationship
(b) Conditional on Observable Worker and Labor Market Characteristics
Notes: Figure shows the estimated relationship between applications per week and the duration of search separately for job seekers based on the total length of their search spell. Only selected spell lengths are reported. The top panel shows the unconditional relationship, while the bottom panel shows the relationship conditional on the fully-specified model (excluding spell length controls). See text for details of the model.

43
Figure 6. Applications over the Duration of Search, Various Controls, by Labor Force Status
Notes: Figure shows the estimated relationship between applications per week and the duration of search for our baseline model and a model that additionally controls for total spell length using a subsample of job seekers identified as either employed or non-employed. Dashed lines represent 95% confidence intervals (with standard errors clustered on job seeker’s metropolitan area).

44
Figure 7. Applications over the Duration of Search, Weak vs. Strong Local Labor Markets(a) All Job Seekers, High vs. Low Unemployment CBSAs
(c) Non-Employed, High vs. Low Unemployment CBSAs
(b) All Job Seekers, High vs. Low Vacancy-Job Seeker Ratio CBSAs
(d) Non-Employed, High vs. Low Vacancy-Job seeker Ratio CBSAs
Notes: Panels depict the estimated applications per week, conditional on our fully-specified model that includes controls for completed spell length, with job seekers grouped by whether they are in a tight or slack local labor market. Tightness is measured by the metropolitan area’s unemployment rate on the left panels, and by the ratio of active job seekers to vacancies in the right panel. Dashed lines represent 95% confidence intervals (with standard errors clustered on job seeker’s metropolitan area). See text for details of model.

45
Figure 8. Fraction of Applications to Expiring Vacancies by over the Duration of Search by Completed Spell Length
Notes: Figure shows the estimated (unconditional) fraction of applications each week that are to an expiring vacancy (defined as a vacancy that receives its last application during the same week) by the number of weeks remaining in the search spell, separately by the total spell length of the job seeker. Only selected spell lengths are reported. Figure 9. Applications by Search Duration and Completed Spell Length, Conditional on Ending Search with an Application to an Expiring Vacancy
Notes: Figure shows the estimated (unconditional) relationship between applications per week and duration of search separately for job seekers based on the total length of their search spell. Mean applications are only calculated for individuals who sent at least one application to a vacancy that expired (defined as receiving its last application) during their last week of search. Only selected spell lengths are reported.
0.10
0.15
0.20
0.25
0.30
0.35
0.40
03691215182124
Shar
e of T
otal
App
licat
ions
Weeks Remining in Search Spell
2 Weeks 3 Weeks 4 Weeks6 Weeks 8 Weeks 10 Weeks13 Weeks 4 Months 5 Months6 Months 8 Months 10+ Months
0.5
1.0
1.5
2.0
2.5
3.0
3.5
4.0
4.5
1 4 7 10 13 16 19 22 25
Appl
icatio
ns
Search Duration (Weeks)
2 Weeks 3 Weeks 4 Weeks6 Weeks 8 Weeks 10 Weeks13 Weeks 4 Months 5 Months6 Months 8 Months 10+ Months

46
Figure 10. Applications over the Duration of Search, Various Controls, Potential Match Sample
Notes: Figure shows the estimated relationship between applications per week and the duration of search for our baseline model and a model that additionally controls for total spell length using the full sample of job seekers and a subsample that are identified as potentially matching with an expiring vacancy.
0.0
0.5
1.0
1.5
2.0
2.5
3.0
3.5
1 4 7 10 13 16 19 22 25
Applications
Search Duration (Weeks)
Basline - Full SampleBaseline - Potential Match SampleBaseline + Spell Length - Full sampleBaseline + Spell Length - Potential Match Sample