the integrated macroeconomic accounts of the … the integrated macroeconomic accounts of the united...
TRANSCRIPT

1
The Integrated Macroeconomic Accounts of the United States Marco Cagetti, Elizabeth Ball Holmquist, Lisa Lynn, Susan Hume McIntosh, and David Wasshausen∗1
The integrated macroeconomic accounts (IMAs), produced jointly by the Bureau of Economic Analysis (BEA) and the Federal Reserve Board (FRB), present a sequence of accounts that relate income, saving, investment in real and financial assets, and asset revaluations to changes in net worth. In this paper we first provide some background information on the IMAs and on their construction. Next, we discuss the usefulness of the IMAs, focusing for instance on the evolution of household net worth and its components, a set of series that has appeared frequently in discussions of the causes and effects of the recent financial crisis. We also discuss some of the challenges associated with integrating nonfinancial and financial data sources, that is, the current and capital accounts statistics from BEA’s national income and product accounts (NIPAs) and the financial account statistics from FRB’s flow of funds accounts (FFAs). In the final section, we discuss future plans for improving the IMAs, including a proposed framework and methodology for breaking out the financial business sector into three subsectors: 1) Central bank, 2) Insurance and pension funds, and 3) Other financial business.
1. Background and evolution The integrated macroeconomic accounts (IMAs) were developed as part of an interagency effort to
further harmonize the Bureau of Economic Analysis’s (BEA) national income and product accounts (NIPAs) and the Federal Reserve Board’s (FRB) flow of funds accounts (FFAs). Work began on these accounts in 2002 and the first version of the tables was presented at the NBER Conference on Research in Income and Wealth, Architecture for the National Accounts in April 2004, with annual data for 1985 to 2002.2 A February 2007 Survey of Current Business article officially introduced the regular production of the IMAs.3
∗ Cagetti, Holmquist, and McIntosh: Board of Governors of the Federal Reserve System, Research and Statistics, 20th and Constitution Ave., N.W. ,Washington, D.C. 20551, U.S.A, e-mail [email protected], [email protected], and [email protected]. Lynn, Wasshausen: Bureau of Economic Analysis, 1441 L Street N.W., Washington, D.C. 20551, U.S.A, email [email protected] and [email protected]. The views expressed herein are those of the authors and do not necessarily reflect the view of the Board of Governors, the Federal Reserve System, or the Bureau of Economic Analysis.
The System of National Accounts, 1993 (SNA) was used as the organizing framework in an effort to bring these accounts into closer accordance with international guidelines. While the resultant set of IMAs are largely in accordance with the SNA, there remain differences, particularly with respect to the way sectors are defined. The IMAs use a consistent set of sectors throughout the entire sequence of accounts, and these sectors are primarily based on definitions used in either the NIPAs or FFAs. In the SNA, institutions are grouped into five mutually exclusive sectors: 1) nonfinancial corporations, 2) financial corporations, 3) general government, 4) nonprofit institutions serving households (NPISH), and 5) households. In the IMAs, estimates are calculated and presented for the following seven, mutually exclusive sectors: 1) households and NPISH, 2) nonfinancial noncorporate business, 3) nonfinancial corporate business, 4) financial business, 5)
1 We would like to thank Joshua Gallin, Kurt Kunze and Brent Moulton for comments and suggestions. 2 See Teplin, Albert M., Rochelle Antoniewicz, Susan Hume McIntosh, Michael G. Palumbo, Genevieve Solomon, Charles Ian Meade, Karin Moses, and Brent Moulton (2006). 3 For more information, see Bond, Martin, McIntosh, and Mead (2007).

2
federal government, 6) state and local government, and 7) rest of world. The primary difference is in the treatment of noncorporate business (which includes entities such as sole proprietorships, general partnerships, and limited liability partnerships, and government enterprises), which, with the exception of government enterprises, are classified as either nonfinancial noncorporate business or financial business in the IMAs. Government enterprise activities are reflected in the government sectors within the IMAs. In contrast, in the SNA, limited liability companies, limited partnerships and government enterprises are classified as “quasi-corporations” in the financial or nonfinancial corporate sectors and general partnerships and sole proprietorships are classified in the household sector.
Most of the IMA series are derived from published NIPA and FFA data. Current account and capital account statistics are based on NIPA data, while the financial account statistics are based on FFA data. The other changes in volume, revaluation, and balance sheet accounts reflect a combination of both BEA and FFA data. BEA provides FRB with unpublished data, where necessary, and the FRB is responsible for compiling the full set of integrated accounts. The IMAs are updated quarterly about 75 days after the end of the quarter and are published by both BEA and FRB. The BEA-supplied statistics for the most recent quarter typically reflect revisions to the previous quarter, with more substantial historical revisions stemming from the NIPA annual revision introduced with the September IMA release. The FRB-supplied statistics are not constrained by a set revision cycle and thus are open to historical revisions with each quarterly update.
Since initial publication of the IMAs in 2007, there have been several improvements implemented into these accounts. One of the more important improvements was the introduction in June, 2010, of quarterly IMA statistics, beginning with 1992. In June, 2012, those quarterly statistics were carried back to 1960. Slightly less detail is available quarterly in the current account, primarily reflecting insufficient source data on gross flows of property income paid and received. Another recent improvement is the introduction of farmland into the real estate component of the balance sheets for both corporate and noncorporate nonfinancial businesses. Estimates for farmland were developed primarily using Economic Research Service statistics, published by the United States Department of Agriculture. Later in the paper we discuss future plans for the IMAs.
2. Construction of the accounts The IMAs link saving, capital accumulation, investment in financial assets, and balance sheet
positions within an integrated framework with consistent definitions, classifications, and accounting conventions. Each of the seven sectors underlying the total economy has a full complement of accounts: the current account (production and distribution of income accounts), and the accumulation accounts (capital, financial, other volume changes, and revaluation accounts). These accounts allow one to trace the factors leading to changes in the net worth position on the balance sheet of each sector. As an example, in the next section, we will discuss the evolution of household net worth and its composition, a set of statistics that helps us understand the causes and consequences of the financial crisis.
Figure 1 provides a diagram of the sequence of accounts presented in the IMAs, described in more details in subsection 2.1. Roughly speaking, in the first account (current account), the IMAs record production and income. Subtracting consumption from income, we get net saving. Net saving is invested in real and financial assets, as shown in the capital account. If investment in real assets is smaller than

3
saving, the difference can be lent to other sectors using financial instruments; otherwise, the difference must be borrowed. Net lending or borrowing thus link the “real” and the “financial” side of the economy. The next account, the financial account, records the lending and borrowing through the various financial instruments. We can link these real and financial investment flows to the balance sheet of the sector. To obtain the end of period balance sheet of a sector, we must add the capital formation, the net lending and borrowing in financial instruments, the holding gains on assets, and other changes not captured elsewhere.
Figure 1
2.1 A more detailed description of the accounts We now describe in more detail each account and the progression from one account to the next, as
depicted in figure 1 above. To better understand this progression, we can also refer to the published tables, for example, to the households and NPISH sector Table S.3.a, included, together with the tables for all sectors, in appendix B at the end of the paper.
The first account in the IMAs is the current account. Its first component (shown in green) is the production account, labeled number 1 in Figure 1, which shows the contribution made by each sector
Balance sheet
position
Capital
formation
Net lending (+) or
net borrowing (-)
Net lending (+) or
net borrowing (-)
Financial
assets Liabilities
1. Production
Account
Net saving 2. Distribution
of Income
Account
5. Other Changes in
Volume Account
6. Revaluation
Account
Current Account
4. Financial Account
3. Capital Account
Accumulation Accounts

4
towards U.S. production, or gross value added4
The second part of the current account, the distribution of income account (labeled 2), records the various types of income received by the sector (such as compensation received and net interest and net dividends received), as shown in lines 9-19 of the households table.
(line 1 of Table S.3.a). The current account also details the components of production, including compensation and taxes paid, and operating surplus (lines 3-8).
After adjusting income by subtracting taxes and other payments and adding various transfers (lines 20-25), we obtain disposable income (line 26). Further subtracting consumption (line 27) from disposable income, we obtain net saving (lines 28).
For instance, considering the households and NPISH sector, the accounts show that the gross value added by the sector in 2010 was $1.8 trillion. In turn, the sector received an income of $10.9 trillion, which, after various adjustments, resulted in a disposable income about $10.8 trillion. Subtracting $10.2 trillion of consumption, the sector’s net saving amounted to $0.6 trillion.
Net saving enters the capital account, the first in the sequence of accumulation accounts. The accumulation accounts describe the change in the sector balance sheet between its opening and closing position. There are four accumulation accounts: capital account, financial account, other changes in the volume of assets account, and revaluation account. The capital account, shown by the red boxes and labeled number 3, records transactions linked to the net acquisition of nonfinancial assets and capital transfers involving the redistribution of wealth used for the purchase of capital. This account consists of net capital formation (gross fixed capital formation less consumption of fixed assets), net capital transfers, acquisition of nonproduced nonfinancial assets and change in private inventories (lines 29-38). Each of these estimates is derived from estimates in the NIPAs and the fixed asset accounts published by BEA. Net capital transfers include transactions such as disaster-related insurance benefits, estate and gift taxes, and financial stabilization payments made by the federal government. Nonproduced nonfinancial assets transactions include purchases of land, payments for drilling rights, electromagnetic spectrum proceeds and miscellaneous international transactions. If net saving derived from the current account is smaller than capital accumulation, the sector is a net borrower, and if net saving is greater than capital accumulation, the sector is a net lender. This difference between net saving and capital accumulation is referred to as net lending (+) or net borrowing (-). As an example, in 2010, capital formation by the sector amounted to about $0.1 trillion. Since its saving was $0.6 trillion, the sector lent $0.5 trillion to the other sectors.
An alternate version of net lending/net borrowing (or NLNB) can be calculated from the financial account, shown as purple boxes and labeled number 4, by subtracting the net increase in liabilities (lines 70-80) from the net acquisition of financial assets (lines 40-69). In principle, the capital account and financial account measures of net lending/net borrowing should be the same, because saving that is not spent on purchases of fixed assets results in the acquisition of financial assets and borrowing that is used to finance the purchase of fixed assets results in the incurrence of financial liabilities. However, when compiling net lending/net borrowing from the capital and financial accounts, the values for the two measures are almost never equal because of differences in source data, timing of recorded flows, and other statistical differences between data used to create the measures. To reconcile the two measures, the difference between NLNB
4 GDP for the U.S. economy can be calculated as the sum of gross value added for all sectors, plus the statistical discrepancy.

5
derived from the two methods (that is, line 81 minus line 38) is included as a statistical discrepancy in the other changes in volume account.
Looking again at 2010, the household sector acquired $0.5 trillion of financial assets, and decreased its liabilities by repaying about $0.2 trillion, resulting in a net lending of $0.8 trillion. Since the net lending obtained from the capital account amounted to about $0.6 trillion, there is a statistical discrepancy of about $0.2 trillion. The other changes in volume account, shown as blue and labeled number 5, records the effect of exceptional events that cause either the value or volume of assets and liabilities to vary (lines 82-86). Included here are adjustments in classification and structure due to changes in data sources or calculations, disaster losses, nonproduced nonfinancial assets, and the statistical discrepancy described above. Disasters are generally defined as catastrophic events (such as hurricanes and earthquakes) with property losses exceeding 0.1 percent of GDP (which is currently about $15 billion). Nonproduced nonfinancial assets are included since they are not recorded on the balance sheet but are included in the capital account.
The last accumulation account is the revaluation account, shown as orange and labeled number 6, which records holding gains and losses stemming from changes in prices since the opening balance sheet position (lines 87-97). Typically, holding gains and losses account for most of the change in net worth on the balance sheet. One major difference between the SNA and the IMA tables is that debt securities (such as corporate bonds) are shown at book value rather than market value in the IMAs, and are therefore not shown in the revaluation account.
The closing balance sheet position is equal to the opening balance sheet position plus the changes recorded in the accumulation accounts, which are shown on the circle in figure 1, and are equal to the change in net worth for the sector. In the IMAs, we have chosen to use net lending/net borrowing as calculated from the capital account rather than the version calculated from the financial account, and, as mentioned above, the difference between the two measures (the statistical discrepancy) is recorded in the other volume changes account to be consistent with the balance sheet data.
Returning to our example, the household sector had a net worth of about $55.6 trillion at the end of 2009. In 2010, it saved about $0.6 trillion (as measured by the capital account). In addition, it gained about $2.6 trillion from changes in the prices of its assets. Further adding other changes of about $0.3 trillion resulting from other changes (and including the statistical discrepancy between the financial account, from which the balance sheet is derived, and the current account), the net worth of the end of 2010 thus amounted to about $59.1 trillion.
One point to note is that, for the household and nonfinancial business sectors, the balance sheet shows FFA estimates of the market value of real estate. These estimates are calculated using real estate price indices and net investment from BEA. For the financial business and government sectors, only the current-cost net stock of structures is shown because there are no reliable estimates for the market value of real estate. All balance sheets for domestic sectors show the current-cost net stock of equipment and software. For those sectors where total real estate is reported, it may be tempting to impute a value for land as the difference between the value of real estate and current-cost net stock of structures; this practice is not recommended, however, because the two measures are estimated independently and rely on different source data. For example, for the nonfinancial corporate business sector, the difference between real estate and net

6
stock of structures is slightly greater than zero in 2009, suggesting that the value of land owned by this sector in 2009 was negligible. Nevertheless, it is useful to analyze and question the relationship between real estate and structures in order to better understand the underlying source data and methods used to construct these statistics.
Table 1 Net Lending (+) or Net Borrowing (-) in the Capital and Financial Accounts, by Sector1
Sector 1970s 1980s 1990s 2000-2006 2007 2008 2009 2010 2011
1. All domestic sectors: C -16 -109 -160 -472 -704 -671 -455 -481 -453
F -17 -88 -10 -476 -473 -1678 -404 -646 -274
2. Households & nonprofits:
C
F
56 135 88 -168 -126 373 488 535 476
78 209 146 -235 164 525 406 833 1037
3. Nonfin. noncorp. business: C -22 -38 -26 -49 -74 -53 14 6 -6
F -22 -37 -28 -101 -122 -53 14 6 -14
4. Nonfin. corp. business: C -21 -13 -26 -23 -94 -7 389 377 422
F -42 -82 8 26 -206 -943 563 151 272
5. Financial business: C
F
5 -20 -2 72 -3 -47 275 157 125
2 7 44 118 108 -267 46 -209 -146
6. Federal government:
C
F
-32 -166 -160 -215 -315 -756 -1446 -1462 -1357
-33 -181 -169 -236 -344 -780 -1289 -1362 -1328
7. State & local govts: C
F
-2 -7 -34 -90 -93 -181 -175 -94 -113
1 -4 11 -49 -72 -161 -144 -65 -95
8. Rest of the world:
C
F
-2 -74 117 559 716 674 378 480 484
-3 58 112 569 618 737 246 254 393
9. Statistical discrepancy2 C 18 36 43 -86 -12 -2 77 1 -32
1. Data in billions. Rows designated by “C” represent net lending or net borrowing calculated from the capital account; rows designated by “F” represent net lending or borrowing calculated from the financial account. 2. Equals rest of the world capital account net lending (+) or net borrowing (-) (line 8) less all domestic sectors’ capital account net lending (+) or net borrowing (-) (line 1). Source: Integrated Macroeconomic Accounts, June 7, 2012
3. Uses of the IMAs The recent financial crisis has vividly shown that analyzing the change in net worth and its composition is critical to understanding the health, risks, and prospects of an economic sector. Net worth is a broad measure of the wealth of a sector, often used in conjunction with other variables, such as income and interest rates, to study variables such as consumption and saving. The IMAs enable one to analyze net worth and its composition, clarifying how the current balance sheet position came about by distinguishing between saving, borrowing, holding gains or losses, and other changes in volume.
As an example, we can look at the IMAs for the household and NPISH sector. In the first half of the last decade, the household sector shifted from being a major lending sector to a major borrowing sector (Table 1, line 2), rivaled only as a borrower by the federal government sector (line 6). It was at this same time that the rest of the world sector (line 8) became the predominant lending sector.

7
At the same time, household net worth surged rapidly and the ratio of household net worth to disposable personal income reached record levels (chart 1). This surge was caused not by elevated savings, but by sizable capital gains both on housing wealth and on stock-market wealth (chart 2).
Chart 1
Chart 2
Indeed, the ratio of both housing wealth and stock market wealth to disposable personal income
surged to historically unprecedented levels (chart 3). Not surprisingly, household debt also ballooned. The ratio of household debt to disposable personal income surged from around 90 percent at the beginning of the decade to an all-time high of around 130 percent in the middle of 2007 (chart 4).

8
Chart 3
Chart 4
This ratio dropped to 111 percent by the end of 2011 as consumers borrowed less and as a significant amount of mortgage debt was written off. As can be seen in Table 1, line 2, the household sector shifted back to being a major net lender in 2008.
Net borrowing by the federal government (table 1, line 6), on the other hand, ballooned to over $1.3 trillion in both 2009 and 2010. In 2009, the rest of the world sector (line 8) was a significant lender, along with the financial business sector (line 5). The nonfinancial corporate business sector (line 4), traditionally a net borrower, became a net lender in 2009, as capital expenditures remained relatively low and retained earnings elevated.

9
4. Challenges in linking current, capital and financial accounts One innovative feature of the integrated accounts is the ability to compare net lending/net
borrowing calculated from the capital account with the alternative measure calculated from the financial account. As discussed above, in the capital account measure, a sector’s net lending or net borrowing is the difference between its net saving (disposable income less current spending) and its net investment (gross purchases of “physical” capital less depreciation on its existing capital stock). In the financial account measure, a sector’s net lending/net borrowing is the difference between its net acquisition of financial assets and its net increase in liabilities. Thus, except for statistical discrepancies, the two measures of a sector’s net lending/net borrowing should be the same.
Chart 5
Chart 5 compares the capital account total net lending or net borrowing for all domestic sectors (the
black line) with the financial account measure (the red line). The two lines are very close to each other and hover around zero until about 1980. From that point forward, the U.S. becomes an increasingly larger net borrower vis-à-vis the rest of the world. The two measures of net lending/net borrowing remain fairly similar, although the financial account measure is more volatile, until around 2008, the year of the financial crisis, when the two lines diverge sharply. This divergence could be partly due to data sources subject to historical benchmark revisions, but is more likely due to data gaps in the financial accounts. These data gaps could reflect off-balance sheet data that have not been captured completely, such as derivatives, or transactions taking place at a level of business structure not currently included in any sector in the accounts, such as nonfinancial holding companies. Also, the treatment of intangibles in the capital and financial accounts could be inconsistent. These data gaps and differences were probably more significant during the financial crisis, and perhaps unsurprisingly, when you compare the two measures of net lending/net borrowing by sector, as shown in table 1 above, the greatest differences appear to be for the nonfinancial

10
corporate business sector (line 4) and the financial business sector (line 5). In 2009, the two measures of total NLNB (chart 5) moved closer together as the economy showed some improvement and have maintained a similar pattern in the most recent years.
Additional issues in comparing the capital account and financial account measures of net lending/net borrowing by sector could be due to the different treatment of debt charge-offs, as well as company- versus establishment-based statistics.
In the financial accounts, debt charge-offs are a component of NLNB, rather than of other changes in volume accounts, as suggested by the SNA. That is, if debt is charged off, net acquisition of assets falls and net lending decreases for the issuing sector. In other words, charge-offs are not distinguished from repayments. However in the NIPAs, charge-offs are not part of net lending/net borrowing as they do not directly change saving or investment. Before the most recent financial crisis, mortgage debt charge-offs for the financial sector were very small.5 With the financial crisis, however, charge-off rates increased rapidly from a few basis points to more than two percent as many houses entered foreclosure.6 Because the mortgage loans (an asset) are generally held by financial institutions and the corresponding mortgage debt is held by primarily by nonfinancial sectors, in particular households, charge-offs generate a discrepancy between the respective sectors’ net lending and borrowing computed from the capital and financial accounts. Chart 6 shows a rough measure of charge-offs for both residential and commercial mortgages7
Finally, in the capital accounts, net lending/net borrowing reflects a mix of company- and establishment-based statistics, while net lending/borrowing from the financial accounts primarily reflects institutional-based reporting. NIPA measures of profits and interest are derived primarily from IRS tabulations of business tax returns, which are reported on a consolidated basis. Therefore, financial activities of captive finance companies (a subsidiary whose purpose is to provide financing to customers buying the parent company's product) are not reflected in the profits of the financial sector. Unfortunately, this is not an easily remedied issue. BEA is actively working with IRS to identify and obtain additional information on the activities of subsidiaries, which should enable us to better understand the financial sector.
(the green line) exploding in 2008, which helps to explain the discrepancy in net lending/net borrowing beginning in 2008 (the distance between the black and the red line).
8
5 A precise series for charge-offs on debt held by financial institutions does not exist. In chart 6 we approximate the value of charge-offs on mortgage debt by applying the charge-off rate on mortgages held at banks to the total amount of outstanding mortgages. This is a rough approximation because the charge-off rate on mortgages held in pools could be different, and because we do not distinguish mortgages held by the financial sector from mortgages held by other sectors. 6 We thank Jim Kennedy and Maria Perozek for the analysis of the effects of charge-offs on the saving rate. 7 The charge-off measure is just a rough approximation based on the charge-off rates for mortgages held at banks. 8 In BEAs annual industry accounts (AIA), NIPA profits are converting from a company- to an establishment-basis primarily using employment data from the Economic Census. Obtaining additional information on subsidiaries from IRS would potentially improve the AIA estimates as well.

11
Chart 6
5. Future plans
5.1 Subsectoring finance Following the financial crisis that began in 2008, members of the G-20 established the G-20 Data
Gaps Initiative in an attempt to improve global financial statistics thereby potentially helping policy makers and market participants identify and address stresses in the financial system before another crisis occurs. One of the conclusions drawn was that sectoral data matter, and emphasis was placed on producing (and publishing) subsector detail for the financial sector. Specifically, one of the recommendations was “to develop a strategy to promote the compilation and dissemination of the balance sheet approach (BSA), flow of funds, and sectoral data more generally.” In February 2011, the IMF and OECD jointly organized a conference on, “Strengthening Sectoral Position and Flow Data in the Macroeconomic Accounts.” The following four financial subsectors, including their corresponding North American Industrial Classification System (NAICS) code, were proposed: 1) Central bank (521), 2) Other deposit-taking corporations (5221), 3) Insurance and pension funds (524 + 525110), and 4) Other financial business (remaining 52 and 55). The IMAs provide an excellent framework to address data gaps in the national accounts of a country and expanding the IMAs to include these additional tables should help analysts better evaluate the risk characteristics of different types of financial institutions.
While sufficient data exist to meet the subsectoring recommendations for the financial account, the current and capital accounts present a challenge. BEA and FRB initially attempted to follow the recommended subsectoring in the IMAs; however, we eventually concluded that there was insufficient data in IRS tax-return based estimates to accurately identify “other deposit-taking institutions” from “other financial business.” Specifically, the consolidated IRS tax return-based statistics for bank holding companies (NAICS 551111 – mapped to “other financial business”) include significant activity for subsidiaries classified as “other deposit-taking institutions” (NAICS 5221). To better understand the
-300.0
-200.0
-100.0
0.0
100.0
200.0
300.0
400.0
1995 2000 2005 2010
In B
illio
ns o
f Dol
lars
Net Lending/Net Borrowing, Financial Business
Capital Account Financial Account Charge-offs
Source: Integrated Macroeconomic Accounts, June 7, 2012

12
magnitude of activity of depository subsidiaries reported in IRS statistics as bank holding companies, BEA received a sample of bank holding company subsidiary data from 2010 preliminary IRS statistics. Our sample suggested that for 2010, within corporate bank holding companies, approximately 40% of receipts, 60% of interest received, and 20% of dividends received were attributable to subsidiaries associated with “other depository taking institutions,” rather than “other financial business.”
As mentioned in section 2.2 above, the nature of the company-based statistics presents some challenges for us and we are actively researching ways to address this. An additional challenge we faced with accommodating the proposed subsectors is that the NIPA industry-based estimates do not always contain sufficient NAICS detail. For example, the subsector “insurance and pension funds” reflects the sum of NAICS 524 (insurance) and NAICS 525110 (pension funds), however separate estimates for NAICS 525110 do not exist in the NIPAs.
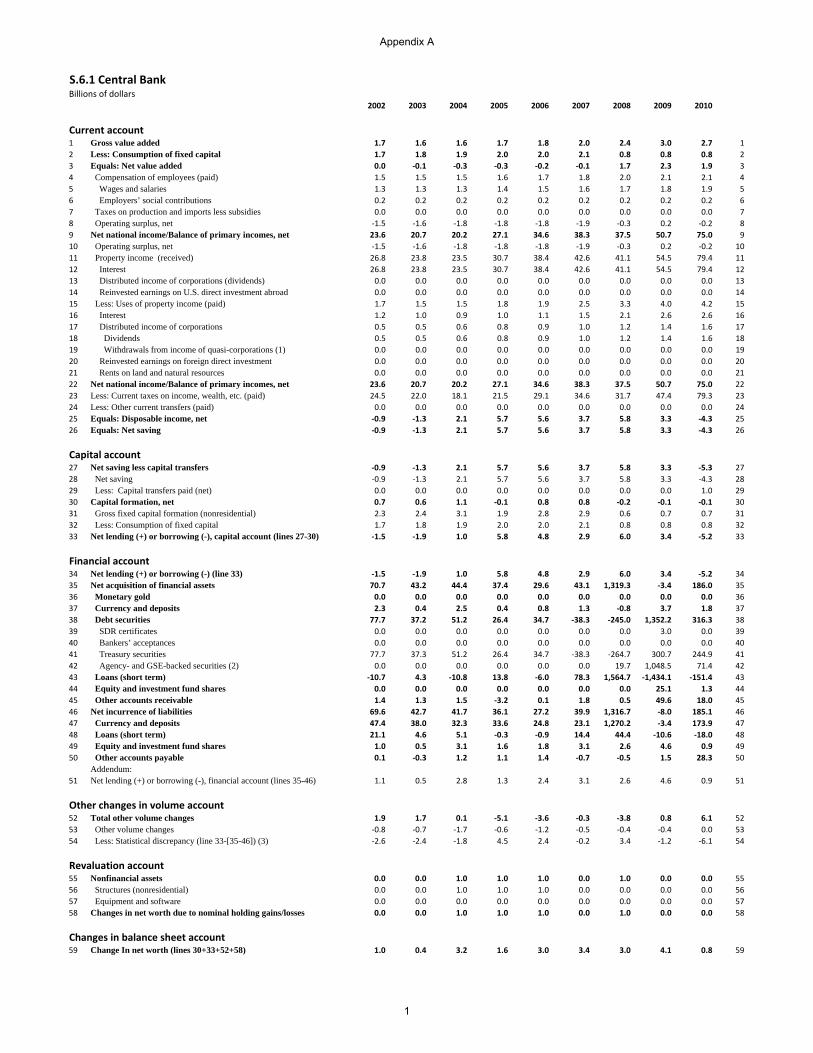
As a first step toward completing this financial subsectoring in the IMAs, we are proposing to combine “other deposit taking corporations” with “other financial business.” Even with combining two of the four subsectors, a number of assumptions are needed in order to derive the remaining subsectors. Nevertheless, publishing these additional tables should help analysts better evaluate the risk characteristics of different types of financial institutions. It should be noted that, with the exception of property income flows associated with government pensions, IMA estimates for total financial business (Table S.6 in the appendix) are unaffected by this proposal. It should also be emphasized that estimates presented for the subsectors are extremely preliminary and subject to change. Emphasis instead should be placed on the framework and methodologies described herein. The following sections briefly describe how each of the subsectors will be constructed.
5.1.1 Central Bank
The Central Bank, for purposes of the IMAs, is essentially defined as the Federal Reserve. The Federal Reserve is separately recognized under NAICS 521 and underlying detail already exists for many of the IMA series in the current, capital, financial, and balance sheet accounts. NIPA estimates for Federal Reserve (which underlie capital and current account data for this subsector) rely heavily on the Federal Reserve annual report as a primary data source, and include both the Federal Reserve Banks and the Federal Reserve Board. In this sector, gross value added is estimated from unpublished statistics from BEAs annual industry accounts (AIAs). For this specific industry/subsector, there is no distinction between company versus establishment so using AIA (establishment-based) in lieu of an indirectly derived NIPA (mostly company-based) estimate is not problematic. Compensation estimates are derived from unpublished NIPA detail, which are consistent with the AIA estimates. There are several series within the current and capital accounts for which no data are available (such as other current transfers and reinvested earnings on FDI abroad), and in these cases we have assumed that the values are zero. The net operating surplus (NOS) is derived residually.
In the financial accounts, the Central Bank subsector is defined as the monetary authority, that is, the assets and liabilities of the Federal Reserve Banks and the Treasury monetary accounts that supply or absorb bank reserves. It excludes the accounts of the Federal Reserve Board. For the financial accounts, the data come from the Federal Reserve statistical release H.4.1, Factors Affecting Reserve Balances. It is

13
worth noting that the net lending/net borrowing series shown for the Central Bank is somewhat confusing because of the way Central Bank operations appear in the accounts (for instance, currency and deposits are a liability of the Central Bank). However, looking separately at the assets and liabilities, both in the financial accounts and in the balance sheet, can help to understand the behavior of the Central Bank. For example, the loans extended to financial institutions in 2008 and the operations related to the quantitative easing policies since the crisis are reflected in the sharp increase in the Central Bank’s assets.
5.1.2 Insurance and pension funds
The insurance and pension fund subsector is defined as the NAICS insurance industry (524) plus pension fund industry (NAICS 525110). Within the current and capital accounts, estimating the insurance portion of this subsector is fairly straightforward because NIPA estimates for this industry currently exist and, in many cases, are published. Unfortunately, that is not the case with pension funds, as very little information currently exists in the NIPAs for this industry. Fortunately, most of the current and capital account series for pension funds are fairly small, with the exception of interest and dividends, which flow through pension funds into the household sector. Accordingly, we have assumed these small series, with no source data, are zero for pension funds and therefore only the receipts and payments of property income associated with pension funds are reflected in this subsector. Because these transactions pass through this subsector, there is no impact on net lending/net borrowing. Estimates for these flows were derived using data from multiple sources, but rely most heavily on statistics published in the FFAs (for pension asset compositions and interest rates), annual reports for Federal government retirement funds, IRS Form 5500 data, and statistics published in the Census Bureau Survey of Public-Employee Retirement Systems.9
In this proposal, we are including property income associated with both defined benefit and defined contribution plans.
10
In the financial accounts, the insurance sector is based on reports filed to insurance authorities. Of note, it does not include most insurance holding companies. For pensions, the financial account also reflects both defined benefit and defined contribution plans.
It is debatable whether or not property income associated with defined contribution plans should be reflected in this account at all, since the property income is considered to be owned directly by the household sector. Nevertheless, we thought it would be helpful to the users of these accounts to see the effect of both types of pension plans. Moreover, the financial accounts for this subsector, discussed next, reflect both defined benefit and defined contributions plans.
Looking at Table S.6.2 in the appendix, which shows preliminary estimates for the subsector, we can see that the industry’s share of gross value added is approximately 1/3 of that of the total financial sector. Operating surplus (table S.6.2, line 10), which is a profits-like measure that excludes income from interest and dividends, rebounded for the subsector in 2010, and was almost twice 2008 levels. In general, both the financial and capital accounts indicate that this subsector has been a net lender to the economy (chart 7).
9 We thank Marshall Reinsdorf for helpful comments regarding the treatment of pensions in the national income and product accounts. We also thank David Lenze, Dylan Rassier, and Benyam Tsehaye for providing estimates of pension-related dividends and interest. 10 Property income flows associated with government defined contribution plans were not available and therefore not reflected in the accompanying tables.

14
Chart 7
Chart 8
5.1.3 Other financial business (including other deposit-taking corporations) The other financial business subsector is calculated residually as total financial business (as shown in Table S.6.a) less the insurance and pension subsector, and less the Central Bank subsector. This subsector implicitly includes estimates for credit intermediaries, security brokerages, investment pools, other deposit taking corporations, and financial holding companies.
-25
0
25
50
75
100
125
150
2002 2003 2004 2005 2006 2007 2008 2009 2010
Bill
ions
ofD
olla
rs
Net Lending/Net Borrowing, Pension and Insurance Subsector
NLNB, Cap Acct NLNB, Fin Acct
-400
-300
-200
-100
0
100
200
300
2002 2003 2004 2005 2006 2007 2008 2009 2010
Billi
ons
of D
olla
rs
Net Lending/Net Borrowing, Other Financial Business
NLNB, Cap Acct NLNB, Fin Acct

15
Preliminary estimates show that other financial business accounts for approximately 2/3 of production for the financial sector. Looking at preliminary net lending/net borrowing for the sector (chart 8), financial NLNB is much more volatile than the corresponding measure in the capital account. There has also been a discrepancy between capital and financial accounts since 2008, which can be in part explained by the treatment of charge-offs, as explained in section 4.
5.1.4 Brief observations relating to proposed financial subsector data In interpreting the financial sector tables, it is important to highlight a few issues in the construction of net worth. As for all other sectors, net worth is the difference between assets and liabilities. However, the market value of the outstanding shares that were issued by the financial sector is recorded as a liability in the accounts. Therefore, declines in stock prices will cause an increase in net worth. As shown in chart 9, the large increases in net worth in 2007 and 2008 can be explained by the large decline in financial stock prices during the crisis, and should obviously not be interpreted as an increase in the value of these companies. In addition, at the moment, our measure of net worth does not include the market value of real estate held by financial companies. As a result, our financial balance sheets do not capture the large declines in commercial real estate during the crisis.
Chart 9
It is also interesting to point out a few facts about net lending/net borrowing of the financial sectors. Usually both the capital account and the financial account indicate that the pension and insurance subsector is a net lender for each year. There is a greater divergence in net lending/net borrowing trends for the other financial business subsector; in this subsector, NLNB for the financial account is much more volatile, with the lending and borrowing amounts much greater than in the capital account. As mentioned in sections above, conceptually the two measures should match, but disparities can arise due to differences in timing, source data, and other statistical differences. This subsector includes a wide variety of institutions with
-1500
-1000
-500
0
500
1000
1500
2000
2002 2003 2004 2005 2006 2007 2008 2009 2010
Financial Subsector Net Worth(in billions of dollars)
Insurance & Pensions FRB Other

16
different risk exposures and cyclical behaviors, and different portfolio composition, which could help explain the larger volatility of NLNB in the financial accounts. Separating the various types of institutions within the subsectors will be helpful in understanding the behavior of the series and the discrepancy between financial and capital accounts. A comparison of net lending/net borrowing for the subsectors can be found below in charts 10 and 11.
Chart 10
Chart 11
-300
-200
-100
0
100
200
300
2002 2003 2004 2005 2006 2007 2008 2009 2010
Bill
ion
s o
f D
olla
rs
Net Lending/Net Borrowing - Capital Account
Insurance/Pensions FRB Other Fin Bus.
-300
-200
-100
0
100
200
300
2002 2003 2004 2005 2006 2007 2008 2009 2010
Bill
ion
s o
f D
olla
rs
Net Lending/Net Borrowing- Financial Account
Insurance & Pensions FRB Other

17
5.2. Other Future Developments A current drawback of the IMAs, as pointed out by Palumbo and Parker (2009) and by Eichner, Kohn,
and Palumbo (2010), is that the accounts did not show the increased exposure of the financial business sector to house price risk because of the aggregation of the sector and of certain asset classes. As discussed earlier, the sector consolidation masked how leveraged some of the financial subsectors had become. In addition, structured financial products and traditional corporate bonds and commercial paper, which are group together as “debt securities” in the IMA, have very different risk characteristics. To address this drawback, we are examining the feasibility of separating the holdings of structured products from traditional debt instruments.
In addition to presenting additional detail for the financial business sector, we are also investigating the possibility of presenting households separately from nonprofit institutions serving households. These two sectors have notably different characteristics from one another and being able to analyze them separately would be helpful.11
In addition to these longer term projects, we believe there are a number of useful series and ratios (constructed from currently published IMA statistics) that could be explicitly added to the addenda of the IMAs. For example, in the household and nonprofit institutions serving households sector, the ratio of real estate to disposable income quickly reveals the housing “bubble” that peaked in the mid 2000’s. Another useful ratio might be the value of corporate equities to disposable income for households and institutions, which peaked in 1999 and then fell rapidly. A useful series that could be added to the household and institutions sector is household net worth from FRB’s Survey of Consumer Finances (SCF). A quick comparison showed household net worth measured indirectly in the IMAs tracks very well the mean household net worth measured directly in the SCF – an important validation for both sets of estimates.
We would also like to incorporate real estate values into the balance sheets for the financial and government sectors. Incorporating conservative estimates may be an improvement over assuming the value is zero.
12
The IMA have already proven to be valuable in studying the U.S. economy. The Federal Reserve and BEA will continue to work together to improve the presentation and data availability of these accounts so that in the future policymakers will be better able to see shifts in the financial climate of the U.S. prior to business cycle expansions and contractions.
For the financial business sector, including selected estimates from BEA’s AIAs might also be useful for comparison purposes. Including these types of related statistics can provide an important validity check and serves to further integrate economic accounts.
11 Here, the primary challenge for the financial accounts is that most data for nonprofit institutions is obtained from tax-return based data, which does not allow us precisely identify the different financial instruments required to make this split. 12 The SCF is a triennial interview survey of U.S. families, sponsored by the Board of Governors of the Federal Reserve System with the cooperation of the U.S. Department of the Treasury. For more information see: http://www.federalreserve.gov/Pubs/Bulletin/2012/articles/scf/scf.htm. For a comparison of the net worth estimates implied by the two datasets, see Alice Henriques and Joanne Hsu (2012).

18
REFERENCES Bond, Charlotte Anne, Teran Martin, Susan Hume McIntosh, and Charles Ian Mead (2007). “Integrated
Macroeconomic Accounts for the United States.” Survey of Current Business, Bureau of Economic Analysis, Department of Commerce, February 2007, pp 14-31.
Eichner, Matthew J., Donald L. Kohn, and Michael G. Palumbo (2010). “Financial Statistics for the United States
and the Crisis: What Did They Get Right, What Did They Miss, and How Should They Change?” Finance and Economics Discussion Series Paper No. 2010-20, Federal Reserve Board.
Enriques, Alice, and Joanne Hsu, Analysis of Wealth Using Micro and Macro Data: A Comparison of the Survey of
Consumer Finances and Flow of Funds Accounts. Presented at the NBER Conference on Research in Income and Wealth, Boston, MA August 2012.
European Commission, International Monetary Fund, Organization for Economic Co-operation and Development,
United Nations, and World Bank (2009). System of National Accounts 2008. New York. McIntosh, Susan Hume and Elizabeth Ball Holmquist (2011). “U.S. Flow of Funds Accounts.” Presented at
IMF/OECD “Conference on Strengthening Sectoral Position and Flow Data in the Macroeconomic Accounts” in Washington, D.C., February 28, 2011.
Palumbo, Michael G., and Jonathan A. Parker (2009). “The Integrated Financial and Real System of National
Accounts for the United States: Does It Presage the Financial Crisis?” American Economic Review 99, no. 2, May, pp. 80-86.
Teplin, Albert M., Rochelle Antoniewicz, Susan Hume McIntosh, Michael G. Palumbo, Genevieve Solomon,
Charles Ian Meade, Karin Moses, and Brent Moulton (2006), “Integrated Macroeconomic Accounts for the United States: Draft SNA-USA.” In A New Architecture for the U.S. National Accounts, ed. Dale W. Jorgenson, J. Steven Landefeld, and William D. Nordhaus, Chicago: University of Chicago Press, pp 471-540.
Wasshausen, David (2011). “Sectoral Balance Sheets for Nonfinancial Assets.” Paper presented at IMF/OECD “Conference on Strengthening Sectoral Position and Flow Data in the Macroeconomic Accounts” in Washington, D.C., March 2, 2011. http://www.imf.org/external/np/seminars/eng/2011/sta/pdf/usa.pdf
S.6.1 Central BankBillions of dollars
2002 2003 2004 2005 2006 2007 2008 2009 2010
Current account1 Gross value added 1.7 1.6 1.6 1.7 1.8 2.0 2.4 3.0 2.7 1
2 Less: Consumption of fixed capital 1.7 1.8 1.9 2.0 2.0 2.1 0.8 0.8 0.8 2
3 Equals: Net value added 0.0 ‐0.1 ‐0.3 ‐0.3 ‐0.2 ‐0.1 1.7 2.3 1.9 3
4 Compensation of employees (paid) 1.5 1.5 1.5 1.6 1.7 1.8 2.0 2.1 2.1 4
5 Wages and salaries 1.3 1.3 1.3 1.4 1.5 1.6 1.7 1.8 1.9 5
6 Employers’ social contributions 0.2 0.2 0.2 0.2 0.2 0.2 0.2 0.2 0.2 6
7 Taxes on production and imports less subsidies 0.0 0.0 0.0 0.0 0.0 0.0 0.0 0.0 0.0 7
8 Operating surplus, net ‐1.5 ‐1.6 ‐1.8 ‐1.8 ‐1.8 ‐1.9 ‐0.3 0.2 ‐0.2 8
9 Net national income/Balance of primary incomes, net 23.6 20.7 20.2 27.1 34.6 38.3 37.5 50.7 75.0 9
10 Operating surplus, net ‐1.5 ‐1.6 ‐1.8 ‐1.8 ‐1.8 ‐1.9 ‐0.3 0.2 ‐0.2 10
11 Property income (received) 26.8 23.8 23.5 30.7 38.4 42.6 41.1 54.5 79.4 11
12 Interest 26.8 23.8 23.5 30.7 38.4 42.6 41.1 54.5 79.4 12
13 Distributed income of corporations (dividends) 0.0 0.0 0.0 0.0 0.0 0.0 0.0 0.0 0.0 13
14 Reinvested earnings on U.S. direct investment abroad 0.0 0.0 0.0 0.0 0.0 0.0 0.0 0.0 0.0 14
15 Less: Uses of property income (paid) 1.7 1.5 1.5 1.8 1.9 2.5 3.3 4.0 4.2 15
16 Interest 1.2 1.0 0.9 1.0 1.1 1.5 2.1 2.6 2.6 16
17 Distributed income of corporations 0.5 0.5 0.6 0.8 0.9 1.0 1.2 1.4 1.6 17
18 Dividends 0.5 0.5 0.6 0.8 0.9 1.0 1.2 1.4 1.6 18
19 Withdrawals from income of quasi-corporations (1) 0.0 0.0 0.0 0.0 0.0 0.0 0.0 0.0 0.0 19
20 Reinvested earnings on foreign direct investment 0.0 0.0 0.0 0.0 0.0 0.0 0.0 0.0 0.0 20
21 Rents on land and natural resources 0.0 0.0 0.0 0.0 0.0 0.0 0.0 0.0 0.0 21
22 Net national income/Balance of primary incomes, net 23.6 20.7 20.2 27.1 34.6 38.3 37.5 50.7 75.0 22
23 Less: Current taxes on income, wealth, etc. (paid) 24.5 22.0 18.1 21.5 29.1 34.6 31.7 47.4 79.3 23
24 Less: Other current transfers (paid) 0.0 0.0 0.0 0.0 0.0 0.0 0.0 0.0 0.0 24
25 Equals: Disposable income, net ‐0.9 ‐1.3 2.1 5.7 5.6 3.7 5.8 3.3 ‐4.3 25
26 Equals: Net saving ‐0.9 ‐1.3 2.1 5.7 5.6 3.7 5.8 3.3 ‐4.3 26
Capital account27 Net saving less capital transfers ‐0.9 ‐1.3 2.1 5.7 5.6 3.7 5.8 3.3 ‐5.3 27
28 Net saving ‐0.9 ‐1.3 2.1 5.7 5.6 3.7 5.8 3.3 ‐4.3 28
29 Less: Capital transfers paid (net) 0.0 0.0 0.0 0.0 0.0 0.0 0.0 0.0 1.0 29
30 Capital formation, net 0.7 0.6 1.1 ‐0.1 0.8 0.8 ‐0.2 ‐0.1 ‐0.1 30
31 Gross fixed capital formation (nonresidential) 2.3 2.4 3.1 1.9 2.8 2.9 0.6 0.7 0.7 31
32 Less: Consumption of fixed capital 1.7 1.8 1.9 2.0 2.0 2.1 0.8 0.8 0.8 32
33 Net lending (+) or borrowing (-), capital account (lines 27-30) ‐1.5 ‐1.9 1.0 5.8 4.8 2.9 6.0 3.4 ‐5.2 33
Financial account34 Net lending (+) or borrowing (-) (line 33) ‐1.5 ‐1.9 1.0 5.8 4.8 2.9 6.0 3.4 ‐5.2 34
35 Net acquisition of financial assets 70.7 43.2 44.4 37.4 29.6 43.1 1,319.3 ‐3.4 186.0 35
36 Monetary gold 0.0 0.0 0.0 0.0 0.0 0.0 0.0 0.0 0.0 36
37 Currency and deposits 2.3 0.4 2.5 0.4 0.8 1.3 ‐0.8 3.7 1.8 37
38 Debt securities 77.7 37.2 51.2 26.4 34.7 ‐38.3 ‐245.0 1,352.2 316.3 38
39 SDR certificates 0.0 0.0 0.0 0.0 0.0 0.0 0.0 3.0 0.0 39
40 Bankers’ acceptances 0.0 0.0 0.0 0.0 0.0 0.0 0.0 0.0 0.0 40
41 Treasury securities 77.7 37.3 51.2 26.4 34.7 ‐38.3 ‐264.7 300.7 244.9 41
42 Agency- and GSE-backed securities (2) 0.0 0.0 0.0 0.0 0.0 0.0 19.7 1,048.5 71.4 42
43 Loans (short term) ‐10.7 4.3 ‐10.8 13.8 ‐6.0 78.3 1,564.7 ‐1,434.1 ‐151.4 43
44 Equity and investment fund shares 0.0 0.0 0.0 0.0 0.0 0.0 0.0 25.1 1.3 44
45 Other accounts receivable 1.4 1.3 1.5 ‐3.2 0.1 1.8 0.5 49.6 18.0 45
46 Net incurrence of liabilities 69.6 42.7 41.7 36.1 27.2 39.9 1,316.7 ‐8.0 185.1 46
47 Currency and deposits 47.4 38.0 32.3 33.6 24.8 23.1 1,270.2 ‐3.4 173.9 47
48 Loans (short term) 21.1 4.6 5.1 ‐0.3 ‐0.9 14.4 44.4 ‐10.6 ‐18.0 48
49 Equity and investment fund shares 1.0 0.5 3.1 1.6 1.8 3.1 2.6 4.6 0.9 49
50 Other accounts payable 0.1 ‐0.3 1.2 1.1 1.4 ‐0.7 ‐0.5 1.5 28.3 50
Addendum:51 Net lending (+) or borrowing (-), financial account (lines 35-46) 1.1 0.5 2.8 1.3 2.4 3.1 2.6 4.6 0.9 51
Other changes in volume account52 Total other volume changes 1.9 1.7 0.1 ‐5.1 ‐3.6 ‐0.3 ‐3.8 0.8 6.1 52
53 Other volume changes ‐0.8 ‐0.7 ‐1.7 ‐0.6 ‐1.2 ‐0.5 ‐0.4 ‐0.4 0.0 53
54 Less: Statistical discrepancy (line 33-[35-46]) (3) ‐2.6 ‐2.4 ‐1.8 4.5 2.4 ‐0.2 3.4 ‐1.2 ‐6.1 54
Revaluation account55 Nonfinancial assets 0.0 0.0 1.0 1.0 1.0 0.0 1.0 0.0 0.0 55
56 Structures (nonresidential) 0.0 0.0 1.0 1.0 1.0 0.0 0.0 0.0 0.0 56
57 Equipment and software 0.0 0.0 0.0 0.0 0.0 0.0 0.0 0.0 0.0 57
58 Changes in net worth due to nominal holding gains/losses 0.0 0.0 1.0 1.0 1.0 0.0 1.0 0.0 0.0 58
Changes in balance sheet account59 Change In net worth (lines 30+33+52+58) 1.0 0.4 3.2 1.6 3.0 3.4 3.0 4.1 0.8 59
Appendix A
1

S.6.1 Central BankBillions of dollars
2002 2003 2004 2005 2006 2007 2008 2009 2010
Balance sheet account (end of period)60 Total assets 762.4 805.5 850.4 888.1 918.2 961.6 2,281.3 2,277.4 2,463.3 60
61 Nonfinancial assets (4) 8.7 8.6 9.1 9.4 9.9 10.3 10.6 10.2 10.1 61
62 Structures (nonresidential) 5.2 5.4 5.9 6.6 7.1 7.6 8.1 7.6 7.5 62
63 Equipment and softwars 3.5 3.3 3.2 2.9 2.8 2.7 2.6 2.5 2.6 63
64 Financial assets 753.6 796.8 841.3 878.7 908.2 951.3 2,270.6 2,267.2 2,453.2 64
65 Monetary gold 11.0 11.0 11.0 11.0 11.0 11.0 11.0 11.0 11.0 65
66 Currency and deposits 51.8 54.9 58.6 56.2 58.2 61.8 61.9 65.7 68.1 66
67 Debt securities 631.6 668.9 720.0 746.4 781.1 742.8 497.8 1,850.0 2,166.3 67
68 SDR certificates 2.2 2.2 2.2 2.2 2.2 2.2 2.2 5.2 5.2 68
69 Bankers’ acceptances 0.0 0.0 0.0 0.0 0.0 0.0 0.0 0.0 0.0 69
70 Treasury securities 629.4 666.7 717.8 744.2 778.9 740.6 475.9 776.6 1,021.5 70
71 Agency- and GSE-backed securities (2) 0.0 0.0 0.0 0.0 0.0 0.0 19.7 1,068.3 1,139.6 71
72 Loans (short term) 39.5 43.8 33.0 46.8 40.8 119.1 1,683.8 249.7 98.4 72
73 Equity and investment fund shares 0.0 0.0 0.0 0.0 0.0 0.0 0.0 25.1 26.4 73
74 Other accounts receivable 19.6 18.2 18.6 18.1 17.0 16.5 16.1 65.6 83.0 74
75 Total liabilities and net worth 762.4 805.5 850.4 888.1 918.2 961.6 2,281.3 2,277.4 2,463.3 75
76 Liabilities 745.3 788.0 829.6 865.7 892.9 932.8 2,249.6 2,241.6 2,426.7 76
77 Currency and deposits 716.0 754.0 786.3 819.9 844.8 867.9 2,138.1 2,134.6 2,308.6 77
78 Loans (short term) 21.1 25.7 30.8 30.5 29.6 44.0 88.4 77.7 59.7 78
79 Equity and investment fund shares 8.4 8.8 11.9 13.5 15.3 18.5 21.1 25.6 26.5 79
80 Other accounts payable ‐0.2 ‐0.6 0.6 1.8 3.2 2.5 2.1 3.6 31.9 80
81 Net worth 17.1 17.5 20.7 22.3 25.3 28.7 31.7 35.8 36.6 81
(1) Consists of rental income of tenant-occupied housing and proprietors' income. Quasi-corporations are unincorporated enterprises that function as if they were corporations; they primarily cover their operating costs through sales, and they keep a complete set of financial records.
(2) Government-sponsored enterprises (GSEs) consist of Federal Home Loan Banks, Fannie Mae, Freddie Mac, Federal Agricultural Mortgage Corporation, Farm Credit System, the Financing Corporation, and the Resolution Funding Corporation, and they included the Student Loan Marketing Association until it was fully privatized in the fourth quarter of 2004.
(3) The statistical discrepancy is the difference between net lending or net borrowing derived in the capital account and the same concept derived in the financial account. The discrepancy reflects differences in source data, timing of recorded flows, and other statistical differences between the capital and financial accounts.
(4) Excludes land. Includes corporate and noncorporate financial business.
Appendix A
2

S.6.2 Insurance and Pension FundsBillions of dollars
2002 2003 2004 2005 2006 2007 2008 2009 2010
Current account1 Gross value added 271.5 283.8 310.8 317.3 365.6 369.3 355.1 368.9 455.5 1
2 Less: Consumption of fixed capital 17.1 17.9 19.2 20.2 20.8 21.8 31.6 32.4 32.9 2
3 Equals: Net value added 254.3 265.9 291.6 297.0 344.8 347.5 323.5 336.6 422.6 3
4 Compensation of employees (paid) 146.9 155.5 164.0 172.9 183.5 188.6 193.1 190.9 195.9 4
5 Wages and salaries 120.9 128.9 136.9 142.5 151.9 158.3 160.4 156.5 161.4 5
6 Employers’ social contributions 26.0 26.6 27.1 30.4 31.6 30.3 32.7 34.4 34.6 6
7 Taxes on production and imports less subsidies 16.2 17.6 19.4 20.3 21.8 22.2 20.5 22.6 22.8 7
8 Operating surplus, net 91.2 92.8 108.2 103.8 139.5 136.7 109.9 123.0 203.9 8
9 Net national income/Balance of primary incomes, net 33.8 32.5 51.1 23.5 45.5 43.5 28.8 59.7 57.4 9
10 Operating surplus, net 91.2 92.8 108.2 103.8 139.5 136.7 109.9 123.0 203.9 10
11 Property income (received) 440.3 432.5 459.0 483.3 543.2 603.4 550.4 568.8 483.1 11
12 Interest 364.1 351.3 364.9 387.4 413.4 457.4 399.0 430.4 346.7 12
13 Distributed income of corporations (dividends) 69.7 70.1 80.8 95.0 114.9 131.4 137.8 126.5 119.5 13
14 Reinvested earnings on U.S. direct investment abroad 6.5 11.0 13.2 0.9 15.0 14.7 13.5 11.9 16.9 14
15 Less: Uses of property income (paid) 497.6 492.7 516.1 563.7 637.2 696.6 631.5 632.1 629.6 15
16 Interest 398.4 391.8 404.1 433.8 486.3 530.1 467.1 487.4 478.4 16
17 Distributed income of corporations 99.1 99.2 105.5 125.1 143.1 160.1 160.3 143.2 142.3 17
18 Dividends 82.0 82.8 88.2 106.2 125.5 141.8 143.2 127.1 127.1 18
19 Withdrawals from income of quasi-corporations (1) 17.1 16.4 17.3 18.9 17.7 18.4 17.2 16.1 15.3 19
20 Reinvested earnings on foreign direct investment 0.2 1.8 6.5 4.8 7.7 6.4 4.1 1.5 8.8 20
21 Rents on land and natural resources 0.0 0.0 0.0 0.0 0.0 0.0 0.0 0.0 0.0 21
22 Net national income/Balance of primary incomes, net 33.8 32.5 51.1 23.5 45.5 43.5 28.8 59.7 57.4 22
23 Less: Current taxes on income, wealth, etc. (paid) 15.4 28.8 33.8 35.1 48.6 46.4 22.4 31.4 38.2 23
24 Less: Other current transfers (paid) -5.8 -29.1 -25.0 -35.8 -44.2 -13.4 22.5 -4.3 -3.1 24
25 Equals: Disposable income, net 24.2 32.8 42.3 24.2 41.1 10.5 -16.1 32.6 22.3 25
26 Equals: Net saving 24.2 32.8 42.3 24.2 41.1 10.5 -16.1 32.6 22.3 26
Capital account
27 Net saving less capital transfers 24.2 32.9 31.7 10.8 41.1 10.5 -10.0 40.2 26.9 27
28 Net saving 24.2 32.8 42.3 24.2 41.1 10.5 -16.1 32.6 22.3 28
29 Less: Capital transfers paid (net) 0.0 -0.1 10.6 13.4 0.0 0.0 -6.1 -7.6 -4.6 29
30 Capital formation, net 0.4 2.5 2.8 -0.1 0.3 1.6 2.7 1.9 1.8 30
31 Gross fixed capital formation (nonresidential) 17.5 20.4 22.0 20.1 21.1 23.4 34.3 34.2 34.7 31
32 Less: Consumption of fixed capital 17.1 17.9 19.2 20.2 20.8 21.8 31.6 32.4 32.9 32
33 Net lending (+) or borrowing (-), capital account (lines 23.8 30.5 28.9 11.0 40.8 9.0 -12.8 38.3 25.1 33
Financial account
34 Net lending (+) or borrowing (-) (line 33) 23.8 30.5 28.9 11.0 40.8 9.0 -12.8 38.3 25.1 34
35 Net acquisition of financial assets 487.0 500.7 495.4 393.3 438.9 363.8 251.3 265.9 279.0 35
36 Currency and deposits 9.1 24.0 -4.4 -4.3 15.3 25.0 10.2 -23.5 10.1 36
37 Debt securities 248.2 365.4 305.0 281.6 302.7 217.1 149.7 372.2 290.5 37
38 Commercial paper 7.4 -29.4 -17.4 3.6 12.7 0.8 0.1 -10.3 -20.9 38
39 Treasury securities 57.6 13.3 25.9 27.9 20.5 -20.6 74.0 211.4 127.8 39
40 Agency- and GSE-backed securities (2) 90.5 103.8 39.9 33.6 79.0 61.1 -0.5 -71.3 -28.9 40
41 Municipal securities 9.6 50.9 45.0 47.6 27.7 40.0 15.3 13.6 18.3 41
42 Corporate and foreign bonds 58.5 202.2 170.5 128.8 127.0 102.4 -2.5 167.0 128.5 42
43 Nonmarketable government securities 24.5 24.7 40.9 40.0 35.8 33.3 63.3 61.9 65.7 43
44 Loans 8.0 6.6 8.0 18.7 31.1 35.6 52.6 -21.6 -7.9 44
45 Short term 0.2 -3.6 0.8 5.1 14.2 16.0 35.5 -7.2 -1.0 45
46 Long term 7.8 10.2 7.2 13.5 16.8 19.6 17.1 -14.4 -7.0 46
47 Equity and investment fund shares 213.7 97.7 196.1 83.8 42.2 37.7 -5.4 -55.5 17.9 47
48 Corporate equities 83.0 92.5 83.2 19.1 -76.6 -107.5 -75.1 -153.1 -46.4 48
49 Mutual fund shares 99.5 3.0 99.0 54.9 98.8 113.6 23.3 87.3 78.1 49
50 Money market mutual fund shares 16.9 -2.9 2.4 -2.4 16.0 7.5 33.9 -8.1 -17.1 50
51 Equity in government -sponsored enterprises (2) 0.2 0.7 0.6 -0.1 0.0 0.6 1.0 -0.3 0.0 51
52 U.S. direct investment abroad 14.1 4.4 10.9 12.2 3.9 23.4 11.5 18.8 3.4 52
53 Insurance, pension and standardized guarantee schem 14.6 -17.3 -36.8 -2.3 -3.0 31.7 42.0 7.7 -3.0 53
54 Other accounts receivable -6.5 24.3 27.5 15.9 50.6 16.7 2.2 -13.5 -28.5 54
55 Net incurrence of liabilities 435.0 442.8 424.0 353.9 395.0 290.5 241.4 141.3 275.1 55
56 Loans (short term) 13.9 4.9 0.9 8.0 2.9 12.8 20.8 -8.8 -4.6 56
57 Equity and investment fund shares 15.1 1.8 -2.8 -0.9 11.7 -32.5 4.6 17.7 13.8 57
58 Corporate equity issues -0.3 0.2 -21.3 -10.8 -28.5 -43.9 -10.3 -6.2 -17.5 58
59 Foreign direct investment in the United States 11.4 -2.2 16.0 0.2 37.5 6.1 27.4 14.6 9.1 59
60 Investment by parent 4.0 3.8 2.5 9.7 2.7 5.3 -12.5 9.3 22.2 60
61 Insurance, pension and standardized guarantee schem 399.8 405.5 414.0 351.0 345.0 294.6 272.8 174.3 242.0 61
62 Other accounts payable 6.2 30.6 12.0 -4.3 35.5 15.6 -56.8 -41.8 23.9 62
Addendum:63 Net lending (+) or borrowing (-), financial account (lines 3 52.0 57.9 71.4 39.4 43.9 73.2 9.9 124.5 3.8 63
3
Appendix A

S.6.2 Insurance and Pension FundsBillions of dollars
2002 2003 2004 2005 2006 2007 2008 2009 2010
Other changes in volume account
64 Total other volume changes 57.8 7.9 36.8 5.8 -54.4 63.0 97.0 50.7 -30.3 64
65 Disaster losses 0.0 0.0 0.2 0.4 0.0 0.0 0.1 0.0 0.0 65
66 Other volume changes 29.6 -19.6 -5.9 -23.0 -57.5 -1.3 74.2 -35.5 -9.0 66
67 Less: Statistical discrepancy (line 33-[35-55]) (3) -28.2 -27.4 -42.5 -28.4 -3.1 -64.2 -22.7 -86.2 21.3 67
Revaluation account
68 Nonfinancial assets 0.8 1.5 67.7 -55.1 13.8 8.3 13.4 -9.5 -1.7 68
69 Structures (nonresidential) 1.8 2.2 67.5 -55.2 12.5 8.9 12.3 -8.1 -0.3 69
70 Equipment and software -0.9 -0.7 0.2 0.1 1.3 -0.6 1.1 -1.4 -1.4 70
71 Financial assets -873.7 1,305.4 611.4 586.7 1,101.4 426.4 -3,327.3 1,408.1 1,033.2 71
72 Corporate equities -733.8 1,053.1 510.8 323.3 825.9 263.6 -2,343.7 968.1 742.2 72
73 Mutual fund shares -159.1 249.0 104.0 259.8 276.2 165.0 -953.1 430.2 275.2 73
74 U.S. direct investment abroad 19.3 3.4 -3.4 3.6 -0.8 -2.2 -30.6 9.7 15.8 74
75 Liabilities -916.8 1,394.0 617.4 576.1 1,187.2 214.3 -3,555.6 1,440.8 1,024.1 75
76 Corporate equity issues -63.7 157.8 61.5 29.6 139.8 -192.8 -386.4 49.4 42.5 76
77 Foreign direct investment in the United States -3.6 4.1 -2.8 -2.3 7.8 -32.0 -61.3 20.6 14.4 77
78 Pension fund reserves -849.5 1,232.0 558.7 548.9 1,039.6 439.1 -3,107.9 1,370.7 967.2 78
79 Investment by parent 0.0 0.0 0.0 0.0 0.0 0.0 0.0 0.0 0.0 79
80 Changes in net worth due to nominal holding gains/loss 44.0 -87.0 61.7 -44.5 -72.1 220.3 241.7 -42.2 7.4 80
Changes in balance sheet account
81 Change In net worth (lines 30+33+64+80) 126.0 -46.2 130.2 -27.9 -85.4 293.8 328.7 48.7 4.0 81
Balance sheet account (end of period)
82 Total assets 10,967.8 12,867.0 14,100.3 15,013.0 16,585.2 17,406.2 14,200.6 15,951.2 17,311.5 82
83 Nonfinancial assets (4) 198.5 207.5 287.6 234.5 250.5 264.1 281.1 273.8 273.9 83
84 Structures (nonresidential) 124.7 127.3 201.2 146.5 159.8 171.0 183.5 175.9 174.4 84
85 Equipment and softwars 73.8 80.2 86.4 88.0 90.6 93.0 97.7 97.8 99.4 85
86 Financial assets 10,769.3 12,659.5 13,812.6 14,778.5 16,334.7 17,142.1 13,919.4 15,677.4 17,037.6 86
87 Currency and deposits 143.5 167.5 163.2 158.9 174.1 199.1 209.4 185.9 196.0 87
88 Debt securities 4,555.4 4,920.9 5,225.8 5,488.2 5,756.0 5,973.1 6,122.8 6,507.6 6,798.0 88
89 Commercial paper 150.2 120.7 103.4 107.0 119.6 120.4 120.5 110.3 89.4 89
90 Treasury securities 474.0 487.2 513.1 541.1 561.6 541.1 615.0 826.4 954.2 90
91 Agency- and GSE-backed securities (2) 824.2 928.0 967.9 1,001.5 1,080.5 1,141.6 1,141.1 1,069.8 1,040.8 91
92 Municipal securities 203.7 254.7 299.7 347.3 375.1 415.1 430.4 444.0 462.3 92
93 Corporate and foreign bonds 2,113.1 2,315.3 2,485.8 2,608.4 2,700.5 2,802.9 2,800.5 2,980.0 3,108.5 93
94 Nonmarketable government securities 790.3 815.0 855.9 882.9 918.7 952.0 1,015.3 1,077.2 1,142.9 94
95 Loans 450.5 457.1 465.1 483.8 514.8 550.4 603.0 568.8 560.9 95
96 Short term 167.0 163.4 164.3 169.4 183.6 199.6 235.1 215.3 214.3 96
97 Long term 283.4 293.7 300.9 314.4 331.2 350.8 367.9 353.5 346.5 97
98 Equity and investment fund shares 4,947.6 6,350.7 7,158.1 7,828.6 8,972.2 9,436.2 6,103.5 7,456.1 8,507.2 98
99 Corporate equities 3,549.5 4,695.1 5,289.0 5,631.5 6,380.8 6,536.9 4,118.2 4,933.2 5,629.1 99
100 Mutual fund shares 1,178.8 1,430.8 1,633.8 1,948.5 2,323.6 2,602.2 1,672.5 2,190.0 2,543.3 100
101 Money market fund shares 127.6 124.7 127.1 124.7 140.7 148.2 182.0 173.9 156.8 101
102 Equity in government-sponsored enterprises (2) 0.5 1.1 1.7 1.6 1.6 2.2 3.2 2.9 2.9 102
103 U.S. direct investment abroad 91.2 99.0 106.5 122.3 125.4 146.7 127.6 156.0 175.2 103
104 Insurance, pension and standardized guarantee sche 319.5 387.7 397.6 405.5 453.6 502.4 392.5 485.4 531.4 104
105 Other accounts receivable 352.7 375.7 402.8 413.5 464.0 480.9 488.3 473.7 444.2 105
106 Total liabilities and net worth 10,967.8 12,867.0 14,100.3 15,013.0 16,585.2 17,406.2 14,200.6 15,951.2 17,311.5 106
107 Liabilities 10,995.9 12,941.4 14,044.4 14,985.0 16,642.6 17,169.7 13,635.4 15,337.4 16,693.7 107
108 Loans (short-term) 20.0 24.8 25.7 33.7 36.6 49.4 70.2 61.4 56.8 108
109 Equity and investment fund shares 790.3 954.1 1,010.0 1,036.4 1,195.7 938.4 495.4 583.1 653.9 109
110 Corporate equity issues 657.8 815.8 856.1 874.8 986.1 749.4 352.7 396.0 420.9 110
111 Foreign direct investment in the United States 112.9 114.8 128.0 125.9 171.2 145.3 111.4 146.7 170.2 111
112 Investment by parent 19.6 23.4 25.9 35.6 38.3 43.7 31.2 40.5 62.7 112
113 Insurance, pension and standardized guarantee sche 10,058.7 11,807.1 12,840.5 13,754.8 15,205.9 15,960.3 12,884.5 14,550.4 15,827.6 113
114 Other accounts payable 126.8 155.3 168.1 160.0 204.4 221.6 185.4 142.6 155.4 114
115 Net worth -28.1 -74.3 55.9 28.0 -57.4 236.4 565.1 613.8 617.8 115
(1) Consists of rental income of tenant-occupied housing and proprietors' income. Quasi-corporations are unincorporated enterprises that function as if they were corporations; they primarily cover their operating costs through sales, and they keep a complete set of financial records.
(2) Government-sponsored enterprises (GSEs) consist of Federal Home Loan Banks, Fannie Mae, Freddie Mac, Federal Agricultural Mortgage Corporation, Farm Credit System, the Financing Corporation, and the Resolution Funding Corporation, and they included the Student Loan Marketing Association until it was fully privatized in the fourth quarter of 2004.
(3) The statistical discrepancy is the difference between net lending or net borrowing derived in the capital account and the same concept derived in the financial account. The discrepancy reflects differences in source data, timing of recorded flows, and other statistical differences between the capital and financial accounts.
(4) Excludes land. Includes corporate and noncorporate financial business.
4
Appendix A

S.6.3 Other Financial BusinessBillions of dollars
2002 2003 2004 2005 2006 2007 2008 2009 2010
Current account1 Gross value added 610.0 636.9 652.0 766.8 822.0 747.3 673.5 747.7 914.7 1
2 Less: Consumption of fixed capital 88.6 93.3 99.3 105.1 110.0 116.7 140.3 143.8 145.4 2
3 Equals: Net value added 521.4 543.6 552.7 661.7 712.0 630.6 533.2 604.0 769.3 3
4 Compensation of employees (paid) 298.9 310.4 331.9 367.3 399.3 419.9 415.3 375.0 386.7 4
5 Wages and salaries 248.9 263.4 281.8 310.6 339.0 361.2 351.1 312.8 323.9 5
6 Employers’ social contributions 50.1 46.9 50.1 56.7 60.2 58.7 64.2 62.1 62.8 6
7 Taxes on production and imports less subsidies 21.3 22.3 24.0 25.8 28.6 31.2 30.7 32.1 32.3 7
8 Operating surplus, net 201.2 210.9 196.9 268.6 284.2 179.6 87.1 197.0 350.3 8
9 Net national income/Balance of primary incomes, net 155.2 178.6 180.7 221.1 194.4 118.8 -24.0 149.5 182.5 9
10 Operating surplus, net 201.2 210.9 196.9 268.6 284.2 179.6 87.1 197.0 350.3 10
11 Property income (received) 865.2 772.1 983.0 1,329.6 1,811.4 2,229.7 1,895.4 1,163.0 1,228.0 11
12 Interest 838.1 738.4 928.4 1,263.4 1,715.4 2,096.6 1,761.4 1,060.5 1,108.2 12
13 Distributed income of corporations (dividends) 19.5 23.8 37.7 64.2 69.4 100.1 98.2 62.6 70.8 13
14 Reinvested earnings on U.S. direct investment abroad 7.6 9.9 16.9 2.1 26.6 32.9 35.8 39.8 49.1 14
15 Less: Uses of property income (paid) 1,132.3 1,034.9 1,288.2 1,707.1 2,295.9 2,725.9 2,390.0 1,601.1 1,592.2 15
16 Interest 991.3 889.4 1,095.3 1,486.9 2,024.8 2,427.7 2,145.1 1,332.3 1,264.9 16
17 Distributed income of corporations 140.9 144.8 190.1 217.0 266.0 294.6 241.9 267.9 319.9 17
18 Dividends 103.0 110.1 153.3 177.9 213.7 254.0 223.9 228.1 278.1 18
19 Withdrawals from income of quasi-corporations (1) 37.8 34.8 36.8 39.1 52.2 40.6 17.9 39.8 41.7 19
20 Reinvested earnings on foreign direct investment 0.1 0.7 2.8 3.2 5.2 3.7 3.0 0.9 7.4 20
21 Rents on land and natural resources 0.0 0.0 0.0 0.0 0.0 0.0 0.0 0.0 0.0 21
22 Net national income/Balance of primary incomes, net 155.2 178.6 180.7 221.1 194.4 118.8 -24.0 149.5 182.5 22
23 Less: Current taxes on income, wealth, etc. (paid) 55.3 60.1 67.2 84.0 87.9 70.7 27.5 18.6 64.3 23
24 Less: Other current transfers (paid) 13.9 15.9 15.5 19.2 18.2 18.0 23.1 23.0 18.1 24
25 Equals: Disposable income, net 86.1 102.6 98.0 117.9 88.2 30.0 -74.6 108.0 100.0 25
26 Equals: Net saving 86.1 102.6 98.0 117.9 88.2 30.0 -74.6 108.0 100.0 26
Capital account27 Net saving less capital transfers 86.1 102.5 92.4 103.6 88.2 30.0 -20.2 222.3 137.9 27
28 Net saving 86.1 102.6 98.0 117.9 88.2 30.0 -74.6 108.0 100.0 28
29 Less: Capital transfers paid (net) 0.0 0.1 5.6 14.3 0.0 0.0 -54.4 -114.3 -37.9 29
30 Capital formation, net 27.9 19.3 30.7 28.2 28.9 44.5 19.8 -10.6 0.9 30
31 Gross fixed capital formation (nonresidential) 116.6 112.6 130.0 133.3 138.9 161.3 160.1 133.2 146.3 31
32 Less: Consumption of fixed capital 88.6 93.3 99.3 105.1 110.0 116.7 140.3 143.8 145.4 32
33 Net lending (+) or borrowing (-), capital account (lines 27-30) 58.1 83.2 61.7 75.3 59.4 -14.5 -39.9 232.9 137.0 33
Financial account34 Net lending (+) or borrowing (-) (line 33) 58.1 83.2 61.7 75.3 59.4 -14.5 -39.9 232.9 137.0 34
35 Net acquisition of financial assets 1,743.2 2,236.4 2,426.2 2,880.6 3,659.7 4,398.0 3,035.9 -1,854.8 -1,143.9 35
36 Currency and deposits -22.8 -66.7 35.8 -1.1 44.5 143.1 1,008.1 255.9 -153.1 36
37 Debt securities 560.7 634.4 107.1 307.3 781.9 933.7 1,546.5 -782.4 127.0 37
38 Commercial paper -137.6 -135.1 50.8 192.7 219.7 -95.6 34.1 -383.1 -106.1 38
39 Treasury securities 61.1 37.6 -129.7 -5.9 36.9 166.9 626.7 -71.5 88.7 39
40 Agency- and GSE-backed securities (2) 448.8 315.9 -208.7 -222.7 56.9 240.5 839.7 -373.5 40.6 40
41 Municipal securities 45.9 50.4 42.0 65.0 95.7 140.1 36.4 2.0 11.1 41
42 Corporate and foreign bonds 142.7 365.5 352.9 278.4 372.8 481.9 9.6 43.5 92.7 42
43 Loans 933.7 1,099.7 1,573.4 1,922.1 2,000.4 2,218.9 28.1 -1,339.5 -814.8 43
44 Short term 46.0 120.6 372.0 528.7 625.3 1,170.1 -43.5 -1,067.0 -319.3 44
45 Long term 887.7 979.1 1,201.3 1,393.5 1,375.2 1,048.8 71.6 -272.4 -495.5 45
46 Equity and investment fund shares 171.7 244.0 467.1 428.5 476.0 961.0 613.9 -23.3 -60.0 46
47 Corporate equities 86.9 165.5 246.3 217.3 200.9 273.8 66.2 179.6 107.2 47
48 Mutual fund shares 1.5 -5.6 -1.9 -2.7 3.8 3.6 1.4 14.1 -5.7 48
49 Money market mutual fund shares -30.9 -64.5 -107.0 37.8 44.9 326.3 270.0 -162.8 -141.0 49
50 Equity in government -sponsored enterprises (2) 1.7 1.8 1.8 2.1 0.0 7.7 -6.3 0.3 -3.2 50
51 U.S. direct investment abroad 9.3 19.9 32.9 -0.7 21.9 83.6 54.9 5.0 25.9 51
52 Stock in Federal Reserve Banks 1.0 0.5 3.1 1.6 1.8 3.1 2.6 4.6 0.9 52
53 Investment in subsidiaries 102.2 126.4 291.9 173.2 202.8 263.1 225.0 -64.1 -44.2 53
54 Insurance, pension and standardized guarantee schemes 0.0 0.0 0.0 0.0 7.9 16.2 5.3 2.9 8.2 54
55 Other accounts receivable 99.6 325.0 242.9 223.6 349.0 125.0 -166.0 31.8 -251.3 55
56 Net incurrence of liabilities 1,767.6 2,076.5 2,484.8 2,614.7 3,443.1 4,366.3 3,315.2 -1,771.2 -930.0 56
57 Currency and deposits 335.8 427.7 580.2 584.1 591.4 513.4 938.9 243.5 129.1 57
58 Debt securities 845.5 1,010.0 805.9 1,039.2 1,323.3 1,504.8 362.8 -1,095.8 -731.1 58
59 Agency- and GSE-backed securities (2) 546.7 586.2 115.8 80.4 328.2 905.7 768.7 -60.1 -46.9 59
60 Corporate bonds 398.8 487.3 668.5 744.6 798.8 710.6 -280.3 -587.6 -582.5 60
61 Commercial paper -99.9 -63.5 21.7 214.2 196.3 -111.4 -125.6 -448.2 -101.7 61
62 Loans 70.7 361.1 305.1 417.2 562.7 555.7 -135.3 -1,044.5 -425.4 62
63 Short term 59.5 352.2 279.6 403.1 556.1 551.0 -142.0 -1,047.8 -425.6 63
64 Long term 11.2 8.9 25.5 14.1 6.6 4.7 6.8 3.4 0.2 64
65 Equity and investment fund shares 342.8 253.9 651.4 699.2 919.7 1,483.6 1,749.2 236.1 84.5 65
66 Money market mutual fund shares -16.7 -207.5 -136.5 127.0 305.3 720.9 724.2 -499.0 -502.9 66
67 Corporate equity issues 71.8 65.9 139.6 89.3 88.0 222.5 647.9 320.5 208.3 67
68 Mutual fund shares 181.1 288.6 298.2 260.2 336.8 364.7 31.0 490.5 389.3 68
69 Equity in government -sponsored enterprises (2) 2.0 3.2 2.5 1.9 0.2 9.1 -4.2 0.0 -2.7 69
70 Foreign direct investment in the United States -1.8 26.1 34.2 13.7 14.5 3.2 93.3 31.5 41.0 70
71 Equity in noncorporate business 0.6 -3.4 -4.2 -1.2 -6.8 2.4 11.5 -3.6 0.4 71
72 Investment by parent 105.7 81.1 317.6 208.4 181.7 160.8 245.5 -103.8 -48.8 72
73 Other accounts payable 172.7 23.8 142.1 -124.8 46.0 308.7 399.5 -110.6 12.8 73
Addendum:74 Net lending (+) or borrowing (-), financial account (lines 35-56) -24.4 159.9 -58.6 265.9 216.7 31.9 -279.3 -83.5 -213.8 74
Other changes in volume account75 Total other volume changes 16.8 2.4 -97.6 153.7 90.3 -158.3 -441.1 409.7 -331.7 75
76 Disaster losses 0.0 0.0 1.5 1.3 0.0 0.0 0.5 0.0 0.0 76
77 Other volume changes 99.3 -74.0 21.1 -38.3 -67.0 -203.5 -200.7 728.6 21.7 77
78 Less: Statistical discrepancy (line 33-[35-56]) (3) 82.5 -76.7 120.3 -190.6 -157.3 -46.4 239.4 316.4 350.8 78
5
Appendix A

S.6.3 Other Financial BusinessBillions of dollars
2002 2003 2004 2005 2006 2007 2008 2009 2010
Revaluation account79 Nonfinancial assets 32.0 38.5 19.7 156.0 84.1 49.0 50.4 -44.3 -2.5 79
80 Structures (nonresidential) 21.6 18.9 0.9 137.3 61.2 36.9 47.0 -42.2 1.7 80
81 Equipment and software 10.3 19.6 18.7 18.7 23.0 12.1 4.5 -2.0 -4.1 81
82 Financial assets -729.9 840.1 590.7 417.5 830.4 505.2 -2,842.7 1,237.4 747.1 82
83 Corporate equities -735.6 809.8 534.7 389.5 790.7 455.9 -2,872.7 1,223.1 716.7 83
84 Mutual fund shares -3.5 3.6 2.0 1.0 3.3 1.3 -11.3 11.7 4.7 84
85 U.S. direct investment abroad 9.1 26.6 54.0 27.1 36.5 48.0 41.4 2.6 25.7 85
86 Liabilities -994.6 1,380.7 890.3 627.8 1,312.3 -424.6 -4,512.6 2,113.3 1,060.6 86
87 Corporate equity issues -303.2 638.1 397.3 232.7 576.8 -791.6 -1,978.0 394.0 474.7 87
88 Mutual fund shares -678.1 727.2 483.8 352.4 682.6 396.0 -2,424.7 1,035.8 583.7 88
89 Foreign direct investment in the United States -11.5 4.3 6.8 11.7 14.7 -24.7 -96.3 1.8 3.0 89
90 Equity in noncorporate business -1.9 11.4 2.4 1.7 4.9 -0.6 -13.6 6.3 1.3 90
91 Investment by parent 0.0 -0.1 0.0 29.0 33.2 -3.7 0.0 675.6 -2.0 91
92 Changes in net worth due to nominal holding gains/losses 296.6 -502.2 -280.0 -54.3 -397.6 978.9 1,720.3 -920.2 -316.0 92
Changes in balance sheet account93 Change In net worth (lines 30+33+75+92) 399.4 -397.0 -285.3 203.0 -219.0 851.9 1,260.5 -285.7 -507.2 93
Balance sheet account (end of period)94 Total assets 28,332.4 31,213.0 34,160.5 37,473.1 41,997.1 46,955.2 47,526.7 47,429.6 46,498.3 94
95 Nonfinancial assets (4) 940.7 978.0 1,000.2 1,160.5 1,250.6 1,317.3 1,386.5 1,331.7 1,330.1 95
96 Structures (nonresidential) 537.3 552.9 548.6 685.8 747.1 788.6 842.7 801.5 796.6 96
97 Equipment and softwars 403.4 425.1 451.6 474.5 503.6 528.8 543.6 530.4 533.6 97
98 Financial assets 27,391.8 30,235.1 33,160.4 36,312.7 40,746.6 45,637.9 46,140.4 46,097.9 45,168.2 98
99 Currency and deposits 588.2 521.5 557.2 556.2 600.9 744.1 1,787.0 2,057.4 1,904.3 99
100 Debt securities 7,468.0 7,939.7 8,067.0 8,374.3 9,145.7 10,079.4 11,625.6 10,853.1 10,496.0 100
101 Commercial market paper 799.8 664.9 715.5 908.2 1,124.7 1,029.1 1,062.9 679.7 573.6 101
102 Treasury securities 528.3 490.0 360.3 354.3 386.9 553.7 1,180.4 1,109.0 1,197.7 102
103 Agency- and GSE-backed securities (2) 3,488.2 3,639.6 3,450.9 3,228.2 3,283.2 3,523.7 4,363.4 4,044.3 3,622.3 103
104 Municipal securities 829.7 880.0 922.1 987.1 1,082.4 1,222.5 1,258.8 1,260.8 1,271.9 104
105 Corporate and foreign bonds 1,821.8 2,265.3 2,618.2 2,896.5 3,268.6 3,750.5 3,760.1 3,759.2 3,830.4 105
106 Loans 12,838.0 13,981.9 15,570.1 17,492.2 19,473.6 21,682.1 21,709.8 20,410.4 19,630.7 106
107 Short term 5,136.3 5,289.3 5,661.3 6,190.0 6,795.0 7,954.7 7,910.9 6,883.9 6,599.7 107
108 Long term 7,701.8 8,692.5 9,908.7 11,302.2 12,678.6 13,727.4 13,799.0 13,526.6 13,031.1 108
109 Equity and investment fund shares 4,576.4 5,660.5 6,718.4 7,564.5 8,904.0 10,370.3 8,141.5 10,031.8 10,718.8 109
110 Corporate equities 2,424.7 3,399.9 4,181.1 4,787.7 5,779.3 6,509.0 3,702.3 5,105.1 5,928.9 110
111 Mutual fund shares 23.1 21.2 21.3 19.6 26.6 31.6 21.6 47.4 46.5 111
112 Money market fund shares 552.6 488.1 381.1 418.9 463.9 790.2 1,060.3 897.5 756.5 112
113 Equity in government-sponsored enterprises (2) 34.7 36.6 38.4 40.4 40.4 48.1 41.8 42.1 38.8 113
114 U.S. direct investment abroad 163.9 210.4 297.3 323.7 382.0 513.5 609.8 617.5 669.1 114
115 Stock in Federal Reserve Banks 8.4 8.8 11.9 13.5 15.3 18.5 21.1 25.6 26.5 115
116 Investment in subsidiaries 1,369.0 1,495.4 1,787.3 1,960.6 2,196.5 2,459.6 2,684.6 3,296.6 3,252.4 116
117 Insurance, pension and standardized guarantee schemes 0.0 0.0 0.0 0.0 108.5 124.7 130.0 132.8 141.1 117
118 Other accounts receivable 1,921.2 2,131.4 2,247.8 2,325.7 2,513.9 2,637.3 2,746.3 2,612.4 2,277.2 118
119 Total liabilities and net worth 28,332.4 31,213.0 34,160.5 37,473.1 41,997.1 46,955.2 47,526.7 47,429.6 46,498.3 119
120 Liabilities 28,684.1 31,961.7 35,194.6 38,304.3 43,047.1 47,153.6 46,464.4 46,652.9 46,228.8 120
121 Currency and deposits 5,657.9 6,085.1 6,690.8 7,275.5 7,867.5 8,380.3 9,282.8 9,519.9 9,645.5 121
122 Debt securities 9,312.8 10,158.1 10,978.9 11,963.6 13,272.1 14,906.8 15,269.3 14,498.9 13,259.8 122
123 Agency- and GSE-backed securities (2) 5,509.0 5,944.5 6,060.3 6,140.7 6,468.9 7,374.6 8,143.4 8,083.3 7,574.0 123
124 Corporate bonds 2,805.9 3,279.2 3,962.6 4,652.7 5,440.1 6,280.4 6,000.1 5,737.9 5,109.9 124
125 Commercial paper 997.9 934.4 956.0 1,170.2 1,363.2 1,251.8 1,125.8 677.6 575.9 125
126 Loans 2,392.9 2,754.1 3,059.2 3,476.4 4,035.9 4,591.6 4,456.3 3,543.6 3,094.6 126
127 Short term 2,296.0 2,648.2 2,927.9 3,330.9 3,883.8 4,434.9 4,292.8 3,376.7 2,927.5 127
128 Long term 97.0 105.9 131.4 145.5 152.1 156.7 163.5 166.9 167.1 128
129 Equity and investment fund shares 9,610.0 11,244.7 12,786.5 14,113.3 16,345.3 17,404.2 14,640.7 16,990.4 18,135.4 129
130 Money market fund shares 2,223.9 2,016.4 1,879.8 2,006.9 2,312.1 3,033.1 3,757.3 3,258.3 2,755.3 130
131 Corporate equity issues 2,194.2 2,898.1 3,435.0 3,757.1 4,421.9 3,852.8 2,522.7 3,237.2 3,920.2 131
132 Mutual fund shares 3,638.4 4,654.2 5,436.3 6,048.9 7,068.3 7,829.0 5,435.3 6,961.6 7,934.5 132
133 Equity in government-sponsored enterprises (2) 39.1 42.3 44.8 46.7 46.9 56.0 51.8 51.8 49.0 133
134 Foreign direct investment in the United States 130.6 160.9 201.9 227.3 256.6 235.1 232.1 265.2 309.3 134
135 Equity in noncorporate business 5.0 13.0 11.2 11.7 9.8 11.6 9.5 12.1 13.8 135
136 Investment by parent 1,379.0 1,460.0 1,777.5 2,014.8 2,229.8 2,386.8 2,632.3 3,204.0 3,153.2 136
137 Other accounts payable 1,710.6 1,719.9 1,679.3 1,475.6 1,526.3 1,870.6 2,815.0 2,100.2 2,093.6 137
138 Net worth -351.7 -748.7 -1,034.0 -831.0 -1,050.0 -198.2 1,062.4 776.7 269.5 138
(1) Consists of rental income of tenant-occupied housing and proprietors' income. Quasi-corporations are unincorporated enterprises that function as if they were corporations; they primarily cover their operating costs through sales, and they keep a complete set of financial records.
(2) Government-sponsored enterprises (GSEs) consist of Federal Home Loan Banks, Fannie Mae, Freddie Mac, Federal Agricultural Mortgage Corporation, Farm Credit System, the Financing Corporation, and the Resolution Funding Corporation, and they included the Student Loan Marketing Association until it was fully privatized in the fourth quarter of 2004.
(3) The statistical discrepancy is the difference between net lending or net borrowing derived in the capital account and the same concept derived in the financial account. The discrepancy reflects differences in source data, timing of recorded flows, and other statistical differences between the capital and financial accounts.
(4) Excludes land. Includes corporate and noncorporate financial business.
6
Appendix A

SNA Tables, June 7, 2012 1
S.1.a Total Economy - Current AccountBillions of dollars
2003 2004 2005 2006 2007 2008 2009 2010
1 FA896902505 Gross value added 11125.5 11875.6 12718.1 13619.5 14040.7 14294.0 13861.5 14525.7 1 (income approach)
2 FA886300091 Less: Consumption of fixed capital 1354.1 1432.8 1541.4 1660.7 1767.5 1854.1 1866.2 1874.9 2
3 FA896902601 Equals: Net value added 9771.5 10442.8 11176.7 11958.8 12273.2 12439.9 11995.3 12650.8 3 4 FA896025001 Compensation of employees (paid) 6388.3 6699.6 7071.5 7483.6 7863.0 8079.1 7815.4 7980.6 4 5 FA896020001 Wages and salaries 5160.3 5416.8 5712.4 6076.8 6422.6 6556.6 6284.4 6417.5 5 6 FA896401001 Employers’ social contributions 1228.0 1282.7 1359.1 1406.9 1440.4 1522.5 1531.1 1563.1 6 7 FA896240101 Taxes on production and imports less subsidies 757.7 817.0 869.3 935.5 972.6 985.7 958.2 996.7 7 8 FA896402101 Operating surplus, net 2625.4 2926.3 3236.0 3539.8 3437.5 3375.1 3221.7 3673.5 8
9 FA266904095 Plus: Income receipts from the rest of the world 353.3 448.6 573.0 721.1 871.0 856.1 639.8 702.9 910 FA266904195 Less: Income payments from the rest of the world 284.6 357.4 475.9 648.6 747.7 686.9 487.5 513.5 10
11 FA896140001 Equals: Net national income/Balance of primary incomes, net 9840.2 10534.1 11273.8 12031.2 12396.4 12609.1 12147.6 12840.1 1112 FA896402101 Operating surplus, net 2625.4 2926.3 3236.0 3539.8 3437.5 3375.1 3221.7 3673.5 1213 FA156025105 Compensation of employees (received) 6382.6 6693.4 7065.0 7477.0 7855.9 8068.3 7806.4 7971.4 1314 FA156020101 Wages and salaries 5154.6 5410.7 5706.0 6070.1 6415.5 6545.9 6275.3 6408.2 1415 FA156401101 Employers’ social contributions 1228.0 1282.7 1359.1 1406.9 1440.4 1522.5 1531.1 1563.1 1516 FA896240001 Taxes on production and imports, receivable 806.8 863.4 930.2 986.8 1027.2 1038.6 1017.9 1054.0 1617 FA366402015 Subsidies paid -49.1 -46.4 -60.9 -51.4 -54.6 -52.9 -59.7 -57.3 1718 FA896150105 Property income (received) 3940.7 4435.5 5123.8 6067.1 6802.7 6511.0 5197.1 5098.4 1819 FA896130101 Interest 2234.9 2420.2 2963.9 3667.9 4272.7 3925.3 2937.6 2539.5 1920 FA896120105 Distributed income of corporations 1543.6 1807.4 2122.4 2132.7 2249.5 2298.1 1972.1 2185.6 2021 FA896121101 Dividends 558.0 718.6 995.8 940.4 1088.0 1104.0 923.1 1035.6 2122 FA156122101 Withdrawals from income of quasi-corporations 985.7 1088.8 1126.6 1192.3 1161.5 1194.1 1049.0 1150.0 2223 FA893092201 Reinvested earnings on U.S. direct investment abroad 148.2 192.5 20.7 248.4 261.6 265.5 270.5 353.8 2324 FA896112101 Rents on land and natural resources 14.1 15.3 16.8 18.0 18.8 22.0 16.9 19.5 2425 FA896150005 Less: Uses of property income (paid) 3866.3 4338.1 5020.3 5988.0 6672.3 6331.0 5035.8 4899.8 2526 FA896130001 Interest 2326.3 2527.9 3099.8 3845.8 4493.2 4151.9 3136.7 2722.8 2627 FA896120005 Distributed income of corporations 1511.5 1745.1 1861.5 2054.8 2104.7 2117.6 1868.5 2063.5 2728 FA896121001 Dividends 525.9 656.3 735.0 862.5 943.2 923.5 819.5 913.6 2829 FA896122001 Withdrawals from income of quasi-corporations 985.7 1088.8 1126.6 1192.3 1161.5 1194.1 1049.0 1150.0 2930 FA893192201 Reinvested earnings on foreign direct investment 14.5 49.8 42.1 69.5 55.5 39.4 13.7 93.9 3031 FA896112001 Rents on land and natural resources 14.1 15.3 16.8 18.0 18.8 22.0 16.9 19.5 31
32 FA896140001 Net national income/Balance of primary incomes, net 9840.2 10534.1 11273.8 12031.2 12396.4 12609.1 12147.6 12840.1 3233 FA896220001 Plus: Current taxes on income, wealth, etc. (received) 1241.1 1349.8 1616.6 1820.6 1924.0 1735.5 1405.1 1594.6 3334 FA896220005 Less: Current taxes on income, wealth, etc. (paid) 1244.1 1353.9 1621.0 1825.7 1934.1 1744.7 1413.7 1604.9 3435 FA896404105 Plus: Social benefits (received) 2098.9 2230.3 2360.1 2510.0 2652.1 2834.6 3068.9 3234.6 3536 FA896404005 Less: Social contributions (paid) 2105.1 2236.5 2366.7 2517.9 2660.7 2845.2 3080.1 3246.3 3637 FA896403105 Plus: Other current transfers (received) 472.6 485.4 513.7 516.4 560.5 596.1 705.8 763.9 3738 FA896403005 Less: Other current transfers (paid) 544.1 572.1 617.8 604.9 668.0 714.7 824.2 893.5 38
39 FA896012005 Equals: Disposable income, net 9759.5 10436.9 11158.9 11929.7 12270.2 12470.6 12009.4 12688.5 39
40 FA896901001 Less: Final consumption expenditures 9560.9 10131.0 10781.4 11394.3 11990.1 12416.5 12278.3 12743.0 40
41 FA896006001 Equals: Net saving 198.6 305.9 377.5 535.4 280.2 54.1 -268.8 -54.5 41
Addendum:42 FA896902505 Gross value added (line 1) 11125.5 11875.6 12718.1 13619.5 14040.7 14294.0 13861.5 14525.7 4243 FA087005995 Plus statistical discrepancy (NIPA) 16.7 -22.4 -95.1 -242.3 -12.0 -2.4 77.4 0.8 4344 FA086902005 Equals: GDP (NIPA, expenditure approach) 11142.2 11853.3 12623.0 13377.2 14028.7 14291.5 13938.9 14526.6 44
Appendix B

SNA Tables, June 7, 2012 2
S.2.a Selected Aggregates for Total Economy and Sectors Billions of dollars; quarterly figures are seasonally adjusted annual rates
2003 2004 2005 2006 2007 2008 2009 2010
1 FA896902505 Gross value added 11125.5 11875.6 12718.1 13619.5 14040.7 14294.0 13861.5 14525.7 1 2 FA156902505 Households and nonprofit institutions serving households 1347.2 1423.8 1506.4 1602.8 1685.8 1805.7 1836.0 1838.4 2 3 FA116902505 Nonfinancial noncorporate business 1901.2 2085.6 2220.2 2401.6 2511.6 2591.1 2370.6 2422.9 3 4 FA106902501 Nonfinancial corporate business 5503.7 5877.5 6302.8 6740.3 6946.0 6991.4 6592.0 6902.0 4 5 FA796902505 Financial business 922.3 964.5 1085.8 1189.4 1118.6 1031.0 1119.7 1372.9 5 6 FA316902505 Federal government 449.2 480.5 504.1 528.9 555.3 585.3 618.0 652.9 6 7 FA206902505 State and local government 1001.8 1043.7 1098.8 1156.4 1223.2 1289.4 1325.2 1336.6 7
8 FA896006001 Net saving 198.6 305.9 377.5 535.4 280.2 54.1 -268.8 -54.5 8 9 FA156006005 Households and nonprofit institutions serving households 304.7 303.2 148.2 257.9 242.5 587.3 557.6 592.8 910 FA106012095 Nonfinancial corporate business 175.1 248.0 338.6 295.4 226.3 237.5 325.6 533.7 1011 FA796012095 Financial business 134.1 142.5 147.7 134.8 44.3 -85.0 143.9 118.0 1112 FA316006085 Federal government -376.4 -379.5 -283.0 -203.8 -245.2 -613.5 -1217.9 -1273.7 1213 FA206006095 State and local government -38.8 -8.4 25.9 51.0 12.2 -72.2 -78.1 -25.3 13
Net capital transfers14 FA155440005 Households and nonprofit institutions serving households 13.1 1.4 -21.9 16.8 3.0 -8.6 -46.6 -42.6 1415 FA115440005 Nonfinancial noncorporate business 0.0 -5.0 -13.1 0.0 0.0 -3.3 -6.0 -7.8 1516 FA105440005 Nonfinancial corporate business -0.1 -6.7 -15.5 -0.0 -0.0 -3.7 38.3 21.3 1617 FA795440005 Financial business 0.0 16.2 27.7 0.0 0.0 -60.5 -121.9 -41.5 1718 FA315440005 Federal government 40.6 38.9 59.8 42.7 56.3 133.5 204.1 149.6 1819 FA205440005 State and local government -51.5 -47.5 -49.8 -57.4 -58.9 -62.8 -67.3 -78.3 1920 FA265440005 Rest of the world -2.2 2.8 12.8 -2.0 -0.4 5.4 -0.6 -0.7 20
21 FA885019005 Gross fixed capital formation 2069.1 2276.0 2514.3 2692.2 2722.6 2625.9 2213.0 2233.5 2122 FA155019005 Households and nonprofit institutions serving households 586.7 690.4 781.0 777.7 661.9 529.2 419.6 406.5 2223 FA115019085 Nonfinancial noncorporate business 197.0 216.8 235.4 247.7 282.8 268.0 211.7 209.2 2324 FA105019085 Nonfinancial corporate business 794.2 841.4 950.7 1079.1 1134.0 1136.5 908.2 930.7 2425 FA795013005 Financial business (nonresidential) 135.4 155.1 155.3 162.7 187.5 195.0 168.1 181.7 2526 FA315019003 Federal government 96.2 103.3 110.5 120.7 127.4 148.4 156.1 168.8 2627 FA205019003 State and local government 259.6 269.1 281.6 304.4 329.0 348.8 349.3 336.5 27
28 FA886300095 Consumption of fixed capital 1354.1 1432.8 1541.4 1660.7 1767.5 1854.1 1866.2 1874.9 2829 FA156300003 Households and nonprofit institutions serving households 200.5 222.2 245.1 268.1 285.5 294.6 292.5 295.2 2930 FA116300001 Nonfinancial noncorporate business 153.4 162.7 175.5 189.6 210.1 211.3 210.8 209.7 3031 FA106300083 Nonfinancial corporate business 669.0 695.6 743.0 800.9 840.1 864.3 862.2 856.8 3132 FA796300081 Financial business (nonresidential) 113.0 120.5 127.3 132.8 140.6 172.7 176.9 179.1 3233 FA316300003 Federal government 90.8 94.8 100.4 106.6 112.6 120.0 124.7 130.0 3334 FA206300003 State and local government 127.3 137.1 150.1 162.7 178.7 191.2 199.0 204.0 34
35 FA145020005 Change in inventories 16.4 64.9 50.0 60.0 29.1 -41.1 -160.8 66.9 3536 FA115020005 Nonfinancial noncorporate business 0.9 10.5 2.6 0.0 0.9 -0.9 -9.3 2.2 3637 FA105020005 Nonfinancial corporate business 15.5 54.4 47.4 59.9 28.2 -40.2 -151.5 64.7 37
38 FA885000985 Net lending (+) or net borrowing (-) (capital account) -534.9 -599.4 -632.6 -558.2 -703.9 -671.1 -455.4 -480.7 3839 FA155000905 Households and nonprofit institutions serving households -86.2 -157.6 -356.6 -258.2 -125.7 372.6 488.3 535.4 3940 FA115000905 Nonfinancial noncorporate business -44.5 -59.6 -49.5 -58.2 -73.6 -52.6 14.5 6.1 4041 FA105000905 Nonfinancial corporate business 37.3 57.1 99.7 -55.2 -94.0 -7.1 388.9 377.2 4142 FA795000995 Financial business 111.7 91.7 92.0 104.9 -2.6 -46.7 274.6 156.9 4243 FA315000995 Federal government -422.2 -426.8 -352.4 -247.2 -315.0 -756.2 -1446.3 -1462.3 4344 FA205000995 State and local government -131.1 -104.2 -66.0 -44.3 -93.1 -181.1 -175.4 -94.0 44 Addendum:45 FA087005995 Statistical discrepancy (NIPA) 16.7 -22.4 -95.1 -242.3 -12.0 -2.4 77.4 0.8 4546 FA265000905 Rest of the world 518.2 621.8 727.7 800.5 715.9 673.6 378.0 479.9 46
47 FA885000005 Net lending (+) or net borrowing (-) (financial account) -437.6 -394.5 -601.0 -725.9 -472.5 -1677.7 -404.3 -645.6 4748 FA155000005 Households and nonprofit institutions serving households -88.8 75.0 -349.2 -429.8 163.9 525.3 405.7 833.3 4849 FA115000005 Nonfinancial noncorporate business -93.8 -112.8 -112.3 -131.0 -122.2 -52.6 14.5 6.1 4950 FA105000005 Nonfinancial corporate business 74.1 166.0 -19.8 -138.4 -206.1 -943.0 563.4 150.6 5051 FA795000005 Financial business 218.3 15.6 306.6 263.0 108.2 -266.8 45.6 -209.1 5152 FA315000005 Federal government -476.9 -434.1 -380.4 -265.3 -344.0 -779.5 -1289.2 -1361.9 5253 FA215000005 State and local government -70.4 -104.2 -46.0 -24.3 -72.4 -161.2 -144.3 -64.6 53 Addendum:54 FA265000005 Rest of the world 531.1 535.4 713.8 807.4 617.6 736.6 245.8 254.1 54
Total other volume changes55 FU158090185 Households and nonprofit institutions serving households 448.4 1287.2 305.9 122.0 610.0 181.8 398.6 318.5 5556 FU118090105 Nonfinancial noncorporate business 104.5 121.8 -17.8 67.3 16.3 -300.1 -15.4 44.3 5657 FU108090105 Nonfinancial corporate business 184.2 309.3 333.9 678.7 805.4 -673.4 231.4 345.3 5758 FU798090185 Financial business 12.3 -60.9 154.4 32.5 -94.5 -346.3 463.7 -353.3 5859 FU318090185 Federal government -86.9 -30.3 -34.2 7.5 16.6 72.4 140.2 56.1 5960 FU218090185 State and local government 49.9 -750.7 36.3 -10.7 106.6 73.0 62.3 77.3 6061 FU268090185 Rest of the world -117.8 -81.7 -274.6 74.3 -252.0 -284.8 -366.5 -361.4 61
Holding gains/losses62 FD158200705 Households and nonprofit institutions serving households 5182.5 5351.6 5785.8 4060.7 -331.6 -13389.2 1037.7 2611.2 6263 FD112010705 Nonfinancial noncorporate business 503.8 1123.4 1328.3 258.9 120.1 -1312.4 -1244.9 543.9 6364 FD108200705 Nonfinancial corporate business -2346.1 -24.0 116.7 -1417.4 -119.3 4181.3 -5357.0 -1076.0 6465 FD798200705 Financial business -589.2 -217.3 -97.8 -468.7 1199.2 1963.0 -962.4 -308.6 6566 FD318200705 Federal government 31.5 115.0 95.7 104.3 70.9 -7.2 -165.4 -13.6 6667 FD218200705 State and local government 121.8 510.4 452.5 590.6 500.0 401.3 -102.3 171.9 6768 FD268200005 Rest of the world -333.3 -375.8 -695.9 -582.3 -795.3 1173.0 -843.2 15.0 68
Appendix B

SNA Tables, June 7, 2012 3
S.2.a Selected Aggregates for Total Economy and Sectors Billions of dollars; quarterly figures are seasonally adjusted annual rates
2003 2004 2005 2006 2007 2008 2009 2010
Change in net worth69 FR152090005 Households and nonprofit institutions serving households 5922.4 6940.6 6261.8 4423.7 517.9 -12611.5 2040.5 3565.0 6970 FR112090205 Nonfinancial noncorporate business 608.2 1250.2 1323.5 326.3 136.4 -1609.2 -1254.3 595.9 7071 FR102090085 Nonfinancial corporate business -1986.8 540.1 804.7 -443.1 912.5 3749.1 -4838.3 -218.3 7172 FR792090095 Financial business -442.8 -151.9 176.7 -301.4 1149.1 1592.2 -232.9 -502.4 7273 FR312090095 Federal government -472.4 -333.7 -281.3 -134.6 -214.1 -681.7 -1447.2 -1380.8 7374 FR212090095 State and local government 184.4 -201.1 564.5 688.3 677.8 464.9 -50.7 302.2 7475 FR262090095 Rest of the world 67.2 164.4 -242.8 292.5 -331.3 1561.8 -831.7 133.4 75
Appendix B

SNA Tables, June 7, 2012 4
S.3.a Households and Nonprofit Institutions Serving HouseholdsBillions of dollars; quarterly figures are seasonally adjusted annual rates
2003 2004 2005 2006 2007 2008 2009 2010
Current account
1 FA156902505 Gross value added 1347.2 1423.8 1506.4 1602.8 1685.8 1805.7 1836.0 1838.4 1
2 FA156300003 Less: Consumption of fixed capital 200.5 222.2 245.1 268.1 285.5 294.6 292.5 295.2 2
3 FA156902605 Equals: Net value added 1146.7 1201.6 1261.3 1334.7 1400.3 1511.1 1543.5 1543.2 3 4 FA156025005 Compensation paid by households and NPISHs 520.6 550.7 571.1 603.5 634.6 671.5 693.8 706.8 4 5 FA156020001 Wages and salaries 435.2 456.7 473.4 502.0 532.0 562.3 579.7 591.7 5 6 FA156401001 Employers’ social contributions 85.4 94.0 97.8 101.5 102.6 109.2 114.1 115.1 6 7 FA156240101 Taxes on production and imports less subsidies 110.0 116.4 121.3 131.1 133.9 142.0 147.1 151.4 7 8 FA156402101 Operating surplus, net 516.1 534.4 568.9 600.2 631.9 697.6 702.6 685.0 8
9 FA156140005 Net national income/Balance of primary incomes, net 8652.0 9149.5 9655.5 10366.8 10895.1 11320.8 10553.0 10910.9 910 FA156402101 Operating surplus, net 516.1 534.4 568.9 600.2 631.9 697.6 702.6 685.0 1011 FA156025105 Compensation of employees (received) 6382.6 6693.4 7065.0 7477.0 7855.9 8068.3 7806.4 7971.4 1112 FA156020101 Wages and salaries 5154.6 5410.7 5706.0 6070.1 6415.5 6545.9 6275.3 6408.2 1213 FA156401101 Employers’ social contributions 1228.0 1282.7 1359.1 1406.9 1440.4 1522.5 1531.1 1563.1 1314 FA156150105 Property income (received) 2299.6 2498.6 2669.9 3023.4 3219.9 3360.9 2757.8 2872.3 1415 FA156130101 Interest 890.9 861.5 988.3 1128.9 1266.5 1383.4 1110.1 1004.5 1516 FA156120105 Distributed income of corporations 1408.8 1637.1 1681.6 1894.5 1953.4 1977.5 1647.7 1867.7 1617 FA156121101 Dividends 423.1 548.3 555.0 702.2 791.9 783.4 598.8 717.7 1718 FA156122101 Withdrawals from income of quasi-corporations (1) 985.7 1088.8 1126.6 1192.3 1161.5 1194.1 1049.0 1150.0 1819 FA156130001 Less: Uses of property income (interest paid) 546.4 576.9 648.3 733.8 812.6 806.0 713.8 617.8 19
20 FA156140005 Net national income/Balance of primary incomes, net 8652.0 9149.5 9655.5 10366.8 10895.1 11320.8 10553.0 10910.9 2021 FA156220001 Less: Current taxes on income, wealth, etc. (paid) 1000.3 1047.8 1208.6 1352.4 1488.7 1435.7 1141.4 1193.9 2122 FA156404105 Plus: Social benefits (received) 1316.0 1398.6 1482.7 1583.6 1687.9 1842.4 2099.9 2242.9 2223 FA156600001 Less: Social contributions (paid) 778.9 827.3 872.7 921.8 959.5 987.3 964.1 986.8 2324 FA156403101 Plus: Other current transfers (received) 25.7 16.9 25.8 21.4 30.5 36.8 38.2 38.3 2425 FA156403001 Less: Other current transfers (paid) 105.7 116.1 131.0 138.7 150.6 154.2 161.9 173.1 25
26 FA156012095 Equals: Disposable income, net 8108.8 8573.8 8951.7 9558.9 10014.7 10622.9 10423.7 10838.3 26
27 FA156901001 Less: Final consumption expenditures 7804.1 8270.6 8803.5 9301.0 9772.3 10035.5 9866.1 10245.5 27
28 FA156006005 Equals: Net saving 304.7 303.2 148.2 257.9 242.5 587.3 557.6 592.8 28
Capital account
29 FA156006315 Net saving less capital transfers 291.5 301.9 170.1 241.1 239.4 595.9 604.2 635.3 2930 FA156006005 Net saving 304.7 303.2 148.2 257.9 242.5 587.3 557.6 592.8 3031 FA155440005 Less: Capital transfers paid (net) 13.1 1.4 -21.9 16.8 3.0 -8.6 -46.6 -42.6 31
32 FA155050905 Capital formation, net 377.8 459.5 526.7 499.3 365.1 223.4 115.9 99.9 3233 FA155019005 Gross fixed capital formation, excluding consumer durables 586.7 690.4 781.0 777.7 661.9 529.2 419.6 406.5 3334 FA155012005 Residential 498.9 594.4 681.9 670.1 541.7 397.2 296.0 287.7 3435 FA165013005 Nonresidential (nonprofit organizations) 87.8 95.9 99.1 107.5 120.2 132.0 123.6 118.8 3536 FA156300003 Less: Consumption of fixed capital 200.5 222.2 245.1 268.1 285.5 294.6 292.5 295.2 3637 FA155420003 Acquisition of nonproduced nonfinancial assets -8.5 -8.7 -9.2 -10.2 -11.3 -11.2 -11.2 -11.3 37
38 FA155000905 Net lending (+) or borrowing (-), capital account (lines 29-32) -86.2 -157.6 -356.6 -258.2 -125.7 372.6 488.3 535.4 38
Financial account
39 FA155000905 Net lending (+) or borrowing (-), capital account (line 38) -86.2 -157.6 -356.6 -258.2 -125.7 372.6 488.3 535.4 39
40 FA154090005 Net acquisition of financial assets 945.0 1222.8 803.2 793.2 1056.8 369.7 227.3 640.9 40
41 FA154000005 Currency and deposits 260.9 410.4 370.7 450.7 421.9 405.0 145.2 180.7 4142 FA153020005 Currency and transferable deposits -31.0 -58.2 -114.2 -40.0 -74.6 224.4 24.0 -25.3 4243 FA153030005 Time and savings deposits 289.8 463.2 482.5 485.5 481.1 204.2 127.6 201.7 4344 FA153091003 Foreign deposits 2.2 5.4 2.4 5.2 15.4 -23.7 -6.4 4.3 4445 FA313131003 Postal savings system deposits 0.0 0.0 0.0 0.0 0.0 0.0 0.0 0.0 45
46 FA154022005 Debt securities 51.3 281.0 228.7 120.6 524.0 -22.2 -114.0 251.9 4647 FA163069103 Open market paper -4.9 6.4 14.7 19.0 -10.2 -101.3 28.7 28.8 4748 FA313161400 U.S. savings bonds 8.9 0.6 0.7 -2.7 -6.0 -2.4 -2.8 -3.3 4849 FA153061105 Treasury securities 11.0 17.1 -96.9 -81.2 -44.0 159.2 425.2 454.5 4950 FA153061705 Agency- and GSE-backed securities (2) 135.1 83.7 110.8 -45.6 320.2 96.8 -566.7 -4.7 5051 FA153062005 Municipal securities 25.4 121.0 77.3 42.0 44.1 41.8 129.3 58.1 5152 FA153063005 Corporate and foreign bonds -124.1 52.2 122.1 189.0 219.8 -216.3 -127.7 -281.5 52
53 FA154035005 Loans 67.3 116.2 7.8 63.5 206.8 -110.2 -89.0 13.8 5354 FA154041005 Short term 63.0 105.8 -0.3 80.8 219.2 -111.6 -79.4 25.1 5455 FA153065005 Long term (mortgages) 4.3 10.4 8.1 -17.2 -12.4 1.4 -9.7 -11.3 55
Appendix B
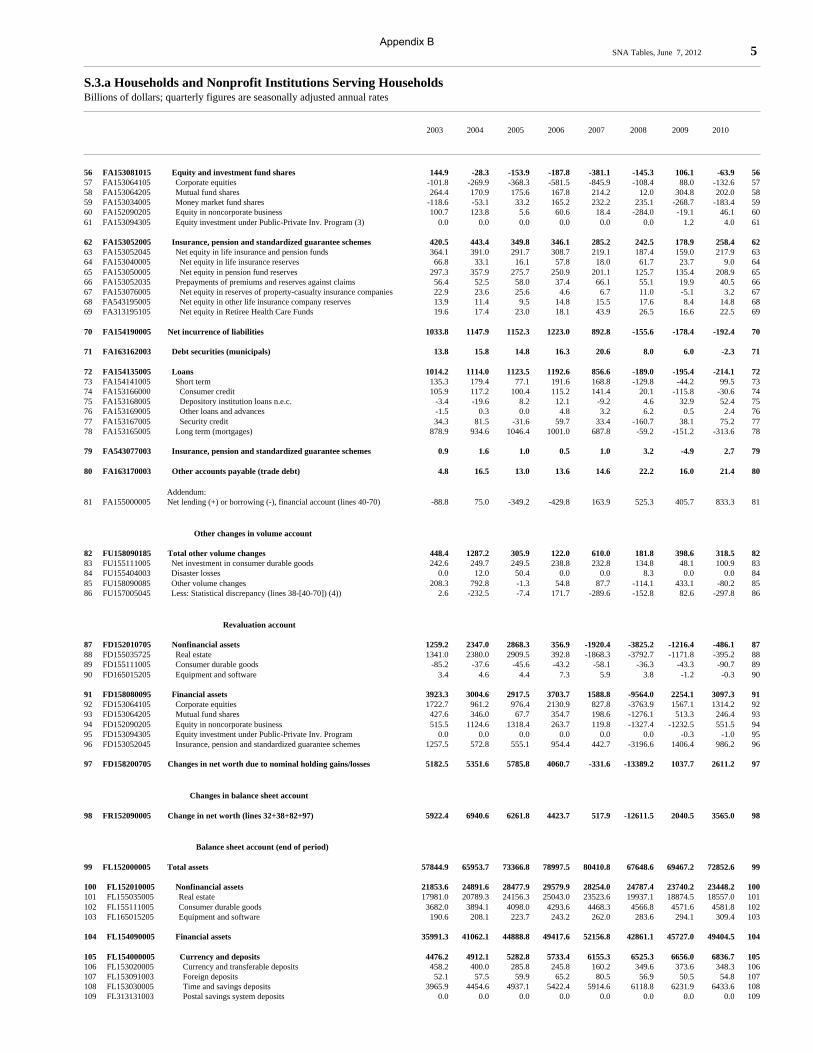
SNA Tables, June 7, 2012 5
S.3.a Households and Nonprofit Institutions Serving HouseholdsBillions of dollars; quarterly figures are seasonally adjusted annual rates
2003 2004 2005 2006 2007 2008 2009 2010
56 FA153081015 Equity and investment fund shares 144.9 -28.3 -153.9 -187.8 -381.1 -145.3 106.1 -63.9 5657 FA153064105 Corporate equities -101.8 -269.9 -368.3 -581.5 -845.9 -108.4 88.0 -132.6 5758 FA153064205 Mutual fund shares 264.4 170.9 175.6 167.8 214.2 12.0 304.8 202.0 5859 FA153034005 Money market fund shares -118.6 -53.1 33.2 165.2 232.2 235.1 -268.7 -183.4 5960 FA152090205 Equity in noncorporate business 100.7 123.8 5.6 60.6 18.4 -284.0 -19.1 46.1 6061 FA153094305 Equity investment under Public-Private Inv. Program (3) 0.0 0.0 0.0 0.0 0.0 0.0 1.2 4.0 61
62 FA153052005 Insurance, pension and standardized guarantee schemes 420.5 443.4 349.8 346.1 285.2 242.5 178.9 258.4 6263 FA153052045 Net equity in life insurance and pension funds 364.1 391.0 291.7 308.7 219.1 187.4 159.0 217.9 6364 FA153040005 Net equity in life insurance reserves 66.8 33.1 16.1 57.8 18.0 61.7 23.7 9.0 6465 FA153050005 Net equity in pension fund reserves 297.3 357.9 275.7 250.9 201.1 125.7 135.4 208.9 6566 FA153052035 Prepayments of premiums and reserves against claims 56.4 52.5 58.0 37.4 66.1 55.1 19.9 40.5 6667 FA153076005 Net equity in reserves of property-casualty insurance companies 22.9 23.6 25.6 4.6 6.7 11.0 -5.1 3.2 6768 FA543195005 Net equity in other life insurance company reserves 13.9 11.4 9.5 14.8 15.5 17.6 8.4 14.8 6869 FA313195105 Net equity in Retiree Health Care Funds 19.6 17.4 23.0 18.1 43.9 26.5 16.6 22.5 69
70 FA154190005 Net incurrence of liabilities 1033.8 1147.9 1152.3 1223.0 892.8 -155.6 -178.4 -192.4 70
71 FA163162003 Debt securities (municipals) 13.8 15.8 14.8 16.3 20.6 8.0 6.0 -2.3 71
72 FA154135005 Loans 1014.2 1114.0 1123.5 1192.6 856.6 -189.0 -195.4 -214.1 7273 FA154141005 Short term 135.3 179.4 77.1 191.6 168.8 -129.8 -44.2 99.5 7374 FA153166000 Consumer credit 105.9 117.2 100.4 115.2 141.4 20.1 -115.8 -30.6 7475 FA153168005 Depository institution loans n.e.c. -3.4 -19.6 8.2 12.1 -9.2 4.6 32.9 52.4 7576 FA153169005 Other loans and advances -1.5 0.3 0.0 4.8 3.2 6.2 0.5 2.4 7677 FA153167005 Security credit 34.3 81.5 -31.6 59.7 33.4 -160.7 38.1 75.2 7778 FA153165005 Long term (mortgages) 878.9 934.6 1046.4 1001.0 687.8 -59.2 -151.2 -313.6 78
79 FA543077003 Insurance, pension and standardized guarantee schemes 0.9 1.6 1.0 0.5 1.0 3.2 -4.9 2.7 79
80 FA163170003 Other accounts payable (trade debt) 4.8 16.5 13.0 13.6 14.6 22.2 16.0 21.4 80
Addendum:81 FA155000005 Net lending (+) or borrowing (-), financial account (lines 40-70) -88.8 75.0 -349.2 -429.8 163.9 525.3 405.7 833.3 81
Other changes in volume account
82 FU158090185 Total other volume changes 448.4 1287.2 305.9 122.0 610.0 181.8 398.6 318.5 8283 FU155111005 Net investment in consumer durable goods 242.6 249.7 249.5 238.8 232.8 134.8 48.1 100.9 8384 FU155404003 Disaster losses 0.0 12.0 50.4 0.0 0.0 8.3 0.0 0.0 8485 FU158090085 Other volume changes 208.3 792.8 -1.3 54.8 87.7 -114.1 433.1 -80.2 8586 FU157005045 Less: Statistical discrepancy (lines 38-[40-70]) (4)) 2.6 -232.5 -7.4 171.7 -289.6 -152.8 82.6 -297.8 86
Revaluation account
87 FD152010705 Nonfinancial assets 1259.2 2347.0 2868.3 356.9 -1920.4 -3825.2 -1216.4 -486.1 8788 FD155035725 Real estate 1341.0 2380.0 2909.5 392.8 -1868.3 -3792.7 -1171.8 -395.2 8889 FD155111005 Consumer durable goods -85.2 -37.6 -45.6 -43.2 -58.1 -36.3 -43.3 -90.7 8990 FD165015205 Equipment and software 3.4 4.6 4.4 7.3 5.9 3.8 -1.2 -0.3 90
91 FD158080095 Financial assets 3923.3 3004.6 2917.5 3703.7 1588.8 -9564.0 2254.1 3097.3 9192 FD153064105 Corporate equities 1722.7 961.2 976.4 2130.9 827.8 -3763.9 1567.1 1314.2 9293 FD153064205 Mutual fund shares 427.6 346.0 67.7 354.7 198.6 -1276.1 513.3 246.4 9394 FD152090205 Equity in noncorporate business 515.5 1124.6 1318.4 263.7 119.8 -1327.4 -1232.5 551.5 9495 FD153094305 Equity investment under Public-Private Inv. Program 0.0 0.0 0.0 0.0 0.0 0.0 -0.3 -1.0 9596 FD153052045 Insurance, pension and standardized guarantee schemes 1257.5 572.8 555.1 954.4 442.7 -3196.6 1406.4 986.2 96
97 FD158200705 Changes in net worth due to nominal holding gains/losses 5182.5 5351.6 5785.8 4060.7 -331.6 -13389.2 1037.7 2611.2 97
Changes in balance sheet account
98 FR152090005 Change in net worth (lines 32+38+82+97) 5922.4 6940.6 6261.8 4423.7 517.9 -12611.5 2040.5 3565.0 98
Balance sheet account (end of period)
99 FL152000005 Total assets 57844.9 65953.7 73366.8 78997.5 80410.8 67648.6 69467.2 72852.6 99
100 FL152010005 Nonfinancial assets 21853.6 24891.6 28477.9 29579.9 28254.0 24787.4 23740.2 23448.2 100101 FL155035005 Real estate 17981.0 20789.3 24156.3 25043.0 23523.6 19937.1 18874.5 18557.0 101102 FL155111005 Consumer durable goods 3682.0 3894.1 4098.0 4293.6 4468.3 4566.8 4571.6 4581.8 102103 FL165015205 Equipment and software 190.6 208.1 223.7 243.2 262.0 283.6 294.1 309.4 103
104 FL154090005 Financial assets 35991.3 41062.1 44888.8 49417.6 52156.8 42861.1 45727.0 49404.5 104
105 FL154000005 Currency and deposits 4476.2 4912.1 5282.8 5733.4 6155.3 6525.3 6656.0 6836.7 105106 FL153020005 Currency and transferable deposits 458.2 400.0 285.8 245.8 160.2 349.6 373.6 348.3 106107 FL153091003 Foreign deposits 52.1 57.5 59.9 65.2 80.5 56.9 50.5 54.8 107108 FL153030005 Time and savings deposits 3965.9 4454.6 4937.1 5422.4 5914.6 6118.8 6231.9 6433.6 108109 FL313131003 Postal savings system deposits 0.0 0.0 0.0 0.0 0.0 0.0 0.0 0.0 109
Appendix B

SNA Tables, June 7, 2012 6
S.3.a Households and Nonprofit Institutions Serving HouseholdsBillions of dollars; quarterly figures are seasonally adjusted annual rates
2003 2004 2005 2006 2007 2008 2009 2010
110 FL154022005 Debt securities 2713.4 3812.4 4150.3 4302.9 4920.4 4832.8 5115.6 5306.8 110111 FL163069103 Open market paper 77.3 83.7 98.4 117.5 107.3 6.0 34.6 63.4 111112 FL313161400 U.S. savings bonds 203.8 204.4 205.1 202.4 196.4 194.0 191.2 187.9 112113 FL153061105 Treasury securities 204.2 288.2 265.6 197.2 68.3 62.6 624.3 1019.1 113114 FL153061705 Agency- and GSE-backed securities (2) 384.0 406.0 513.5 443.1 693.3 736.9 141.9 126.0 114115 FL153062005 Municipal securities 703.7 1561.8 1639.1 1681.4 1725.4 1767.2 1896.5 1954.6 115116 FL153063005 Corporate and foreign bonds 1140.4 1268.3 1428.6 1661.4 2129.8 2066.2 2227.0 1955.7 116
117 FL154035005 Loans 599.4 715.6 723.4 787.0 993.8 883.5 796.8 810.6 117118 FL154041005 Short term 478.5 584.3 584.0 664.7 884.0 772.4 695.4 720.4 118119 FL153065005 Long term (mortgages) 120.9 131.3 139.5 122.2 109.8 111.2 101.5 90.2 119
120 FL153081015 Equity and investment fund shares 16968.9 19372.5 21581.0 24142.5 24907.5 18394.9 19348.7 21395.8 120121 FL153064105 Corporate equities 6784.2 7475.5 8083.5 9632.9 9614.8 5742.5 7397.6 8579.2 121122 FL153064205 Mutual fund shares 2915.3 3432.3 3675.5 4198.1 4610.9 3346.8 4164.9 4613.4 122123 FL153034005 Money market fund shares 969.2 916.1 949.2 1114.5 1346.7 1581.8 1313.1 1129.7 123124 FL152090205 Equity in noncorporate business 6300.2 7548.6 8872.6 9197.0 9335.2 7723.8 6472.1 7069.7 124125 FL153094305 Equity investment under Public-Private Inv. Program (3) 0.0 0.0 0.0 0.0 0.0 0.0 0.9 3.8 125
126 FL153052005 Insurance, pension and standardized guarantee schemes 11233.4 12249.6 13151.3 14451.8 15179.7 12224.6 13810.0 15054.6 126127 FL153052045 Net equity in life insurance and pension funds 10732.1 11695.8 12542.7 13805.8 14467.5 11458.3 13023.7 14227.9 127128 FL153040005 Net equity in life insurance reserves 1013.2 1060.4 1082.6 1055.2 1076.8 1049.8 1109.2 1137.2 128129 FL153050005 Net equity in pension fund reserves 9718.9 10635.5 11460.1 12750.6 13390.7 10408.5 11914.5 13090.7 129130 FL153052035 Prepayments of premiums and reserves against claims 501.3 553.8 608.7 646.1 712.2 766.3 786.2 826.7 130131 FL153076005 Net equity in reserves of property-casualty insurance companies 266.8 290.4 316.0 320.5 327.3 337.3 332.2 335.4 131132 FL543195005 Net equity in other life insurance company reserves 199.5 211.0 217.3 232.1 247.6 265.2 273.6 288.4 132133 FL313195105 Net equity in Retiree Health Care Funds 35.0 52.4 75.4 93.5 137.3 163.8 180.4 202.9 133
134 FL152100005 Total liabilities and net worth 57844.9 65953.7 73366.8 78997.5 80410.8 67648.6 69467.2 72852.6 134
135 FL154190005 Liabilities 9823.1 10991.2 12142.5 13349.4 14244.8 14094.1 13872.3 13692.7 135
136 FL163162003 Debt securities (municipals) 177.7 198.9 213.7 230.1 250.7 258.7 264.6 262.3 136
137 FL154135005 Loans 9467.7 10596.5 11720.1 12896.6 13755.7 13571.7 13332.8 13131.5 137138 FL154141005 Short term 2399.7 2579.1 2656.2 2831.8 3003.1 2873.3 2785.7 2899.1 138139 FL153166000 Consumer credit 2102.9 2220.1 2320.6 2384.6 2528.5 2548.6 2438.5 2411.6 139140 FL153168005 Depository institution loans n.e.c. -4.4 -24.0 -15.8 31.3 22.1 26.7 10.4 73.2 140141 FL153169005 Other loans and advances 118.7 119.0 119.0 123.8 127.0 133.2 133.7 136.1 141142 FL153167005 Security credit 182.5 264.0 232.4 292.1 325.5 164.8 203.0 278.2 142143 FL153165005 Long term (mortgages) 7068.0 8017.4 9063.9 10064.8 10752.6 10698.4 10547.2 10232.4 143
144 FL543077003 Insurance, pension and standardized guarantee schemes 20.9 22.5 22.4 22.8 23.9 27.0 22.1 24.7 144
145 FL163170003 Other accounts payable (trade debt) 156.8 173.3 186.3 199.9 214.5 236.7 252.7 274.1 145
146 FL152090005 Net worth 48021.9 54962.5 61224.3 65648.1 66166.0 53554.5 55594.9 59159.9 146
(1) Consists of rental income of tenant-occupied housing and proprietors’ income. Quasi-corporations are unincorporated enterprises that function as if they were corporations;they primarily cover their operating costs through sales, and they keep a complete set of financial records.(2) Government-sponsored enterprises (GSEs) consist of Federal Home Loan Banks, Fannie Mae, Freddie Mac, Federal Agricultural Mortgage Corporation, Farm Credit System,the Financing Corporation, and the Resolution Funding Corporation, and they included the Student Loan Marketing Association until it was fully privatized in the fourth quarter of 2004.(3) Funds invested by financial institutions such as domestic hedge funds through the Public-Private Investment Program (PPIP).(4) The statistical discrepancy is the difference between net lending or net borrowing derived in the capital account and the same concept derived in the financial account. The discrepancyreflects differences in source data, timing of recorded flows, and other statistical differences between the capital and financial accounts.NPISHs Nonprofit institutions serving householdsn.e.c. Not elsewhere classified
Appendix B

SNA Tables, June 7, 2012 7
S.4.a Nonfinancial Noncorporate BusinessBillions of dollars; quarterly figures are seasonally adjusted annual rates
2003 2004 2005 2006 2007 2008 2009 2010
Current account
1 FA116902505 Gross value added 1901.2 2085.6 2220.2 2401.6 2511.6 2591.1 2370.6 2422.9 1
2 FA116300001 Less: Consumption of fixed capital 153.4 162.7 175.5 189.6 210.1 211.3 210.8 209.7 2
3 FA116902605 Equals: Net value added 1747.8 1922.9 2044.7 2212.0 2301.5 2379.9 2159.8 2213.2 3 4 FA116025001 Compensation of employees (paid) 523.1 573.6 626.3 693.1 758.1 776.4 741.1 755.0 4 5 FA116020001 Wages and salaries 439.1 481.8 525.5 584.9 644.4 655.5 621.8 634.5 5 6 FA116401005 Employers’ social contributions 84.0 91.8 100.8 108.2 113.8 120.9 119.3 120.6 6 7 FA116240101 Taxes on production and imports less subsidies 123.6 139.5 143.5 160.7 177.7 177.4 169.0 175.8 7 8 FA116402105 Operating surplus, net 1101.1 1209.8 1274.9 1358.3 1365.7 1426.1 1249.7 1282.3 8
9 FA116140001 Net national income/Balance of primary incomes, net 19.8 19.9 21.9 22.5 20.7 16.1 29.6 31.3 910 FA116402105 Operating surplus, net 1101.1 1209.8 1274.9 1358.3 1365.7 1426.1 1249.7 1282.3 1011 FA116130101 Property income (interest received) 15.7 16.7 15.8 15.3 16.7 19.6 16.0 15.1 1112 FA116150005 Less: Uses of property income (paid) 1096.9 1206.6 1268.8 1351.1 1361.6 1429.6 1236.1 1266.2 1213 FA116130001 Interest 162.5 171.8 200.2 228.7 259.1 270.4 243.0 173.1 1314 FA116122001 Withdrawals from income of quasi-corporations (1) 934.4 1034.7 1068.6 1122.4 1102.5 1159.0 993.1 1092.9 1415 FA113192281 Reinvested earnings on foreign direct investment 0.0 0.1 0.1 0.1 0.1 0.1 0.0 0.2 1516 FA116112001 Rents on land and natural resources 0.0 0.0 0.0 0.0 0.0 0.0 0.0 0.0 16
17 FA116140001 Net national income/Balance of primary incomes, net 19.8 19.9 21.9 22.5 20.7 16.1 29.6 31.3 1718 FA116403001 Less: Other current transfers (paid) 19.8 19.9 21.9 22.5 20.7 16.1 29.6 31.3 18
19 FA116012005 Equals: Disposable income, net 0.0 0.0 0.0 0.0 0.0 0.0 0.0 0.0 19
20 FA116012005 Equals: Net saving 0.0 0.0 0.0 0.0 0.0 0.0 0.0 0.0 20
Capital account
21 FA116006305 Net saving less capital transfers 0.0 5.0 13.1 0.0 0.0 3.3 6.0 7.8 2122 FA116012005 Net saving 0.0 0.0 0.0 0.0 0.0 0.0 0.0 0.0 2223 FA115440005 Less: Capital transfers paid (net) 0.0 -5.0 -13.1 0.0 0.0 -3.3 -6.0 -7.8 23
24 FA115050985 Capital formation, net 44.5 64.6 62.5 58.2 73.6 55.9 -8.5 1.7 2425 FA115019085 Gross fixed capital formation 197.0 216.8 235.4 247.7 282.8 268.0 211.7 209.2 2526 FA115013085 Nonresidential 124.0 136.8 149.0 162.6 202.2 198.4 157.4 161.4 2627 FA115012005 Residential 73.0 80.0 86.4 85.0 80.5 69.6 54.4 47.8 2728 FA116300001 Less: Consumption of fixed capital 153.4 162.7 175.5 189.6 210.1 211.3 210.8 209.7 2829 FA115020005 Change in private inventories 0.9 10.5 2.6 0.0 0.9 -0.9 -9.3 2.2 29
30 FA115000905 Net lending (+) or borrowing (-), capital account (lines 21-24) -44.5 -59.6 -49.5 -58.2 -73.6 -52.6 14.5 6.1 30
Financial account
31 FA115000905 Net lending (+) or borrowing (-) (line 30) -44.5 -59.6 -49.5 -58.2 -73.6 -52.6 14.5 6.1 31
32 FA114090005 Net acquisition of financial assets 80.4 370.8 437.3 519.8 479.4 97.2 -100.8 -136.8 32
33 FA114000005 Currency and deposits 50.7 93.7 100.1 94.9 81.8 2.5 15.7 -33.8 3334 FA113020005 Currency and transferable deposits 6.1 106.9 76.6 74.6 66.9 3.8 20.4 -20.1 3435 FA113030003 Time and savings deposits 44.7 -13.2 23.5 20.3 14.9 -1.2 -4.8 -13.7 35
36 FA114022005 Debt securities 1.4 7.0 6.1 1.5 2.5 -7.9 -5.5 -2.0 3637 FA113061003 Treasury securities 2.1 5.3 6.0 0.2 3.0 -7.5 -5.7 -1.8 3738 FA113062003 Municipal securities -0.7 1.7 0.1 1.3 -0.5 -0.4 0.2 -0.2 38
39 FA114035005 Loans 0.1 4.6 5.3 -1.5 7.4 -3.0 -1.2 -1.5 3940 FA113066003 Short term (consumer credit) 0.0 0.0 0.0 0.0 0.0 0.0 0.0 0.0 4041 FA113065005 Long term (mortgages) 0.1 4.6 5.3 -1.5 7.4 -3.0 -1.2 -1.5 41
42 FA113081005 Equity and investment fund shares 2.9 3.0 2.4 3.3 2.9 2.2 -1.7 -2.5 4243 FA113034003 Money market mutual fund shares 2.3 2.9 2.4 3.2 2.2 1.0 -1.7 -2.9 4344 FA113092405 Equity in government-sponsored enterprises (2) 0.6 0.0 -0.1 0.2 0.7 1.2 -0.0 0.4 44
45 FA113076005 Insurance, pension and standardized guarantee schemes (3) 4.7 4.6 5.5 4.4 3.7 3.4 1.0 0.1 45
46 FA113096005 Other accounts receivable 20.6 258.1 317.8 417.2 381.1 100.0 -109.0 -97.2 4647 FA113070003 Trade receivables -25.1 26.6 66.6 40.0 54.7 -3.0 -26.3 -19.2 4748 FA113093005 Other (miscellaneous assets) 45.8 231.4 251.2 377.2 326.4 102.9 -82.7 -77.9 48
49 FA114190005 Net incurrence of liabilities 174.3 483.6 549.6 650.8 601.6 149.9 -115.2 -142.8 49
50 FA114135005 Loans 73.8 254.7 341.6 415.2 461.6 318.8 -134.2 -198.5 5051 FA114141005 Short term 9.7 34.1 164.2 132.0 154.5 131.9 -121.6 -66.1 5152 FA113168005 Depository institution loans n.e.c. 10.3 32.9 157.9 115.3 140.8 119.6 -116.3 -70.4 5253 FA113169005 Other loans and advances -0.6 1.2 6.3 16.8 13.7 12.3 -5.3 4.3 5354 FA113165005 Long term (mortgages) 64.1 220.6 177.5 283.2 307.1 186.9 -12.6 -132.3 54
Appendix B

SNA Tables, June 7, 2012 8
S.4.a Nonfinancial Noncorporate BusinessBillions of dollars; quarterly figures are seasonally adjusted annual rates
2003 2004 2005 2006 2007 2008 2009 2010
55 FA113181005 Equity and investment fund shares 103.8 128.1 6.9 67.6 16.3 -295.7 -15.0 45.7 5556 FA112090205 Equity in noncorporate business 104.1 128.0 6.8 67.4 16.0 -295.5 -15.5 45.7 5657 FA115114005 Foreign direct investment in the United States -0.4 0.1 0.1 0.2 0.3 -0.2 0.5 -0.0 57
58 FA113196005 Other accounts payable -3.3 100.8 201.0 168.0 123.7 126.7 34.0 9.9 5859 FA113170005 Trade payables -26.2 23.7 49.7 14.4 26.0 5.8 7.6 -19.2 5960 FA113178003 Taxes payable -0.5 8.4 8.7 9.0 3.8 6.7 -6.3 -4.9 6061 FA113193003 Other (miscellaneous liabilities) 23.4 68.8 142.7 144.6 93.9 114.3 32.6 34.1 61
Addendum:62 FA115000005 Net lending (+) or borrowing (-), financial account (lines 32-49) -93.8 -112.8 -112.3 -131.0 -122.2 -52.6 14.5 6.1 62
Other changes in volume account
63 FU118090105 Total other volume changes 104.5 121.8 -17.8 67.3 16.3 -300.1 -15.4 44.3 6364 FU115404005 Disaster losses 0.0 6.6 24.5 0.0 0.0 4.4 0.0 0.0 6465 FU118090085 Other volume changes 104.5 115.2 -42.3 67.3 16.3 -304.5 -15.4 44.3 65
Revaluation account
66 FD112010705 Nonfinancial assets 503.8 1123.4 1328.3 258.9 120.1 -1312.4 -1244.9 543.9 6667 FD115035705 Real estate 528.8 1157.7 1357.9 289.9 132.2 -1323.4 -1230.4 512.2 6768 FD115032705 Residential 384.2 706.5 990.1 -46.6 -388.3 -950.0 -395.3 151.5 6869 FD115033705 Nonresidential 144.6 451.2 367.7 336.5 520.5 -373.4 -835.2 360.7 6970 FD115015705 Equipment and software -37.0 -33.6 -37.9 -35.3 -35.3 17.0 -5.7 -4.4 7071 FD115012265 Residential -1.3 -0.4 1.3 1.2 -0.4 0.2 -2.8 -2.6 7172 FD115013705 Nonresidential -35.7 -33.2 -39.1 -36.5 -34.9 16.7 -3.0 -1.8 7273 FD115020005 Inventories 12.0 -0.8 8.2 4.3 23.1 -6.0 -8.8 36.1 73
74 FD112010705 Changes in net worth due to nominal holding gains/losses 503.8 1123.4 1328.3 258.9 120.1 -1312.4 -1244.9 543.9 74
Changes in balance sheet account
75 FR112090205 Change in net worth (lines 24+30+63+74) 608.2 1250.2 1323.5 326.3 136.4 -1609.2 -1254.3 595.9 75
Balance sheet account (end of period)
76 FL112000005 Total assets 9569.2 11174.7 13041.1 13950.8 14672.5 13508.9 12154.7 12563.5 76
77 FL112010005 Nonfinancial assets 7780.6 9015.2 10444.4 10834.3 11076.6 9815.7 8562.3 9107.9 7778 FL115035005 Real estate 7056.8 8252.0 9634.5 9976.7 10164.6 8876.2 7649.3 8147.7 7879 FL115035023 Residential (4) 4518.2 5249.7 6250.9 6231.5 5864.3 4920.7 4522.0 4663.0 7980 FL115035035 Nonresidential 2538.6 3002.3 3383.6 3745.2 4300.4 3955.5 3127.3 3484.7 8081 FL115015205 Equipment and software 528.2 557.9 593.7 637.1 667.4 701.7 693.4 702.3 8182 FL115012265 Residential 37.9 39.5 42.9 46.2 47.4 48.7 46.1 44.4 8283 FL115013265 Nonresidential 490.3 518.4 550.8 591.0 619.9 653.0 647.2 657.9 8384 FL115020005 Inventories 195.6 205.4 216.2 220.6 244.6 237.7 219.6 257.9 84
85 FL114090005 Financial assets 1788.6 2159.4 2596.7 3116.5 3595.9 3693.1 3592.4 3455.6 85
86 FL114000005 Currency and deposits 504.4 598.1 698.2 793.2 875.0 877.5 893.1 859.4 8687 FL113020005 Currency and transferable deposits 190.6 297.5 374.1 448.8 515.6 519.4 539.8 519.7 8788 FL113030003 Time and savings deposits 313.8 300.6 324.1 344.4 359.3 358.1 353.3 339.6 88
89 FL114022005 Debt securities 47.6 54.5 60.6 62.1 64.6 56.7 51.2 49.2 8990 FL113061003 Treasury securities 44.9 50.2 56.2 56.3 59.3 51.8 46.1 44.4 9091 FL113062003 Municipal securities 2.7 4.3 4.4 5.8 5.3 4.9 5.1 4.9 91
92 FL114035005 Loans 26.3 30.8 36.2 34.6 42.1 39.1 37.9 36.4 9293 FL113066003 Short term (consumer credit) 0.0 0.0 0.0 0.0 0.0 0.0 0.0 0.0 9394 FL113065005 Long term (mortgages) 26.3 30.8 36.2 34.6 42.1 39.1 37.9 36.4 94
95 FL113081005 Equity and investment fund shares 67.8 70.7 73.1 76.5 79.3 81.7 80.0 77.6 9596 FL113034003 Money market mutual fund shares 63.6 66.5 69.0 72.2 74.3 75.4 73.7 70.9 9697 FL113092405 Equity in government-sponsored enterprises (2) 4.2 4.2 4.1 4.3 5.0 6.4 6.3 6.7 97
98 FL113076005 Insurance, pension and standardized guarantee schemes (3) 89.2 93.7 99.2 103.6 107.3 111.5 112.4 112.5 98
99 FL113096005 Other accounts receivable 1053.4 1311.5 1629.3 2046.5 2427.6 2526.6 2417.6 2320.5 99100 FL113070003 Trade receivables 337.7 364.3 430.9 470.9 525.6 522.7 496.3 477.1 100101 FL113093005 Other (miscellaneous assets) 715.7 947.1 1198.4 1575.6 1902.0 2003.9 1921.3 1843.3 101
102 FL112100005 Total liabilities and net worth 9569.2 11174.7 13041.1 13950.8 14672.5 13508.9 12154.7 12563.5 102
103 FL114190005 Liabilities 3282.0 3637.2 4180.2 4763.6 5349.0 5794.5 5694.7 5507.6 103
Appendix B

SNA Tables, June 7, 2012 9
S.4.a Nonfinancial Noncorporate BusinessBillions of dollars; quarterly figures are seasonally adjusted annual rates
2003 2004 2005 2006 2007 2008 2009 2010
104 FL114135005 Loans 2301.4 2556.1 2897.7 3313.0 3774.6 4093.4 3959.1 3761.8 104105 FL114141005 Short term 606.7 640.9 805.0 937.1 1091.6 1223.4 1101.9 1036.9 105106 FL113168005 Depository institution loans n.e.c. 479.7 512.6 670.4 785.7 926.5 1046.1 929.8 859.4 106107 FL113169005 Other loans and advances 127.1 128.3 134.6 151.4 165.1 177.4 172.1 177.5 107108 FL113165005 Long term (mortgages) 1694.7 1915.2 2092.7 2375.9 2683.0 2869.9 2857.3 2724.9 108
109 FL115114005 Equity and investment fund shares (direct investment in the U.S.) 3.3 3.0 3.3 3.6 3.6 3.6 4.0 4.3 109
110 FL113196005 Other accounts payable 977.3 1078.1 1279.1 1447.1 1570.8 1697.5 1731.6 1741.5 110111 FL113170005 Trade payables 261.2 284.9 334.5 348.9 374.9 380.7 388.3 369.1 111112 FL113178003 Taxes payable 69.7 78.0 86.7 95.7 99.5 106.2 99.9 95.0 112113 FL113193003 Other (miscellaneous liabilities) 646.5 715.2 857.9 1002.5 1096.4 1210.7 1243.3 1277.4 113
114 FL112090205 Net worth 6287.3 7537.4 8860.9 9187.2 9323.5 7714.3 6460.0 7055.9 114
Notes. Nonfinancial noncorporate business includes noncorporate farms that are excluded from the nonfinancial noncorporate business sector in the Flow of Funds Accounts.Estimates for 2000 and earlier periods are based on the 1987 Standard Industrial Classification System; later estimates are based on the North American Classification System.(1) Consists of rental income of tenant-occupied housing and proprietors’ income. Quasi-corporations are unincorporated enterprises that function as if they were corporations;they primarily cover their operating costs through sales, and they keep a complete set of financial records.(2) Government-sponsored enterprises (GSEs) consist of Federal Home Loan Banks, Fannie Mae, Freddie Mac, Federal Agricultural Mortgage Corporation, Farm Credit System,the Financing Corporation, and the Resolution Funding Corporation, and they included the Student Loan Marketing Association until it was fully privatized in the fourth quarter of 2004.(3) Net equity in reserves of property-casualty insurance companies.(4) Farm houses are included in the household sector.n.e.c. Not elsewhere classified
Appendix B

SNA Tables, June 7, 2012 10
S.5.a Nonfinancial Corporate BusinessBillions of dollars; quarterly figures are seasonally adjusted annual rates
2003 2004 2005 2006 2007 2008 2009 2010
Current account
1 FA106902501 Gross value added 5503.7 5877.5 6302.8 6740.3 6946.0 6991.4 6592.0 6902.0 1
2 FA106300083 Less: Consumption of fixed capital 669.0 695.6 743.0 800.9 840.1 864.3 862.2 856.8 2
3 FA106902605 Equals: Net value added 4834.7 5181.9 5559.8 5939.4 6106.0 6127.1 5729.8 6045.2 3 4 FA106025005 Compensation of employees (paid) 3651.3 3786.7 3976.3 4182.3 4361.0 4441.2 4178.2 4263.0 4 5 FA106020001 Wages and salaries 2979.0 3105.5 3267.5 3462.3 3636.2 3681.4 3436.4 3513.4 5 6 FA106401001 Employers’ social contributions 672.3 681.2 708.8 720.0 724.8 759.8 741.7 749.6 6 7 FA106240101 Taxes on production and imports less subsidies 484.2 517.7 558.4 593.3 607.7 615.2 587.4 614.3 7 8 FA106402101 Operating surplus, net 699.2 877.5 1025.1 1163.7 1137.4 1070.8 964.2 1167.8 8
9 FA106140005 Net national income/Balance of primary incomes, net 373.2 500.5 689.8 678.9 589.2 522.9 579.0 848.3 910 FA106402101 Operating surplus, net 699.2 877.5 1025.1 1163.7 1137.4 1070.8 964.2 1167.8 1011 FA106150105 Property income (received) 420.0 481.8 614.7 643.6 689.1 634.8 603.5 644.2 1112 FA106130101 Interest 237.0 253.1 296.8 357.1 382.8 310.6 246.5 224.0 1213 FA106121101 Distributed income of corporations (dividends) 55.8 66.3 300.2 79.6 92.3 108.0 138.1 132.4 1314 FA103092201 Reinvested earnings on U.S. direct investment abroad 127.2 162.4 17.8 206.8 214.1 216.2 218.8 287.7 1415 FA106150005 Less: Uses of property income (paid) 746.0 858.7 950.0 1128.4 1237.3 1182.7 988.7 963.7 1516 FA106130001 Interest 370.8 372.2 428.2 503.2 596.3 546.2 473.4 335.4 1617 FA106121001 Distributed income of corporations (dividends) 349.2 430.8 471.1 550.7 576.9 582.2 487.1 531.2 1718 FA103192201 Reinvested earnings on foreign direct investment 12.0 40.5 34.0 56.5 45.3 32.3 11.3 77.6 1819 FA106112001 Rent 14.1 15.3 16.8 18.0 18.8 22.0 16.9 19.5 19
20 FA106140005 Net national income/Balance of primary incomes, net 373.2 500.5 689.8 678.9 589.2 522.9 579.0 848.3 2021 FA106220001 Less: Current taxes on income, wealth, etc. (paid) 132.9 187.0 271.9 307.6 293.8 227.4 175.0 229.3 2122 FA106403001 Less: Other current transfers (paid) 65.2 65.5 79.3 75.8 69.1 58.1 78.3 85.4 22
23 FA106012095 Equals: Disposable income, net 175.1 248.0 338.6 295.4 226.3 237.5 325.6 533.7 23
24 FA106012095 Equals: Net saving 175.1 248.0 338.6 295.4 226.3 237.5 325.6 533.7 24
Capital account
25 FA106006385 Net saving less capital transfers 175.2 254.7 354.2 295.5 226.4 241.1 287.3 512.4 2526 FA106012095 Net saving 175.1 248.0 338.6 295.4 226.3 237.5 325.6 533.7 2627 FA105440005 Less: Capital transfers paid (net) -0.1 -6.7 -15.5 -0.0 -0.0 -3.7 38.3 21.3 27
28 FA105050985 Capital formation, net 137.9 197.6 254.5 350.6 320.4 248.2 -101.6 135.2 28 Gross fixed capital formation (acquisition of29 FA105019085 produced nonfinancial assets) 794.2 841.4 950.7 1079.1 1134.0 1136.5 908.2 930.7 2930 FA106300083 Less: Consumption of fixed capital 669.0 695.6 743.0 800.9 840.1 864.3 862.2 856.8 3031 FA105420005 Acquisition of nonproduced nonfinancial assets -2.9 -2.7 -0.6 12.5 -1.7 16.3 3.9 -3.4 3132 FA105020005 Change in private inventories 15.5 54.4 47.4 59.9 28.2 -40.2 -151.5 64.7 32
33 FA105000905 Net lending (+) or borrowing (-), capital account (lines 25-28) 37.3 57.1 99.7 -55.2 -94.0 -7.1 388.9 377.2 33
Financial account
34 FA105000905 Net lending (+) or borrowing (-), capital account (line 33) 37.3 57.1 99.7 -55.2 -94.0 -7.1 388.9 377.2 34
35 FA104090005 Net acquisition of financial assets 87.6 780.1 945.7 700.9 1074.9 -604.0 308.7 780.5 35
36 FA104000005 Currency and deposits 133.0 56.2 120.6 -84.8 -62.3 -197.6 253.6 188.0 3637 FA103020005 Currency and transferable deposits 44.0 3.0 60.8 -117.2 -7.6 -112.6 139.8 155.8 3738 FA103030003 Time and savings deposits 71.5 37.7 49.9 46.6 -55.7 -59.4 106.9 22.6 3839 FA103091003 Foreign deposits 17.6 15.6 9.9 -14.2 0.9 -25.5 6.8 9.6 39
40 FA104022005 Debt securities 10.8 16.2 40.4 -1.2 -61.7 -25.7 16.3 15.3 4041 FA103069100 Open market paper 10.9 19.3 16.0 11.7 -53.2 -12.2 -1.3 11.8 4142 FA103061103 Treasury securities 2.3 0.3 18.1 -6.7 -7.1 -7.9 12.5 4.9 4243 FA103061703 Agency- and GSE-backed securities (1) -5.7 0.1 6.0 -2.2 -2.4 -2.6 4.2 1.6 4344 FA103062003 Municipal securities 3.3 -3.6 0.3 -4.0 1.1 -3.0 0.9 -3.0 44
45 FA104035005 Loans -13.7 15.4 10.2 -12.7 -23.7 -11.6 -8.1 0.4 4546 FA104041005 Short term (security RPs and consumer credit) -15.9 0.6 8.5 -4.3 -5.3 -3.8 -4.0 1.9 4647 FA103065003 Long term (mortgages) 2.2 14.8 1.7 -8.4 -18.4 -7.7 -4.1 -1.5 47
48 FA103081005 Equity and investment fund shares 103.3 284.1 142.5 334.8 374.7 407.0 237.1 196.8 4849 FA103034003 Money market fund shares -30.4 10.3 52.7 69.1 127.2 162.2 -69.0 -156.9 4950 FA103064203 Mutual fund shares 5.8 -1.3 0.7 23.6 -4.8 -16.7 35.5 11.2 5051 FA103092005 U.S. direct investment abroad 125.3 272.4 24.7 219.2 307.0 262.6 279.8 322.1 5152 FA103092405 Equity in government-sponsored enterprises (1) 0.1 0.1 0.0 0.1 0.1 -0.1 0.0 0.1 5253 FA103094105 Investment in finance company subsidiaries 2.6 2.6 64.4 22.9 -54.8 -1.1 -9.3 20.3 53
54 FA103076005 Insurance, pension and standardized guarantee schemes (2) 19.1 19.7 21.2 7.6 8.3 10.9 -0.9 3.0 54
55 FA103096005 Other accounts receivable -165.0 388.5 610.8 457.1 839.6 -787.0 -189.3 377.0 5556 FA103070005 Trade receivables -17.7 128.8 277.6 -15.1 161.9 -167.7 -28.6 135.2 5657 FA103093005 Other (miscellaneous assets) -147.2 259.7 333.2 472.2 677.7 -619.3 -160.7 241.8 57
Appendix B

SNA Tables, June 7, 2012 11
S.5.a Nonfinancial Corporate BusinessBillions of dollars; quarterly figures are seasonally adjusted annual rates
2003 2004 2005 2006 2007 2008 2009 2010
58 FA104190005 Net incurrence of liabilities 13.5 614.1 965.5 839.3 1281.0 339.0 -254.7 629.9 5859 FA104122005 Debt securities 121.4 113.6 88.7 285.0 391.5 281.4 352.4 482.0 5960 FA103169100 Open market paper -37.3 15.3 -7.7 22.4 11.3 7.7 -73.1 24.5 6061 FA103162000 Municipal securities 3.3 10.6 42.2 54.3 69.0 68.2 37.8 34.7 6162 FA103163003 Corporate bonds 155.4 87.7 54.2 208.3 311.1 205.5 387.6 422.8 62
63 FA104135005 Loans -34.0 122.6 276.4 233.7 445.1 66.9 -481.6 -197.9 6364 FA104141005 Short term -84.0 55.1 83.1 150.0 384.3 112.6 -361.5 -129.2 6465 FA103168005 Depository institution loans n.e.c. -91.4 4.0 -27.1 22.1 96.3 64.2 -219.8 -33.4 6566 FA103169005 Other loans and advances 7.3 51.1 110.2 127.9 287.9 48.5 -141.7 -95.8 6667 FA103165005 Long term (mortgages) 50.0 67.6 193.3 83.7 60.9 -45.7 -120.2 -68.6 67
68 FA103181005 Equity and investment fund shares 0.7 -27.0 -243.1 -374.7 -575.3 -146.4 47.4 -91.8 6869 FA103164103 Corporate equities -39.6 -122.7 -341.8 -565.7 -786.8 -336.0 -64.6 -278.0 6970 FA103192005 Foreign direct investment in the United States 40.2 95.7 98.7 191.0 211.6 189.5 112.0 186.2 70
71 FA573074005 Insurance, pension and standardized guarantee schemes -0.2 -3.1 -1.9 -2.0 4.4 0.7 2.5 -1.3 71
72 FA103196005 Other accounts payable -74.4 408.0 845.5 697.3 1015.3 136.4 -175.4 438.8 7273 FA103170005 Trade payables -54.7 97.7 199.0 109.0 85.1 -225.2 -85.3 163.1 7374 FA103178000 Taxes payable -11.7 6.8 -1.8 -0.8 -49.6 3.1 -3.3 7.2 7475 FA103193005 Miscellaneous liabilities -7.9 303.5 648.2 589.0 979.8 358.5 -86.9 268.5 75
Addendum:76 FA105000005 Net lending (+) or borrowing (-), financial account (lines 35-58) 74.1 166.0 -19.8 -138.4 -206.1 -943.0 563.4 150.6 76
Other changes in volume account
77 FU108090105 Total other volume changes 184.2 309.3 333.9 678.7 805.4 -673.4 231.4 345.3 7778 FU105404005 Disaster losses 0.0 9.2 22.7 0.0 0.0 5.8 0.0 0.0 7879 FU108090085 Other volume changes 136.2 157.0 400.0 723.9 870.2 212.3 57.4 532.8 7980 FU107005045 Less: Statistical discrepancy (lines 33-[35-58]) (3) -36.7 -108.9 119.5 83.2 112.1 935.9 -174.5 226.5 8081 FU105020601 Less: Inventory valuation adjustment -11.3 -34.3 -30.7 -38.0 -47.2 -44.5 0.6 -39.1 81
Revaluation account
82 FD102010705 Nonfinancial assets 309.5 1265.0 1003.0 1015.4 1668.8 -1098.5 -2974.1 1110.5 8283 FD105035705 Real estate 263.1 1140.8 882.7 867.5 1556.5 -1151.4 -2983.2 1053.2 8384 FD105013705 Equipment and software 29.5 86.9 86.1 137.7 51.4 103.4 -20.3 -1.5 8485 FD105020015 Inventories 16.9 37.4 34.2 10.2 60.9 -50.5 29.4 58.8 85
86 FD108080095 Financial assets 26.1 89.2 94.5 31.0 154.8 -199.6 23.3 -17.3 8687 FD103064203 Mutual fund shares 18.2 11.9 8.1 15.2 9.7 -55.1 20.2 13.6 8788 FD103092005 Direct investment abroad 7.9 77.2 86.3 15.9 145.1 -144.4 3.1 -30.9 88
89 FD103181005 Liabilities 2681.7 1378.2 980.7 2463.8 1942.9 -5479.4 2406.2 2169.3 8990 FD103164103 Corporate equity 2672.5 1366.1 939.8 2481.5 1915.2 -5378.2 2542.7 2206.0 9091 FD103192005 Foreign direct investment in the United States 9.2 12.1 41.0 -17.7 27.7 -101.2 -136.5 -36.8 91
92 FD108200705 Changes in net worth due to nominal holding gains/losses -2346.1 -24.0 116.7 -1417.4 -119.3 4181.3 -5357.0 -1076.0 92
Changes in balance sheet account
93 FR102090085 Change in net worth (lines 28+33+77+92) (4) -1986.8 540.1 804.7 -443.1 912.5 3749.1 -4838.3 -218.3 93
Balance sheet account (end of period)
94 FL102000005 Total assets 20795.3 23065.8 25268.8 27380.9 30516.2 28860.2 26173.4 28348.5 94
95 FL102010005 Nonfinancial assets (5) 10671.9 12121.2 13360.2 14713.3 16754.2 15922.6 12832.2 14157.6 9596 FL105035005 Real estate 6011.5 7205.9 8170.2 9165.8 10909.0 9945.2 7049.6 8189.1 9697 FL105015205 Equipment and software 3310.4 3439.2 3601.6 3851.0 4012.2 4190.8 4118.7 4141.9 9798 FL105020015 Inventories 1350.1 1476.1 1588.4 1696.5 1832.9 1786.6 1663.9 1826.6 98
99 FL104090005 Financial assets 10123.4 10944.6 11908.6 12667.6 13762.1 12937.7 13341.1 14190.9 99
100 FL104000005 Currency and deposits 605.1 661.3 781.9 697.1 634.8 437.2 690.8 878.7 100101 FL103020005 Currency and transferable deposits 204.2 207.2 268.0 150.8 143.2 30.6 170.4 326.2 101102 FL103030003 Time and savings deposits 362.8 400.5 450.4 497.0 441.3 381.9 488.8 511.4 102103 FL103091003 Foreign deposits 38.1 53.7 63.6 49.3 50.3 24.7 31.5 41.1 103
104 FL104022005 Debt securities 156.0 172.2 212.6 211.4 149.7 124.1 140.4 155.7 104105 FL103069100 Open market paper 75.7 95.0 111.0 122.7 69.5 57.3 56.0 67.8 105106 FL103061103 Treasury securities 33.7 34.0 52.1 45.5 38.3 30.5 43.0 47.8 106107 FL103061703 Agency- and GSE-backed securities (1) 11.2 11.3 17.4 15.2 12.8 10.2 14.3 15.9 107108 FL103062003 Municipal securities 35.4 31.8 32.1 28.1 29.2 26.2 27.1 24.1 108
Appendix B

SNA Tables, June 7, 2012 12
S.5.a Nonfinancial Corporate BusinessBillions of dollars; quarterly figures are seasonally adjusted annual rates
2003 2004 2005 2006 2007 2008 2009 2010
109 FL104035005 Loans 116.8 132.2 142.4 132.4 108.7 97.1 89.1 93.2 109110 FL104041005 Short term 65.1 65.6 74.1 72.6 67.3 63.5 59.5 65.2 110111 FL102050003 Security repurchases 6.0 6.4 14.6 15.5 8.1 7.2 7.9 12.1 111112 FL103066005 Consumer credit 59.1 59.2 59.6 57.0 59.3 56.3 51.7 53.1 112113 FL103065003 Long term (mortgages) 51.8 66.6 68.3 59.8 41.4 33.6 29.5 28.0 113
114 FL103081005 Equity and investment fund shares 2170.6 2543.9 2809.9 3175.8 3701.6 3908.8 4169.2 4348.7 114115 FL103034003 Money market fund shares 289.3 299.6 352.2 421.3 548.5 710.6 641.7 484.8 115116 FL103064203 Mutual fund shares 114.9 125.6 134.4 173.1 178.0 106.2 161.9 186.6 116117 FL103092005 U.S. direct investment abroad 1745.1 2094.7 2205.7 2440.7 2892.9 3011.1 3294.0 3585.2 117118 FL103092405 Equity in government-sponsored enterprises (1) 0.4 0.5 0.5 0.6 0.7 0.4 0.5 0.6 118119 FL103094105 Investment in finance company subsidiaries 21.0 23.6 117.0 140.1 81.5 80.5 71.2 91.5 119
120 FL103076005 Insurance, pension and standardized guarantee schemes (2) 243.0 262.7 284.0 291.6 299.9 311.1 310.2 313.2 120
121 FL103096005 Other accounts receivable 6831.8 7172.3 7677.9 8159.2 8867.3 8059.4 7941.6 8401.4 121122 FL103070005 Trade receivables 1701.8 1830.6 2108.2 2090.5 2252.4 2084.6 2056.0 2187.4 122123 FL103093005 Other (miscellaneous assets) 5130.0 5341.6 5569.6 6068.7 6615.0 5974.8 5885.6 6214.0 123
124 FL102100085 Total liabilities and net worth 20795.3 23065.8 25268.8 27380.9 30516.2 28860.2 26173.4 28348.5 124
125 FL104194005 Liabilities 20739.9 22470.4 23868.6 26423.8 28646.7 23241.6 25393.0 27786.5 125
126 FL104122005 Debt securities 3260.6 3375.6 3464.4 3749.3 4140.8 4422.2 4774.5 5256.6 126127 FL103169100 Open market paper 82.5 97.8 90.1 112.5 123.8 131.5 58.4 82.9 127128 FL103162000 Municipal securities 163.9 176.0 218.2 272.4 341.5 409.7 447.5 482.3 128129 FL103163003 Corporate bonds 3014.2 3101.9 3156.1 3364.4 3675.5 3881.0 4268.6 4691.4 129
130 FL104135005 Loans 1878.5 2001.1 2277.4 2509.5 2961.1 3023.1 2457.3 2276.7 130131 FL104141005 Short term 1356.3 1411.4 1494.5 1641.6 2032.3 2145.0 1699.3 1586.3 131132 FL103168005 Depository institution loans n.e.c. 614.1 618.0 591.0 613.0 715.9 780.0 560.3 545.2 132133 FL103169005 Other loans and advances 742.2 793.3 903.5 1028.5 1316.5 1364.9 1139.1 1041.1 133134 FL103165005 Long term (mortgages) 522.1 589.7 783.0 867.9 928.8 878.1 757.9 690.4 134
135 FL103181005 Equity and investment fund shares 12147.2 13498.4 14236.0 16325.1 17692.7 12066.9 14520.5 16597.9 135136 FL103164103 Corporate equity 10845.2 12088.6 12686.6 14602.3 15730.7 10016.6 12494.7 14422.8 136137 FL103192005 Foreign direct investment in the United States 1302.0 1409.8 1549.4 1722.7 1961.9 2050.3 2025.8 2175.2 137
138 FL573074005 Insurance, pension and standardized guarantee schemes 49.8 46.6 44.8 42.8 47.2 47.9 50.5 49.2 138
139 FL103196005 Other accounts payable 3403.9 3548.6 3846.1 3797.1 3804.8 3681.5 3590.3 3606.1 139140 FL103170005 Trade payables 1403.9 1501.6 1700.6 1812.9 1897.9 1672.7 1587.5 1750.6 140141 FL103178000 Taxes payable 81.2 88.0 86.2 85.4 35.8 39.0 35.7 42.9 141142 FL103193005 Miscellaneous liabilities 1918.8 1959.1 2059.3 1898.9 1871.1 1969.8 1967.1 1812.6 142
143 FL102090085 Net worth 55.4 595.5 1400.2 957.1 1869.5 5618.7 780.4 562.0 143
Notes. Nonfinancial corporate business includes corporate farms that are excluded from the nonfinancial corporate business sector in the Flow of Funds Accounts.Estimates for 2000 and earlier periods are based on the 1987 Standard Industrial Classification System; later estimates are based on the North American Classification System.(1) Government-sponsored enterprises (GSEs) consist of Federal Home Loan Banks, Fannie Mae, Freddie Mac, Federal Agricultural Mortgage Corporation, Farm Credit System, the Financing Corporation, and the Resolution Funding Corporation, and they included the Student Loan Marketing Association until it was fully privatized in the fourth quarter of 2004.(2) Net equity in reserves of property-casualty insurance companies.(3) The statistical discrepancy is the difference between net lending or net borrowing derived in the capital account and the same concept derived in the financial account. The discrepancyreflects differences in source data, timing of recorded flows, and other statistical differences between the capital and financial accounts.(4) Includes changes in the market value of shares and other equity that are excluded from the related measures for the nonfinancial corporate business sector in the Flow of Funds Accounts.(5) Excludes nonproduced nonfinancial assets.n.e.c. Not elsewhere classified
Appendix B

SNA Tables, June 7, 2012 11
S.6.a Financial BusinessBillions of dollars; quarterly figures are seasonally adjusted annual rates
2003 2004 2005 2006 2007 2008 2009 2010
Current account
1 FA796902505 Gross value added 922.3 964.5 1085.8 1189.4 1118.6 1031.0 1119.7 1372.9 1
2 FA796300081 Less: Consumption of fixed capital 113.0 120.5 127.3 132.8 140.6 172.7 176.9 179.1 2
3 FA796902605 Equals: Net value added 809.3 844.1 958.5 1056.7 978.1 858.3 942.8 1193.8 3 4 FA796025005 Compensation of employees (paid) 467.3 497.4 541.8 584.4 610.3 610.4 568.0 584.7 4 5 FA796020001 Wages and salaries 393.6 420.0 454.5 492.4 521.0 513.3 471.1 487.1 5 6 FA796401001 Employers’ social contributions 73.7 77.4 87.3 92.0 89.2 97.1 96.8 97.6 6 7 FA796240101 Taxes on production and imports less subsidies 39.9 43.4 46.1 50.5 53.4 51.2 54.7 55.1 7 8 FA796402101 Operating surplus, net 302.1 303.3 370.6 421.8 314.4 196.7 320.2 554.0 8
9 FA796140005 Net national income/Balance of primary incomes, net 231.8 252.0 271.7 274.5 200.6 42.3 260.0 314.8 910 FA796402101 Operating surplus, net 302.1 303.3 370.6 421.8 314.4 196.7 320.2 554.0 1011 FA796150105 Property income (received) 1108.6 1338.1 1711.5 2255.2 2732.7 2358.2 1678.4 1422.8 1112 FA796130101 Interest 1010.4 1205.9 1570.2 2057.5 2483.9 2099.8 1461.7 1190.9 1213 FA796121101 Distributed income of corporations (dividends) 77.3 102.0 138.3 156.0 201.2 209.1 165.0 165.8 1314 FA793092281 Reinvested earnings on U.S. direct investment abroad 20.9 30.1 3.0 41.6 47.6 49.3 51.7 66.0 1415 FA796150005 Less: Uses of property income (paid) 1179.0 1389.3 1810.4 2402.5 2846.5 2512.5 1738.6 1661.9 1516 FA796130001 Interest 948.6 1100.4 1480.4 2007.9 2411.0 2129.1 1347.9 1206.4 1617 FA796120005 Distributed income of corporations 227.9 279.7 321.9 381.7 425.4 376.4 388.2 439.4 1718 FA796121001 Dividends 176.7 225.6 263.9 311.8 366.4 341.3 332.4 382.3 1819 FA796122001 Withdrawals from income of quasi-corporations (1) 51.2 54.1 58.0 69.9 59.0 35.1 55.9 57.0 1920 FA793192281 Reinvested earnings on foreign direct investment 2.5 9.3 8.0 12.9 10.1 7.1 2.4 16.2 2021 FA796112001 Rents on land and natural resources 0.0 0.0 0.0 0.0 0.0 0.0 0.0 0.0 21
22 FA796140005 Net national income/Balance of primary incomes, net 231.8 252.0 271.7 274.5 200.6 42.3 260.0 314.8 2223 FA796220001 Less: Current taxes on income, wealth, etc. (paid) 110.9 119.1 140.5 165.6 151.7 81.6 97.4 181.8 2324 FA796403005 Less: Other current transfers (paid) -13.2 -9.6 -16.6 -26.0 4.6 45.6 18.7 15.0 24
25 FA796012095 Equals: Disposable income, net 134.1 142.5 147.7 134.8 44.3 -85.0 143.9 118.0 25
26 FA796012095 Equals: Net saving 134.1 142.5 147.7 134.8 44.3 -85.0 143.9 118.0 26
Capital account
27 FA796006385 Net saving less capital transfers 134.1 126.3 120.0 134.8 44.3 -24.5 265.9 159.5 2728 FA796012095 Net saving 134.1 142.5 147.7 134.8 44.3 -85.0 143.9 118.0 2829 FA795440005 Less: Capital transfers paid (net) 0.0 16.2 27.7 0.0 0.0 -60.5 -121.9 -41.5 29
30 FA795015085 Capital formation, net 22.3 34.6 28.0 29.9 46.9 22.2 -8.8 2.6 3031 FA795013005 Gross fixed capital formation (nonresidential) 135.4 155.1 155.3 162.7 187.5 195.0 168.1 181.7 3132 FA796300081 Less: Consumption of fixed capital 113.0 120.5 127.3 132.8 140.6 172.7 176.9 179.1 32
33 FA795000995 Net lending (+) or borrowing (-), capital account (lines 27-30) 111.7 91.7 92.0 104.9 -2.6 -46.7 274.6 156.9 33
Financial account
34 FA795000995 Net lending (+) or borrowing (-) (line 33) 111.7 91.7 92.0 104.9 -2.6 -46.7 274.6 156.9 34
35 FA794090005 Net acquisition of financial assets 2780.3 2966.0 3311.3 4128.2 4804.9 4606.5 -1592.3 -678.9 35
36 FA713011203 Monetary gold 0.0 0.0 -0.0 -0.0 0.0 0.0 0.0 0.0 36
37 FA794000005 Currency and deposits -42.3 33.9 -5.0 60.6 169.4 1017.5 236.1 -141.2 37
38 FA794022005 Debt securities 1037.0 463.3 615.3 1119.3 1112.5 1451.2 942.0 733.8 3839 FA713014003 SDR certificates 0.0 0.0 0.0 0.0 0.0 0.0 3.0 0.0 3940 FA793069175 Open market paper -164.5 33.4 196.3 232.4 -94.8 34.2 -393.4 -127.0 4041 FA793061105 Treasury securities 88.2 -52.6 48.4 92.1 108.0 436.0 440.6 461.4 4142 FA793061705 Agency- and GSE-backed securities (2) 419.7 -168.8 -189.1 135.9 301.6 858.9 603.7 83.1 4243 FA793062005 Municipal securities 101.3 87.0 112.6 123.4 180.1 51.7 15.6 29.4 4344 FA793063005 Corporate and foreign bonds 567.7 523.4 407.2 499.8 584.3 7.1 210.5 221.2 4445 FA343150005 Nonmarketable government securities 24.7 40.9 40.0 35.8 33.3 63.3 61.9 65.7 45
46 FA794035005 Loans 1110.6 1570.6 1954.6 2025.5 2332.8 1645.4 -2795.2 -974.1 4647 FA794041005 Short term 121.3 362.0 547.6 633.5 1264.4 1556.7 -2508.3 -471.7 4748 FA793065005 Long term (mortgages) 989.3 1208.5 1407.0 1392.0 1068.4 88.7 -286.8 -502.5 48
49 FA793081005 Equity and investment fund shares 341.7 663.2 512.3 518.2 998.7 608.5 -53.7 -40.8 4950 FA793064105 Corporate equities 258.0 329.5 236.4 124.3 166.3 -8.9 51.6 62.1 5051 FA793064205 Mutual fund shares -2.6 97.1 52.2 102.6 117.2 24.7 101.4 72.4 5152 FA793034005 Money market mutual fund shares -67.4 -104.6 35.4 60.9 333.8 303.9 -170.9 -158.1 5253 FA793092405 Equity in government-sponsored enterprises (2) 2.5 2.4 2.0 -0.0 8.3 -5.3 0.0 -3.2 5354 FA793092005 U.S. direct investment abroad 24.3 43.8 11.5 25.8 107.0 66.4 23.8 29.3 5455 FA713164003 Stock in Federal Reserve Banks 0.5 3.1 1.6 1.8 3.1 2.6 4.6 0.9 5556 FA793094005 Investment in subsidiaries 126.4 291.9 173.2 202.8 263.1 225.0 -64.1 -44.2 56
57 FA793052005 Insurance, pension and standardized guarantee schemes -17.3 -36.8 -2.3 4.9 47.9 47.3 10.6 5.2 57
58 FA793096005 Other accounts receivable 350.6 271.9 236.3 399.7 143.5 -163.3 67.9 -261.8 58
Appendix B

SNA Tables, June 7, 2012 12
S.6.a Financial BusinessBillions of dollars; quarterly figures are seasonally adjusted annual rates
2003 2004 2005 2006 2007 2008 2009 2010
59 FA794190005 Net incurrence of liabilities 2562.0 2950.5 3004.7 3865.3 4696.7 4873.3 -1637.9 -469.8 59
60 FA794100095 Currency and deposits 465.7 612.5 617.7 616.2 536.5 2209.1 240.1 303.0 60
61 FA794122005 Debt securities 1010.0 805.9 1039.2 1323.3 1504.8 362.8 -1095.8 -731.1 6162 FA423161705 Agency- and GSE-backed securities (2) 586.2 115.8 80.4 328.2 905.7 768.7 -60.1 -46.9 6263 FA793163005 Corporate bonds 487.3 668.5 744.6 798.8 710.6 -280.3 -587.6 -582.5 6364 FA793169175 Commercial paper -63.5 21.7 214.2 196.3 -111.4 -125.6 -448.2 -101.7 64
65 FA794135005 Loans 370.6 311.1 424.9 564.7 582.9 -70.1 -1063.9 -448.0 6566 FA794141005 Short term 361.7 285.6 410.8 558.1 578.2 -76.8 -1067.2 -448.2 6667 FA643165005 Long term (mortgages) 8.9 25.5 14.1 6.6 4.7 6.8 3.4 0.2 67
68 FA793181005 Equity and investment fund shares 256.2 651.7 699.9 933.2 1454.2 1756.4 258.4 99.2 6869 FA634090005 Money market mutual fund shares -207.5 -136.5 127.0 305.3 720.9 724.2 -499.0 -502.9 6970 FA793164105 Corporate equity issues 66.1 118.3 78.5 59.5 178.6 637.6 314.3 190.8 7071 FA653164205 Mutual fund shares 288.6 298.2 260.2 336.8 364.7 31.0 490.5 389.3 7172 FA403192405 Equity in government-sponsored enterprises (2) 3.2 2.5 1.9 0.2 9.1 -4.2 0.0 -2.7 7273 FA793192005 Foreign direct investment in the United States 23.9 50.2 13.9 52.0 9.3 120.7 46.1 50.1 7374 FA662090205 Equity in noncorporate business -3.4 -4.2 -1.2 -6.8 2.4 11.5 -3.6 0.4 7475 FA793194005 Investment by parent 84.9 320.1 218.1 184.4 166.1 233.0 -94.5 -26.6 7576 FA713164003 Stock in Federal Reserve Banks 0.5 3.1 1.6 1.8 3.1 2.6 4.6 0.9 76
77 FA583152005 Insurance, pension and standardized guarantee schemes 405.5 414.0 351.0 345.0 294.6 272.8 174.3 242.0 77
78 FA793196005 Other accounts payable 54.1 155.3 -128.0 82.9 323.6 342.2 -150.9 65.0 78
Addendum:79 FA795000005 Net lending (+) or borrowing (-), financial account (lines 35-59) 218.3 15.6 306.6 263.0 108.2 -266.8 45.6 -209.1 79
Other changes in volume account
80 FU798090185 Total other volume changes 12.3 -60.9 154.4 32.5 -94.5 -346.3 463.7 -353.3 8081 FU795404005 Disaster losses 0.0 1.7 1.7 0.0 0.0 0.6 0.0 0.0 8182 FU798090085 Other volume changes -94.3 13.5 -61.9 -125.6 -205.3 -126.9 692.7 12.7 8283 FU797005045 Less: Statistical discrepancy (lines 33-[35-59]) (3) -106.5 76.1 -214.6 -158.1 -110.8 220.0 229.1 366.0 83
Revaluation account
84 FD792010795 Nonfinancial assets 40.0 88.4 101.9 98.9 57.3 64.8 -53.8 -4.2 8485 FD795013765 Structures (nonresidential) 21.1 69.4 83.1 74.7 45.8 59.3 -50.3 1.4 8586 FD795013725 Equipment and software 18.9 18.9 18.8 24.3 11.5 5.6 -3.4 -5.5 86
87 FD793081085 Financial assets 2145.5 1202.1 1004.2 1931.8 931.6 -6170.0 2645.5 1780.3 8788 FD793064105 Corporate equities 1862.9 1045.5 712.8 1616.6 719.5 -5216.4 2191.2 1458.9 8889 FD793064205 Mutual fund shares 252.6 106.0 260.8 279.5 166.3 -964.4 441.9 279.9 8990 FD793092005 U.S. direct investment abroad 30.0 50.6 30.7 35.7 45.8 10.8 12.3 41.5 90
91 FD793181085 Liabilities 2774.7 1507.7 1203.9 2499.5 -210.3 -8068.2 3554.1 2084.7 9192 FD793164105 Corporate equity issues 795.9 458.8 262.3 716.6 -984.4 -2364.4 443.4 517.2 9293 FD653164205 Mutual fund shares 727.2 483.8 352.4 682.6 396.0 -2424.7 1035.8 583.7 9394 FD793192005 Foreign direct investment in the United States 8.4 4.0 9.4 22.5 -56.7 -157.6 22.4 17.4 9495 FD662090205 Equity in noncorporate business 11.4 2.4 1.7 4.9 -0.6 -13.6 6.3 1.3 9596 FD153050005 Pension fund reserves 1232.0 558.7 548.9 1039.6 439.1 -3107.9 1370.7 967.2 9697 FD793194005 Investment by parent -0.1 -0.0 29.0 33.2 -3.7 0.0 675.6 -2.0 97
98 FD798200705 Changes in net worth due to nominal holding gains/losses -589.2 -217.3 -97.8 -468.7 1199.2 1963.0 -962.4 -308.6 98
Changes in balance sheet account
99 FR792090095 Change in net worth (lines 30+33+80+98) -442.8 -151.9 176.7 -301.4 1149.1 1592.2 -232.9 -502.4 99
Balance sheet account (end of period)
100 FL792000095 Total assets 44885.5 49111.2 53374.2 59500.5 65323.0 64008.6 65658.2 66273.1 100
101 FL792010095 Nonfinancial assets (4) 1194.1 1296.9 1404.4 1511.0 1591.7 1678.2 1615.7 1614.1 101102 FL795013665 Structures (nonresidential) 685.6 755.7 838.9 914.0 967.2 1034.3 985.0 978.5 102103 FL795013265 Equipment and software 508.6 541.2 565.4 597.0 624.5 643.9 630.7 635.6 103
104 FL794090005 Financial assets 43691.4 47814.3 51969.9 57989.5 63731.3 62330.4 64042.5 64659.0 104
105 FL713011203 Monetary gold 11.0 11.0 11.0 11.0 11.0 11.0 11.0 11.0 105
106 FL794000005 Currency and deposits 743.9 779.0 771.3 833.2 1005.0 2058.3 2309.0 2168.4 106
Appendix B

SNA Tables, June 7, 2012 13
S.6.a Financial BusinessBillions of dollars; quarterly figures are seasonally adjusted annual rates
2003 2004 2005 2006 2007 2008 2009 2010
107 FL794022005 Debt securities 13529.5 14012.8 14608.9 15682.8 16795.3 18246.2 19210.7 19460.3 107108 FL713014003 SDR certificates 2.2 2.2 2.2 2.2 2.2 2.2 5.2 5.2 108109 FL793069175 Open market paper 785.6 818.9 1015.2 1244.3 1149.5 1183.4 790.0 663.0 109110 FL793061105 Treasury securities 1643.9 1591.2 1639.6 1727.4 1835.4 2271.3 2712.0 3173.4 110111 FL793061705 Agency- and GSE-backed securities (2) 4567.6 4418.8 4229.7 4363.7 4665.3 5524.2 6182.4 5802.7 111112 FL793062005 Municipal securities 1134.7 1221.8 1334.4 1457.5 1637.6 1689.2 1704.8 1734.2 112113 FL793063005 Corporate and foreign bonds 4580.6 5104.0 5504.9 5969.1 6553.4 6560.6 6739.2 6938.9 113114 FL343150005 Nonmarketable government securities 815.0 855.9 882.9 918.7 952.0 1015.3 1077.2 1142.9 114
115 FL794035005 Loans 14482.8 16068.2 18022.8 20029.2 22351.6 23996.6 21228.9 20290.0 115116 FL794041005 Short term 5496.5 5858.6 6406.2 7019.4 8273.4 9829.8 7348.9 6912.4 116117 FL793065005 Long term (mortgages) 8986.2 10209.6 11616.6 13009.8 14078.2 14166.9 13880.1 13377.6 117
118 FL793081005 Equity and investment fund shares 12011.2 13876.5 15393.1 17876.2 19806.5 14245.0 17513.0 19252.4 118119 FL793064105 Corporate equities 8095.0 9470.1 10419.2 12160.1 13045.9 7820.5 10063.4 11584.4 119120 FL793064205 Mutual fund shares 1452.0 1655.1 1968.1 2350.2 2633.8 1694.1 2237.4 2589.8 120121 FL793034005 Money market fund shares 612.8 508.2 543.6 604.6 938.4 1242.3 1071.4 913.3 121122 FL793092405 Equity in government-sponsored enterprises (2) 37.7 40.1 42.0 42.0 50.3 45.0 45.0 41.7 122123 FL793092005 U.S. direct investment abroad 309.4 403.8 446.0 507.4 660.2 737.4 773.5 844.3 123124 FL713164003 Stock in Federal Reserve Banks 8.8 11.9 13.5 15.3 18.5 21.1 25.6 26.5 124125 FL793094005 Investment in subsidiaries 1495.4 1787.3 1960.6 2196.5 2459.6 2684.6 3296.6 3252.4 125
126 FL793052005 Insurance, pension and standardized guarantee schemes 387.7 397.6 405.5 562.1 627.1 522.5 618.2 672.5 126
127 FL793096005 Other accounts receivable 2525.3 2669.2 2757.3 2994.9 3134.7 3250.7 3151.7 2804.4 127
128 FL792100005 Total liabilities and net worth 44885.5 49111.2 53374.2 59500.5 65323.0 64008.6 65658.2 66273.1 128
129 FL794194005 Liabilities 45691.1 50068.6 54155.0 60582.6 65256.1 62349.4 64231.9 65349.2 129
130 FL794100095 Currency and deposits 6839.1 7477.1 8095.4 8712.3 9248.2 11420.9 11654.5 11954.1 130
131 FL794122005 Debt securities 10158.1 10978.9 11963.6 13272.1 14906.8 15269.3 14498.9 13259.8 131132 FL423161705 Agency- and GSE-backed securities (2) 5944.5 6060.3 6140.7 6468.9 7374.6 8143.4 8083.3 7574.0 132133 FL793163005 Corporate bonds 3279.2 3962.6 4652.7 5440.1 6280.4 6000.1 5737.9 5109.9 133134 FL793169175 Commercial paper 934.4 956.0 1170.2 1363.2 1251.8 1125.8 677.6 575.9 134
135 FL794135005 Loans 2804.6 3115.7 3540.6 4102.1 4685.0 4614.9 3682.7 3211.1 135136 FL794141005 Short term 2698.7 2984.4 3395.1 3950.0 4528.3 4451.4 3515.8 3044.0 136137 FL643165005 Long term (mortgages) 105.9 131.4 145.5 152.1 156.7 163.5 166.9 167.1 137
138 FL793181005 Equity and investment fund shares 12207.6 13808.4 15163.2 17556.3 18361.1 15157.2 17599.1 18815.8 138139 FL634090005 Money market fund shares 2016.4 1879.8 2006.9 2312.1 3033.1 3757.3 3258.3 2755.3 139140 FL793164105 Corporate equity issues 3713.9 4291.1 4631.9 5408.0 4602.2 2875.4 3633.2 4341.1 140141 FL653164205 Mutual fund shares 4654.2 5436.3 6048.9 7068.3 7829.0 5435.3 6961.6 7934.5 141142 FL403192405 Equity in government-sponsored enterprises (2) 42.3 44.8 46.7 46.9 56.0 51.8 51.8 49.0 142143 FL793192005 Foreign direct investment in the United States 275.7 329.9 353.2 427.8 380.4 343.5 411.9 479.5 143144 FL662090205 Equity in noncorporate business 13.0 11.2 11.7 9.8 11.6 9.5 12.1 13.8 144145 FL793194005 Investment by parent 1483.4 1803.4 2050.4 2268.1 2430.5 2663.5 3244.5 3215.9 145146 FL713164003 Stock in Federal Reserve Banks 8.8 11.9 13.5 15.3 18.5 21.1 25.6 26.5 146
147 FL583152005 Insurance, pension and standardized guarantee schemes 11807.1 12840.5 13754.8 15205.9 15960.3 12884.5 14550.4 15827.6 147
148 FL793196005 Other accounts payable 1874.6 1848.0 1637.4 1733.9 2094.7 3002.5 2246.4 2280.9 148
149 FL792090095 Net worth -805.5 -957.4 -780.7 -1082.1 66.9 1659.2 1426.3 923.9 149
Notes. Financial business includes depository institutions, insurance companies and pension funds, monetary authority, and other financial institutions.Estimates for 2000 and earlier periods are based on the 1987 Standard Industrial Classification System; later estimates are based on the North American Classification System.(1) Consists of rental income of tenant-occupied housing and proprietors’ income. Quasi-corporations are unincorporated enterprises that function as if they were corporations;they primarily cover their operating costs through sales, and they keep a complete set of financial records.(2) Government-sponsored enterprises (GSEs) consist of Federal Home Loan Banks, Fannie Mae, Freddie Mac, Federal Agricultural Mortgage Corporation, Farm Credit System,the Financing Corporation, and the Resolution Funding Corporation, and they included the Student Loan Marketing Association until it was fully privatized in the fourth quarter of 2004.(3) The statistical discrepancy is the difference between net lending or net borrowing derived in the capital account and the same concept derived in the financial account. The discrepancyreflects differences in source data, timing of recorded flows, and other statistical differences between the capital and financial accounts.(4) Excludes land. Includes corporate and noncorporate financial business.SDRs Special Drawing Rights
Appendix B

SNA Tables, June 7, 2012 16
S.7.a Federal GovernmentBillions of dollars; quarterly figures are seasonally adjusted annual rates
2003 2004 2005 2006 2007 2008 2009 2010
Current account
1 FA316902505 Gross value added 449.2 480.5 504.1 528.9 555.3 585.3 618.0 652.9 1
2 FA316300003 Less: Consumption of fixed capital 90.8 94.8 100.4 106.6 112.6 120.0 124.7 130.0 2
3 FA316902605 Equals: Net value added 358.4 385.7 403.7 422.3 442.7 465.3 493.3 522.8 3 4 FA316025001 Compensation of employees (paid) 354.7 385.4 407.2 425.2 445.4 469.0 497.8 527.6 4 5 FA316020001 Wages and salaries 234.9 250.1 263.4 271.7 283.4 296.7 312.2 329.2 5 6 FA316401005 Employers’ social contributions 119.8 135.4 143.8 153.5 162.0 172.3 185.5 198.5 6 7 FA316402101 Operating surplus, net 3.7 0.3 -3.5 -2.9 -2.7 -3.7 -4.4 -4.8 7
8 FA316140005 Net national income/Balance of primary incomes, net -146.1 -149.2 -197.0 -207.5 -239.1 -221.1 -169.3 -185.9 8 9 FA316402101 Operating surplus, net 3.7 0.3 -3.5 -2.9 -2.7 -3.7 -4.4 -4.8 910 FA316240001 Taxes on production and imports, receivable 89.3 94.3 98.8 99.4 94.5 94.0 97.3 101.5 1011 FA316402015 Subsidies (paid) -49.0 -46.0 -60.5 -51.0 -47.4 -49.9 -58.3 -55.8 1112 FA316150195 Property income (received) 22.8 23.2 23.7 26.1 29.8 30.7 48.1 53.1 1213 FA316130101 Interest 16.4 16.3 16.4 18.2 22.2 20.1 24.5 29.9 1314 FA316121101 Distributed income of corporations (dividends) 0.0 0.1 0.2 0.3 0.2 0.6 18.7 17.0 1415 FA316112101 Rents on land and natural resources 6.4 6.8 7.0 7.7 7.3 10.0 4.8 6.2 1516 FA316130095 Less: Uses of property income (interest paid) 212.9 221.0 255.4 279.2 313.2 292.1 251.9 279.9 16
17 FA316140005 Net national income/Balance of primary incomes, net -146.1 -149.2 -197.0 -207.5 -239.1 -221.1 -169.3 -185.9 1718 FA316220001 Plus: Current taxes on income, wealth, etc. (received) 980.9 1059.5 1284.9 1458.9 1543.1 1353.7 1073.0 1239.3 1819 FA316601001 Plus: Social benefits (received) 762.8 807.6 852.6 904.6 945.3 973.1 948.9 970.9 1920 FA316404001 Less: Social contributions (paid) 972.7 1024.9 1089.2 1193.1 1267.5 1401.2 1617.9 1724.9 2021 FA316403105 Plus: Other current transfers (received) 25.6 29.0 33.6 38.3 44.8 54.4 69.8 69.7 2122 FA316403001 Less: Other current transfers (paid) 366.6 380.1 402.1 394.0 423.0 440.7 535.7 588.8 22
23 FA316012005 Equals: Disposable income, net 283.9 341.9 482.8 607.2 603.7 318.3 -231.3 -219.7 2324 FA316700001 Plus: Wage accruals less disbursements 0.0 0.0 0.0 0.0 0.0 0.0 0.0 0.0 2425 FA316901001 Less: Final consumption expenditures 660.3 721.4 765.8 811.0 848.9 931.7 986.6 1054.0 25
26 FA316006085 Equals: Net saving -376.4 -379.5 -283.0 -203.8 -245.2 -613.5 -1217.9 -1273.7 26
Capital account
27 FA316006385 Net saving less capital transfers -417.0 -418.4 -342.8 -246.5 -301.6 -746.9 -1422.0 -1423.3 2728 FA316006085 Net saving -376.4 -379.5 -283.0 -203.8 -245.2 -613.5 -1217.9 -1273.7 2829 FA315440005 Less: Capital transfers paid (net) 40.6 38.9 59.8 42.7 56.3 133.5 204.1 149.6 29
30 FA315050905 Capital formation, net 5.2 8.5 9.5 0.8 13.5 9.2 24.3 39.0 30 Gross fixed capital formation (acquisition of31 FA315019003 produced nonfinancial assets) 96.2 103.3 110.5 120.7 127.4 148.4 156.1 168.8 3132 FA316300003 Less: Consumption of fixed capital 90.8 94.8 100.4 106.6 112.6 120.0 124.7 130.0 3233 FA315420003 Acquisition of nonproduced nonfinancial assets -0.2 0.0 -0.5 -13.3 -1.3 -19.2 -7.1 0.2 33
34 FA315000995 Net lending (+) or borrowing (-), capital account (lines 27-30) -422.2 -426.8 -352.4 -247.2 -315.0 -756.2 -1446.3 -1462.3 34
Financial account
35 FA315000995 Net lending (+) or borrowing (-) (line 34) -422.2 -426.8 -352.4 -247.2 -315.0 -756.2 -1446.3 -1462.3 35
36 FA314090005 Net acquisition of financial assets 34.2 4.3 30.2 -14.2 -0.5 571.9 231.3 318.0 36
37 FA313011105 Monetary gold and SDRs -0.6 0.4 -4.5 0.2 0.2 0.1 48.2 0.0 3738 FA313011205 Monetary gold 0.0 -0.0 0.0 0.0 0.0 0.0 0.0 0.0 3839 FA313011303 SDR holdings -0.6 0.4 -4.5 0.2 0.2 0.1 48.2 0.0 39
40 FA314000005 Currency and deposits -16.9 -34.6 -0.9 -5.5 25.7 316.0 -170.0 150.6 4041 FA313011505 Official foreign currencies 0.3 0.3 0.3 0.4 0.5 0.6 0.3 0.3 4142 FA313011405 Reserve position in IMF (net) -1.5 -3.8 -10.2 -3.3 -1.0 3.5 3.4 1.3 4243 FA313020005 Currency and transferable deposits 9.3 -31.0 12.2 -2.7 25.1 313.1 -174.2 148.9 4344 FA723130130 Time and savings deposits -25.2 -0.0 -1.0 0.2 1.2 -1.3 0.3 0.1 4445 FA313091105 Nonofficial foreign currencies 0.2 -0.0 -2.2 -0.0 -0.1 0.0 0.2 0.1 45
46 FA314022005 Debt securities 0.0 0.0 0.0 0.0 0.0 54.4 142.5 -46.9 4647 FA313061703 Agency- and GSE-backed securities 0.0 0.0 0.0 0.0 0.0 54.4 142.0 -47.2 4748 FA313063763 Corporate and foreign bonds 0.0 0.0 0.0 0.0 0.0 0.0 0.6 0.3 48
49 FA314035005 Loans -2.6 2.3 -0.9 5.9 5.9 30.8 152.9 131.9 4950 FA314041005 Short term -0.1 0.7 -3.3 2.2 3.8 17.3 140.4 133.7 5051 FA313066220 Consumer credit 1.9 3.7 3.7 1.6 6.0 11.3 74.3 130.2 5152 FA313069005 Other loans and advances -2.0 -3.0 -7.0 0.6 -2.2 6.0 66.0 3.5 5253 FA313065005 Long term (mortgages) -2.5 1.6 2.4 3.7 2.1 13.5 12.6 -1.8 53
54 FA313081115 Equity and investment fund shares 1.4 2.0 1.3 2.0 1.7 257.7 3.4 30.4 5455 FA313064105 Corporate equities 0.0 0.0 0.0 0.0 0.0 256.3 0.6 24.1 5556 FA313092803 Equity in international organizations 1.4 2.0 1.3 2.0 1.7 1.4 1.7 2.3 5657 FA313092403 Equity in government-sponsored enterprises (1) 0.0 0.0 0.0 0.0 0.0 0.0 0.0 0.0 5758 FA313094303 Equity investment under Public-Private Inv. Program 0.0 0.0 0.0 0.0 0.0 0.0 1.2 4.0 58
Appendix B

SNA Tables, June 7, 2012 17
S.7.a Federal GovernmentBillions of dollars; quarterly figures are seasonally adjusted annual rates
2003 2004 2005 2006 2007 2008 2009 2010
59 FA313096005 Other accounts receivable 52.9 34.2 35.2 -16.9 -33.9 -87.2 54.2 52.0 5960 FA313070000 Trade receivables 19.1 10.5 9.2 -11.6 1.2 4.2 -21.1 -0.7 6061 FA313078005 Taxes receivable 33.5 22.3 25.3 -6.3 -35.5 -61.9 43.0 62.5 6162 FA313093003 Other (miscellaneous assets) 0.4 1.4 0.6 1.0 0.4 -29.4 32.3 -9.8 62
63 FA314190005 Net incurrence of liabilities 511.1 438.4 410.5 251.1 343.5 1351.4 1520.5 1679.9 63
64 FA313111303 SDR allocations 0.0 0.0 0.0 0.0 0.0 0.0 47.6 0.0 64
65 FA314100005 Currency and deposits 0.6 0.7 0.8 0.6 -0.7 -0.8 -0.4 -0.3 65
66 FA314122005 Debt securities 420.7 402.8 346.9 219.1 270.4 1302.5 1508.8 1645.9 6667 FA713014003 SDR certificates 0.0 0.0 0.0 0.0 0.0 0.0 3.0 0.0 6768 FA313161505 Treasury securities including savings bonds 398.4 362.5 307.3 183.7 237.5 1239.0 1443.7 1579.6 6869 FA313161705 Federal agency securities -2.4 -0.6 -0.4 -0.3 -0.4 0.2 0.1 0.7 6970 FA343150005 Nonmarketable securities held by pension plans 24.7 40.9 40.0 35.8 33.3 63.3 61.9 65.7 70
71 FA313165403 Loans (mortgages) 0.0 0.0 0.0 0.0 0.0 0.0 0.0 0.0 71
72 FA313152005 Insurance, pension and standardized guarantee schemes 20.7 18.5 24.2 19.6 45.1 27.5 17.7 23.4 7273 FA313140003 Insurance reserves 1.1 1.1 1.1 1.5 1.2 1.0 1.1 0.9 7374 FA313195105 Retiree Health Care Funds 19.6 17.4 23.0 18.1 43.9 26.5 16.6 22.5 74
75 FA313196005 Other accounts payable 69.1 16.4 38.7 11.8 28.7 22.2 -53.3 10.9 7576 FA313170005 Trade payables 71.7 15.4 33.7 6.2 29.3 22.6 -56.2 8.5 7677 FA313193005 Other (miscellaneous liabilities) -2.6 1.0 5.0 5.6 -0.6 -0.3 2.9 2.4 77
Addendum:78 FA315000005 Net lending (+) or borrowing (-), financial account (lines 36-63) -476.9 -434.1 -380.4 -265.3 -344.0 -779.5 -1289.2 -1361.9 78
Other changes in volume account
79 FU318090185 Total other volume changes -86.9 -30.3 -34.2 7.5 16.6 72.4 140.2 56.1 7980 FU315404003 Disaster losses 0.0 0.0 0.5 0.0 0.0 0.0 0.0 0.0 8081 FU318090085 Other volume changes -32.2 -23.0 -6.6 25.6 45.5 95.8 -16.9 -44.3 8182 FU317005045 Less: Statistical discrepancy (lines 34-[36-63]) (2) 54.7 7.3 28.0 18.0 28.9 23.3 -157.2 -100.4 82
Revaluation account
83 FD312010795 Nonfinancial assets 29.0 114.0 97.2 103.9 70.6 60.6 -43.6 29.1 8384 FD315014765 Structures 25.9 92.4 88.7 86.6 57.7 48.9 -42.4 15.3 8485 FD315013265 Equipment and software 3.1 21.5 8.5 17.3 12.9 11.7 -1.1 13.7 85
86 FD318080005 Financial assets 3.1 1.3 -2.1 0.8 0.7 -67.9 -121.6 -43.7 8687 FD313011105 Monetary gold and SDRs 1.1 0.5 -0.9 0.4 0.5 -0.2 0.2 -1.0 8788 FD314000005 Currency and deposits 2.1 0.8 -1.2 0.3 0.2 -0.0 0.3 -0.2 8889 FD313064105 Corporate equities 0.0 0.0 0.0 0.0 0.0 -67.7 -121.9 -41.5 8990 FD313094303 Equity investment under Public-Private Inv. Program 0.0 0.0 0.0 0.0 0.0 0.0 -0.3 -1.0 90
91 FD313111303 Liabilities 0.6 0.3 -0.6 0.4 0.4 -0.2 0.2 -1.0 9192 FD313111303 SDR allocations 0.6 0.3 -0.6 0.4 0.4 -0.2 0.2 -1.0 92
93 FD318200705 Changes in net worth due to nominal holding gains/losses 31.5 115.0 95.7 104.3 70.9 -7.2 -165.4 -13.6 93
Changes in balance sheet account
94 FR312090095 Change in net worth (lines 30+34+79+93) -472.4 -333.7 -281.3 -134.6 -214.1 -681.7 -1447.2 -1380.8 94
Balance sheet account (end of period)
95 FL312000095 Total assets 2173.3 2277.1 2387.5 2498.5 2628.7 3298.0 3368.2 3663.5 95
96 FL312010095 Nonfinancial assets (3) 1513.6 1636.5 1743.8 1861.9 1947.5 2036.4 2024.3 2092.2 9697 FL315014665 Structures 998.0 1087.7 1171.1 1253.1 1308.6 1358.1 1321.0 1345.7 9798 FL315013265 Equipment and software 515.5 548.8 572.7 608.8 638.9 678.3 703.2 746.4 98
99 FL314090005 Financial assets 659.7 640.6 643.7 636.6 681.2 1261.5 1343.9 1571.4 99
100 FL313011105 Monetary gold and SDRs 12.6 13.6 8.2 8.9 9.5 9.3 57.8 56.8 100101 FL313011205 Monetary gold 0.0 0.0 0.0 0.0 0.0 0.0 0.0 0.0 101102 FL313011303 SDR holdings 12.6 13.6 8.2 8.9 9.5 9.3 57.8 56.8 102
103 FL314000005 Currency and deposits 101.8 68.0 65.9 60.8 86.7 402.7 233.0 383.4 103104 FL313011505 Official foreign currencies 19.9 21.4 18.9 20.5 22.5 24.8 25.2 26.0 104105 FL313011405 Reserve position in IMF (net) 22.7 19.6 8.1 5.2 4.4 7.8 11.5 12.6 105106 FL313020005 Currency and transferable deposits 54.1 21.9 36.8 32.9 56.5 368.0 193.6 342.1 106107 FL723130130 Time and savings deposits 2.4 2.4 1.4 1.7 2.8 1.6 1.9 2.0 107108 FL313091105 Nonofficial foreign currencies 2.8 2.8 0.6 0.6 0.5 0.5 0.7 0.8 108
Appendix B

SNA Tables, June 7, 2012 18
S.7.a Federal GovernmentBillions of dollars; quarterly figures are seasonally adjusted annual rates
2003 2004 2005 2006 2007 2008 2009 2010
109 FL314022005 Debt securities 0.0 0.0 0.0 0.0 0.0 54.4 197.0 150.1 109110 FL313061703 Agency- and GSE-backed securities 0.0 0.0 0.0 0.0 0.0 54.4 196.4 149.2 110111 FL313063763 Corporate and foreign bonds 0.0 0.0 0.0 0.0 0.0 0.0 0.6 0.9 111
112 FL314035005 Loans 272.4 274.7 273.8 275.2 281.1 311.9 464.9 596.8 112113 FL314041005 Short term 199.8 200.5 197.2 194.9 198.8 216.1 356.5 490.2 113114 FL313066220 Consumer credit 82.4 86.1 89.8 86.9 93.0 104.3 178.6 308.8 114115 FL313069005 Other loans and advances 117.5 114.4 107.4 108.0 105.8 111.8 177.9 181.4 115116 FL313065005 Long term (mortgages) 72.6 74.2 76.6 80.3 82.4 95.8 108.4 106.6 116
117 FL313081115 Equity and investment fund shares 40.0 42.0 43.2 45.3 46.9 237.0 118.2 106.1 117118 FL313064105 Corporate equities 0.0 0.0 0.0 0.0 0.0 188.7 67.4 49.9 118119 FL313092803 Equity in international organizations 40.0 42.0 43.2 45.3 46.9 48.3 50.0 52.3 119120 FL313092403 Equity in government-sponsored enterprises (1) 0.0 0.0 0.0 0.0 0.0 0.0 0.0 0.0 120121 FL313094303 Equity investment under Public-Private Inv. Program 0.0 0.0 0.0 0.0 0.0 0.0 0.9 3.8 121
122 FL313096005 Other accounts receivable 232.8 242.3 252.5 246.5 257.0 246.2 273.1 278.2 122123 FL313070000 Trade receivables 51.3 61.8 71.0 59.4 60.6 64.7 43.6 42.9 123124 FL313078005 Taxes receivable 93.7 91.2 91.6 96.1 105.0 119.4 135.1 150.8 124125 FL313093003 Other (miscellaneous assets) 87.9 89.3 89.9 91.0 91.4 62.0 94.3 84.5 125
126 FL312000095 Total liabilities and net worth 2173.3 2277.1 2387.5 2498.5 2628.7 3298.0 3368.2 3663.5 126
127 FL314190005 Liabilities 5118.4 5556.0 5947.6 6193.2 6537.4 7888.4 9405.9 11082.1 127
128 FL313111303 SDR allocations 7.3 7.6 7.0 7.4 7.7 7.5 55.4 54.4 128
129 FL314100005 Currency and deposits 26.0 26.7 27.5 28.1 27.4 26.6 26.2 25.9 129
130 FL314122005 Debt securities 4850.2 5253.1 5587.0 5806.1 6076.5 7379.0 8887.8 10533.8 130131 FL713014003 SDR certificates 2.2 2.2 2.2 2.2 2.2 2.2 5.2 5.2 131132 FL313161505 Treasury securities including savings bonds 4008.2 4370.7 4678.0 4861.7 5099.2 6338.2 7781.9 9361.5 132133 FL313161705 Federal agency securities 24.9 24.3 23.8 23.5 23.1 23.3 23.5 24.2 133134 FL343150005 Nonmarketable securities held by pension plans 815.0 855.9 882.9 918.7 952.0 1015.3 1077.2 1142.9 134
135 FL313165403 Loans (mortgages) 0.0 0.0 0.0 0.0 0.0 0.0 0.0 0.0 135
136 FL313152005 Insurance, pension and standardized guarantee schemes 75.5 93.9 118.1 137.7 182.7 210.2 227.9 251.3 136137 FL313140003 Insurance reserves 40.5 41.6 42.7 44.2 45.4 46.4 47.5 48.4 137138 FL313195105 Retiree Health Care Funds 35.0 52.4 75.4 93.5 137.3 163.8 180.4 202.9 138
139 FL313196005 Other accounts payable 159.5 174.6 208.1 214.0 243.1 265.1 208.6 216.7 139140 FL313170005 Trade payables 153.6 169.0 202.7 208.9 238.2 260.8 204.6 213.1 140141 FL313193013 Other (miscellaneous liabilities) 5.8 5.6 5.4 5.1 4.9 4.3 4.0 3.6 141
142 FL312090095 Net worth -2945.2 -3278.8 -3560.1 -3694.7 -3908.8 -4590.5 -6037.7 -7418.6 142
Note. The Federal government accounts exclude Federal employee retirement funds(1) Government-sponsored enterprises (GSEs) consist of Federal Home Loan Banks, Fannie Mae, Freddie Mac, Federal Agricultural Mortgage Corporation, Farm Credit System,the Financing Corporation, and the Resolution Funding Corporation, and they included the Student Loan Marketing Association until it was fully privatized in the fourth quarter of 2004.(2) The statistical discrepancy is the difference between net lending or net borrowing derived in the capital account and the same concept derived in the financial account. The discrepancyreflects differences in source data, timing of recorded flows, and other statistical differences between the capital and financial accounts.(3) Excludes land and nonproduced nonfinancial assets.IMF International Monetary FundSDRs Special Drawing Rights
Appendix B

SNA Tables, June 7, 2012 19
S.8.a State and Local GovernmentsBillions of dollars; quarterly figures are seasonally adjusted annual rates
2003 2004 2005 2006 2007 2008 2009 2010
Current account
1 FA206902505 Gross value added 1001.8 1043.7 1098.8 1156.4 1223.2 1289.4 1325.2 1336.6 1
2 FA206300003 Less: Consumption of fixed capital 127.3 137.1 150.1 162.7 178.7 191.2 199.0 204.0 2
3 FA206902605 Equals: Net value added 874.5 906.7 948.7 993.7 1044.6 1098.2 1126.1 1132.6 3 4 FA206025001 Compensation of employees (paid) 871.2 905.7 948.6 995.0 1053.6 1110.5 1136.6 1143.5 4 5 FA206020001 Wages and salaries 678.4 702.7 728.1 763.4 805.7 847.4 863.0 861.7 5 6 FA206401005 Employers’ social contributions 192.8 203.0 220.5 231.6 248.0 263.1 273.6 281.8 6 7 FA206402101 Operating surplus, net 3.3 1.0 0.1 -1.3 -9.1 -12.3 -10.5 -10.8 7
8 FA206140005 Net national income/Balance of primary incomes, net 709.5 761.2 832.0 896.2 929.9 928.0 895.3 920.7 8 9 FA206402101 Operating surplus, net 3.3 1.0 0.1 -1.3 -9.1 -12.3 -10.5 -10.8 910 FA206240001 Taxes on production and imports, receivable 717.5 769.1 831.4 887.4 932.7 944.6 920.6 952.6 1011 FA206402015 Subsidies (paid) -0.1 -0.4 -0.4 -0.4 -7.1 -3.0 -1.4 -1.6 1112 FA206150195 Property income (received) 74.0 77.1 88.3 103.5 114.5 106.8 93.3 90.9 1213 FA206130101 Interest 64.6 66.7 76.4 90.9 100.6 91.9 78.7 75.0 1314 FA206121101 Distributed income of corporations (dividends) 1.7 2.0 2.1 2.3 2.4 2.9 2.5 2.6 1415 FA206112101 Rents on land and natural resources 7.6 8.5 9.8 10.3 11.5 12.0 12.1 13.4 1516 FA206130095 Less: Uses of property income (interest paid) 85.1 85.6 87.3 93.0 101.1 108.1 106.7 110.4 16
17 FA206140005 Net national income/Balance of primary incomes, net 709.5 761.2 832.0 896.2 929.9 928.0 895.3 920.7 1718 FA206220005 Plus: Current taxes on income, wealth, etc. (received) 260.2 290.3 331.7 361.6 380.9 381.8 332.2 355.4 1819 FA206601001 Plus: Social benefits (received) 20.1 24.1 24.8 21.8 18.9 19.0 20.2 20.8 1920 FA206404001 Less: Social contributions (paid) 353.4 384.3 404.8 402.9 433.7 456.7 498.1 534.6 2021 FA206403105 Plus: Other current transfers (received) 421.3 439.4 454.3 456.7 485.1 505.0 597.8 655.9 21
22 FA206012005 Equals: Disposable income, net 1057.7 1130.7 1238.0 1333.4 1381.1 1377.0 1347.5 1418.2 22
23 FA206901001 Less: Final consumption expenditures 1096.5 1139.1 1212.0 1282.3 1368.9 1449.2 1425.5 1443.5 23
24 FA206006095 Equals: Net saving -38.8 -8.4 25.9 51.0 12.2 -72.2 -78.1 -25.3 24
Capital account
25 FA206006395 Net saving less capital transfers 12.6 39.2 75.7 108.4 71.2 -9.4 -10.7 53.0 2526 FA206006095 Net saving -38.8 -8.4 25.9 51.0 12.2 -72.2 -78.1 -25.3 2627 FA205440005 Less: Capital transfers paid (net) -51.5 -47.5 -49.8 -57.4 -58.9 -62.8 -67.3 -78.3 27
28 FA205050905 Capital formation, net 143.7 143.4 141.7 152.8 164.2 171.7 164.6 147.0 28 Gross fixed capital formation (acquisition of29 FA205019003 produced nonfinancial assets) 259.6 269.1 281.6 304.4 329.0 348.8 349.3 336.5 2930 FA206300003 Less: Consumption of fixed capital 127.3 137.1 150.1 162.7 178.7 191.2 199.0 204.0 3031 FA205420003 Acquisition of nonproduced nonfinancial assets 11.4 11.4 10.3 11.1 13.8 14.1 14.4 14.5 31
32 FA205000995 Net lending (+) or borrowing (-), capital account (lines 25-28) -131.1 -104.2 -66.0 -44.3 -93.1 -181.1 -175.4 -94.0 32
Financial account
33 FA205000995 Net lending (+) or borrowing (-) (line 32) -131.1 -104.2 -66.0 -44.3 -93.1 -181.1 -175.4 -94.0 33
34 FA214090005 Net acquisition of financial assets 79.1 112.8 123.4 108.4 111.6 -102.0 5.0 40.0 34
35 FA214000005 Currency and deposits 27.3 4.8 22.3 31.6 31.6 27.6 30.1 6.2 3536 FA213020005 Currency and transferable deposits 7.0 -6.8 9.5 5.4 -4.8 8.5 19.2 6.7 3637 FA213030005 Time and savings deposits 20.3 11.6 12.8 26.2 36.4 19.1 10.8 -0.4 37
38 FA214022005 Debt securities 49.8 64.2 118.1 60.1 64.6 -127.7 -45.2 36.6 3839 FA213069103 Open market paper 10.3 10.1 8.3 7.3 -3.0 -64.6 -54.5 7.0 3940 FA213061105 Treasury securities 9.5 24.9 85.9 31.7 18.3 -50.0 18.8 9.7 4041 FA213061703 Agency- and GSE-backed securities (1) 22.5 21.9 18.0 15.8 37.0 -9.9 -17.1 10.0 4142 FA213062003 Municipal securities 0.3 0.3 0.2 0.2 0.5 -0.1 0.3 0.4 4243 FA213063003 Corporate and foreign bonds 7.1 6.9 5.7 5.0 11.7 -3.1 7.3 9.5 43
44 FA214035005 Loans 16.4 16.0 13.1 11.6 26.3 -7.5 16.6 14.8 4445 FA212050003 Short term (security repurchases) 7.9 7.7 6.3 5.6 13.0 -3.5 8.0 10.6 4546 FA213065005 Long term (mortgages) 8.5 8.3 6.8 6.0 13.3 -4.0 8.6 4.2 46
47 FA213081005 Equity and investment fund shares -18.2 -1.5 1.0 -7.5 7.2 30.3 12.3 -32.1 4748 FA213034003 Money market fund shares 4.0 3.9 3.2 2.8 6.6 -1.8 4.1 5.4 4849 FA213064103 Corporate equities -17.0 -4.2 -1.7 -7.9 0.7 19.0 15.9 -28.9 4950 FA213064203 Mutual fund shares -5.2 -1.3 -0.5 -2.4 -0.1 13.1 -7.7 -8.5 50
51 FA213096005 Other accounts receivable 3.8 29.4 -31.1 12.6 -18.2 -24.6 -8.8 14.5 5152 FA213070003 Trade receivables 8.1 7.9 6.5 5.7 13.3 -3.6 8.2 10.8 5253 FA213078005 Taxes receivable 0.9 11.3 15.4 11.4 2.7 2.2 -4.8 7.0 5354 FA213093005 Other (miscellaneous assets) -5.2 10.2 -52.9 -4.5 -34.3 -23.2 -12.2 -3.3 54
55 FA214190005 Net incurrence of liabilities 149.5 216.9 169.4 132.7 183.9 59.2 149.2 104.6 55
Appendix B

SNA Tables, June 7, 2012 20
S.8.a State and Local GovernmentsBillions of dollars; quarterly figures are seasonally adjusted annual rates
2003 2004 2005 2006 2007 2008 2009 2010
56 FA213162005 Debt securities (municipals) 120.5 186.4 136.6 97.7 146.2 19.2 110.7 65.3 5657 FA213162400 Short term 10.4 22.1 -1.6 -8.2 16.8 4.7 7.7 -0.6 5758 FA213162200 Other 110.1 164.4 138.2 105.9 129.4 14.4 102.9 66.0 58
59 FA213169203 Loans (short term) 0.1 0.3 0.6 0.6 0.7 0.8 0.8 0.9 59
60 FA213170003 Other accounts payable (trade payables) 29.0 30.2 32.1 34.4 37.0 39.2 37.7 38.4 60
Addendum:61 FA215000005 Net lending (+) or borrowing (-), financial account (lines 34-55) -70.4 -104.2 -46.0 -24.3 -72.4 -161.2 -144.3 -64.6 61
Other changes in volume account
62 FU218090185 Total other volume changes 49.9 -750.7 36.3 -10.7 106.6 73.0 62.3 77.3 6263 FU215404003 Disaster losses 0.0 0.0 10.7 0.0 0.0 0.0 0.0 0.0 6364 FU218090085 Other volume changes -10.7 -750.8 5.5 -30.7 85.9 53.0 31.2 47.8 6465 FU217005045 Less: Statistical discrepancy (lines 32-[34-55]) (2) -60.6 -0.1 -20.0 -20.0 -20.7 -20.0 -31.1 -29.4 65
Revaluation account
66 FD212010795 Nonfinancial assets 92.6 498.1 444.6 575.3 488.0 460.0 -131.2 145.0 6667 FD215014765 Structures 93.4 494.6 442.0 573.3 485.9 450.8 -131.3 144.1 6768 FD215013265 Equipment and software -0.8 3.5 2.6 2.0 2.1 9.1 0.0 0.9 68
69 FD213081005 Equity and investment fund shares 29.3 12.3 7.9 15.3 12.0 -58.6 28.9 26.9 69
70 FD218200705 Changes in net worth due to nominal holding gains/losses 121.8 510.4 452.5 590.6 500.0 401.3 -102.3 171.9 70
Changes in balance sheet account
71 FR212090095 Change in net worth (lines 28+32+62+70) 184.4 -201.1 564.5 688.3 677.8 464.9 -50.7 302.2 71
Balance sheet account (end of period)
72 FL212000095 Total assets 6889.5 7635.5 8369.4 9190.4 10052.1 10576.2 10674.7 11081.5 72
73 FL212010095 Nonfinancial assets (3) 4981.3 5606.0 6174.9 6894.6 7535.2 8152.9 8172.0 8449.6 7374 FL215014665 Structures 4765.2 5387.4 5945.3 6653.3 7278.7 7874.9 7882.9 8149.6 7475 FL215013265 Equipment and software 216.1 218.6 229.6 241.3 256.5 278.0 289.1 300.0 75
76 FL214090005 Financial assets 1908.2 2029.5 2194.5 2295.8 2516.9 2423.3 2502.7 2631.9 76
77 FL214000005 Currency and deposits 212.8 217.5 239.8 271.4 303.1 330.7 360.8 367.0 7778 FL213020005 Currency and transferable deposits 53.8 47.0 56.5 61.9 57.1 65.6 84.9 91.5 7879 FL213030005 Time and savings deposits 159.0 170.6 183.3 209.6 245.9 265.1 275.9 275.5 79
80 FL214022005 Debt securities 992.7 1056.9 1175.0 1235.1 1299.6 1171.9 1126.7 1163.2 8081 FL213069103 Open market paper 161.6 171.7 180.0 187.3 184.3 119.8 65.3 72.2 8182 FL213061105 Treasury securities 364.2 389.1 475.0 506.8 525.1 475.1 493.9 503.6 8283 FL213061703 Agency- and GSE-backed securities (1) 351.2 373.2 391.1 407.0 444.0 434.1 417.0 427.0 8384 FL213062003 Municipal securities 4.4 4.7 4.9 5.1 5.5 5.4 5.7 6.1 8485 FL213063003 Corporate and foreign bonds 111.3 118.2 123.9 129.0 140.7 137.5 144.8 154.3 85
86 FL214035005 Loans 256.3 272.3 285.5 297.0 323.3 315.8 332.5 347.3 8687 FL212050003 Short term (security repurchases) 123.5 131.2 137.5 143.0 156.1 152.6 160.6 171.2 8788 FL213065005 Long term (mortgages) 132.9 141.2 148.0 154.0 167.3 163.3 171.8 176.1 88
89 FL213081005 Equity and investment fund shares 173.3 184.1 193.0 200.8 220.1 191.7 233.0 227.8 8990 FL213034003 Money market fund shares 62.7 66.6 69.8 72.7 79.3 77.5 81.6 86.9 9091 FL213064103 Corporate equities 84.7 90.0 94.3 98.1 108.0 82.1 117.7 109.9 9192 FL213064203 Mutual fund shares 25.9 27.5 28.9 30.0 32.8 32.0 33.7 30.9 92
93 FL213096005 Other accounts receivable 273.1 298.6 301.3 291.5 370.8 413.2 449.9 526.7 9394 FL213070003 Trade receivables 126.5 134.4 140.9 146.6 159.9 156.4 164.6 175.4 9495 FL213078005 Taxes receivable 73.6 99.6 141.0 189.0 237.5 269.8 280.9 298.0 9596 FL213093005 Other (miscellaneous assets) 73.0 64.6 19.3 -44.1 -26.7 -13.0 4.3 53.2 96
97 FL212100005 Total liabilities and net worth 6889.5 7635.5 8369.4 9190.4 10052.1 10576.2 10674.7 11081.5 97
98 FL214190005 Liabilities 1988.1 2935.3 3104.7 3237.3 3421.3 3480.4 3629.7 3734.3 98
99 FL213162005 Debt securities (municipals) 1558.8 2475.4 2612.0 2709.7 2855.9 2875.0 2985.7 3051.1 99100 FL213162400 Short term 106.1 44.2 42.5 34.3 51.2 55.9 63.6 63.0 100101 FL213162200 Other 1452.7 2431.3 2569.5 2675.4 2804.7 2819.2 2922.1 2988.1 101
Appendix B

SNA Tables, June 7, 2012 21
S.8.a State and Local GovernmentsBillions of dollars; quarterly figures are seasonally adjusted annual rates
2003 2004 2005 2006 2007 2008 2009 2010
102 FL213169203 Loans (short term) 9.7 10.0 10.6 11.2 11.9 12.7 13.5 14.4 102
103 FL213170003 Other accounts payable (trade payables) 419.7 449.9 482.0 516.4 553.5 592.7 630.4 668.8 103
104 FL212090095 Net worth 4901.3 4700.2 5264.7 5953.1 6630.8 7095.7 7045.1 7347.2 104
Note. The state and local government accounts exclude state and local employee retirement funds(1) Government-sponsored enterprises (GSEs) consist of Federal Home Loan Banks, Fannie Mae, Freddie Mac, Federal Agricultural Mortgage Corporation, Farm Credit System,the Financing Corporation, and the Resolution Funding Corporation, and they included the Student Loan Marketing Association until it was fully privatized in the fourth quarter of 2004.(2) The statistical discrepancy is the difference between net lending or net borrowing derived in the capital account and the same concept derived in the financial account. The discrepancyreflects differences in source data, timing of recorded flows, and other statistical differences between the capital and financial accounts.(3) Excludes land and nonproduced nonfinancial assets.
Appendix B

SNA Tables, June 7, 2012 22
S.9.a Rest of the World Billions of dollars; quarterly figures are seasonally adjusted annual rates
2003 2004 2005 2006 2007 2008 2009 2010
Current account
1 FA266905095 Foreign income from U.S. 1910.5 2253.4 2618.6 2990.5 3248.7 3381.9 2600.3 3021.8 1 2 FA266903001 U.S. imports of goods and services 1545.1 1798.9 2027.8 2240.3 2374.8 2556.5 1974.6 2356.7 2 3 FA266904195 U.S. income payments to rest of world 284.6 357.4 475.9 648.6 747.7 686.9 487.5 513.5 3 4 FA266400101 Current taxes and trans. payments to rest of world 80.7 97.1 115.0 101.5 126.2 138.4 138.2 151.6 4
5 FA266900095 Less: Foreign outlays to U.S. 1394.3 1628.8 1878.1 2192.1 2532.6 2702.9 2222.8 2542.7 5 6 FA266903011 U.S. exports of goods and services 1041.0 1180.2 1305.1 1471.0 1661.7 1846.8 1583.0 1839.8 6 7 FA266904095 U.S. income receipts from rest of world 353.3 448.6 573.0 721.1 871.0 856.1 639.8 702.9 7
8 FA266000095 Equals: Net saving (current external balance) 516.1 624.6 740.5 798.4 716.0 679.0 377.4 479.2 8
Capital account
9 FA266000095 Net saving 516.1 624.6 740.5 798.4 716.0 679.0 377.4 479.2 9
10 FA265440005 Less: Net capital transfers -2.2 2.8 12.8 -2.0 -0.4 5.4 -0.6 -0.7 10
11 FA265420005 Less: Acquisition of nonproduced nonfinancial assets 0.1 0.0 0.1 -0.1 0.5 -0.0 0.0 0.0 11
12 FA265000905 Net lending (+) or borrowing (-), capital account (lines 9-10-11) 518.2 621.8 727.7 800.5 715.9 673.6 378.0 479.9 12
Financial account
13 FA265000905 Net lending (+) or borrowing (-) (line 12) 518.2 621.8 727.7 800.5 715.9 673.6 378.0 479.9 13
14 FA264090005 Net acquisition of U.S. financial assets 820.4 1398.6 1100.3 1854.1 1766.9 584.4 189.6 1085.5 14
15 FA263011005 Monetary gold and SDRs 0.0 0.0 0.0 0.0 0.0 0.0 47.6 0.0 1516 FA263011205 Monetary gold 0.0 0.0 0.0 0.0 0.0 0.0 0.0 0.0 1617 FA313111303 SDR allocations 0.0 0.0 0.0 0.0 0.0 0.0 47.6 0.0 17
18 FA264000005 Currency and deposits 53.8 39.7 28.9 54.8 -76.6 540.2 -322.7 -1.7 1819 FA263025003 Currency 10.6 13.3 8.4 2.2 -10.7 29.2 12.6 28.3 1920 FA263027003 Transferable deposits 4.0 9.1 6.4 9.2 5.2 34.8 -21.8 1.2 2021 FA263030005 Time deposits 5.2 34.1 6.7 11.5 40.3 65.5 -43.1 16.9 2122 FA264016005 Net interbank items due from U.S. banks 34.0 -16.8 7.3 31.9 -111.4 410.8 -270.4 -48.2 22
23 FA264022005 Debt securities 583.6 848.1 720.7 967.4 841.1 421.9 168.4 541.2 2324 FA263069103 Open market paper 66.2 37.0 9.9 46.7 -8.3 -45.1 -41.4 -0.5 2425 FA263061105 Treasury securities 276.4 366.9 245.1 150.3 165.3 711.6 555.0 654.2 2526 FA263061705 Agency- and GSE-backed securities (1) 12.3 178.2 134.3 224.0 248.8 -228.6 -226.0 -89.1 2627 FA263062003 Municipal securities 8.0 6.5 3.0 5.4 10.7 5.4 8.2 13.1 2728 FA263063005 Corporate bonds 220.8 259.5 328.5 541.0 424.6 -21.4 -127.4 -36.5 28
29 FA264041005 Loans (short term) 86.0 76.5 76.8 8.6 67.5 -278.2 -171.3 -148.2 2930 FA262050003 Security repurchases (net) 86.9 70.3 45.5 2.4 -35.2 -214.0 -146.4 -126.1 3031 FA263069500 Loans to U.S. corporate business -0.8 6.3 31.3 6.2 102.7 -64.1 -24.9 -22.0 3132 FA263067003 Security credit 0.0 0.0 0.0 0.0 0.0 0.0 0.0 0.0 32
33 FA263081005 Equity and investment fund shares 97.7 207.8 201.9 388.6 496.8 436.9 379.6 408.6 3334 FA263034003 Money market fund shares 2.6 4.1 0.1 4.1 19.0 23.7 7.2 -7.1 3435 FA263064105 Corporate equities 5.2 25.0 56.9 96.2 218.5 105.1 157.2 67.3 3536 FA263064203 Mutual fund shares 26.2 32.7 32.2 45.2 38.2 -2.0 56.5 112.2 3637 FA263092001 Foreign direct investment in the United States 63.8 146.0 112.6 243.2 221.2 310.1 158.6 236.2 37
38 FA263096005 Other accounts receivable -0.8 226.5 72.0 434.7 438.1 -536.5 88.0 285.6 3839 FA263070005 Trade receivables 1.3 -1.1 7.9 5.9 20.8 6.5 6.6 19.4 3940 FA263093005 Other (miscellaneous assets) -2.1 227.5 64.1 428.8 417.3 -542.9 81.4 266.1 40
41 FA264190005 Net incurrence of liabilities 289.4 863.2 386.5 1046.7 1149.3 -152.2 -56.1 831.4 41
42 FA313011303 SDR holdings -0.6 0.4 -4.5 0.2 0.2 0.1 48.2 0.0 42
43 FA264100005 Currency and deposits 35.2 86.6 29.0 84.6 255.8 -389.5 -101.9 73.5 4344 FA263111503 Official foreign currencies 0.6 0.6 0.6 0.7 1.0 1.3 0.7 0.5 4445 FA263111403 Reserve position in IMF (net) -1.5 -3.8 -10.2 -3.3 -1.0 3.5 3.4 1.3 4546 FA263191003 U.S. private deposits 36.0 89.9 40.8 87.2 256.0 -394.3 -106.1 71.7 4647 FA313091105 Nonofficial foreign currencies 0.2 -0.0 -2.2 -0.0 -0.1 0.0 0.2 0.1 47
48 FA264122005 Debt securities 47.6 155.0 103.1 326.2 149.4 -229.8 222.6 70.1 4849 FA263169105 Commercial paper 18.9 69.2 38.6 98.4 -69.3 -71.0 59.4 -2.7 4950 FA263163003 Bonds 28.7 85.8 64.5 227.8 218.7 -158.8 163.2 72.8 50
51 FA264141005 Loans (short term) -4.6 0.2 9.9 6.4 44.9 533.3 -554.3 7.9 5152 FA263169005 Other loans and advances -2.1 -3.6 -4.6 -7.4 -3.2 -1.5 0.3 0.2 5253 FA263168005 Depository institution loans n.e.c. -2.5 3.8 14.5 13.8 24.1 5.1 -11.2 17.9 5354 FA263167003 Security debt 0.0 0.0 0.0 0.0 0.0 0.0 0.0 0.0 5455 FA713091103 Nonoff. foreign currencies (swap lines) 0.0 0.0 0.0 0.0 24.0 529.7 -543.5 -10.2 55
Appendix B

SNA Tables, June 7, 2012 23
S.9.a Rest of the World Billions of dollars; quarterly figures are seasonally adjusted annual rates
2003 2004 2005 2006 2007 2008 2009 2010
56 FA263181105 Equity and investment fund shares 313.1 377.4 243.8 425.6 605.7 282.8 392.4 443.4 5657 FA263164103 Corporate equities 118.0 84.8 186.7 137.3 147.8 -38.5 63.6 79.1 5758 FA313092803 U.S. government equity in IBRD, etc. 1.4 2.0 1.3 2.0 1.7 1.4 1.7 2.3 5859 FA263192005 U.S. direct investment abroad 149.6 316.2 36.2 244.9 414.0 329.1 303.6 351.4 5960 FA263194735 Investment by holding companies 44.1 -25.6 19.6 41.3 42.2 -9.1 23.5 10.6 60
61 FA263196005 Other accounts payable -101.3 243.5 5.1 203.7 93.3 -349.2 -63.1 236.4 6162 FA263170003 Trade payables 6.1 3.5 6.3 6.2 12.4 -9.9 6.1 26.6 6263 FA263193005 Other (miscellaneous liabilities) -107.4 240.0 -1.1 197.5 80.9 -339.3 -69.2 209.8 63
Addendum:64 FA265000005 Net lending, financial account (lines 14-41) 531.1 535.4 713.8 807.4 617.6 736.6 245.8 254.1 64
Other changes in volume account
65 FU268090185 Total other volume changes -117.8 -81.7 -274.6 74.3 -252.0 -284.8 -366.5 -361.4 6566 FU268090085 Other volume changes -130.6 4.7 -260.7 67.4 -153.7 -347.8 -234.3 -135.7 6667 FU267005005 Less: Statistical discrepancy (lines 12-[14-41]) (2) -12.8 86.4 13.9 -6.9 98.3 -63.0 132.2 225.7 67
Revaluation account
68 FD264090095 Financial assets 438.0 182.2 -53.9 382.5 264.3 -1610.5 526.2 530.7 68
69 FD313111303 SDR allocations 0.6 0.3 -0.6 0.4 0.4 -0.2 0.2 -1.0 69
70 FD264022085 Debt securities -49.7 -55.8 -195.4 34.8 129.1 -125.7 76.0 131.1 7071 FD263061105 Treasury securities -48.4 -66.9 -74.3 -8.5 85.0 164.9 -136.6 59.7 7172 FD263061705 Agency- and GSE-backed securities 12.5 41.7 3.4 26.7 70.0 53.2 -26.1 11.6 7273 FD263063005 Corporate bonds -13.8 -30.7 -124.4 16.6 -26.0 -343.8 238.7 59.8 73
74 FD263081005 Equity and investment fund shares 487.0 237.7 142.1 347.3 134.8 -1484.6 450.0 400.6 7475 FD263064105 Corporate equities 447.8 205.0 77.6 312.8 145.6 -1110.7 513.4 381.6 7576 FD263064203 Mutual fund shares 21.9 17.0 13.9 29.6 18.5 -115.3 50.9 38.0 7677 FD263092001 Foreign direct investment in the United States 17.3 15.8 50.6 4.9 -29.3 -258.6 -114.3 -19.0 77
78 FD264190095 Liabilities 771.2 558.0 642.1 964.8 1059.5 -2783.4 1369.4 515.7 78
79 FD313011303 SDR holdings 1.1 0.5 -0.9 0.4 0.5 -0.2 0.2 -1.0 79
80 FD264100005 Currency and deposits 7.4 3.1 -6.7 2.7 4.1 2.5 0.6 0.9 8081 FD263111503 Official foreign currencies 5.3 2.4 -5.5 2.4 3.9 2.5 0.3 1.0 8182 FD263111403 Reserve position in IMF (net) 2.1 0.8 -1.2 0.3 0.2 -0.0 0.3 -0.2 8283 FD263191003 U.S. private deposits 0.0 0.0 0.0 0.0 0.0 0.0 0.0 0.0 8384 FD263191103 Nonofficial foreign currencies 0.0 0.0 0.0 0.0 0.0 0.0 0.0 0.0 84
85 FD263163003 Debt securities (corporate bonds) 137.5 30.2 -37.9 36.2 92.8 -191.0 169.8 94.1 85
86 FD263181105 Equity and investment fund shares 625.3 524.0 687.6 925.5 962.1 -2594.7 1198.7 421.7 8687 FD263164103 Corporate equities 587.4 396.2 570.6 873.9 771.2 -2461.0 1183.3 411.2 8788 FD263192005 U.S. direct investment abroad 37.9 127.8 117.0 51.5 190.9 -133.7 15.4 10.6 88
89 FD268200005 Changes in net worth due to nominal holding gains/losses -333.3 -375.8 -695.9 -582.3 -795.3 1173.0 -843.2 15.0 89
Changes in balance sheet account
90 FR262090095 Change in net worth (lines 12+65+89) 67.2 164.4 -242.8 292.5 -331.3 1561.8 -831.7 133.4 90
Financial balance sheet account (end of period) (3)
91 FL264090005 Total financial assets 8851.6 10579.1 11599.4 14067.7 16037.6 15239.6 15854.0 17419.2 91
92 FL313111303 SDR allocations 7.3 7.6 7.0 7.4 7.7 7.5 55.4 54.4 92
93 FL264000005 Currency and deposits 520.6 560.3 589.2 644.0 567.4 1107.7 785.0 783.3 9394 FL263025003 Currency 258.7 272.0 280.4 282.6 272.0 301.1 313.8 342.1 9495 FL263027003 Transferable deposits 4.2 13.3 19.7 28.9 34.2 69.0 47.2 48.4 9596 FL263030005 Time deposits 115.0 149.2 155.9 167.4 207.6 273.1 230.0 246.9 9697 FL264016005 Net interbank items due from U.S. banks 142.7 125.9 133.2 165.1 53.7 464.5 194.0 145.9 97
98 FL264022005 Debt securities 3711.1 4503.4 5028.8 6030.9 7001.1 7297.3 7541.7 8214.0 9899 FL263069103 Open market paper 192.8 229.8 239.6 286.3 278.1 232.9 191.5 191.0 99100 FL263061105 Treasury securities 1513.5 1813.6 1984.4 2126.2 2376.4 3253.0 3671.4 4385.3 100101 FL263061705 Agency- and GSE-backed securities (1) 655.3 875.2 1012.9 1263.6 1582.4 1406.9 1154.8 1077.3 101102 FL263062003 Municipal securities 19.5 26.0 29.0 34.4 45.1 50.5 58.7 71.7 102103 FL263063005 Corporate bonds 1330.0 1558.9 1762.9 2320.5 2719.1 2354.0 2465.3 2488.6 103
Appendix B

SNA Tables, June 7, 2012 24
S.9.a Rest of the World Billions of dollars; quarterly figures are seasonally adjusted annual rates
2003 2004 2005 2006 2007 2008 2009 2010
104 FL264041005 Loans (short term) 240.4 316.9 393.8 533.4 609.9 322.2 213.5 64.3 104105 FL262050003 Security repurchases (net) 115.4 185.7 231.2 364.6 338.4 114.9 31.0 -96.1 105106 FL263069500 Loans to U.S. corporate business 125.0 131.2 162.5 168.8 271.5 207.3 182.5 160.4 106107 FL263067003 Security credit 0.0 0.0 0.0 0.0 0.0 0.0 0.0 0.0 107
108 FL263081005 Equity and investment fund shares 3420.5 3866.0 4210.0 4946.0 5577.6 4529.8 5359.4 6168.6 108109 FL263034003 Money market fund shares 18.8 22.9 23.0 27.0 46.0 69.7 76.9 69.8 109110 FL263064105 Corporate equities 1674.6 1904.6 2039.1 2448.1 2812.2 1806.6 2477.2 2926.1 110111 FL263064203 Mutual fund shares 146.1 195.8 242.0 316.8 373.5 256.2 363.6 513.8 111112 FL263092001 Foreign direct investment in the United States 1581.0 1742.7 1906.0 2154.1 2345.9 2397.4 2441.7 2658.9 112
113 FL263096005 Other accounts receivable 951.7 1324.8 1370.7 1906.1 2273.8 1975.0 1899.1 2134.7 113114 FL263070005 Trade receivables 50.1 49.0 56.9 62.8 83.6 90.1 96.7 116.1 114115 FL263093005 Other (miscellaneous assets) 901.6 1275.8 1313.8 1843.3 2190.2 1884.9 1802.5 2018.6 115
116 FL262100005 Total liabilities and net worth 8851.6 10579.1 11599.4 14067.7 16037.6 15239.6 15854.0 17419.2 116
117 FL264194005 Total liabilities 6649.2 8212.3 9475.4 11651.2 13952.4 11592.7 13038.8 14470.6 117
118 FL313011303 SDR holdings 12.6 13.6 8.2 8.9 9.5 9.3 57.8 56.8 118
119 FL264100005 Currency and deposits 932.1 1021.9 1044.2 1131.5 1391.4 1004.4 903.2 977.6 119120 FL263111503 Official foreign currencies 39.7 42.7 37.8 40.9 45.8 49.6 50.5 52.1 120121 FL263111403 Reserve position in IMF (net) 22.5 19.5 8.0 5.0 4.2 7.7 11.4 12.5 121122 FL263191003 U.S. private deposits 867.1 957.0 997.8 1085.0 1340.9 946.7 840.6 912.3 122123 FL313091105 Nonofficial foreign currencies 2.8 2.8 0.6 0.6 0.5 0.5 0.7 0.8 123
124 FL264122005 Debt securities 1145.1 1330.3 1395.5 1757.8 2000.1 1579.3 1971.7 2135.9 124125 FL263169105 Commercial paper 276.1 345.3 384.0 482.3 413.0 342.0 401.3 398.6 125126 FL263163003 Bonds 868.9 985.0 1011.6 1275.5 1587.1 1237.3 1570.3 1737.3 126
127 FL264141005 Loans (short term) 108.2 108.5 118.4 124.8 150.2 683.3 128.9 137.3 127128 FL263169005 Other loans and advances 42.2 38.6 34.0 26.6 23.4 21.6 21.9 22.1 128129 FL263168005 Depository institution loans n.e.c. 66.1 69.9 84.4 98.3 102.8 107.9 96.8 115.1 129130 FL263167003 Security debt 0.0 0.0 0.0 0.0 0.0 0.0 0.0 0.0 130131 FL713091103 Nonoff. foreign currencies (swap lines) 0.0 0.0 0.0 0.0 24.0 553.7 10.3 0.1 131
132 FL263181105 Equity and investment fund shares 4207.0 5108.4 6039.8 7390.8 8958.6 6646.8 8237.8 9102.9 132133 FL263164103 Corporate equities 2079.4 2560.4 3317.7 4329.0 5248.0 2748.4 3995.3 4485.6 133134 FL313092803 U.S. government equity in IBRD, etc. 40.0 42.0 43.2 45.3 46.9 48.3 50.0 52.3 134135 FL263192005 U.S. direct investment abroad 2054.5 2498.5 2651.7 2948.2 3553.1 3748.5 4067.5 4429.4 135136 FL263194735 Investment by holding companies 33.1 7.5 27.1 68.4 110.6 101.5 125.1 135.6 136
137 FL263196005 Other accounts payable 244.1 629.6 869.3 1237.4 1442.6 1669.6 1739.4 2060.0 137138 FL263170003 Trade payables 44.7 48.2 54.5 60.7 73.1 63.2 69.3 95.9 138139 FL263193005 Other (miscellaneous liabilities) 199.4 581.4 814.8 1176.7 1369.5 1606.4 1670.0 1964.1 139
140 FL262090095 Net worth (external account) 2202.5 2366.8 2124.0 2416.5 2085.2 3646.9 2815.3 2948.7 140
(1) Government-sponsored enterprises (GSEs) consist of Federal Home Loan Banks, Fannie Mae, Freddie Mac, Federal Agricultural Mortgage Corporation, Farm Credit System,the Financing Corporation, and the Resolution Funding Corporation, and they included the Student Loan Marketing Association until it was fully privatized in the fourth quarter of 2004.(2) The statistical discrepancy is the difference between net lending or net borrowing derived in the capital account and the same concept derived in the financial account. The discrepancyreflects differences in source data, timing of recorded flows, and other statistical differences between the capital and financial accounts.(3) Excludes nonfinancial assets, including nonproduced nonfinancial assets.IBRD International Bank for Reconstruction and DevelopmentIMF International Monetary FundSDRs Special Drawing Rightsn.e.c. Not elsewhere classified
Appendix B