the institutional determinants of internationalization ... · the data used in this study were...
TRANSCRIPT

Journal of International Students
1591
ISSN: 2162-3104 Print/ ISSN: 2166-3750 Online Volume 8, Issue 4 (2018), pp. 1591–1612
© Journal of International Students http://jistudents.org/
doi: 10.5281/zenodo.1467813
The Institutional Determinants of Internationalization: The Cases of Study Abroad
Participation and International Student Enrollment
Jonathan Marks Bellarmine University, USA
Charles Yeager
Suffolk County Community College, USA
Jay Gatrell Eastern Illinois University, USA
Jeremy Bennett
Indiana State University and Evansville Day School, USA
ABSTRACT
Globalization, global citizenship, and cross-cultural competence are central to the mission of post-secondary institutions. In this paper, we examined study abroad participation rates and international student enrollments to understand the determinants that drive critical components of campus internationalization. We identified possible explanatory variables for study abroad participation and international student enrollment, conducting regression analyses to assess the relationships between variables. We found that several explanatory variables were significantly related to study abroad participation and international student enrollment. Models showed differences in how variables could be used to predict study abroad participation and international enrollment at different kinds of schools.
Keywords: internationalization, international students, study abroad

Journal of International Students
1592
Globalization, global citizenship, and cross-cultural competence are central to the mission of post-secondary institutions. As a result, institutions have deployed numerous methodologies and practices to advance these priorities. For example, colleges and universities have encouraged students to participate in study abroad programs, integrated international content into the general education experience, reinvigorated language studies, and increased the enrollment of international students. In this paper, we examine observed trends in study abroad participation and international student enrollment to understand the institutional determinants that drive critical components of campus internationalization.
LITERATURE REVIEW
Internationalization is an expansive concept and as a process, varies from campus to campus with respect to the specifics of implementation and, in some cases, the objective or strategic goal. As a result, there are numerous definitions and permutations on the ground and reaching a consensus on how to successfully internationalize universities is difficult (Altbach & Teichler, 2001; Bartell, 2003; Hawawini, 2011) and little rigorous empirical research exists (McMahon, 1992). Nevertheless, internationalization has become a pillar of the modern university and is often linked to the competitiveness of institutions. Given the paucity of research in this area, we are focusing on two critical and prominent components of campus internationalization: the study abroad experience and the impact of international students on universities. These measures are useful as they resonate with both the campus experience (i.e., diversity and multi-cultural experiences) for all students and measure the participation in deep, rich, and immersive learning experiences (short term, summer, semester, or academic year) for students studying abroad.
Study Abroad Participation
Study abroad programs are an effective credit-bearing learning experience that prepares students for an increasingly globalized and integrated world vis-a-vis increased cultural awareness and enhanced communication skills (Dwyer, 2004; Naffziger, 2008; Williams, 2005). Moreover, there is empirical evidence of interest in global careers at both the high school and undergraduate levels (Punteney, 2016). Additionally, advocates believe study abroad academic programs enhance the competitiveness of local and national economies (Aguayo, 2016; Lincoln Commission, 2005; Salisbury, Umbach, Paulsen, & Pascarella, 2008;

Journal of International Students
1593
Treverton & Bikson 2003). The Lincoln Commission (2005) reported that as many as a million students should have been enrolled in study abroad programs by 2017 to keep the U.S. on par with other countries in terms of the “global competence” of citizens and the workforce. Although there has been steady growth among participants nationally, as a percentage of all college students, participation within study abroad programs has been limited relative to the overall, absolute number of students (Salisbury et al., 2008). Slightly less than ten percent of U.S. college students have first-hand international experiences from study abroad participation (IIE, 2016). Yet, participation is increasing. For example, 313,415 students enrolled in for-credit classes abroad in the 2014-2015 academic year, which was an increase of 2.9% over the 2013-2015 academic year (NAFSA, 2017). In an effort to double participation by 2020 to nearly 600,000 students the IIE launched the Generation Study Abroad campaign in 2014. Given the economic and cross-cultural imperatives of increased global awareness and knowledge, this study seeks to understand the institutional determinants that co-vary with increased participation in study abroad programs.
International Student Enrollment
As indicated above, one long-standing strategy for internationalizing campuses has been international student enrollment in exchange and degree seeking programs (Urban & Palmer, 2014). Although there are other reasons why international students choose to study in the United States (see Bennett, Yeager & Gatrell, 2016), this approach provides domestic students with a more diverse student population and opportunities to have a variety of cross-cultural experiences during their studies (Choudaha & Chang, 2012; Luo & Jameson-Drake, 2013). To enhance interactions between domestic and international students, some institutions have implemented peer-mentoring programs where American students are paired with incoming international students to facilitate a successful transition to American higher education (Summers & Volet, 2008). For American students, interaction with international students has been shown to improve critical thinking skills (Luo & Jameson-Drake, 2013; Pascarella, Palmer, Moye & Pierson, 2001) and the overall college experience (Hu & Kuh, 2003). Finally, international students also enhance the real and perceived competitiveness of institutions and their academic programs—which benefits all students (Qureshi, 2013).
In addition to the learning benefits of internationalization, universities see international enrollments as a strategy for revenue growth and diversification (Thomason, 2013). In today’s competitive higher

Journal of International Students
1594
education environment, international students, particularly those who are able to fund their own education, are highly sought after (Cantwell, 2015; Luo & Jameson-Drake, 2013). Beyond increased revenue to the institution, international enrollments enhance local economies (Lee, 2007), and international students accounted for $30.5 billion in investment over the course of the 2014-2015 academic year (NAFSA, 2017). Given these educational and economic benefits, this study seeks to identify the institutional characteristics that co-vary with observed international student enrollments.
DATA AND METHOD
The data used in this study were obtained from the National Center for Education Statistics, specifically from their Integrated Postsecondary Education Data System (IPEDS). Data gathered included numbers on fall enrollment, financial aid, student success indicators, socio-demographics, and other institutional characteristics, such as the type of university (private, non-profit, or public), for all IPEDS institutions for the academic years 2013-2014 and 2014-2015 (AY1314 and AY1415) (n=7,048). Additionally, the Indiana University Center for Postsecondary Research provided data from the 2015 Carnegie Classification of Institutions of Higher Education. In addition to obtaining standardized IPEDS data, Study Abroad Participants and International Student Enrollment data were obtained from the 2016 Open Doors report (n=1,034). The Open Doors data are based on the entire academic year and IPEDS reflects fall data only. The result was a final data set comprised of 1034 institutions.
Once the data were gathered, twenty potential explanatory variables were identified. These variables include the following:
(1) the percentage of full-time, first-time undergraduates receiving Pell grants (PG); (2) estimated full-time equivalent undergraduate enrollment for 2013-2014 (EU); (3) estimated full-time equivalent graduate enrollment for 2013-2014 (EG); (4) total students (ET); (5) the percentage of enrolled students with ACT composite scores in the 75th percentile (AC); (6) the percentage of undergraduates who complete their degree in 150% of normal time (or six-years) (GR); (7) the percentage of women undergraduates who complete their degree in 150% of normal time (or six-years) (GW); (8) the percentage of white graduates who complete their degree in 150% of normal time (GT); (9) the total enrollment as recorded in the fall of the academic year (RT); (10) the percentage of enrolled women

Journal of International Students
1595
(PC); (11) the percentage of white students enrolled (PW); (12) the percentage of enrolled undergraduates between the ages of 18-24 (DV); (13) the percentage of total admitted students (DM); (14) the average weighted monthly salary for all faculty (SM); (15) the average weighted monthly salary of female faculty (SV); (16) the ratio of students to faculty (ST); (17) the average in-state tuition of undergraduates (T1); (18) the average out-of-state tuition of undergraduates (T3); (19) the average net price within the income bracket $48,001-$75,000 of students receiving aid (NP), and (20) region (i.e., location of the school based on U.S. department of Education regions) (O).
In addition to the initial explanatory variables, the 1,034 cases were classified based on Carnegie Classification, Institution Type, and Control. Carnegie classification subsets institutions into eighteen groups, while the dataset filters out two-year institutions, very small institutions and graduation/professional only institutions. Institution Type refers to the highest level of degree awarded by the listed institution, and associate degree awarding institutions were excluded from the dataset. Control designates whether an institution is public or private, and private, for profit institutions were excluded from the dataset. As such, the analysis was also performed by sub-groups to determine if the derived terminal models co-varied by sub-population. In terms of the analysis, the data were assessed using Pearson’s R correlation. All of the identified explanatory variables were entered into a regression analysis and the terminal models were derived using the stepwise approach. Once the explanatory models for study abroad participation and international student enrollment were defined, each were conducted independently by sub-group to determine if model performance varied by category.
RESULTS
Table 1 presents the results of the Pearson’s R correlations between explanatory variables to identify potential concerns with multicollinearity. Of the original twenty potential variables, seven displayed high correlations relative to other explanatory variables. In cases where correlation coefficients were greater than .7, one of the variables was removed from the regression. Monthly salary for all faculty and monthly salary of female faculty displayed a high, positive correlation (.978), since both variables are measures of faculty salary. As a result, only one salary variable, salary for all faculty, was used to represent the faculty in the subsequent analysis.

Journal of International Students
1596
Likewise, several other variables were identified as potentially
problematic. Specifically, the average in-state tuition of graduates and the average net price within the income bracket $48,001-$75,000 of students receiving aid were highly correlated (-.810), so the average in-state tuition of graduates was removed from the regression, as both variables measured the cost of tuition. Finally, it was decided that the average out-of-state tuition of graduates would also be removed, since private institutions do not have out of state tuition brackets.
Additionally, full time undergraduate enrollment for 2013-2014 displayed a high degree of correlation with two variables, total students and total enrollment as recorded in fall of the academic year, as all three variables are measures of student enrollment. As such, full time undergraduate enrollment for 2013-2014 was removed from the regression in favor of total students. The total students and total enrollment as recorded in fall of the academic year variables also displayed a high degree of correlation with the full-time graduate enrollment for 2013-2014, which was initially retained. However, the subsequent stepwise analysis eventually removed the estimated full-time equivalent graduate enrollment for 2013-2014 from the terminal equation.
The percentage of women undergraduates who complete their degree in 150% of normal time and the percentage of enrolled women displayed a high, positive correlation (.762), as both variables measured

Journal of International Students
1597
females in student enrollment. Because the percentage of enrolled women variable provided a better measure of the female demographic, the percentage of women undergraduates who complete their degree in 150% of normal time was removed from the regression. Similarly, the percentage of white students enrolled and the percentage of white graduates who complete their degrees in 150% of normal time variables were highly and positively correlated (.891), as both variables measured white students in the student population. As such, the percentage of white students enrolled and the percentage of white graduates who complete their degrees in 150% of normal time variable was eliminated.
Study Abroad Participation
Based upon the observed correlations and exploratory regression analysis, the following terminal equation was derived:
SA = a + PG + AC + GR + PC + SM + NP (1) Where SA represents the percentage of college students that study
abroad, a is a constant, PG represents the percentage of full-time undergraduates receiving Pell grants, AC is the ACT cumulative score ranking at or above in the 75th percentile, GR represents the graduation rate of undergraduate students within 150% of normal graduation time, PC represents the percentage of undergraduate enrollment identified as women, SM represents the average weighted monthly salary total for faculty, and NP is the average net price for students from household incomes between $48,001 and $75,000.
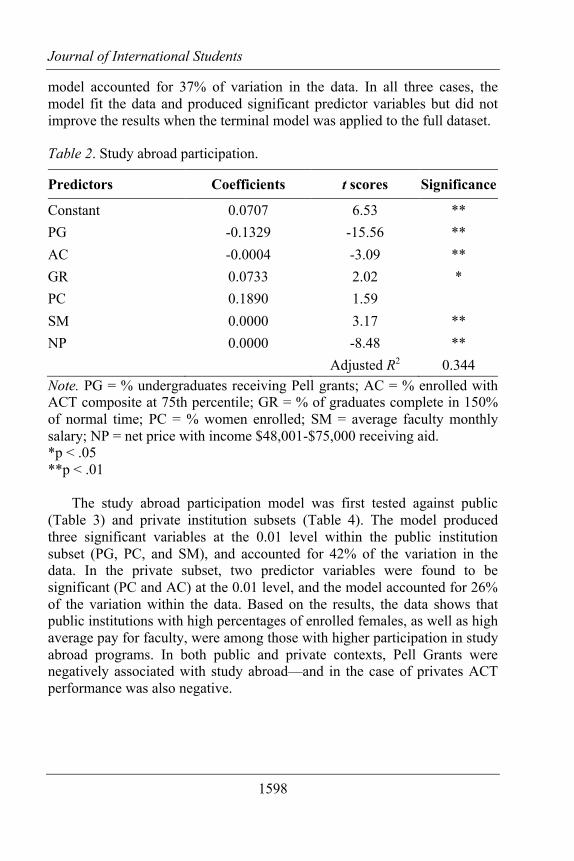
Table 2 shows the final model results for study abroad participation among the full data set utilizing six predictor variables, of which four were highly significant at the 0.01 level and one was significant at the 0.05 level. The adjusted R-square of 0.344, explains 34% of the variability of the data.
The study abroad participation terminal model was also tested against the Carnegie classification data subsets to predict participation based upon institution size (Table 5). The terminal model performed best against the medium institution data set, producing four highly significant variables at the 0.01 level: PG, PC, SM and NP. The model accounted for 36% of variation within the medium dataset and produced three significant variables at the .01 level in both the large and small datasets. Within the large classification, PG, PC and SM were significant predictors of study abroad participation at the .01 level and the model accounted for 56% of the variation within the data. In the small classification, PG, SM and NP were significant predictors of study abroad participation at the .01 level and the
Journal of International Students
1598
model accounted for 37% of variation in the data. In all three cases, the model fit the data and produced significant predictor variables but did not improve the results when the terminal model was applied to the full dataset.
Table 2. Study abroad participation.
Predictors Coefficients t scores Significance
Constant 0.0707 6.53 ** PG -0.1329 -15.56 ** AC -0.0004 -3.09 ** GR 0.0733 2.02 * PC 0.1890 1.59 SM 0.0000 3.17 ** NP 0.0000 -8.48 ** Adjusted R2 0.344 Note. PG = % undergraduates receiving Pell grants; AC = % enrolled with ACT composite at 75th percentile; GR = % of graduates complete in 150% of normal time; PC = % women enrolled; SM = average faculty monthly salary; NP = net price with income $48,001-$75,000 receiving aid. *p < .05 **p < .01
The study abroad participation model was first tested against public (Table 3) and private institution subsets (Table 4). The model produced three significant variables at the 0.01 level within the public institution subset (PG, PC, and SM), and accounted for 42% of the variation in the data. In the private subset, two predictor variables were found to be significant (PC and AC) at the 0.01 level, and the model accounted for 26% of the variation within the data. Based on the results, the data shows that public institutions with high percentages of enrolled females, as well as high average pay for faculty, were among those with higher participation in study abroad programs. In both public and private contexts, Pell Grants were negatively associated with study abroad—and in the case of privates ACT performance was also negative.

Journal of International Students
1599
Table 3. Study abroad participation for public institutions. Predictors Coefficients t scores Significance
Constant 0.0043 0.45 PG -0.0738 -12.76 ** AC 0.0087 0.91 GR 0.0000 0.56 PC 0.0442 4.16 ** SM 0.0000 4.83 ** NP 0.0000 -0.02 Adjusted R2 0.415
*p < .05 **p < .01
Table 4. Study abroad participation for private institutions.
Predictors Coefficients t scores Significance
Constant 0.9420 5.73 ** PG -0.1705 -11.35 ** AC -0.0432 -2.58 ** GR 0.0984 1.60 PC 0.0110 0.65 SM 0.0000 1.18 Adjusted R2 0.255
*p < .05. **p < .01 The terminal model was also tested against baccalaureate, masters
and doctoral degree awarding intuitions to predict study abroad participation (Table 6). The model had the greatest success in producing significant predictor variables when tested on institutions where Masters degrees were the highest awarded degree, as PG, PC, SM and NP were all significant at the 0.01 level. The model explained 31% of variation in the data. The model also produced three significant predictor variables when tested against institutions awarding doctoral degrees (PG, PC, and SM) and those awarding baccalaureate degrees (PG, NP, and SM). The model explaining study abroad participation among institutions awarding doctoral degrees accounted for 41% of the variability within the dataset, whereas the model

Journal of International Students
1600
applied to baccalaureate awarding institutions accounted for 40% of the variation in that dataset. As with the Carnegie classification subsets, the degree awarding institution subsets were successful in utilizing the terminal model to explain study abroad participation, even though the model did not produce any major differences within and between groups relative to individual parameters in most cases.
Table 5. Study abroad participation by Carnegie Institution size.
Predictors Coefficients t scores Significance Small Constant 0.0717 3.54 ** PG -0.1367 -7.44 ** AC -0.0335 -1.60 GR 0.0127 0.20 PC -0.0297 -1.51 SM 0.0000 5.01 ** NP 0.0000 -3.08 ** Adjusted R2 0.366 Medium Constant 0.0134 0.82 PG -0.1042 -9.38 ** AC -0.0092 -0.56 GR 0.0832 1.48 PC 0.0638 -3.58 ** SM 0.0000 3.09 ** NP 0.0000 -4.30 ** Adjusted R2 0.357 Large Constant -0.0022 -0.15 PG -0.0997 -10.84 ** AC 0.0115 0.87 GR 0.0851 1.63

Journal of International Students
1601
Predictors Coefficients t scores Significance PC 0.0638 3.67 ** SM 0.0000 4.63 ** NP 0.0000 -0.87 Adjusted R2 0.556
*p < .05. **p < .01
Table 6. Study abroad participation by degree awards.
Predictors Coefficients t scores Significance Baccalaureate Constant 0.1124 4.17 ** PG -0.1391 -5.78 ** AC -0.0153 -0.59 GR -0.1387 -1.66 PC -0.0287 -1.08 SM 0.0000 2.30 ** NP 0.0000 -4.11 ** Adjusted R2 0.403 Masters Constant 0.0121 0.96 PG -0.0939 -10.58 ** AC -0.0084 0.07 GR 0.0673 1.63 PC 0.0379 2.78 ** SM 0.0000 4.91 ** NP 0.0000 -4.46 ** Adjusted R2 0.307 Doctorate Constant -0.0002 -0.01 PG -0.1027 -8.88 ** AC 0.0014 0.08

Journal of International Students
1602
Predictors Coefficients t scores Significance GR 0.1019 1.53 PC 0.0625 3.72 ** SM 0.0000 4.36 ** NP 0.0000 -1.07 Adjusted R2 0.409
*p < .05 **p < .01
International Student Enrollment
Based upon the observed correlations and exploratory regression analysis, the following terminal equation was derived:
IS = a + PG + AC + GR + PC + PW + SM + NP (2) Where IS represents the percentage of college students that study
abroad, a is a constant, PG represents the percentage of full-time undergraduates receiving Pell grants, AC is the ACT cumulative score ranking at or above in the 75th percentile, GR represents the graduation rate of undergraduate students within 150% of normal graduation time, PC represents the percentage of undergraduate enrollment identified as women, SM represents the average weighted monthly salary total for faculty, and NP is the average net price for students from household incomes between $48,001 and $75,000.
The final model explaining international student enrollment included seven predictor variables, with all variables being highly significant at 0.01 and accounting for 45% of the variability of the data (Table 7). These seven predictor variables explain international student enrollment within the context of the full dataset, which consisted of 1,034 institutions. These institutions were public and private, Baccalaureate, Masters, and Doctorate degree-awarding, and small, medium, and large, according to the Carnegie classification designation.
In applying the final model to the public (Table 8) and private institution (Table 9) subgroupings, the model performed well with both data sets. Within public institutions there were six highly significant variables, and PG was the only variable that was not significant. Further, the model accounted for 47.2% of variation in the data. Additionally, the private institution model produced four significant variables at the 0.01 level, and one significant variable at the 0.05 level. The model accounted for 45.4% of variation in the

Journal of International Students
1603
data, and only GR was not a significant predictor of international student enrollment.
Table 7. International student enrollment rates.
Predictors Coefficients t scores Significance
Constant 0.1437 5.8 ** PG -0.0682 -3.42 ** AC 0.0007 -3.67 ** GR -0.1680 -2.81 ** PC -0.1704 -8.71 ** PW -0.0920 -7.14 ** SM 0.0000 10.98 ** NP 0.0000 -5.34 ** Adjusted R2 0.445 Note. PG = % undergraduates receiving Pell grants; AC = % enrolled with ACT composite at 75th percentile; GR = % of graduates complete in 150% of normal time; PC = % women enrolled; SM = average faculty monthly salary; NP = net price with income $48,001-$75,000 receiving aid. *p < .05. **p < .01
Table 8. International student enrollment for public institutions.
Predictors Coefficients t scores Significance
Constant 0.1641 4.73 ** PG -0.0371 -12.76 AC 0.0009 3.42 ** GR -0.2558 -3.81 ** PC -0.2377 -7.66 ** PW -0.435 -3.05 ** SM 0.0000 7.09 ** NP 0.0000 -3.18 ** Adjusted R2 0.472 *p < .05 **p < .01

Journal of International Students
1604
Table 9. International student enrollment for private institutions.
Predictors Coefficients t-scores Significance
Constant 0.1676 4.74 ** PG -0.0829 -2.79 ** AC 0.0005 1.95 * GR -0.0892 -0.97 PC -0.1525 -5.97 ** PW -0.1442 -7.20 ** SM 0.0000 7.09 ** Adjusted R2 0.454 *p < .05. **p < .01
In testing the model against the Carnegie classification subgroups, the
terminal model performed well in all instances (Table 10). The model fit the large classification best, returning an adjusted R square value of 0.603, by far the highest for the international enrollment sub-category tests. Five of the predictor variables were significant. The model also performed well for the medium classification, producing six significant predictor variables, five of which were significant at the 0.01 significance level. The model accounted for 43% of the variability within the data. The model performed most poorly when tested on the small classification data, although it still accounted for 24% of the variation in the data. The model produced five significant predictor variables, three of which were significant at the .01 level. Unlike in the large or medium classifications, PG (the percentage of Pell Grants awarded at an institution) was a significant predictor variable at institutions in the small Carnegie classification.
The model was finally tested against subsets of the dataset based on the highest degree awarded at an institution (Table 11). The model performed well against the sub-group of doctorate-awarding institutions, producing five highly significant variables at the 0.01 level, and accounting for 57.5% of the variability in the data. The model produced six significant predictor variables when tested against the masters-awarding institutions, with five variables being significant at the 0.01 level. However, the model only accounted for 17.8% of the variability within the data. When tested against baccalaureate-awarding institutions, the model produced three significant predictor variables, two of which were significant at the 0.01 level, and accounted for 24.7% of the variability within the data. Although the model

Journal of International Students
1605
performed best with predicting international enrollments among doctoral awarding institutions, the model performed well in most of the data subsets.
Table 10. International student enrollment by Carnegie Institution size.
Predictors Coefficients t scores Significance Small Constant 0.1379 4.44 ** PG -0.0891 -3.52 ** AC 0.0000 0.02 GR -0.1367 -2.02 * PC -0.0500 -2.35 * PW -0.0939 -5.72 ** SM 0.0000 3.33 ** NP 0.0000 -0.350 Adjusted R2 0.239 Medium Constant 0.2457 5.26 ** PG -0.0456 -1.27 AC 0.0009 2.54 ** GR -2.870 -2.41 * PC -0.3210 -8.49 ** PW -0.0951 -4.14 ** SM 0.0000 4.55 ** NP 0.0000 -3.80 ** Adjusted R2 0.427
Large Constant 0.2567 4.20 ** PG -0.0751 -1.57 AC 0.0013 2.61 ** GR -0.1580 -0.80 PC -0.4004 -6.26 ** PW -0.0955 -3.31 **

Journal of International Students
1606
Predictors Coefficients t scores Significance SM 0.0000 5.52 ** NP 0.0000 -2.69 ** Adjusted R2 0. 603 *p < .05. **p < .01
Table 11. International student enrollment by degree awards.
Predictors Coefficients t scores Significance Small Constant 0.1044 2.60 ** PG -0.0974 -3.11 ** AC 0.0001 -0.26 GR -0.0839 -1.04 PC 0.0127 0.49 PW -0.0809 -3.78 ** SM 0.0000 2.18 * NP 0.0000 -1.46 Adjusted R2 0.247 Medium Constant 0.1331 4.62 ** PG -0.0082 -0.36 AC 0.0006 2.66 ** GR -0.1633 -2.19 * PC -0.1575 -6.41 ** PW -0.0480 -3.34 ** SM 0.0000 3.44 ** NP 0.0000 -4.46 ** Adjusted R2 0.178 Large Constant 0.4447 7.46 **

Journal of International Students
1607
Predictors Coefficients t scores Significance PG -0.1447 -2.70 ** AC 0.0004 0.67 GR -0.2920 -1.40 PC -0.4802 -9.14 ** PW -0.1577 -5.09 ** SM 0.0000 3.41 ** NP 0.0000 -4.27 ** Adjusted R2 0.575 *p < .05. **p < .01
DISCUSSION AND CONCLUSIONS
Institutions of higher education are keenly aware of the importance of study abroad programs, as well as maintaining (and growing) the numbers of international students on their campuses. As such, the knowledge of specific factors related to study abroad participation and international student enrollment is critical for colleges aiming to become more competitive through internationalization (Mohsin & Zaman, 2014). The results of the analyses have at least four important implications for universities and colleges engaged in internationalization. First, whether looking at study abroad programs or international student enrollment, the availability of Pell Grants to first-time, undergraduate students was significantly and negatively related in both terminal models, as well as in every subset for study abroad participation and in four subsets for international student enrollment. Clearly, access to educational funding is an important factor for students as well as institutions, but at institutions where more students are receiving assistance through Pell Grants, internationalization—particularly study abroad, has been less successful. Second, strategies for internationalizing might vary depending on the size of the institution. Specifically, there was more overlap with significant variables in both study abroad participation and international student enrollment among medium and large institutions than there was with smaller schools and either larger or medium sizes schools, based on Carnegie classifications. This suggests that an institution’s size might play an important role in any specific plan to increase internationalization. Third, gender matters. The percentage of female

Journal of International Students
1608
students at an institution was an important predictor for international student enrollment, as well as for four subsets of study abroad participation. In cases where the percentage of female students was significant in relation to study abroad programs, the relationship was always strong and positive, indicating that female students might be more willing to engage in such programs than male students. While the percentage of female students correlates positively toward study abroad participation, at the same time minority involvement is dropping in study abroad programs (see Aguayo, 2016). Increasing minority and male participation even at small and baccalaureate institutions may have a significant effect of participation—and some evidence suggests the branding of study abroad may need to change (see Woodham, 2017). On the other hand, the percentage of female students, when significant, was negatively related to international student enrollment. Fourth, there is a strong, positive relationship between average faculty salary and both study abroad participation and international student enrollment. Faculty salary is a significant, positive predictor in both terminal models as well as seven of eight subsets for study abroad participation, and seven of eight subsets for international student enrollment. In terms of salaries, the indicators imply that institution type and the program array differences which translate into empirical salary differentials (i.e., engineering, business, and so on) influence decision making—as well as net tuition costs (or revenues).
Internationalization as an intentional process can be accomplished in a variety of ways. In this paper, we examined study abroad participation rates and observed international student enrollments. Generally speaking, the public and private participation rates for study abroad and the model performance was counter-intuitive. Specifically, the nostalgic belief that private liberal arts campuses continue to be the strongholds for study abroad relative to larger publics does not appear to be supported by the data. This may be due to the cost structures of private universities as compared with public universities. To that end, the results suggest that the confluence of socioeconomic status and cost are a prominent driver of observed participation rates. Additionally, the analysis confirms that the gender balance of individual campuses influences participation rates. Specifically, campuses with higher observed rates of female enrollments have higher participation in study abroad which empirically reinforces the notion than men do not appear to participate at the same rate as women do. Finally, it is worth noting that Carnegie designations may be important as the proportion of graduate students is, based on the models, consistently a negative factor. Consequently, the model performs more effectively at institutions with dominant undergraduate enrollments. With respect to international student

Journal of International Students
1609
enrollments, cost and program array are critical. Indeed, the variables perform especially well in explaining observed international student enrollments at graduate programs (doctoral and master’s programs) compared to undergraduate institutions. Likewise, public institutions appear to be more attractive than privates which likely coincides with cost. Finally, and more interestingly, more diverse campuses tend to statistically account for increased international enrollments.
In the end, the findings themselves are not surprising. Yet, the implications of the research are important. Indeed, the findings as they relate to gender, race, and class relative to study abroad are compelling, and these factors should inform the development of new lower cost faculty-led options as well as targeted programming and recruitment across the entire program array. With respect to international enrollments, the findings clearly indicate doctoral degree programs are a critical determinant as is diversity.
REFERENCES
Aguayo, J. (2016). Examining Study Abroad Participation in I-Promise Students: Preliminary Study on Why Minority Students Don't Study Abroad. TRiO McNair Journal, 2(1). Retrieved from http://hdl.handle.net/2142/95746
Altbach, P. (2015). Globalization and Forces for Change in Higher Education. International Higher Education, 50, 2-4. doi:10.6017/ihe.2008.50.7997
Altbach, P. G., & Knight, J. (2007). The Internationalization of Higher Education: Motivations and Realities. Journal of Studies in International Education, 11(3-4), 290-305. doi:10.1177/1028315307303542
Altbach, P., & Teichler, U. (2001). Internationalization and Exchanges in a Globalized University. Journal of Studies In International Education, 5, 5-25. http://dx.doi.org/10.1177/102831530151002
Bartell, M. (2003). Internationalization of Universities: A University Culture-Based Framework. Higher Education, 45, 43-70. https://doi.org/10.1023/A: 1021225514599
Bennett, J., Yeager, C., & Gatrell, J. (2016). The Locational Determinants of International Student Enrollments by State, 2009–2013. Papers in Applied Geography, 2(4), 409-420. http://dx.doi.org/10.1080/23754931.2016. 1239223
Cantwell, B. (2015). Are international students cash cows? Examining the relationship between new international undergraduate enrollments and institutional revenue at public colleges and universities in the US. Journal of International Students, 5(4), 512-525. Retrieved from https://files.eric.ed.gov/fulltext/EJ1066279.pdf

Journal of International Students
1610
Choudaha, R., & Chang, L. (2012). Trends in international student mobility. Retrieved from http://wenr.wes.org/2012/02/wenr-february-2012-trends-in-international-student-mobility
De Wit, H. (2015). Internationalization Misconceptions. International Higher Education, 64, 6-7. http://dx.doi.org/10.6017/ihe.2011.64.8556
Dwyer, M. M. (2004). More is better: The impact of study abroad program duration. Frontiers: The Interdisciplinary Journal of Study Abroad, 10, 151-163. Retrieved from https://files.eric.ed.gov/fulltext/EJ891454.pdf
Hawawini, G. (2011). The Internationalization of Higher Education Institutions: A Critical Review and a Radical Proposal. SSRN Electronic Journal. http://dx.doi.org/10.2139/ssrn.1954697
Hu, S., & Kuh, G. (2003). Maximizing What Students Get Out of College: Testing a Learning Productivity Model. Journal Of College Student Development, 44(2), 185-203. http://dx.doi.org/10.1353/csd.2003.0016
IIE. (2016). Leading Institutions by Undergraduate Participation: Previous Years. Retrieved from https://www.iie.org/en/Research-and-Insights/Open-Doors/Data/US-Study-Abroad/Leading-Institutions/Leading-Institutions-by-Undergraduate-Participation
Lee, J. (2008). Beyond Borders: International Student Pathways to the United States. Journal Of Studies In International Education, 12(3), 308-327. http://dx.doi.org/10.1177/1028315307299418
Lincoln Commission. (2005). Global Competence and National Needs: One Million Americans Studying Abroad. Final Report from the Commission on the Abraham Lincoln Fellowship Program, Washington DC (pp. 3-31). Washington, D.C.
Luo, J., & Jamieson-Drake, D. (2013). Examining the educational benefits of interacting with international students. Journal of International Students, 3(2), 85-101. Retrieved from https://files.eric.ed.gov/fulltext/ EJ1056457.pdf
McMahon, M. (1992). Higher education in a world market. Higher Education, 24(4), 465-482. http://dx.doi.org/10.1007/bf00137243
Mohsin, A., & Zaman, K. (2014). Internationalization of universities: Emerging trends, challenges and opportunities. Journal of Economic Info, 3(1). Retrieved from http://jei.readersinsight.net/index.php/jei/article/viewFile/ 1/1
Naffziger, D. W., Bott, J. P., & Mueller, C. B. (2008). Factors influencing study abroad decisions among college of business students. International Business: Research, Teaching and Practice, 2(1), 39-52. Retrieved from http://www.aibse.org/wp-content/uploads/2012/02/NaffzigerBottMueller2008.pdf
NAFSA. (2017). New NAFSA Data: International Students Contribute $30.5 Billion to the U.S. Economy. Retrieved from http://www.nafsa.org/ About_Us/About_NAFSA/Press/New_NAFSA_DataInternational_Students_Contribute_$30_5_Billion_to_the_U_S__Economy/.

Journal of International Students
1611
Ortiz, A., Chang, L., & Fang, Y. (2015). International student mobility trends 2015 an economic perspective. Retrieved from http://wenr.wes.org/2015/02/ international-student-mobility-trends-2015-an-economic-perspective/
Pascarella, E. T., Palmer, B., Moye, M., & Pierson, C. T. (2001). Do diversity experiences influence the development of critical thinking? Journal of College Student Development, 42(3), 257-271. Retrieved from https://eric.ed.gov/?id=EJ630563
Qureshi, M., Janjua, S., Zaman, K., Lodhi, M., & Tariq, Y. (2013). Internationalization of higher education institutions: implementation of DMAIC cycle. Scientometrics, 98(3), 2295-2310. http://dx.doi.org/ 10.1007/s11192-013-1163-9
Salisbury, M., Umbach, P., Paulsen, M., & Pascarella, E. (2008). Going Global: Understanding the Choice Process of the Intent to Study Abroad. Research in Higher Education, 50(2), 119-143. http://dx.doi.org/10.1007/s11162-008-9111-x
Summers, M., & Volet, S. (2008). Students’ attitudes towards culturally mixed groups on international campuses: impact of participation in diverse and non‐diverse groups. Studies in Higher Education, 33(4), 357-370. http://dx.doi.org/10.1080/03075070802211430
Thomason, A. (2013). Diversity aside, international students bring a financial incentive. The Chronicle of Higher Education. Retrieved from http://chronicle.com/blogs/bottomline/diversity-aside-international-students-bring-a-financial-incentive/
Treverton, G. F., & Bikson, T. K. (2003). New challenges for leadership: Positioning the United States for the 21st century. RAND CORP SANTA MONICA CA. Retrieved from http://www.dtic.mil/get-tr-doc/pdf?AD=A4
Urban, E., & Palmer, L. (2013). International Students as a Resource for Internationalization of Higher Education. Journal Of Studies In International Education, 18(4), 305-324. http://dx.doi.org/10.1177/ 1028315313511642
Williams, T. R. (2005). Exploring the impact of study abroad on students’ intercultural communication skills: Adaptability and sensitivity. Journal of studies in international education, 9(4), 356-371. https://doi.org/10.1177/ 1028315305277681
Woodham, O., Stone, G. W., Cort, K., & Jones, M. A. (2017). An Exploratory Comparison of Private and HBCU Marketing Student Study Abroad Program (SAP) Participation Intentions. Atlantic Marketing Journal, 5(3), 3. Retrieved from https://digitalcommons.kennesaw.edu/amj/vol5/iss3/3
JONATHAN MARKS is a graduate student at Bellarmine University. Email: [email protected] CHARLES YEAGER, JR., PhD, is Assistant Professor of Geography, SUNY Suffolk. His major research interests lie in the area of the spatial aspects of

Journal of International Students
1612
suburbanization, popular culture, and higher education. Email: [email protected] JAY D. GATRELL, Ph.D., is Provost and Vice President of Academic Affairs at Eastern Illinois University. Jay is also a professor of geography with diverse research interests across human geography. Email: [email protected] JEREMY BENNETT, Ph.D., is Upper School Social Studies Teacher, Evansville Day School. Jeremy's academic interests range across human geography, specifically including economic geography, international issues, and China. Email: [email protected]
Manuscript submitted: August 26, 2017 Manuscript revised: April 3, 2018
Accepted for publication: August 20, 2018