the instability of instability of centered distributionsyctovey/publications/papers/... · norman...
TRANSCRIPT

The Instability of Instability of Centered Distributions∗†
Craig A. Tovey‡
ISyE and College of Computing§
Georgia Institute of TechnologyAtlanta Ga 30332
February 14, 1991revised September, 1992;June 2008;August 2009
In memoriam James V. McConnell, 1925–1990
∗a version of this paper was presented at Washington University, October 1990; SUNY at Stony Brook, Febru-ary 1991; California Institute of Technology, February 1991; Rutgers University, February 1991; Carnegie-MellonUniversity, March 1991.†This paper is dedicated, in memoriam, to James V. McConnell, whose insights were the original stimulus for
this line of research. Norman Schofield introduced me to the instability and chaos theorems of the Euclidean spatialmodel; Bob Foley, Richard McKelvey, and Gideon Weiss all suggested the appropriate mathematical machineryon distributional convergence, which allowed enormous simplifications in the proofs of Theorems 1,2,and 4. I alsogratefully acknowledge helpful discussions and correspondence with Donald Brown, Allen Calvin, Charles Plott,Howard Rosenthal, Matt Sobel, Stan Zin, Victor Rios-Rull, George Dantzig, Peter Lewis, Kathleen Platzman, JamieCalvin, David Koehler, Melvin Hinich, Michael Trick, John Hooker, Michael Rothkopf, Henry Tovey, Mahmoud El-Gamal, and Eban Goodstein. Finally, I particularly thank Don Saari and Bernie Grofman for their encouragement,and the referees for improving and streamlining the paper.‡Research supported by a Presidential Young Investigator Award from the National Science Foundation (ECS-
8451032), and a Senior Research Associateship from the National Research Council§at the Naval Postgraduate School, Operations Research Department,Monterey CA, academic year 1990-1991
1

Abstract
Democratic simple majority voting is perhaps the most widely used method of groupdecision making in our time. Standard theory, based on “instability” theorems, predicts thata group employing this method will almost always fail to reach a stable conclusion. Butempirical observations do not support the gloomy predictions of the instability theorems.We show that the instability theorems are themselves unstable in the following sense: if themodel of voter behavior is altered however slightly to incorporate any of several plausiblecharacteristics of decision-making, then the instability theorems do not hold and in factthe probability of stability converges to 1 as the population increases, when the populationis sampled from a centered distribution. The assumptions considered include: a cost ofchange; bounded rationality; perceptual thresholds;a discrete proposal space, and others.Evidence from a variety of fields justifies these assumptions in all or most circumstances.One consequence of this work is to render precise and rigorous, the solution proposed byTullock to the impossibility problem.
All of the stability results given here hold for arbitrary dimension. We generalize theresults to establish stability with probability converging to 1 subject to tradeoffs betweenthe assumptions and the degree of non-centeredness of the population. We also extend theresults from Euclidean preferences to the more general class of intermediate preferences.
1 Introduction
A principal goal of political economy has been to understand and explain the contemporary pro-cesses by which group decisions are made. In present times, democracy based on simple majorityrule has emerged as perhaps the predominant mode of group decision making. Standard pure the-ory predicts the failure of a majority-rule democracy. Indeed, the classic results on social choiceare predominantly pessimistic: the counterintuitive voter paradox of Condorcet, the extraordinaryimpossibility theorem of Arrow, the instability theorems of McKelvey, Rubenstein, Schofield, andothers. In particular, the instability theorems predict that majority-rule decision making will notreach a conclusion and can traverse any point in the decision space.
However, instability is not characteristically observed empirically, though in theory it shouldoccur most or all of the time [74]. As Ledyard observes, this “means that the theory as we knowit is fundamentally flawed”[37]. This and other gaps between the theory and the observationof democratic decision-making processes have inspired significant alterations in research, such asthe literature of “institutionalism,” which typically takes as given various sorts of structure orconstraints placed on the decision-making process. In this paper we show that a more modestdeparture from the pure theory suffices to bridge the gap between instability and stability. This isin the same general vein as [37], which views the retreat from the pure theory as premature. Someadvantages to our approach are the more generic nature of the results, and the natural linkagewith measurable preference data (Section 5). We should also point out that some of the departureshere are completely in line with institutionalism (e.g. Model II).
The key idea is to enrich the social choice model by incorporating real characteristics of decision-making behavior. It will turn out that the slightest bit of any of a number of plausible, broadlyjustifiable model refinements is enough to banish instability. One refinement we consider is a costof change. For example, no change in legislative statute, policy, procedure, or resource allocation
2

can be effected without some cost. Moreover, there is both experimental and physiological evidencethat a person can not change his mind without cost. Other refinements that we consider includebounds on the computational ability of the voters, and bounds on the degree of accuracy to whichan alternative may be specified. For example, budget amounts may not be in fractions of a cent,or tax rates may not be specified to within more than four decimal places of accuracy.
We explore the societal implications of this individual behavior. Our starting point is theDownsian or spatial model of voting [16, 7, 14, 12] under Euclidean or quadratic concave prefer-ences. This has long been the most widely used model of group choice and has found extensiveempirical application as well [52, 51, 48, 47, 50, 49, 30, e.g.]. Current theory, in the form of theclassic instability theorems [45, 39, 58, 40, 42, 5], states that instability will occur, leading tochaotic movement and cycling.
Continuing to the main point (section 3), we make an additional assumption regarding thedistribution of voter ideal points: the population is drawn according to a centered distributionwhich is continuous or has bounded support. In section 4 we will show how this assumptionmay be relaxed to permit non-centered distributions. For now we note that most distributionsin the literature are centered, e.g. the multivariate normal, uniform cube, ball, parallelopiped,or ellipsoid. In addition the U.S. Senate data in [32] appears consistent with a centerednessassumption.
We then develop several modifications to the standard Downsian model, each based upon aplausible assumption about decision-making. It turns out that that just the slightest alteration tothe basic model, by injection of the least bit of any of these assumptions, nullifies the instabilitytheorems. More precisely, the probability of stability will converge to 1 as the population grows.
The first modification (Model I , section 3.1) assumes that there exists ε > 0, such that avoter will prefer a new alternative to the status quo only if the former is at least ε better than thelatter. This assumption is justified in many situations where there exists some minimal (threshold)nonzero cost ε > 0 of change. Often this is a direct economic cost; we will argue that in many othersituations the cost of change may be nonzero because of the cost of the greater uncertainty of thenew alternative, or for other indirect reasons. Thus Model I applies to a broad variety of situations.Theorem 1 proves that in Model I, however small ε, stability ensues for any dimensionality withprobability 1 as the population increases. This modification is analogous to the notion of an ε-core[75, 60, 34] (or quasi-core [59]) in game theory, and to the concept of an ε-equilibrium, and inthese terms Theorem 1 guarantees (probabilistically) the existence of an ε-core for all positive ε.
In related work, Kohler [33] and Brauninger (using a more accurate computational method)[8] have numerically simulated Model I in two dimensions and obtained results consistent with thegeneral results proved here. Methods to compute the ε-core in two dimensions to within a desiredorder of precision are discussed in [69, 8]. Statistical consistency of the ε-core in all dimensions isshown in [69]. The author has also proved that the ε-core enjoys a dynamical convergence property:Let r and c be the yolk radius and center, respectively; if ε > 2r a sequence of majority-rule votesunder Model I starting at x will always reach an ε-core point in at most d ||x−c||−r
ε−2re steps [70].
The concept of bounded rationality [61] provides an alternative justification for the ε > 0assumption of Model I (section 3.1.2). If the voters have limited computational power, then theywill not be able to recognize arbitrarily small differences in distance (utility). Thus Model I applies,and stability ensues with probability 1 as the population increases. This result mirrors results ingame theory, where more cooperative group behavior emerges under the same assumption [44].
3

When this justification of Model I is invoked, we have the intriguing outcome, that individualimperfections or limitations may contribute to social stability.
Model II (section 3.1) assumes that for some ε > 0 no alternative at distance less than ε fromthe incumbent or status quo may be introduced. As with Model I we argue that this assumption isvalid in a great many situations. For example, people often are limited by perceptual thresholds,and are unable to distinguish between arbitrarily close alternatives. This assumption is alsoconsistent with the idea of “institutional” restrictions. When this assumption is valid, Theorem1 again provides a positive outcome (theorem 1): stability with probability 1 as the populationgrows.
Model II also serves as a precise formulation of Tullock’s controversial proposed solution tothe instability problem [72, 73]. Forty years ago, Tullock had sought to explain the “irrelevance”of the Arrow impossibility theorem via the 2-dimensional Downsian model. Assuming a uniformrectangular distribution, and a prohibition against “hairsplitting”, Tullock argued informally thatstability would ensue. Succeeding work by Arrow [3], McKelvey[39, 40], and others [13, e.g.]appeared first to prove, then to disprove, Tullock’s ingenious argument. However, Tullock’s argu-ment has never been proved nor disproved [71]. We prove it here in Theorem 1, and extend it toarbitrary dimension.
The third and fourth models we consider assume some kind of a priori advantage on the partof the incumbent or status quo. Again we argue that this assumption is frequently valid, whetherdue to the control of proxy votes by the incumbent board at the stockholder’s meeting, greatername recognition of political incumbents, or interests vested in the status quo. Theorem 3 (section3.3) guarantees that in Models III and IV, stability will exist with probability 1 as the populationincreases. The result confirms work of Sloss[64] and Slutsky[65], who find that if a proposal is apriori guaranteed a number of votes, it is easier for it to be a stable point (“easier” here meansthat the conditions for stability are mathematically weaker, though they are much more complex[31, 6]). Also related is work by Feld and Grofman [20], who study cases in two dimensions with3 and 5 voters, and observe that incumbency advantage makes stability more likely. Theorem 3provides a precise and rigorous generalization of their observation.
The last two models we consider are based on discretization assumptions. Model V assumesthat the distance or utility function calculations are not performed over a continuum, but ratherover a discrete set of possible values. This assumption would be valid for instance, if numericalcalculations were performed in fixed precision, or if costs were computed only to the nearest cent(or centime). Model VI assumes that the proposal space is a discrete set. These models are similarbut not identical to models I and II, respectively. The outcome is identical: Theorem 4 tells usthat stability exists with probability 1 as the population increases.
Thus the instability theorems are themselves unstable with respect to slight realistic modifi-cations to the basic spatial model. This may help explain why majority rule usually works inpractice.
The reinstatement of stability is in the same spirit as in [54], where models of auction partici-pant behavior are enriched to improve consistency between the predicted and actual outcomes ofauctions for U.S. Forest Service timber (see also [55, 53, 27]). For another result in the same spirit,consider a famed “negative” result in the theory of voting under incomplete information, due toAusten-Smith and Banks, that informative behavior is not an equilibrium in the Condorcet JuryTheorem framework [4]. Laslier and Weibull have proved that this “instability” result is not stable
4

in the sense that it breaks down if one instills some reasonable perturbation in the description ofthe voter’s decision-making process [36]
While the centeredness of underlying distributions remains an open question, we doubt that realpopulations or groups behave as though sampled from a perfectly centered distribution (althoughthere is some empirical evidence that the underlying distribution may not be very much off-centered). The ε-stability Theorems 1,3, and 4 just described make the strong assumption that thedistribution is centered. On the other hand, these theorems make the relatively weak assumptionthat ε > 0. It seems likely that in many of the situations discussed, ε will not just be nonzero,but will have non-negligible magnitude. For example, the cost of change or of uncertainty can besubstantial in many cases. This suggests that we seek a trade-off between the centeredness of thedistribution and the magnitude of ε.
The yolk radius and the Simpson-Kramer min-max majority are two measures of non-centeredness.We show (section 4) how a tradeoff between the degree of centeredness and the value of ε in ModelsI–IV leads to stability. When ε is greater than the distributional yolk radius, in model I, stabilityensues with probability 1 as the population grows (Theorem 6). Similar results hold for the othermodels. However, we do not wish to conceal the importance of the centeredness assumption, or,as we show in section 6, the related but weaker assumption of intermediate preferences. As one ofthe referees has pointed out, voting data can be fitted to more than one model of preferences, sowhat is really at stake is how are the ideal points scattered in a space that makes all individualpreferences Euclidean, constant-elasticity-substitution, or intermediate. If they are scattered in acentered or nearly centered way, then the results herein apply.
Ultimately we should like a model of social choice with good explanatory and effective predictivepower. Thus we seek stronger tests of our proposed explanation, than that they should merelypredict stability. In the case of Model I, there is some very promising corroborative experimentalwork reported by Salant and Goodstein [57], who formulated Model I independently and priorto the work reported here. These tests and other empirical issues are discussed in section 5. InSection 6 the results are extended to the class of intermediate preferences and some related workon probabilistic models is discussed.
2 Notation and Assumptions
We establish notation and introduce the main assumption of centeredness. The voters form aset V ⊂ <m, where m ≥ 2 is fixed. Each voter v ∈ V is independently identically distributedaccording to a probability distribution µ.
For any hyperplane h ∈ <m, we denote the two closed halfspaces defined by h as h+ and h−,respectively, where h− contains the origin (if h contains the origin the ambiguity won’t matter).Let n = |V | denote the number of voters.
Definition: A probability distribution f is centered around 0 iff for every hyperplane h not passingthrough 0, the total mass of f in h+ is less than 1/2.
Definition: A probability distribution f(x) is centered around z iff f(x + z) is centered around0. If f is centered around z we say f is centered and z is the center of f .
Many common distributions are centered, for example the multinormal (even with singularvariance/covariance matrix), or the uniform distribution on a parallelogram or ellipsoid. Most
5

sign-invariant distributions are centered. Note our condition is that the population be drawn froma centered distribution. This is a different and much weaker condition than requiring that thepopulation be centered. See [71] for additional explanation.
Koehler [32] gives some data for the U.S. Senate in 1985. A projection of the 3 dimensionalrepresentation is shown in Figure 1. The overall shape is quite interesting: there are two large op-posing peaks, and a third, smaller, central peak. On the basis of this data, the group’s ideal pointsare quite polarized and fail statistical fitness tests for both the normal and uniform distributionclasses. They also do not appear to be sampled from a concave distribution. But they do appearroughly consistent with sampling from a centered distribution. I do not know of any statisticaltests for whether a sample comes from a centered distribution, so I cannot support the precedingstatement rigorously. In section 5 some ideas for such statistical tests are discussed, and some ofthe mathematical groundwork for these is laid here (Corollary 6.2) and in [9, 71]. This area needssome more development.
In addition to the centeredness assumption, µ is taken to satisfy one (or more) of the followingtechnical regularity conditions: (i) µ has bounded support; (ii)µ is continuous; (iii)µ has positivecontinuous density in a ball containing z. For empirical studies the first of these will ordinarily besatisfied, since we usually take measurements on bounded scales. If we fit this data to a normalor some other continuous distribution, then (ii) will apply. Therefore, the regularity condition isfairly mild, though we dispense with it when possible (e.g. Theorem 7).
3 The Instability of Instability
In this section we introduce several plausible assumptions concerning individual decision-making.Each leads to a modification of the Euclidean model. Theorems 2–4 state that in any of thesemodified models, there is equilibrium with probability 1 as the population increases, when thepopulation is sampled from a centered distribution.
3.1 Model I: the ε-core
The first assumption we consider is that there exists some minimal “threshold” value ε > 0 suchthat agents or voters will select a new alternative in preference to the status quo or incumbentonly if the new alternative is at least ε closer.
Model I: Faced with an “incumbent” alternative a ∈ <m and another alternative c ∈ <m, anagent with ideal point v ∈ <m will vote for c only if ||a− v|| > ||c− v||+ ε.
By “Model I” we actually mean the Euclidean model, modified by the enrichment just stated.It is worth noting that this enrichment is scale-independent, as will be the other models andTheorems 2–4. We rely implicitly on this invariance later in this section, where we argue thatModel I will be justified in a great many situations, including some where ε may be hard orimpossible to measure. All that matters is that ε be strictly positive. It should also be pointedout that Model I says “only if”. This permits nonuniformity among the agents: each could havea different threshold, as long as no threshold is less than ε.
An undominated point in Model I can be viewed as an ε-core point in game-theoretic termi-nology.The ε-core clearly is also similar to the notion of an ε-equilibrium.
6
For ε sufficiently large obviously the core will be nonempty. When µ is centered, Theorem1 says the core will become non-empty (w.p.1) as the population increases, for any positive ε,however small.
Model II assumes there exists a threshold value ε > 0 such that proposals are not distinguishedfrom one another unless they differ by ε or more. We define Model II precisely as:
Model II: There exists ε > 0, such that any new proposal c offered to challenge the incumbentproposal a must satisfy ||a− c|| > ε.
In Model II the Euclidean model is altered by requiring the “challenger” proposal c to be atdistance ε or more from the incumbent a. The forbidden points are those meeting Hotelling’sprinciple of adjacency. Then a is an equilibrium point if and only if no point c, ||c − a|| ≥ ε ispreferred to a by a majority of the voters. The assumption of Model II is mathematically weakerthan Assumption I. Nonetheless, Theorem 1 assures eventual equilibrium with probability 1 asthe population grows.
Theorem 1. Let µ be a centered distribution on <m satisfying one of the regularity conditions(i–iii). Let a population of n ideal points with Euclidean preferences be sampled independently fromµ. Then in Models I and II, for any ε > 0, there is equilibrium with respect to simple majorityrule as n→∞ w.p.1.
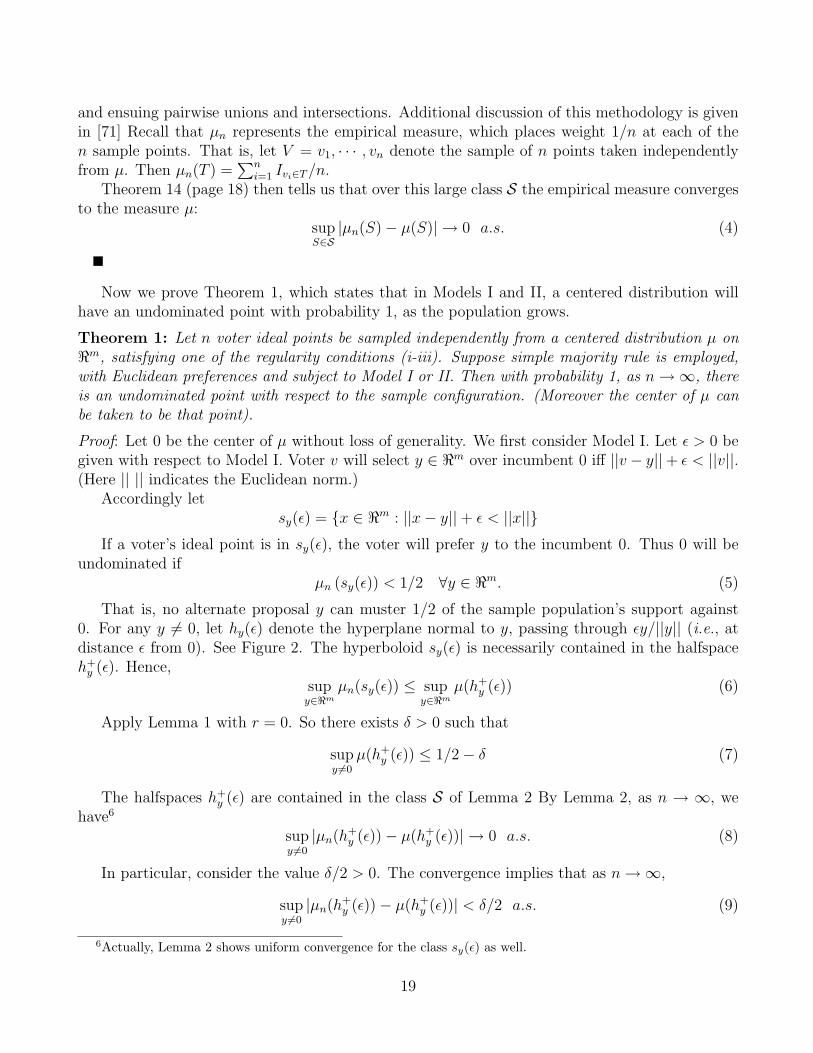
Proof: While the actual proof of Theorem 1 is relegated to the appendix, the intuitive ideas canbe seen quite easily in two dimensions.
Consider Figure 2: for an alternative proposal y ∈ <2, the shaded region defined by thehyperbola shown is where y will draw support against an incumbent at the distribution centerz. For any particular y, centeredness implies that the probability measure of the associatedhyperboloid region is less than 1/2. Then by the law of large numbers, incumbent z will defeat cwith probability 1 as the population increases. To prove that all alternatives are simultaneouslydefeated, we employ real analysis to control the probability measures of all the hyperboloid regionswith a single bound, and invoke strong results on uniform convergence of empirical measures tobe sure this bound is adhered to closely enough in all the regions.
3.2 Motivation for Models I and II
In this section we will show that in the context of Model I, the ε-core has a strong foundation ineconomic and human behavior. We also motivate the assumption of Model II.
3.2.1 The cost of change
A very natural way to justify assumption I is to view ε as the cost of change.1
There can be very strong economic reasons for resisting change. For example, when the U.S.Congress overhauled the tax law in 1986, the Wall Street Journal reported an estimate of 100billion dollars as the cost to American business for compliance, simply to meet the new legal,
1this observation, including the consequent conflict between empirical data and the simple static form of theVon Neumann-Morgenstern utility function, is due to James McConnell.
7
accounting, and reporting requirements. Thus a change could easily decrease a company’s taxliability, yet result in a net loss due to legal, administrative, and data processing costs. In generalthe cost of altering business plans is enormous. Start-up costs are a major part of business planningfor product cycles.
Individuals resist change in many situations. Illustrations of this phenomenon are found inmany fields. In marketing science, brand loyalty is a broadly accepted and observed behavior.In political science, party loyalty has been long observed and well documented. Some interestingexamples of resistance to change are found in experiments from the study of cognitive dissonance,initiated by Leon Festinger [23]. Festinger found that people with a belief position would rejectdata in conflict with their beliefs, rather than change their beliefs. Evidence from neurophysiologyindicate a physical basis for these observations: there are measurable physiological changes in thebrain that accompany learning or changes to memory [38, 29].
The decision-making associated with Model I can be viewed as rational behavior. Consider autility function U [p] mapping alternatives p ∈ <m to utility values. In the presence of a cost ofchange, this simple functional form is inadequate to capture decision-making behavior. A moresophisticated form is needed; e.g. let U [p1, p2] denote the utility of being at position pi in periodi, i = 1, 2. Then we could have U [a, a] > U [a, b] and U [b, b] > U [b, a]. Thus whichever of a, b isthe present position will be the preferred position for the next period. These preferences wouldappear reflexive with the less sophisticated functional form2.
3.2.2 Bounded rationality
The concept of bounded rationality [61] offers another possible justification of Model I. This idea isbased on the fact that people have limited or costly computational abilities or resources. Boundedrationality is modelled by assuming computations are limited to those that can be realized on aparticular formal model of computation. For example, we may assume as in [44] that each voter’scomputations are performed on a deterministic finite automaton (DFA). Roughly speaking, a DFAwithM states is a computer program consisting ofM conditional go-to (branching) statements, butwith no memory access permitted (see [63] for a complete exposition). If a voter’s computations arelimited in this way, it follows that the computations cannot be carried out to arbitrary precision,since they are trivially limited by the number of states, M . If there is a limit on precision, thenfor some ε > 0 (e.g. 2−(M+1) if the input is binary), the voter will not be able to distinguishbetween ||a− v|| − ||c− v|| ≤ 0 and ||a− v|| − ||c− v|| ≤ ε. The exact value of ε is not importanthere because of the scale invariance of the results. Hence computational limitations have the sameeffect on the Euclidean model as the cost of change, and thus provide an alternate justification ofModel I.
Several other formal models of computation lead to the same conclusion as well. For example,suppose the computations are limited to a pushdown automaton (PDA). The PDA is more powerfulthan the DFA ([63]), so this is a less restrictive assumption. In the appendix we prove that thePDA cannot compute the differences in distances to arbitrary precision, either.
A slightly less formal model would be, any automaton whose arithmetic operations are per-formed in fixed precision. We summarize with the following proposition:
2This form was suggested by Stan Zin and Victor Rios-Rull.
8

Proposition 2.If each voter’s computations can be performed on a Deterministic Finite Automa-ton or a Pushdown Automaton or an automaton with fixed precision arithmetic operations, thenAssumption I holds.
We have a philosophical problem here. The Von Neumann-Morgenstern theory specificallydoes not assume that individuals calculate a utility function. Rather, it asserts that (rational)individuals’ decisions can be accurately modelled as though they did. But in the bounded ra-tionality justification of Model I, it seems we implicitly assume voters do calculate their utilityfunctions. Are we making an unrealistically strong assumption about voter behavior?
This problem is resolved through the idea of computation as developed in complexity theory.A person is faced with two alternatives, a and c. If she always decides in a manner consistentwith maximizing a utility function U(), then she always decides for c when U(a) < U(c), andvice-versa. Thus she is, in effect computing the function ∆U(a, c) = U(a)−U(c). More precisely,we could say that the voter receives input (a, c) and outputs “No” if and only if ∆U(a, c) < 0. Ina formal sense, this input-output description is the definition of computing whether ∆U < 0.
Therefore, we may say that the voter performs computations. We may not say that the voter’scomputations are performed by some specific method. Nevertheless we can put formal limits onthe complexity of these computations by requiring that they could be performed by a specific typeof automaton. (This explains why ∆U was used in the proof for PDAs, and why the wording ofthe Proposition is “. . . can be performed . . .”.)
3.2.3 The cost of uncertainty
Assumption I will also be valid in many situations where there is a cost of uncertainty. Theuncertainty could be one of two kinds: it could be uncertainty as to what the social decisionoutcome will be, or it could be an uncertainty as to the consequences of a new alternative.
The first kind of uncertainty can have a large economic cost. For example it is much easier toplan for hard times ahead if one knows whether the problem will be inflation or recession. Thisis so obvious it seems unnecessary to justify — there is a vast literature on decision-making andplanning under uncertainty. If hedging cost nothing, uncertainty wouldn’t cause problems. Butof course hedging is costly. In fact, planning under uncertainty is the problem which gave rise tolinear programming [11]. (This sounds similar to the business cost of change. Here the point isthe cost of hedging, such as the cost of a flexible business plan, rather than cost of altering one’sbusiness plans.)
The cost of uncertainty on the individual level is illustrated by many psychological experimentsin which subjects found the possibility of an undesirable outcome, more stressful than its certainty.One way to interpret this is to assume that the voters or committee members attach a negativeutility to not reaching a conclusion. If this utility is at least ε in absolute value, then an individualwould not propose a new alternative less than ε better than the incumbent proposal. This againleads to Model I.
Similarly, positive utility may often be associated with the group’s reaching a conclusion. Forexample, committee members may be permitted to leave a smoke-filled room or go home and eatdinner, provided they reach a conclusion. The purpose of the smoke is to increase the value of εin Model I. The United States Congress always manages to resolve its knotty issues in time forthe members to spend Christmas with their families.
9

The second kind of uncertainty may cause voters to increase their preference for an incumbent,because the incumbent is generally more of a known quantity (“Better the devil you know, thanthe devil you don’t.” as the saying goes). This justification would seem more likely to be validin situations where the social choice is a person, e.g. an elected official. It could also apply tosituations where the exact details of the new alternative are unspecified, and are to be workedout later by a negotiating committee or organization. In the United States, the Congressionalseniority system may increase preference for incumbents in Senate and House elections. Supposea voter is indifferent between the incumbent’s platform and a challenger’s, and favorable overalltowards both. The voter may then prefer the incumbent, who by greater seniority would be moreeffective.
3.2.4 Model II: minimal distance
Model II is partly motivated by situations where people cannot perceive arbitrarily fine distinc-tions. More precisely, suppose there exists a perceptual threshold value ε > 0 such that votersare unable to distinguish between proposals that differ by less than ε. Faced with two proposalssufficiently similar to each other, voters will think the two proposals are the same. Therefore anyproposed alternative c would have to be at least ε distant from the status quo a. (Some evidenceof perceptual threshold effects with respect to economic quantities is found in [43].
It is possible to justify Model II from a slightly different point of view. Tullock [72] arguesintuitively that the set of proposals that could get a majority over the center would lie in a verysmall area, if voters were uniformly distributed in a rectangle. He adds, “at this point, however,most voters will feel that new proposals are splitting hairs, and the motion to adjourn will carry.”[pages 260–261]. Note that the uniform distribution on a rectangle is centered. Therefore, aspromised, one consequence of Theorem 1 is a mathematically rigorous justification of Tullock’s“general irrelevance” argument. Tullock’s suggestion is not that participants will be unable todistinguish, but that they will not tolerate arbitrarily fine distinctions or “hairsplitting”. It seemslikely that this assumed limitation of hairsplitting will apply in many situations, simply as aconsequence of human behavior.
Model II is also applicable in situations where the institution explicitly constrains new al-ternatives to be some minimal distance from the incumbent proposal. In this context Model IIrepresents one of the standard institutional methods of restoring stability. Theorem 1 could there-fore be employed as theoretical support for this institutional restriction. Theorem 3 and Model IV,to follow, could be invoked to support another standard institutional restriction (supermajority).This aspect of the results is not emphasized because (in the author’s opinion) the institutionalapproach has a more normative flavor than the work here, where the goal is for stability to followfrom natural, plausible, widely applicable assumptions (rather than from easily enforced rules).
3.3 Models III & IV: incumbency advantages
The incumbent may enjoy particular advantages in attracting voters, especially in political situ-ations where the incumbent is a person. In the United States, incumbents generally have morevisibility and campaign funding than challengers. In many corporate elections the incumbent offi-cers control the proxy votes of inactive small shareholders. In general, there are apt to be interests
10

vested in the status quo, whether the status quo is a person, policy, resource allocation, or law.Models III and IV are intended to capture the “clout” or other advantage the incumbent may
possess. Model III states that the incumbent has an advantage in drawing out supporters.Model III: Supporters of the incumbent abstain with probability 1 − p ≥ 0; supporters of anychallenger abstain with probability 1− q > 1− p.
Model IV gives the incumbent a bloc of εn voters who will vote for her. These might be,for example, uninformed voters who decide on the basis of name recognition, or proxy voterscontrolled by the incumbent corporate board.Model IV: A subset S, |S| ≥ εn of voters will vote for the incumbent regardless of their truepreferences.
The key feature of Models III and IV is that the incumbency exerts an influence proportionalto the population size. The “ε” in these models is the proportionality factor: (p− q) in Model III;the ε such that |S| ≥ εn in Model IV. Suppose, for example, 5% of the voting population wereuninformed and voted solely on the basis of name recognition, and that a larger fraction of theserecognized the incumbent than the challenger. The differential fraction would form a bloc as inModel IV. Theorem 3, following, would imply that an incumbent at the center of the distributionµ would be undefeatable.
Theorem 3.Let µ be a centered distribution. Let a population of n ideal points be sampled inde-pendently from µ. Then in Model III or IV, there is equilibrium as n→∞ w.p.1.
Proof: Intuitively, nearly 1/2 of the voters will be sure to prefer 0 to the challenger, for largepopulations. Either modification gives the incumbent a slight additional advantage, which isenough to assure at least half the votes. For a rigorous proof, see the Appendix. (For this proof toapply, the influence need only be more than of order ∼
√n, but this seems to hold only technical
interest).
There is a set of results in the literature on two-party competition that has a similar themeas Theorem 3. This literature studies the stability-inducing effect of non-policy factors on votingbehavior in the spatial model. In general, researchers find that incumbency or party identificationadvantages induce stability. See, for example, [2, 26, 1].
3.4 Discretization: Models V & VI
The last two models we consider involve discretization, that is, limiting the possible values of avariable to a certain discrete set. For example, a computation of present value might be computedin whole dollars.
Model V: Discretized Utilities For some ν > 0, individual decisions are consistent with cal-culations of utility functions in integer multiples of ν.
Or, instead of utilities, the set of potential proposals could be discrete. For example, the U.S.president and Congress may have long debates over income tax rates, but all proposals are inwhole percents for tax rates and tens of dollars for breakpoints. No one ever suggests a tax rateof 21.462% for taxable income over $34,601.13. Let Z denote the integers.
11

Model VI: Discretized Proposals For some ν > 0, the set of feasible proposals are the latticepoints νx : x ∈ Zm.
Theorem 4. Let µ be a centered distribution satisfying one of the regularity conditions (i–iii).Let a population of n ideal points be sampled independently from µ. Then in Model V or VI, thereis stability as n→∞ w.p.1.
Proof: Intuitively, Model V should resemble Model I, because any challenger proposal must haveutility at least one step higher to be preferred to the incumbent. Model VI should resemble ModelII, since both forbid challengers to be arbitrarily close to the incumbent. The rigorous proofs arecomplicated by the fact that the distributional center or its utility may not be at a discretizedvalue. Details are given in the appendix.
4 Trade-offs between centeredness and ε
How realistic is the assumption, that µ is centered? While this remains an open question forempirical study, it seems unlikely to me, a priori, that ideal points are distributed as thoughsampled from a perfectly centered distribution. The purpose of this section is to show how thestability results of the previous sections carry over to the case where µ is not centered. The mainresult is that there is a trade-off between the degree of centeredness and the magnitude of ε in themodels.
In Theorems 2–4 of the previous section, the condition on µ is strong (centeredness), while themodifying assumption is weak (e.g. ε > 0). Perhaps if µ were almost centered, and ε were not toosmall, then stability would ensue with high probability.
To make this idea precise, we first need a way to measure how centered or off-centered adistribution is. Two powerful concepts from the literature present themselves: the radius of theyolk, and the min-max majority. The yolk of a configuration of voter ideal points [22, 41] is definedas the smallest ball intersecting all median hyperplanes (each closed halfspace contains at leasthalf the ideal points). The min-max majority [62, 35] is defined as the smallest supermajority thatpermits some point to be undominated; a point that is so undominated is a min-max winner.
Where V is a configuration of points, r(V ) and c(V ) will denote the radius and center of theyolk of V , respectively. When V is clear from context we will simply write r and c, respectively.Similarly, the min-max majority is denoted α∗(V ) and is always in the interval [1/2, 1]. For anysupermajority level α, Mα(V ) will denote the set of points that are undominated with respect toα-majority rule. Thus Mα∗ is the set of min-max winners.
We extend the definitions of r, c, α∗, and M to distributions in the natural way (see e.g.[9, 13, 71]). A median hyperplane h of a distribution µ satisfies µ(h+) ≥ 1/2, µ(h−) ≥ 1/2, andthe yolk of µ, with radius r(µ), is the smallest ball intersecting all median hyperplanes. A point xis in Mα(µ) if and only if, for every hyperplane h containing x, µ(h+) ≥ 1−α and µ(h−) ≥ 1−α.
Both r and α∗ are natural measures of centeredness. A distribution µ is centered only ifr(µ) = 0, and α∗(µ) = 1/2. (Iff moreover, e.g. when µ is positive continuous.) As r increases from0, or α∗ increases from 1/2, the distribution becomes more off-centered.
We wish to balance the off-centeredness of a distribution, as measured by r or α∗, against themagnitude of the parameters in the modifications. For finite fixed configurations, the following
12

deterministic theorem gives a trade-off between r and the ε of Models I and II. If the cost of changeor of uncertainty exceeds the yolk radius, or the perceptual threshold is more than twice the yolkradius, then stability exists.
Theorem 5: Suppose the yolk radius of a configuration V satisfies r(V ) < ε, in Model I; orsatisfies r(V ) ≤ ε/2, in Model II. Then the yolk center is an undominated point.
Proof: It suffices to consider the mathematically weaker case of Model II. For any proposal p atdistance 2r from the yolk center c, the bisecting hyperplane h of segment cp is either tangentto or outside the yolk. Hence at least half the points are in the halfspace containing c, and c isundominated.
The probabilistic counterpart to Theorem 5 holds, subject to the same conditions as in Theorem1. If the cost of change or uncertainty exceeds the distributional yolk radius, then stability existswith probability 1 as the population increases. Similarly, if the distributional yolk radius is smallerthan the finest precision of the available computation, or smaller than half the perceptual threshold,then equilibrium exists w.p.1 asymptotically.
Theorem 6: Let µ be probability measure with distributional yolk radius r(µ), and let µ satisfyone of the regularity conditions (i–iii). Let a population of n ideal points be sampled independentlyfrom µ. Suppose Model I holds with ε > r(µ), or Model II holds with ε > 2r. Then there is stabilityas n→∞ w.p.1.
Proof: See appendix.
We wish to find a result similar to Theorem 6 that applies to Model III. The Simpson-Kramermin-max majority is a natural counterbalance to employ with Model III, since both are multi-plicative effects on the voting population. Suppose α < p/(p + q), whence p(1 − α) > qα. Thequantity p(1− α) is a lower bound on the expected fraction of the population which votes for theincumbent; the quantity qα is an upper bound on the fraction voting for the challenger. Thus itis plausible that the incumbent would be undominated. Theorem 7 makes this argument precise.
Theorem 7: Let µ be a probability measure on <m. Suppose x ∈ Mα(µ). Let a population of nideal points be sampled independently from µ. Suppose Model III holds and α < p/(p+ q). Then xwill be an equilibrium point with probability 1 as n→∞. (In particular, α∗ < p/(p+q) guaranteesequilibrium w.p.1 as the population increases.)
Proof: see Appendix. This proof does not require any of the regularity conditions (i–iii).
5 Empirical issues
We began this study as an attempt to reconcile real-world observations with the theoretical pre-dictions of the spatial model. We have argued for the plausibility and broad justifiability of severalslight modifications of the model, and proved that any of these suffices to restore stability. Thishelps establish the enriched models as legitimate theories to explain observed stability. However,there are several important further steps that must be taken.
13

First, the results herein are asymptotic. They do not assume an infinite population (see [71] foran explanation of the finite sample method employed here), but they do assume a large population.Often what we would like to know is, for instance, how likely is stability in a population of 9, or101? This is where the simulation results of Koehler and Brauninger cited earlier [32, 33, 8] addto the theoretical arguments put forward here.
We now seek stronger empirical validation of our models. Theorems 5 and 6 suggest one kindof test: estimate for example the “cost of change,” or precision level, and the yolk radius, andcheck to see if stability was observed.
There are no statistical tests available to determine whether a sample derives from a centereddistribution. These measures suggest the following kind of test: calculate the sample r(µn) orα∗(µn), and compare the value with 0 or 1/2, respectively. The comparison would have to takeinto account other parameters: n, the sample size, and in the case of r some measure of distance(e.g. the mean distance between sample points) to make the test scale-invariant. Constructinga good test may be difficult or not possible. In any case, a first step would be to establish theconsistency of the “estimators” r and α∗. That is, we would like to be sure that
limn→∞
r(µn)→ r(µ) a.s. (1)
andlimn→∞
α∗(µn)→ α∗(µ) a.s. (2)
The latter convergence (2) has been established by [9] for continuous bounded functions ondomains of compact support, and by [71] in the general case. As a by-product of Theorem 6,Corollaries 6.1 and 6.2 following prove (1), subject to a regularity condition.
Corollary 6.1:Under the hypotheses of Theorem 6, lim supn r(µn) ≤ r(µ), a.s.Corollary 6.1 is one side of the convergence needed to establish the consistency of the yolk radius
statistic. Under additional conditions, the proof also gives the lim inf side of the convergence, whichcombines with 6.1 to give consistency (1), stated next.
Corollary 6.2:Under the hypotheses of Theorem 6, and the additional condition that µ iscontinuous and strictly positive in the region of its support, limn r(µn) = r(µ), a.s.
The additional condition of Corollary 6.2 may seem unnecessarily strong to the reader. How-ever, regularity condition (i) is not sufficient for the convergence (1). A simple counterexampleis two points, each with mass 1/2. A simple two-dimensional counterexample is four points atthe vertices of a rectangle, each with probability 1/4. In this case we calculate lim infn r(µn) =1/(2 +
√2) < 1/2 = lim supn r(µn). If the rectangle is made into a trapezoid, the ratio between
the lim sup and the lim inf can be made as large as desired.A stronger test would be to check if the societal outcome falls within the “solution set” of the
model. If a model passes this stronger test, then it would appear to have good predictive power.In the case of Model I, experimental work of Salant and Goodstein [57] provides very promis-
ing test results. Salant and Goodstein conduct a series of experiments on committee voting undermajority rule, and find that the committees often choose alternatives other than the core (un-dominated point), even when the core coincides with a unique Nash equilibrium in undominatedstrategies. To reconcile the experimental results with the theory, they modify the model by as-suming that agents will only vote for a new alternative if its utility exceeds the incumbent’s by
14

at least some nonzero threshold amount. This is of course identical to Model I.3 With the ε-coresolution concept Salant and Goodstein reconcile the outcomes of their experiments. They also areable to explain the outcomes of the Fiorina and Plott [24] and Eavey and Miller [17] experiments,which had previously been regarded as structurally different [57, p. 296]. Some other corrobora-tive evidence for Model I is given by Herzberg and Wilson [28], where they find the ε-core at leastnot inconsistent with experimental data. It would be interesting to have similar tests on the othermodels proposed here.
There is considerable methodological work remaining, as well. Each solution concept bringswith it the joint questions of computation and statistical estimation. For the yolk, the algorithmof [68] handles the computational question, and Theorem 6.1 in this paper makes a start at the es-timation question. For the Simpson-Kramer min-max set, [69] provides an efficient computationalmethod; as stated the asymptotic consistency is established in [9, 71]. Similar work is called forwith respect to the solution concepts of Models I and II. In all these cases, more work remains onestimating variances to incorporate into valid statistical tests and confidence intervals.
6 Extensions and related work
6.1 Extension from Euclidean to Intermediate Preferences
We extend most of the results of the paper from Euclidean preferences to the much more generalclass of intermediate preferences. This class, introduced by Grandmont [25], is characterized bythe “division by hyperplane property”: the bisecting hyperplane of segment ab separates the voterswho prefer a to b from those who prefer b to a. This class includes the C.E.S. (constant elasticityof substitution) utility functions and is a tad more general than the “linear preferences” of [10](see this article for several nice illustrations of the richness of this class).
All the definitions and models extend without change, except for Models I and V. Model I isspecial because it is stated in terms of Euclidean distance but Assumption I is about utilities. Inthe general case we now treat, utilities and distance no longer correspond4. We define an extendedmodel as follows, where U [x] denotes the (static) utility of alternative x.
Model I ′: For some ν > 0, agents will vote for an alternative c to incumbent proposal a only ifthey determine that U [c] > U [a] + ν.
Models I ′ and V implicitly assume individual preferences are representable by a utility function.To extend the results to these models, we moreover assume continuity of these utilities.
Assumption: Continuous Utilities: Each voter v has (static) preferences which are repre-sentable by a continuous utility function Uv[a], a ∈ <m.
Theorem 8 extends all the results in the paper to intermediate preferences, except for Theorems5 and 6 in the case of Model I ′.
3Salant and Goodstein describe their threshold assumption (page 295) as a slight weakening of the rationalityhypothesis. As argued in 4.1.1, the threshold assumption can also be viewed as perfectly rational in a great manysituations, e.g. in the presence of a cost of change, even if that cost be psychological, or the presence of a benefitto adjournment.
4Model I, unmodified, makes mathematical sense. But I don’t think it is a meaningful model when preferencesare non-Euclidean.
15

Theorem 8: Extend Models I ′,II–VI to intermediate preferences. For Models I ′ and V, furtherassume Continuous Utilities. Then Theorems 1,2,3,4,and 7 remain true. Theorems 5 and 6 remaintrue in the case of Model II.Proof: The proofs of Theorems 1, 2 (Model II), 3, 4 (Model VI), 5 and 6 (Model II), and 7 allapply to the extended class without change. To prove Theorem 1 for the case of Model I ′, letν > 0 be given. By Continuous Utilities at the origin, there exists ε > 0 such that
||x|| < ε⇒ |Uv[x]− Uv[0]| < ν ∀v ∈ V. (3)
(We get uniform continuity for free since |V | is finite.)Under the assumption of the model, no alternative with ε of the origin will be selected by any
voter. Now we satisfy the condition of Model II, and Theorem 1 for that case applies. The proofof Theorem 4 for the case of Model V is supplemented in precisely the same way5.
It would be interesting to further extend some of the results, particularly Corollary 1, to evenmore general classes of preferences, e.g. the continuous class treated in [56]. It is not clear how toformulate such a generalization in a natural yet mathematically proper fashion.
We can weaken the assumption of Model I, to assume that only alternatives at distance greaterthan ε from the status quo are preferred only if they are at least ε closer to the ideal point. Inthis model, the proof of Theorem 1 carries through, under the stronger condition of µ sphericallysymmetric. Perhaps a different method of proof would yield equilibrium under a weaker condition.
6.2 Probabilistic considerations
There are many reasons to include a probabilistic element in a model of social choice. Theseinclude variations in individual behavior, use of data from a sample of the population (e.g. anysurvey or poll data), uncertainty and inaccuracy of information. The models in this paper areprobabilistic, but are nonetheless wedded to the classic deterministic Euclidean spatial model.The probabilistic element enters when V is sampled. Once V is determined, what takes place isdeterministic. If we compare the models here with other more deeply probabilistic models, wefind some very interesting differences and similarities. For purposes of discussion, we consider apaper on spatial competition by De Palma et al.[15], and a related paper on spatial voting byEnelow and Hinich [19]. In [15] Hotelling’s principle of minimum differentiation is restored byintroducing a “large enough” unobserved probabilistic heterogeneity in consumer tastes; in [19]equilibrium is restored by introducing a “large enough” unobserved probabilistic element to voterutility calculations (see also [18]). In both cases, a competitive equilibrium between two location-seeking entities (firms, candidates) is sought. This contrasts with the goal of a core point in thiswork.
A more important contrast lies in how probability enters the model. In both [19, 15] theEuclidean rule of selecting the alternative at least distance is altered so that a consumer or voterselects between two alternatives with probabilities weighted by a function of the distances. Whenthe alternatives are equidistant, the probabilities are equal; when the alternatives are almost
5Theorems 5 and 6 do not work for Model I ′ because the yolk radius needs to be compared with the ε of (3),which is a function of ν, rather than with ν itself. If we strengthen the Continuous Utilities assumption to, say,uniformly Lipschitz continuous with constant K, we easily get extensions of Theorems 5 and 6 to Model I wherethe yolk radius is multiplied by K.
16

equidistant, the probabilities are almost equal. This modification eliminates discontinuities in thegain (profit,votes) function [15, pages 771–772], and continuity is essential to the existence of acompetitive equilibrium solution to the positioning problem.
In contrast, the probabilistic element invoked here is not sufficient, by itself, to reinstatestability. Indeed, for all of Models I–VI, if ε = 0 then there is no stability a.e., as shown in thecompanion paper [71] (except the 2-D n even case, where the instability is asymptotic). Moreoverthe instability occurs precisely because of the discontinuity of the associated functional.
Also, the probabilistic assumptions of [15, 19] are ineluctably probabilistic, because no singlefixed configuration, in any number of additional dimensions, will deterministically provide thebehavior of these models for all pairs of locations chosen by the firms or candidates. Thus theproduct differentiation in [15] is not due to a fixed though unknown set of additional coordinates.Rather, the customer actions have inherent randomness in that model.
Therefore the models we are comparing are not equivalent, and cannot be made so. Note theresults in this paper remain meaningful in the presence of random behavior, because Theorems2–4,6,7 actually construct a specific point, prior to the sampling, which will be undominated a.s.
Despite the inherent differences in the models, there is an important qualitative similarity in theoutcomes, that sufficiently large µ, σ2, and ε, respectively, restore equilibrium. In particular, theσ2 value in [19] is intended to capture some of the same effects as ε here. The comparison suggestsa question: can the finite sample method be adapted to find a finite population restoration of theprinciple of minimum differentiation? In the product placement model, the firms will probablyhave a greater cost of change than the consumers, because start-up production costs are typicallyvery high. This issue is also attractive because data on these costs should be readily available;this would make empirical verification more practicable.
7 Appendix: Proofs of stability theorems 1–4, 6–7
The proofs all take the following form:
1. Define a class S of subsets sx(ε) ⊂ <m, parameterized by ε > 0 and x ∈ <m, ||x|| = 1.Members of the class may be halfspaces, for example. To dislodge the incumbent, morethan half the population sample must fall into sx(ε) for some x. Equivalently, the empiricalmeasure µn would have to satisfy µn(sx(ε)) > 1/2 for some x.
2. Given arbitrary ε > 0, show there exists δ > 0 such that for all x, µ(sx(ε)) ≤ 1/2− δ.
3. Verify properties of the class S to invoke convergence theorems of stochastic processes andfind that
supx|µn(sx(ε))− µ(sx(ε)| → 0a.s.
In particular, the greatest deviation of the empirical measure will eventually drop and staybelow δ/2, with probability 1. Therefore, given ε > 0, there exists δ > 0 such that withprobability 1,
∀x, µn(sx(ε)) ≤ 1/2− δ/2 < 1/2
eventually as n → ∞. Combining this with step 1 implies that the incumbent cannot bedislodged as n→∞ w.p.1.
17
The class S constructed in step 1 will vary depending on the modification to the model.We will repeatedly call on Lemmata 1 and 2, following, to accomplish steps 2 and 3, respectively.
One preliminary definition will be needed.
Definition. A probability measure µ on <m is r-centered at 0 iff every hyperplane h at distance> r from 0 satisfies µ(h+) < 1/2. When r = 0 the distribution µ is centered. More generally r is
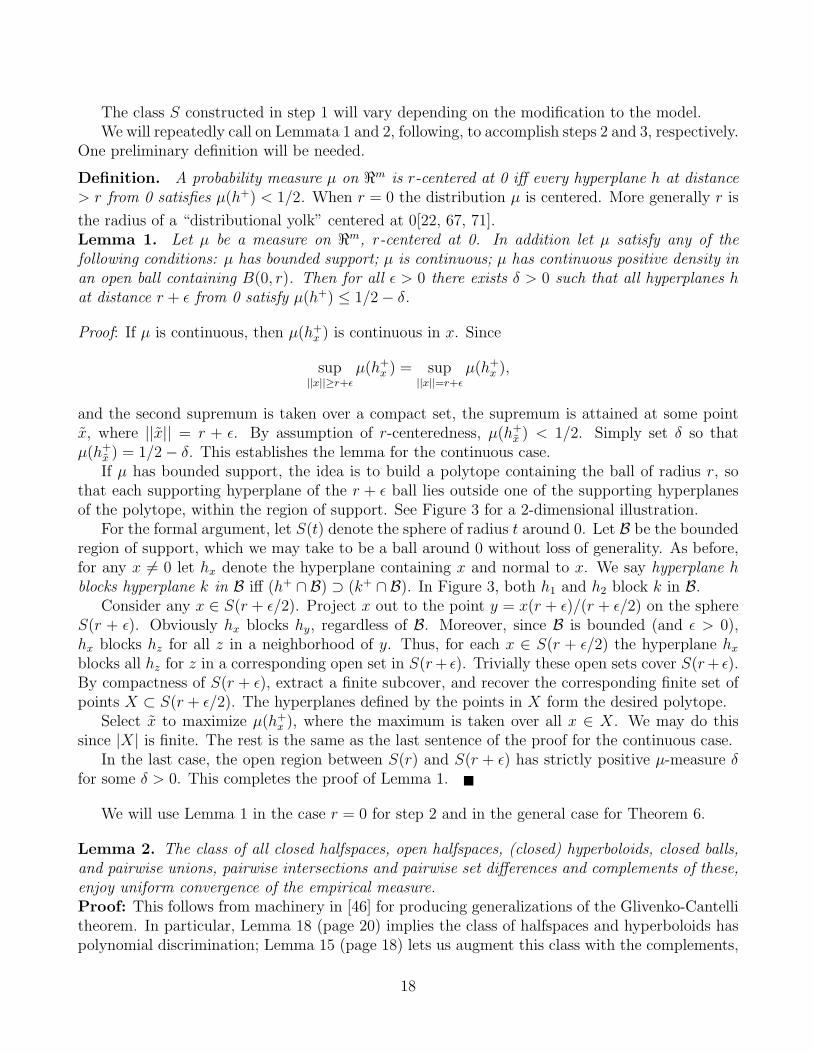
the radius of a “distributional yolk” centered at 0[22, 67, 71].Lemma 1. Let µ be a measure on <m, r-centered at 0. In addition let µ satisfy any of thefollowing conditions: µ has bounded support; µ is continuous; µ has continuous positive density inan open ball containing B(0, r). Then for all ε > 0 there exists δ > 0 such that all hyperplanes hat distance r + ε from 0 satisfy µ(h+) ≤ 1/2− δ.
Proof: If µ is continuous, then µ(h+x ) is continuous in x. Since
sup||x||≥r+ε
µ(h+x ) = sup
||x||=r+εµ(h+
x ),
and the second supremum is taken over a compact set, the supremum is attained at some pointx, where ||x|| = r + ε. By assumption of r-centeredness, µ(h+
x ) < 1/2. Simply set δ so thatµ(h+
x ) = 1/2− δ. This establishes the lemma for the continuous case.If µ has bounded support, the idea is to build a polytope containing the ball of radius r, so
that each supporting hyperplane of the r + ε ball lies outside one of the supporting hyperplanesof the polytope, within the region of support. See Figure 3 for a 2-dimensional illustration.
For the formal argument, let S(t) denote the sphere of radius t around 0. Let B be the boundedregion of support, which we may take to be a ball around 0 without loss of generality. As before,for any x 6= 0 let hx denote the hyperplane containing x and normal to x. We say hyperplane hblocks hyperplane k in B iff (h+ ∩ B) ⊃ (k+ ∩ B). In Figure 3, both h1 and h2 block k in B.
Consider any x ∈ S(r + ε/2). Project x out to the point y = x(r + ε)/(r + ε/2) on the sphereS(r + ε). Obviously hx blocks hy, regardless of B. Moreover, since B is bounded (and ε > 0),hx blocks hz for all z in a neighborhood of y. Thus, for each x ∈ S(r + ε/2) the hyperplane hxblocks all hz for z in a corresponding open set in S(r+ ε). Trivially these open sets cover S(r+ ε).By compactness of S(r + ε), extract a finite subcover, and recover the corresponding finite set ofpoints X ⊂ S(r + ε/2). The hyperplanes defined by the points in X form the desired polytope.
Select x to maximize µ(h+x ), where the maximum is taken over all x ∈ X. We may do this
since |X| is finite. The rest is the same as the last sentence of the proof for the continuous case.In the last case, the open region between S(r) and S(r + ε) has strictly positive µ-measure δ
for some δ > 0. This completes the proof of Lemma 1.
We will use Lemma 1 in the case r = 0 for step 2 and in the general case for Theorem 6.
Lemma 2. The class of all closed halfspaces, open halfspaces, (closed) hyperboloids, closed balls,and pairwise unions, pairwise intersections and pairwise set differences and complements of these,enjoy uniform convergence of the empirical measure.Proof: This follows from machinery in [46] for producing generalizations of the Glivenko-Cantellitheorem. In particular, Lemma 18 (page 20) implies the class of halfspaces and hyperboloids haspolynomial discrimination; Lemma 15 (page 18) lets us augment this class with the complements,
18
and ensuing pairwise unions and intersections. Additional discussion of this methodology is givenin [71] Recall that µn represents the empirical measure, which places weight 1/n at each of then sample points. That is, let V = v1, · · · , vn denote the sample of n points taken independentlyfrom µ. Then µn(T ) =
∑ni=1 Ivi∈T/n.
Theorem 14 (page 18) then tells us that over this large class S the empirical measure convergesto the measure µ:
supS∈S|µn(S)− µ(S)| → 0 a.s. (4)
Now we prove Theorem 1, which states that in Models I and II, a centered distribution willhave an undominated point with probability 1, as the population grows.
Theorem 1: Let n voter ideal points be sampled independently from a centered distribution µ on<m, satisfying one of the regularity conditions (i-iii). Suppose simple majority rule is employed,with Euclidean preferences and subject to Model I or II. Then with probability 1, as n→∞, thereis an undominated point with respect to the sample configuration. (Moreover the center of µ canbe taken to be that point).
Proof: Let 0 be the center of µ without loss of generality. We first consider Model I. Let ε > 0 begiven with respect to Model I. Voter v will select y ∈ <m over incumbent 0 iff ||v − y||+ ε < ||v||.(Here || || indicates the Euclidean norm.)
Accordingly letsy(ε) = x ∈ <m : ||x− y||+ ε < ||x||
If a voter’s ideal point is in sy(ε), the voter will prefer y to the incumbent 0. Thus 0 will beundominated if
µn (sy(ε)) < 1/2 ∀y ∈ <m. (5)
That is, no alternate proposal y can muster 1/2 of the sample population’s support against0. For any y 6= 0, let hy(ε) denote the hyperplane normal to y, passing through εy/||y|| (i.e., atdistance ε from 0). See Figure 2. The hyperboloid sy(ε) is necessarily contained in the halfspaceh+y (ε). Hence,
supy∈<m
µn(sy(ε)) ≤ supy∈<m
µ(h+y (ε)) (6)
Apply Lemma 1 with r = 0. So there exists δ > 0 such that
supy 6=0
µ(h+y (ε)) ≤ 1/2− δ (7)
The halfspaces h+y (ε) are contained in the class S of Lemma 2 By Lemma 2, as n → ∞, we
have6
supy 6=0|µn(h+
y (ε))− µ(h+y (ε))| → 0 a.s. (8)
In particular, consider the value δ/2 > 0. The convergence implies that as n→∞,
supy 6=0|µn(h+
y (ε))− µ(h+y (ε))| < δ/2 a.s. (9)
6Actually, Lemma 2 shows uniform convergence for the class sy(ε) as well.
19

Substituting inequality (7) into (9) implies as n→∞,
supy 6=0|µn(h+
y (ε))| < 1/2− δ/2 < 1/2, w.p.1,
which by inequalities (5) and (6) proves the theorem for Model I.We now turn to Model II. For notational convenience, let 2ε > 0 denote the threshold value
of Model II. Hence ||y|| ≥ 2ε. The voter v will prefer y iff v is in the halfspace h+y (||y||/2). This
halfspace is contained in the halfspace h+y (ε). Now we are in exactly the same situation as at
inequality (6) in the proof of Model I, which completes the proof.
The uniform convergence means we may take Ω as the set of all infinite sequences of points in<m, with measure derived from µ.
Proof of the claim for Proposition 2: If there existed a PDA that could compute these dif-ferences, even in two dimensions, then for arbitrary (a1, a2), (v1, v2), (c1, c2) it could determine if(a1−v1)
2 +(a2−v2)2−(c1−v1)
2 +(c2−v2)2 ≤ 0. Then under closure properties of the context-free
languages (and their equivalence to those accepted by PDAs), there would exist a PDA that couldrecognize strings of form (w, x, y, z : w2 + x2 = y2 + z2). But this contradicts the pumpinglemma for PDAs [63]. This establishes the claim.
Theorem 3:Let n voter ideal points be sampled independently from a centered distribution µ on<m. Suppose simple majority rule is employed, with Euclidean preferences modified as in ModelIII or IV. Then with probability 1, as n → ∞, there is an undominated point with respect to thesample configuration.
Proof: Consider the class C of halfspaces h+0 (x) generated by hyperplanes h(x) through 0, normal
to x ∈ <m. Since C ⊂ S, Lemma 2 implies that
supx|µn(h+(x))| ≤ 1/2
For any δ > 0, the incumbent will be preferred by at least (1/2−δ)n members of the population,in the limit w.p.1. Let q > p from Model III be given. Select positive δ < (q − p)/[4− 2(p + q)].According to Model III, the incumbent will receive at least ∼ (1−p)(1/2−δ)n votes; the challengerwill receive no more than ∼ (1 − q)(1/2 + δ)n votes. (Here we are implicitly relying on theexponentially small tails of the binomial distribution to substitute the expected number of non-abstaining votes for the random number who will actually vote. — see the proof of Theorem 7 fordetails.) Algebra shows that (1− p)(1/2− δ) > (1− q)(1/2 + δ). Therefore the incumbent receivesmore votes than the challenger. This establishes equilibrium under Model III.
Similarly, under Model IV, with probability 1 nearly 1/2 the voters prefer the incumbent,and the extra Ω(n) support is enough to maintain 0 in equilibrium. This completes the proof ofTheorem 3.
An additional nondegeneracy assumption is required for the proof of Theorem 4. The assump-tion amounts to the requirement that the location or utility of the center of the distribution doesnot fall at an exact midpoint between two allowable discrete values. This condition holds with
20
probability 1 if the center of the distribution is independent of the base value of the discretiza-tion. Thus it is an exceedingly mild assumption which however we make explicit for the sake ofmathematical rigour.Nondegenerate Normalization Condition. Let c be the center of the distribution µ. For ModelV: the utility functions Uv of the voters v are normalized at c such that Uv(c)/ν − bUv(c)/νc =η 6= 1/2. For Model VI: the coordinates of the center satisfy ci/ν − bci/νc 6= 1/2, i = 1, · · · ,m.
Theorem 4: Let n voter ideal points be sampled independently from a centered distribution µ on<m, satisfying one of the regularity conditions (i-iii). Suppose simple majority rule is employed,with Euclidean preferences and subject to Model V (resp. VI) and the corresponding nondegeneratenormalization condition. Then with probability 1, as n→∞, there is an undominated point withrespect to the sample configuration.
Proof (Model V): To start we make the discretized utility function precise. Let the utility functionand its discretization be denoted U and DU , respectively. Let DU be found by rounding. Thus ifU [a] = wν (w not necessarily integer), then DU [a] = bw + 1/2cν.
Let the center of the distribution be c. Now let ε = DU [c] + ν/2 − U [c]. The nondegeneratenormalization condition guarantees ε > 0. This transforms the situation into an equivalence withModel I, and the rest follows from Theorem 1.Proof (Model VI): This case is not immediately equivalent to Model II because we cannot knowthat the distribution center c is a member of the lattice of admissible proposals. In other words,once we assume 0 is an admissible proposal, we cannot assume 0 is the distribution center withoutloss of generality. It will be more convenient in the proof to do the converse: we take c = 0 withoutloss of generality, and shift the lattice instead. Formally, let the lattice of admissible proposals bedenoted L ≡ β + νx : x ∈ Zn. Here β is some fixed point in <m.
Each coordinate value of β can be taken to be in the interval [0, ν), since adding integermultiples of ν does not affect the definition of L. The nondegenerate normalization conditionensures in addition that βi 6= 1/2 ∀i. Define c, the discretized center of µ, as
ci = βi if βi < ν/2
βi − ν if βi > ν/2
Our goal now is to show that the discretized center c is undominated. For any other latticepoint y ∈ L, y 6= c, let hy(c) denote the hyperplane bisecting the segment yc (normal to y − c,passing through (y + c)/2). Of the two halfspaces defined by hy(c), let h+
y (c) denote the onecontaining y. By the triangle inequality, c = 0 is closer to c than to y. So 0 6∈ h+
y (c). Let ε > 0equal the minimum distance from 0 to hy(c), over all y ∈ L, y 6= c. This minimum exists becauseit is attained at some y : |yi| ≤ 2ν.
If c is the incumbent proposal, each feasible alternative proposal receives support from votersin a halfspace at least ε from 0, the true center of the distribution µ. This situation is identicalto that of Model II, and the rest follows from Theorem 1. This completes the proof of Theorem4.
Proof of Theorem 6: Take the yolk center c = 0 without loss of generality. Let ∆ = (ε − r)/2(respectively (ε/2 − r)/2 for the case of Model II.) Given ∆ > 0, apply Lemma 1 to find δ > 0
21

such that all hyperplanes at distance r + ∆ from 0 satisfy µ(h+) < 1/2 − δ. Note r + ∆ < ε(respectively r + ∆ < ε/2).
By Lemma 2, w.p.1 for all these hyperplanes µn(h+) < 1/2 − δ/2 eventually as n increases.Then all median hyperplanes of the empirical measure (i.e. the finite sample configuration) are atdistance less than ε (resp. ε/2) from 0. Apply Theorem 5 to complete the proof.
As a consequence of the proof, a ball of radius ε centered at 0 would intersect all medianhyperplanes. This implies that eventually, the sample yolk radius will satisfy r(µn) ≤ ε. Sincethis is true for all ε > r(µ), we conclude that lim supn→∞ r(µn) ≤ r(µ) a.s.
Now we make the additional assumption of Corollary 6.2, that µ is positive and strictlycontinuous in its region of support. Then for any δ > 0, there exists ∆ > 1/2 such thatall the hyperplanes h at distance r(µ) + δ from 0 have mass at least ∆ in the closed halfs-pace they define, i.e. µ(h−) ≥ ∆ > 1/2. So by the same argument as above, we conclude thatlim infn→∞ r(µn) ≥ r(µ) a.s. This inequality combined with Corollary 6.1 proves Corollary 6.2.
Theorem 7: Let µ be a probability measure on <m. Suppose x ∈ Mα(µ). Let a population of nideal points be sampled independently from µ. Suppose Model III holds and α < p/(p + q). Thenx will be an equilibrium point with probability 1 as n→∞.Proof of Theorem 7: To start we simply count supporters, ignoring the issue of abstention. By theconvergence of the min-max majority [9, Theorem 3](continuous case), [71, Theorem 6](generalcase), (this also follows easily from Lemma 2), x ∈ Mα(µ) implies that w.p.1, the fraction ofpopulation x will muster against all alternatives converges to 1− α or more. This does not meanthat x will have the support of precisely n(1−α) or more voters (i.e. that x will be an α-majoritywinner, see [71]). But it does mean that for any δ > 0, x ∈Mα+δ(µn) eventually as n→∞ w.p.1.That is, eventually x will be a (α + δ)-majority winner, in the sample configuration, w.p.1.
In the preceding paragraph, we were counting supporters rather than votes. Now we takeabstentions into account. Fix δ > 0 with a value to be determined later. Assume all statementsin this paragraph are modified by the phrase “eventually as n → ∞, with probability 1.” Theincumbent x gets at least n(1 − α − δ) supporters. Therefore x receives a number of votes(stochastically) greater than or equal to a random variable X distributed according to a binomialdistribution B[n(1 − α − δ), p] (success probability p, with n(1 − α − δ) trials.) Out of the nmembers of the population c gets at most n(α + δ) supporters, and receives votes stochasticallyless than random variable C distributed as B[n(α + δ), q].
Our hypothesis is (1− α)p > qα. Hence there exists δ > 0 such that (1− α− δ)p > q(α + δ).This determines δ > 0 as promised. We now have two binomially distributed variables, X and C,with expected difference proportional to n, namely:
[(1− α− δ)p− (α + δ)q]n.
By the Chernoff bounds [66] or other bounds on tail probabilities of the binomial distribution[21], the value of X will exceed the value of C almost surely as n→∞. This completes the proofof Theorem 7.
22

References
[1] James Adams, Samuel Merrill III, and Bernard Grofman. A Unified Theory of Party Com-petition. Cambridge University Press, Cambridge, 2005.
[2] Stephen D. Ansolahebere and Jr. James M. Snyder. Valence politics and equilibrium in spatialelection models. Public Choice, 103:327–336, 2000.
[3] Kenneth Arrow. Tullock and an existence theorem. Public Choice, 6:105–112, 1969.
[4] David Austen-Smith and Jeff Banks. Information aggregation, rationality, and the condorcetjury theorem. American Political Science Review, 90:34–45, 1996.
[5] Jeffrey S. Banks, John Duggan, and Michel Le Breton. Social choice and electoral competitionin the general spatial model. Journal of Economic Theory, 126:194–234, 2006.
[6] John J. Bartholdi, N. Narasimhan, and Craig A. Tovey. Recognizing majority-rule equilibriumin spatial voting games. Social Choice and Welfare, 8:183–197, 1991.
[7] D. Black. The Theory of Committees and Elections. Cambridge University Press, Cambridge,1958.
[8] Thomas Brauninger. Stability in spatial voting games with restricted preference maximizing.Journal of Theoretical Politics, 19:173–191, 2007.
[9] Andrew Caplin and Barry Nalebuff. On 64% majority rule. Econometrica, 56, 1988.
[10] Andrew Caplin and Barry Nalebuff. Aggregation and social choice: A mean voter theorem.Econometrica, 59:1–24, 1991.
[11] George B. Dantzig. Linear Programming and Extensions. Princeton University Press, Prince-ton, New Jersey, 1963.
[12] Otto Davis, Melvin J. Hinich, and Peter Ordeshook. An expository development of a mathe-matical model of the electoral process. American Political Science Review, 64:426–448, 1970.
[13] Otto A. Davis, Morris H. DeGroot, and Melvin J. Hinich. Social preference orderings andmajority rule. Econometrica, 40:147–157, 1972.
[14] Otto A. Davis and Melvin J. Hinich. A mathematical model of policy formation in a demo-cratic society. In J.L. Berndt, editor, Mathematical Applications in Political Science II. South-ern Methodist University, Dallas, 1966.
[15] A. De Palma, V. Ginsburgh, Y.Y.Papageorgiou, and J.-F. Thisse. The principle of minimumdifferentiation holds under sufficient heterogeneity. Econometrica, 53(4):767–781, July 1985.
[16] A. Downs. Economic Theory of Democracy. Harper and Row, New York, 1957.
[17] C. Eavey and G. Miller. Fairness in majority rule games with a core. American Journal ofPolitical Science, 28:570–586, 1984.
23

[18] James Enelow and Melvin Hinich. The Spatial Theory of Voting. Cambridge University Press,Cambridge, 1984.
[19] James Enelow and Melvin Hinich. A general probabilistic spatial theory of elections. PublicChoice, 61:101–113, 1989.
[20] S.L Feld and B. Grofman. Incumbency advantage, voter loyalty, and the benefit of the doubt.Journal of Theoretical Politics, 1991. to appear.
[21] William Feller. An Introduction to Probability Theory and its Applications. John Wiley, NewYork, 1965.
[22] John A. Ferejohn, Richard McKelvey, and Edward Packel. Limiting distributions for contin-uous state markov models. Social Choice and Welfare, 1:45–67, 1984.
[23] Leon Festinger. A Theory of Cognitive Dissonance. Stanford University Press, Stanford,California, 1957.
[24] M. Fiorina and Charles Plott. Committee decisions under majority rule: An empirical study.American Political Science Review, 72:575–598, 1978.
[25] Jean-Michel Grandmont. Intermediate preferences and the majority rule. Econometrica,46:317–330, 1978.
[26] Tim Groseclose. A model of candidate location when one candidate has a valence advantage.American Journal of Political Science, 45:862–886, 2001.
[27] Ronald M. Harstad and Michael H. Rothkopf. Enriched modelling of english auctions. Techni-cal Report 33-89, RUTCOR, Rutgers University, New Brunsick, New Jersey 08903, September1989.
[28] Roberta Herzberg and Rick Wilson. Costly Agendas and Spatial Voting Games: Theory andExperiments on Agenda Access Costs. Ann Arbor: University of Michigan Press, 1991.
[29] Gabriel Horn, Alister U. Nicol, and Malcolm W. Brown. Tracking memory’s trace. Proc.National Academy Science.
[30] Gyung-Ho Jeong. Testing the predictions of the multidimensional spatial voting model withroll call data. Political Analysis, 16:179–196, 2008.
[31] David S. Johnson and F.P. Preparata. The densest hemisphere problem. Theor. Comput.Sci., 6:93–107, 1978.
[32] David H. Koehler. The size of the yolk: Computations for odd and even-numbered commit-tees. Social Choice and Welfare, 7:231–245, 1990.
[33] David H. Koehler. Convergence and restricted preference maximizing under simple majorityrule: Results from a computer simulation of committee choice in two-dimensional space.American Political Science Review, 95:155–167, 2001.
24

[34] Alexander Kovalenkov and Myrna Holtz Wooders. Epsilon cores of games with limited sidepayments: Nonemptiness and equal treatment. Games and Economic Behavior, 36:193.
[35] Gerald H. Kramer. A dynamical model of political equilibrium. Journal of Economic Theory,16:310–334, 1977.
[36] Jean-Francois Laslier and Jorgen Weibull. Committee decisions: Optimality and equilibrium.Working Paper, Ecole Polytechnique, 2008.
[37] John O. Ledyard. The pure theory of large two-candidate elections. Public Choice, 44:7–41,1984.
[38] James V. McConnell. Memory transfer through cannibalism in planarium. Journal of Neu-ropsychiatry, 3(s1):542–548, 1962.
[39] Richard D. McKelvey. Intransitivities in multidimensional voting models and some implica-tions for agenda control. Journal of Economic Theory, 12:472–482, 1976.
[40] Richard D. McKelvey. General conditions for global intransitivies in formal voting models.Econometrica, 47:1085–1112, 1979.
[41] Richard D. McKelvey. Covering, dominance, and institution free properties of social choice.American Journal of Political Science, 30:283–314, 1986.
[42] Richard D. McKelvey and Norman J. Schofield. Generalized symmetry conditions at a corepoint. Econometrica, 55:923–933, 1987.
[43] Anthony E. Myatt and Gregory Young. Interest rates and inflation: Uncertainty cushions,threshold and ‘patman’ effects. Eastern Economic Journal, 12(2):103–114, April–June 1986.
[44] Abraham Neyman. Bounded complexity justifies cooperation in the finitely repeated prison-ers’ dilemma. manuscript, 1985.
[45] Charles Plott. A notion of equilibrium and its possibility under majority rule. AmericanEconomic Review, 57:787–806, 1967.
[46] David Pollard. Convergence of Stochastic Processes. Springer-Verlag, New York, 1984.
[47] Keith Poole and Howard Rosenthal. Spatial realiignment and the mapping of issues in Amer-ican history: the evidence from roll call voting. Technical report, Ann Arbor, Michigan,U.S.A.
[48] Keith Poole and Howard Rosenthal. Patterns of congressional voting. American Journal ofPolitical Science, 35:228–278, 1991.
[49] Keith Poole and Howard Rosenthal. D-nominate after 10 years: An update to congress: Apolitical-economic history of roll call voting. Legislative Studies Quarterly, 26:5–29, 2001.
[50] Keith Poole and Richard Smith.
25

[51] G. Rabinowitz and E. McDonald. The power of the states in U.S. presidential elections.American Political Science Review, 80:65–89, 1986.
[52] A. Rapoport and E. Golan. Assessment of political power in the Israeli Knessett. AmericanPolitical Science Review, 79:673–692, 1985.
[53] Michael H. Rothkopf and Richard Engelbrecht-Wiggans. Innovative approaches to competi-tive mineral leasing. Technical Report 42-89, RUTCOR, Rutgers University, New Brunsick,New Jersey 08903, October 1989.
[54] Michael H. Rothkopf and Richard Engelbrecht-Wiggans. Sealed bids vs. open auctions for fed-eral timber: Theory reconsidered and data reinterpreted. Technical Report 7-90, RUTCOR,Rutgers University, New Brunsick, New Jersey 08903, February 1990.
[55] Michael H. Rothkopf, Thomas J. Teisberg, and Edward P. Kahn. Why are vickrey auctionsrare? Journal of Political Economy, 98:94–109, 1990.
[56] Ariel Rubinstein. A note about the ‘nowhere denseness’ of societies having an equilibriumunder majority rule. Econometrica, 47:511–514, 1979.
[57] Stephen W. Salant and Eban Goodstein. Predicting committee behavior in majority rulevoting experiments. RAND Journal of Economics, 21:293–313, 1990.
[58] Norman J. Schofield. Instability of simple dynamic games. Review of Economic Studies,45:575–594, 1978.
[59] Lloyd Shapley and Martin Shubick. Quasi-cores in a monetary economy with non-convexpreferences. Econometrica, 34:805–827, 1966.
[60] Martin Shubik and Myrna Holtz Wooders. Approximate cores of replica games and economies.Mathematical Social Sciences, 6:27–48, 1983.
[61] Herbert A. Simon. Theories of bounded rationality. In C. B. McGuire and R. Radner, editors,Decision and Organization. North-Holland, Amsterdam, 1972.
[62] P. B. Simpson. On defining areas of voter choice. The Quarterly Journal of Economics,83:478–490, 1969.
[63] Michael Sipser. Introduction to the Theory of Computation. MIT Press, 2005.
[64] Judith Sloss. Stable outcomes in majority voting games. Public Choice, 15:19–48, 1973.
[65] Steven Slutsky. Equilibrium under α-majority voting. Econometrica, 47:1113–1125, 1979.
[66] Joel Spencer. Ten Lectures on the Probabilistic Method. SIAM, Philadelphia, 1987.
[67] Craig A Tovey. The almost surely shrinking yolk. Technical Report 150, Center in PoliticalEconomy, Washington University, St. Louis, Mo, October 1990.
26

[68] Craig A. Tovey. A polynomial algorithm to compute the yolk in fixed dimension. MathematicalProgramming, 57:259–277, 1992. Presented at SIAM Symposium on Complexity Issues inNumerical Optimization, March 1991, Ithaca, N.Y.
[69] Craig A. Tovey. Some foundations for empirical study in spatial euclidean social choicemodels. In M. Hinich W. Barnett and N. Schofield, editors, Political Economy: InstitutionsInformation and Competition. Cambridge University Press, Cambridge, U.K., 1993. presentedat the Seventh International Symposium in Economic Theory and Econometrics, May 1991.
[70] Craig A. Tovey. Dynamical convergence in the euclidean spatial model. In Social Choice,Welfare, and Ethics: Proceedings of the Eighth International Symposium on Economics andEconometrics. 1995.
[71] Craig A Tovey. A critique of distributional analysis. This issue. Earlier version released asTechnical Report NPSOR-91-16, Department of Operations Research, Naval PostgraduateSchool, Monterey, Ca 93943, 2009.
[72] Gordon Tullock. The general irrelevance of the general impossibility theorem. The QuarterlyJournal of Economics, 81:256–270, 1967.
[73] Gordon Tullock. Toward a Mathematics of Politics. University of Michigan Press, Ann Arbor,1967.
[74] Gordon Tullock. Why so much stability? Public Choice, 37:189–202, 1981.
[75] Myrna Holtz Wooders. The epsilon core of a large replica game. Journal of MathematicalEconomics, 11:277–300, 1983.
27