the innovation output indicator 2014
TRANSCRIPT
Report EUR 26936 EN
THE INNOVATION OUTPUT INDICATOR 2014
Methodology Report
Dániel Vértesy and Stefano Tarantola
2014

European Commission
Joint Research Centre
Contact information
Daniel Vertesy
Address: Joint Research Centre, Via Enrico Fermi 2749, TP 361, 21027 Ispra (VA), Italy
E-mail: [email protected]
Tel.: +39 0332 783556
Fax: +39 0332 785733
http://www.jrc.ec.europa.eu/
This publication is a Technical Report by the Joint Research Centre of the European Commission.
Legal Notice
This publication is a Technical Report by the Joint Research Centre, the European Commission’s in-house science service.
It aims to provide evidence-based scientific support to the European policy-making process. The scientific output expressed
does not imply a policy position of the European Commission. Neither the European Commission nor any person
acting on behalf of the Commission is responsible for the use which might be made of this publication.
JRC92570
EUR 26936 EN
ISBN 978-92-79-40958-5 (PDF)
ISSN 1831-9424 (online)
doi: 10.2788/836690
Luxembourg: Publications Office of the European Union, 2014
Cover image by Christian Ferrari
© European Union, 2014
Reproduction is authorised provided the source is acknowledged.
Printed in Luxembourg

THE INNOVATION OUTPUT INDICATOR 2014:
METHODOLOGY REPORT
Dániel Vértesy and Stefano Tarantola
(JRC, DDG01)
26 November 2014
The authors gratefully acknowledge the contribution of Richard Deiss (RTD), Veijo Ritola, Luis de la Fuente, Evangelos Pongas, Aleksandra Stawinska and Elisaveta Ushilova (ESTAT) to the fine-tuning of the methodology described in this report.

1
Table of Contents
EXECUTIVE SUMMARY .................................................................................................2
1. INTRODUCTION ...........................................................................................................3
1.1. Measuring innovation output ........................................................................................3
2. HOW TO BUILD THE IOI .............................................................................................5
2.1. The PCT component .....................................................................................................7
Discussion ....................................................................................................................8
2.2. The KIA component .....................................................................................................9
Discussion ..................................................................................................................10
2.3. The COMP component (including GOOD and SERV) ..............................................10
The GOOD component ..............................................................................................10
Discussion ..................................................................................................................11
The SERV component ................................................................................................12
Discussion ..................................................................................................................13
The COMP component ...............................................................................................14
2.4. The DYN component: employment dynamism of high-growth enterprises in
innovative sectors .......................................................................................................15
The innovation coefficient s
scorescore KIACIS )*( ........................................................15
High-growth enterprises (EHG
) ...................................................................................18
Imputation technique for missing values and wider international comparability ......19
Discussion ..................................................................................................................20
2.5. Computing country scores ..........................................................................................21
3. ROBUSTNESS ANALYSIS .........................................................................................24
ANNEX..............................................................................................................................25
List of Acronyms ...............................................................................................................25
Country abbreviations ........................................................................................................26
2
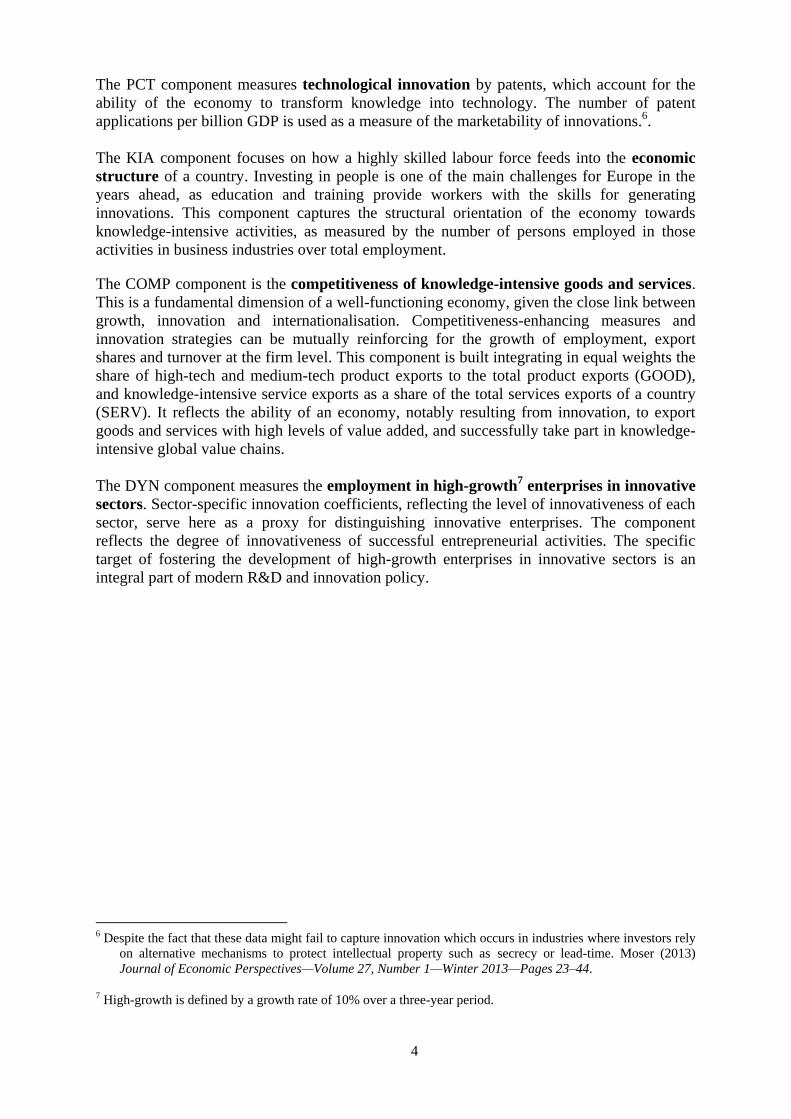
EXECUTIVE SUMMARY
This report presents the methodology followed to compute the 2014 edition of the Innovation
Output Indicator (IOI). The IOI was developed by the European Commission at the request of
the European Council in order to benchmark national innovation policies and to monitor the
EU’s performance against its main trading partners. The IOI was first presented as a
Communication and Staff Working Document1 in 2013, followed by an update in 2014 as
part of the 2014 Commission Report on Innovation Union progress at country level (country
profiles).
The IOI measures the extent to which ideas stemming from innovative sectors are capable of
reaching the market, providing better jobs and making Europe more competitive. It covers
technological innovation, skills in knowledge-intensive activities, the competitiveness of
knowledge-intensive goods and services, and the innovativeness of fast-growing enterprises.
It complements the R&D intensity indicator by focusing on innovation output. It aims to
support policy-makers in establishing new or reinforced actions to remove bottlenecks
preventing innovators from translating ideas into successful goods and services.
The IOI is a composite of four indicators, chosen for their policy relevance, data quality,
International availability and cross-country comparability and robustness. Its four
components are:
technological innovation as measured by patents (PCT);
Employment in knowledge-intensive activities as a percentage of total employment
(KIA);
the average of the share of medium and high-tech goods and services in a countries
export (COMP)
and employment dynamism of fast-growing enterprises in innovative sectors (DYN).
By documenting the methodological considerations underlying the IOI, this technical report
aims to serve as a reference for future updates.
1 European Commission, 2013, Communication from the Commission to the Institutions. Measuring innovation
output in Europe: towards a new indicator COM(2013)624 and SWD(2013)325

3
1. INTRODUCTION
This report illustrates the methodology followed to compute the 2014 edition2 of the
innovation output indicator (indicated with IOI from now on) and shows the ongoing work
being conducted to improve the indicator itself in view of the next publication of the IOI in
summer 2015.
In this report we show the most recent data available for each component indicator, but not
the IOI country scores, as this methodology report is not meant to be a release of the IOI.
The IOI concept was established when the European Council gave the Commission the
mandate to develop an indicator in the context of Europe 20203, to complement the R&D
intensity target4, taking into account the Innovation Union request that the Commission
"launch the necessary work for the development of a new indicator measuring the share of
fast-growing innovative companies in the economy".
To advise the Commission on its formulation, a High-Level Panel of leading innovators and
economists was set up in 2010.5 It prompted the Commission to engage in data collections on
high-growth enterprises in innovative sectors, carried out by Eurostat. In parallel, cooperation
was undertaken with the OECD to develop sectoral innovation coefficients. Discussions with
Member States on the scope and definition of the indicator took place in workshops, in
October and December 2012, and in July 2013.
Finally, the first edition of the IOI was published in the Commission Communication COM
(2013) 624 on 13 September 2013 and a second edition in September 2014. The present
report describes the methodology used in this most recent edition.
1.1. Measuring innovation output
Innovation output is wide-ranging and differs from sector to sector. Measuring it entails
quantifying the extent to which ideas for new products and services, carry an economic added
value and are capable of reaching the market. Therefore, it can be captured by more than one
measure.
The IOI is output-oriented, measures the innovation performance of a country and its
capacity to derive economic benefits from it, captures the dynamism of innovative
entrepreneurial activities, and is useful for policy-makers at EU and national level.
The IOI has four components called PCT, KIA, COMP and DYN, one of which (COMP) is
in turn composed by two sub-indicators, GOOD and SERV.
2 See European Commission (2014) “Research and Innovation performance. Innovation Union progress at
country level 2014”, EUR 26334 EN. URL: [http://ec.europa.eu/research/innovation-union/pdf/state-of-
the-union/2014/iuc_progress_report_2014.pdf]
3 http://ec.europa.eu/europe2020/index_en.htm
4 Conclusions of 4/2/2011 (Council doc. EUCO 2/1/11 REV1) and 1-2/3/2012 (EUCO 4/2/12 REV2)
5 Report of the High Level Panel on the Measurement of Innovation, A. Mas-Colell (Chair), September 2010.
4
The PCT component measures technological innovation by patents, which account for the
ability of the economy to transform knowledge into technology. The number of patent
applications per billion GDP is used as a measure of the marketability of innovations.6.
The KIA component focuses on how a highly skilled labour force feeds into the economic
structure of a country. Investing in people is one of the main challenges for Europe in the
years ahead, as education and training provide workers with the skills for generating
innovations. This component captures the structural orientation of the economy towards
knowledge-intensive activities, as measured by the number of persons employed in those
activities in business industries over total employment.
The COMP component is the competitiveness of knowledge-intensive goods and services.
This is a fundamental dimension of a well-functioning economy, given the close link between
growth, innovation and internationalisation. Competitiveness-enhancing measures and
innovation strategies can be mutually reinforcing for the growth of employment, export
shares and turnover at the firm level. This component is built integrating in equal weights the
share of high-tech and medium-tech product exports to the total product exports (GOOD),
and knowledge-intensive service exports as a share of the total services exports of a country
(SERV). It reflects the ability of an economy, notably resulting from innovation, to export
goods and services with high levels of value added, and successfully take part in knowledge-
intensive global value chains.
The DYN component measures the employment in high-growth7 enterprises in innovative
sectors. Sector-specific innovation coefficients, reflecting the level of innovativeness of each
sector, serve here as a proxy for distinguishing innovative enterprises. The component
reflects the degree of innovativeness of successful entrepreneurial activities. The specific
target of fostering the development of high-growth enterprises in innovative sectors is an
integral part of modern R&D and innovation policy.
6 Despite the fact that these data might fail to capture innovation which occurs in industries where investors rely
on alternative mechanisms to protect intellectual property such as secrecy or lead-time. Moser (2013)
Journal of Economic Perspectives—Volume 27, Number 1—Winter 2013—Pages 23–44.
7 High-growth is defined by a growth rate of 10% over a three-year period.

5
2. HOW TO BUILD THE IOI
The IOI is obtained by aggregating its components according to the formula:
DYNwCOMPwKIAwPCTwI 4321
Equation 1. Aggregation formula for the IOI
Where 4321 ,,, wwww are the weights of the component indicators (22, 10, 24, 9), that are
computed in such a way that the IOI is statistically equally balanced in its underlying
components. This procedure aims to avoid that the variables are equally important in nominal
terms but that, statistically, the IOI depends more on some variables and less on the others.8
Table 1 reports the definitions of the component indicators:
8 Paruolo P., Saisana M., Saltelli A., “Ratings and Rankings: Voodoo or Science?”, Journal Royal Statistical
Society, A176(3), 609-634, show that the relative importance of variables are variance based, hence they are
ratios of quadratic forms of nominal weights, while target relative importance are often deduced as ratios of
nominal weights . A correction of the ‘scaling coefficients’ can be made to achieve component indicators
with the desired relative target importance.
6
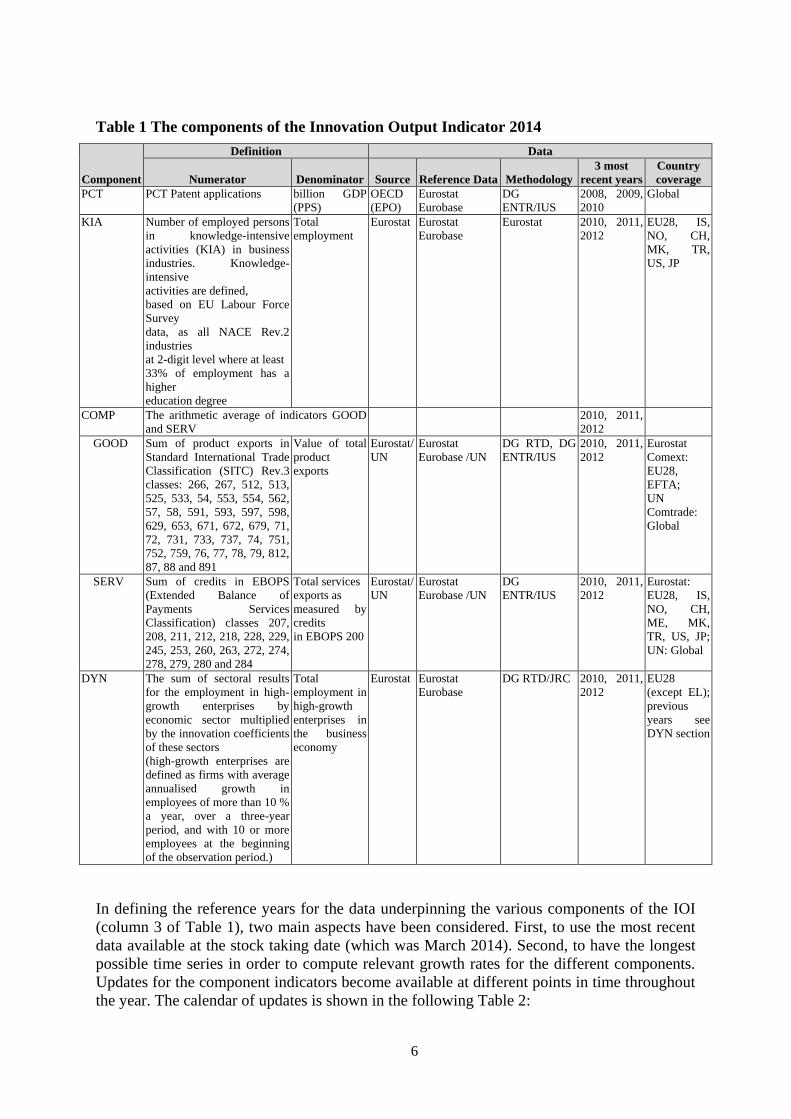
Table 1 The components of the Innovation Output Indicator 2014
Component
Definition Data
Numerator Denominator Source Reference Data Methodology
3 most
recent years
Country
coverage
PCT PCT Patent applications billion GDP
(PPS)
OECD
(EPO)
Eurostat
Eurobase
DG
ENTR/IUS
2008, 2009,
2010
Global
KIA Number of employed persons
in knowledge-intensive
activities (KIA) in business
industries. Knowledge-
intensive
activities are defined,
based on EU Labour Force
Survey
data, as all NACE Rev.2
industries
at 2-digit level where at least
33% of employment has a
higher
education degree
Total
employment
Eurostat Eurostat
Eurobase
Eurostat 2010, 2011,
2012
EU28, IS,
NO, CH,
MK, TR,
US, JP
COMP The arithmetic average of indicators GOOD
and SERV
2010, 2011,
2012
GOOD Sum of product exports in
Standard International Trade
Classification (SITC) Rev.3
classes: 266, 267, 512, 513,
525, 533, 54, 553, 554, 562,
57, 58, 591, 593, 597, 598,
629, 653, 671, 672, 679, 71,
72, 731, 733, 737, 74, 751,
752, 759, 76, 77, 78, 79, 812,
87, 88 and 891
Value of total
product
exports
Eurostat/
UN
Eurostat
Eurobase /UN
DG RTD, DG
ENTR/IUS
2010, 2011,
2012
Eurostat
Comext:
EU28,
EFTA;
UN
Comtrade:
Global
SERV Sum of credits in EBOPS
(Extended Balance of
Payments Services
Classification) classes 207,
208, 211, 212, 218, 228, 229,
245, 253, 260, 263, 272, 274,
278, 279, 280 and 284
Total services
exports as
measured by
credits
in EBOPS 200
Eurostat/
UN
Eurostat
Eurobase /UN
DG
ENTR/IUS
2010, 2011,
2012
Eurostat:
EU28, IS,
NO, CH,
ME, MK,
TR, US, JP;
UN: Global
DYN The sum of sectoral results
for the employment in high-
growth enterprises by
economic sector multiplied
by the innovation coefficients
of these sectors
(high-growth enterprises are
defined as firms with average
annualised growth in
employees of more than 10 %
a year, over a three-year
period, and with 10 or more
employees at the beginning
of the observation period.)
Total
employment in
high-growth
enterprises in
the business
economy
Eurostat Eurostat
Eurobase
DG RTD/JRC 2010, 2011,
2012
EU28
(except EL);
previous
years see
DYN section
In defining the reference years for the data underpinning the various components of the IOI
(column 3 of Table 1), two main aspects have been considered. First, to use the most recent
data available at the stock taking date (which was March 2014). Second, to have the longest
possible time series in order to compute relevant growth rates for the different components.
Updates for the component indicators become available at different points in time throughout
the year. The calendar of updates is shown in the following Table 2:
7
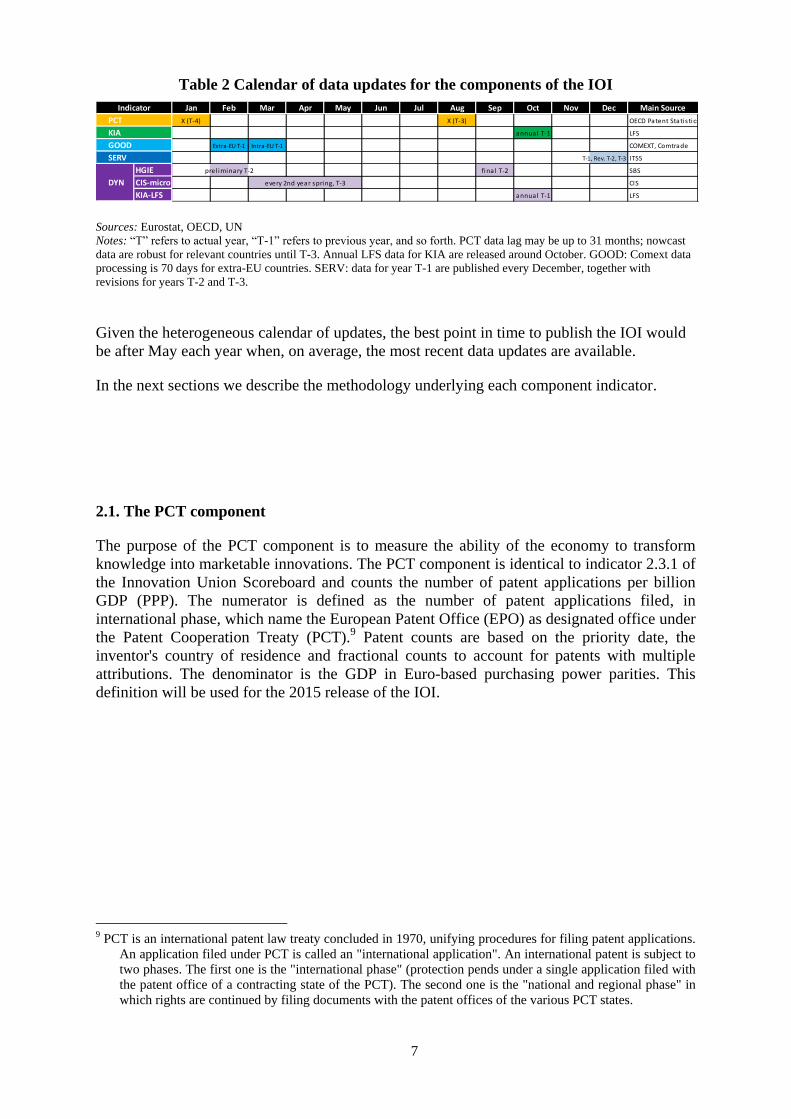
Table 2 Calendar of data updates for the components of the IOI
Jan Feb Mar Apr May Jun Jul Aug Sep Oct Nov Dec Main Source
PCT X (T-4) X (T-3) OECD Patent Statis tics
KIA annual T-1 LFS
GOOD Extra-EU T-1 Intra-EU T-1 COMEXT, Comtrade
SERV T-1, Rev. T-2, T-3 ITSS
HGIE prel iminary T-2 final T-2 SBS
CIS-micro CIS
KIA-LFS annual T-1 LFS
DYN every 2nd year spring, T-3
Indicator
Sources: Eurostat, OECD, UN
Notes: “T” refers to actual year, “T-1” refers to previous year, and so forth. PCT data lag may be up to 31 months; nowcast
data are robust for relevant countries until T-3. Annual LFS data for KIA are released around October. GOOD: Comext data
processing is 70 days for extra-EU countries. SERV: data for year T-1 are published every December, together with
revisions for years T-2 and T-3.
Given the heterogeneous calendar of updates, the best point in time to publish the IOI would
be after May each year when, on average, the most recent data updates are available.
In the next sections we describe the methodology underlying each component indicator.
2.1. The PCT component
The purpose of the PCT component is to measure the ability of the economy to transform
knowledge into marketable innovations. The PCT component is identical to indicator 2.3.1 of
the Innovation Union Scoreboard and counts the number of patent applications per billion
GDP (PPP). The numerator is defined as the number of patent applications filed, in
international phase, which name the European Patent Office (EPO) as designated office under
the Patent Cooperation Treaty (PCT).9 Patent counts are based on the priority date, the
inventor's country of residence and fractional counts to account for patents with multiple
attributions. The denominator is the GDP in Euro-based purchasing power parities. This
definition will be used for the 2015 release of the IOI.
9 PCT is an international patent law treaty concluded in 1970, unifying procedures for filing patent applications.
An application filed under PCT is called an "international application". An international patent is subject to
two phases. The first one is the "international phase" (protection pends under a single application filed with
the patent office of a contracting state of the PCT). The second one is the "national and regional phase" in
which rights are continued by filing documents with the patent offices of the various PCT states.

8
Figure 1 PCT Patent applications per billion GDP (PPS)
Source: OECD Patent Statistics (PCT), Eurostat (GDP)
Discussion
Selecting a patent indicator: PCT data are available for all countries, including US, JP and
the BRIC countries. An intrinsic bias in favour of countries relying more on international
patents than on national ones might occur. The work undertaken examined the possibility of
using triadic patents from the OECD Patent Database, instead of PCT patents. Among the
benefits of such approach was the avoidance of the implicit "home bias" for the US in the
PCT data. The analysis carried out showed a very high correlation between both indicators
and stability in the final ranking, therefore that option was finally dropped.
Timeliness and nowcasting: OECD publishes statistics on PCT filings in the international
phase as defined above twice a year, for the years ‘t-3’ in January and for ‘t-2’ in August.
Patents are counted according to priority dates which are closest to the date of invention.
However, there is a time lag between priority date and the availability of patent information.
One possible way to overcome this is to estimate (“nowcast”) the number of PCT
applications to be transferred to a particular country, which can provide robust estimates for
most countries (with the exception of small patenting countries) up to year t-2.10
Tests
showed a very high correlation between nowcast and non-nowcast data for the latest available
year (t-3). It has been decided to use the non-nowcast data for the 2014 edition of the IOI.In
the robustness analysis that will be carried out for the 2015 edition of the IOI, both nowcast
and non-nowcast data will be tested.
Trademarks and designs were proposed as additional indicators of measuring the market
success of innovations. Trademarks have the potential to measure non-technological
innovation and innovation in the service industries, according to an OECD report11
. However,
10 For details on the methodology, please refer to Dernis, H. (2007), “Nowcasting Patent Indicators”, OECD
Science, Technology and Industry Working Papers, No. 2007/03, OECD Publishing and to OECD (2009),
OECD Patent Statistics Manual, OECD Publishing.
11 Millot, V. (2009), "Trademarks as an Indicator of Product and Marketing Innovations", OECD Science,
Technology and Industry Working Papers, No. 2009/06, OECD Publishing.
9
the same document also points out cautionary remarks on the use of trademark count as an
indicator of product and marketing innovation. First of all, variation in legal systems across
countries and over time makes comparability problematic. Second, the majority of
trademarks registered in a given year cease to exist six or seven years after registration,
although there are major differences across country practices. Third, the home region bias is
rather significant and there are no established methods to overcome it.
Revision of GDP: The implementation of the latest revision of the European System of
National and Regional Accounts (ESA 2010) from September 2014 implies that GDP figures
will be revised. A level shift is expected due, inter alia, to the counting of R&D expenditure,
weapon system as investments, resulting in higher levels of GDP for countries that are high
spenders in these fields.12
As for the PCT variable, it remains to be investigated how an
increase in the denominator – potentially larger for the strongest patenting countries – will
change the current values.
2.2. The KIA component
The KIA component aims at measuring how the supply of skills feeds into the economic
structure. It is identical to indicator 3.2.1 of the Innovation Union Scoreboard and measures
the number of employed persons in knowledge-intensive activities (KIA) in business
industries as a percentage of total employment. The KIA component is calculated from EU
Labour Force Survey data, as all NACE Rev.2 industries at 2-digit level,13
where at least 33%
of employment has a tertiary degree.
This definition will be used for the 2015 release of the IOI.
Annual data for year t-1 is available from Eurostat every October. Eurostat publishes relevant
data for the EU Member States, ETFA countries, FYRO Macedonia, Turkey, and calculates
them for the US and Japan from national sources.
12 Eurostat notes that ESA 2010 is expected to increase the level of GDP on average across the EU by around
2.5%, of which some 2% is due to the capitalisation of research and development. The remaining
methodological impact is due to various elements, the most important of which is capitalisation of
expenditure on weapon systems which represents +0.1%. I.e., in the case of the United States, the
introduction of the new international standards led to an increase of 3.5% in the level of GDP for 2010 to
2012, with the capitalisation of research and development accounting for 2.5%. For further information on
ESA 2010, see: [http://epp.eurostat.ec.europa.eu/portal/page/portal/esa_2010/introduction].
13 NACE (Nomenclature statistique des activités économiques) is the statistical classification of economic
activities in the European Union and the subject of legislation at the EU level, which guarantees the use of
the classification uniformly within all the Member States. It is a basic element of the international
integrated system of economic classifications, based on classifications of the UN Statistical Commission,
Eurostat as well as national classifications; all of them strongly related each to the others, allowing the
comparability of economic statistics produced worldwide by different institutions.
10
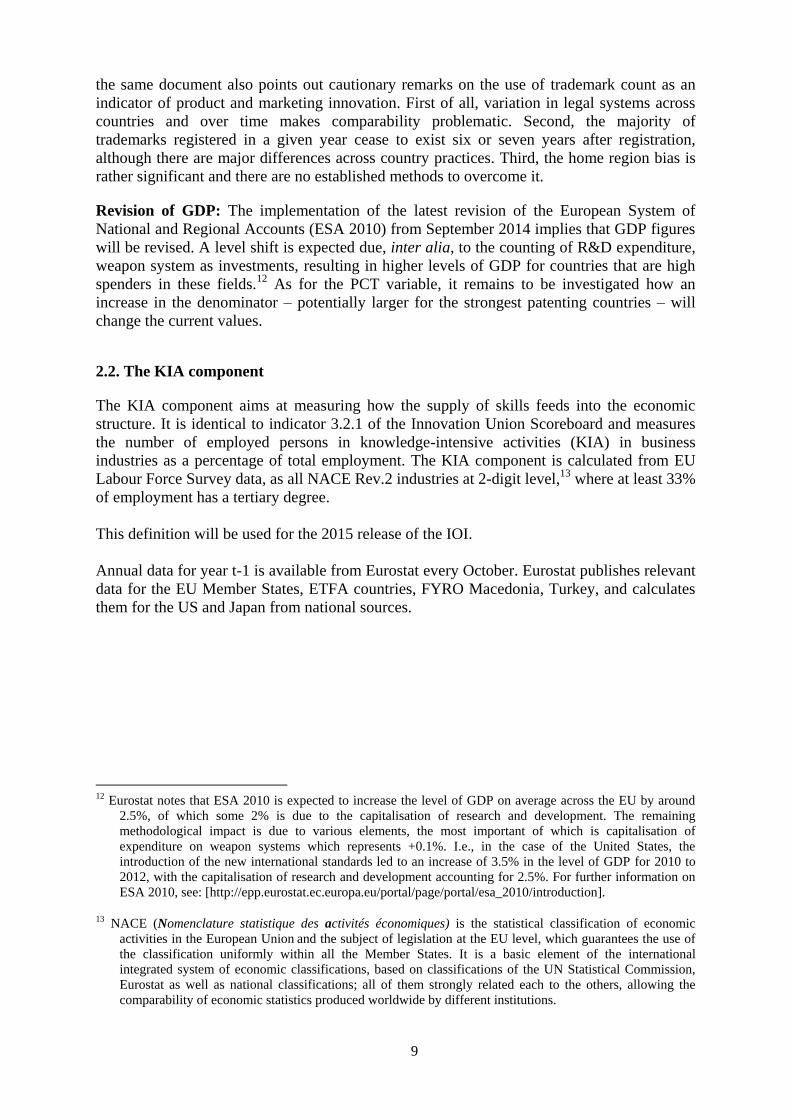
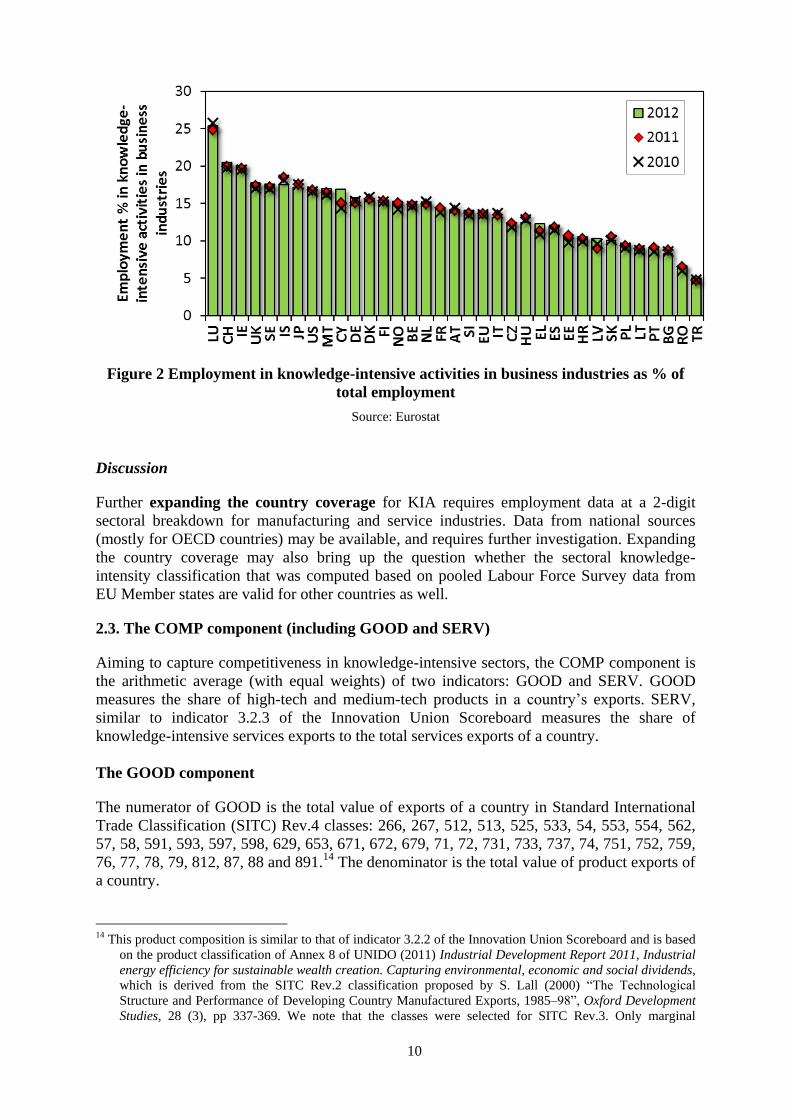
Figure 2 Employment in knowledge-intensive activities in business industries as % of
total employment
Source: Eurostat
Discussion
Further expanding the country coverage for KIA requires employment data at a 2-digit
sectoral breakdown for manufacturing and service industries. Data from national sources
(mostly for OECD countries) may be available, and requires further investigation. Expanding
the country coverage may also bring up the question whether the sectoral knowledge-
intensity classification that was computed based on pooled Labour Force Survey data from
EU Member states are valid for other countries as well.
2.3. The COMP component (including GOOD and SERV)
Aiming to capture competitiveness in knowledge-intensive sectors, the COMP component is
the arithmetic average (with equal weights) of two indicators: GOOD and SERV. GOOD
measures the share of high-tech and medium-tech products in a country’s exports. SERV,
similar to indicator 3.2.3 of the Innovation Union Scoreboard measures the share of
knowledge-intensive services exports to the total services exports of a country.
The GOOD component
The numerator of GOOD is the total value of exports of a country in Standard International
Trade Classification (SITC) Rev.4 classes: 266, 267, 512, 513, 525, 533, 54, 553, 554, 562,
57, 58, 591, 593, 597, 598, 629, 653, 671, 672, 679, 71, 72, 731, 733, 737, 74, 751, 752, 759,
76, 77, 78, 79, 812, 87, 88 and 891.14
The denominator is the total value of product exports of
a country.
14 This product composition is similar to that of indicator 3.2.2 of the Innovation Union Scoreboard and is based
on the product classification of Annex 8 of UNIDO (2011) Industrial Development Report 2011, Industrial
energy efficiency for sustainable wealth creation. Capturing environmental, economic and social dividends,
which is derived from the SITC Rev.2 classification proposed by S. Lall (2000) “The Technological
Structure and Performance of Developing Country Manufactured Exports, 1985–98”, Oxford Development
Studies, 28 (3), pp 337-369. We note that the classes were selected for SITC Rev.3. Only marginal

11
Data for GOOD is available in the Eurostat COMEXT database for EU Member States and
EFTA countries, and UN Comtrade for all others (including US, JP and BRIC countries).
COMEXT data is available for the previous year by April, while Comtrade data is
continuously updated throughout the year.
From the 2015 edition of the IOI, COMEXT data will be used for EU and EFTA countries,
and UN Comtrade data for the rest..
In order to compare the EU as a single entity in global trade with other countries (i.e. the US),
only extra-EU trade should be considered, as partners are considered as single entities (i.e.,
interstate trade is not considered for the US). However, in order to compare the EU
performance against that of the Member States, intra-European trade (or dispatches) has to be
considered in the computation of GOOD. Therefore, to allow both European and global
comparisons, two different GOOD scores were computed for the EU28 aggregate. For global
comparison, only extra-EU product exports were considered, resulting in the score for ‘EUx’.
For a European comparison, the ‘EU’ score was computed by including both intra- and extra-
EU product exports.
Figure 3 The share of medium- and high-tech products in total exports
Source: EU MSs, EU28,; IS, NO: Eurostat Comext; CH, TR, US, JP: UN Comtrade.
Note: The EU28 aggregate is represented by two values: , EU refers to both intra- and extra-EU trade (left
panel); EUx refers to Extra-EU trade only(right panel). For MS (left panel)both intra and extra-EU trade are
included
Discussion
For the 2014 release of the IOI, a number of alternatives for GOOD were considered but
finally not chosen:
(a) alternative formula: An alternative way to measure competitiveness in a selected set
of products is to compute their contribution to a country’s trade balance (CTB), as
used for indicator 3.2.2 of the Innovation Union Scoreboard and the 2013 edition of
the IOI. While the use of the CTB formula was also tested for the 2014 edition, in the
differences were found in the 5-digit level products covered in the 3-digit level selection when changing to
the currently used SITC Rev.4 classification (classes most affected are 752 and 759).
12
end the share formula was chosen because it is easier to interpret, it avoids strange
results at extreme cases, and is aligned with the SERV component.
(b) alternative data source: While the 2013 edition of the IOI and the Innovation Union
Scoreboard used UN Comtrade, the 2014 edition of the IOI introduced Comext data.
The key advantages of shifting to the latter source are the improved timeliness
(Eurostat regularly updates upon receipt of country data), and better quality (results
are more harmonized). COMEXT data are more consistent as regards the trade hub
effect (Rotterdam effect), while Comtrade data may not necessarily comply with the
Eurostat/COMEXT approach. While for many Member States COMEXT and
Comtrade data are largely the same, for countries with a large trade hub (like NL-
Rotterdam, LU-air cargo) there are significant differences. There is also a relatively
large difference for Switzerland, which needs to be examined further (the trade of
gold being an important factor here). Comtrade data will continue to be used for non-
European countries.
(c) different denominator: The value of total exports is larger for countries with rich
natural resource endowments and high primary exports. The discussion on whether
this is to be considered as a bias and if so, how to reduce it, remains open.
Alternatives could be the use of GDP rather than total trade as a denominator, or
excluding primary products from the denominator, or considering manufacturing
exports only.
The SERV component
SERV, the second component of COMP, measures exports of knowledge-intensive services
as captured by the sum of credits in EBOPS (Extended Balance of Payments Services
Classification) classes 207, 208, 211, 212, 218, 228, 229, 245, 253, 260, 263, 272, 274, 278,
279, 280 and 284. The denominator is the total value of services exports as measured by
credits in EBOPS 200.
Preliminary (and not fully detailed) data for year t-1 are released every May together with
revisions for year t-2. Complete data for year t-1 are published in December, together with
revisions for years t-2 and t-3. Time lags may be longer for Non-EU Member States,
including Norway and Switzerland.
Due to confidentiality reasons, many EBOPS service posts are missing in data published by
Eurostat in some or all years. This may significantly affect country scores, i.e. in the case of
freight transport by sea where Greek data fluctuates from 5.4% in 2010 to 54.2% in
2011.Special aggregates on knowledge-intensive services obtained from Eurostat were used
to partially overcome this problem. However, in a number of cases, incomplete time series
were imputed by simply using previous year’s data. Yet, for completely missing services no
imputation was made, resulting in an underestimation of the component, notably in the cases
of CH, US and JP.
As for GOOD, two different SERV scores were computed for the EU28 aggregate to
accommodate both European and global comparisons. For the global comparison, only extra-
EU service exports were considered, resulting in the score for ‘EUx’. For a European
comparison, the ‘EU’ weighted average score was computed by including both intra- and
extra-EU service exports.

13
Figure 4 Knowledge-intensive services exports as % of total service exports
Source: Eurostat EBOPS special aggregation;UN Service Trade Statistics; Note: EUx refers to Extra-EU 28
trade only, EU refers to both intra- and extra-EU trade for EU28 aggregate
Discussion
For the 2014 release of the IOI, a number of alternatives were considered for the definition of
SERV, but the final decision was to apply the original definition of the IUS, in which all KIS
services are included.
First, an alternative formula was proposed based on the contribution to the trade balance, in
order to align it with the definition of GOOD used in the 2013 release. Secondly, the
inclusion or exclusion of specific sectors was discussed. In particular, the classification of
maritime transport as KIS gives a disadvantage to landlocked countries (AT, CZ, HU, SK,
LU). Moreover, royalties and license fees, not classified as KIS, put countries with
substantial receipts (such as the Netherlands, where royalties and license fees are tax-free) at
a disadvantage. Land based transport (rail, road and pipelines), not classified as KIS, put
transit countries (such as AT and the Baltics) at a disadvantage. Education and health
services, not classified as KIS, but having high tertiary attainment of employed persons,
should also be considered. Tests have been conducted by combining all these options.
Education and health services were found to have negligible impact on SERV. An update of
the KIS classification, or even the development of a new classification, is the object of
ongoing investigation. This, potentially affecting the 2015 edition of the IOI, will take into
account an upcoming methodological update of Balance of Payment Manual (BPM5 to
BPM6)15
.
Alternative ways to impute missing services (in particular in the case of non-EU countries)
remain to be investigated.
15 The main methodological reference used for the production of balance of payment statistics is the fifth
balance of payments manual (BPM5) of the International Monetary Fund (IMF). The sixth edition of this
manual (BPM6) was finalised in December 2008 and its implementation will take place by the end of 2014.
This new set of international standards has been developed, partly in response to important economic
developments, including an increased role for globalisation, rising innovation and complexity in financial
markets, and a greater emphasis on using the balance sheet as a tool for understanding economic activity.
14
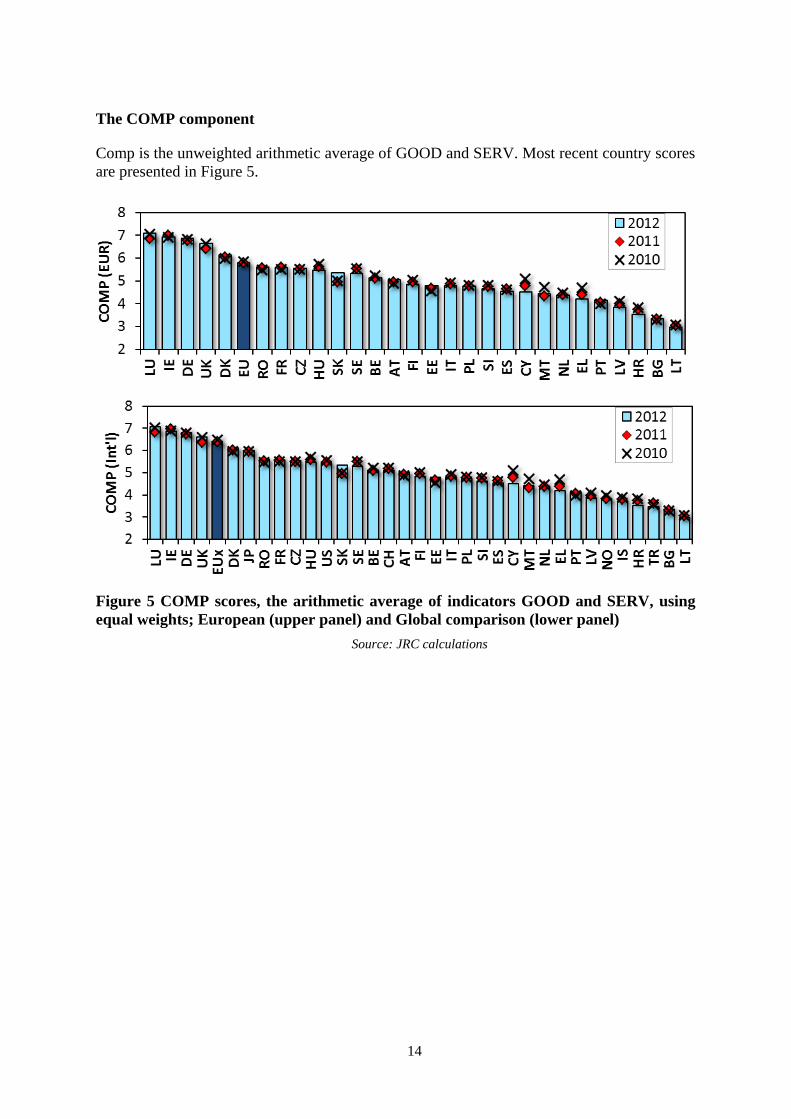
The COMP component
Comp is the unweighted arithmetic average of GOOD and SERV. Most recent country scores
are presented in Figure 5.
Figure 5 COMP scores, the arithmetic average of indicators GOOD and SERV, using
equal weights; European (upper panel) and Global comparison (lower panel)
Source: JRC calculations

15
2.4. The DYN component: employment dynamism of high-growth enterprises in
innovative sectors
The purpose of the DYN component is to measure countries’ capacity to create employment
in high-growth enterprises that operate in innovative sectors. It is computed by weighting
sectoral innovation coefficients with sectoral shares of employment in high-growth
enterprises, according to the following formula:
HG
C
HG
sC
s
s
scorescore
cE
EKIACISDYN
1
)*(
Equation 2. Component DYN (dynamism) of the IOI
where
s
scorescore KIACIS )*( is the innovation coefficient, and HG
sCE is the number of employees in
high-growth enterprises in sector s and country c, being s
HG
sC
HG
C EE . Note that in this
formula the term HG
C
HG
sC
E
E plays the role of a weight as 1
1
HG
C
HG
sC
s E
E.
The economic sectors covered are the three-digit NACE business economy sectors,
including the financial sector (i.e. NACE Rev. 2 sections B-N & S95), as identified by the
national statistical office based on national business register data and based on the number of
employees in these enterprises.16
The reason for using NACE three-digit level statistical
breakdown is to capture cross-sectoral differences in innovativeness.
The innovation coefficient s
scorescore KIACIS )*(
The taxonomy of the innovation coefficients was developed by the OECD, in the framework
of a contract financed by the Commission.17
The innovation coefficients cover all NACE
sectors. This option allows innovation in all business sectors to be taken into account.
The innovation coefficient is not country-specific but computed over the entire pool of
European countries in order to provide an indication of the structural features of economic
sectors across Europe. Moreover, for some countries, statistics may not be representative.
For the 2013 and 2014 edition of the IOI, the innovation coefficients for all three-digit NACE
sectors have been computed using data from the Community Innovation Survey (CIS) 2008
(for the sscoreCIS( ) and the Labour Force Survey (LFS) 2009 and 2010 (for the s
scoreKIA ).
The s
scorescore KIACIS )*( for the 25 most innovative sectors are presented in Table 3. The
sectors with the highest innovation coefficients include R&D in natural sciences and
engineering, software publishing, satellite telecommunications activities, manufacture of
pharmaceutical preparations, computer programming, consultancy and related activities,
wireless telecommunications activities, manufacture of basic pharmaceutical products,
architectural and engineering activities and related technical consultancy. The methodology is
illustrated in the next two sections.
16 The financial sector ‘K’ is included from the 2014 version of the Innovation Output Indicator onward.
17 See OECD (2011) “Innovation Intensity in Sectors; An Experimental Taxonomy”.

16
Table 3 The 25 most innovative sectors based on the innovation coefficient
NACE Rev. 2, 3-digit (groups) Coefficients
CIS*KIA
Code Description
721 Research and experimental development on natural sciences and engineering 0.82
582 Software publishing 0.66
643 Trusts, funds and similar financial entities 0.64
722 Research and experimental development on social sciences and humanities 0.62
613 Satellite telecommunications activities 0.6
620 Computer programming, consultancy and related activities 0.58
212 Manufacture of pharmaceutical preparations 0.58
612 Wireless telecommunications activities 0.56
639 Other information service activities 0.55
211 Manufacture of basic pharmaceutical products 0.54
663 Fund management activities 0.54
601 Radio broadcasting 0.52
602 Television programming and broadcasting activities 0.52
641 Monetary intermediation 0.52
202 Manufacture of pesticides and other agrochemical products 0.51
652 Reinsurance 0.5
263 Manufacture of communication equipment 0.49
265 Manufacture of instruments and appliances for measuring, testing and navigation;
watches and clocks 0.48
711 Architectural and engineering activities and related technical consultancy 0.48
303 Manufacture of air and spacecraft and related machinery 0.48
262 Manufacture of computers and peripheral equipment 0.48
266 Manufacture of irradiation, electromedical and electrotherapeutic equipment 0.46
651 Insurance 0.45
304 Manufacture of military fighting vehicles 0.43
702 Management consultancy activities 0.43
Note: For the 3-digit NACE Rev. 2 groups for which CIS2008 statistics could not be compiled, the corresponding 2-digit
scores were assigned and highlighted in grey. KIA coefficients for the economic activities which are below the reliability
threshold of 20,000 employed persons (for European aggregate) are presented in italic.
Calculation of CIS scores
CIS aims at capturing a broad range of innovation activities such as product and process
development and marketing and organisational changes. A total of 33 CIS 2008 variables
distributed among four groups (see Table 12), and reflecting the different aspects of
innovation, were used to rank economic sectors according to their innovation intensity. These
variables were assigned equal weights so that, for instance, R&D performers and marketing
innovators are given the same weight when constructing sectoral innovation intensities. This
addresses the concern that the innovation performance of some sectors, especially services, is
17
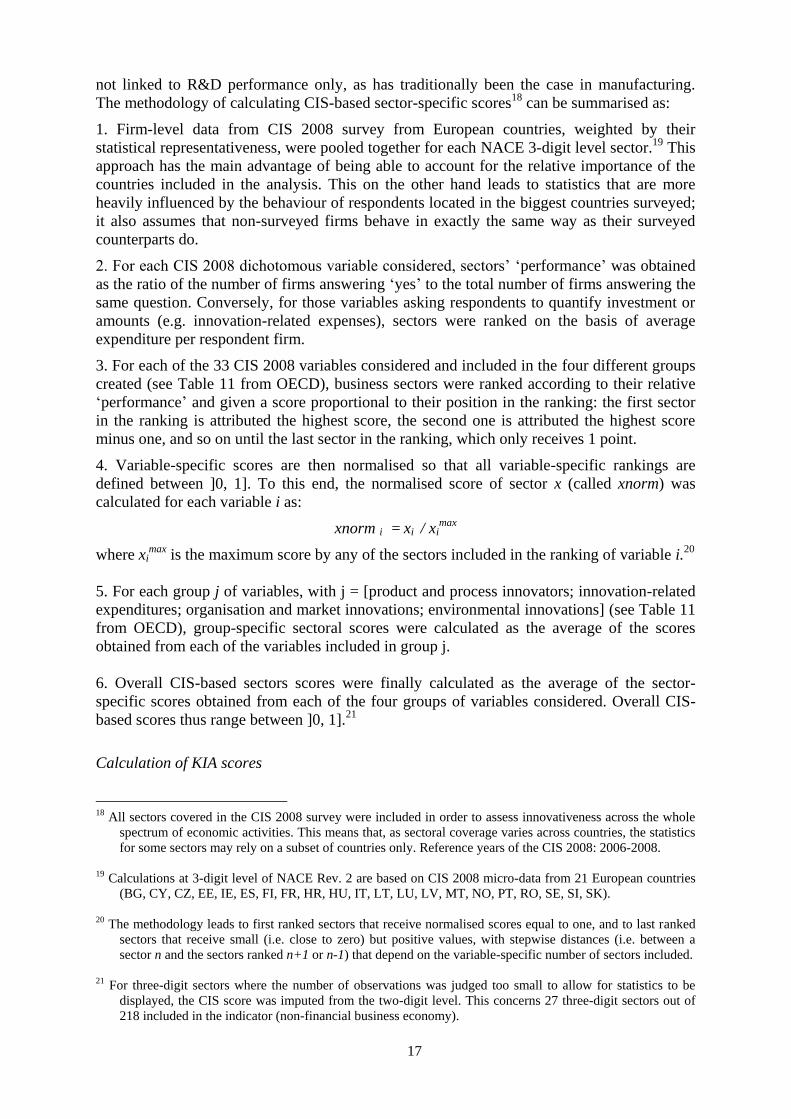
not linked to R&D performance only, as has traditionally been the case in manufacturing.
The methodology of calculating CIS-based sector-specific scores18
can be summarised as:
1. Firm-level data from CIS 2008 survey from European countries, weighted by their
statistical representativeness, were pooled together for each NACE 3-digit level sector.19
This
approach has the main advantage of being able to account for the relative importance of the
countries included in the analysis. This on the other hand leads to statistics that are more
heavily influenced by the behaviour of respondents located in the biggest countries surveyed;
it also assumes that non-surveyed firms behave in exactly the same way as their surveyed
counterparts do.
2. For each CIS 2008 dichotomous variable considered, sectors’ ‘performance’ was obtained
as the ratio of the number of firms answering ‘yes’ to the total number of firms answering the
same question. Conversely, for those variables asking respondents to quantify investment or
amounts (e.g. innovation-related expenses), sectors were ranked on the basis of average
expenditure per respondent firm.
3. For each of the 33 CIS 2008 variables considered and included in the four different groups
created (see Table 11 from OECD), business sectors were ranked according to their relative
‘performance’ and given a score proportional to their position in the ranking: the first sector
in the ranking is attributed the highest score, the second one is attributed the highest score
minus one, and so on until the last sector in the ranking, which only receives 1 point.
4. Variable-specific scores are then normalised so that all variable-specific rankings are
defined between ]0, 1]. To this end, the normalised score of sector x (called xnorm) was
calculated for each variable i as:
xnorm i = xi / ximax
where ximax
is the maximum score by any of the sectors included in the ranking of variable i.20
5. For each group j of variables, with j = [product and process innovators; innovation-related
expenditures; organisation and market innovations; environmental innovations] (see Table 11
from OECD), group-specific sectoral scores were calculated as the average of the scores
obtained from each of the variables included in group j.
6. Overall CIS-based sectors scores were finally calculated as the average of the sector-
specific scores obtained from each of the four groups of variables considered. Overall CIS-
based scores thus range between ]0, 1].21
Calculation of KIA scores
18 All sectors covered in the CIS 2008 survey were included in order to assess innovativeness across the whole
spectrum of economic activities. This means that, as sectoral coverage varies across countries, the statistics
for some sectors may rely on a subset of countries only. Reference years of the CIS 2008: 2006-2008.
19 Calculations at 3-digit level of NACE Rev. 2 are based on CIS 2008 micro-data from 21 European countries
(BG, CY, CZ, EE, IE, ES, FI, FR, HR, HU, IT, LT, LU, LV, MT, NO, PT, RO, SE, SI, SK).
20 The methodology leads to first ranked sectors that receive normalised scores equal to one, and to last ranked
sectors that receive small (i.e. close to zero) but positive values, with stepwise distances (i.e. between a
sector n and the sectors ranked n+1 or n-1) that depend on the variable-specific number of sectors included.
21 For three-digit sectors where the number of observations was judged too small to allow for statistics to be
displayed, the CIS score was imputed from the two-digit level. This concerns 27 three-digit sectors out of
218 included in the indicator (non-financial business economy).

18
Innovation is always the tangible or intangible translation of new ideas and knowledge.
Knowledge-intensive economic activities are more likely to be subject to innovations and to
offer innovations with a high potential for economic and societal transformations. In order to
account for the role of knowledge in the innovation potential of an economic sector, the share
of tertiary-educated persons employed in that sector, normalised by the highest share among
all sectors is used.22
The sector-specific KIA score thus ranges between [0, 1]. The average of
2009 and 2010 values obtained from the Labour Force Survey were used.
High-growth enterprises (EHG
)
High-growth enterprises are defined as enterprises with average annualised growth in number
of employees of more than 10 % a year, over a three-year period, and with 10 or more
employees at the beginning of the observation period (period of growth).23
High-growth
enterprises have been defined statistically as part of the joint OECD/Eurostat
Entrepreneurship Indicators Programme (EIP).24
The definition used for the dynamism
component is the employment-based definition established by the EIP, with the exception of
the minimum growth rate, which is set to 10 % for DYN instead of 20 % for the EIP. While
still being very selective, this lower threshold allows for a more significant coverage of high-
growth enterprises.25
Data availability has been increasing with time. Following a test collection covering data for
the year 2008, as of 2011 25 countries are covered (24 EU Member States plus Norway). No
data is available for the following EU Member States for the following years: 2008: BE, BG,
CY, CZ, DE, ES, FR, IE, NL, UK, EL, HR, MT; 2009: BG, CY, CZ, DE, ES, UK, EL, HR,
MT; 2010: EL, HR, MT, DE (sector K missing from aggregation); 2011: IT, PL, SI, EL, HR,
MT; 2012 /provisional data/: EL, FR, HR, IE; 2012 /final data/26
: FI, EL.
22 Calculations at three-digit level of NACE Rev. 2 are based on the LFS data available for 19 Member States
(AT, CZ, DE, EE, ES, FI, FR, GR, HU, LU, LT, MT, NL, PL, PT, RO, SE, SK, UK). Values for 25 three-
digit sectors out of 272 in total economy (i.e. including public sector), accounting for 0.3% of total persons
employed in 2010 in the same dataset, are considered unreliable and not published, because they are below
the 6500 population threshold applied to LFS data; 28 additional three-digit sectors out of 272 in total
economy, accounting for 1.2% of total persons employed in 2010 in the same data set, are considered
unreliable but are published with a flag (between 6500 and 15000 population threshold applied to LFS
data).
23 Different thresholds were tested (such as 7% and 20%), and 10% was judged sufficient to capture the
phenomenon.
24 The joint OECD/Eurostat EIP programme started in 2006. See
http://www.oecd.org/fr/industrie/statistiquessurlentreprenariatetlesentreprises/theentrepreneurshipindicators
programmeeipbackgroundinformation.htm.
25 The rationale of the choice of this threshold was agreed with Member States' experts on 23 October 2012.
26 Final data became available from Eurostat in October 2014, after publication of the IOI 2014. Therefore, the
IOI 2014 used provisional data, published in February 2014 (see notes of Figure 6).

19
Imputation technique for missing values and wider international comparability
Unlike for the other components, data for international comparability is more limited for
DYN.27
Missing data have been imputed using the Expectation-Maximization (EM)
algorithm, which was found the best in a cross-validation of ten different alternatives28
.
EM is an iterative procedure to find the maximum likelihood estimates of the parameter
vector by repeating the following steps.
1. Expectation "E-step": given a set of parameter estimates, such as a mean vector and
covariance matrix for a multivariate normal distribution, the E-step calculates the
conditional expectation of the complete-data log likelihood given the observed data
and the parameter estimates.
2. Maximization "M-step": given a complete-data log likelihood, the M-step finds the
parameter estimates which maximize the complete-data log likelihood from the E-
step. These two steps are iterated until the iterations converge.
This technique has been applied to impute missing values for component DYN for the EU-
Member States listed as missing, as well as for TR, IS, CH, US and JP. BRIC countries have
not been included in the IOI because they also display missing data for the KIA component.
The implications of the imputation procedure on countries ranking will be tested in the
robustness analysis that will be conducted for the 2015 release of the IOI.
27 The actual capacity to provide data to calculate the indicator on an international basis is constrained for two
main reasons: First of all, while statistical business registers are available in countries such as Brazil,
Canada, New Zealand or the United States, a proper register does not exist in other major global economies
such as China, India or Japan. In order to calculate the dynamism component for these countries, all that
can be used are firm-level data from different types of data sources, with several representativeness and
quality problems. For instance, the available Chinese data only cover manufacturing enterprises while India
provides information at plant (not company) level, again mostly in manufacturing industry. Second,
estimates of employment in fast-growing innovative enterprises are based on European sector-specific
innovation coefficients.
28 For further reference see: Dempster, A.P.; Laird, N.M.; Rubin, D.B., 1977. Maximum Likelihood from
Incomplete Data via the EM Algorithm, Journal of the Royal Statistical Society. B 39 (1): 1–38, and Little,
R.J.A., Rubin, D.B., 2002. Statistical Analysis with missing data. IInd edition; John Wiley & Sons, Inc.

20
Figure 6 DYN component - employment dynamism of high-growth enterprises
Source: Eurostat; Note: 2012: preliminary data, IE and FR - 2011 data; Imputation: 2010 - EL, HR, MT, DE;
2011- IT, PL, SI, EL, HR, MT; 2012- EL and HR; all years - CH, IS, TR, US, JP
Discussion
Sectoral Disaggregation Level: 3-digit or 2-digit? The dynamism component has
been calculated using data at NACE three-digit level, instead of the two-digit level, as
these latter may prove too heterogeneous in their sub-sectors. The JRC will test both
levels of disaggregation of the sectoral data used for this component in the robustness
analysis of the IOI.
Financial services: Well-functioning and performing financial services are crucial to
the innovative capacity of an economy. Financial services have been excluded from
the indicator in the 2013 edition but included in the 2014 edition because they are
considered relevant for the measurement of innovation given their pervasive function
and impact in the non-financial economy. The contribution of the financial sector is
furthermore not excluded in the other three components of the IOI, i.e. PCT, KIA and
COMP.
Update of CIS KIA: The 2015 edition of the IOI will use newly computed
s
scorescore KIACIS )*( using (when microdata will be made available) CIS 2012 as well
as LFS 2013 data. The update of sscoreCIS using micro-data from CIS 2010 has been
made in July 2014 by the JRC.
Enhancing the international dimension: Increasing the international coverage may
be possible using employment data for HGIE computed by national statistical offices
(i.e. in the framework of the Entrepreneurship Indicators Programme of the OECD).
Increasing the international coverage of the DYN component in the future will, (as in
the case of other components), bring along the question whether the sectoral
innovativeness coefficients that were computed based on CIS and KIA micro-data
from EU Member states are also valid for other countries (i.e. the US and Japan).
Use of preliminary or final EHG
data: the use of preliminary EHG
data published in
February each year may bias country scores by not restricted firm growth (due to
mergers and acquisitions), which would be (in most cases) corrected in the final EHG
21
data published in October each year. Both alternatives will be tested in the robustness
analysis that will be conducted for the 2015 release of the IOI.
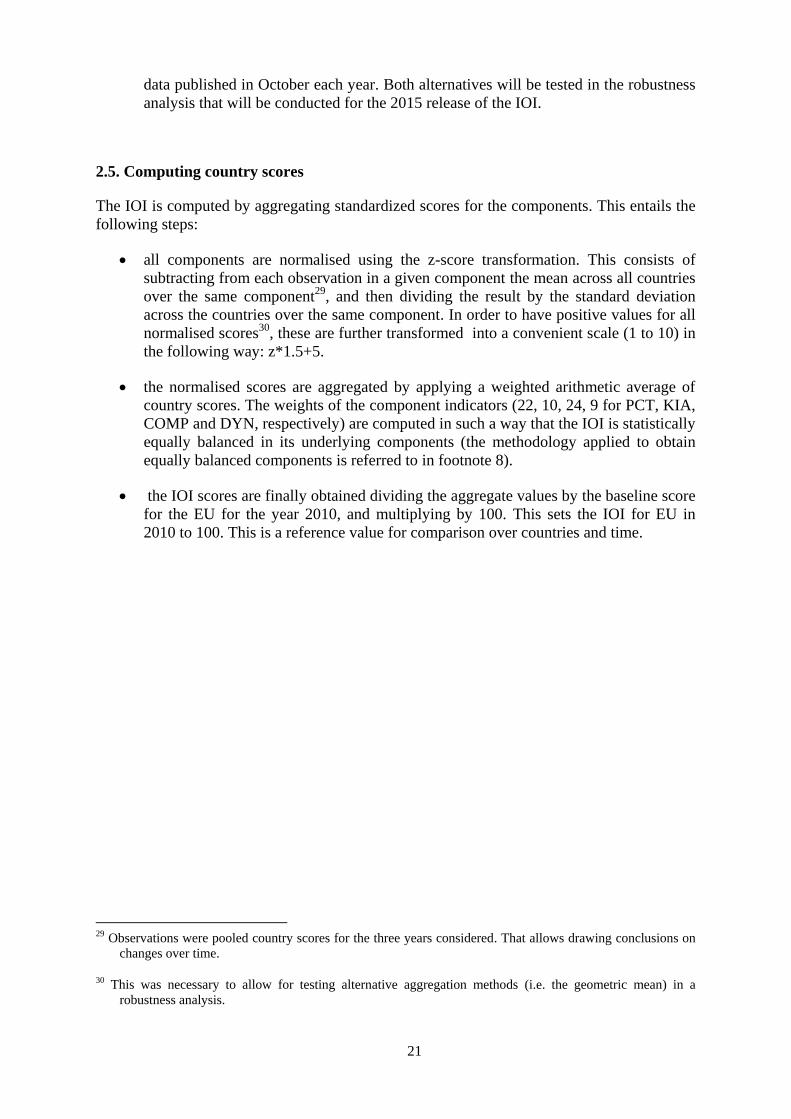
2.5. Computing country scores
The IOI is computed by aggregating standardized scores for the components. This entails the
following steps:
all components are normalised using the z-score transformation. This consists of
subtracting from each observation in a given component the mean across all countries
over the same component29
, and then dividing the result by the standard deviation
across the countries over the same component. In order to have positive values for all
normalised scores30
, these are further transformed into a convenient scale (1 to 10) in
the following way: z*1.5+5.
the normalised scores are aggregated by applying a weighted arithmetic average of
country scores. The weights of the component indicators (22, 10, 24, 9 for PCT, KIA,
COMP and DYN, respectively) are computed in such a way that the IOI is statistically
equally balanced in its underlying components (the methodology applied to obtain
equally balanced components is referred to in footnote 8).
the IOI scores are finally obtained dividing the aggregate values by the baseline score
for the EU for the year 2010, and multiplying by 100. This sets the IOI for EU in
2010 to 100. This is a reference value for comparison over countries and time.
29 Observations were pooled country scores for the three years considered. That allows drawing conclusions on
changes over time.
30 This was necessary to allow for testing alternative aggregation methods (i.e. the geometric mean) in a
robustness analysis.

22
Table 4 Data used for the Innovation Output Indicator 2014
Country Year PCT KIA GOOD SERV DYN
EU28 EU "2012" 4.0 13.9 53.4 49.5 17.9
EUx "2012"
59.7 56.0
Belgium BE "2012" 4.0 15.2 46.7 42.9 15.6
Bulgaria BG "2012" 0.4 8.3 25.7 28.6 16.2
Czech Republic CZ "2012" 0.7 12.5 62.5 34.8 18.7
Denmark DK "2012" 6.6 15.5 42.9 68.1 18.5
Germany DE "2012" 7.8 15.8 65.8 58.1 19.1
Estonia EE "2012" 2.3 10.8 40.8 42.5 14.7
Ireland IE "2012" 2.4 20.1 47.9 78.6 21.8
Greece EL "2012" 0.4 12.3 18.8 54.0 16.8
Spain ES "2012" 1.7 11.9 44.3 33.2 15.9
France FR "2012" 4.2 14.3 57.1 41.1 20.8
Italy IT "2012" 2.1 13.2 49.3 33.3 15.3
Cyprus CY "2012" 0.3 16.9 36.0 41.9 16.7
Latvia LV "2012" 0.5 10.3 29.0 35.6 11.3
Lithuania LT "2012" 0.4 9.1 31.9 14.2 12.3
Luxembourg LU "2012" 1.7 25.4 56.1 73.6 18.8
Hungary HU "2012" 1.5 12.5 66.2 28.8 19.1
Malta MT "2012" 0.7 17.0 51.3 23.7 17.5
Netherlands NL "2012" 5.5 15.2 42.7 31.8 16.2
Austria AT "2012" 5.4 14.2 55.1 32.2 17.2
Poland PL "2012" 0.5 9.7 48.2 33.6 19.3
Portugal PT "2012" 0.6 9.0 36.5 33.5 14.7
Romania RO "2012" 0.2 6.5 50.2 49.2 16.0
Slovenia SI "2012" 3.2 14.1 53.3 25.7 15.3
Slovakia SK "2012" 0.5 10.1 61.7 31.3 19.2
Finland FI "2012" 10.5 15.5 40.4 43.9 17.1
Sweden SE "2012" 10.1 17.6 51.4 41.8 18.9
United Kingdom UK "2012" 3.3 17.8 53.8 66.4 18.6
Croatia HR "2012" 0.8 10.4 39.4 17.6 15.0
Turkey TR "2012" 0.6 5.0 34.1 22.0 13.3
Iceland IS "2012" 3.0 17.5 11.8 51.4 16.7
Norway NO "2012" 3.4 15.3 11.6 54.0 15.4
Switzerland CH "2012" 8.0 20.5 63.0 25.0 19.0
United States US "2012" 3.9 17.1 50.2 45.6 18.4
Japan JP "2012" 11.2 17.2 74.4 31.6 19.1
EU28 EU "2011" 4.0 13.6 53.5 48.8 18.2
EUx "2011"
59.4 55.5
Belgium BE "2011" 3.8 14.8 46.7 42.5 17.3
Bulgaria BG "2011" 0.4 8.7 25.9 27.7 14.5
Czech Republic CZ "2011" 0.9 12.3 63.1 32.9 17.0
Denmark DK "2011" 7.0 15.6 42.3 66.5 21.7
Germany DE "2011" 7.8 15.1 65.4 56.7 18.5
Estonia EE "2011" 2.4 10.7 39.6 41.0 16.2
Ireland IE "2011" 2.8 19.7 50.2 77.7 21.8
Greece EL "2011" 0.4 11.3 21.3 54.7 16.6
Spain ES "2011" 1.6 11.8 47.2 31.9 15.9
France FR "2011" 4.3 14.4 56.2 42.0 20.8
Italy IT "2011" 2.1 13.4 50.1 33.5 17.2
Cyprus CY "2011" 0.6 15.1 38.1 44.9 15.5
Latvia LV "2011" 1.2 9.0 30.4 36.5 9.5
Lithuania LT "2011" 0.3 8.9 32.4 14.7 12.3
Luxembourg LU "2011" 1.8 24.8 49.3 75.7 21.0
Hungary HU "2011" 1.5 13.1 68.5 29.2 18.7
Malta MT "2011" 0.3 16.4 49.4 23.0 16.8
Netherlands NL "2011" 6.3 14.9 43.2 31.0 16.4
Austria AT "2011" 5.2 14.0 53.9 31.2 16.7
Poland PL "2011" 0.5 9.3 49.5 32.5 15.6
Portugal PT "2011" 0.7 9.1 36.8 31.2 14.1
Romania RO "2011" 0.2 6.5 50.4 47.5 16.0
Slovenia SI "2011" 3.2 13.7 54.3 26.6 17.0
Slovakia SK "2011" 0.4 10.5 60.3 24.5 16.9

23
Country Year PCT KIA GOOD SERV DYN
Finland FI "2011" 10.5 15.3 42.0 44.2 15.3
Sweden SE "2011" 10.9 17.2 53.6 43.7 19.2
United Kingdom UK "2011" 3.5 17.4 50.4 64.9 18.8
Croatia HR "2011" 0.7 10.3 43.3 17.6 15.2
Turkey TR "2011" 0.6 4.7 37.7 21.4 13.4
Iceland IS "2011" 3.9 18.5 11.9 52.7 17.3
Norway NO "2011" 3.7 15.1 11.4 54.0 16.3
Switzerland CH "2011" 8.1 19.9 64.2 25.4 18.9
United States US "2011" 3.9 16.8 50.0 46.6 18.5
Japan JP "2011" 9.4 17.5 73.1 32.0 20.4
EU28 EU "2010" 3.8 13.5 54.6 49.0 17.3
EUx "2010"
60.4 56.5
Belgium BE "2010" 3.5 14.6 48.8 42.4 17.4
Bulgaria BG "2010" 0.3 8.6 25.9 26.9 14.9
Czech Republic CZ "2010" 1.0 11.8 63.3 32.9 16.4
Denmark DK "2010" 7.3 15.8 41.7 66.0 20.7
Germany DE "2010" 7.1 15.3 65.9 57.5 19.6
Estonia EE "2010" 2.0 9.8 36.4 41.8 14.4
Ireland IE "2010" 2.9 19.5 49.2 76.9 21.5
Greece EL "2010" 0.4 10.9 23.5 59.0 16.9
Spain ES "2010" 1.4 11.5 48.0 30.8 16.6
France FR "2010" 4.0 13.8 57.6 38.8 19.7
Italy IT "2010" 2.1 13.7 50.6 34.4 17.1
Cyprus CY "2010" 0.5 14.4 40.8 48.5 18.6
Latvia LV "2010" 0.8 9.6 30.7 38.8 13.9
Lithuania LT "2010" 0.6 8.7 32.2 15.6 13.6
Luxembourg LU "2010" 1.7 25.7 51.3 77.6 27.0
Hungary HU "2010" 1.4 12.8 71.4 28.6 18.2
Malta MT "2010" 1.0 16.2 54.9 25.4 17.2
Netherlands NL "2010" 6.5 15.2 43.7 32.2 17.1
Austria AT "2010" 4.6 14.4 54.2 29.5 16.0
Poland PL "2010" 0.4 9.1 51.2 31.2 17.3
Portugal PT "2010" 0.6 8.6 36.5 30.1 14.2
Romania RO "2010" 0.2 6.0 51.1 45.4 15.2
Slovenia SI "2010" 3.1 13.4 56.0 25.9 15.2
Slovakia SK "2010" 0.3 10.1 62.1 23.3 19.4
Finland FI "2010" 9.5 15.2 45.0 42.4 18.5
Sweden SE "2010" 10.5 16.9 53.5 43.6 21.0
United Kingdom UK "2010" 3.4 17.0 54.0 65.9 16.6
Croatia HR "2010" 0.7 9.9 45.1 17.6 15.0
Turkey TR "2010" 0.5 4.8 38.6 18.8 13.1
Iceland IS "2010" 2.7 18.1 12.6 54.1 17.3
Norway NO "2010" 2.9 14.2 14.2 54.0 17.4
Switzerland CH "2010" 7.9 19.8 63.6 26.6 18.9
United States US "2010" 3.9 16.6 52.3 45.9 18.5
Japan JP "2010" 7.6 17.5 73.8 31.0 20.2
Source: JRC calculations. Note: ‘EUx’ refers to Extra-EU trade for GOOD and SERV.

24
3. ROBUSTNESS ANALYSIS
Monitoring innovation at the national scale across the Member States and with respect to
non-EU benchmark countries raises practical challenges related to the quality of data and the
combination of these into a single number.
Robustness analysis is a necessary step to ensure the transparency and reliability of an
indicator, to enable policy-makers to derive informed and meaningful conclusions, and to
potentially guide choices on priority setting and policy formulation.
The JRC applies robustness analysis to assess the IOI for the conceptual and statistical
coherence of its structure, and for the impact of key modelling assumptions on the country
scores.31
The JRC has already tested the conceptual coherence of the IOI in its first release using
principal component analysis. The structure of the IOI has been fixed at that time. A potential
revision of the framework can be envisaged in five to ten years.
The statistical coherence of the IOI is tested using the Pearson correlation ratio (the non-
linear equivalent of the Pearson correlation coefficient), which enables computing nominal
weights such that the components are all equally balanced.32
Key modelling assumptions are tested in the robustness analysis and include i) alternative
techniques for the imputation of missing data, ii) alternative aggregation formulas
(arithmetic, geometric), iii) alternative specifications of the selected indicators and iv)
aggregation using random weights. This type of assessment aims to anticipate eventual
criticism about the assumptions made to construct the IOI (Saisana et al., 2005;33
Saisana et
al., 2011).
The outcome of the analysis complements the country rankings with confidence intervals, in
order to better appreciate the robustness of the IOI to key modelling assumptions.
31
See for example Saisana, M., D'Hombres, B., Saltelli, A., 2011. Rickety numbers: Volatility of university
rankings and policy implications, Research Policy 40(1), 165-177.
32 Details on the applied methodologies are available at [http://composite-indicators.jrc.ec.europa.eu]
33 Saisana, M., Saltelli, A., Tarantola, S., 2005. Uncertainty and sensitivity analysis techniques as tools for the
analysis and validation of composite indicators. Journal of the Royal Statistical Society A 168(2), 307-323.

25
ANNEX
List of Acronyms
BPM Balance of Payments Manual
BRIC Brazil, Russia, India and China
CIS Community Innovation Survey
COMEXT Eurostat reference database for external trade
COMP Indicator of competitiveness in knowledge-intensive sectors
Comtrade United Nations Commodity Trade Statistics Database
CTB Contribution to the trade balance
DG ENTR DG Enterprise and Industry of the European Commission
DG RTD DG Research and Innovation of the European Commission
DYN Indicator of Employment dynamism of fast-growing enterprises in innovative sectors
EBOPS Extended Balance of Payments Services Classification
EIP Entrepreneurship Indicators Programme
EM Expectation-Maximization
EPO European Patent Office
ESA European System of National and Regional Accounts
EU European Union
GDP Gross Domestic Product
GOOD Indicator on the share of high-tech and medium-tech products in a country’s exports
IMF International Monetary Fund
IOI Innovation Output Indicator
IUS Innovation Union Scoreboard
ITSS Statistics of International Trade in Services
JRC Joint Research Centre of the European Commission
KIA Knowledge-intensive activities (also abbreviates the Indicator of ~)
KIS Knowledge-intensive services
LFS Labour Force Survey
MHT Medium-tech and high-tech
MS Member State (of the European Union)
NACE Statistical classifications of economic activities
OECD Organization of Economic Cooperation and Development
PCT Patent Cooperation Treaty (also refers to Indicator on patent applications)
PPP Purchasing Power Parity
R&D Research and Development
SERV Indicator on the share of knowledge-intensive services in a country’s exports
SITC Standard International Trade Classification
UN United Nations
UNIDO United Nations Industrial Development Organization

26
Country abbreviations
Code Country
EU28 European Union (28 countries)
AT Austria
BE Belgium
BG Bulgaria
CH Switzerland
CY Cyprus
CZ Czech Republic
DE Germany
DK Denmark
EE Estonia
EL Greece
ES Spain
FI Finland
FR France
HR Croatia
HU Hungary
IE Ireland
IS Iceland
IT Italy
JP Japan
KR Republic of Korea
LT Lithuania
LU Luxembourg
LV Latvia
ME Montenegro
MK Former Yugoslav Republic of Macedonia, the
MT Malta
NL Netherlands
NO Norway
PL Poland
PT Portugal
RO Romania
RU Russia
SE Sweden
SI Slovenia
SK Slovakia
TR Turkey
UK United Kingdom
US United States of America

27
Europe Direct is a service to help you find answers to your questions about the European Union
Freephone number (*): 00 800 6 7 8 9 10 11
(*) Certain mobile telephone operators do not allow access to 00 800 numbers or these calls may be billed.
A great deal of additional information on the European Union is available on the Internet.
It can be accessed through the Europa server http://europa.eu/.
How to obtain EU publications
Our priced publications are available from EU Bookshop (http://bookshop.europa.eu),
where you can place an order with the sales agent of your choice.
The Publications Office has a worldwide network of sales agents.
You can obtain their contact details by sending a fax to (352) 29 29-42758.
European Commission
EUR 26936 – Joint Research Centre – DDG.01
Title: The Innovation Output Indicator 2014: Methodology Report
Author(s): Daniel Vertesy, Stefano Tarantola
Luxembourg: Publications Office of the European Union
2014 – 28+5 pp. – 21.0 x 29.7 cm
EUR – Scientific and Technical Research series – ISSN 1831-9424 (online)
ISBN 978-92-79-40958-5 (PDF)
doi: 10.2788/836690
Abstract
The Innovation Output Indicator was developed by the Commission at the request of the European Council to benchmark
national innovation policies and to monitor the EU’s performance against its main trading partners. It measures the extent to
which ideas stemming from innovative sectors are capable of reaching the market, providing better jobs and making Europe
more competitive. It complements the R&D intensity indicator (3 % target of the Europe 2020 strategy) by focusing on
innovation output. It will support policy-makers in establishing new or reinforced actions to remove bottlenecks preventing
innovators from translating ideas into successful goods and services.
This report discusses the methodology applied for the computation of the Innovation Output Indicator (IOI) 2014 edition. The IOI
is a composite of four components, chosen for their policy relevance: technological innovation as measured by patents (PCT);
Employment in knowledge-intensive activities as a percentage of total employment (KIA); the average of the share of medium
and high-tech goods and services in a countries export (COMP); and employment dynamism of fast-growing enterprises in
innovative sectors (DYN).
29
ISBN 978-92-79-40958-5
LB
-NA
-26
93
6-E
N-N