the ingredients and challenges of sustained growth michael spence cape town june 2007
TRANSCRIPT

The Ingredients and Challenges of Sustained Growth
Michael SpenceCape Town June 2007
Outline
• Sustained High Growth– Ingredients– China and India
• Income inequality• Comparative Advantage• Leadership and political transitions• Urbanization• Demand Shock• Resource rich economies
Sustained High Growth• Growth > 7% for twenty plus years• There are 11 cases• 8 in Asia• (Botswana, China, Hong Kong, Indonesia,
Korea, Malaysia, Malta, Oman, Singapore, Taiwan and Thailand)
• Japan was close - India is about to join in• All post WW II• All leverage the global economy

Growth is a Recent Phenomenon
21st?
Ingredients
• Functioning market system• High levels of savings and investment
– Public and private• Resource mobility
– The microeconomic evolution of a rapidly growing economy
• Leveraging the global economy– Demand– Comparative Advantage– Technology and know-how

China and India
• China has been in this high growth mode since 1978
• India is about to jump into the high growth category • India’s current five year plan (just started) has
average growth over 9% accelerating to over 10%• There are formidable challenges for each country• They will have substantial and increasing impacts
on their neighbors, other developing countries, and the global economy
The two most populous countries, accounting for 40% of the world’s population, are the fastest growing economies in the world, one a complex democracy and the other a socialist market economy
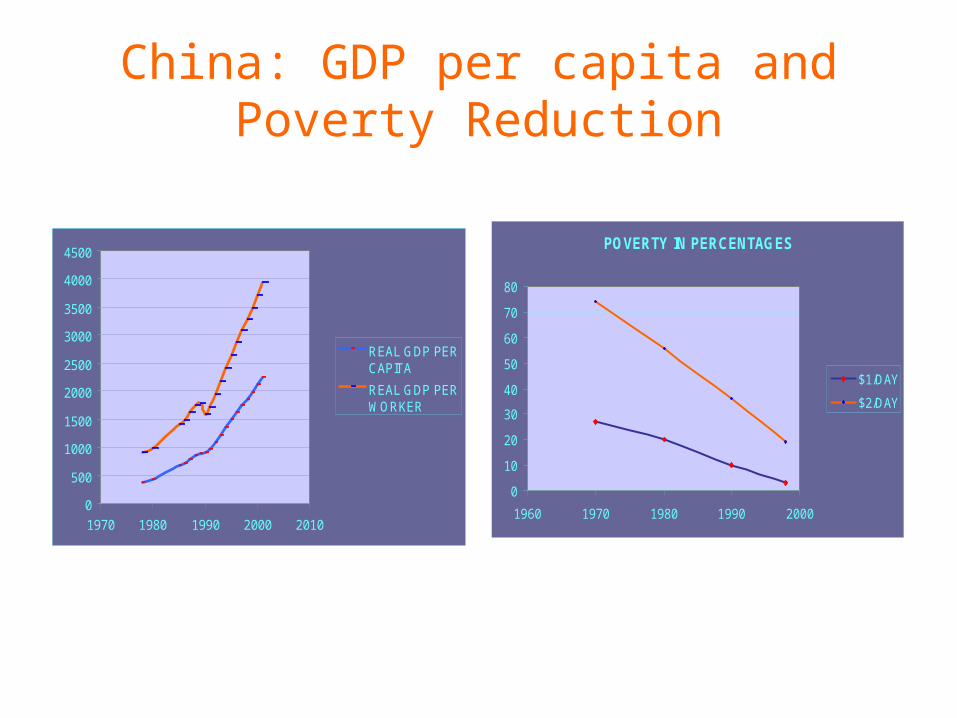
China: GDP per capita and Poverty Reduction
0
500
1000
1500
2000
2500
3000
3500
4000
4500
1970 1980 1990 2000 2010
REAL GDP PERCAPITA
REAL GDP PERWORKER
POVERTY IN PERCENTAGES
0
10
20
30
40
50
60
70
80
1960 1970 1980 1990 2000
$1/DAY
$2/DAY
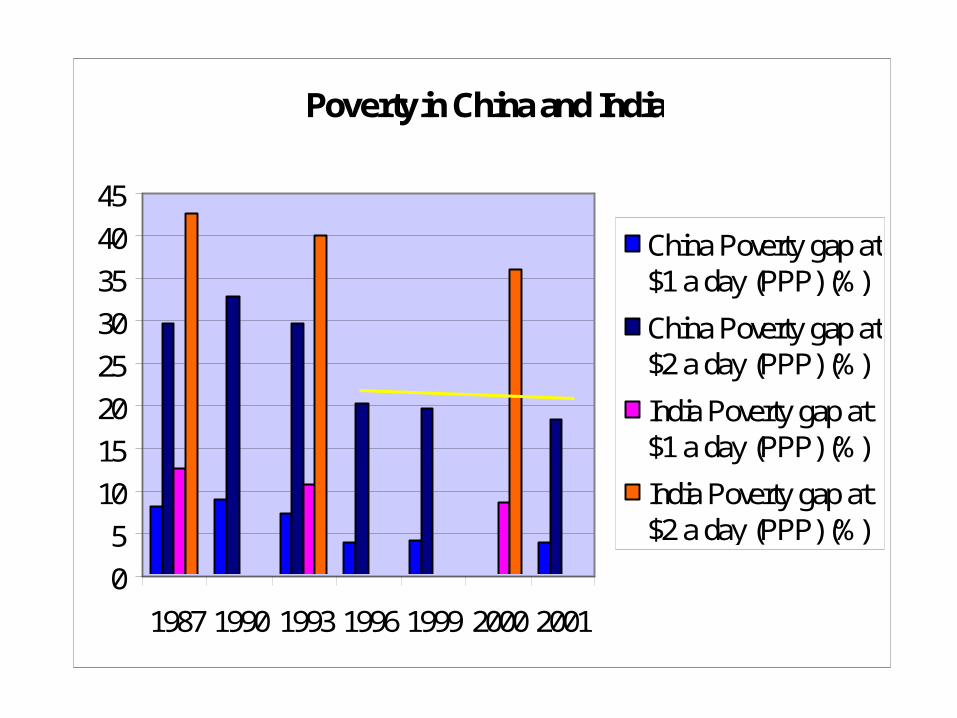
Poverty in China and India
0
5
10
15
20
25
30
35
40
45
1987 1990 1993 1996 1999 2000 2001
China Poverty gap at$1 a day (PPP) (%)
China Poverty gap at$2 a day (PPP) (%)
India Poverty gap at$1 a day (PPP) (%)
India Poverty gap at$2 a day (PPP) (%)

Income Inequality
China: Total Growth and Growth Rate: Per Capita Income: 1995-2004
0.00
2.00
4.00
Gro
wth
0.00
4.00
8.00
12.00
16.00
Gro
wth
Rat
e
Grow th Factor Grow th Rate

GDP per capita: China and India (constant 2000 US$)
0
200
400
600
800
1000
1200
1400
1600
1980
1982
1984
1986
1988
1990
1992
1994
1996
1998
2000
2002
2004
India GDP per capita(constant 2000 US$)
China GDP per capita(constant 2000 US$)

Rural Populations Decline
Rural Population Percentage
50
55
60
65
70
75
80
85
China Rural populationpercentage
India Rural populationpercentage

Saving and Investment
Savings and Investment in India and China
0
5
10
15
2025
30
35
40
45
1980 1984 1988 1992 1996 2000 2004
InvestmentRate (% ofGDP) IndiaSavings Rate(% of GD) India
Gross capitalformation (% ofGDP) ChinaGross savings(% of GDP)China

Leveraging the Global Economy
Trade in Relation to GDP China
0
10
20
30
40
50
60
70
1980
1982
1984
1986
1988
1990
1992
1994
1996
1998
2000
2002
2004
China NE.IMP.GNFS.ZSImports of goods andservices (% of GDP)
China NE.EXP.GNFS.ZSExports of goods andservices (% of GDP)
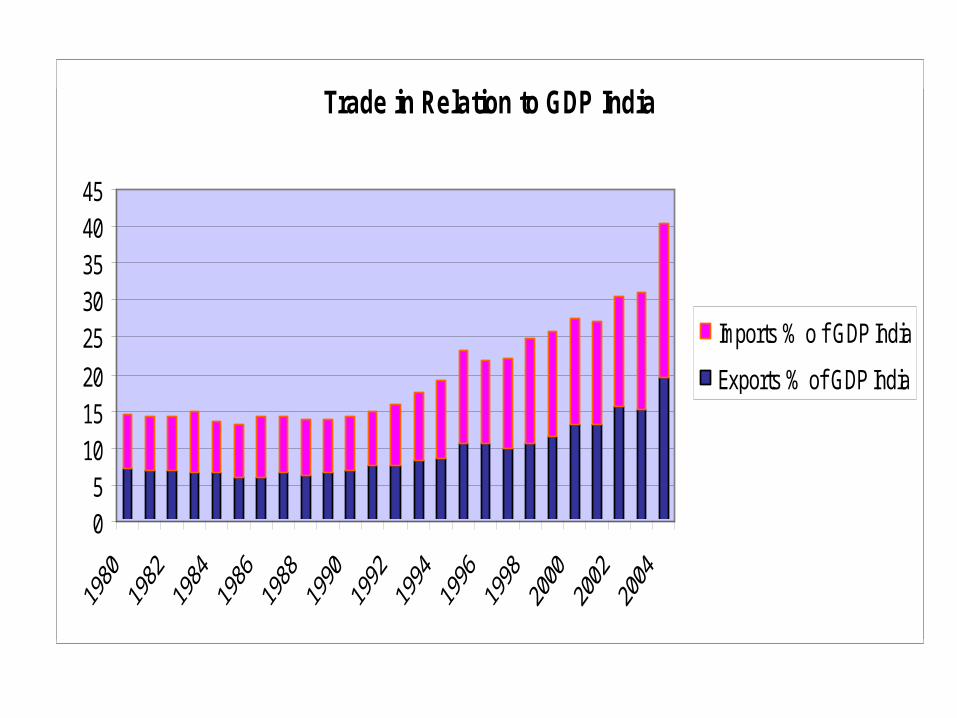
Trade in Relation to GDP India
05
1015202530354045
1980
1982
1984
1986
1988
1990
1992
1994
1996
1998
2000
2002
2004
Imports % o f GDP India
Exports % of GDP India
Trade in Relation to GDP India
05
101520
2530354045
Imports % o f GDP India
Exports % of GDP India
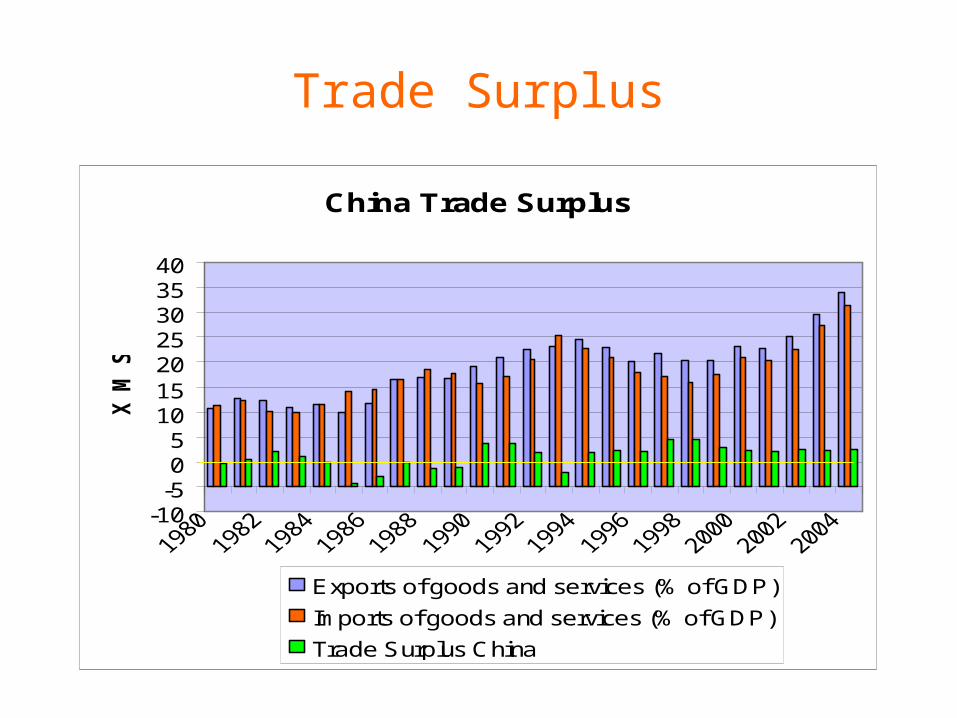
Trade Surplus
China Trade Surplus
-10-505
10152025303540
X M
S
Exports of goods and services (% of GDP)
Imports of goods and services (% of GDP)
Trade Surplus China
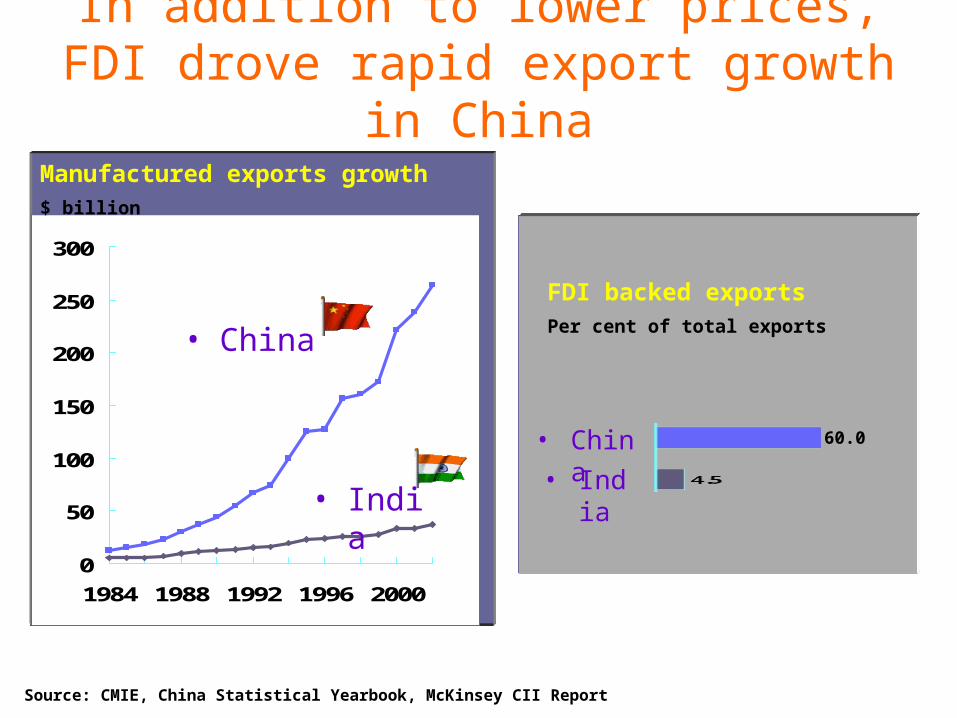
In addition to lower prices, FDI drove rapid export growth in China
0
50
100
150
200
250
300
1984 1988 1992 1996 2000
Manufactured exports growth$ billion
FDI backed exportsPer cent of total exports
• China• India
60.0
• India
• China
Source: CMIE, China Statistical Yearbook, McKinsey CII Report

China vs India - Infrastructure Formation
0306090
120
150180210240270
1985 1987 1989 1991 1993 1995 1997 1999 2001 2003 2005
China India
India (RHS)
China (LHS)
US$ bn
Source: The World Bank; Deutsche Bank; CMIE
US$50 bn over the next 3 years
Public debt: China 24.4% of GDP (2005 est.)
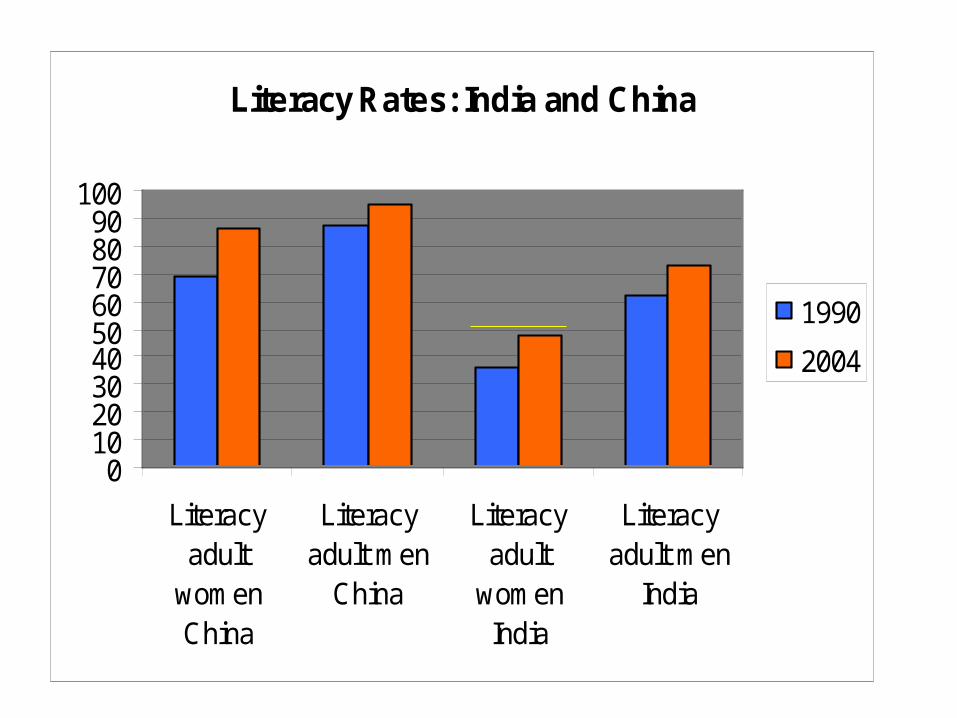
Literacy Rates: India and China
0102030405060708090
100
Literacyadult
womenChina
Literacyadult men
China
Literacyadult
womenIndia
Literacyadult men
India
1990
2004

Deng Xiaoping’s biography in brief
Secretary of Party under Mao
Banished to a tractor factory in Cultural Revolution
Returned under wing of Zhou Enlai
Banished by Gang of Four
Replace Hua Guofeng
Left Hua in Central Committee (essentially for life)
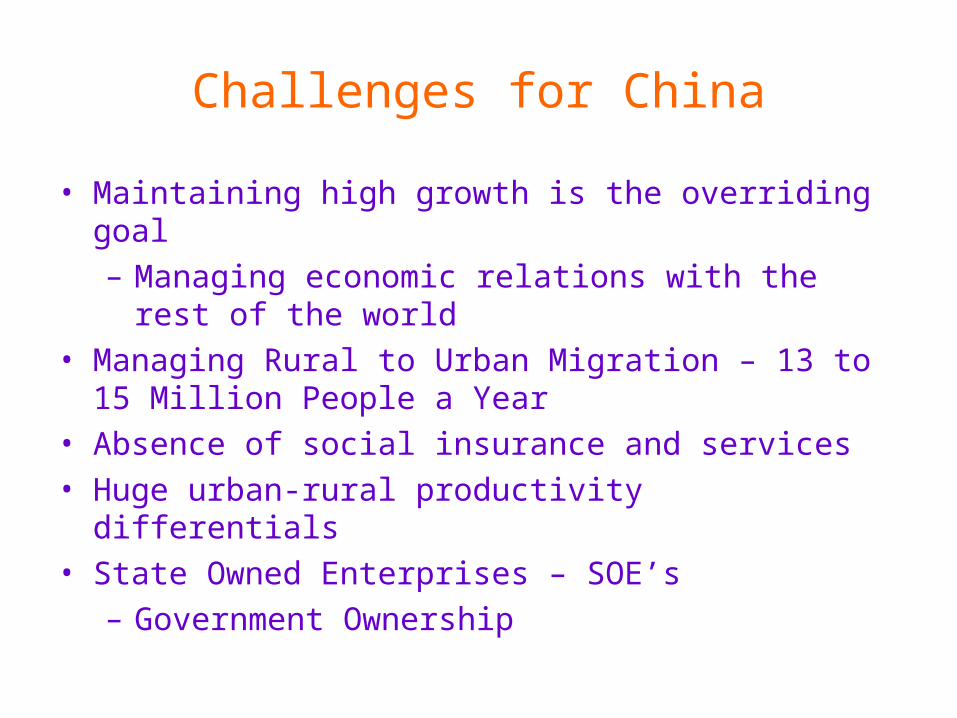
Challenges for China
• Maintaining high growth is the overriding goal– Managing economic relations with the rest of
the world• Managing Rural to Urban Migration – 13 to 15
Million People a Year• Absence of social insurance and services• Huge urban-rural productivity differentials• State Owned Enterprises – SOE’s
– Government Ownership

Capital Markets and Diversifying Sources of Growth
• Capital Markets and investment efficiency– Capital markets are quite underdeveloped
• Exchange Rate and External Imbalance– PBC (our Federal Reserve) accumulation of
foreign reserves • Diversifying sources of growth
– Manufacturing sectors– Service sector– Domestic Market
• “China is several different economies at different stages of development”

Capital Composition

Aside: Global Capital Markets

Gradual Appreciation of Currency is Likely
• The continuing need for direct credit and other controls on investment– Response to interest rates unclear
• Continuing capital controls are required to have a monetary policy targeted to inflation and growth and at the same time retain some control over the exchange rate.
• In addition with immature capital markets, there is the risk of destructive volatility – without capital controls
• Phasing these out at the proper rate as the capital markets develop is a key policy challenge
• Building capital markets and increasing efficiency of investment is a high current priority
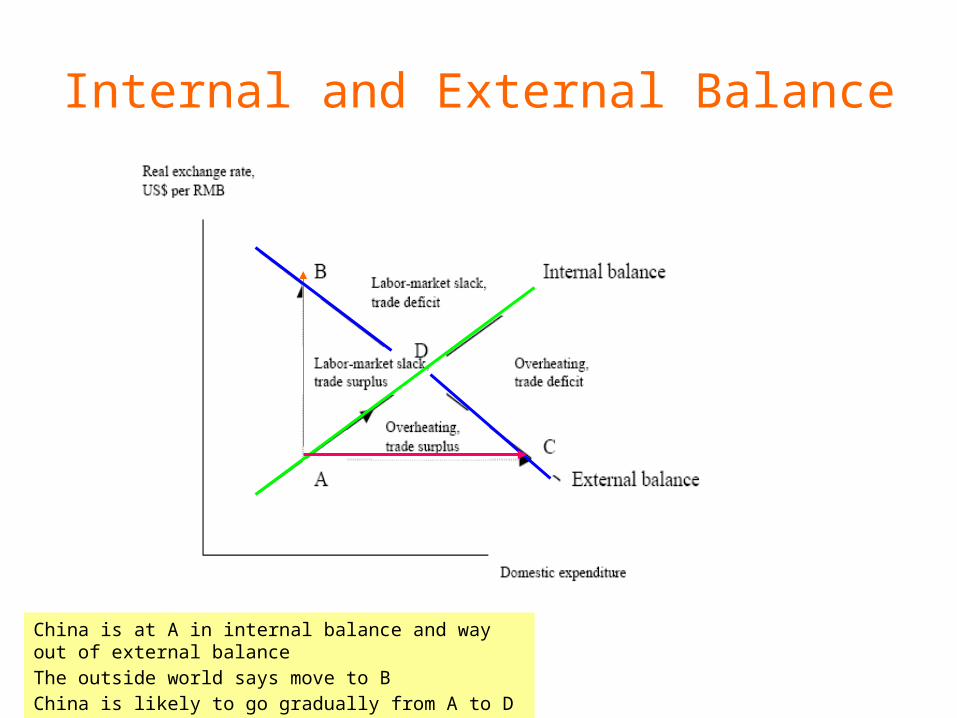
China is at A in internal balance and way out of external balanceThe outside world says move to BChina is likely to go gradually from A to D
Internal and External Balance

Reserves
Foreign Reserve Holdings at the End of 2006
0
200
400
600
800
1000
1200
China
Jap
an
Rus
sia
Rep
ublic
of C
hina
(Taiw
an)
Sout
h Kor
ea In
dia
Sin
gapo
re
Hon
g Kon
g, C
hina
Ger
man
y
Bill
ions
$

Recent Trends
• In 2007 in China– GDP: $2.8 trillion– Forecast trade surplus: $250-$300 billion– Surplus/GDP 10% or more– Investment/GDP: 40-45%– Savings/GDP: 50-55%– Exports + Imports as percentage of GDP: 70%– Reserves at the end of 2006: $1.2 trillion– Likely reserve additions: $400 billion or more– Reserves at the end of 2007: $1.6 trillion

40
50
60
70
80
90
100
110
120
Source: Bloomberg
Jun 97 October 22, 2003
Korean Won
Japanese Yen
Taiwan $
Thai Baht
Chinese Renminbi
China During Currency Crisis1997-1998
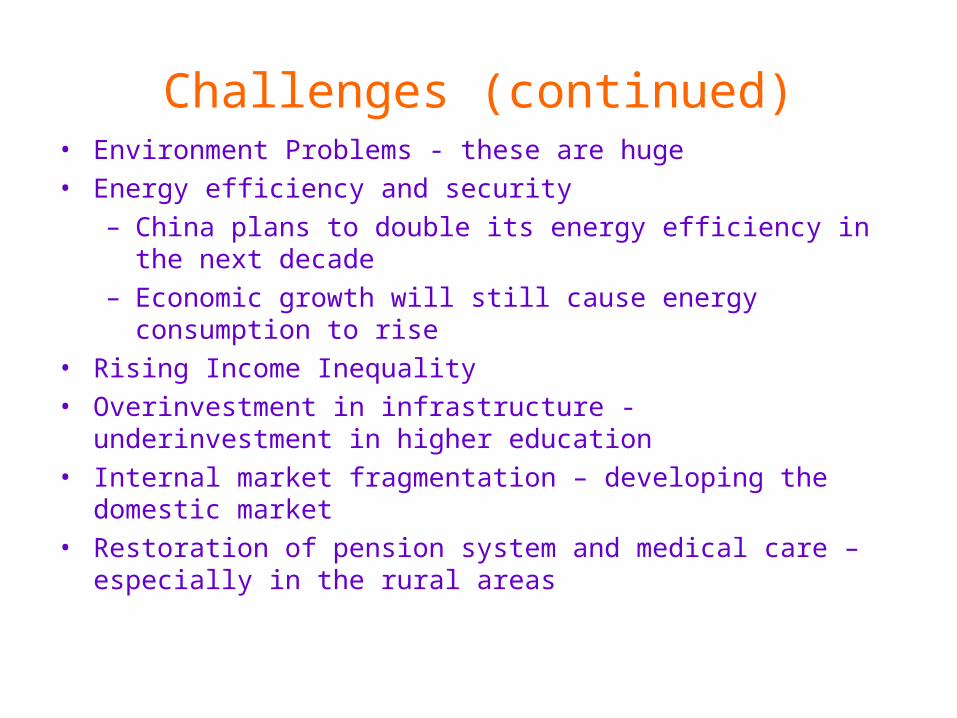
Challenges (continued)• Environment Problems - these are huge• Energy efficiency and security
– China plans to double its energy efficiency in the next decade
– Economic growth will still cause energy consumption to rise
• Rising Income Inequality• Overinvestment in infrastructure - underinvestment in
higher education• Internal market fragmentation – developing the domestic
market• Restoration of pension system and medical care –
especially in the rural areas
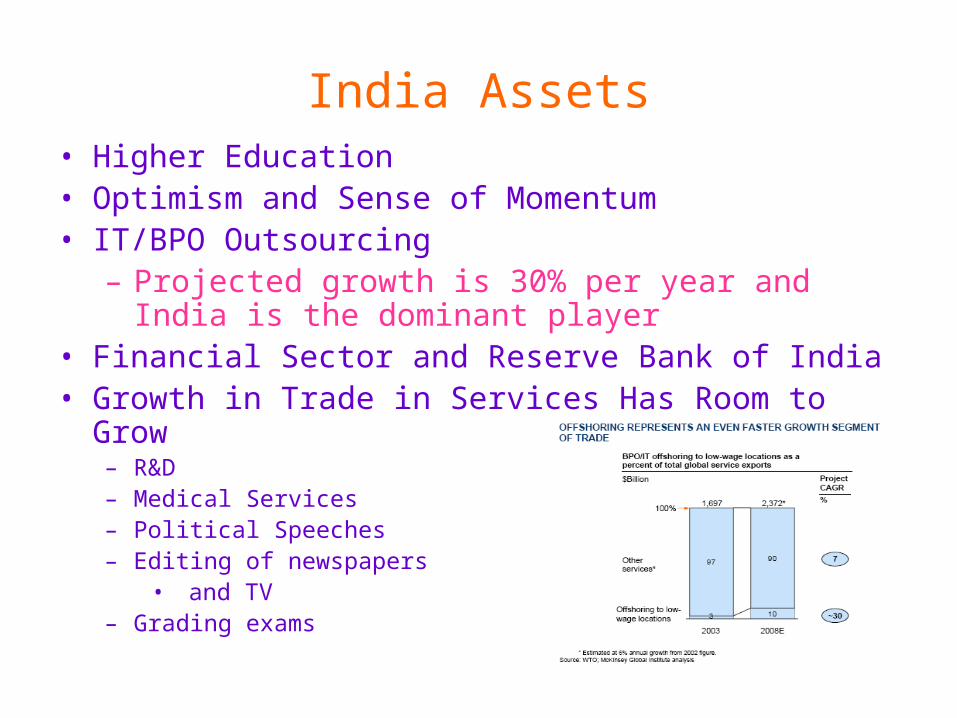
India Assets• Higher Education• Optimism and Sense of Momentum• IT/BPO Outsourcing
– Projected growth is 30% per year and India is the dominant player
• Financial Sector and Reserve Bank of India• Growth in Trade in Services Has Room to Grow
– R&D– Medical Services– Political Speeches– Editing of newspapers
• and TV– Grading exams
But
• This is not enough to produce and sustain high and inclusive growth – Doesn’t employ enough people
• India needs an additional powerful productive employment-generating engine
• This is very well understood by India’s leaders• Labor intensive manufacturing and exports
– Add the China approach to the portfolio• Open up to FDI• Special Export Zones (400+)
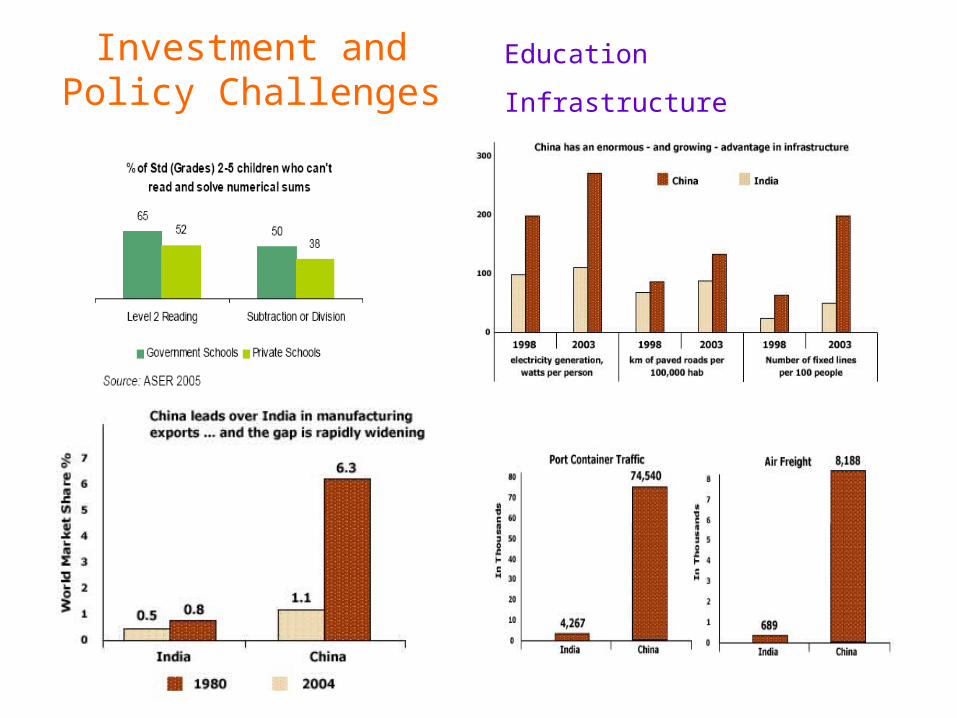
Investment and Policy Challenges
Education
Infrastructure

Efficiency and Investment in Agriculture
Impacts on Global Economy
• Rapidly growing trade with each other• Very large regional impact in east and south Asia
– Demand and imports from each other and more advanced neighbors
– Intense competition for less developed neighbors
• Competitive pressure on advanced economies– Europe in particular with less flexible labor
markets and social safety nets that constrain competitive responses
Demand for Energy and Commodities
• Large incremental demand for raw materials and commodities with effects of prices (China’s equivalent of our interstate highway system is an example)
• Potential scramble for energy security – because of the size of the demand shock
• Increased influence in Africa and other parts of the world
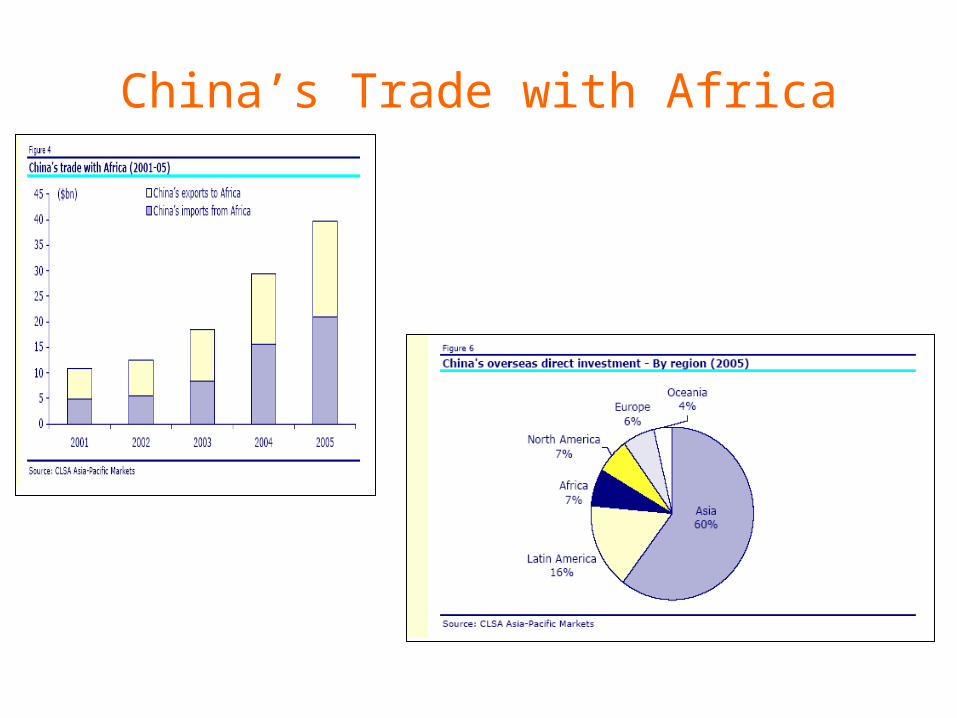
China’s Trade with Africa
Magnitude of Impacts Becoming Material
• In 1980 when China grew ten percent, the absolute increment to global GDP and global demand was insignificant.
• Now the GDP is about 2.22 trillion $, and a ten percent increment is large in absolute terms – The rough equivalent (in terms of global
demand) of about a 1.78% increment in US GDP growth
Demonstration Effects
• India has been galvanized by China’s growth• High growth is possible in a complex democracy• Can other developing countries compete with
China and India– locating comparative advantage
• Quality of the economic policy debate

The Latest Entrant: Vietnam
Vietnam: GDP per capita
0
500
1000
1500
2000
2500
3000
1980
1982
1984
1986
1988
1990
1992
1994
1996
1998
2000
2002
2004
GDP per capita, PPP (constant 2000 international $)
Growth Rate 5.88%

South Africa: GDP/capita PPP adjusted constant dollars
0
2000
4000
6000
8000
10000
12000

South Africa: Saving and Investment
05
10152025303540
Gross capital formation (% of GDP)
Gross domestic savings (% of GDP)

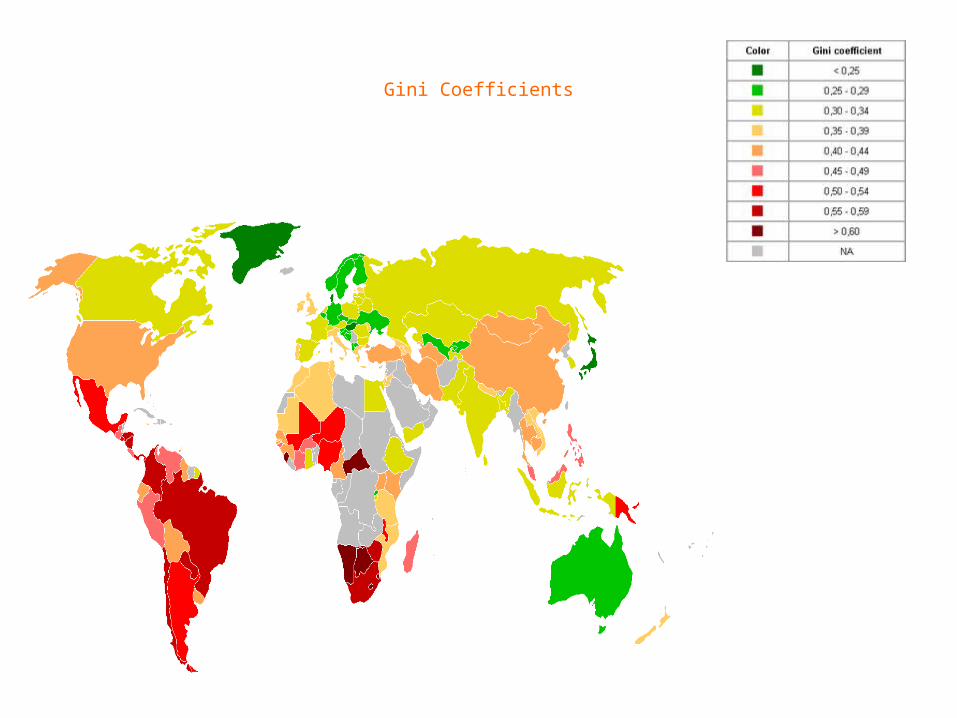
South Africa Gini Coefficient
0
10
20
30
40
50
60
70

Rising Income Inequality and Resistance to Globalization
• Developed Countries– Middle income lag– Protectionist sentiment– Trade in services and
globalization of some labor markets
– Impact of technology
• Developing Countries– Rising inequality side
effect of benign growth dynamics (China and India)
– “Inclusiveness”– Unequal distribution of
assets can retard growth
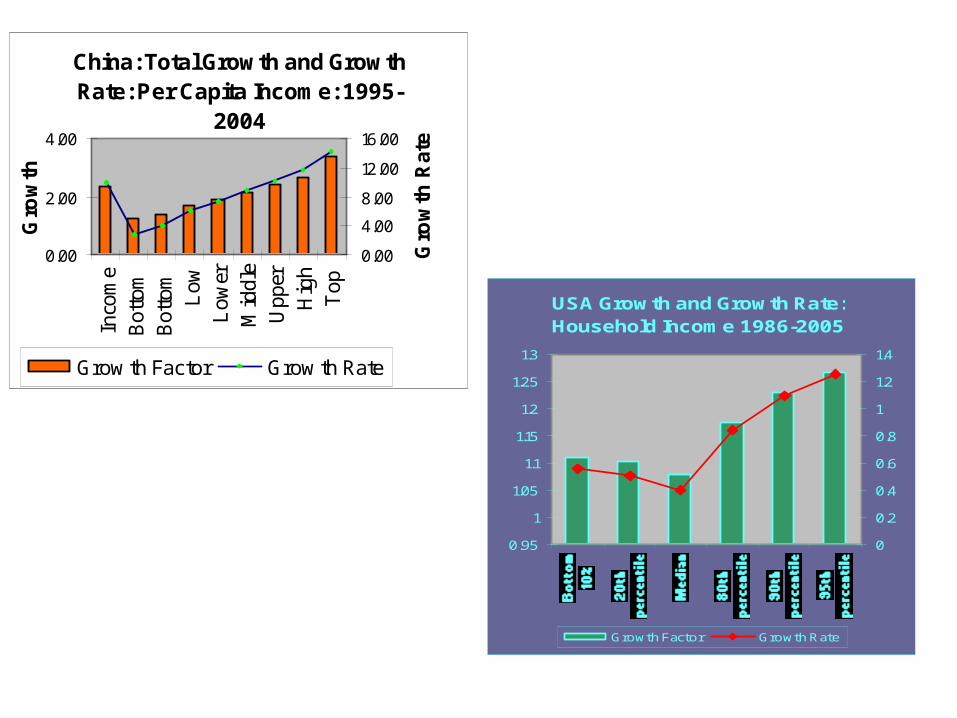
USA Growth and Growth Rate: Household Income 1986-2005
0.95
1
1.05
1.1
1.15
1.2
1.25
1.3
0
0.2
0.4
0.6
0.8
1
1.2
1.4
Growth Factor Growth Rate
China: Total Growth and Growth Rate: Per Capita Income: 1995-
2004
0.00
2.00
4.00
Income
Bottom
Bottom
Low
Lower
Middle
Upper
High
Top
Gro
wth
0.00
4.00
8.00
12.00
16.00
Gro
wth
Rat
e
Grow th Factor Grow th Rate
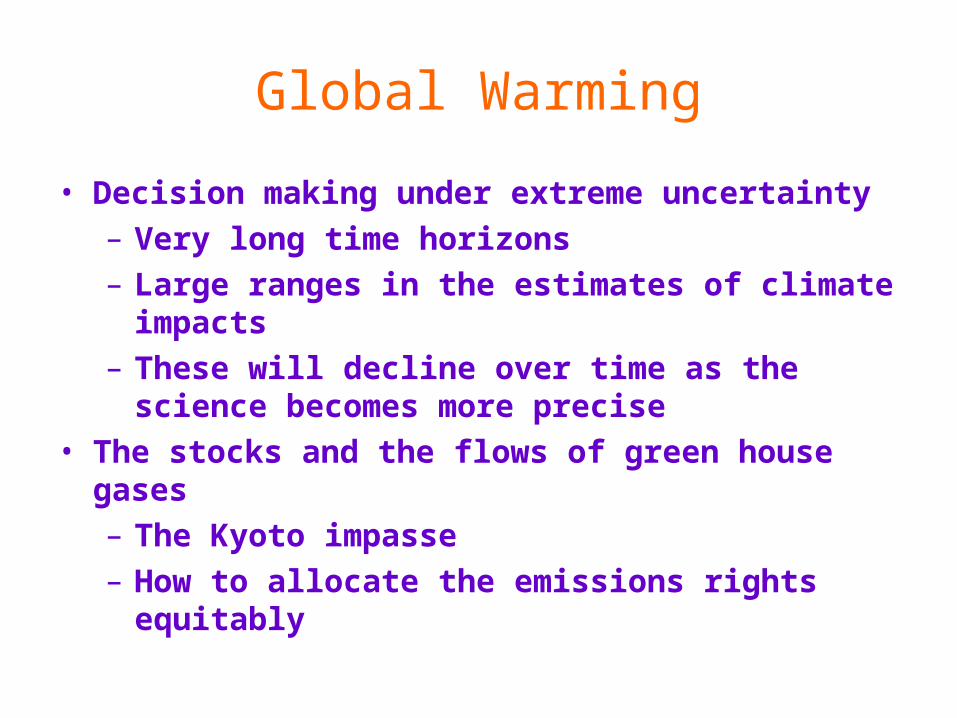
Global Warming
• Decision making under extreme uncertainty– Very long time horizons– Large ranges in the estimates of climate
impacts– These will decline over time as the
science becomes more precise• The stocks and the flows of green house
gases– The Kyoto impasse– How to allocate the emissions rights
equitably

Three Major Sets of Issues
• 1. Mitigation – Allocation of emissions rights across countries– Efficiency – carbon trading market mechanisms
• 2. Technology – Reduction of the costs of mitigation– Subsidies and rapid transfer globally
• 3. Adaptation– Capacity to adapt to climate change that does
occur– Poorer country problem
• RESPONDING TO CLIMATE CHANGE IS A MAJOR TEST OF OUR COLLECTIVE CAPACITY FOR GLOBAL GOVERNANCE

Demand for Energy and Commodities
• Large incremental demand for raw materials, commodities, and energy with effects on prices (China’s construction of the equivalent of the US interstate highway system is an example)
• For developing countries with commodity exports, the effect can be beneficial in the short run – but rising commodity prices is not a basis for sustained growth
• Generally rising energy costs hurt poor countries more than richer ones
• Potentially damaging scramble for energy security – because of the size of the demand shock – and the potential for supply problems in unstable regions


Global “Imbalances”

United States Savings and Foreign Reserves
Foreign Reserve Holdings at the End of 2006
0
200
400
600
800
1000
1200
China
Jap
an
Rus
sia
Rep
ublic
of C
hina
(Taiw
an)
Sout
h Kor
ea In
dia
Sin
gapor
e
Hon
g Kon
g, C
hina
Ger
man
y
Bill
ions
$
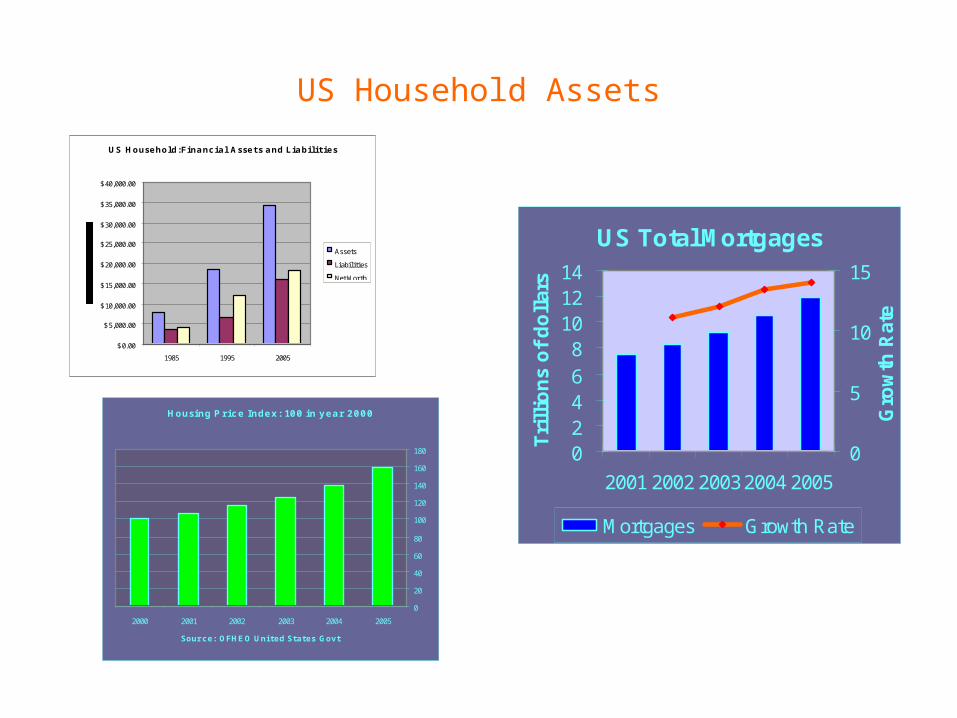
US Household Assets
US Household:Financial Assets and Liabilities
$0.00
$5,000.00
$10,000.00
$15,000.00
$20,000.00
$25,000.00
$30,000.00
$35,000.00
$40,000.00
1985 1995 2005
Assets
Liabilities
Net Worth
US Total Mortgages
02468
101214
2001 2002 20032004 2005
Tri
llio
ns
of
do
llar
s
0
5
10
15
Gro
wth
Rat
e
Mortgages Growth Rate
Housing Price Index: 100 in year 2000
0
20
40
60
80
100
120
140
160
180
200520042003200220012000
Source: OFHEO Uni ted States Govt

Recent Trends
• In 2007 in China– GDP: $2.8 trillion– Forecast trade surplus: $250-$300 billion– Surplus/GDP 10% or more– Investment/GDP: 40-45%– Savings/GDP: 50-55%– Exports + Imports as percentage of GDP: 70%– Reserves at the end of 2006: $1.2 trillion– Likely reserve additions: $400 billion or more– Reserves at the end of 2007: $1.6 trillion