the influence of the shape and configuration of sensitizer
TRANSCRIPT

RSC Advances
PAPER
Ope
n A
cces
s A
rtic
le. P
ublis
hed
on 2
9 Ja
nuar
y 20
21. D
ownl
oade
d on
2/2
2/20
22 8
:47:
25 P
M.
Thi
s ar
ticle
is li
cens
ed u
nder
a C
reat
ive
Com
mon
s A
ttrib
utio
n-N
onC
omm
erci
al 3
.0 U
npor
ted
Lic
ence
.
View Article OnlineView Journal | View Issue
The influence of
Department of Physics, Bharathiar Un
+91-422-2422387. E-mail: [email protected]
† Electronic supplementary informa10.1039/d0ra10613e
Cite this: RSC Adv., 2021, 11, 5556
Received 17th December 2020Accepted 4th January 2021
DOI: 10.1039/d0ra10613e
rsc.li/rsc-advances
5556 | RSC Adv., 2021, 11, 5556–556
the shape and configuration ofsensitizer molecules on the efficiency of DSSCs:a theoretical insight†
S. Krishnan and K. Senthilkumar *
The sensitizer is an active component of dye sensitized solar cell (DSSC) technology, which is highly
influential for the performance of DSSCs. The present study attempts to investigate the relationship
between the shape of the sensitizer molecule and efficiency of DSSCs. Specifically, 17 different
structures were investigated, and classified into four categories based on the shape of the dye molecule,
namely L-shaped (linear), V-shaped, X-shaped and Y-shaped, and into two different categories based on
the donor moiety. The five of studied structures contained a triphenylamine (TPA) donor moiety, and
twelve structures contained carbazole (CAR) donor moiety. Parameters related to the performance of
DSSCs such as absorption spectra, intramolecular charge transfer indices, frontier molecular orbitals,
light harvesting efficiency, excited-state lifetime, exciton binding energy, electrostatic potential, charge
transfer and electron injection ability were studied using results obtained from electronic structure
calculations. The analysis of these various parameters showed that the linear-shaped and V-shaped
sensitizers possess better photon absorption ability, and the V-shaped structure is best suited shape for
applications in high performance DSSCs.
1. Introduction
Energy plays a vital role in global economy, and thus energyscarcity will cause critical issues in almost all the aspects ofdaily life. Currently, it is important to identify energy produc-tion methods that are more efficient and environmentalfriendly.1,2 The production of renewable energy providesa solution to both energy demands and environmentalconcerns.3 In this case, solar energy harvesting using photo-voltaic technology seems to be a very viable choice.4–6 Sinceconventional silicon-based technology is expensive, research isfocused on comparatively cheaper photovoltaic technologiessuch as perovskite solar cells (PSCs), dye sensitised solar cells(DSSCs), organic solar cells (OSC), and quantum dot solar cells(QDSC). These new generation solar cell technologies arecharacterised by good exibility, low production costs andbiodegradability. However, new generation photovoltaic tech-nology has not achieved the required efficiency for its wideapplicability.
Among the available photovoltaic technologies, dye sensi-tised solar cells (DSSCs) are a promising technology. Althoughthe efficiency level of DSSCs is modest under full light condi-tions, they are the best choice under dim light conditions.7 Also,
iversity, Coimbatore, 641046, India,
.in
tion (ESI) available. See DOI:
7
DSSCs offer decent scope for improvement in efficiency chieyby tuning the opto-electronic properties of the dye material,which is an active component of this technology with tuneablesubstitutions and structural modications.8–10 There are twomain factors that determine the power conversion efficiency(PCE) of DSSCs, namely, the short circuit current (Jsc) and theopen circuit voltage (Voc). The electronic properties of a sensi-tizer molecule directly impact Jsc since the sensitizer isresponsible for harvesting solar light, and thereby accounts forthe number of charge carriers produced and injected into theoxide layer.11,12 On the other hand, the dye molecule can inu-ence the Voc of DSSCs through its participation in energy levelalignment and control over recombination losses. Numerousexperimental and theoretical studies have reported with the aimof improving solar cell efficiency based on its structure andcompositional tuning.8,9,12–21 These efforts have led to a gradualincrease in the efficiency of DSSCs, where the maximum effi-ciency of up to 14.3% was achieved under full light conditions,22
while efficiency up to 28.9% has been reported under dim lightconditions.23 Hence, structural and compositional modica-tions are common strategies to improve the efficiency of DSSCs,particularly manipulating the shape of the dye molecule, andthere are several reports on the effect of the shape of dyemolecules on the performance of DSSCs.13–15,18–21,24–28
The implications of shape modications of the sensitizermolecule on the efficiency of DSSCs is not straightforward, andthus it is difficult to develop a benchmark shape for a sensitizerthat results in high efficiency in DSSCs. This is because the
© 2021 The Author(s). Published by the Royal Society of Chemistry
Paper RSC Advances
Ope
n A
cces
s A
rtic
le. P
ublis
hed
on 2
9 Ja
nuar
y 20
21. D
ownl
oade
d on
2/2
2/20
22 8
:47:
25 P
M.
Thi
s ar
ticle
is li
cens
ed u
nder
a C
reat
ive
Com
mon
s A
ttrib
utio
n-N
onC
omm
erci
al 3
.0 U
npor
ted
Lic
ence
.View Article Online
shape of the dye can inuence several factors that are related tothe PCE of DSSCs, where it can have a positive impact on certainparameters, while the same shape may have a negative impacton other parameters. For instance, a branched sensitizer(instead of linear sensitizer) can be helpful in decreasing theenergy quenching effect that occurs between dye molecules andscreening TiO2–electrolyte interactions, but it may reduce thedye loading on the surface of TiO2, thereby reducing the amountof charge generated. Also, it is known that the frontier molec-ular orbital patterns and their energies responsible for the opto-electronic properties of dye molecules strongly depend on theshape of the dye molecule and functional groups present on it.Therefore, it is important to develop a design that balancesdifferent aspects of the sensitizer towards high PCE. In thisdirection, Yuezhen et al.19 performed an experimental study toinvestigate the impact of the shape of the sensitizer on the PCEof DSSC, particularly focusing on the angle between the donorand acceptor moieties (are angle). Their study concluded thatthe dyes with a larger are angle of about 150.6� between thedonor and acceptor units are suitable for DSSC applications.There are several other studies that investigated sensitizers ofdifferent shapes, such as X-shaped, Y-shaped, linear, branched,H-shaped, V-shaped, and rod-shaped sensitizers,5,10,13–15,18–21,24–28
most of which were carried out independently, lack consistencyin the description rules for the sensitizer molecular shape anddo not present any insight into how sensitizers of differentshapes differ under identical conditions of examination toreach a benchmark on the shape of the sensitizer.
To form consolidated conclusions, a collective study thatencompasses several shapes of dyes in a uniform platformmustbe performed. Thus, this study is an attempt to achieve this goaland will present more clarity on the design strategy for sensi-tizers and their relationship with the PCE. In the present work,electronic structure calculations were performed on 17 differentstructures, which can be classied into four categories based ontheir shape, namely linear-shaped, V-shaped, X-shaped and Y-shaped sensitizers. The studied structures can also be classi-ed in terms of their donor moieties, namely triphenylamine(TPA)-based sensitizers and carbazole (CAR)-based sensitizers.One of the studied sensitizers (TPAL1) was previously reportedby Kuan-Fu Chen et al.29 and was shown to provide a modestPCE of 4.40%, while the other sensitizers were newly designed.This study was limited to investigating the opto-electronicproperties of the individual sensitizer molecules, such as theirabsorption spectrum, intra-molecular charge transfer and otherparameters related to the Jsc and Voc.
2. Theoretical background andmethodology
The power conversion efficiency (PCE) is a measure of theperformance of any type of solar cell, which refers to thepercentage of incident light that a solar cell can harvest. ThePCE (h) is given by the expression30
h ¼ ffVocJsc
Pinc
(1)
© 2021 The Author(s). Published by the Royal Society of Chemistry
where ff is the ll factor of the solar cell, Voc is the open circuitvoltage, Jsc is the short circuit current and Pinc refers to thepower of incident solar radiation ux. In the above expression,Voc and Jsc are parameters that can be tuned to improve the PCE.Although the expression for the PCE is generic for all photo-voltaic technologies, the Voc and Jsc are dependent on thecomponents of the specic technology.
The short-circuit current (Jsc) of a DSSC is given by31
Jsc ¼ðl
LHEðlÞ4injecthcollectdl (2)
where LHE (l) refers to the light harvesting efficiency ata particular absorption wavelength, l, of a dye molecule, 4inject
refers to the electron injection efficiency and hcollect is thecharge collection efficiency. It should be noted that the LHE (l)is completely a sensitizer-dependent factor, whereas 4inject ispartially dependent on the sensitizer and hcollect is a parameterthat is dependent on the recombination lifetime and diffusiontransit time. LHE (l) can be calculated through electronicstructure calculations of the photo-excitation occurring ina system with a known ground state electronic structure, whichis given by the expression32
LHE (l) ¼ 1 � 10�f (3)
where f refers to the oscillator strength, which corresponds tothe spectrum. The excited state (uorescence) lifetime of a dyeis calculated through the expression33
s ¼ 1.499/fE2 (4)
where f is the oscillator strength and E is the excitation energy.The electron injection efficiency of the dye can be evaluatedthrough the change in the Gibbs free energy, which correspondsto the electron injection,34 DGinject
DGinject ¼ Edye* � ECB ¼ (Edye � E0–0) � ECB (5)
where Edye* refers to the excited-state oxidation potential energyof the dye, Edye refers to the ground state oxidation potentialenergy, ECB refers to the conduction band edge of the semi-conductor (TiO2) and E0–0 refers to the vertical electronic tran-sition energy.
The open circuit voltage (Voc) depends on the energy levelalignment between layers (dye–TiO2 substrate and dye–electro-lyte interface) and the recombination loss. These factors can beanalyzed through the results of the electronic structure calcu-lations. In addition to the above parameters, which are directlyrelated to the magnitude of Voc and Jsc, the reorganizationenergy and excited state lifetime of a dye molecule are alsoimportant. The reorganization energy (Ereorg) of the dye whileundergoing oxidation is given by35
Ereorg ¼ [E+(g0) � E+(g+)] + [E0(g+) � E0(g0)] (6)
where E+(g0) is the total energy of the cationic state in theneutral geometry, E+(g+) is the total energy of the cationic statein the cationic geometry, E0(g+) is the total energy of the neutral
RSC Adv., 2021, 11, 5556–5567 | 5557
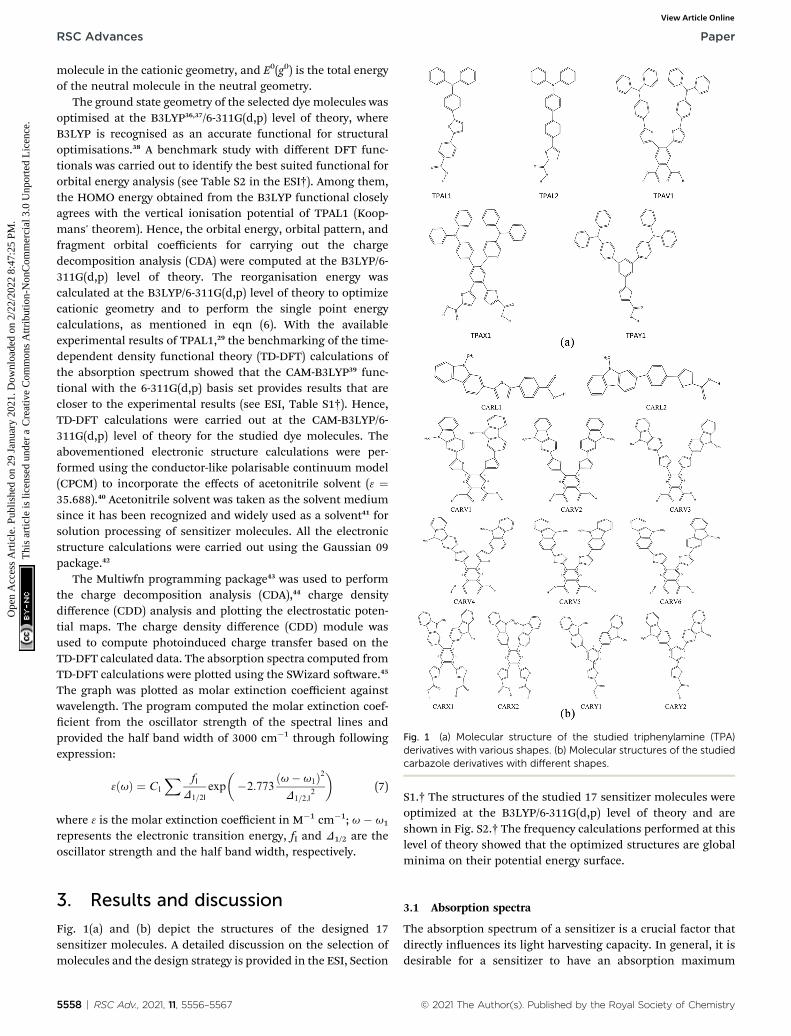
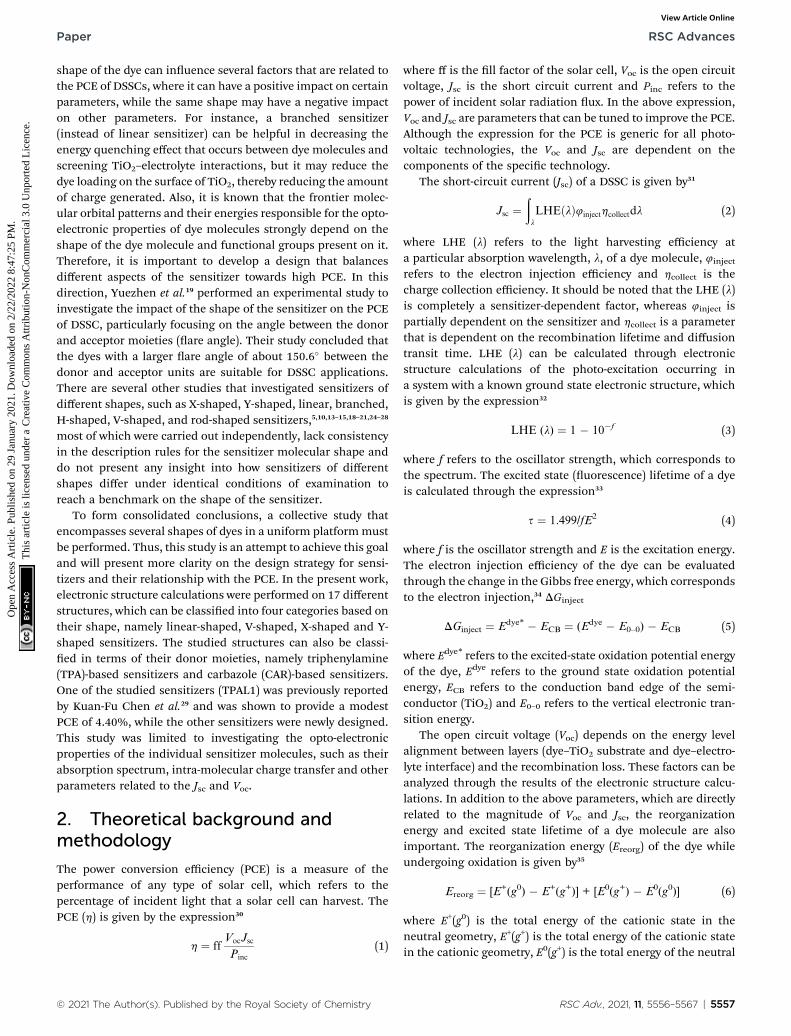
Fig. 1 (a) Molecular structure of the studied triphenylamine (TPA)derivatives with various shapes. (b) Molecular structures of the studiedcarbazole derivatives with different shapes.
RSC Advances Paper
Ope
n A
cces
s A
rtic
le. P
ublis
hed
on 2
9 Ja
nuar
y 20
21. D
ownl
oade
d on
2/2
2/20
22 8
:47:
25 P
M.
Thi
s ar
ticle
is li
cens
ed u
nder
a C
reat
ive
Com
mon
s A
ttrib
utio
n-N
onC
omm
erci
al 3
.0 U
npor
ted
Lic
ence
.View Article Online
molecule in the cationic geometry, and E0(g0) is the total energyof the neutral molecule in the neutral geometry.
The ground state geometry of the selected dye molecules wasoptimised at the B3LYP36,37/6-311G(d,p) level of theory, whereB3LYP is recognised as an accurate functional for structuraloptimisations.38 A benchmark study with different DFT func-tionals was carried out to identify the best suited functional fororbital energy analysis (see Table S2 in the ESI†). Among them,the HOMO energy obtained from the B3LYP functional closelyagrees with the vertical ionisation potential of TPAL1 (Koop-mans' theorem). Hence, the orbital energy, orbital pattern, andfragment orbital coefficients for carrying out the chargedecomposition analysis (CDA) were computed at the B3LYP/6-311G(d,p) level of theory. The reorganisation energy wascalculated at the B3LYP/6-311G(d,p) level of theory to optimizecationic geometry and to perform the single point energycalculations, as mentioned in eqn (6). With the availableexperimental results of TPAL1,29 the benchmarking of the time-dependent density functional theory (TD-DFT) calculations ofthe absorption spectrum showed that the CAM-B3LYP39 func-tional with the 6-311G(d,p) basis set provides results that arecloser to the experimental results (see ESI, Table S1†). Hence,TD-DFT calculations were carried out at the CAM-B3LYP/6-311G(d,p) level of theory for the studied dye molecules. Theabovementioned electronic structure calculations were per-formed using the conductor-like polarisable continuum model(CPCM) to incorporate the effects of acetonitrile solvent (3 ¼35.688).40 Acetonitrile solvent was taken as the solvent mediumsince it has been recognized and widely used as a solvent41 forsolution processing of sensitizer molecules. All the electronicstructure calculations were carried out using the Gaussian 09package.42
The Multiwfn programming package43 was used to performthe charge decomposition analysis (CDA),44 charge densitydifference (CDD) analysis and plotting the electrostatic poten-tial maps. The charge density difference (CDD) module wasused to compute photoinduced charge transfer based on theTD-DFT calculated data. The absorption spectra computed fromTD-DFT calculations were plotted using the SWizard soware.45
The graph was plotted as molar extinction coefficient againstwavelength. The program computed the molar extinction coef-cient from the oscillator strength of the spectral lines andprovided the half band width of 3000 cm�1 through followingexpression:
3ðuÞ ¼ C1
X fΙ
D1=2Ιexp
��2:773
ðu� u1Þ2D1=2;Ι
2
�(7)
where 3 is the molar extinction coefficient in M�1 cm�1; u � u1
represents the electronic transition energy, fI and D1/2 are theoscillator strength and the half band width, respectively.
3. Results and discussion
Fig. 1(a) and (b) depict the structures of the designed 17sensitizer molecules. A detailed discussion on the selection ofmolecules and the design strategy is provided in the ESI, Section
5558 | RSC Adv., 2021, 11, 5556–5567
S1.† The structures of the studied 17 sensitizer molecules wereoptimized at the B3LYP/6-311G(d,p) level of theory and areshown in Fig. S2.† The frequency calculations performed at thislevel of theory showed that the optimized structures are globalminima on their potential energy surface.
3.1 Absorption spectra
The absorption spectrum of a sensitizer is a crucial factor thatdirectly inuences its light harvesting capacity. In general, it isdesirable for a sensitizer to have an absorption maximum
© 2021 The Author(s). Published by the Royal Society of Chemistry

Paper RSC Advances
Ope
n A
cces
s A
rtic
le. P
ublis
hed
on 2
9 Ja
nuar
y 20
21. D
ownl
oade
d on
2/2
2/20
22 8
:47:
25 P
M.
Thi
s ar
ticle
is li
cens
ed u
nder
a C
reat
ive
Com
mon
s A
ttrib
utio
n-N
onC
omm
erci
al 3
.0 U
npor
ted
Lic
ence
.View Article Online
centered between 500–600 nm (ref. 46) so that its absorptionspectrum will match with AM 1.5 solar spectrum irradiance.However, it is challenging to design and synthesize metal-freesensitizers with spectral maxima in this range with a broaderspectral coverage. Most of the metal-free sensitizers showa spectral maximum (lmax) centered below 500 nm and almostall of them have a very narrow spectral distribution. Theabsorption spectra of the studied TPA- and CAR-based sensi-tizers are shown in Fig. 2(a) and (b), and the corresponding datais presented in Tables 1 and 2, respectively.
It was observed that the TPA donors was more benecial forthe molar absorption coefficient of the sensitizer than the CARdonors. For both cases, the spectra were plotted for wavelengthsabove 300 nm. As shown in Fig. 1(a), the spectral maximum forTPAL1 was located at 368 nm, which is the highest lmax amongthe TPA-based sensitizers. The reason for the linear-shapedsensitizer, TPAL1, having the highest lmax is that the elec-tronic transition corresponding to lmax is from the HOMO to
Fig. 2 (a) Absorption spectra of TPA-based sensitizers with differentacetonitrile solvent medium (the spectra were simulated using a GaussiAbsorption spectra of CAR-based sensitizers with different shapes comsolvent medium (the spectra were simulated using a Gaussian distributio
© 2021 The Author(s). Published by the Royal Society of Chemistry
LUMO and the energy gap is low, whereas for the other shapedsensitizers, the orbitals adjacent to the frontier molecularorbitals (FMO) also signicantly contribute as dominatingtransitions. For instance, in the TPAL2 and CARL2 sensitizerswhere thiophene is placed adjacent to the –COOH group, thecontribution from the HOMO to LUMO transition to thedominant peak is relatively less, resulting in a blue shi in thespectrum with respect to TPAL1 and CARL1, respectively.Among the CAR-based sensitizers, the maximum wavelength(lmax) of 365 nm and 364 nm was observed for CARV3 andCARV4, respectively. It should be noted that for CARV3 andCARV4, the electronic transition corresponding to lmax isdominantly from the HOMO to LUMO (approximately 80%), asin the case of CARL1. With respect to lmax of CARL1, the lmax ofCARV3 and CARV4 is red shied by 14 nm. Besides, these twosensitizers have a dominant peak at around 322 nm. Thereby,CARV3 and CARV4 showed a wider spectral distribution thanthat of other studied sensitizers. It was observed that the
shapes computed at the CAM-B3LYP/6-311G(d,p) level of theory inan distribution centered at the computed absorption wavelength). (b)puted at the CAM-B3LYP/6-311G(d,p) level of theory in acetonitrilen centered at the computed absorption wavelength).
RSC Adv., 2021, 11, 5556–5567 | 5559

Table 1 Computed absorption wavelength (nm), energy (eV) andoscillator strength (a.u.) of the TPA-based derivatives in acetonitrilesolvent medium. In the orbital transitions, H and L represent theHOMO and LUMO, respectively
Molecule l (nm)Absorption energy(eV) f (a.u.) Orbital transition
TPAL1 368 3.37 1.47 H / L (73%)H�1 / L (14%)H / L+1 (10%)
TPAL2 341 3.64 1.55 H / L (59%)H�1 / L (22%)H / L+1 (14%)
TPAV1 340 3.64 1.72 H�1 / L (46%)H / L+1 (25%)H / L+2 (12%)H�3 / L (8%)
TPAX1 295 4.21 1.24 H�1 / L+2 (38%)H / L+3 (28%)
TPAY1 313 3.96 1.12 H / L (30%)H / L+2 (28%)H / L+1 (27%)H / L+1 (43%)
305 4.07 1.01 H�2 / L (25%)
Table 2 Computed absorption wavelength (nm), energy (eV) andoscillator strength (a.u.) of the CAR-based derivatives in acetonitrilesolvent medium. In the orbital transitions, H and L represent theHOMO and LUMO, respectively
Molecule l (nm)Absorption energy(eV) f (a.u.) Orbital transition
CARL1 350 3.54 1.42 H / L (80%)CARL2 329 3.77 1.37 H / L (64%)
H�2 / L (21%)CARV1 320 3.87 1.68 H�1 / L (43%)
H / L+1 (25%)CARV2 319 3.89 1.78 H�1 / L (80%)
H / L+1 (64%)H�3 / L (21%)
CARV3 365 3.40 1.08 H / L (78%)322 3.85 1.25 H / L+1 (35%)
H�1 / L (24%)H�3 / L (19%)
CARV4 364 3.41 1.12 H / L (78%)322 3.85 1.10 H / L+1 (35%)
H�1 / L (24%)H�3 / L (19%)
CARV5 321 3.86 1.50 H�1 / L (40%)H / L+1 (27%)
CARV6 321 3.86 1.56 H�1 / L (37%)H / L+1 (28%)H�3 / L (12%)
CARX1 278 4.46 1.11 H�3 / L+1 (25%)H / L+3 (23%)H�2 / L+3 (20%)
CARX2 278.5 4.45 1.21 H�3 / L+1 (28%)H / L+3 (22%)H�2 / L+3 (21%)
CARY1 298 4.16 1.03 H�4 / L (70%)H�3 / L (16%)
CARY2 264 4.70 1.00 H�3 / L+1 (28%)H�3 / L+2 (34%)H�2 / L+1 (29%)H�1 / L+3 (15%)
RSC Advances Paper
Ope
n A
cces
s A
rtic
le. P
ublis
hed
on 2
9 Ja
nuar
y 20
21. D
ownl
oade
d on
2/2
2/20
22 8
:47:
25 P
M.
Thi
s ar
ticle
is li
cens
ed u
nder
a C
reat
ive
Com
mon
s A
ttrib
utio
n-N
onC
omm
erci
al 3
.0 U
npor
ted
Lic
ence
.View Article Online
CARV1, CARV2, CARV5 and CARV6 molecules have a relativelyhigher molar absorption coefficient corresponding to lmax.Among the V-shaped sensitizers, the distinct optical behavior ofCARV3 and CARV4 is related to the orientation of the thiophenerings, which are oriented oppositely and outwards from the p
bridge. The spectral distribution of the X- and Y-shaped sensi-tizers was unsatisfactory for application as active componentsin photovoltaic devices since the lmax of these sensitizers isbelow or around 300 nm. It should be noted that the transitionsin these sensitizers were characterized with less participation ofHOMO and LUMO. Thus, these results indicate the importanceof the orientation of the donor and acceptor groups on opticalbehavior of the sensitizer molecule. Further, it is conclusivefrom the absorption spectral properties that the linear-shapedand V-shaped sensitizers are good contributors for better lightharvesting ability across the UV-visible region.
3.2 Frontier molecular orbital distribution
Fig. 3(a) and (b) show the spatial distribution pattern of thefrontier molecular orbitals (FMO), HOMO and LUMO of theTPA- and CAR-based sensitizer molecules of different shapes.Studying the distribution pattern of the FMO is useful tounderstand the opto-electronic properties of a moleculebecause these orbitals are directly involved in charge transportproperties, optical behavior and the interaction with nearbymolecules. Hence, by analyzing the distribution of FMO, qual-itative predictions can be made on the performance of dyemolecules for DSSC applications. Further, it is also important toanalyze the orbitals adjacent to the FMO, such as HOMO�1,HOMO�2, HOMO�3, LUMO+1, LUMO+2, and LUMO+3, whichhave a signicant contribution to the spectral behavior ofa molecule, particularly for X- and Y-shaped molecules (seeTables 1 and 2). For DSSCs where the conguration of the
5560 | RSC Adv., 2021, 11, 5556–5567
sensitizer molecule is the push–pull type, it is desirable to havea segregated HOMO and LUMO distribution. This distributionwill favor intramolecular charge transfer, and it is also desirableto have the LUMO distribution on the acceptor moiety, whichwill support stable anchoring of the sensitizer on the semi-conductor (TiO2) surface. As shown in Fig. 3(a) and (b), thestudied X- and Y-shaped TPA- and CAR-based sensitizers havea segregated HOMO and LUMO distribution. Also, it wasobserved that the molecular structure in which the thiophenemoiety is positioned adjacent to the anchoring group possessesa high orbital coefficient of LUMO around the anchoringmoiety. The distribution of the HOMO�1 and LUMO+1 orbitalsof the studied sensitizers is shown in Fig. S1(a) and (b),†respectively. Upon comparing the HOMO and LUMO distribu-tion with the HOMO�1 and LUMO+1 distributions, it wasobserved that the HOMO and LUMO distribution favors chargeseparation more than the HOMO�1 and LUMO+1 orbitals sincethese orbitals do not show a good segregated distribution asthat of the HOMO and LUMO.
© 2021 The Author(s). Published by the Royal Society of Chemistry

Fig. 3 (a) HOMO and LUMO distribution patterns in the triphenylamine-based derivatives with different shapes computed at the B3LYP/6-311G(d,p) level of theory. (b) HOMO and LUMO distribution patterns in the carbazole-based derivatives with different shapes computed at theB3LYP/6-311G(d,p) level of theory.
Paper RSC Advances
Ope
n A
cces
s A
rtic
le. P
ublis
hed
on 2
9 Ja
nuar
y 20
21. D
ownl
oade
d on
2/2
2/20
22 8
:47:
25 P
M.
Thi
s ar
ticle
is li
cens
ed u
nder
a C
reat
ive
Com
mon
s A
ttrib
utio
n-N
onC
omm
erci
al 3
.0 U
npor
ted
Lic
ence
.View Article Online
To quantify the observed orbital pattern, a charge decom-position analysis (CDA) was carried out. The CDA analysis wascarried out by partitioning the sensitizer molecule into threefragment components, namely donor, p and acceptor. Thecontribution of these fragments to the FMOs was analyzed andsummarized in Tables 3 and 4. It was observed that the p
fragment of all the studied sensitizers has a signicant contri-bution on the LUMO of the sensitizer molecule. In the X- and Y-shaped TPA and CAR derivatives and in the TPAL2 sensitizer(linear-shaped TPA derivative), the contribution of the p frag-ment on the HOMO of the sensitizer molecule is absent(contribution falls below 10%). This is the reason for thesegregated distribution of the HOMO and LUMO in the X- andY-shaped structures, and in the TPAL2 molecule. It was foundthat in the linear-shaped molecules, the positioning of thio-phene adjacent to the anchoring moiety (–COOH) decreases theamount of orbital contribution from the p fragment on theHOMO of the sensitizer. A similar observation was also foundfor the V-shaped and X-shaped sensitizers, where the X-shapedsensitizer with the same molecular composition shows better
© 2021 The Author(s). Published by the Royal Society of Chemistry
HOMO–LUMO segregation than the V-shaped sensitizers.Hence, according to the FMO and CDA analysis, it was observedthat placing the thiophene moiety adjacent to the anchoringgroup is a potential strategy to design a sensitizer structure witha segregated HOMO and LUMO distribution. However, bycomparing the absorption spectrum of the L1 and L2 sensi-tizers, and the V-shaped and X-shaped sensitizers, it wasobserved that placing the thiophene moiety nearer to the–COOH group blue shis the absorption spectrum. It should benoted that although the molecular composition in bothcongurations, TPAL1 and TPAL2 (for the TPA-based sensi-tizers) and CARL1 and CARL2 (for the CAR-based sensitizers) issame, the fragment orbital (FO) contribution percentage for theHOMO and LUMO composition in each case is different.Specically, the fragment orbital contribution orbital for theHOMO and LUMO formation is dependent on the shape of thesensitizer. For instance, as given in Table 4 although themolecular structure and composition (C26N2H20) of the donorfragment in the V-, X- and Y-shaped sensitizers of CAR deriva-tives is same, the fragment orbital (FO) contribution from the
RSC Adv., 2021, 11, 5556–5567 | 5561

Tab
le3
Chargedeco
mpositionan
alysisoftriphenylam
ine-b
asedsensitize
rsco
mputedat
theB3LY
P/6-3
11G(d,p)leve
loftheory
Dye
HOMOa
LUMOa
Orbital
contribution
from
don
orfrag
men
tOrbital
contribution
from
p-bridg
efrag
men
tOrbital
contribution
from
acceptor
frag
men
tOrbital
contributionfrom
donor
frag
men
tOrbital
contributionfrom
p-bridg
efrag
men
tOrbital
contribution
from
acceptor
frag
men
t
TPA
L1FO
(S�1
)/
38%
FO(H
�1)/
12%
——
FO(L+1
)/
68%
FO(S+1
)/
12%
FO(S)/
37%
TPA
L2FO
(S�1
)/
44%
——
—FO
(L+1
)/
62%
FO(S+1
)/
15%
FO(S)/
44%
TPA
V1
FO(H
)/
73%
FO(H
�1)/
11%
——
FO(L+2
)/
67%
FO(L+2
)/
16%
TPA
X1
FO(H
)/
89%
——
—FO
(L+2
)/
41%
FO(L+1
)/
20%
FO(L+4
)/
28%
TPA
Y1
FO(H
�1)/
84%
——
—FO
(S+2
)/
68%
FO(S+1
)/
18%
aFrag
men
torbital(FO)contributionto
theHOMO
orLU
MO
ofthesensitizer,
whereH,San
dLrepresen
tHOMO,singlyoccu
pied
molecular
orbital(SOMO)an
dLU
MO
ofthefrag
men
t,resp
ectively.
5562 | RSC Adv., 2021, 11, 5556–5567
RSC Advances Paper
Ope
n A
cces
s A
rtic
le. P
ublis
hed
on 2
9 Ja
nuar
y 20
21. D
ownl
oade
d on
2/2
2/20
22 8
:47:
25 P
M.
Thi
s ar
ticle
is li
cens
ed u
nder
a C
reat
ive
Com
mon
s A
ttrib
utio
n-N
onC
omm
erci
al 3
.0 U
npor
ted
Lic
ence
.View Article Online
donor fragment on the HOMO and LUMO of the sensitizer isdifferent in each case. It is important to note that the shape anddistribution of the electron density of each contributing frag-ment orbital will inuence the formation of the frontiermolecular orbitals (HOMO and LUMO) of the sensitizer mole-cule. We found that since the linear combination of fragmentorbital (LCFO) approach accounts for the symmetry of thecombined FO, the angle at which the combining fragmentorbital approaches each other becomes the decisive factor overmolecular orbital formation. Thereby, the shape of the sensi-tizer has a direct inuence on the opto-electronic properties ofthe sensitizer molecule since the angle of approach of thecombining fragment orbital depends on the shape of themolecule.
3.3 Energy of frontier molecular orbital
The energy of the frontier molecular orbital has high impor-tance on the performance of solar cells since the energy gapbetween the HOMO and LUMO has a direct impact on the lightharvesting capacity of the sensitizer, and thereby impacts the Jscof the DSSC.47 The energy level diagram of the FMO of thestudied TPA- and CAR-based sensitizers is illustrated in Fig. 4(a)and (b). It was observed that the TPA-based sensitizers havea lower band gap than that of the CAR-based sensitizers. Theanalysis of the diagrams showed that the energy level alignmenton the studied sensitizers is shape dependent. In both cases,the linear- and V-shaped sensitizers show a lower band gap thanthe X- and Y-shaped sensitizers, while the V-shaped and X-shaped sensitizers possess the same molecular composition.Hence, the linear- and V-shaped sensitizers are more likely toresult in a better photocurrent. Upon analyzing the HOMO andLUMO energy levels based on shape, we found that the relativelyhigh HOMO energy of the linear-shaped sensitizers and rela-tively lower lying LUMO in the V-shaped sensitizers areresponsible for the lower energy gap in these two cases.
It was also important to study whether the sensitizers havea suitable HOMO and LUMO energy with respect to theconduction band edge of the semiconductor substrate andredox potential of the electrolyte. Efficient electron injectionfrom the sensitizer to the TiO2 substrate requires the energy ofthe LUMO of the sensitizer molecule to be higher than theenergy of the conduction band edge of the TiO2 substrate.Similarly, for the regeneration of the dye by the electrolyte, theHOMO of the sensitizer should lie lower than the energy of theredox potential of the electrolyte. In the present study, wecompared the energy level alignment of the sensitizers with thewidely used TiO2 semiconductor substrate48 (�4.0 eV) and I�/I3
�
redox electrolyte49 (�4.7 eV). It was found that the HOMO energyof the studied TPA- and CAR-based sensitizers is sufficientlylower than the redox potential of the I�/I3
� redox couple, andthe LUMO of the studied sensitizers is high enough to facilitateelectron injection into the conduction band of TiO2. Speci-cally, all the studied sensitizers, irrespective of their shape,show optimal FMO energy levels for the electron injection anddye regeneration processes.
© 2021 The Author(s). Published by the Royal Society of Chemistry

Tab
le4
Chargedeco
mpositionan
alysisofca
rbaz
ole-b
asedsensitize
rsco
mputedat
theB3LY
P/6-3
11G(d,p)leve
loftheory
Dye
HOMOa
LUMOa
Don
orfrag
men
tcontribution
p-bridg
efrag
men
tcontribution
Accep
torfrag
men
tcontribution
Don
orfrag
men
tcontribution
p-bridg
efrag
men
tcontribution
Accep
torfrag
men
tcontribution
CARL1
FO(S�1
)/
27%
FO(H
�1)/
23%
——
FO(L+1
)/
71%
FO(S+1
)/
14%
FO(S)/
24%
FO(L)/
12%
CARL2
FO(S�1
)/
36%
FO(H
�1)/
11%
——
FO(L+1
)/
62%
FO(L)/
16%
FO(S)/
33%
CARV1
FO(H
�4)/
25%
FO(H
�1)/
27%
——
FO(L+2
)/
67%
FO(L+2
)/
15%
FO(H
�3)/
22%
FO(L)/
18%
CARV2
FO(H
�4)/
22%
FO(H
�1)/
27%
——
FO(L+2
)/
68%
FO(L+2
)/
16%
FO(H
�3)/
25%
FO(L)/
18%
CARV3
FO(H
�4)/
20%
FO(H
�1)/
27%
——
FO(L+2
)/
68%
FO(L+2
)/
14%
FO(H
�3)/
20%
FO(L)/
25%
CARV4
FO(H
�4)/
19%
FO(H
�1)/
26%
——
FO(L+2
)/
68%
FO(L+2
)/
14%
FO(H
�3)/
22%
FO(L)/
24%
CARV5
FO(H
�4)/
24%
FO(L)/
43%
——
FO(L+2
)/
65%
FO(L+2
)/
14%
FO(H
�3)/
19%
CARV6
FO(H
�4)/
24%
FO(H
�1)/
27%
——
FO(L+2
)/
68%
FO(L+2
)/
15%
FO(H
�3)/
19%
FO(L)/
22%
CARX1
FO(H
)/
84%
——
—FO
(L+2
)/
42%
FO(L+1
)/
20%
FO(L+4
)/
27%
CARX2
FO(H
)/
84%
——
—FO
(L+2
)/
42%
FO(L+1
)/
20%
FO(L+4
)/
27%
CARY1
FO(H
�2)/
89%
——
—FO
(S+2
)/
68%
FO(S+1
)/
18%
FO(H
�1)/
10%
CARY2
FO(H
�1)/
80%
——
—FO
(S+2
)/
67%
FO(S+1
)/
19%
aFrag
men
torbital(FO)contributionto
theHOMO
orLU
MO
ofthesensitizer,
whereH,San
dLrepresen
tHOMO,singlyoccu
pied
molecular
orbital(SOMO)an
dLU
MO
ofthefrag
men
t,resp
ectively.
© 2021 The Author(s). Published by the Royal Society of Chemistry RSC Adv., 2021, 11, 5556–5567 | 5563
Paper RSC Advances
Ope
n A
cces
s A
rtic
le. P
ublis
hed
on 2
9 Ja
nuar
y 20
21. D
ownl
oade
d on
2/2
2/20
22 8
:47:
25 P
M.
Thi
s ar
ticle
is li
cens
ed u
nder
a C
reat
ive
Com
mon
s A
ttrib
utio
n-N
onC
omm
erci
al 3
.0 U
npor
ted
Lic
ence
.View Article Online

Fig. 4 (a) Energy level diagram of the frontier molecular orbital of theTPA-based sensitizers with different shapes calculated at the B3LYP/6-311G(d,p) level. The energy gap values are presented in eV. (b) Energylevel diagram of the frontier molecular orbital of the CAR-basedsensitizers with different shapes calculated at the B3LYP/6-311G(d,p)level. The energy gap values are presented in eV.
Table 5 Computed charge density difference (CDD) indices, chargetransfer distance (DCT) (�A), amount of charge transfer (qct), difference intransition dipole movement due to excitation (cm), t-index (�A) andoverlap integral of the triphenylamine- and carbazole-basedsensitizersa
Molecule DCT (�A) qct (e) 10�29mCT (C m) t (�A) Overlap integral
TPAL1 2.15 0.96 1.30 2.37 0.48TPAL2 2.79 0.95 1.68 2.18 0.46TPAV1 2.77 0.94 1.65 3.56 0.41TPAX1 2.29 0.89 1.29 3.76 0.36TPAY1 2.07 0.93 1.21 4.71 0.37CARL1 2.06 0.96 1.25 2.07 0.49CARL2 2.32 0.96 1.40 1.85 0.48CARV1 1.85 0.91 1.07 3.45 0.42CARV2 1.89 0.93 1.10 3.57 0.43CARV3 2.45 0.93 1.43 3.54 0.38CARV4 2.41 0.93 1.41 3.36 0.38CARV5 1.80 0.92 1.04 3.45 0.42CARV6 1.86 0.93 1.09 3.29 0.43CARX1 1.05 0.83 0.56 3.67 0.42CARX2 1.02 0.90 0.58 3.89 0.47CARY1 1.94 0.84 1.03 1.47 0.34CARY2 2.00 0.85 1.08 2.98 0.35
a Transition mode ¼ 1.
RSC Advances Paper
Ope
n A
cces
s A
rtic
le. P
ublis
hed
on 2
9 Ja
nuar
y 20
21. D
ownl
oade
d on
2/2
2/20
22 8
:47:
25 P
M.
Thi
s ar
ticle
is li
cens
ed u
nder
a C
reat
ive
Com
mon
s A
ttrib
utio
n-N
onC
omm
erci
al 3
.0 U
npor
ted
Lic
ence
.View Article Online
3.4 Charge transfer indices
All the studied structures belong to the donor–p bridge–acceptor architecture. These structures exhibit push–pullproperty, which will facilitate the intramolecular charge trans-fer as a photon excites the molecule. Specically, when anelectron is excited from the HOMO to LUMO, there will bea temporary redistribution of charges (holes and electrons),which is crucial in the generation of a photocurrent. Hence, inthe present study, the charge transfer indices corresponding tothe rst mode of transition (S0 / S1) were studied using thecharge density difference (CDD) analysis module available inthe Multiwfn package, and the results are summarized in Table5. According to the tabulated values, we found that the amountof charge transferred per transition mode is high (around 0.95e)in the linear-shaped sensitizers and the charge transfer isrelatively less the in X-shaped molecules. By analyzing thetransition dipole moment of the studied sensitizers, weobserved that in terms of charge transport properties, theTPAL1, TPAL2, TPAV1, CARV3 and CARV4 sensitizers exhibit
5564 | RSC Adv., 2021, 11, 5556–5567
good charge transport properties, and the TPA-based sensitizersare clearly superior to the CAR-based sensitizers. On comparingtheir shapes, it was observed that the charge transporting abilityof the linear-shaped and V-shaped sensitizers is comparableand the X-shaped sensitizers show the lowest intramolecularcharge transporting ability. The barycenter of the hole andelectron distribution aer excitation of the sensitizer wasplotted and is shown in Fig. S2.†Well separated barycenters arepreferred for obtaining good efficiency, and a barycenter ofelectrons nearer to the anchoring group ensures good electroninjection into the TiO2 substrate. According to Fig. S2,† it can beinferred that the V-shaped sensitizers have good charge distri-bution characteristics for electron injection into the TiO2
substrate. In terms of overlap integral and t-index (a computedmeasure of the ground state and excited state charge density), itwas observed that in comparison with the linear-shaped sensi-tizers, the V-shaped sensitizers have a relatively higher t-indexvalue and lower overlap integral, showing that the V-shapedsensitizers are a better option with less recombination possi-bilities. Hence, based on the EDD analysis, it was observed thatthe linear- and V-shaped sensitizers are well suited as light-harvesting sensitizers, and particularly the V-shaped sensi-tizers are slightly better.
3.5 Light harvesting efficiency, uorescence lifetime, freeenergy change for electron injection, reorganisation energyand exciton binding energy
The parameters that are directly related with the Jsc and Voc ofa DSSC, such as light harvesting efficiency (LHE), excited statelifetime (s), change in Gibbs free energy for electron injection,(DGinject) and reorganisation energy were calculated using the
© 2021 The Author(s). Published by the Royal Society of Chemistry
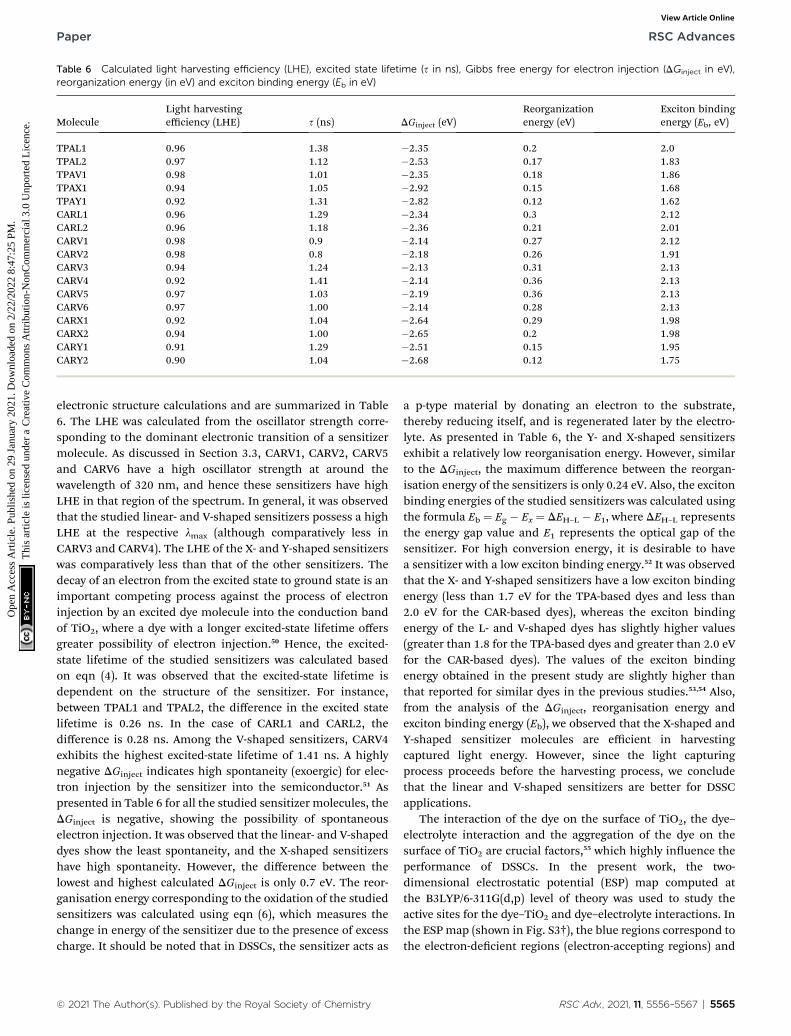
Table 6 Calculated light harvesting efficiency (LHE), excited state lifetime (s in ns), Gibbs free energy for electron injection (DGinject in eV),reorganization energy (in eV) and exciton binding energy (Eb in eV)
MoleculeLight harvestingefficiency (LHE) s (ns) DGinject (eV)
Reorganizationenergy (eV)
Exciton bindingenergy (Eb, eV)
TPAL1 0.96 1.38 �2.35 0.2 2.0TPAL2 0.97 1.12 �2.53 0.17 1.83TPAV1 0.98 1.01 �2.35 0.18 1.86TPAX1 0.94 1.05 �2.92 0.15 1.68TPAY1 0.92 1.31 �2.82 0.12 1.62CARL1 0.96 1.29 �2.34 0.3 2.12CARL2 0.96 1.18 �2.36 0.21 2.01CARV1 0.98 0.9 �2.14 0.27 2.12CARV2 0.98 0.8 �2.18 0.26 1.91CARV3 0.94 1.24 �2.13 0.31 2.13CARV4 0.92 1.41 �2.14 0.36 2.13CARV5 0.97 1.03 �2.19 0.36 2.13CARV6 0.97 1.00 �2.14 0.28 2.13CARX1 0.92 1.04 �2.64 0.29 1.98CARX2 0.94 1.00 �2.65 0.2 1.98CARY1 0.91 1.29 �2.51 0.15 1.95CARY2 0.90 1.04 �2.68 0.12 1.75
Paper RSC Advances
Ope
n A
cces
s A
rtic
le. P
ublis
hed
on 2
9 Ja
nuar
y 20
21. D
ownl
oade
d on
2/2
2/20
22 8
:47:
25 P
M.
Thi
s ar
ticle
is li
cens
ed u
nder
a C
reat
ive
Com
mon
s A
ttrib
utio
n-N
onC
omm
erci
al 3
.0 U
npor
ted
Lic
ence
.View Article Online
electronic structure calculations and are summarized in Table6. The LHE was calculated from the oscillator strength corre-sponding to the dominant electronic transition of a sensitizermolecule. As discussed in Section 3.3, CARV1, CARV2, CARV5and CARV6 have a high oscillator strength at around thewavelength of 320 nm, and hence these sensitizers have highLHE in that region of the spectrum. In general, it was observedthat the studied linear- and V-shaped sensitizers possess a highLHE at the respective lmax (although comparatively less inCARV3 and CARV4). The LHE of the X- and Y-shaped sensitizerswas comparatively less than that of the other sensitizers. Thedecay of an electron from the excited state to ground state is animportant competing process against the process of electroninjection by an excited dye molecule into the conduction bandof TiO2, where a dye with a longer excited-state lifetime offersgreater possibility of electron injection.50 Hence, the excited-state lifetime of the studied sensitizers was calculated basedon eqn (4). It was observed that the excited-state lifetime isdependent on the structure of the sensitizer. For instance,between TPAL1 and TPAL2, the difference in the excited statelifetime is 0.26 ns. In the case of CARL1 and CARL2, thedifference is 0.28 ns. Among the V-shaped sensitizers, CARV4exhibits the highest excited-state lifetime of 1.41 ns. A highlynegative DGinject indicates high spontaneity (exoergic) for elec-tron injection by the sensitizer into the semiconductor.51 Aspresented in Table 6 for all the studied sensitizer molecules, theDGinject is negative, showing the possibility of spontaneouselectron injection. It was observed that the linear- and V-shapeddyes show the least spontaneity, and the X-shaped sensitizershave high spontaneity. However, the difference between thelowest and highest calculated DGinject is only 0.7 eV. The reor-ganisation energy corresponding to the oxidation of the studiedsensitizers was calculated using eqn (6), which measures thechange in energy of the sensitizer due to the presence of excesscharge. It should be noted that in DSSCs, the sensitizer acts as
© 2021 The Author(s). Published by the Royal Society of Chemistry
a p-type material by donating an electron to the substrate,thereby reducing itself, and is regenerated later by the electro-lyte. As presented in Table 6, the Y- and X-shaped sensitizersexhibit a relatively low reorganisation energy. However, similarto the DGinject, the maximum difference between the reorgan-isation energy of the sensitizers is only 0.24 eV. Also, the excitonbinding energies of the studied sensitizers was calculated usingthe formula Eb ¼ Eg � Ex ¼ DEH–L � E1, where DEH–L representsthe energy gap value and E1 represents the optical gap of thesensitizer. For high conversion energy, it is desirable to havea sensitizer with a low exciton binding energy.52 It was observedthat the X- and Y-shaped sensitizers have a low exciton bindingenergy (less than 1.7 eV for the TPA-based dyes and less than2.0 eV for the CAR-based dyes), whereas the exciton bindingenergy of the L- and V-shaped dyes has slightly higher values(greater than 1.8 for the TPA-based dyes and greater than 2.0 eVfor the CAR-based dyes). The values of the exciton bindingenergy obtained in the present study are slightly higher thanthat reported for similar dyes in the previous studies.53,54 Also,from the analysis of the DGinject, reorganisation energy andexciton binding energy (Eb), we observed that the X-shaped andY-shaped sensitizer molecules are efficient in harvestingcaptured light energy. However, since the light capturingprocess proceeds before the harvesting process, we concludethat the linear and V-shaped sensitizers are better for DSSCapplications.
The interaction of the dye on the surface of TiO2, the dye–electrolyte interaction and the aggregation of the dye on thesurface of TiO2 are crucial factors,55 which highly inuence theperformance of DSSCs. In the present work, the two-dimensional electrostatic potential (ESP) map computed atthe B3LYP/6-311G(d,p) level of theory was used to study theactive sites for the dye–TiO2 and dye–electrolyte interactions. Inthe ESP map (shown in Fig. S3†), the blue regions correspond tothe electron-decient regions (electron-accepting regions) and
RSC Adv., 2021, 11, 5556–5567 | 5565

RSC Advances Paper
Ope
n A
cces
s A
rtic
le. P
ublis
hed
on 2
9 Ja
nuar
y 20
21. D
ownl
oade
d on
2/2
2/20
22 8
:47:
25 P
M.
Thi
s ar
ticle
is li
cens
ed u
nder
a C
reat
ive
Com
mon
s A
ttrib
utio
n-N
onC
omm
erci
al 3
.0 U
npor
ted
Lic
ence
.View Article Online
the yellow or white regions correspond to the electron-richregion (electron donating). It was observed that the electron-decient region on the studied V-shaped and X-shaped sensi-tizers was oriented towards the anchoring site, and this distri-bution of charge density can be benecial for the verticaladsorption of sensitizers on the surface of TiO2 since fromprevious works it is well established that TiO2 has a greateraffinity for electron decient groups.56 Further, it was observedthat the regions around the double-bonded oxygen atom, sulfurin the thiophene rings, nitrogen atom in the donormoieties andlateral edges of the conjugated rings are more likely to beelectrophilic, where electrolyte–dye interactions can favorablyoccur. Further, it is expected that the branched structure of theV-shaped sensitizers can be useful in creating space for elec-trolyte–dye interactions57 and to prevent dye–dye aggregation bylimiting the p–p interaction between adjacent dye molecules,58
thereby reducing the quenching effect.
4. Conclusion
A collective study on 17 sensitizer molecules was performed asa systematic attempt to identify potential shapes for the appli-cation of sensitizer molecules in dye sensitized solar cells(DSSCs). Based on the analysis of various parameters obtainedfrom electronic structure calculations, we found that the linear-and V-shaped sensitizers outperform the X and Y-shapedsensitizers in most of the crucial parameters, where espe-cially, the linear and V-shaped sensitizers show good photonabsorption ability. By considering the drawback of p–p aggre-gation in linear-shaped sensitizers, we recommend the V-shaped design for sensitizers to achieve the best performancein DSSCs. It was observed that positioning the thiophene groupadjacent to the anchoring group segregates the HOMO–LUMOdistribution signicantly, which is advantageous; however, itblue shis the absorption spectrum, which can limit the photonabsorption ability of the dye molecule. Further, we observedthat the triphenylamine donor is more advantageous than thecarbazole donor in terms of photon absorption ability. We hopethat the present study, which was limited to the electronicstructure properties of selected isolated dye molecules, will beuseful to design and synthesize efficient dye molecules to ach-ieve better power conversion efficiencies in DSSCs.
Conflicts of interest
There are no conicts to declare.
Acknowledgements
Authors are thankful to the University Grants Commission, NewDelhi, India, for providing funds to establish High PerformanceComputing facility, under the Center with Potential for Excel-lence in Particular Area (CPEPA) scheme [grant no. 2-8/2016(NS/PE) dated 03.10.2016]. Author, S. Krishnan sincerelythanks University Grants Commision (UGC) for providing thenancial support through Basic Science Research (BSR)scheme.
5566 | RSC Adv., 2021, 11, 5556–5567
References
1 P. B. L. Neto, O. R. Saavedra and D. Q. Oliveira, RenewableEnergy, 2020, 147, 339–355.
2 P. J. Burke, J. Widnyana, Z. Anjum, E. Aisbett,B. Resosudarmo and K. G. H. Baldwin, Energy Policy, 2019,132, 1216–1228.
3 E. Guelpa, A. Bischi, V. Verda, M. Chertkov and H. Lund,Energy, 2019, 10, 2–21.
4 X. Li, X. Zhang, J. Hua and H. Tian,Mol. Syst. Des. Eng., 2017,2, 98–122.
5 T. Lehtola and A. Zahedi, Sustain. Energy Technol. Assess.,2019, 35, 25–31.
6 N. Sangiorgi, A. Sangiorgi, A. Dess̀ı, L. Zani, M. Calamante,G. Reginato, A. Mordini and A. Sanson, Sol. Energy Mater.Sol. Cells, 2019, 204, 110209.
7 M. A. Sabuj and N. Rai, Mol. Syst. Des. Eng., 2020, 5, 1477–1490.
8 S. Ashrafa, R. Sud, J. Akhtarc, H. M. Siddiqib, A. Shujae,K. A. Al-Saadf, S. Y. Al-Qaradawif and A. El-Shafeid, DyesPigm., 2019, 171, 107754.
9 N. Manfredi, B. Cecconi and A. Abbotto, Eur. J. Org. Chem.,2014, 7069–7086.
10 Y. Tanga, Y. Wang, H. Song, Q. Liu, X. Lid, Y. Cai and Y. Xie,Dyes Pigm., 2019, 171, 107776.
11 Z.-D. Sun, J.-S. Zhao, Z. Mei and X.-H. Ju, J. Mol. Model., 2019,25, 300.
12 S. Yamamoto, A. Zhang, M. J. Stillman, N. Kobayashi andM. Kimura, Chem.–Eur. J., 2018, 22, 1–10.
13 M. Harikrishnan, V. Sadhasivam, A. Siva, S. Anandan,V. Subbiah and S. Murugesan, J. Phys. Chem. C, 2019, 123,21959–21968.
14 B. L. Watson, B. D. Sherman, A. L. Moore, T. A. Moore andD. Gusta, Phys. Chem. Chem. Phys., 2015, 17, 15788–15796.
15 E. Aslan, M. Karaman, G. Yanalak, M. Can, F. Ozel andI. H. Patir, Dyes Pigm., 2019, 171, 107710.
16 T. Duan, K. Fan, T. Peng, C. Zhong, Y. He and X. Chen, Synth.Met., 2016, 211, 19–24.
17 M. K. R. Fischer, S. Wenger, M. Wang, A. Mishra,S. M. Zakeeruddin, M. Gratzel and P. Bauerle, Chem.Mater., 2009, 22, 1836–18445.
18 J. M. Parka, C. Y. Jungb, Y. Wang, H. D. Choib, S. J. Parkb,P. Oub, W.-D. Janga and J. Y. Jaungb, Dyes Pigm., 2019,170, 107568.
19 Y. Wu, Q. Zhang, X. Tian, J. Li, X. Lu, D. Li, B. Xu, Y. Wu andK. Guo, J. Mater. Chem. A, 2019, 7, 1974–1981.
20 F. Zhang, J. Fan, H. Yu, Z. Ke, C. Nie, D. Kuang, G. Shao andC. Su, J. Org. Chem., 2019, 80, 9034–9040.
21 H. Zhang, Z.-E. Chen, J. Hu and Y. Hong, Electrochim. Acta,2018, 295, 934–941.
22 K. Kakiage, Y. Aoyama, T. Y. K. Oya, J.-i. Fujisawab andM. Hanaya, Chem. Commun., 2015, 51, 15894–15897.
23 M. Freitag, J. Teusher, Y. Saigilli and X. Zhang, Nat.Photonics, 2017, 11, 372–378.
24 D. D. Babu, R. Su, A. El-Shafei and A. V. Adhikari, RSC Adv.,2016, 6, 30205–30216.
© 2021 The Author(s). Published by the Royal Society of Chemistry

Paper RSC Advances
Ope
n A
cces
s A
rtic
le. P
ublis
hed
on 2
9 Ja
nuar
y 20
21. D
ownl
oade
d on
2/2
2/20
22 8
:47:
25 P
M.
Thi
s ar
ticle
is li
cens
ed u
nder
a C
reat
ive
Com
mon
s A
ttrib
utio
n-N
onC
omm
erci
al 3
.0 U
npor
ted
Lic
ence
.View Article Online
25 T. Duana, K. Fanb, T. Peng, C. Zhongb, Y. Hea and X. Chenb,Synth. Met., 2016, 211, 19–24.
26 H. Jia, K. Shen, X. Ju, M. Zhang and H. Zheng, New J. Chem.,2016, 40, 2799–2805.
27 Q. Li, J. Shi, S. Li, C. Zhong, F. Guo, M. Peng, J. Hua, J. Qinaand Z. Li, J. Mater. Chem., 2012, 2012, 6689–6696.
28 A. Yuvapragasam, N. Muthukumarasamy, S. Agilan,D. Velauthapillai, T. S. Senthil and S. Sundaram, J.Photochem. Photobiol., B, 2015, 148, 223–231.
29 K.-F. Chen, Y.-C. Hsu, Q.Wu, M.-C. P. Yeh and S.-S. Sun, Org.Lett., 2008, 11, 377–380.
30 W. Shockley and H. J. Queisser, J. Appl. Phys., 1961, 32, 510–519.
31 B. O. Regan and M. Gratzel, Nature, 1991, 353, 737–740.32 M. K. Nazeeruddin, A. Kay, I. Rodicio, R. Humphry-Baker,
E. Muller, P. Liska, N. Vlachopoulos and M. Gratzel, J. Am.Chem. Soc., 1993, 115, 6382–6390.
33 T. L. Bahers, T. Pauporte, G. Scalmani, C. Adamo andI. Cioni, Phys. Chem. Chem. Phys., 2009, 11, 11276–11284.
34 J. Preat, A. Hagfeldt and E. A. Perpete, Energy Environ. Sci.,2011, 4, 4537–4549.
35 H. L. Tavernier, A. V. Barzykin, M. Tachiya andM. D. Fayer, J.Phys. Chem. B, 1998, 102, 6078–6088.
36 A. D. Becke, Phys. Rev. A: At., Mol., Opt. Phys., 1988, 38, 3098–3100.
37 C. Lee, E. Yang and R. G. Parr, Phys. Rev. B: Condens. MatterMater. Phys., 1988, 37, 785–789.
38 N. Mardirossian and M. Head-Gordon,Mol. Phys., 2017, 115,2315–2372.
39 T. Yanai, D. P. Tew and N. C. Handy, Chem. Phys. Lett., 2004,393, 51–57.
40 F. M. Rajab, J. Nanomater., 2015, 2016, 8.41 J. Wu, Z. Lan, J. Lin, M. Huang, Y. Huang, L. Fan and G. Luo,
Chem. Rev., 2015, 115, 2136–2173.42 M. J. Frisch, G. W. Trucks, H. B. Schlegel, G. E. Scuseria,
M. A. Robb, J. R. Cheeseman, G. Scalmani, V. Barone,G. A. Petersson, H. Nakatsuji, M. C. X. Li, A. Marenich,J. Bloino, B. G. Janesko, R. Gomperts, B. Mennucci,H. P. Hratchian, J. V. Ortiz, A. F. Izmaylov,J. L. Sonnenberg, D. Williams-Young, F. Ding, F. Lipparini,F. Egidi, J. Goings, B. Peng, A. Petrone, T. Henderson,D. Ranasinghe, V. G. Zakrzewski, J. Gao, N. Rega,G. Zheng, W. Liang, M. Hada, M. Ehara, K. Toyota,
© 2021 The Author(s). Published by the Royal Society of Chemistry
R. Fukuda, J. Hasegawa, M. Ishida, T. Nakajima,O. K. Y. Honda, T. V. H. Nakai, K. Throssell,J. A. Montgomery, J. E. P. Peralta Jr, M. B. F. Ogliaro,E. B. J. J. Heyd, K. N. Kudin, V. N. Staroverov, T. Keith,R. Kobayashi, J. Normand, K. Raghavachari, A. Rendell,J. C. Burant, S. S. Iyengar, J. Tomasi, M. Cossi,J. M. Millam, M. Klene, C. Adamo, R. Cammi,J. W. Ochterski, R. L. Martin, K. Morokuma, O. Farkas,J. B. Foresman and D. J. Fox, Gaussian 09, Gaussian, Inc.,Wallingford CT, 2016.
43 T. Lu and F. Chen, J. Comput. Chem., 2012, 33, 580–592.44 M. Xiao and T. Lu, J. Adv. Phys. Chem., 2015, 4, 111–124.45 S. I. Gorelsky and A. B. P Lever, J. Organomet. Chem., 2001,
635, 187–196.46 K. Portillo-Cortez, A. Mart́ınez, A. Dutt and G. Santana, J.
Phys. Chem. A, 2019, 123, 10930–10939.47 V. K. Singh, R. K. Kanaparthi and L. Giribabu, RSC Adv.,
2014, 4, 6970–6984.48 J.-i. Fujisawa, T. Eda and M. Hanaya, Chem. Phys. Lett., 2017,
685, 23–26.49 G. Boschloo and A. Hagfeldt, Acc. Chem. Res., 2009, 42, 1819–
1826.50 J.-H. Luo, Q.-S. Li, L.-N. Yang, Z.-Z. Sun and Z.-S. Li, RSC Adv.,
2014, 4, 20200–20207.51 R. Katoh, Ambio, 2012, 41, 143–148.52 B.-G. Kim, C.-G. Zhen, E. J. Jeong, J. Kieffer and J. Kim, Adv.
Funct. Mater., 2012, 22, 1606–1612.53 M. A. M. Rashid, D. Hayati, K. Kwak and J. Hong,
Nanomaterials, 2020, 10, 914–937.54 P. Li, Z. Wang, C. Song and H. Zhang, J. Mater. Chem. C,
2017, 5, 11454–11465.55 G. Pepe, J. M. Cole, P. G. Waddel and J. I. Perrya, Mol. Syst.
Des. Eng., 2016, 1, 416–435.56 P. Ganesan, V. S. Rajadurai, J. Sivanadanam,
V. Ponnambalam and R. Rajalingam, J. Photochem.Photobiol., A, 2013, 271, 31–44.
57 Y.-Q. Yan, Y.-Z. Zhu, P.-P. Dai, J. Han, M. Yan and J.-Y. Zheng,New J. Chem., 2020, 44, 12909–12915.
58 J. Yang, P. Ganesan, J. l. Teuscher, T. Moehl, Y. J. Kim, C. Yi,P. Comte, K. Pei, T. W. Holcombe, M. K. Nazeeruddin,J. Hua, S. M. Zakeeruddin, H. Tian and M. Gratzel, J. Am.Chem. Soc., 2014, 136, 5722–5730.
RSC Adv., 2021, 11, 5556–5567 | 5567