the influence of the existence of liquid natural gas (lng ... · the influence of the existence of...
TRANSCRIPT

European Journal of Research and Reflection in Management Sciences Vol. 5 No. 2, 2017 ISSN 2056-5992
Progressive Academic Publishing, UK Page 43 www.idpublications.org
THE INFLUENCE OF THE EXISTENCE OF LIQUID NATURAL GAS
(LNG) TANGGUH TOWARD MACROECONOMIC DEVELOPMENT
OF TELUK BINTUNI REGENCY INDONESIA
Jasper Louw, Deddy T. Tikson, Alwi, Hasniati
Faculty of Social and Political Sciences, University of Hasanuddin
INDONESIA
ABSRACT
The influence of the existence of Liquid Natural Gas (LNG) Tangguh toward macroeconomic
development in Teluk Bintuni regency, West Papua, Indonesia. The LNG Tangguh is a
company engaged in the gas subsector that operates in Teluk Bintuni regency, West Papua,
Indonesia in 2002 and production 2009. Ideally the company that exploits gas resources in
Teluk Bintuni regency named "Negeri Kali Kabur" must contribute to local development.
This paper is the result of a secondary data analysis of the times series 2009-2015. The aim of
this research is to analyze and explain the influence of the existence of the LNG Tangguh
toward macroeconomic development, namely: Domestic revenues of regional Bruto,
reduction unemployment, Economic growth and inflation. The results of the study showed
that the monetary contributions given by LNG Tangguh sourced from the restaurant tax, tax
road illumination and revenue sharing fund have positive effect on: The Structure revenue,
Domestic Revenue of Regional Bruto, economic growth, inflation rate and income per capita.
Keywords: LNG Tangguh, Liquefied Natural Gas, Macro Economy, Teluk Bintuni regency.
INTRODUCTION
Teluk Bintuni is a new district expansion of Manokwari regency in West Papua, Indonesia.
The Basis of de jure formation law No. 26 2002 about the formation of Sarmi, Keerom,
South Sorong, Raja Ampat, Pegunungan Bintang, Yahukim, Tolikara, Waropen, Kaimana,
Boven Digul, Mappi and Teluk Bintuni Regency. The de facto Teluk Bintuni regency started
to stand on June 2003 (Abdul et al, 2008). The potential of natural resources districts
nicknamed "Negeri Kali Kabur" is very high, which wide 18, 637.00 km2 or 1,863,700.00
ha, diverse flora and fauna, Hydrology, socio-culture and the wealth of natural gas and oil
(Abdul et al, 2008; BPS Bintuni Bay, 2014). Until the end of 2016 the numbers of the
inhabitants of West Papua are predicted to reach 871 510 souls then 59 196 people or 6
percent is settled in Teluk Bintuni (BPS Teluk Bintuni, 2016).
The resource potential of liquefied natural gas project in Teluk Bintuni relatively high, i.e.
lost 23.80Trillion standard cubic feet (TSCF) where has been and is being were exploited
12.3 TSCF (51.68 percent) to train 1 and 2 and 10.10 TSCF (48.32 percent) to train 3. In
addition, it has found more new reserves of 6-8 TSCF (the Ministry of Industry Rep.
Indonesia, 2016).
Investment in billions USD is ideally give positive impact for the state investor. In contrast,
positive impact is also obtained to Indonesia and the Government of Teluk Bintuni regency
that has the natural wealth of gas. The positive impact that obtained the state can be in the
monetary and non monetary (Corporate Social Responsibility). LNG Tangguh monetary
contribution is usually in revenue sharing fund (RSF), Gas taxs, tax Restaurant and road

European Journal of Research and Reflection in Management Sciences Vol. 5 No. 2, 2017 ISSN 2056-5992
Progressive Academic Publishing, UK Page 44 www.idpublications.org
illumination. While the contributions of non monetary or CSR are capacity building,
community residential development (DAV), marketing assistance and the establishment of
subsidiaries as a derivative of the existence of LNG Tangguh.
This paper is limited to the utilization of monetary contribution toward the development of
macro economy sub-sector in Teluk Bintuni regency. Development is a process of change for
better direction through the efforts planned (Kartasasmitha Badruddin, 1994, 2009). Another
understanding, which is identical with the construction is defined by Siagian adminisrasi
(1994) as a business or a series of business growth and change that is planned and carried out
consciously by the nation, state and government to modernity in the context of nation
building. Further proposed by Siagian that the administration development is the entire work
than have done by nation to grow, develop and change in conscious and deliberate in all
facets of life and livelihood of the nation in order to achieve the goal. Listyaningsih (2014)
added that the administration environment development consists of political, economic,
socio-cultural, scientific and technological aspects and institutional aspects.
Listening comprehension development administration proposed by Siagian (1999) and
Listyaningsih (2014) on the development of economic sectors, especially macroeconomics is
an integral part of the administration building. In other words, economic development is a
subset of the administration building.
Classical economic principles that have always believed to read every economic transaction
need to sacrifice certain resources efficiently to gain maximum benefit. If this principle is
connected with rational choice theory, dependency theory and stakeholder theory then their
reciprocal correlation exists. Rational choice theory which is a blend of micro economics and
political science correlates with economic principles in the company's operations
(Frederickson and Smith, 1984). Dependency theory in principle deems it necessary flow of
capital investment from capital-intensive to third world country rich in natural resources but
lack capital. Likewise, the core stakeholder theory is mutual relations and influences between
various parties who have an interest in the company (Freeman and Reed, 1983).
LNG is a business organization that’s ideally approachable business administration. This
study did not look at the elements of the business but the contributions made in taxes and
RSF against local macroeconomic development. Therefore it is necessary to do research to
find out how much and how the presence of LNG Tangguh influence on macroeconomic
developments in Teluk Bintuni.
The purpose of this research is to know the influence of the existence of the LNG Tangguh
Company to the macroeconomic development: Domestic Revenue of Regional Bruto
(PDRB), economic growth, structure of the economy and inflation.
RESEARCH METHODS
The approach used in this study is a quantitative approach to the design of ex post
facto. Pasolong (2012) suggested that quantitative research is a type of research that
approaches or numerical measurement, data collection and analysis. The data used are time
series data (time series) for 2009-2015. The data was obtained from the Regional
Government of Teluk Bintuni, namely: Board of Finance and Asset Management, the
Department of Revenue and the Agency for Regional Development Planning, Finance, Asset
and LNG form of general directives.

European Journal of Research and Reflection in Management Sciences Vol. 5 No. 2, 2017 ISSN 2056-5992
Progressive Academic Publishing, UK Page 45 www.idpublications.org
The design of the ex post facto have characters, data obtained from all events that have
occurred and bound variable is determined first and then follows lately to find the cause of
the relationship and its interpretation. Ex post facto is the discovery of empirical done
systematically where researchers do not control over the variables because manivetation
already happen or these variables are inherent cannot be manipulated (Kerlinger, 1993;
Arifin, 2013).
Ex post facto design applications in this study refers to the influence of which was supplied
by LNG since 2009-2015. In other words, the data analyzed consisted of the data activities
carried out for approximately 7 years from 2009-2015.
Research September 2016 to early January 2017, the implementation of field research took
place in three stages where the first phase of the conducted field research that focuses on the
primary data collection and secondary data. The second stage focuses on the processing and
analysis of the field data to the withdrawal of the conclusion. The third stage focuses on the
process of writing and settlement of completed research report. Data monetized substantial
funding consists of gas revenue sharing fund, road illumination Tax and tax Restaurant. The
three types of this data were quantitative means in tems of a number with units of rupiah.
Table 1. Data Quantitative Research Impact of Economic Developments against LNG in
Teluk Bintuni Regency, 2016
The
Approach
The Data Data Source The technique of
Data Collection
(1) (2) (3) (4)
Quantitative
(Monetized)
The funds for
the Gas
Results
Regional Income,
Financial Management
Agency and Local
assets, Bappeda, LNG
Tangguh
Interview and
Secondary Data
Road
Illumination
Tax
Regional Income,
Financial Management
Agency and Local
assets, Bappeda, LNG
Tangguh
Interview and
Secondary Data
Restaurant
Tax
Regional Income,
Financial Management
Agency and Local
assets, Bappeda, LNG
Tangguh
Interview and
Secondary Data
Processing data is performed by using descriptive statistic and inductive statistic
(inferential). Descriptivly the data of revenue sharing fund (RSF), Restaurant Tax and road
illumination tax were collected, processed, presented in tables and graphs as well as the
conclusion but did not generalize. Meanwhile, to the extent used statistical generalization
induction/inferential (Silaen and Heriyanto, 2013).
European Journal of Research and Reflection in Management Sciences Vol. 5 No. 2, 2017 ISSN 2056-5992
Progressive Academic Publishing, UK Page 46 www.idpublications.org
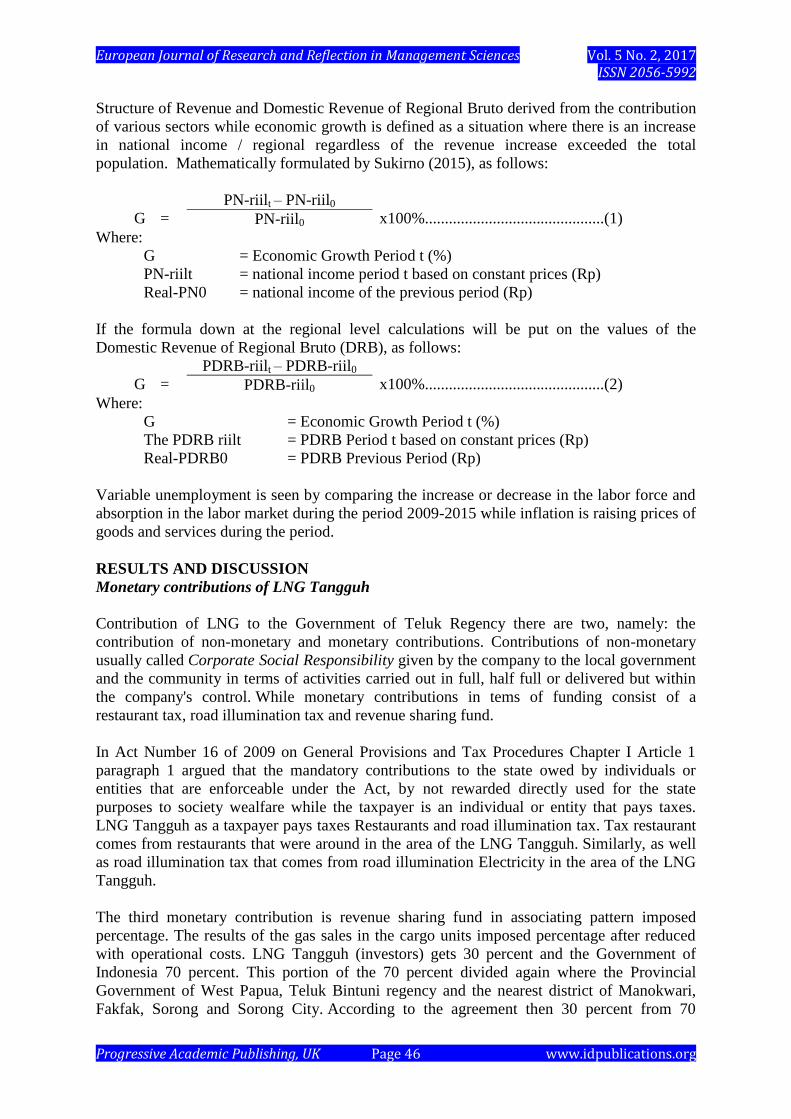
Structure of Revenue and Domestic Revenue of Regional Bruto derived from the contribution
of various sectors while economic growth is defined as a situation where there is an increase
in national income / regional regardless of the revenue increase exceeded the total
population. Mathematically formulated by Sukirno (2015), as follows:
G =
PN-riilt – PN-riil0
x100%.............................................(1) PN-riil0
Where:
G = Economic Growth Period t (%)
PN-riilt = national income period t based on constant prices (Rp)
Real-PN0 = national income of the previous period (Rp)
If the formula down at the regional level calculations will be put on the values of the
Domestic Revenue of Regional Bruto (DRB), as follows:
G =
PDRB-riilt – PDRB-riil0
x100%.............................................(2) PDRB-riil0
Where:
G = Economic Growth Period t (%)
The PDRB riilt = PDRB Period t based on constant prices (Rp)
Real-PDRB0 = PDRB Previous Period (Rp)
Variable unemployment is seen by comparing the increase or decrease in the labor force and
absorption in the labor market during the period 2009-2015 while inflation is raising prices of
goods and services during the period.
RESULTS AND DISCUSSION
Monetary contributions of LNG Tangguh
Contribution of LNG to the Government of Teluk Regency there are two, namely: the
contribution of non-monetary and monetary contributions. Contributions of non-monetary
usually called Corporate Social Responsibility given by the company to the local government
and the community in terms of activities carried out in full, half full or delivered but within
the company's control. While monetary contributions in tems of funding consist of a
restaurant tax, road illumination tax and revenue sharing fund.
In Act Number 16 of 2009 on General Provisions and Tax Procedures Chapter I Article 1
paragraph 1 argued that the mandatory contributions to the state owed by individuals or
entities that are enforceable under the Act, by not rewarded directly used for the state
purposes to society wealfare while the taxpayer is an individual or entity that pays taxes.
LNG Tangguh as a taxpayer pays taxes Restaurants and road illumination tax. Tax restaurant
comes from restaurants that were around in the area of the LNG Tangguh. Similarly, as well
as road illumination tax that comes from road illumination Electricity in the area of the LNG
Tangguh.
The third monetary contribution is revenue sharing fund in associating pattern imposed
percentage. The results of the gas sales in the cargo units imposed percentage after reduced
with operational costs. LNG Tangguh (investors) gets 30 percent and the Government of
Indonesia 70 percent. This portion of the 70 percent divided again where the Provincial
Government of West Papua, Teluk Bintuni regency and the nearest district of Manokwari,
Fakfak, Sorong and Sorong City. According to the agreement then 30 percent from 70

European Journal of Research and Reflection in Management Sciences Vol. 5 No. 2, 2017 ISSN 2056-5992
Progressive Academic Publishing, UK Page 47 www.idpublications.org
percent i.e. 21 percent left in the Provincial Government of West Papua while 49 percent
returned to producing Teluk Bintuni regency and also Fakfak, Sorong and
Manokwari (Figure 1).
Based on the agreement of percentage pattern is only applicable to the components of
revenue sharing fund and it does not apply to restaurant tax and road illumination tax. Both
the tax variable is paid directly by LNG Tangguh in Teluk Bintuni regency through regional
domestic revenue.
The Share which beleongs to Indonesia government imposed percentage of revenue sharing
fund (RSF), it is also one of the components of the Regional Budget (APBD) Teluk Bintuni
regency which is preloaded operational budget Usage List (DPA) each Regional Work Units.
Table 2 contains 3 loading cost components which is the contribution of LNG Tangguh for
Regional Government of Teluk Bintuni.
Picture 1. The funding scheme for revenue sharing fund (RSF) LNG Tangguh
The pattern is restaurant Tax and road illumination tax paid directly by LNG Tannguh to
regional government of Teluk Bintuni through of Regional Income while revenue sharing
fund is a component of the Equalization Fund and Local Government plus with the General
Allocation Fund and the Special Allocation Fund.
Table 2. Contribution Monetized LNG Tangguh to the Regional Government of Teluk
Bintuni, 2009-2016 (Rupiah)
Year The Tangguh amount
Restaurant Tax Road
Illumination Tax
Revenue
sharing fund
(1) (2) (3) (4) (5)
2009 283,598,000.00 28,749,024.00 498,018,455.00 610,365,469.00
2010 114,885,707.00 964,963,575.00 17,933,168,907.00 19,013,018,129.00
2011 1,441,616,395.00 195,662,729.00 38,571,820,369.00 19,570,448,031.00
2012 6,040,567, 027.00 2,305,825,673.0
0
3, 311, 716, 614.00 11.658,109,314.00
2013 7,343,902, 826.00 3,071,043,559.0
0
154, 402, 878, 029.0
0
164,817,897,414.0
0
2014 6,816,089, 037.00 3,047,703,448.0 183, 358, 303, 668.0 193,222,096,153.0
Gas Net Profit before expense
Operational expense
Profit after expense
LNG
Tangguh
Indonesia
Province of West Papua
National
Government
Province of West Papua
Fakfak, Sorong, Manokwari Teluk Bintuni
European Journal of Research and Reflection in Management Sciences Vol. 5 No. 2, 2017 ISSN 2056-5992
Progressive Academic Publishing, UK Page 48 www.idpublications.org
0 0 0
2015 6,588,443, 905.00 294,580,707.00 309, 782, 233, 834.0
0
316,665,258,446.0
0
Amoun
t
26,789,092,795.0
0
8,720,153,387.0
0
650,855,205,145.00*
)
746,195,844,428.0
0
Source: of Regional Income Teluk Bintuni regency (2017) *)has not been reduced by other RSF.
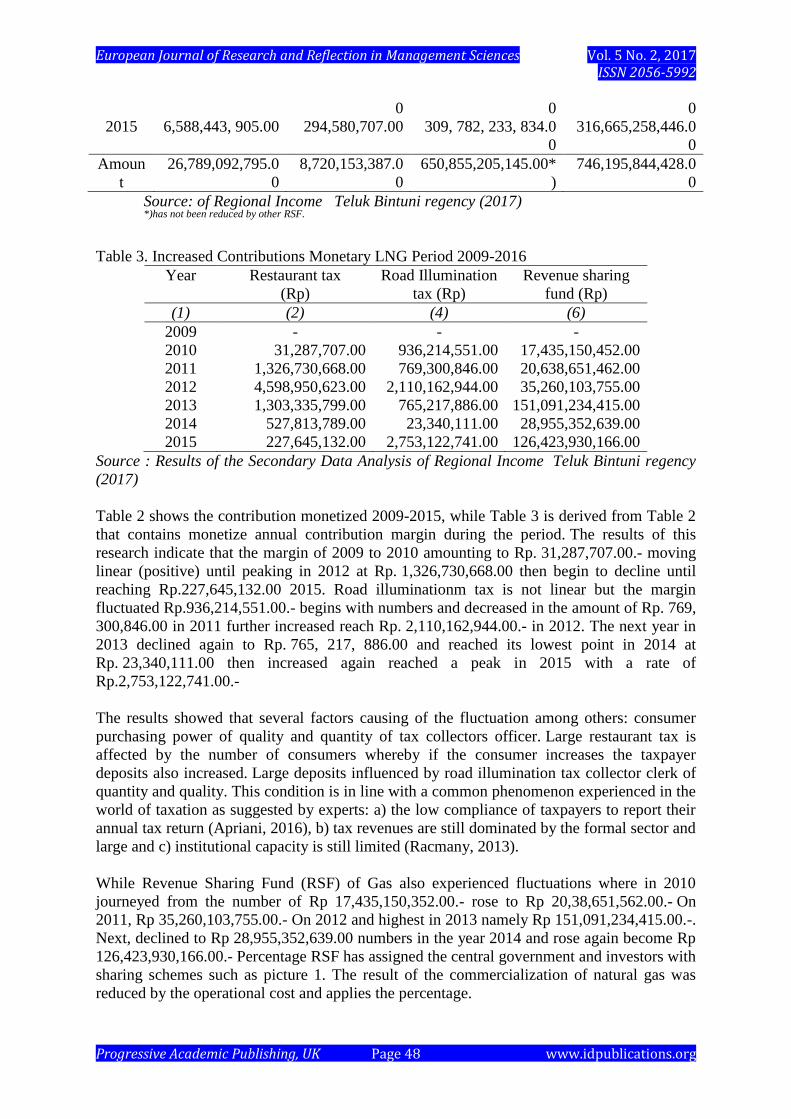
Table 3. Increased Contributions Monetary LNG Period 2009-2016
Year Restaurant tax
(Rp)
Road Illumination
tax (Rp)
Revenue sharing
fund (Rp)
(1) (2) (4) (6)
2009 - - -
2010 31,287,707.00 936,214,551.00 17,435,150,452.00
2011 1,326,730,668.00 769,300,846.00 20,638,651,462.00
2012 4,598,950,623.00 2,110,162,944.00 35,260,103,755.00
2013 1,303,335,799.00 765,217,886.00 151,091,234,415.00
2014 527,813,789.00 23,340,111.00 28,955,352,639.00
2015 227,645,132.00 2,753,122,741.00 126,423,930,166.00
Source : Results of the Secondary Data Analysis of Regional Income Teluk Bintuni regency
(2017)
Table 2 shows the contribution monetized 2009-2015, while Table 3 is derived from Table 2
that contains monetize annual contribution margin during the period. The results of this
research indicate that the margin of 2009 to 2010 amounting to Rp. 31,287,707.00.- moving
linear (positive) until peaking in 2012 at Rp. 1,326,730,668.00 then begin to decline until
reaching Rp.227,645,132.00 2015. Road illuminationm tax is not linear but the margin
fluctuated Rp.936,214,551.00.- begins with numbers and decreased in the amount of Rp. 769,
300,846.00 in 2011 further increased reach Rp. 2,110,162,944.00.- in 2012. The next year in
2013 declined again to Rp. 765, 217, 886.00 and reached its lowest point in 2014 at
Rp. 23,340,111.00 then increased again reached a peak in 2015 with a rate of
Rp.2,753,122,741.00.-
The results showed that several factors causing of the fluctuation among others: consumer
purchasing power of quality and quantity of tax collectors officer. Large restaurant tax is
affected by the number of consumers whereby if the consumer increases the taxpayer
deposits also increased. Large deposits influenced by road illumination tax collector clerk of
quantity and quality. This condition is in line with a common phenomenon experienced in the
world of taxation as suggested by experts: a) the low compliance of taxpayers to report their
annual tax return (Apriani, 2016), b) tax revenues are still dominated by the formal sector and
large and c) institutional capacity is still limited (Racmany, 2013).
While Revenue Sharing Fund (RSF) of Gas also experienced fluctuations where in 2010
journeyed from the number of Rp 17,435,150,352.00.- rose to Rp 20,38,651,562.00.- On
2011, Rp 35,260,103,755.00.- On 2012 and highest in 2013 namely Rp 151,091,234,415.00.-.
Next, declined to Rp 28,955,352,639.00 numbers in the year 2014 and rose again become Rp
126,423,930,166.00.- Percentage RSF has assigned the central government and investors with
sharing schemes such as picture 1. The result of the commercialization of natural gas was
reduced by the operational cost and applies the percentage.

European Journal of Research and Reflection in Management Sciences Vol. 5 No. 2, 2017 ISSN 2056-5992
Progressive Academic Publishing, UK Page 49 www.idpublications.org
Domestic Revenue of Regional Bruto (DRB)
DRB is the number of the total value of goods and services that are produced in an economic
activity in the entire region in a specific year or a certain period in one year.
Table 4. Regional Gross Domestic Product Teluk Bintuni regency Year 2008-2015 (in
Rupiah
The Year On the basis of Current
Prices
On constant Price
(1) (2) (3)
2008 863,763,800,000.00 527,958,300,000.00
2009 1,041,428,590,000.00 584,555,370,000.00
2010 8,716,127,160,000.00 2,619,467,780,000.00
2011 15,250,563,800,000.00 4,562,540,230,000.00
2012 19,746,125,860,000.00 5,999,485,380,000.00
2013 22,531,300,720,000.00 22,631,300,700,000.00
2014 23,025,509,190,000.00 23,025,509,200,000.00
2015 23,984,173,501,000.00 22,407,334,580,000.00
Source : Financial Report of Teluk Bintuni (2015) and (2016)
The Data in table 4 shows that the DRB Teluk Bintuni regency moves follow linear curve on
the price valid or on prices basis. This phenomenon became indicators that the economy in
the Teluk Bintuni regency increasing from year to year. The Data in table 4 revealed in figure
no. 2 graphs DRB Teluk Bintuni regency 2008-2015. This graph shows that the DRB on the
basis of the price valid moves follow linear line and until in 2013 lineary DRB started.
The position of DRB’s graph on constant price is under DRB on the basis of the price
valid. The curve lines DRB on the basis of the average constant price throughout the year
2008-2009 and increased in the period 2009-2011 then started again at period 2011-
2012. There is an increase in the 2012-2013 periods that very sharp and return even tends to
be decreased in the following years.
Picture3. Graph of DRB Teluk Bintuni regency 2008-2015
The Benefits of DRB for the regional government Teluk Bintuni, among others: a) materials
performance evaluation of each SKPD, b) the material manufacturing of planning, c) matter
projected development of the regional economy, d) material of evaluation in the past
development and e) comparison the role of each sector.
0.00
5,000,000,000,000.00
10,000,000,000,000.00
15,000,000,000,000.00
20,000,000,000,000.00
25,000,000,000,000.00
30,000,000,000,000.00
2006 2010 2014
PD
RB
(R
p)
Year
PDRB Price valid
PDRB Constant Price

European Journal of Research and Reflection in Management Sciences Vol. 5 No. 2, 2017 ISSN 2056-5992
Progressive Academic Publishing, UK Page 50 www.idpublications.org
Economic Growth
Economic growth is one of the indicators of success in economic development
area. Economic growth redefines by Sukirno (2015) as activities development in the economy
that caused the goods and services that diproduksikan in increased community. In this study
of goods and services that have the development is converted into money (rupiah) and then
each unit increment is calculated and given the percentage. Table 4 points to economic
growth before and after the contribution of LNG Tangguh.
Economic growth in the Teluk Bintuni regency is higher than the Province of West Papua
which reached 5.38 percent (2014), 4.79 percent (2015) and 6.20 percent (2016). Sukirno
(2015) proposed that economic growth in a region affected by the wealth of natural resources,
the number and the quality of the population and labor, capital goods and technology, social
level system and the attitude of the community.
The theory of Schumpeter emphasized the importance of the role of entrepreneurs in realizing
economic growth is shown with the continuously make renewal or innovation in economic
activity (Jhingan, 2014; Sukirno, 2015). If this theory is associated with the real conditions at
the location of the research and the role of the private sector is very great in the economic
growth of the LNG Tangguh especially in the recruitment of labor and the availability of
private sector employment.
Table 4. Economic growth in the Teluk Bintuni regency before and after the presence of the
LNG Tangguh Project period 2009-2015
The Year Economic growth (%)
With Oil and Gas Without oil and gas
(1) (2) (3)
2009 173.13 5.02
2010 74.17 5.02
2011 31.49 6.02
2012 13.49 4.94
2013 13.27 4.57
2014 5.51 7.20
2015 25.37 38.77
Source : Financial Report of the Regional Government Teluk Bintuni 2010-2015
The graph in figure 2 revealed from the data in table 4 where the blue line is the line speed
of the economic growth after the existence of the LNGTangguh Project while the red line
without the contribution of the Tangguh LNG plant.

European Journal of Research and Reflection in Management Sciences Vol. 5 No. 2, 2017 ISSN 2056-5992
Progressive Academic Publishing, UK Page 51 www.idpublications.org
Picture 2. The growth of the Teluk Bintuni regency Year 2009-2015
Based on data in table 4 which is revealed in the figure 2 it can be noted that the Tangguh
LNG Project is very influential on the economic growth of Bintuni Bay District. The red
line that shows the economic growth without the contribution of the LNG Tangguh Project
is located at the bottom of the green line (LNG) except in the year 2014 which happens
meeting (intersection line). At this point is the cutting economic growth without oil and gas
5.51 percent and with oil and gas 7.20 percent while on 2017 economic growth rate with oil
and gas 25.37 percent and without Oil and Gas 38.77 percent.
Inflation
Malyani et al (2016) proposed that inflation is a rise in the level of prices of goods and
services in the market due to various factors. These factors, among others: a) The imbalance
in the amount of goods circulating in the community with the amount of money, b) Inhibition
of production of goods and services that would hamper the supply needs of the people is low,
c) Increased aggregate demand, d) increase in fuel prices and tariffs electricity prices, e) the
existence of fluctuations in foreign sector (exports and imports), investments, savings and
revenues and f) the issuance of new money (monetary authorities) which adds to the
circulation of money.
Based on the Local Government Financial Report data Teluk Bintuni regency 2015 noted that
the inflation rate specific issued to Teluk Bintuni regency is not available so that the inflation
rate used is the rate of inflation data Sorong Regency and Manokwari with little deviation.
The inflation rate is high Manokwari District 0.84 percent, so if Teluk Bintuni regency
Manokwari guided by the rate of inflation in the Bay is relatively higher. This is due to the
relatively isolated location, county division and transport. As Devel-ding it in Indonesia
regency / city with the lowest inflation rate is Padang and Cilacap 12:01 percent (Dhara Post,
2015).
0
20
40
60
80
100
120
140
160
180
200
2008 2010 2012 2014 2016
The
Eco
no
mic
Gro
wth
(%
)
Year
With Oil and Gas
Without Oil and Gas

European Journal of Research and Reflection in Management Sciences Vol. 5 No. 2, 2017 ISSN 2056-5992
Progressive Academic Publishing, UK Page 52 www.idpublications.org
E. Employment, Unemployment and Job Opportunities
Employment, unemployment and job opportunities there are 3 macroeconomics variable that
very important. The Data in table 5 shows that the working-age population in the year 2008-
2015.
Table 5. The composition of the inhabitants of the 15-year-old to top according to the main
activities in the Teluk Bintuni regency Period 2008-2015
The type of main
activities
The Year
2008 2009 2010 2011 201
2
201
3
201
4
2015
1. Working-age
population (15 +)
35,791 36,86
1
33.7
26
35,0
68
37,0
51
38,0
06
39,2
65
40,524
A. Work Force 27,089 23.31
1
25.4
30
25,8
43
25,9
21
27,0
31
28,8
67
30,704
- Work 24,971 23,05
6
23.6
51
23,7
50
24,3
39
25,3
51
26,9
73
28,596
- Open
unemployment
2,118 2,255 Bln
stg
via
2,09
5
1,58
2
1,68
0
1,89
4
2,108
B. Not Work Force 8,702 11,55
0
8,29
6
9,22
3
11,1
30
10,9
35
10,8
77
9,820
- The School 2,637 3,405 3,39
7
3,98
2
5,02
3
5,13
3
4,35
7
3,542
- Household
Mangurus
5,689 7,183 4,26
8
4,81
2
5,69
9
5,02
6
5,30
0
5,574
- Others 176 892 631
429
408 816 760 676
2. TPAK (%) 75.69 68.67 75.4
0
73.
70
69.9
6
71.1
2
73.4
5
75.77
3. Open
unemployment (%)
7.82 Retur
ns
8.91
7.00
8.11
6.10 6.22 6.50 6.87
Source : Teluk Bintuni regency in numbers (2009-2016)
2008 totaled 35,791 people which continue to increase in a linear until year 2015 penetrate
the number 40,524 soul or the experience of adding around 4,733 people. The figure is
derived from the population residing in the Teluk Bintuni area or coming from the outside
and find work there.
Table 6. The number of companies and Labor Absorption in the Teluk Bintuni regency 2012-
2015 Period
The Sector
The
Year
Total
Com
pany
(unit)
Labor absorbed
(soul)
The
number
of
Manpo
wer
(soul)
Indonesian
workers
TKA
L P L P
European Journal of Research and Reflection in Management Sciences Vol. 5 No. 2, 2017 ISSN 2056-5992
Progressive Academic Publishing, UK Page 53 www.idpublications.org
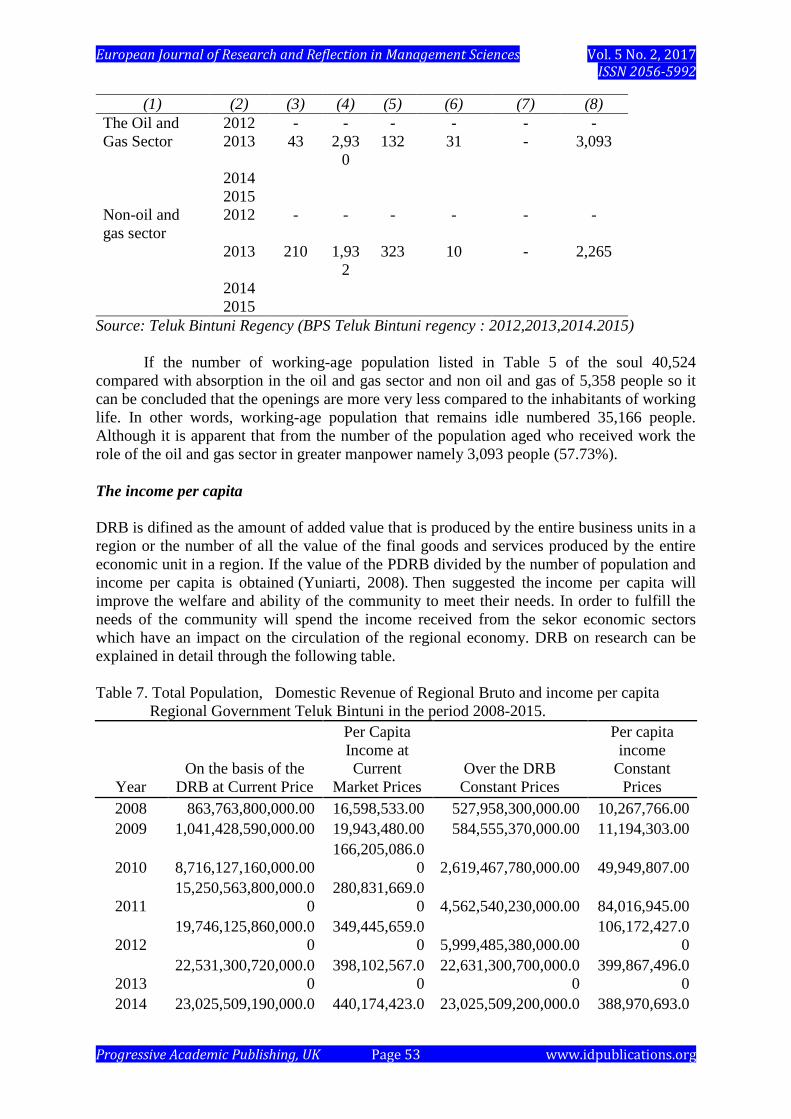
(1) (2) (3) (4) (5) (6) (7) (8)
The Oil and
Gas Sector
2012 - - - - - -
2013 43 2,93
0
132 31 - 3,093
2014
2015
Non-oil and
gas sector
2012 - - - - - -
2013 210 1,93
2
323 10 - 2,265
2014
2015
Source: Teluk Bintuni Regency (BPS Teluk Bintuni regency : 2012,2013,2014.2015)
If the number of working-age population listed in Table 5 of the soul 40,524
compared with absorption in the oil and gas sector and non oil and gas of 5,358 people so it
can be concluded that the openings are more very less compared to the inhabitants of working
life. In other words, working-age population that remains idle numbered 35,166 people.
Although it is apparent that from the number of the population aged who received work the
role of the oil and gas sector in greater manpower namely 3,093 people (57.73%).
The income per capita
DRB is difined as the amount of added value that is produced by the entire business units in a
region or the number of all the value of the final goods and services produced by the entire
economic unit in a region. If the value of the PDRB divided by the number of population and
income per capita is obtained (Yuniarti, 2008). Then suggested the income per capita will
improve the welfare and ability of the community to meet their needs. In order to fulfill the
needs of the community will spend the income received from the sekor economic sectors
which have an impact on the circulation of the regional economy. DRB on research can be
explained in detail through the following table.
Table 7. Total Population, Domestic Revenue of Regional Bruto and income per capita
Regional Government Teluk Bintuni in the period 2008-2015.
Year
On the basis of the
DRB at Current Price
Per Capita
Income at
Current
Market Prices
Over the DRB
Constant Prices
Per capita
income
Constant
Prices
2008 863,763,800,000.00 16,598,533.00 527,958,300,000.00 10,267,766.00
2009 1,041,428,590,000.00 19,943,480.00 584,555,370,000.00 11,194,303.00
2010 8,716,127,160,000.00
166,205,086.0
0 2,619,467,780,000.00 49,949,807.00
2011
15,250,563,800,000.0
0
280,831,669.0
0 4,562,540,230,000.00 84,016,945.00
2012
19,746,125,860,000.0
0
349,445,659.0
0 5,999,485,380,000.00
106,172,427.0
0
2013
22,531,300,720,000.0
0
398,102,567.0
0
22,631,300,700,000.0
0
399,867,496.0
0
2014 23,025,509,190,000.0 440,174,423.0 23,025,509,200,000.0 388,970,693.0

European Journal of Research and Reflection in Management Sciences Vol. 5 No. 2, 2017 ISSN 2056-5992
Progressive Academic Publishing, UK Page 54 www.idpublications.org
0 0 0 0
2015
23,984,173,501,000.0
0
402,445,028.0
0
22,407,334,580,000.0
0
375,987,233.0
0
Source : processed from various sources
Table 7 contains the number of the relationship between the total population and DRB with
the income per capita Where the income per capita is the reverse relationship between the
total population with the DRB. In other words, the income per capita obtained from DRB
divided total population. The results of the study showed that penndapatan per capita based
on the applicable price is higher than the income per capita based on constant prices. In
addition, the income per capita rose continues to increase until the year 7 (2014) and
decreased.
CONCLUSION
Based on the implementation of the data analysis time series, the result and the explanation
that is contained in this writing could be concluded that the monetary contribution of LNG
Tangguh to the Rional Goverment of Teluk Bintuni is 3, namely : restaurants tax, road
illumination and revenue sharing fund (RSF), then DRB increased year by year in constant
prices and current price, economic growth after the existence of the LNG Tangguh is far
higher than without LNG Tangguh, inflation rate Teluk Bintuni regency is relatively the
same with the Manokwari regency namely 0.84 percent, the Oil and Gas Sector that have
capable of labor higher compared with non-oil and gas sector but has not been able to absorb
all labor. It is available in the Labor Department of Teluk Bintuni and income per capita The
basic price is smaller than the current price but tend to be on one level year by year.
REFERENCES
BPS. 2014. Teluk Bintuni in Figure 2014. Publisher Statistics of Teluk Bintuni Regency.
Bintuni. ISSN: 2089-55703.
BPS. 2015. Teluk Bintuni in Figure 2015. Publisher Statistics of Teluk Bintuni Regency.
Bintuni. ISSN: 2089-55703.
BPS. 2016. Teluk Bintuni in Figure 2016. Publisher Statistics of Teluk Bintuni Regency.
Bintuni. ISSN: 2089-55703.
Frederickson, H. George and Kevin B. Smith. 1984. The Public Administration Theory
Primer.
Freeman, R.E. and Reed. 1983. Stockholder and Stakeholder : A New Perspective on
Corporate Government.
Industrial Ministry Rep. of Indonesia. 2016. “Penganugrahan Penghargaan Indonesia Good
Design Selection, 2016”. Http://www.kemenperin..go.id.
Listyaningsih. 2014. Administrative Development : Approaches, Concept and
Implementation. Publisher Graha Ilmu. Yogyakarta.
Jhingan, M.L. 2014. Ekonomi Pembangunan dan Perencanaan. P.T. RajaGrafindo Persada.
Jakarta.
Pudyantoro, A. Rinto. 2002. A to Z Bisnis Hulu Migas. Penerbit Ppetromindo. Jakarta.
Abdul, Rahman; Ahmad; Kusumo, Handono. 2008. The History of Teluk Bintuni Regency.
Lanarka Publisher. Yogyakarta.
Regional Gouvernment of Teluk Bintuni Regency. 2012. Laporan Keuangan Tahun
Anggaran 2012. Regional Gouvernment of Teluk Bintuni Regency . Bintuni.

European Journal of Research and Reflection in Management Sciences Vol. 5 No. 2, 2017 ISSN 2056-5992
Progressive Academic Publishing, UK Page 55 www.idpublications.org
Regional Gouvernment of Teluk Bintuni Regency. 2013. Laporan Keuangan Tahun
Anggaran 2012. Regional Gouvernment of Teluk Bintuni Regency. Bintuni.
Regional Gouvernment of Teluk Bintuni Regency. 2014. Laporan Keuangan Tahun
Anggaran 2012. Regional Gouvernment of Teluk Bintuni Regency. Bintuni.
Regional Gouvernment of Teluk Bintuni Regency. 2015. Laporan Keuangan Tahun
Anggaran 2012. Pemerintah Kabupaten Teluk Bintuni. Bintuni.