the influence of subsurface moisture on rill system evolution
TRANSCRIPT
Earth Surface Processes and LandformsEarth Surf. Process. Landforms, 23, 773–789 (1998)
THE INFLUENCE OF SUBSURFACE MOISTURE ON RILL SYSTEMEVOLUTION
R. B. BRYAN*, R. M. HAWKE AND D. L. ROCKWELL†Soil Erosion Laboratory, University of Toronto (Scarborough), 1265 Military Trail, Scarborough, Ontario M1C 1A4, Canada
Received 21 December 1994; Revised 29 October 1997; Accepted 1 December 1997
ABSTRACT
Rill development studies have focused almost exclusively on surface erosion processes and critical threshold hydraulicconditions. Characteristic rill features, such as arcuate headcuts and knickpoints, are morphologically similar to the‘theatre-headed’ valleys which have been associated with ‘sapping’ processes at various scales. This paper reports onlaboratory experiments designed to identify linkages between surface flow hydraulics, subsurface moisture conditions andrill development. Experiments were carried out in a 16·57m2 flume under simulated rainfall with soil samples up to 0·15mdepth in which moisture conditions were monitored by miniature time-domain reflectometer probes. Tests showedcomplex responses in which some rill incision reflected surface flow conditions, but major rill system development withmarkedly enhanced sediment yield was closely associated with high soil moisture contents. It was not possible to measureseepage forces directly, but calculation and observation indicate that these were less important than reduction in soilstrength with saturation, which resulted in increased effective runoff erosivity. This caused concentrated undercuttingalong the water table at rill walls, while slightly stronger surface layers above the water table formed microscarps. Theseretreated along the water table into interrill surfaces, producing residual pediment transport slopes. The microscarpseventually disappeared when the water table reached the surface, eliminating differential soil strength.
The experiments showed complex relationships between surface and subsurface erosional processes in evolving rillsystems, strongly influenced by soil moisture dynamics. The very small topographic and hydraulic head amplitudesindicate that seepage forces and ‘sapping’ were minimal. The dominant effect of soil moisture was reduction of soilstrength with saturation, and increased runoff entrainment. Experimental conditions were not unusual, either foragricultural fields or natural hillslopes, and the intricate interrelationship of surface and subsurface erosion processesobserved is probably not uncommon. Attempts to link specific morphologic features at rill scale to dominance of surface orsubsurface processes alone are therefore unlikely to be successful or reliable. 1998 John Wiley & Sons, Ltd.
KEY WORDS: rill system development; hydraulic thresholds; soil moisture; sapping; laboratory experiments.
INTRODUCTION
The geomorphological significance of rill systems has been recognized since Horton’s (1945) paper on drainagesystem evolution and Schumm’s (1956) use of rill-scale analogues in the Perth Amboy badlands as a basis forconcepts of river channel development. Rills have also been a central focus in soil erosion research because ofassociated rapid increase in soil transport rates (e.g. Loch and Donnollan, 1983). Most rill studies haveemphasized formation by surface processes, particularly thin sheetflow, and have attempted to isolate criticalthreshold values for diagnostic hydraulic parameters (Bryan, 1987). Subsurface process have usually beeninvoked only where micropiping occurs on swelling clay soils (e.g. Bryan et al., 1978; Gerits et al., 1987).
The diagnostic hydraulic parameters most frequently identified are shear velocity (u*), stream power (ω) andFroude number (Fr) (e.g. Govers and Rauws, 1986; Rauws, 1987; Rauws and Govers, 1988; Bryan and Peosen,1989; Govers et al., 1990; Rose et al., 1990; Slattery and Bryan, 1992a; Merz and Bryan, 1993). Virtually allstudies concur that rill incision requires u* values greater than about 0·035m s−1, but otherwise there is little
* Correspondence to: R. B. Bryan, Soil Erosion Laboratory, University of Toronto (Scarborough), 1265, Military Trail, Scarborough, OntarioM1C 1A4 Canada.† Now with Teal Group Corporation, Fairfax, Virginia, USAContract/grant sponsor: Natural Sciences and Engineering Research Council
CCC 0197-9337/98/090773–17 1998 John Wiley & Sons, Ltd.
774 R. B. BRYAN ET AL.
agreement about the most useful parameters or critical threshold values. This may reflect differences in soilsand experimental design, but comparison of results is also hindered by lack of data on soil conditions (e.g. bulkdensity, antecedent moisture) and common morphological criteria.
Merritt (1984) and Torri et al. (1987) suggested explicit criteria to identify ‘microrill’ incision linked withgently sloping headcuts formed by flow convergence. In many studies, however, till incision is associated withsteep or vertical, arcuate headcuts, which dramatically alter local hydraulic conditions (Bryan, 1990).Ephemeral arcuate knickpoints can develop within rill channels (Bryan and Poesen, 1989), but more persistentfeatures form as headcuts incised into more resistant surface layers. These are perfect small-scale analogues ofgullies (Bryan and Oostwoud Wijdenes, 1992) and of large river channels in bedrock, as recognized inDePloey’s (1989) model.
The arcuate headcuts described were attributed to surface erosion processes. However, this typicalmorphology closely resembles the ‘theatre-headed’ valleys often linked to subsurface sapping or seepage (e.g.Hinds, 1925; Higgins, 1974, 1982, 1990; Kochel et al., 1985; Baker, 1990; Onda, 1994; Uchupi and Oldale, 1994;Nash, 1996). Some observations involve large valleys related to groundwater weathering in resistant rock(Laity, 1983; Laity and Malin, 1985; Kochel and Piper, 1986; Howard and McLane, 1988), and others concernsmall-scale features in laboratory studies with low cohesion materials (Howard and McLane, 1988; Sakuro etal., 1987; Gomez and Mullen, 1992).
This brief literature review suggests that drainage systems with arcuate headcuts, steep sides and broad flatfloors can be formed at various scales by either surface or subsurface processes. This is potentially significant asthey have been used as evidence of processes which cannot be directly observed, as with suggested sappingfeatures on Mars (Higgins, 1982; Kochel et al., 1985). More precise understanding of the relationships betweenchannel and basin form, and surface and subsurface erosion processes is therefore necessary. It is difficult to testthese relationships at large scale, but it is possible at laboratory scale. However, few laboratory studies providesimultaneous information on both surface and subsurface processes. Experimental design in most of thelaboratory rill studies identified above would certainly have involved significantly impeded drainage, yet onlysurface process data are available. In addition, in most cases, data were collected only at terminal weirs, so thatprecise identification of entrainment processes is very difficult.
This paper describes experiments carried out at the Soil Erosion Laboratory, University of Toronto, designedto provide:
1. observations of rill system development patterns;2. simultaneous local measurement of surface hydraulic and soil moisture data, together with water and
sediment discharge at a terminal weir;
with two objectives:
1. to identify the nature of subsurface erosion processes active in rill development on soils;2. to determine if surface or subsurface processes can be linked with specific morphological characteristics
(e.g. ‘theatre-valley’ morphologies) at rill scale.
EXPERIMENTAL DESIGN
Experiments were carried out in a planar flume (7·1m×2·4m) with a surface area of 16·57m2 and inclination of0·087. The base was formed with mesh inserts covered by porous fabric intended to provide free drainage, butwhich turned out to be somewhat impermeable. A mixture of two soils from southern Ontario, the Pontypoolsand and Peel clay, was used in a 4:1 ratio. This mixture has been used in several previous studies (Bryan andPoesen, 1989; Bryan, 1990; Slattery and Bryan, 1992a,b, 1994) providing abundant background information onmaterial behaviour and rill initiation under different experimental conditions. Sample characteristics are shownin Table I.
Air-dry material was sieved through an 8mm sieve, then packed into the flume to an average initial bulkdensity of 1·3Mg m−3. Soil was packed in several layers, each lightly raked to minimize heterogeneity andstructural layering. Despite care, some heterogeneity did occur, but this was localized and random. The bed was
1998 John Wiley & Sons, Ltd. Earth Surf. Process. Landforms 23, 773–789 (1998)
775RILL DEVELOPMENT
Table I. Characteristics of binary soil used in experiments
Characteristic
Sand content (%)Silt content (%)Clay content (%)D50 (mm)D90 (mm)Liquid limit (%)Consistency (c5-10) index (%)WSA>2·8mm (% weight)WSA>0·5mm (% weight)Saturated hydraulic conductivity (ms−1)
49·432·518·10·252·0017·11·671·918·12
0·0022
Table II. Summary data for three initial and two subsequent flume experiments
Date of experiment
6 April 20 May 2 June 7 December 10 December
Duration (min 120 120 60 120 60Antecedent moisturecontent mlml−1)
0·0858·5
0·0555·5
0·1313·0
0·0494·9
0·19419·4
Mean bulk density(Mgm−3)
1·3 1·3 1·5 1·3 1·5
Total rainfall (mm) 117·2 107·1 54·8 101·9 59·5Mean rainfall intensity(mmh−1)
58·6 53·6 54·8 50·9 59·5
Storm discharge (m3) 1·606 1·587 0·934 0·911 0·991Peak discharge (1min−1) 19·0 18·4 19·1 12·8 16·9Runoff coefficient (%) 81·7 88·3 99·0 53·3 99·3Storm sedimentdischarge (kg)
61·9 72·1 58·5 80·8 110·3
Peak sediment discharge(gl−1)
51·5 67·5 88·8 125·4 146·8
shaped to a broad central valley (to 6m above the weir) to constrain rill development and facilitateinstrumentation. Initial soil depths were 0·15 and 0·10m at the drainage divide and central valley, respectively,providing an average initial interrill slope of 0·042 and thalweg of 0·087.
Tests were carried out with simulated rainfall generated by two SPRACO nozzles (#48252613) at 4m meanfall-height. Rainfall was measured by eight manual gauges arranged around the flume edge (Table II). Rainfalldistribution was generally satisfactory, but some concentration occurred in the upper flume and where spraycones overlapped in the central flume which could not be precisely defined with gauges confined to theperiphery. Three initial experiments were carried out on newly sieved soil and two subsequent tests (2 June, 10December) on pre-rilled surfaces. Initial tests lasted 120 min, and those on pre-rilled surfaces, 60 min.
Water and sediment discharge were measured at the weir at 5 min intervals after flow initiation. Data on localflow and sediment transport conditions (flow velocity, depth, width, suspended sediment concentration andbedload) were collected almost continuously by observers on mobile sampling bridges using techniquesdescribed by Bryan (1990). Flow data were used to calculate hydraulic variables. In initial tests, data werecollected from the central valley and at most rill initiation locations, but in subsequent tests measurement wasconcentrated in a few selected rill channels.
Information on subsurface moisture conditions were collected from 14 miniature time-domain reflectometer(TDR) probes (Hawke, 1997). These were inserted vertically through the base of the flume at the locationsshown in Figure 5b, and linked to a Tektronix cable tester and a Campbell data logger. The probes integratemoisture content over the 8cm probe sensor length.
1998 John Wiley & Sons, Ltd. Earth Surf. Process. Landforms 23, 773–789 (1998)
776 R. B. BRYAN ET AL.
(a)
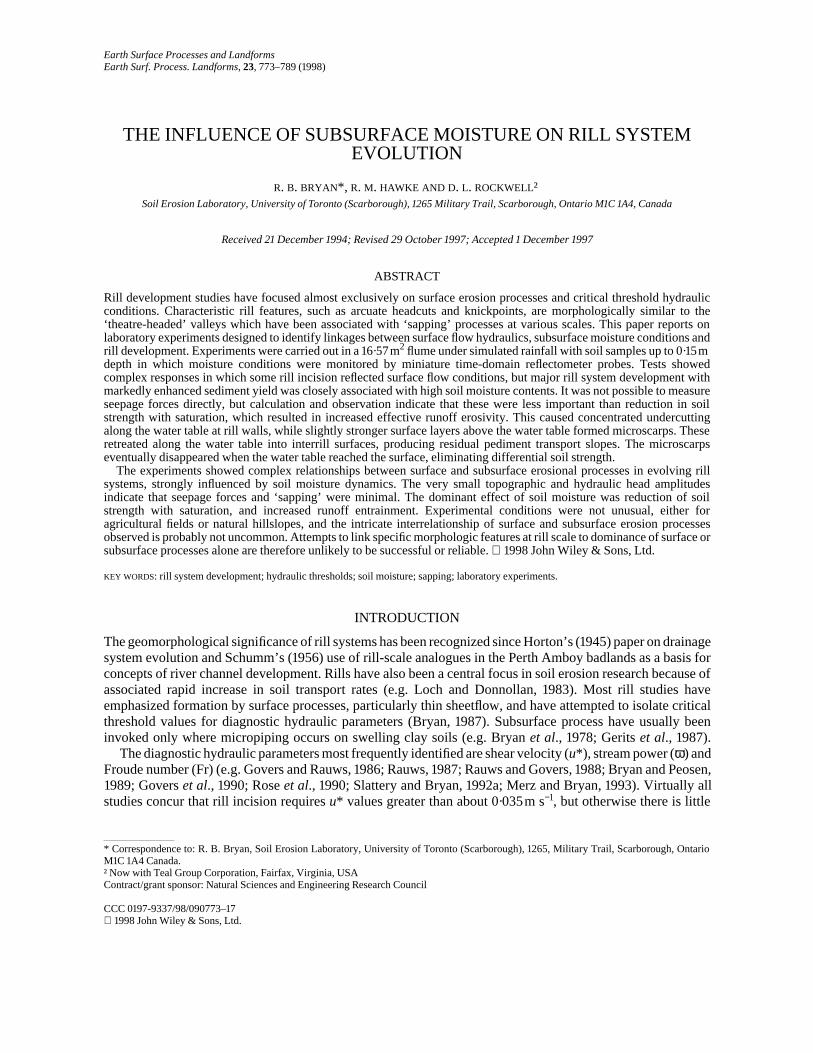
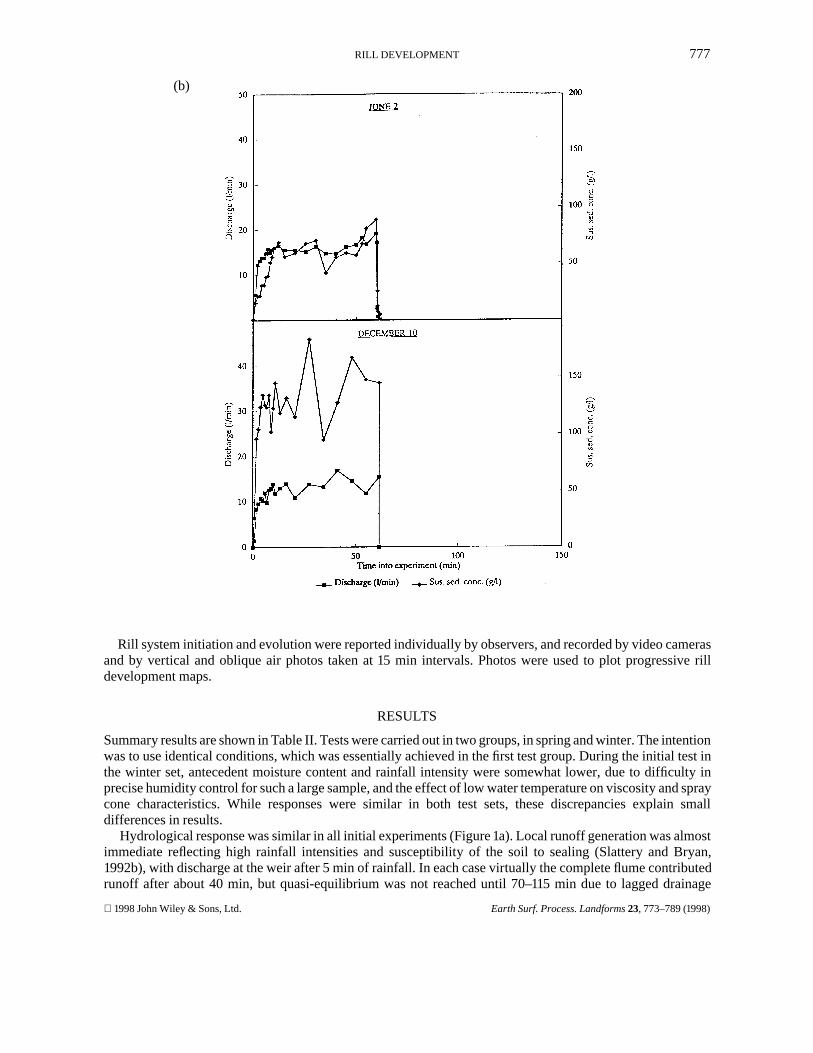
Figure 1. Hydrograph and sediment concentration variations: (a) during initial experiments on newly prepared soils, 6 April, 20 May, 7December; (b) during subsequent experiments on rilled surfaces, 2 June, 10 December
1998 John Wiley & Sons, Ltd. Earth Surf. Process. Landforms 23, 773–789 (1998)
777RILL DEVELOPMENT
(b)
Rill system initiation and evolution were reported individually by observers, and recorded by video camerasand by vertical and oblique air photos taken at 15 min intervals. Photos were used to plot progressive rilldevelopment maps.
RESULTS
Summary results are shown in Table II. Tests were carried out in two groups, in spring and winter. The intentionwas to use identical conditions, which was essentially achieved in the first test group. During the initial test inthe winter set, antecedent moisture content and rainfall intensity were somewhat lower, due to difficulty inprecise humidity control for such a large sample, and the effect of low water temperature on viscosity and spraycone characteristics. While responses were similar in both test sets, these discrepancies explain smalldifferences in results.
Hydrological response was similar in all initial experiments (Figure 1a). Local runoff generation was almostimmediate reflecting high rainfall intensities and susceptibility of the soil to sealing (Slattery and Bryan,1992b), with discharge at the weir after 5 min of rainfall. In each case virtually the complete flume contributedrunoff after about 40 min, but quasi-equilibrium was not reached until 70–115 min due to lagged drainage
1998 John Wiley & Sons, Ltd. Earth Surf. Process. Landforms 23, 773–789 (1998)
778 R. B. BRYAN ET AL.
(a) (b)
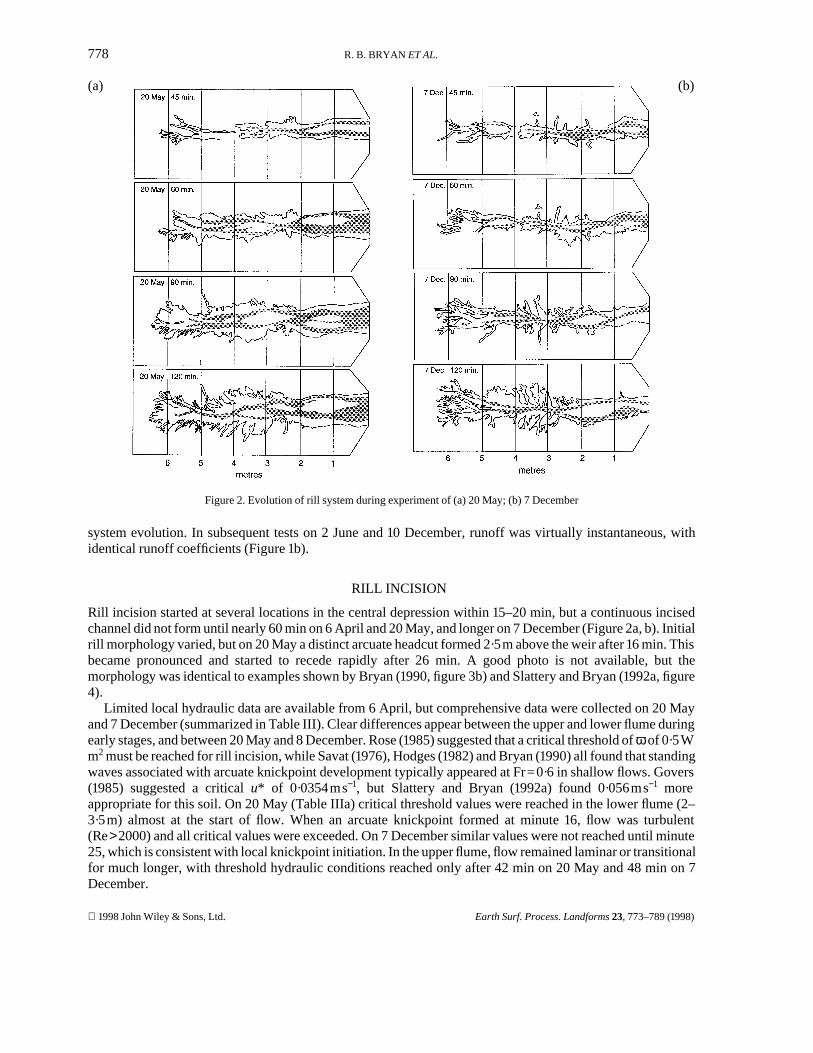
Figure 2. Evolution of rill system during experiment of (a) 20 May; (b) 7 December
system evolution. In subsequent tests on 2 June and 10 December, runoff was virtually instantaneous, withidentical runoff coefficients (Figure 1b).
RILL INCISION
Rill incision started at several locations in the central depression within 15–20 min, but a continuous incisedchannel did not form until nearly 60 min on 6 April and 20 May, and longer on 7 December (Figure 2a, b). Initialrill morphology varied, but on 20 May a distinct arcuate headcut formed 2·5m above the weir after 16 min. Thisbecame pronounced and started to recede rapidly after 26 min. A good photo is not available, but themorphology was identical to examples shown by Bryan (1990, figure 3b) and Slattery and Bryan (1992a, figure4).
Limited local hydraulic data are available from 6 April, but comprehensive data were collected on 20 Mayand 7 December (summarized in Table III). Clear differences appear between the upper and lower flume duringearly stages, and between 20 May and 8 December. Rose (1985) suggested that a critical threshold of ω of 0·5Wm2 must be reached for rill incision, while Savat (1976), Hodges (1982) and Bryan (1990) all found that standingwaves associated with arcuate knickpoint development typically appeared at Fr=0·6 in shallow flows. Govers(1985) suggested a critical u* of 0·0354ms−1, but Slattery and Bryan (1992a) found 0·056ms−1 moreappropriate for this soil. On 20 May (Table IIIa) critical threshold values were reached in the lower flume (2–3·5m) almost at the start of flow. When an arcuate knickpoint formed at minute 16, flow was turbulent(Re>2000) and all critical values were exceeded. On 7 December similar values were not reached until minute25, which is consistent with local knickpoint initiation. In the upper flume, flow remained laminar or transitionalfor much longer, with threshold hydraulic conditions reached only after 42 min on 20 May and 48 min on 7December.
1998 John Wiley & Sons, Ltd. Earth Surf. Process. Landforms 23, 773–789 (1998)
779RILL DEVELOPMENT
Table III. Summary hydraulic data and associated rill development features
(a) 20 May experiment
Time(min)
v q u* Re Fr ff ω Flow conditions
Location: 2·0–3·5m above weir
0–21 0·140(0·018)
11·0(1·29)
0·056(0·030)
2140(258)
0·766(0·124)
1·023(0·391)
0·460(0·054)
Sheetwash without incision
21–45 0·145(0·014)
13·0(2·14)
0·070(0·018)
4590(1739)
0·569(0·135)
2·525(1·163)
1·143(0·516)
Knickpoint incision
45–95 0·305(0·037)
13·4(8·67)
0·063(0·014)
6140(3328)
1·499(0·351)
0·326(0·102)
1·448(0·826)
Multiple knickpoint incision andpediment development
95–120 0·195(0·082)
0·76(0·26)
0·029(0·001)
598(472)
2·003(0·842)
0·256(0·133)
0·167(0·070)
Aggradation
Location: 4·5–5·0m above weir
0–35 0·075(0·018)
3·55(1·43)
0·054(0·003)
1015(206)
0·413(0·066)
4·403(1·432)
0·224(0·045)
Sheetwash with limited incision
35–120 0·232(0·052)
14·48(4·08)
0·062(0·003)
4436(1749)
1·086(0·226)
0·656(0·216)
0·996(0·413)
Knickpoint incision
(b) 7 December experiment
Time(min)
v q u* Re Fr ff ω Flow conditions
0–35 0·164(0·037)
5·84(3·84)
0·052(0·003)
2201(689)
0·981(0·201)
0·867(0·510)
0·492(0·157)
Sheetwash with very local incision
35–62 0·241(0·039)
12·09(4·60)
0·069(0·006)
5512(1496)
1·026(0·161)
0·864(0·233)
1·298(0·362)
Knickpoint incision
62–120 0·308(0·039)
11·08(3·57)
0·066(0·004)
6465(1039)
1·361(0·195)
0·402(0·131)
1·565(0·299)
Multiple knickpoint incision andsapping pediment development
Location: 4·5–5·0m above weir
0–55 0·091(0·038)
2·15(2·03)
0·036(0·0101)
711(679)
0·732(0·192)
1·776(1·505)
0·157(0·152)
Sheetwash with local incision
55–120 0·175(0·010)
7·34(2·33)
0·059(0·006)
2920(589)
0·875(0·074)
0·928(0·162)
0·659(0·136)
Knickpoint incision
v=velocity (ms1); q=discharge (lmin−1); u*=shear velocity (ms−1); Re=Reynolds number; Fr=Froude number; ff=Darcy–Weisbach friction factor; ω= stream power (Wm−2). Values in parentheses are standard deviations
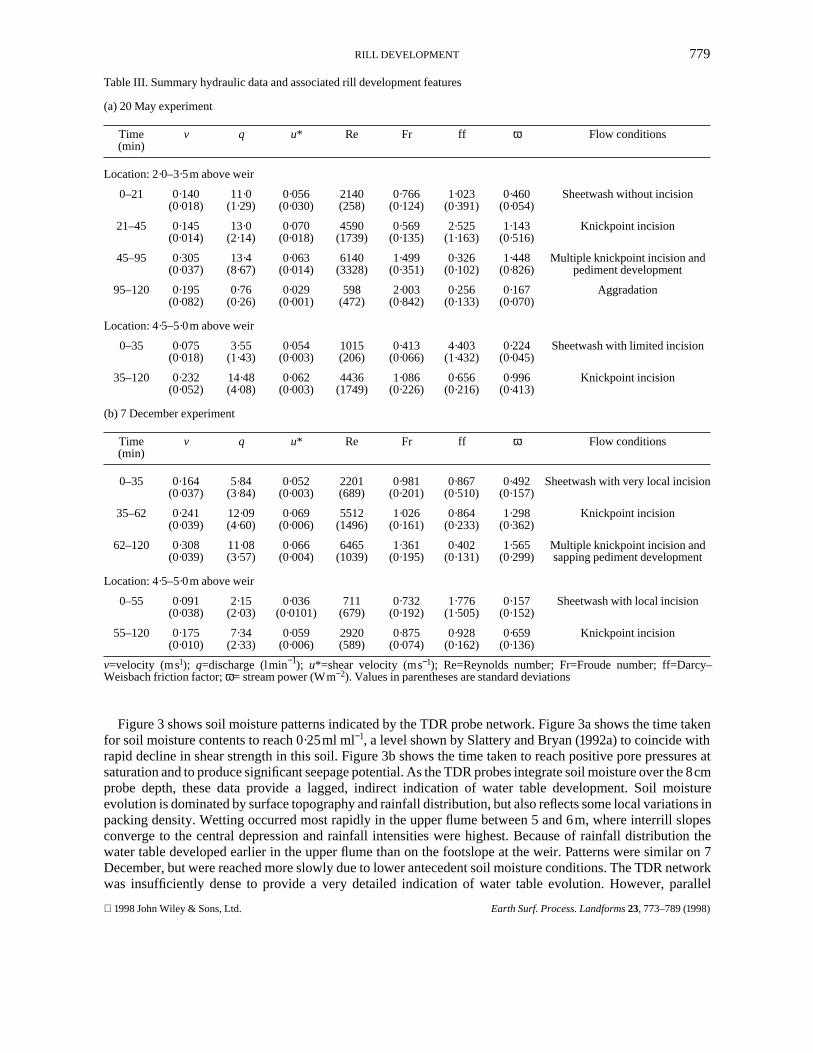
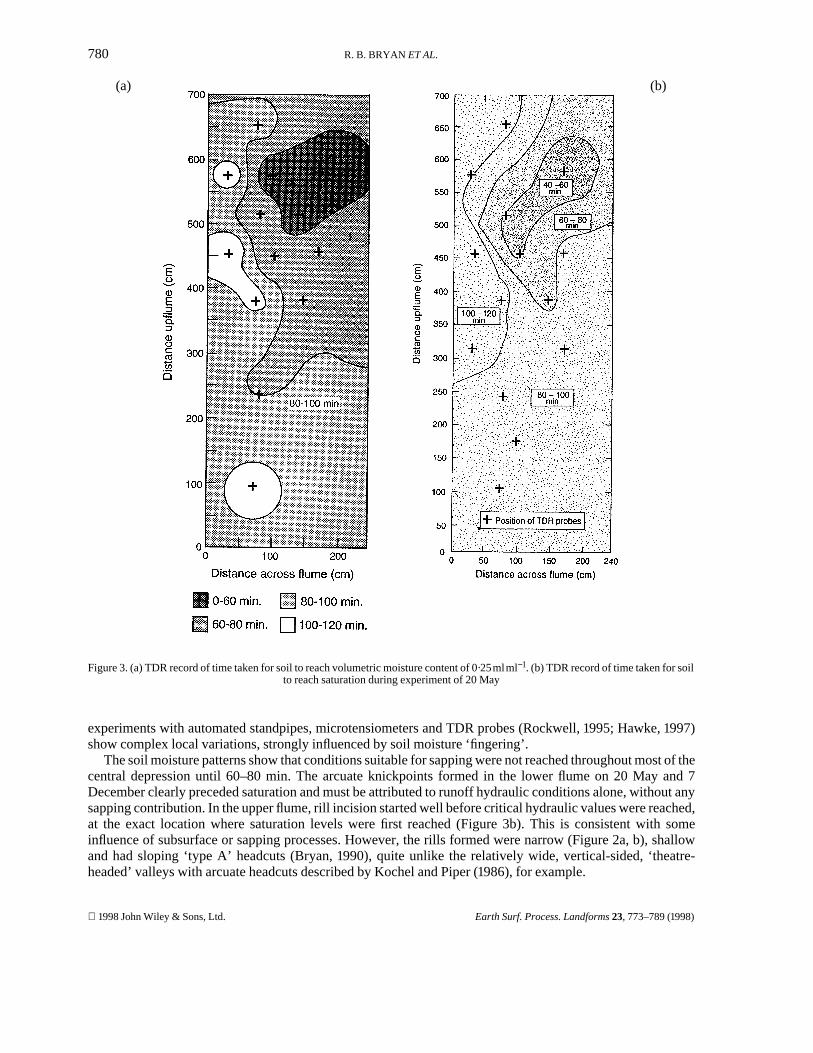
Figure 3 shows soil moisture patterns indicated by the TDR probe network. Figure 3a shows the time takenfor soil moisture contents to reach 0·25ml ml−1, a level shown by Slattery and Bryan (1992a) to coincide withrapid decline in shear strength in this soil. Figure 3b shows the time taken to reach positive pore pressures atsaturation and to produce significant seepage potential. As the TDR probes integrate soil moisture over the 8cmprobe depth, these data provide a lagged, indirect indication of water table development. Soil moistureevolution is dominated by surface topography and rainfall distribution, but also reflects some local variations inpacking density. Wetting occurred most rapidly in the upper flume between 5 and 6m, where interrill slopesconverge to the central depression and rainfall intensities were highest. Because of rainfall distribution thewater table developed earlier in the upper flume than on the footslope at the weir. Patterns were similar on 7December, but were reached more slowly due to lower antecedent soil moisture conditions. The TDR networkwas insufficiently dense to provide a very detailed indication of water table evolution. However, parallel
1998 John Wiley & Sons, Ltd. Earth Surf. Process. Landforms 23, 773–789 (1998)
780 R. B. BRYAN ET AL.
(a) (b)
Figure 3. (a) TDR record of time taken for soil to reach volumetric moisture content of 0·25mlml−1. (b) TDR record of time taken for soilto reach saturation during experiment of 20 May
experiments with automated standpipes, microtensiometers and TDR probes (Rockwell, 1995; Hawke, 1997)show complex local variations, strongly influenced by soil moisture ‘fingering’.
The soil moisture patterns show that conditions suitable for sapping were not reached throughout most of thecentral depression until 60–80 min. The arcuate knickpoints formed in the lower flume on 20 May and 7December clearly preceded saturation and must be attributed to runoff hydraulic conditions alone, without anysapping contribution. In the upper flume, rill incision started well before critical hydraulic values were reached,at the exact location where saturation levels were first reached (Figure 3b). This is consistent with someinfluence of subsurface or sapping processes. However, the rills formed were narrow (Figure 2a, b), shallowand had sloping ‘type A’ headcuts (Bryan, 1990), quite unlike the relatively wide, vertical-sided, ‘theatre-headed’ valleys with arcuate headcuts described by Kochel and Piper (1986), for example.
1998 John Wiley & Sons, Ltd. Earth Surf. Process. Landforms 23, 773–789 (1998)
781RILL DEVELOPMENT
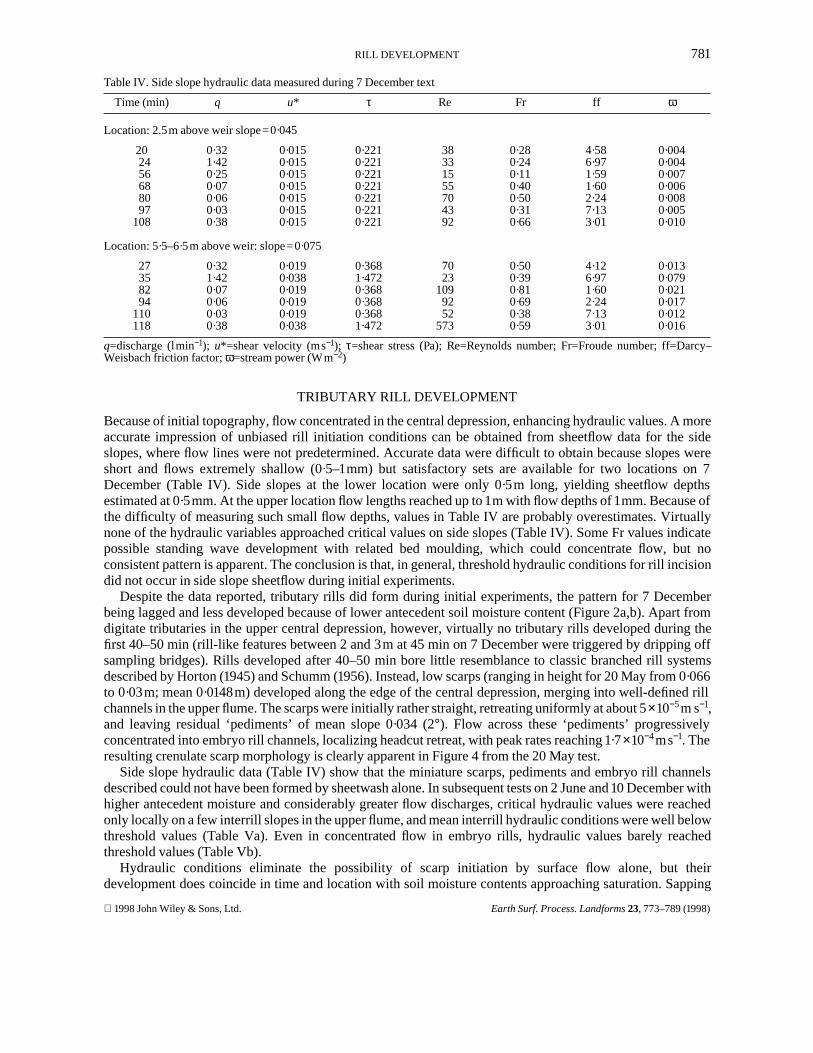
Table IV. Side slope hydraulic data measured during 7 December text
Time (min) q u* τ Re Fr ff ω
Location: 2.5m above weir slope=0·045
202456688097
108
0·321·420·250·070·060·030·38
0·0150·0150·0150·0150·0150·0150·015
0·2210·2210·2210·2210·2210·2210·221
38331555704392
0·280·240·110·400·500·310·66
4·586·971·591·602·247·133·01
0·0040·0040·0070·0060·0080·0050·010
Location: 5·5–6·5m above weir: slope=0·075
27358294
110118
0·321·420·070·060·030·38
0·0190·0380·0190·0190·0190·038
0·3681·4720·3680·3680·3681·472
7023
1099252
573
0·500·390·810·690·380·59
4·126·971·602·247·133·01
0·0130·0790·0210·0170·0120·016
q=discharge (lmin−1); u*=shear velocity (ms−1); τ=shear stress (Pa); Re=Reynolds number; Fr=Froude number; ff=Darcy–Weisbach friction factor; ω=stream power (Wm−2)
TRIBUTARY RILL DEVELOPMENT
Because of initial topography, flow concentrated in the central depression, enhancing hydraulic values. A moreaccurate impression of unbiased rill initiation conditions can be obtained from sheetflow data for the sideslopes, where flow lines were not predetermined. Accurate data were difficult to obtain because slopes wereshort and flows extremely shallow (0·5–1mm) but satisfactory sets are available for two locations on 7December (Table IV). Side slopes at the lower location were only 0·5m long, yielding sheetflow depthsestimated at 0·5mm. At the upper location flow lengths reached up to 1m with flow depths of 1mm. Because ofthe difficulty of measuring such small flow depths, values in Table IV are probably overestimates. Virtuallynone of the hydraulic variables approached critical values on side slopes (Table IV). Some Fr values indicatepossible standing wave development with related bed moulding, which could concentrate flow, but noconsistent pattern is apparent. The conclusion is that, in general, threshold hydraulic conditions for rill incisiondid not occur in side slope sheetflow during initial experiments.
Despite the data reported, tributary rills did form during initial experiments, the pattern for 7 Decemberbeing lagged and less developed because of lower antecedent soil moisture content (Figure 2a,b). Apart fromdigitate tributaries in the upper central depression, however, virtually no tributary rills developed during thefirst 40–50 min (rill-like features between 2 and 3m at 45 min on 7 December were triggered by dripping offsampling bridges). Rills developed after 40–50 min bore little resemblance to classic branched rill systemsdescribed by Horton (1945) and Schumm (1956). Instead, low scarps (ranging in height for 20 May from 0·066to 0·03m; mean 0·0148m) developed along the edge of the central depression, merging into well-defined rillchannels in the upper flume. The scarps were initially rather straight, retreating uniformly at about 5×10⁻⁵ m s−1,and leaving residual ‘pediments’ of mean slope 0·034 (2°). Flow across these ‘pediments’ progressivelyconcentrated into embryo rill channels, localizing headcut retreat, with peak rates reaching 1·7×10−4 ms−1. Theresulting crenulate scarp morphology is clearly apparent in Figure 4 from the 20 May test.
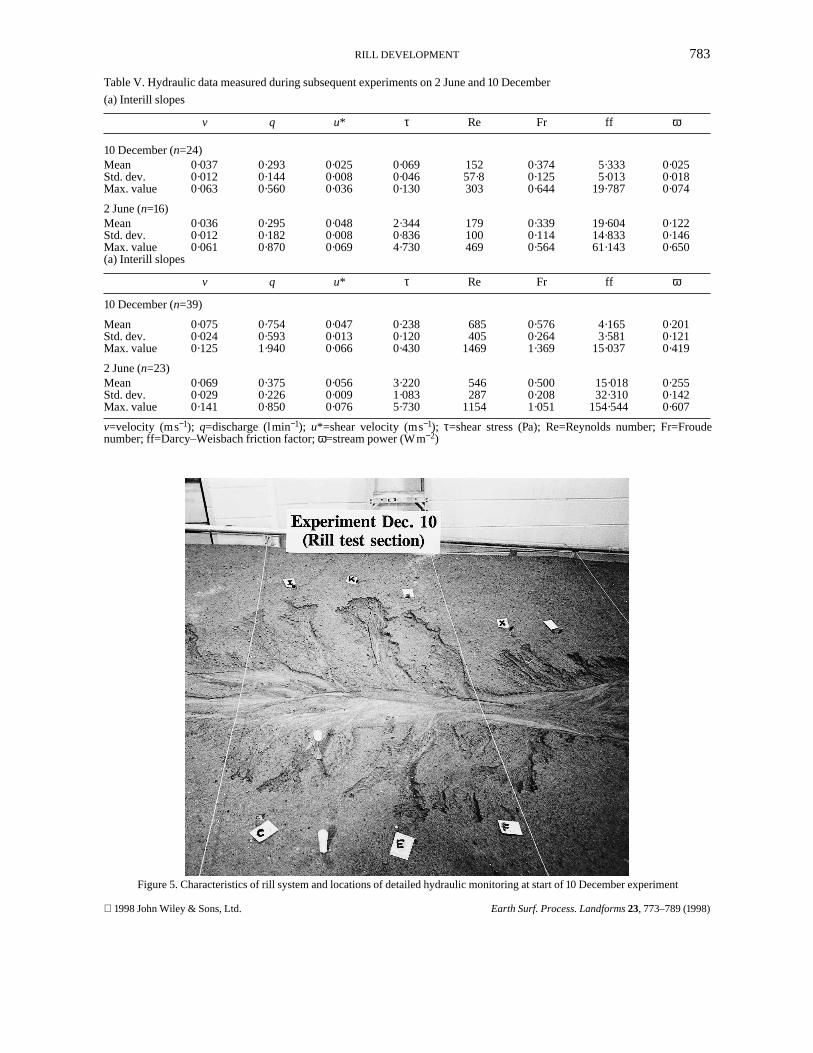
Side slope hydraulic data (Table IV) show that the miniature scarps, pediments and embryo rill channelsdescribed could not have been formed by sheetwash alone. In subsequent tests on 2 June and 10 December withhigher antecedent moisture and considerably greater flow discharges, critical hydraulic values were reachedonly locally on a few interrill slopes in the upper flume, and mean interrill hydraulic conditions were well belowthreshold values (Table Va). Even in concentrated flow in embryo rills, hydraulic values barely reachedthreshold values (Table Vb).
Hydraulic conditions eliminate the possibility of scarp initiation by surface flow alone, but theirdevelopment does coincide in time and location with soil moisture contents approaching saturation. Sapping
1998 John Wiley & Sons, Ltd. Earth Surf. Process. Landforms 23, 773–789 (1998)
782 R. B. BRYAN ET AL.
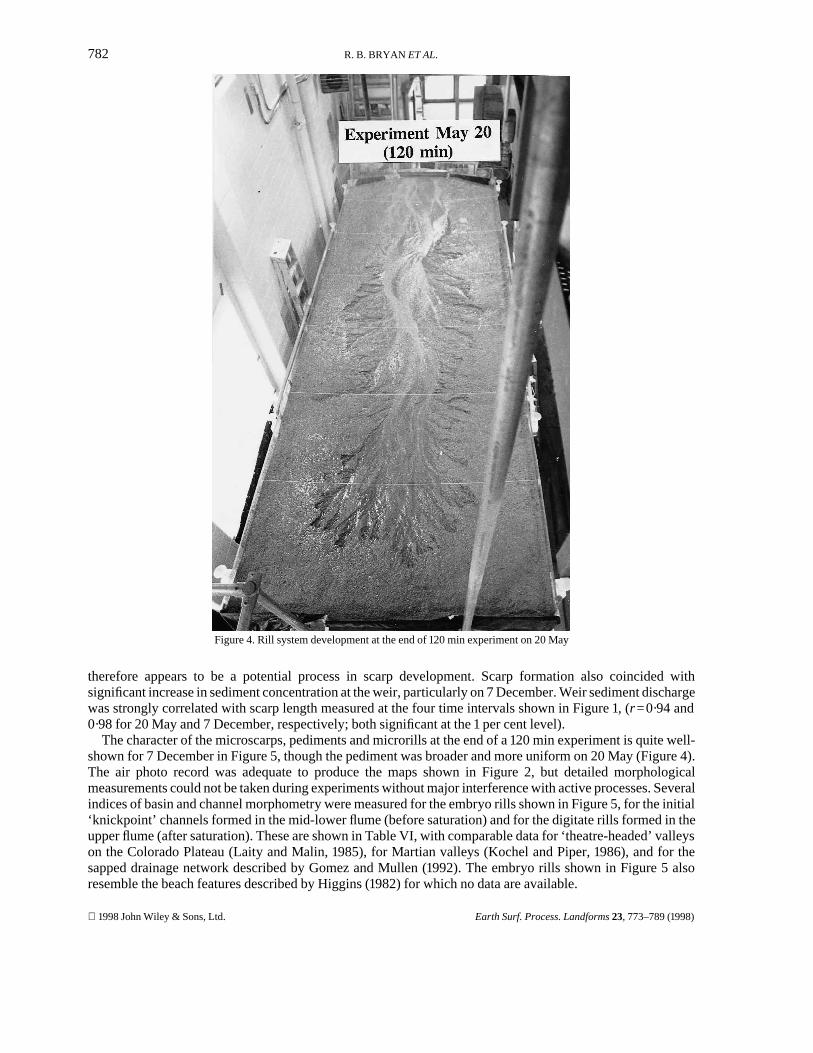
Figure 4. Rill system development at the end of 120 min experiment on 20 May
therefore appears to be a potential process in scarp development. Scarp formation also coincided withsignificant increase in sediment concentration at the weir, particularly on 7 December. Weir sediment dischargewas strongly correlated with scarp length measured at the four time intervals shown in Figure 1, (r=0·94 and0·98 for 20 May and 7 December, respectively; both significant at the 1 per cent level).
The character of the microscarps, pediments and microrills at the end of a 120 min experiment is quite well-shown for 7 December in Figure 5, though the pediment was broader and more uniform on 20 May (Figure 4).The air photo record was adequate to produce the maps shown in Figure 2, but detailed morphologicalmeasurements could not be taken during experiments without major interference with active processes. Severalindices of basin and channel morphometry were measured for the embryo rills shown in Figure 5, for the initial‘knickpoint’ channels formed in the mid-lower flume (before saturation) and for the digitate rills formed in theupper flume (after saturation). These are shown in Table VI, with comparable data for ‘theatre-headed’ valleyson the Colorado Plateau (Laity and Malin, 1985), for Martian valleys (Kochel and Piper, 1986), and for thesapped drainage network described by Gomez and Mullen (1992). The embryo rills shown in Figure 5 alsoresemble the beach features described by Higgins (1982) for which no data are available.
1998 John Wiley & Sons, Ltd. Earth Surf. Process. Landforms 23, 773–789 (1998)
783RILL DEVELOPMENT
Table V. Hydraulic data measured during subsequent experiments on 2 June and 10 December
(a) Interill slopes
v q u* τ Re Fr ff ω
10 December (n=24)MeanStd. dev.Max. value
0·0370·0120·063
0·2930·1440·560
0·0250·0080·036
0·0690·0460·130
15257·8303
0·3740·1250·644
5·3335·013
19·787
0·0250·0180·074
2 June (n=16)MeanStd. dev.Max. value
0·0360·0120·061
0·2950·1820·870
0·0480·0080·069
2·3440·8364·730
179100469
0·3390·1140·564
19·60414·83361·143
0·1220·1460·650
(a) Interill slopes
v q u* τ Re Fr ff ω
10 December (n=39)
MeanStd. dev.Max. value
0·0750·0240·125
0·7540·5931·940
0·0470·0130·066
0·2380·1200·430
685405
1469
0·5760·2641·369
4·1653·581
15·037
0·2010·1210·419
2 June (n=23)MeanStd. dev.Max. value
0·0690·0290·141
0·3750·2260·850
0·0560·0090·076
3·2201·0835·730
546287
1154
0·5000·2081·051
15·01832·310
154·544
0·2550·1420·607
v=velocity (ms−1); q=discharge (lmin−1); u*=shear velocity (ms−1); τ=shear stress (Pa); Re=Reynolds number; Fr=Froudenumber; ff=Darcy–Weisbach friction factor; ω=stream power (Wm−2)
Figure 5. Characteristics of rill system and locations of detailed hydraulic monitoring at start of 10 December experiment
1998 John Wiley & Sons, Ltd. Earth Surf. Process. Landforms 23, 773–789 (1998)
784 R. B. BRYAN ET AL.
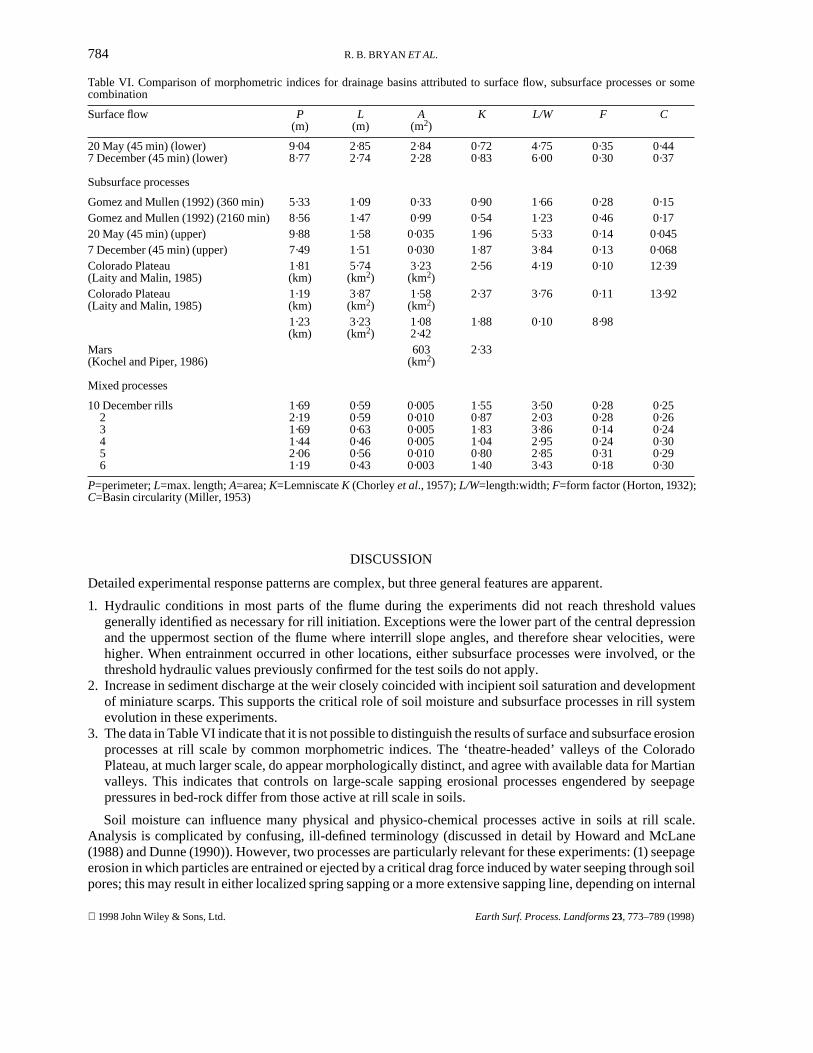
Table VI. Comparison of morphometric indices for drainage basins attributed to surface flow, subsurface processes or somecombination
Surface flow P(m)
L(m)
A(m2)
K L/W F C
20 May (45 min) (lower)7 December (45 min) (lower)
9·048·77
2·852·74
2·842·28
0·720·83
4·756·00
0·350·30
0·440·37
Subsurface processes
Gomez and Mullen (1992) (360 min) 5·33 1·09 0·33 0·90 1·66 0·28 0·15Gomez and Mullen (1992) (2160 min) 8·56 1·47 0·99 0·54 1·23 0·46 0·1720 May (45 min) (upper) 9·88 1·58 0·035 1·96 5·33 0·14 0·0457 December (45 min) (upper) 7·49 1·51 0·030 1·87 3·84 0·13 0·068Colorado Plateau(Laity and Malin, 1985)
1·81(km)
5·74(km2)
3·23(km2)
2·56 4·19 0·10 12·39
Colorado Plateau(Laity and Malin, 1985)
1·19(km)
3·87(km2)
1·58(km2)
2·37 3·76 0·11 13·92
1·23(km)
3·23(km2)
1·082·42
1·88 0·10 8·98
Mars(Kochel and Piper, 1986)
603(km2)
2·33
Mixed processes
10 December rills23456
1·692·191·691·442·061·19
0·590·590·630·460·560·43
0·0050·0100·0050·0050·0100·003
1·550·871·831·040·801·40
3·502·033·862·952·853·43
0·280·280·140·240·310·18
0·250·260·240·300·290·30
P=perimeter; L=max. length; A=area; K=Lemniscate K (Chorley et al., 1957); L/W=length:width; F=form factor (Horton, 1932);C=Basin circularity (Miller, 1953)
DISCUSSION
Detailed experimental response patterns are complex, but three general features are apparent.
1. Hydraulic conditions in most parts of the flume during the experiments did not reach threshold valuesgenerally identified as necessary for rill initiation. Exceptions were the lower part of the central depressionand the uppermost section of the flume where interrill slope angles, and therefore shear velocities, werehigher. When entrainment occurred in other locations, either subsurface processes were involved, or thethreshold hydraulic values previously confirmed for the test soils do not apply.
2. Increase in sediment discharge at the weir closely coincided with incipient soil saturation and developmentof miniature scarps. This supports the critical role of soil moisture and subsurface processes in rill systemevolution in these experiments.
3. The data in Table VI indicate that it is not possible to distinguish the results of surface and subsurface erosionprocesses at rill scale by common morphometric indices. The ‘theatre-headed’ valleys of the ColoradoPlateau, at much larger scale, do appear morphologically distinct, and agree with available data for Martianvalleys. This indicates that controls on large-scale sapping erosional processes engendered by seepagepressures in bed-rock differ from those active at rill scale in soils.
Soil moisture can influence many physical and physico-chemical processes active in soils at rill scale.Analysis is complicated by confusing, ill-defined terminology (discussed in detail by Howard and McLane(1988) and Dunne (1990)). However, two processes are particularly relevant for these experiments: (1) seepageerosion in which particles are entrained or ejected by a critical drag force induced by water seeping through soilpores; this may result in either localized spring sapping or a more extensive sapping line, depending on internal
1998 John Wiley & Sons, Ltd. Earth Surf. Process. Landforms 23, 773–789 (1998)
785RILL DEVELOPMENT
soil structure (Dunne, 1990); (2) reduction in soil shear strength, with increased vulnerability to entrainment byeither surface or concentrated subsurface flow.
The evolution of soil moisture patterns (Figure 3a,b) and the water table are critical in isolating the processesactive in rill system evolution. Water table development was complex, with much local variation, but conditionswere not generally suitable for subsurface flow before saturation in the upper flume (Figure 3b). Rill initiationoccurred with knickpoint scour in the central flume, 2–3·5m above the weir, after 16–25 min. This precededsaturation at this location, and probably also water table development. No TDR probes were situated at thispoint but calculations from rainfall rates, infiltration rates, bulk density and hydraulic conductivity, correctedfor hydraulic compaction, show that a water table would have started to form after 27 min, and saturation couldnot have occurred here before minute 59 on 20 May and minute 33 on 7 December. Knickpoint scour at thislocation must therefore be attributed entirely to runoff tractive forces. In the upper flume, saturation occurredearlier and rills developed before threshold hydraulic values were reached. In both cases, entrainment wasenhanced by soil strength decline once moisture content exceeded 0·23–0·25ml ml−1. Discharge and sedimentconcentration data at the weir (Figure 1a,b) show that flow transport capacity was more than adequate to removeall sediment entrained at this stage.
Initial knickpoint scour expanded to a true rill by headward retreat with some channel widening by bankscour, but no bank collapse. Using the Terzaghi (1943) expression for critical vertical bank height:
Hc =4c
y
(where c=cohesive strength, y=bulk unit soil weight), with shear strength data from Slattery and Bryan(1992a), gave a critical incision depth of 28m. Initial knickpoint incision in the central flume was only 0·03m.Critical incision depth declines swiftly with increasing moisture content, as shear strength trends towards zeroat the saturation volumetric moisture content of 42 per cent (Slattery and Bryan, 1992a). Direct shear strengthmeasurement with a miniature shear vane during the 10 December test gave mean and minimum shear strengthvalues of 0·0302kPa and 0·006kPa respectively at saturation. Calculated critical incision depth declined to0·06m at saturation. This indicates that bank collapse did not contribute to channel widening in the centralflume, but did play a role in the upper flume where central rill incision eventually reached 0·11m.
The separate rill systems in the central and upper flume joined at about the same time that saturation occurredin much of the upper flume (Figure 3b). Although saturation was incomplete, a more or less continuous watertable probably covered most of the flume by this stage. The central rill subsequently widened and residualpediments and microscarps developed, coinciding with abrupt increase in sediment discharge at the weir(Figure 1a,b).
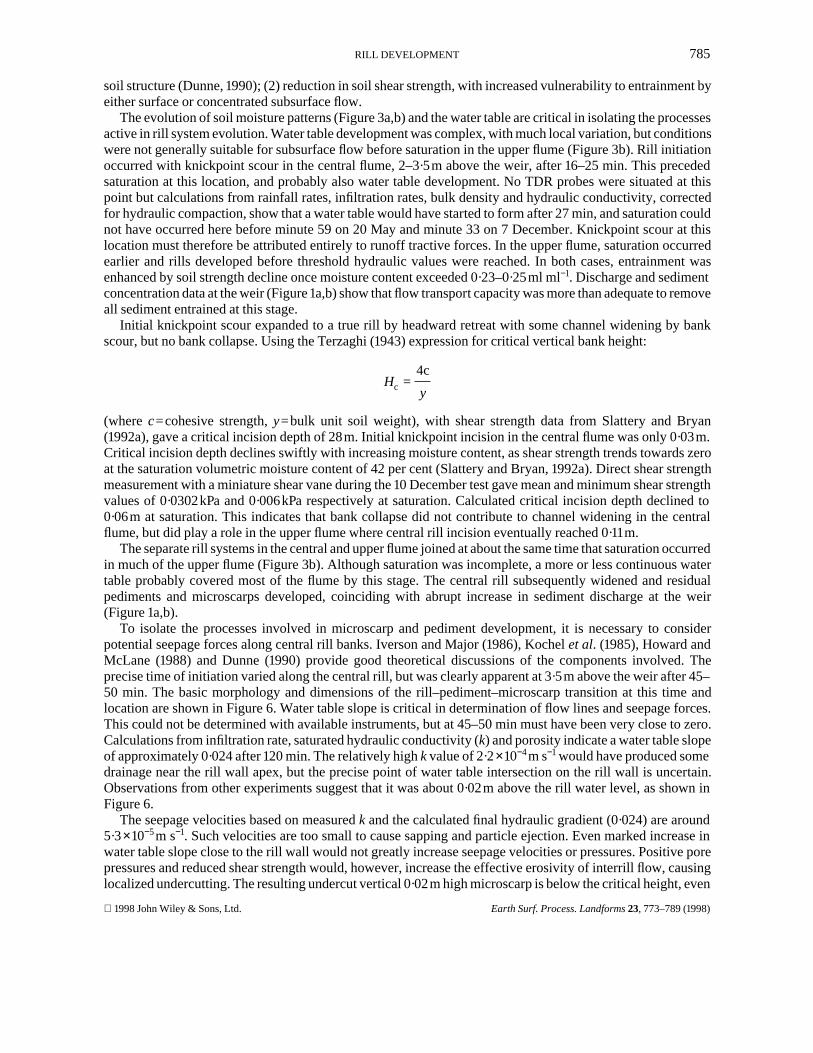
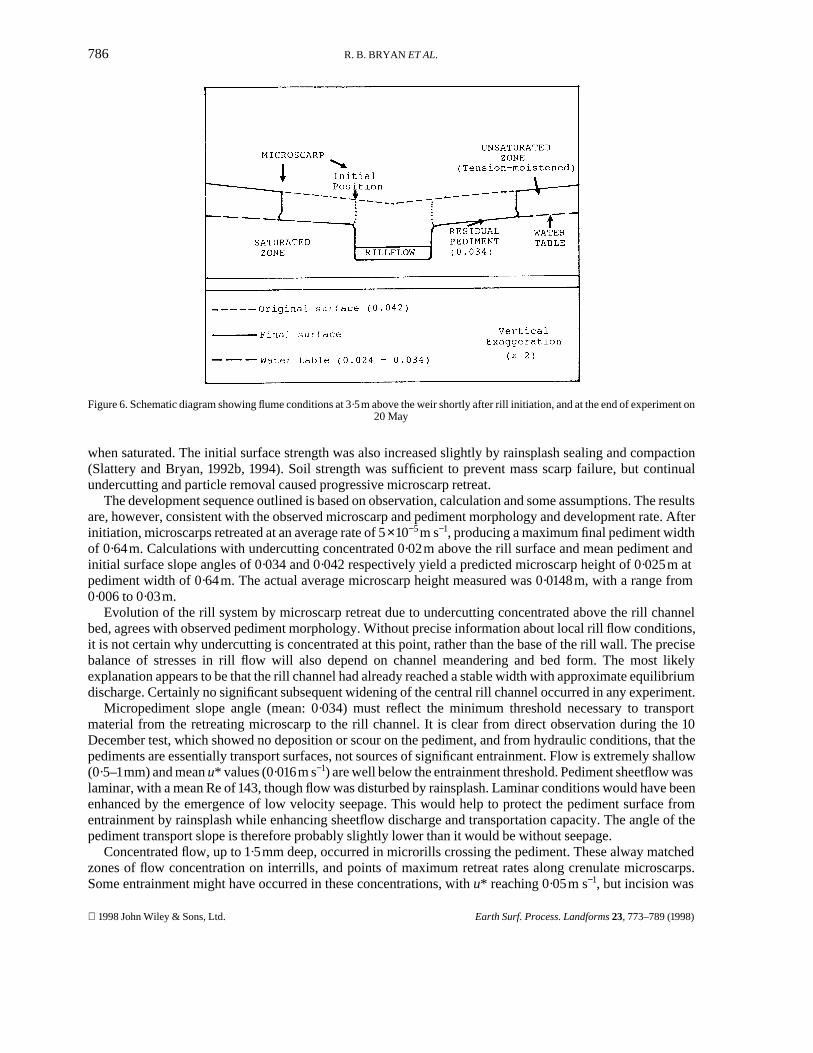
To isolate the processes involved in microscarp and pediment development, it is necessary to considerpotential seepage forces along central rill banks. Iverson and Major (1986), Kochel et al. (1985), Howard andMcLane (1988) and Dunne (1990) provide good theoretical discussions of the components involved. Theprecise time of initiation varied along the central rill, but was clearly apparent at 3·5m above the weir after 45–50 min. The basic morphology and dimensions of the rill–pediment–microscarp transition at this time andlocation are shown in Figure 6. Water table slope is critical in determination of flow lines and seepage forces.This could not be determined with available instruments, but at 45–50 min must have been very close to zero.Calculations from infiltration rate, saturated hydraulic conductivity (k) and porosity indicate a water table slopeof approximately 0·024 after 120 min. The relatively high k value of 2·2×10−4 m s−1 would have produced somedrainage near the rill wall apex, but the precise point of water table intersection on the rill wall is uncertain.Observations from other experiments suggest that it was about 0·02m above the rill water level, as shown inFigure 6.
The seepage velocities based on measured k and the calculated final hydraulic gradient (0·024) are around5·3×10−5 m s−1. Such velocities are too small to cause sapping and particle ejection. Even marked increase inwater table slope close to the rill wall would not greatly increase seepage velocities or pressures. Positive porepressures and reduced shear strength would, however, increase the effective erosivity of interrill flow, causinglocalized undercutting. The resulting undercut vertical 0·02m high microscarp is below the critical height, even
1998 John Wiley & Sons, Ltd. Earth Surf. Process. Landforms 23, 773–789 (1998)
786 R. B. BRYAN ET AL.
Figure 6. Schematic diagram showing flume conditions at 3·5m above the weir shortly after rill initiation, and at the end of experiment on20 May
when saturated. The initial surface strength was also increased slightly by rainsplash sealing and compaction(Slattery and Bryan, 1992b, 1994). Soil strength was sufficient to prevent mass scarp failure, but continualundercutting and particle removal caused progressive microscarp retreat.
The development sequence outlined is based on observation, calculation and some assumptions. The resultsare, however, consistent with the observed microscarp and pediment morphology and development rate. Afterinitiation, microscarps retreated at an average rate of 5×10⁻⁵ m s−1, producing a maximum final pediment widthof 0·64m. Calculations with undercutting concentrated 0·02m above the rill surface and mean pediment andinitial surface slope angles of 0·034 and 0·042 respectively yield a predicted microscarp height of 0·025m atpediment width of 0·64m. The actual average microscarp height measured was 0·0148m, with a range from0·006 to 0·03m.
Evolution of the rill system by microscarp retreat due to undercutting concentrated above the rill channelbed, agrees with observed pediment morphology. Without precise information about local rill flow conditions,it is not certain why undercutting is concentrated at this point, rather than the base of the rill wall. The precisebalance of stresses in rill flow will also depend on channel meandering and bed form. The most likelyexplanation appears to be that the rill channel had already reached a stable width with approximate equilibriumdischarge. Certainly no significant subsequent widening of the central rill channel occurred in any experiment.
Micropediment slope angle (mean: 0·034) must reflect the minimum threshold necessary to transportmaterial from the retreating microscarp to the rill channel. It is clear from direct observation during the 10December test, which showed no deposition or scour on the pediment, and from hydraulic conditions, that thepediments are essentially transport surfaces, not sources of significant entrainment. Flow is extremely shallow(0·5–1mm) and mean u* values (0·016m s−1) are well below the entrainment threshold. Pediment sheetflow waslaminar, with a mean Re of 143, though flow was disturbed by rainsplash. Laminar conditions would have beenenhanced by the emergence of low velocity seepage. This would help to protect the pediment surface fromentrainment by rainsplash while enhancing sheetflow discharge and transportation capacity. The angle of thepediment transport slope is therefore probably slightly lower than it would be without seepage.
Concentrated flow, up to 1·5mm deep, occurred in microrills crossing the pediment. These alway matchedzones of flow concentration on interrills, and points of maximum retreat rates along crenulate microscarps.Some entrainment might have occurred in these concentrations, with u* reaching 0·05m s−1, but incision was
1998 John Wiley & Sons, Ltd. Earth Surf. Process. Landforms 23, 773–789 (1998)

787RILL DEVELOPMENT
hardly measurable, and not sufficient to cause significant subsurface flow diversion on the saturated pediment.Differential microscarp retreat concentrated at microrills would, however, have progressively deflectedflowlines. This was particularly notable after the 7 December test, where portions of the original interrill surfacewere isolated by intersection of adjacent microrill headcuts (Figure 5).
Analysis of experimental results indicates that surface flow concentration is the dominant factor determiningrill initiation and location. The precise form and evolution of the rill system is, however, strongly influenced bysoil moisture patterns. Data are not sufficiently precise to eliminate the possibility of localized sapping, but theydo indicate that the most important effect of soil saturation in these experiments was significant reduction in soilshear strength and the threshold flow shear stress necessary for particle entrainment. The conspicuousmicroscarp and pediment morphology developed in initial experiments resulted from differences in strengthbetween the saturated lower layers and the undersaturated surface. This indicates that the actual final water tableslope in initial experiments was probably closer to the mean pediment angle of 0·034, than the calculated valueof 0·024. Increase in surface strength due to rainsplash sealing and compaction does not appear to havesignificantly increased microscarp stability; on 2 June and 10 December, when the water table reached interrillsurfaces, microscarps were virtually eliminated.
CONCLUSIONS
Despite small variations in some experimental conditions, the pattern of rill evolution was essentially similar inthe three initial experiments. In each case rills initiated by local scour in the central depression, but a fullyintegrated rill system did not appear until much of the flume area approached saturation. At this stagemicroscarps developed along the central trunk rill walls. These retreated progressively into interrill surfaces,leaving residual low-angle pediments. Microscarp initiation coincided with rapid increase in sedimentdischarge, and the increasing scarp perimeter length was closely correlated with weir sediment yield.Microscarps were markedly crenulate with maximum retreat rates at points where microrill discharge frominitial interrill surfaces concentrated scarp erosion.
Initial scour and rill incision in the central depression was associated with hydraulic values above commonlyidentified thresholds and clearly preceded soil saturation. Similar hydraulic values were only very sporadicallyreached elsewhere on the flume. Tributary microrill incision, and microscarp and pediment development wereall closely linked to high soil moisture levels, and water table evolution. Some sapping influence on microscarpinitiation cannot be categorically ruled out, but small hydraulic gradients and measured saturated hydraulicconductivities indicate that seepage forces were minimal. The dominant impact of saturation was to reduce soilshear strength to near zero, permitting significant entrainment by runoff well below normal thresholds. Verticalmicroscarps survived because of the slightly higher strength of the uppermost unsaturated soil layer.Microscarp retreat involved undercutting of this layer along the water table and transport across the residualpediment to the central rill. The pediment is interpreted as essentially a transport slope, where entrainment islimited and transportation enhanced by emerging low velocity laminar seepage.
Virtually all the morphologic features of the evolving rill system were strongly influenced by both surfaceand subsurface processes, reflecting local soil moisture conditions. None of the morphometric indicesmeasured could be linked solely to either category of process with any confidence. We conclude, therefore, thatrill morphology is not a reliable indicator of the dominance of surface or subsurface erosion. Although the testsinvolved extreme rainfall, all other conditions occur frequently on agricultural fields, and are by no meansuncommon on natural hillslopes. The evolution of a shallow water table, as observed in these experiments,perched on a plough pan, soil horizon or rock surface of low permeability, must be frequent, particularly duringwet winters. While rill incision solely controlled by surface erosion, or by subsurface erosion (as in the case ofmicropiped smectite clays in badlands), is incontrovertible, the intimate interaction of both sets of processes, asobserved in these experiments, is probably much more common.
ACKNOWLEDGEMENTS
The research project described was supported by an operating grant from the Natural Sciences and EngineeringResearch Council to R. B. Bryan. The experiments involved assistance from many people, particularly
1998 John Wiley & Sons, Ltd. Earth Surf. Process. Landforms 23, 773–789 (1998)
788 R. B. BRYAN ET AL.
Annemieke Farenhorst, George Yap, Mark Crow, Joshua Ramisch, Tim Van Seters, Carolyn Switzer andNicole Marshall. All are gratefully acknowledged. The contribution of Bill Nicholson and Dan Doolan of theScarborough Campus Engineering Workshops, who designed and built the flume, is also gratefullyacknowledged.
REFERENCES
Baker, V. R. 1990. ‘Spring sapping and valley network development with case studies by Kochel, R. C., Baker, V. R., Laity, J. E. andHoward, A. D’, in Higgins, C. G. and Coates, D. R. (Eds), Groundwater Geomorphology; The Role of Subsurface Water in EarthSurface Processes and Landforms, Boulder, Colorado, Geological Society of America, Special Paper, 252, 235–265.
Bryan, R. B. 1987. ‘Processes and significance of rill development’, in Bryan, R. B. (Ed.), Rill Erosion: Processes and Significance,Catena Supplement, 8, 1–15.
Bryan, R. B. 1990. ‘Knickpoint evolution in rillwash’, in Bryan, R. B. (Ed.), Soil Erosion: Experiments and Models, Catena Supplement,17, 111–132.
Bryan, R. B. and Oostwoud Wijdenes, D. J. 1992. ‘Field and laboratory experiments on the evolution of microsteps and scour channels onlow angle-slopes’, in Schmidt, K-H. and DePloey, J. (Eds), Functional Geomorphology, Catena Supplement, 23, 1–29.
Bryan, R. B. and Poesen, J. W. A. 1989. ‘Laboratory experiments on the influence of slope length on runoff, percolation and rilldevelopment’, Earth Surface Processes and Landforms, 14, 211–231.
Bryan, R. B., Yair, A. and Hodges, W. K. 1978. ‘Factors controlling the initiation of runoff and piping in Dinosaur Provincial Parkbadlands, Alberta’, Zeitschrift fur Geomorphologie Supplement, 29, 151–168.
Chorley, R. J., Malm, D. E. G. and Pogorzelski, H. A. 1957. ‘A new standard for estimating basin shape’, American Journal of Science,255. 138–141.
De Ploey, J. 1989. ‘A model for headcut retreat in gullies’, in Yair, A. and Berkowitz, S. (Eds), Arid and Semi-arid Environments, CatenaSupplement, 14, 81–86.
Dunne, T. 1980. ‘Formation and controls of channel networks’, Progress in Physical Geography, 4, 211–239.Dunne, T. 1990. ‘Hydrology, mechanics and geomorphic implications of erosion by subsurface low’, in Higgins, C. G. and Coates, D. R.
(Eds), Groundwater Geomorphology: The Role of Subsurface Water in Earth Surface Processes and Landforms, Boulder, Colorado,Geological Society of America, Special Paper, 252, 1–28.
Gerits, J., Imeson, A. C., Verstraten, J. M. and Bryan, R. B. 1987. ‘Rill development and badland regolith properties’, in Bryan, R. B.(Ed.), Rill Erosion: Processes and Significance, Catena Supplement, 8, 141–160.
Gomez, B. and Mullen, V. T. 1992. ‘An experimental study of sapped drainage network development’, Earth Surface Processes andLandforms, 17, 465–476.
Govers, G. 1985. ‘Selectivity and transport capacity of thin flows in relation to rill erosion’, Catena, 12, 35–49.Govers, G. and Rauws, G. 1986. ‘Transporting capacity of overland flow on plane and on irregular beds’, Earth Surface Processes and
Landforms, 11, 515–524.Govers, G., Everaert, W., Poesen, J., Rauws, G., DePloey, J. and Lautridou, J. 1990. ‘A long flume study of the dynamic factors affecting
the resistance of loamy soil to concentrated flow erosion’, Earth Surface processes and Landforms, 15, 313–328.Hawke, R. M. 1997. The energetics and dynamics of surface sealing: a laboratory investigation, Unpublished PhD thesis, University of
Toronto, 232 pp.Higgins, C. G. 1974. ‘Model drainage networks developed by groundwater sapping’, Geological Society of America, Abstracts with
Program, 6(7), 794–795.Higgins, C. G. 1982. ‘Drainage systems developed by sapping on Earth and Mars’, Geology, 10, 147–152.Higgins, C. G. 1990. Seepage-induced Cliff Recession and Regional Denudation, Geological Society of America, Special Paper, 252,
291–317.Hinds, N. E. A. 1925. ‘Amphitheatre valley heads’, Journal of Geology, 33, 816–818.Hodges, W. K. 1982. ‘Hydraulic characteristics of a badland pseudo-pediment slope system during simulated rainfall experiments’, in
Bryan, R. B. and Yair, A. (Eds), Badland Geomorphology and Piping, Geo Abstracts, Norwich, 127–152.Horton, R. E. 1932. ‘Drainage basin characteristics’, Transactions of the American Geophysical Union, 13, 350–361.Horton, R. E. 1945. ‘Erosional development of streams and their drainage basins: hydrophysical approach to quantitative morphology’,
Geological Society of America Bulletin, 56, 275–370.Howard, A. D. and McLane, C. F. 1988. ‘Erosion of cohesionless sediment by groundwater sapping’, Water Resources Research, 24,
1659–1674.Iverson, R. M. and Major, J. J. 1986. ‘Groundwater seepage vectors and the potential for hillslope failure and debris flow mobilization’,
Water Resources Research, 22(11), 1543–1548.Kochel, R. C. and Piper, J. F. 1986. ‘Morphology of large valleys on Hawaii, evidence for groundwater sapping and comparisons with
Martian valleys’, Journal of Geophysical Research, 91, E175–E192.Kochel, R. C., Howard, A. D. and McLane, C. 1985. ‘Channels developed by groundwater sapping in fine-grained sediments: analogs to
some Martian valleys, in Woldenberg, M. W. (Ed.), Models in Geomorphology, Allen & Unwin, Boston, 313–341.Laity, J. E. 1983. ‘Diagenetic controls on groundwater sapping and valley formation’, Physical Geography, 4, 103–125.Laity, J. E. and Malin, M. C. 1985. ‘Sapping processes and the development of theatre-headed valley networks on the Colorado Plateau’,
Geological Society of America Bulletin, 96, 203–217.Loch, R. and Donnollan, 1983. ‘Field simulator studies on two clay soils of Darling Downs, Queensland. I. The effect of plot length and
tillage orientation on erosion processes and runoff and erosion rates’, Australian Journal of Soil Research, 21, 33–46.Merritt, E. 1984. ‘The identification of four stages during microrill development’, Earth Surface Processes and Landforms, 9, 493–496.Merz, W. and Bryan, R. B. 1993. ‘Critical conditions for rill initiation on sandy-loam Brunisols: laboratory and field experiments in
southern Ontario, Canada’, Geoderma, 57, 357–385.
1998 John Wiley & Sons, Ltd. Earth Surf. Process. Landforms 23, 773–789 (1998)

789RILL DEVELOPMENT
Miller, V. C. 1953. A quantitative geomorphic study of drainage basin characteristics in the Clinch mountain area: Va. and Tenn. OfficeNaval Research Project, NR 389–042, Technical Report, 3, Columbia University.
Nash, D. J. 1996. ‘Groundwater sapping and valley development in the Hackness Hills, North Yorkshire, England’, Earth SurfaceProcesses and Landforms, 21, 781–795.
Onda, Y. 1994. ‘Seepage erosion and its implication to the formation of amphitheatre valley heads: a case study at Obara, Japan’, EarthSurface Processes and Landforms, 19, 627–640.
Rauws, G. 1987. ‘The initiation of rills on plane beds of non-cohesive sediments’, in Bryan, R. B. (Ed.), Rill Erosion: Processes andSignificance, Catena Supplement, 8, 107–118.
Rauws, G. and Govers, G. 1988. ‘Hydraulic and soil mechanical aspects of rill generation on agricultural soils’, Journal of Soil Science,39, 111–124.
Rockwell, D. L. 1995. Effects of groundwater development on surface flow erosion during simulated rainstorms in a laboratory flume,Unpublished PhD thesis, University of Toronto, 278 pp.
Rose, C. W. 1985. ‘Developments in soil erosion and deposition models’, in Stewart, B. A. (Ed.), Advances in Soil Science, 2, SpringerVerlag, Berlin, 1–64.
Rose, C. W., Hairsine, P. B., Proffitt, A. B. and Misra, R. K. 1990. ‘Interpreting the role of soil strength in erosion processes’, in Bryan, R.B. (Ed.), Soil Erosion: Experiments and Models, Catena Supplement, 17, 153–165.
Sakuro, Y., Mochizuki, M. and Kawasaki, I. 1987. ‘Experimental studies on valley headward erosion due to groundwater flow’,Geophysical Bulletin of Hokkaido University (Sapporo, Japan), 49, 229–239.
Savat, J. 1976. ‘Discharge velocities and total erosion of a calcareous loess: a comparison between pluvial and terminal runoff’, Revue deGeomorphologie Dynamique, 24, 113–122.
Schumm, S. A. 1956. ‘Evolution of drainage systems and slopes in badlands at Perth Amboy, New Jersey’, Bulletin of the GeologicalSociety of America, 67, 597–646.
Slattery, M. C. and Bryan, R. B. 1992a. ‘Hydraulic conditions for rill incision under simulated rainfall: a laboratory experiment’, EarthSurface Processes and Landforms, 17, 127–146.
Slattery, M. C. and Bryan, R. B. 1992b. ‘Laboratory experiments on surface seal development and its effect on interrill erosion processes’,Journal of Soil Science, 43, 517–529.
Slattery, M. C. and Bryan, R. B. 1994. ‘Surface seal development under simulated rainfall on an actively eroding surface’, Catena, 22, 17–34.
Terzaghi, K. 1943. Theoretical Soil Mechanics, John Wiley, New York, 510 pp.Torri, D., Sfalanga, M. and Chisci, G. 1987. ‘Threshold conditions for incipient rilling’, in Bryan, R. B. (Ed.), Rill Erosion: Processes and
Significance, Catena Supplement, 8, 97–106.Uchupi, E. and Oldale, R. N. 1994. ‘Spring sapping origin of the enigmatic relict valleys of Cape Cod and Martha’s Vineyard and
Nantucket Islands, Massachusetts’, Geomorphology, 9, 83–95.
1998 John Wiley & Sons, Ltd. Earth Surf. Process. Landforms 23, 773–789 (1998)