the influence of shielded metal arc welding (smaw) inter...
TRANSCRIPT

- 1 -
The Influence of Shielded Metal Arc Welding (SMAW) Inter-pass Temperature on the Ferrite Number of Weld
Joints made on AISI 304H Stainless Steel
MSc(50/50) Research Project
Prepared by
Ntsikelelo Ngonyoza (552436)
Submitted to
School of Chemical and Metallurgical Engineering, Faculty of Engineering and the
Built Environment, University of the Witwatersrand, Johannesburg, South Africa
Supervisor(s): Dr. Josias van der Merwe
October 2014

- 2 -
DEDICATION
I would like to thank my Lord and Saviour Jesus Christ for his guidance and providence.
Thank you to my lovely wife, Maxine, for her support and love. To my mom for her
sacrifices and nagging me about when I’m graduating, thank you.
- 3 -
ACKKOWLEDGEMENTS
The author would like to acknowledge:
• Ms Marion van den Hoogen, Materials and Corrosion Engineering Lead at
SAPREF Refinery, for her patience.
• Dr. Josias van der Merwe, the author’s supervisor, for his guidance and patience.
• Dr. Nicolas Dowling for his contribution towards my professional and career
development.
• Mr Jay Padayachee and the SAPREF Refinery Inspection Department for
financial support to conduct this investigation.
• Mr Mohamed Cader from Avenger-LTA for providing the welding resources
needed to conduct the research.
• Ms Leanne Matyhyssen from MegChem (Pty) Ltd for chemical etching the
specimens with Villela’s reagent and Oxalic acid.

- 4 -
ABSTRACT
The research focused on the influence of welding inter-pass temperature in 304H type
austenitic stainless steel weld joints in the as-welded condition. The shielded metal arc
welding process was used to weld the joints. The following was evaluated: the
theoretical and measured ferrite numbers, solidification mode and delta ferrite
morphology, as well as the evolution and precipitation of secondary phases i.e. sigma
phase in the weld, chromium carbides in the heat affected zone. After the evaluation, it
was clear that the inter-pass temperature had an effect on solute distribution during
cooling and subsequent calculated ferrite numbers of the welds. The calculated ferrite
numbers, that were determined using the weld metal chemistry of each joint and the
WRC-1992 constitution diagram, increased from FN of 1 to FN of 3 with the increase in
welding inter-pass temperature from 105°C-100°C and to 195°C-200°C respectively.
The measured ferrite number showed no correlation with the increases in interpass
temperature. The highest measured ferrite number of 3.8 was obtained when welding at
an inter-pass temperature of 135°C – 140°C which was closest to the FN of 5 required
minimum, as specified by the SAPREF Refinery, to prevent solidification cracking. No
solidification cracking was observed in any of the specimens evaluated in this study
even though all the specimens had ferrite contents well below FN 5. This observation
supports research that indicates that controlling of the primary solidification mode as
delta ferrite is more important a factor in preventing solidification cracking than trying to
control the actual ferrite content of the weld metal. The primary solidification mode of
the weld was a combination of the austenite-ferrite (AF) to predominantly ferrite-
austenite (FA) with the FA solidification mode dominating with the increase in inter-pass
temperature. The nature of the carbides formed due to low temperature sensitization in
the heat affected zone of the base metal changed with the increase in inter-pass
temperature. The precipitated chromium carbides only formed discontinuous carbide
networks at the interpass temperature of 195°C-200°C. The transformation of sigma
from delta ferrite was not observed in the columnar dendritic and mushy zones of the
weld metal. This research revealed the optimum welding inter-pass temperature for
welding 304H austenitic stainless steel with 308H electrode to be 135-140°C.

- 5 -
TABLE OF CONTENTS
CONTENT PAGE
I. CHAPTER ONE - INTRODUCTION 17
1.1 Background 17
1.2 Research objectives 18
II. CHAPTER TWO - LITERATURE REVIEW 19
2.1 Metallurgy of stainless steels 19
2.1.1 Solidification of stainless steel 21
2.2 Austenitic stainless steel microstructure 24
2.3 hot and cold working of austenitic stainless steels 27
2.3.1 Hot working of austenitic stainless steels 27
2.3.2 Cold working of austenitic stainless steels 29
2.4 Delta ferrite 30
2.4.1 Importance of delta ferrite in austenitic stainless steels 30
2.4.2 Influence of delta ferrite on performance of austenitic stainless steels
in high temperature service 31
2.4.3 Effect of alloying elements on delta ferrite formation 34
2.5 Difference between 304, 304L and 304H austenitic stainless 35
- 6 -
2.5.1 Type 304, 304L and 304H chemical compositions and the significance
of alloying elements 35
2.5.2 Differences in mechanical properties 38
2.6 Shielded metal arc welding (SMAW) process 41
2.7 Importance of inter-pass temperature 43
2.8 Post solidification phase transformation – The effect of solidification mode on the delta ferrite microstructure in austenitic stainless steel 43 2.9 Effect of constitutional supercooling on the weld metal austenitic matrix microstructure 47
2.10 Sigma phase transformations 51
2.10.1 Factors that influence the delta ferrite-sigma phase transformation in
weld metals 51
2.10.1.1 Compositional conditions 52
2.10.1.2 Structural conditions 52
2.11 Methods and difficulties in the measurement of delta ferrite 53
2.11.1 Metallographic evaluation 54
2.11.2 X-ray diffraction 54
2.11.3 Magnetic permeability measurements 54
2.11.4 Magnetic determination 55
2.11.5 Calculation of ferrite from chemistry 60

- 7 -
2.12 Control of ferrite content/ferrite number 60
2.12.1 Heat input 60
2.12.2 Cooling rate 61
2.12.3 Welding process 62
2.12.4 Welding consumable considerations 63
2.13 Sensitization of austenitic stainless steels 63
2.13.1 Sensitization theory 63
2.13.2 Low temperature HAZ sensitization (LTS) behavior 66
2.14 Etching of austenitic stainless steels 67
2.14.1 Electrolytic etching 67
2.14.2 Chemical etching 70
III. CHAPTER THREE - EXPERIMENTAL PROCEDURE 72
3.1 Materials used 72
3.2 Equipment used 74
3.3 Procedure 75
3.3.1 Joint preparation and welding 75
3.3.2 Ferrite measurement 76
3.3.3 Specimen extraction and sectioning 78
3.3.4 Specimen mounting 79

- 8 -
3.3.5 Specimen grinding and polishing 79
3.3.6 Specimen etching 81
3.3.7 Microscopy 81
IV. CHAPTER FOUR - RESULTS 82
4.1 Ferrite numbers 82
4.2 Metallurgical feature evaluation 87
4.2.1 Solidification phases 87
4.2.2 Presence of carbides in the heat affected zone 89
4.2.3 Evaluation for sigma phase transformation in the weld metal 93
4.2.4 Evaluation for sigma phase transformation in the weld metal 95
V. CHAPTER FIVE - DISCUSSION 99
5.1 Ferrite numbers 99
5.2 Metallurgical feature evaluation 100
5.2.1 Solidification phases 100
5.2.2 Delta ferrite morphology 101
5.2.3 Sigma phase transformation in the weld metal 102
5.2.4 Low temperature sensitization of the heat affected zone (HAZ) 103
VI. CHAPTER SIX – CONLCUSION 104
VII. CHAPTER SEVEN – FUTURE WORK OPPORTUNITIES 105

- 9 -
VIII. REFERENCES 106
- 10 -
LIST OF TABLES
Table Page
Table 1: Chemical compositions in wt% of some typical austenitic
stainless steels 23
Table 2: Crystal structures and compositions of phases that may occur
in stainless steels 24
Table 3: Solubility of sulphur and phosphorus in ferrite and austenite
in wt % 31
Table 4: Creep-Rupture Properties of CF8 Castings 32
Table 5: Chemistry of 304, 304L and 304H austenitic stainless steel 38
Table 6: Mechanical properties of types 304, 304L and 304H austenitic
stainless steel at 20 or 21°C 39
Table 7: : Maximum allowable stress values for types 304, 304L and
304H austenitic stainless steel for temperature range 65-825°C 39
Table 8: Effect of interpass temperature on the mechanical properties 43
Table 9 Electrolytic etchants for etching sigma phase, carbides and
delta ferrite 70
Table 10: Chemical etchants for etching sigma phase, carbides and
delta ferrite 71

- 11 -
Table 11: Chemical composition of the 304H austenitic stainless
steel samples 72
Table 12: Chemical composition of the 308H welding electrode 73
Table 13: Welding variables used for welding the pipe samples 76
Table 14: Specimen preparation grinding and polishing steps and times 80
Table 15: Ferritescope ferrite content measurement readings for sample
A to D welded at various inter-pass temperatures 83
Table 16: Chemical compositions of the weld metals of specimens
A to D 85
Table 17: The calculated chromium-nickel-equivalents and WRC-1992
ferrite numbers of the weld metals of specimens A to D 85
Table 18: Weight % of different elements for EDS spectrum 1. 91
Table 19: Weight % of different elements for EDS spectrum 1 on the
matrix of specimen C 92
Table 20: Comparison between ferritescope measured and the
WRC-1992 predicted ferrite numbers 99

- 12 -
LIST OF FIGURES
Figure Page
Figure 1: The influence of chromium on the atmospheric corrosion of
low-carbon steel 19
Figure 2: Fe-Cr binary phase diagram 20
Figure 3: A section of the -Fe-Cr-Ni ternary equilibrium diagram at 650° 20
Figure 4: Vertical section of Fe-Cr-Ni phase diagram showing the
variation of solidification mode with composition for a constant Fe
content of 70% 21
Figure 5: Compositional and property linkages in the stainless
steel family of alloys 23
Figure 6: Main transformations that occur in austenitic stainless steel
between room temperature and the liquid state 25
Figure 7: Type 304 base metal and heat affected zone taken at X250
Magnification 26
Figure 8: The heat affected zone, fusion line and 308 filler weld metal
of the fabrication taken at X250 Magnification 26
Figure 9: Effect of alloying elements on hot ductility of AISI 304L
austenitic stainless steel 28
Figure 10: Stress rupture curves for E308 weld metal and CF8 castings

- 13 -
at 593° C with different ferrite levels 33
Figure 11: Influence of the chemical composition, especially the
Cr content, on the oxidation resistance of steels 36
Figure 12: Stress rupture curves for ASTM 312 Type 304 and 304H 40
Figure 13: Shielded Metal Arc Welding Process 42
Figure 14: Solidification and post solidification transformation in
Fe-Cr-Ni welds (a) interdendritic ferrite, (b) vermicular ferrite and
(c) lathy ferrite (d) a schematic vertical or isoplethal section of
the Fe-Cr-Ni ternary phase diagram at 70 wt% Fe and above 1200°C 44
Figure 15: Solidification and transformation modes and resultant
ferrite morphologies 47
Figure 16: The effect of constitutional super-cooling on solidification
mode on the (a) planar, (b) cellular, (c) columnar dendritic and
(d) equiaxed dendritic grains 0f the weld metal 48
Figure 17: The effect of constitutional supercooling on solidification
mode during welding resulting in (a) planar, (b) cellular, (c) columnar
dendriticand (d) equiaxed dendritic grains 50
Figure 18: Microstructures depicting the effect of constitutional supercooling
on solidification mode during welding planar resulting in (a) planar,
(b) cellular, (c) columnar dendritic and (d) equiaxed dendritic grains 50
Figure 19: The variations in solidification mode in a single weld across
the fusion zone 50
- 14 -
Figure 20: Microstructure showing the variations in solidification mode in
a single weld across the fusion zone 50
Figure 21: Sigma phase precipitation in an austenitic stainless steel
containing delta ferrite 53
Figure 22: Schaeffler constitution diagram for stainless steel weld metal 56
Figure 23: DeLong constitution diagram for stainless steel weld metal,
the Schaeffler austenite-martensite boundary is included for reference 57
Figure 24: WRC-1992 constitution diagram 60
Figure 25: Grain boundary structure of sensitized steel 64
Figure 26: Time-temperature-precipitation (TTP) for 304 type stainless steel 65
Figure 27: Time-temperature-sensitization (TTS) carbide precipitation curves
for type 304 stainless steel 65
Figure 28: Basic laboratory setup for electrolytic etching and polishing 68
Figure 29: Idealized current density versus applied voltage for many
common electrolytes with regions for electrolytic etching and polishing
as indicated 69
Figure 30: Carbon compositional limits of ASTM A240/240M Type 304,
304L and 304H austenitic stainless steel 73
Figure 31: Welded pipe samples after sections were cut out 76
- 15 -
Figure 32: Top view of the weld bead on the welded samples with the
centre line of weld bead marked as location A 77
Figure 33: Welded pipe samples with sections that were cut out for
mounting and sample preparation 78
Figure 34: Graphical representation of ferrite content measurement
readings from table 10. 84
Figure 35: Graphical comparison of the average ferrite content
measurement readings from table 14. 84
Figure 36: Graphical comparison of the Creq/Nieq ratio from table 16 85
Figure 37: Graphical comparison of the WRC-1992 ferrite numbers (FN)
from table 16 86
Figure 38: Ferrite numbers plotted on WRC-1992 calculated using
the weld metal chemistry of specimens A, B, C and D 86
Figure 39: Weld metal microstructure of specimens A to D at X200
magnification after chemical etching with Villela’s reagent 88
Figure 40: Schematic of weld joint showing (1) base metal, (2),
heat affected zone-HAZ, (3) fusion line, (4) columnar dendritic zone
and (5) mushy zone. 89
Figure 41: Microstructures of the (a) base metal, (b) heat affected
zone and (c) fusion line for specimen A at X200 magnification after

- 16 -
etching with oxalic acid. 89
Figure 42: Microstructures of the heat affected zone for
specimen C at X10000 magnification after etching with oxalic acid 90
Figure 43: Microstructures of the heat affected zone for specimen
C at X10000 magnification after etching with oxalic acid 90
Figure 44: location of EDS analysis. 91
Figure 45: Graph of Spectrum 1 EDS analysis. 92
Figure 46: SEM image with location of EDS analysis (spectrum 2) on the
matrix of specimen C. 92
Figure 47: Graph of Spectrum 2 EDS analysis of the matrix of specimen C. 93
Figure 48: Microstructures of the columnar dendritic zone for specimen
A welded at 105-110°C inter-pass temperature at (a) X500 and (b) X1000
after etching with oxalic acid. 93
Figure 49: Microstructures of the columnar dendritic zone for specimen B
welded at 135-140°C inter-pass temperature at (a) X500 and (b) X1000
after etching with oxalic acid. 94
Figure 50: Microstructures of the columnar dendritic zone for specimen C
welded at 165-170°C inter-pass temperature at (a) X500 and (b) X1000 after
etching with oxalic acid. 94
Figure 51: Microstructures of the columnar dendritic zone for specimen D
welded at 195-200°C inter-pass temperature at (a) X500 and (b) X1000

- 17 -
after etching with oxalic acid. 95
Figure 52: Location of the mushy zone in the weld metal of specimen A to D 95
Figure 53: Micrographs of the microstructures of specimens A to D
at X1000 magnification after electrolytic etching with NaOH 96
Figure 54: Stereographs of the weld after Groesbeck etchant at X6.7
Magnification 97
Figure 55: HAZ microstructure of the 304H austenitic steel base
metal at X1000 magnification after chemical etching with Groesbeck 98
- 18 -
LIST OF EQUATIONS
Equation Page
Equation 1: Chromium equivalent (Creq ) 22
Equation 2: Nickel equivalent (Nieq) 22
Equation 3: G/R ratio equation 49
Equation 4: Proportionality function 61
- 19 -
I. CHAPTER ONE - INTRODUCTION
1.1 Background
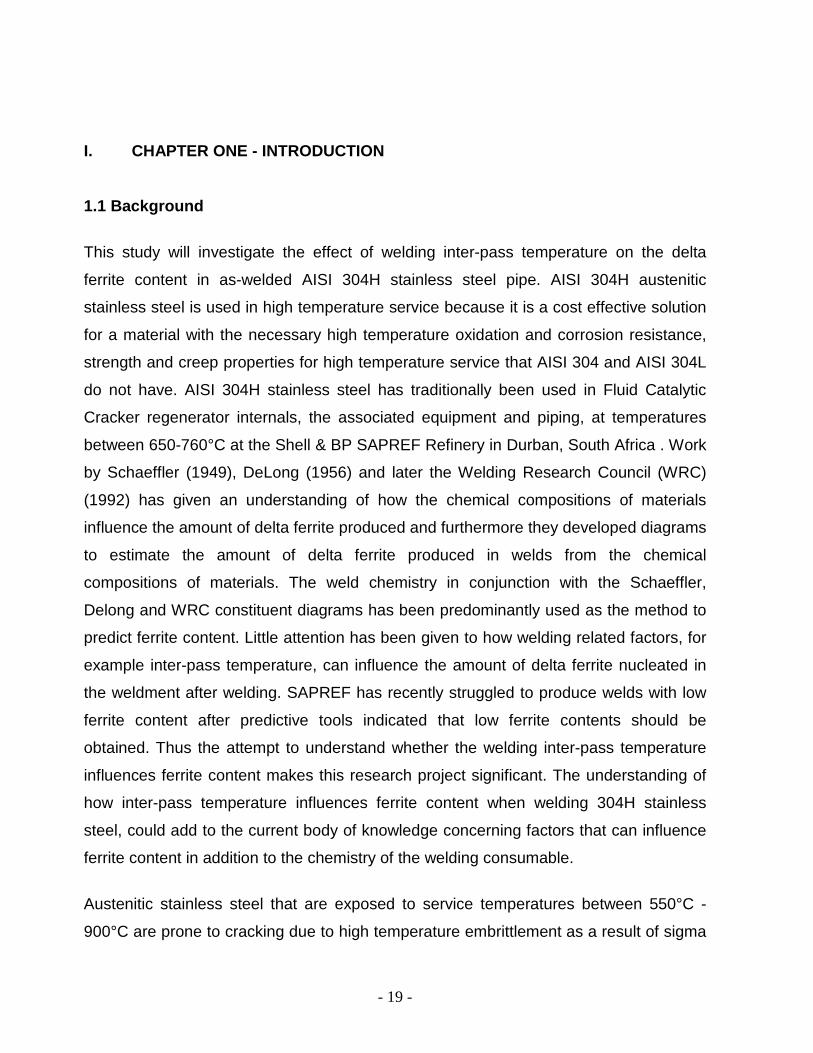
This study will investigate the effect of welding inter-pass temperature on the delta
ferrite content in as-welded AISI 304H stainless steel pipe. AISI 304H austenitic
stainless steel is used in high temperature service because it is a cost effective solution
for a material with the necessary high temperature oxidation and corrosion resistance,
strength and creep properties for high temperature service that AISI 304 and AISI 304L
do not have. AISI 304H stainless steel has traditionally been used in Fluid Catalytic
Cracker regenerator internals, the associated equipment and piping, at temperatures
between 650-760°C at the Shell & BP SAPREF Refinery in Durban, South Africa . Work
by Schaeffler (1949), DeLong (1956) and later the Welding Research Council (WRC)
(1992) has given an understanding of how the chemical compositions of materials
influence the amount of delta ferrite produced and furthermore they developed diagrams
to estimate the amount of delta ferrite produced in welds from the chemical
compositions of materials. The weld chemistry in conjunction with the Schaeffler,
Delong and WRC constituent diagrams has been predominantly used as the method to
predict ferrite content. Little attention has been given to how welding related factors, for
example inter-pass temperature, can influence the amount of delta ferrite nucleated in
the weldment after welding. SAPREF has recently struggled to produce welds with low
ferrite content after predictive tools indicated that low ferrite contents should be
obtained. Thus the attempt to understand whether the welding inter-pass temperature
influences ferrite content makes this research project significant. The understanding of
how inter-pass temperature influences ferrite content when welding 304H stainless
steel, could add to the current body of knowledge concerning factors that can influence
ferrite content in addition to the chemistry of the welding consumable.
Austenitic stainless steel that are exposed to service temperatures between 550°C -
900°C are prone to cracking due to high temperature embrittlement as a result of sigma
- 20 -
phase formation and sensitization(Castro & de Cadanet, 1975). They further explained
that the brittle sigma phase is formed when delta ferrite in stainless steel welds
transform to sigma phase when exposed to high temperature service. Due to the brittle
nature of sigmatized welds, repairing of sigmatized welds can only be done by removing
the entire weld and re-welding the complete joint. SAPREF has in the past attempted to
repair these cracked welds without complete removal. This proved to be a challenge
because these sigmatized welds were so brittle that the cracks in the weld bead
propagated into the heat affected zone (HAZ) of the base metal. The weld thus has to
be completely removed and re-welded. This research project attempts to investigate
the role the welding inter-pass temperature could play in the amount of delta ferrite
produced because this delta ferrite will eventually transform to the chi, laves and brittle
sigma phases during exposure to high temperature service.
1.2 Research objectives
• To investigate the effect of inter-pass temperature on the delta ferrite content
of AISI 304H stainless steel weldments when using the shielded metal arc
welding process (SMAW)
• To determine the optimum inter-pass temperature and welding variables to be
used during the repair welding of AISI 304H stainless steel joints at the
SAPREF refinery to produce low ferrite number welds, between FN 5 and FN
8, in order to prevent solidification cracking during welding and consequently
excessive sigmatization at service temperatures respectively.
• To evaluate the effect of inter-pass temperature on the solidification
microstructures of the welded joints and secondary phases i.e. sigma phase
and sensitization (M23C6 carbides), that may have formed during welding and
subsequent cooling will be evaluated.
- 21 -
II. CHAPTER TWO - LITERATURE REVIEW
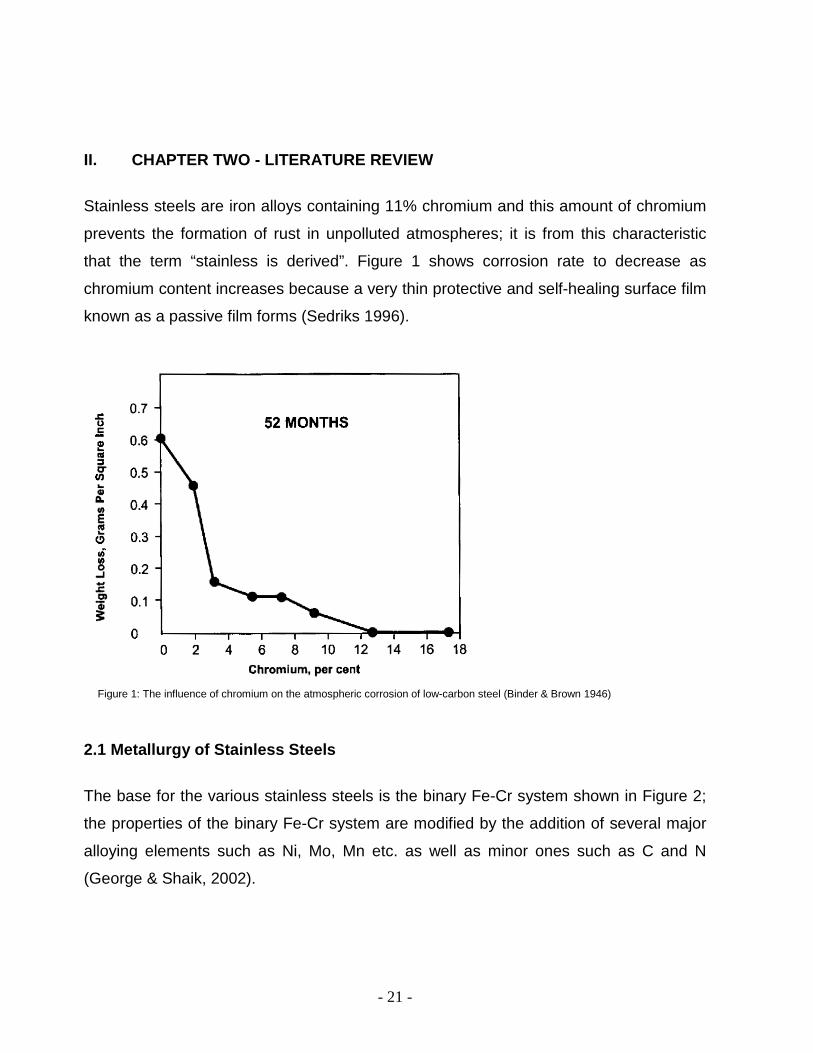
Stainless steels are iron alloys containing 11% chromium and this amount of chromium
prevents the formation of rust in unpolluted atmospheres; it is from this characteristic
that the term “stainless is derived”. Figure 1 shows corrosion rate to decrease as
chromium content increases because a very thin protective and self-healing surface film
known as a passive film forms (Sedriks 1996).
2.1 Metallurgy of Stainless Steels
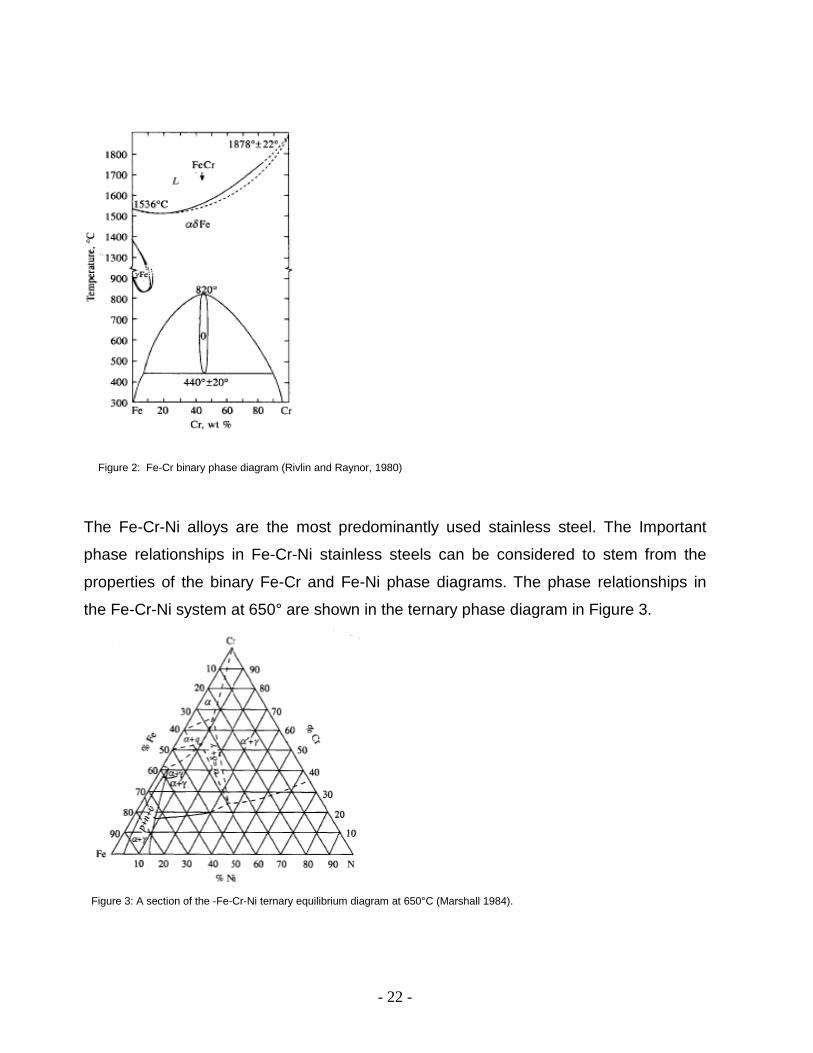
The base for the various stainless steels is the binary Fe-Cr system shown in Figure 2;
the properties of the binary Fe-Cr system are modified by the addition of several major
alloying elements such as Ni, Mo, Mn etc. as well as minor ones such as C and N
(George & Shaik, 2002).
Figure 1: The influence of chromium on the atmospheric corrosion of low-carbon steel (Binder & Brown 1946)
- 22 -
The Fe-Cr-Ni alloys are the most predominantly used stainless steel. The Important
phase relationships in Fe-Cr-Ni stainless steels can be considered to stem from the
properties of the binary Fe-Cr and Fe-Ni phase diagrams. The phase relationships in
the Fe-Cr-Ni system at 650° are shown in the ternary phase diagram in Figure 3.
Figure 2: Fe-Cr binary phase diagram (Rivlin and Raynor, 1980)
Figure 3: A section of the -Fe-Cr-Ni ternary equilibrium diagram at 650°C (Marshall 1984).

- 23 -
2.1.1 Solidification of stainless steels
A convenient way of understanding the phase relationship in the Fe-Cr-Ni ternary
system is by the use of cross-sections through the ternary diagram, such that the
proportion of one element is constant. A section of the Fe-Cr-Ni diagram at a constant
Fe content of 70% from the work of Kujanpaa, Suutala, Takalo & Moisio, (1979) is
shown in figure 4. According to Allan (1995) Figure 3 shows that stainless steels can
solidify by the following mechanisms or modes:
• Ferritic or mode A (L → L + δ → δ)
• Ferritic-austenitic or mode B (L → L + δ → L + δ + γ → γ + δ)
• Austenitic-ferritic or mode C (L → L + γ → L + γ + δ → γ +δ )
• Austenitic or mode D (L → L + γ → γ)
Figure 4: Vertical section of Fe-Cr-Ni phase diagram showing the variation of solidification mode with composition for a constant Fe
content of 70% (Kujanpaa et al, 1979).
Where: L = Liquid, γ = Austenite and δ = Delta ferrite
Mode A Mode B Mode D Mode C

- 24 -
Allan (1995) and others, furthermore state that the solidification mode and sequence
may also be successfully predicted using chromium and nickel equivalent ratios which
are calculated using the ferrite and austenite forming elements respectively. Among
several equations for chromium equivalent, Creq and nickel equivalent, Nieq one can
quote the following by Padilha and Guedes (1994) where all the elements are
introduced into the formula in wt. (%).
It also clear from Figure 3 that austenite is the stable phase in the Ni-rich side of the
diagram while delta-ferrite is the equilibrium phase in the Cr rich side (George & Shaik
2002).
The properties of the Fe-Cr-Ni system can also be modified by the addition of several
major and minor alloying elements such as Ni, Mo, Ti, Ni, Mn, C and Figure 5 shows a
few compositional and property linkages in the family of stainless steels that can result
from these various alloying elements being added to or reduced from Type 304
austenitic stainless steel. Chemical compositons of the various 200 and 300 series
austenitic stainless steels is shown in table 1.
(1)
(2)
Equation 2: Nickel equivalent, Nieq, equation (Padihla & Guedes, 2004)
Equation 1: Chromium equivalent, Creq, equation (Padihla & Guedes, 2004)

- 25 -
Figure 5: Compositional and property linkages in the stainless steel family of alloys (Sedriks 1996)
Table 1: Chemical compositions in wt% of some typical austenitic stainless steels (Padihla, Plaut & Rios 2007)
- 26 -
2.2 Austenitic stainless steel microstructure
The austenitic stainless steel matrix microstructure is a solid solution, with very low
stacking fault energy and a high work hardening capability (Schramm & Reed, 1975).
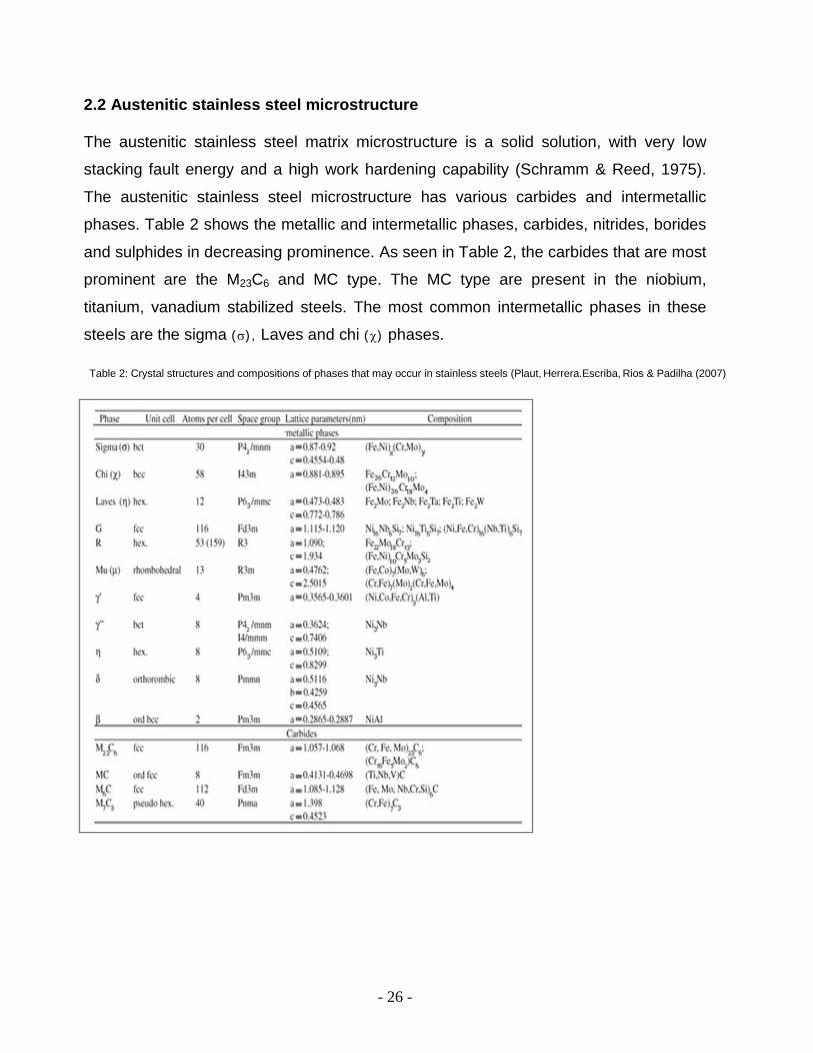
The austenitic stainless steel microstructure has various carbides and intermetallic
phases. Table 2 shows the metallic and intermetallic phases, carbides, nitrides, borides
and sulphides in decreasing prominence. As seen in Table 2, the carbides that are most
prominent are the M23C6 and MC type. The MC type are present in the niobium,
titanium, vanadium stabilized steels. The most common intermetallic phases in these
steels are the sigma (σ), Laves and chi (χ) phases.
Table 2: Crystal structures and compositions of phases that may occur in stainless steels (Plaut, Herrera.Escriba, Rios & Padilha (2007)
- 27 -
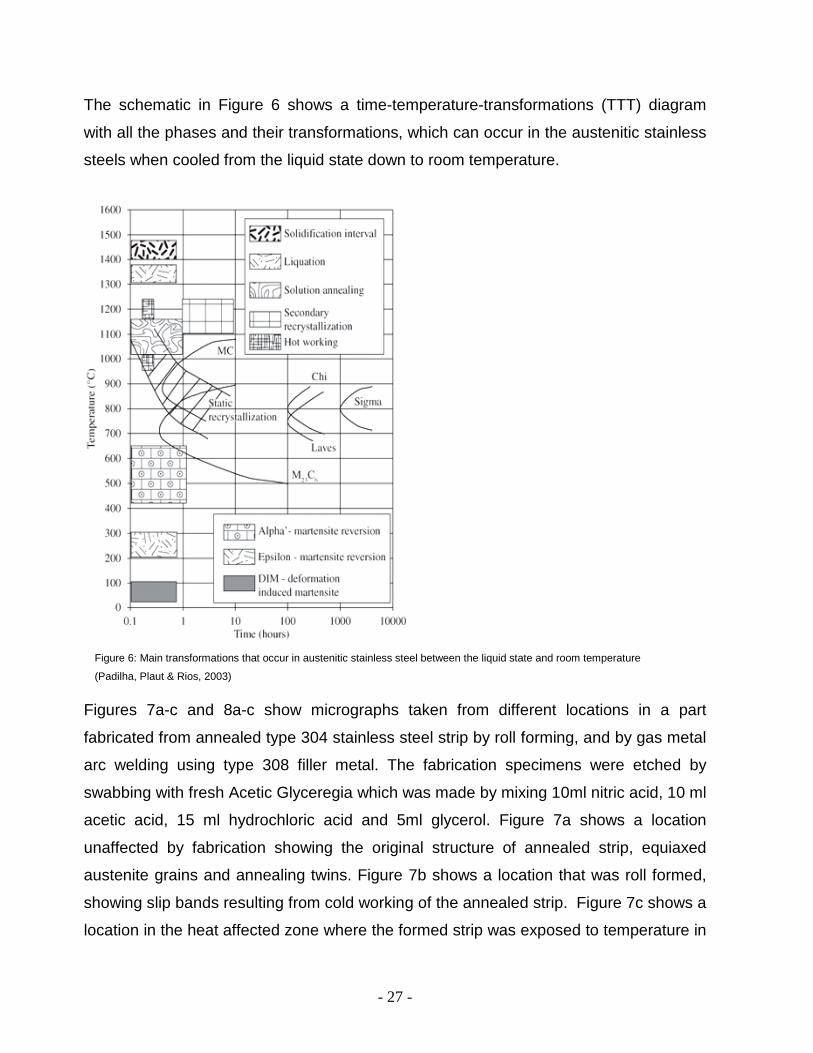
The schematic in Figure 6 shows a time-temperature-transformations (TTT) diagram
with all the phases and their transformations, which can occur in the austenitic stainless
steels when cooled from the liquid state down to room temperature.
Figures 7a-c and 8a-c show micrographs taken from different locations in a part
fabricated from annealed type 304 stainless steel strip by roll forming, and by gas metal
arc welding using type 308 filler metal. The fabrication specimens were etched by
swabbing with fresh Acetic Glyceregia which was made by mixing 10ml nitric acid, 10 ml
acetic acid, 15 ml hydrochloric acid and 5ml glycerol. Figure 7a shows a location
unaffected by fabrication showing the original structure of annealed strip, equiaxed
austenite grains and annealing twins. Figure 7b shows a location that was roll formed,
showing slip bands resulting from cold working of the annealed strip. Figure 7c shows a
location in the heat affected zone where the formed strip was exposed to temperature in
Figure 6: Main transformations that occur in austenitic stainless steel between the liquid state and room temperature
(Padilha, Plaut & Rios, 2003)

- 28 -
the sensitizing range of 427-816°C during welding, showing precipitation of carbide
particles at grain boundaries with some remnants of slip bands resulting from cold
working are also apparent.
Figure 8a shows a location in the heat affected zone where the welding temperature
was above 816°C, showing partial recrystallization of the cold worked structure. Figure
8b shows a location at the interface of the base metal (left) and weld metal (right); the
heat affected zone is fully recrystallized because of being heated above 1093°C during
welding, and is free of carbide precipitation because the strip was cooled rapidly
through the sensitization range. Figure 8c shows a specimen of the weld metal, showing
a dendritically cored structure containing some delta ferrite (islands at top) and
precipitated carbides (small black particles) in an austenitic matrix. Dendritic coring is
characteristic of rapidly frozen austenitic weld metal.
Figure 7: Type 304 base metal and heat affected zone taken at X250 Magnification (Mehl 1972)
Figure 8: The heat affected zone, fusion line and 308 filler weld metal of the fabrication taken at X250 Magnification (Mehl 1972)
- 29 -
2.3 Hot and cold working of austenitic stainless steel
It is generally well known that austenitic stainless steels cannot be hardened by heat
treatments but that cold or warm working (drawing, rolling, forging, etc.) can make such
stainless steels harden (Milad, Zreiba, Elhalouan &Baradai, 2007). For austenitic
stainless steels, the greater the amount of plastic strain induced, the higher is the stress
required to deform the material further. This phenomenon is known as strain (or work)
hardening, and is attributed to the increasing difficulty of dislocations movement as their
density increases with deformation (Milad et al, 2007).
2.3.1 Hot working of austenitic stainless steels
After solidification, via conventional or continuous casting, wrought austenitic stainless
steels are, in general, hot worked. According to Ahlblom and Sandström (1982) and
Keown (1980) several factors influence hot ductility of the austenitic stainless steels:
temperature, strain, strain rate, chemical composition, grain size and orientation, non-
metallic inclusions and prior mechanical or thermal heat treatments. The analysis of the
effects of the alloying elements on the hot ductility of the austenitic stainless steels
presents increased difficulties due to the fact that practically all alloying elements and
impurities influence the amount of delta ferrite that is formed (Plaut, Herrera, Escriba,
Rios & Padilha 2007). Figure 9 shows the hot ductility variations, evaluated by hot
tensile testing at a constant strain rate of 6 per second (S-1), for several additions to the
base-composition of the AISI 304L steel. The curves in Figure 9 show a similar shape
and the work of Keown (1980) further divides the curves into the following three stages:
Stage 1 - In the 900 to 1000 °C, temperature range, ductility is low,
Stage 2 - In the 1100 to 1200 ºC range, ductility significantly increases due to dynamic
recrystallization.
Stage 3 – In the temperature range 1250-1350 °C, ductility loss is related to the lack of
grain boundary cohesion and eventually with the occurrence of some liquation.

- 30 -
From Figure 9 It may also be observed that small Ti additions enhance hot ductility of
the 304L steel while all the other element additions (N, Cr, Ni, Mo, S, C and Mn + Si)
have a negative effect of the hot ductility. In the case of the AISI 316 steel, 40-90 ppm additions of boron improve the hot ductility (Keown 1980).
Figure 9: Effect of alloying elements on hot ductility of AISI 304L austenitic stainless steel (Keown 1982)
- 31 -
2.3.2 Cold working of austenitic stainless steels
When Austenite is unstable, it transforms at least partially to martensite and this greatly
increases its mechanical strength. In comparison, a highly stable austenite will limit the
strain hardening of the alloy (Lacombe Baroux & Beranger, 1993). Reed (1962) further
explained that two types of martensites can form spontaneously in austenitic stainless
steels. These two types of martensites have a body centered cubic (BCC) and the
hexagonal close packed (HCP) metallurgical structure. The martensite with the HCP
metallurgical structure is ɛ-martensite and is formed by mechanical strain induced by
cold work. The martensite with the BCC metallurgical structure is ά-martensite, and it is
formed thermally on cooling (M´Esz´Arosa & Proh´Aszkab 2005). According to Reed
(1962) deformation induced or strain induced martensite (ɛ-martensite) is a unique
feature of austenitic stainless steels. During plastic deformation, dislocation density (or
crystalline defects) and in consequence the stacking fault density, within the host
material, increases with the degree of deformation. The dislocations and twins are
considered to be the major sources for martensitic phase transformation (Mumtaz, et
al., 2004). Schramm and Reed (1975) believe stacking faults are in hexagonal
symmetry arrangement in FCC lattices, like ɛ-martensite, n stacking faults can form a
hexagonal ɛ-martensite crystal. As aforementioned, ά-martensite is formed on cooling
of the austenitic stainless steel. When enough driving force i.e. decrease in Gibbs free
energy exists, the ά-martensite nucleus will rapidly grow as plates and the growth of ά-
martensite occurs by the repeated nucleation of new embryos and coalescence
(Hedström, Lienert, Almer, Odén, 2008). The fact that magnetization of a material is
closely related to the microstructure of the materials makes magnetic measurements a
technique for non-destructive testing (Murr, Staudhammer & Hecker, 1982). At room
temperature, all austenitic stainless steels are paramagnetic in the fully annealed
condition (M´Esz´Arosa & Proh´Aszkab 2005). The hcp ɛ-martensite is paramagnetic in
contrast to the bcc ά-martensite which is strongly ferromagnetic and the only magnetic
phase in the low carbon austenitic stainless steels (Reed 1962). The strain induced
martensite may revert back into austenite during subsequent annealing, even for
temperatures that are lower than the temperature for static recrystallization (Padilha,
- 32 -
Plaut & Rios, 2003). The austenitic stainless steels are generally supplied in the solution
annealed condition, performed in the temperature range of 1000 to 1120 °C. It is
important to note that even though these stainless steels are supplied in the solution
annealed condition they invariably contain some residual delta ferrite in their
microstructure (Padilha, Plaut & Rios 2007).
2.4 Delta Ferrite
2.4.1 Importance of delta ferrite in austenitic stainless steels
During the welding process the solidification strength of austenitic stainless steels can
be seriously impaired by the presence of relatively small amounts of low melting point
impurities such as sulphur and phosphorus. During solidification these low-melting point
impurities are forced out to the grain boundaries as they are last to solidify because
their melting point is lower than that of the stainless steel. The grain structure is
therefore weakened at the locations on the grain boundary where these impurities
accumulate. The presence of these impurities, when coupled with the high coefficient of
expansion of austenitic stainless steels when compared to that of martensitic and ferritic
stainless steels, can cause serious solidification cracking problems called ‘micro-
fissures’ (Singh 2011).One method of reducing the effect of micro-fissuring is to
disperse these low-melting point impurities among disconnected grain boundaries that
surround the islands or colonies of a second phase that has the capacity to absorb the
impurities. This can be accomplished by modifying the chemical composition of the steel
in such a way to allow the creation of islands or colonies of ferrite in the welds which is
dispersed throughout the microstructure (Singh 2011). Due to the high solubility delta
ferrite has for sulphur and phosphorus impurities; some delta ferrite is intentionally
allowed to be retained as a second phase in weld metal and in castings because it acts
as a sink for sulphur and phosphorus; its presence therefore reduces solidification
cracking (Sedriks 1996). Table 3 quantifies the solubility of sulphur and phosphorus in
delta ferrite and austenite in weight % (wt %).

- 33 -
The type 304H austenitic stainless steel is designed to follow the Ferritic-austenitic
solidification sequence or mode B (L → L + δ → L + δ + γ → γ + δ), as shown in
figure 3. As seen in the solidification sequence, Type 304H stainless steel will solidify
initially as delta ferrite during welding, which has a high solubility for the sulphur and
phosphorus impurities at high temperature. Most of the delta ferrite then transforms to
austenite upon further cooling and results in an austenitic matrix containing tiny patches
of residual delta ferrite. The presence of delta ferrite has the potential to reduce the
corrosion resistance of the steel very slightly but its ability to prevent micro-fissuring
which can lead to catastrophic failure makes it desirable in small quantities as low as 4
wt% (Singh 2011). Work by Konteki and Armao (2011) revealed that a ferrite content of
4 wt%, FN4, was required to avoid solidification cracking and was best determined by
measurement with a magnetic instrument calibrated to AWS A4.2 or ISO 8249.
2.4.2 Influence of delta ferrite on performance of austenitic stainless steels in high temperature service
Control of the structure of stainless steel weld deposits and castings is important
because the microstructure of the steel influences many of its properties. As
aforementioned, the presence of delta ferrite reduces hot cracking in deposited weld
metal, and reduces hot tearing in castings. The adverse effects of delta ferrite for some
applications might include the higher magnetic permeability of alloys containing ferrite,
or the decrease of impact strength during long-time high-temperature service through
an increase in the rate of sigma phase formation (Hull 1973). In the work of Hauser and
Vanecho (1982), where the effects of delta ferrite level on tensile and creep-rupture
behavior of E308-16 shielded metal-arc stainless steel weld metal with FN 2, 6, 10 and
Table 3: Solubility of sulphur and phosphorus in ferrite and austenite in wt % (Borland and Younger, 1960)
Sulphur Phosphorus
- 34 -
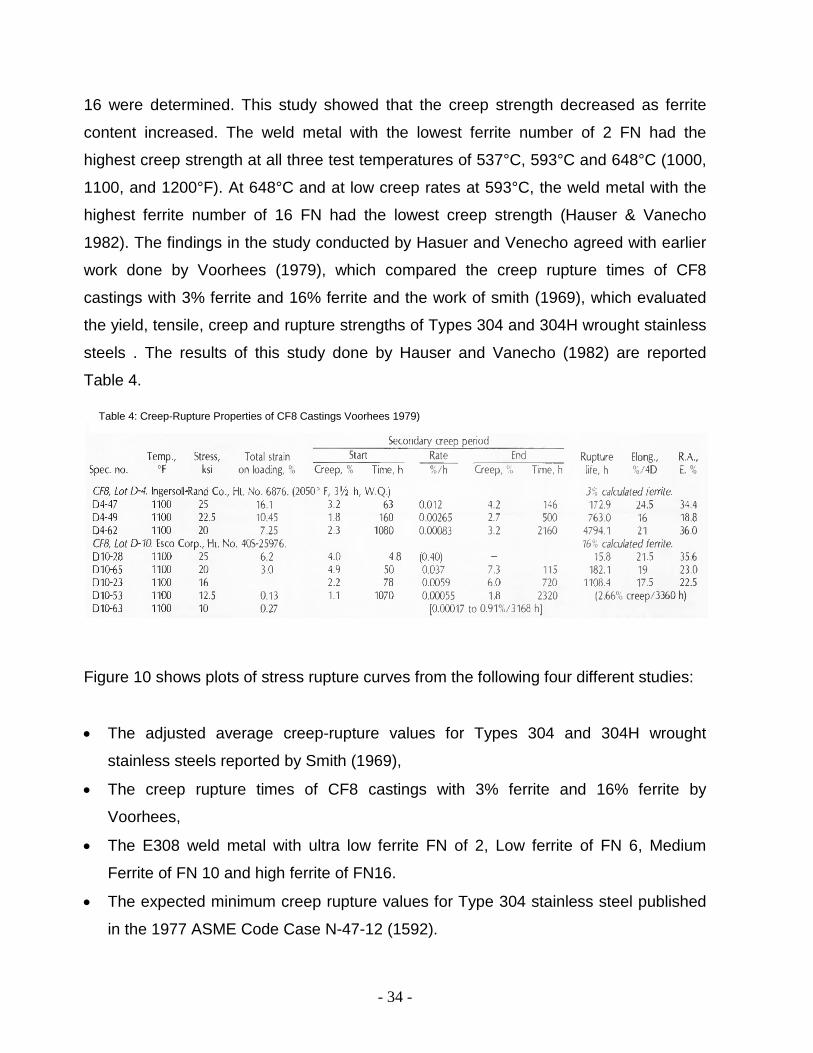
16 were determined. This study showed that the creep strength decreased as ferrite
content increased. The weld metal with the lowest ferrite number of 2 FN had the
highest creep strength at all three test temperatures of 537°C, 593°C and 648°C (1000,
1100, and 1200°F). At 648°C and at low creep rates at 593°C, the weld metal with the
highest ferrite number of 16 FN had the lowest creep strength (Hauser & Vanecho
1982). The findings in the study conducted by Hasuer and Venecho agreed with earlier
work done by Voorhees (1979), which compared the creep rupture times of CF8
castings with 3% ferrite and 16% ferrite and the work of smith (1969), which evaluated
the yield, tensile, creep and rupture strengths of Types 304 and 304H wrought stainless
steels . The results of this study done by Hauser and Vanecho (1982) are reported
Table 4.
Figure 10 shows plots of stress rupture curves from the following four different studies:
• The adjusted average creep-rupture values for Types 304 and 304H wrought
stainless steels reported by Smith (1969),
• The creep rupture times of CF8 castings with 3% ferrite and 16% ferrite by
Voorhees,
• The E308 weld metal with ultra low ferrite FN of 2, Low ferrite of FN 6, Medium
Ferrite of FN 10 and high ferrite of FN16.
• The expected minimum creep rupture values for Type 304 stainless steel published
in the 1977 ASME Code Case N-47-12 (1592).
Table 4: Creep-Rupture Properties of CF8 Castings Voorhees 1979)

- 35 -
The plots in Figure 10 show a general trend of a decrease in creep rupture strength as
ferrite content increases. According to Hauser and Vanecho (1982) when compared to
the austenitic weld metals, the austenitic castings have the following creep-rupture
properties:
• Lower strength.
• Lower secondary creep rate.
• Higher elongation and reduction of area at fracture, especially at the longer rupture
times.
The CF8 having a calculated ferrite level of 3% in Figure 10 was significantly stronger
than CF8 having a calculated ferrite level of 16%.
Figure 10: Stress rupture curves for E308 weld metal and CF8 castings at 593° C with different ferrite levels
(Hauser and Vanecho 1982)
- 36 -
2.4.3 Effect of alloying elements on delta ferrite formation
According to Castro & de Cadanet (1975) an increase in chromium, niobium,
molybdenum and silicon increases the temperature range in which delta ferrite can
exist, and can be described as ferrite forming elements.
An increase in the proportion of ferrite formers therefore tends to increase the quantity
of ferrite and sigma phase likely to be formed, and to accelerate the formation. High
silicon and molybdenum contents have the effect of increasing ferrite stability to higher
temperatures and the temperature range over which sigma phase exists increases as
well. As an example a steel containing 20 wt% chromium, 10 wt% nickel and 3 wt%
molybdenum still forms sigma phase at 1000°C, whereas in molybdenum-free
compositions this phase ceases to exist above about 900°C. Work by Ogawa and
Tsunetomi (1982) on the hot cracking susceptibility of austenitic stainless steels showed
that silicon, when present in appreciable amounts in welded joints decreases the hot
cracking resistance. All ferrite formers are present in high amounts in sigma type
intermetallic compounds, so the diffusion rates of individual elements play an important
role in sigma formation.
Austenite forming elements such as nickel, carbon, nitrogen and copper extend the
temperature range where austenite can exist (Castro and de Cadanet, 1975). Therefore
higher levels of austenite promoters diminish the tendency for standard stainless steels
to form ferrite. Carbon acts mainly by forming complex carbides of chromium;
molybdenum and tungsten, which renders these elements unavailable to form other
phases. An increase in nickel and nitrogen content has the effect of retarding the
diffusion of ferrite formers in the austenite, and consequently slows down the rate of
precipitation of ferrite and subsequent transformation to sigma phase. Delta ferrite is
therefore controlled and affected by content of chromium, molybdenum, niobium, nickel,
carbon, nitrogen, manganese and copper (Priceputu & Moisa, 2011).
- 37 -
2.5 Difference between 304, 304L and 304H type austenitic stainless steels
Type 304 austenitic stainless steel is available in low or high controlled carbon contents,
known as L and H grades (Albright & Hansen, 2009). This constitutes three separate
grades. The H grade austenitic stainless steel, such as type 304H, has a carbon content
greater than 0.04 wt% and is used in the solution annealed condition with grain size
requirements of No. 7 or coarser. These compositional and heat treatment restrictions
ensure high and reproducible creep rupture strengths at elevated temperatures
(Sedriks1996). Types 304 and 304L stainless steels have no requirement for minimum
carbon, control of grain size or annealing temperature (Kutz 2002). Type 304, 304L and
304H constitutes three separate grades and it is therefore more economical for mills to
melt steel to only two different levels of carbon, and dual certify them as types 304/304L
and types 304/304H (Kutz 2002). All austenitic stainless steels are susceptible to
sensitization when sufficiently exposed the temperature range of 450-850oC. The low-
carbon grades are preferred if sensitization is a problem. (Albright 2009). The high-
carbon grades should be used with caution if service-induced carburization may be a
problem.
2.5.1 Type 304, 304L and 304H chemical compositions and the significance of alloying elements
The introduction of the argon-oxygen decarburization (AOD) process for refining
stainless steel has made profound changes in how existing grades were produced, as
well as permitting totally new grades to be developed because, the AOD permits
refining carbon to very low levels without removing chromium (Kutz 2002).
The minimum and maximum chemical composition limits for 304, 304L and 304H type
stainless steel are almost identical with slight differences in the carbon, nickel and
nitrogen contents as seen in Table 5 taken from ASTM A240/A240M.

- 38 -
2.5.1.1 Chromium
Chromium as an alloying element in stainless steel is a strong ferrite former that has
outstanding corrosion resistance to oxidizing acids but offers little resistance to reducing
acids or halogen acids (Kutz 2002). As aforementioned, the addition of chromium as
alloying element forms a protective, self-healing passive film that protects the steel from
corrosion making it stainless (Sedriks 1996). Oxidation is the most important high-
temperature corrosion reaction and the protective film also enhances the high
temperature oxidation resistance of ferrous metals (Davis 1994). The basic mechanism
involves the formation of a Cr2O3 and/or a FeCr2O4 spinel protective film (Dillon 1995).
Figure 11 shows the temperature range for which different ferrous materials present a
satisfactory oxidation resistance. As expected, the maximum operating temperature
increases with an increase in the chromium content. Table 5 also shows Type 304 and
304L to have the same minimum and maximum compositional limits for chromium of
17.5 and 19.5 wt% respectively. Type 304H has a higher chromium content range
between 18-20 wt% because Type 304H is used at elevated temperatures.
2.5.1.2 Nickel
Nickel as alloying element in stainless steel is a strong austenite former which offers
resistance to reducing solutions but is readily attacked by oxidizing solutions (Kutz
Figure 11: Influence of the chemical composition, especially the Cr content, on the oxidation resistance of steels37. All
compositions are in wt. (%) (Dienst 1978)
- 39 -
2002). Table 5 further shows that 304,304L and 304H type stainless steels all have the
same minimum nickel content limit of 8.0 wt%. The maximum nickel content limits do
however differ with 304L type austenitic stainless steel permitting up to 12.0 wt% nickel,
compared to the maximum nickel content limit of 10.5 wt% for standard 304 and 304H.
It is however important to note that given the high cost of nickel it is not unusual for all
three grades to be produced with their nickel content close to the minimum limit of 8.0
wt%. There is therefore little practical difference in their nickel content (Atlas steels,
2011). The addition of nickel increases creep resistance as a result nickel superalloys,
which have higher nickel contents, therefore have a comparatively better creep
resistance than the austenitic stainless steels (Plaut et al., 2007). Austenitic stainless
steels are widely used because they are easier to process and less expensive, by a
factor of 6 to 60, depending on the alloy, than the nickel superalloys (Plaut et al., 2007).
2.5.1.3 Carbon
Table 5 taken from ASTM A240/A240M shows Type 304 has a specified maximum
carbon content of 0.07 wt% and Type 304L has a specified maximum carbon content of
0.03 wt%. Both Type 304 and 304L do not have minimum carbon content values
specified. The 304H type stainless steel has specified carbon content of 0.04 - 0.10
wt%. The Type 304H stainless steel is used in high temperature service because the
minimum carbon content requirement of 0.04 - 0.1 wt% in Type 304H guarantees higher
allowable stresses i.e. strength, at elevated temperatures above 540oC (Albright et al.
2009). It is important to note that the carbon contents of types 304 and 304H overlap
between the ranges 0.04 - 0.07 wt%. This overlap in carbon levels between the three
grades makes it more economical for mills to melt steel to only two steels with different
levels of carbon and dual certify (Kutz 2002). As a result a type 304 stainless steel with
less than 0.03 wt% carbon can be dual certified as a type 304L and a type 304 stainless
steel. Similarly, a type 304 with a carbon wt% of 0.04 or higher can be dual certified as
a type 304H and a type 304 stainless steel.

- 40 -
2.5.1.4 Nitrogen
Nitrogen as an alloying element is an austenite former. The last compositional
difference is that 304H does not contain nitrogen whereas the Types 304 and 304L
have a 0.10 wt% nitrogen content maximum limit specified. The use of the AOD process
for refining steels has made it possible to add a small, precisely controlled amount of
nitrogen because the addition of nitrogen increases the room temperature tensile
properties without adversely affecting the intergranular corrosion resistance (Kutz
2002). With care in annealing practice, it is now possible to produce type 304 stainless
steel with low enough carbon to meet the type 304L specification, yet with a high
enough yield strength to meet type 304 requirements (Kutz 2002).
2.5.2 Differences in mechanical properties
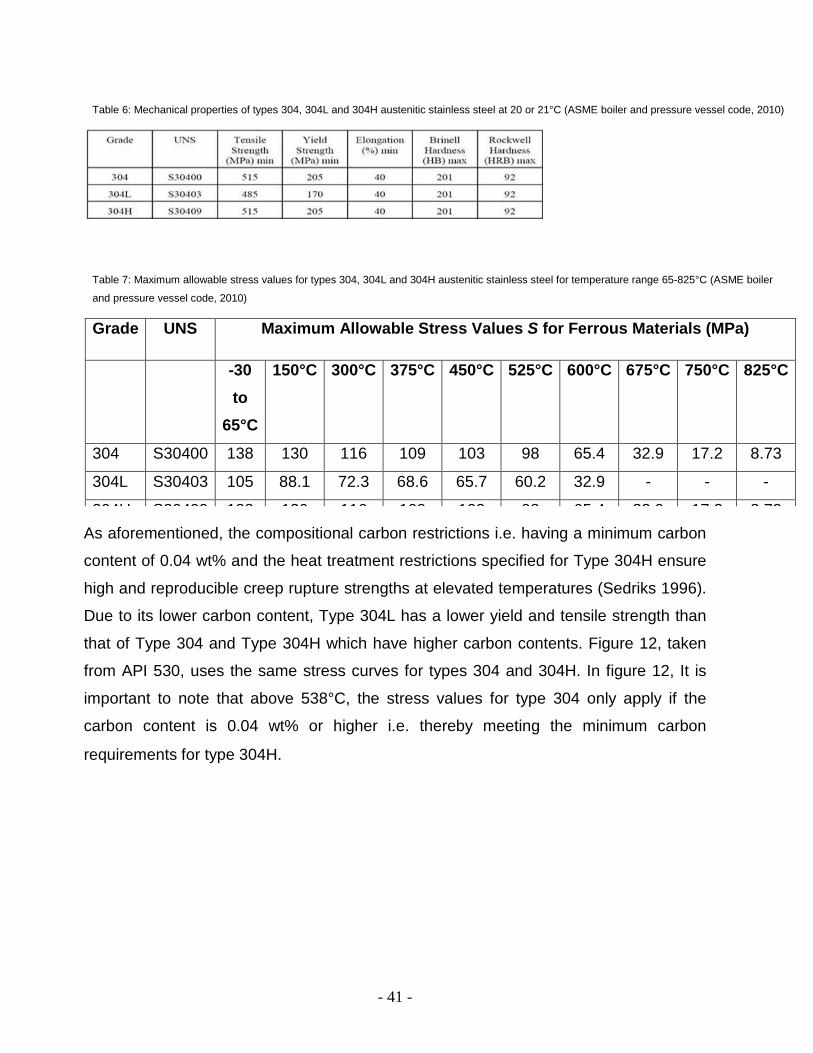
Mechanical property specification differences are illustrated in Table 6 taken from
AMSE 2010, A312. Table 6 shows that the elongation, Brinell and Rockwell hardness
requirements to be identical for the 304, 304L and 304H stainless steels. The yield and
tensile strength for 304 and 304H at 20°C or 21°C are equal with the minimum yield
strength being 205 MPa and a minimum tensile strength being 515 MPa. The 304L has
a minimum yield and tensile strength requirement of 170 MPa and 485 MPa
respectively at 20°C or 21°C which lower than values for 304 and 304H Type stainless
steel at the same temperature. The maximum allowable stress values shown in Table 7
for exposure in the temperature range 65°C – 825°C for types 304 and 304H are also
equal to each other while the values obtained for 304L are lower in the same 65 - 825°C
temperature range. There is therefore no difference in maximum allowable stresses at
high or low temperature service for a type 304 stainless steel dual certified as type 304
and 304H.
Table 5: Chemistry of 304, 304L and 304H austenitic stainless steel (ASME boiler and pressure vessel code, 2010)
- 41 -
As aforementioned, the compositional carbon restrictions i.e. having a minimum carbon
content of 0.04 wt% and the heat treatment restrictions specified for Type 304H ensure
high and reproducible creep rupture strengths at elevated temperatures (Sedriks 1996).
Due to its lower carbon content, Type 304L has a lower yield and tensile strength than
that of Type 304 and Type 304H which have higher carbon contents. Figure 12, taken
from API 530, uses the same stress curves for types 304 and 304H. In figure 12, It is
important to note that above 538°C, the stress values for type 304 only apply if the
carbon content is 0.04 wt% or higher i.e. thereby meeting the minimum carbon
requirements for type 304H.
Table 6: Mechanical properties of types 304, 304L and 304H austenitic stainless steel at 20 or 21°C (ASME boiler and pressure vessel code, 2010)
Table 7: Maximum allowable stress values for types 304, 304L and 304H austenitic stainless steel for temperature range 65-825°C (ASME boiler
and pressure vessel code, 2010)
Grade UNS Maximum Allowable Stress Values S for Ferrous Materials (MPa)
-30 to
65°C
150°C 300°C 375°C 450°C 525°C 600°C 675°C 750°C 825°C
304 S30400 138 130 116 109 103 98 65.4 32.9 17.2 8.73
304L S30403 105 88.1 72.3 68.6 65.7 60.2 32.9 - - -
304H S30409 138 130 116 109 103 98 65 4 32 9 17 2 8 73

- 42 -
Figure 12: Stress rupture curves for ASTM 312 Type 304 and 304H (American Petroleum Institute 530)
- 43 -
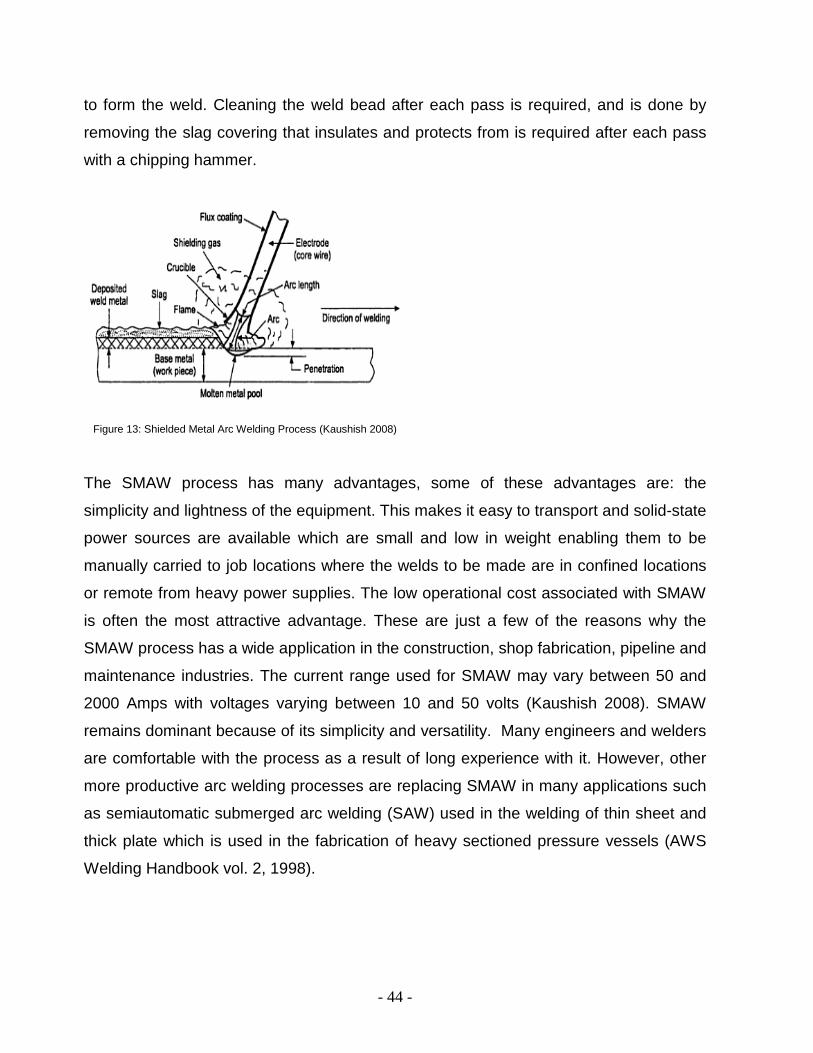
2.6 Shielded metal arc welding (SMAW) process
Shielded metal arc welding (SMAW) is one of the oldest welding processes and is the
simplest and one of the most versatile for welding ferrous base metals and several non-
ferrous base metals (8th Edition of the AWS Welding Handbook vol. 2, 1998). It is also
the most commonly used welding process in fabrication and maintenance jobs
(Kaushish 2008). The SMAW method is commonly called Manual Metal Arc Welding
(MMA), referring to the fact that in a majority of cases it is carried out by a welder
guiding the stick electrode (Svensson 1994). The shielded metal arc welding (SMAW)
process as illustrated in Figure 13 uses a covered electrode consisting of a core wire
around which a concentric clay-like mixture of silicate binders and powdered materials
is extruded. Materials such as such as fluorides, oxides, carbonates, metal alloys and
cellulose are some of the common powdered materials used in the clay-like covering.
The main coating types that exist can be divided into acid, cellulosic, rutile and basic
electrodes with each the electrodes possessing characteristics and mechanical
properties typical to the type (Svensson 1994). The covered electrodes are produced in
diameters normally ranging from 2 to 8 mm with the smaller diameters used with low
currents for joining thin sections in all welding positions; and the larger electrode
diameters used with high currents to achieve greater deposition rates when welding in
the flat and horizontal positions (AWS Welding Handbook, 1998). The covering around
the core wire is the source of arc stabilizers, gases to displace air, metal and slag to
protect, support, insulate the hot weld metal and allows the addition of alloying elements
(Svensson 1994). The top section of the electrode core wire is however not covered
with the covering and is left bare. This bare section of the electrode is clamped in an
electrode holder, which in turn is connected to a power source by a welding cable. The
work is connected to the other power source terminal. The arc is initiated by touching
the electrode tip against the work and then drawing it slightly. The current passes
through the metal rod and tip of the electrode is heated by resistance heating and action
of the arc (Svensson 1994). Under the intense heat of the arc of about 5000°C, a small
part of the base metal, the core wire and covering of the electrode melt (Kaushish
2008). The molten base metal, core wire, and metal powders in the covering coalesce
- 44 -
to form the weld. Cleaning the weld bead after each pass is required, and is done by
removing the slag covering that insulates and protects from is required after each pass
with a chipping hammer.
The SMAW process has many advantages, some of these advantages are: the
simplicity and lightness of the equipment. This makes it easy to transport and solid-state
power sources are available which are small and low in weight enabling them to be
manually carried to job locations where the welds to be made are in confined locations
or remote from heavy power supplies. The low operational cost associated with SMAW
is often the most attractive advantage. These are just a few of the reasons why the
SMAW process has a wide application in the construction, shop fabrication, pipeline and
maintenance industries. The current range used for SMAW may vary between 50 and
2000 Amps with voltages varying between 10 and 50 volts (Kaushish 2008). SMAW
remains dominant because of its simplicity and versatility. Many engineers and welders
are comfortable with the process as a result of long experience with it. However, other
more productive arc welding processes are replacing SMAW in many applications such
as semiautomatic submerged arc welding (SAW) used in the welding of thin sheet and
thick plate which is used in the fabrication of heavy sectioned pressure vessels (AWS
Welding Handbook vol. 2, 1998).
Figure 13: Shielded Metal Arc Welding Process (Kaushish 2008)
- 45 -
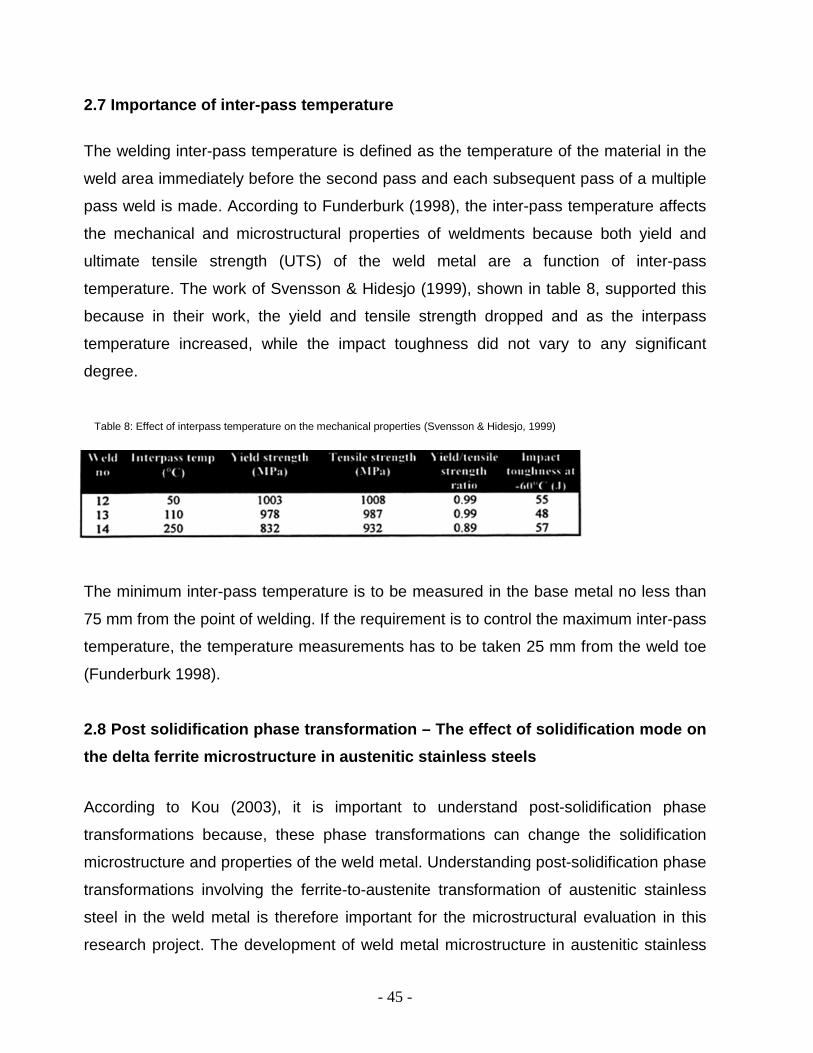
2.7 Importance of inter-pass temperature
The welding inter-pass temperature is defined as the temperature of the material in the
weld area immediately before the second pass and each subsequent pass of a multiple
pass weld is made. According to Funderburk (1998), the inter-pass temperature affects
the mechanical and microstructural properties of weldments because both yield and
ultimate tensile strength (UTS) of the weld metal are a function of inter-pass
temperature. The work of Svensson & Hidesjo (1999), shown in table 8, supported this
because in their work, the yield and tensile strength dropped and as the interpass
temperature increased, while the impact toughness did not vary to any significant
degree.
The minimum inter-pass temperature is to be measured in the base metal no less than
75 mm from the point of welding. If the requirement is to control the maximum inter-pass
temperature, the temperature measurements has to be taken 25 mm from the weld toe
(Funderburk 1998).
2.8 Post solidification phase transformation – The effect of solidification mode on the delta ferrite microstructure in austenitic stainless steels
According to Kou (2003), it is important to understand post-solidification phase
transformations because, these phase transformations can change the solidification
microstructure and properties of the weld metal. Understanding post-solidification phase
transformations involving the ferrite-to-austenite transformation of austenitic stainless
steel in the weld metal is therefore important for the microstructural evaluation in this
research project. The development of weld metal microstructure in austenitic stainless
Table 8: Effect of interpass temperature on the mechanical properties (Svensson & Hidesjo, 1999)

- 46 -
steels is shown in Figure 14. The delta ferrite can be (a) interdendritic, (b) vermicular or
(c) lathy. Figure 14 also shows (d), a schematic vertical or isoplethal section of the Fe-
Cr-Ni ternary phase diagram at 70 wt% Fe and above 1200°C. This has also been
called a Fe-Cr-Ni pseudo-binary phase diagram. The apex in figure 14d, point 1 in the
isoplethal section, is the start of the of the three-phase eutectic triangle. The triangle is
formed by points 1, 2 and 3 and the three phases of the three-phase eutectic triangle
are Liquid (L), austenite (γ) and delta ferrite (δ).
Figure 14 shows that for all compositions that are on the left of the apex, austenite will
be the primary solidification phase and those on the right of the apex will solidify with
delta ferrite as the primary solidification phase before transformation to austenite.
Therefore for the nickel-rich alloy on the left-hand side of the apex of the three-phase
eutectic triangle, austenite (γ) will be the primary solidification phase. The light dendrites
shown in figure 14a are austenite, while the dark particles between the primary dendrite
arms is the delta-ferrite (δ) that forms when the three-phase triangle is reached during
the terminal stage of solidification. This delta ferrite which is found in between the
austenite dendrites is called interdendritic delta ferrite. For dendrites with long
secondary arms, interdendritic ferrite particles can also form between secondary
dendrite arms. For a chromium-rich alloy i.e. an alloy on the right-hand side of the apex
Figure 14: Solidification and post solidification transformation in Fe-Cr-Ni welds (a) interdendritic ferrite, (b) vermicular ferrite
and (c) lathy ferrite (d) a schematic vertical or isoplethal section of the Fe-Cr-Ni ternary phase diagram at 70 wt% Fe and
above 1200°C (Kou 2003)
- 47 -
of the three-phase eutectic triangle, delta ferrite (δ) will be the primary solidification
phase. The dark dendrites shown in figure 14b are therefore delta ferrite that is first to
form. The core of the delta-ferrite dendrites, which forms at the beginning of
solidification, is richer in Cr (point 4), while the outer portions, which form as
temperature decreases, have lower chromium contents. As the chromium rich alloy
cools into the (δ + γ) two-phase region, the outer portions of the dendrites having less Cr
transform to austenite, thus leaving behind Cr-rich “skeletons” of d-ferrite at the dendrite
cores. This skeletal ferrite is called vermicular ferrite. In addition to vermicular ferrite,
primary delta ferrite dendrites can also transform to lathy or lacy ferrite upon cooling into
the (δ + γ) two-phase region, as shown in figure 14c.
Plaut el al. (2007) and Kou (2003) further elaborate on the primary ferrite and austenite
solidification modes and their transformation path in greater detail. According to Plaut
and Kou, the primary austenitic solidification mode can be sub-divided into two modes.
The two modes of primary austenite solidification modes are namely;
• Primary austenitic solidification mode (A), which follows the solidification sequence L
→ L + γ → γ phase transformation. In this solidification mode, no delta ferrite exists
in the microstructure.
• Austenitic-ferritic solidification mode (AF), where the ferrite present is eutectic ferrite
and follows the solidification sequence L→ L + γ → L+ γ + δ → γ + δ phase
transformation.
The primary ferrite solidification mode can be further sub-divided into three modes and
these modes are namely;
• Ferritic-austenitic solidification mode (FA), where the ferrite present is vermicular
(skeletal) ferrite. Mode FA follows the solidification sequence L→ L + δ → L + δ + γ
→ γ+ δ phase transformation.
• Ferritic-austenitic solidification mode (FA), where the ferrite is a lathy ferrite. Here
the two FA modes follow the same solidification sequence L→ L + δ → L + δ + γ →
γ + δ phase transformation.

- 48 -
• Ferritic solidification mode is the primary ferrite solidification mode (F), where the
ferrite is present as Widmanstätten patterns. Mode F follows the solidification
sequence L → L + δ → δ phase transformation. In this mode, no austenite exists in
the microstructure.
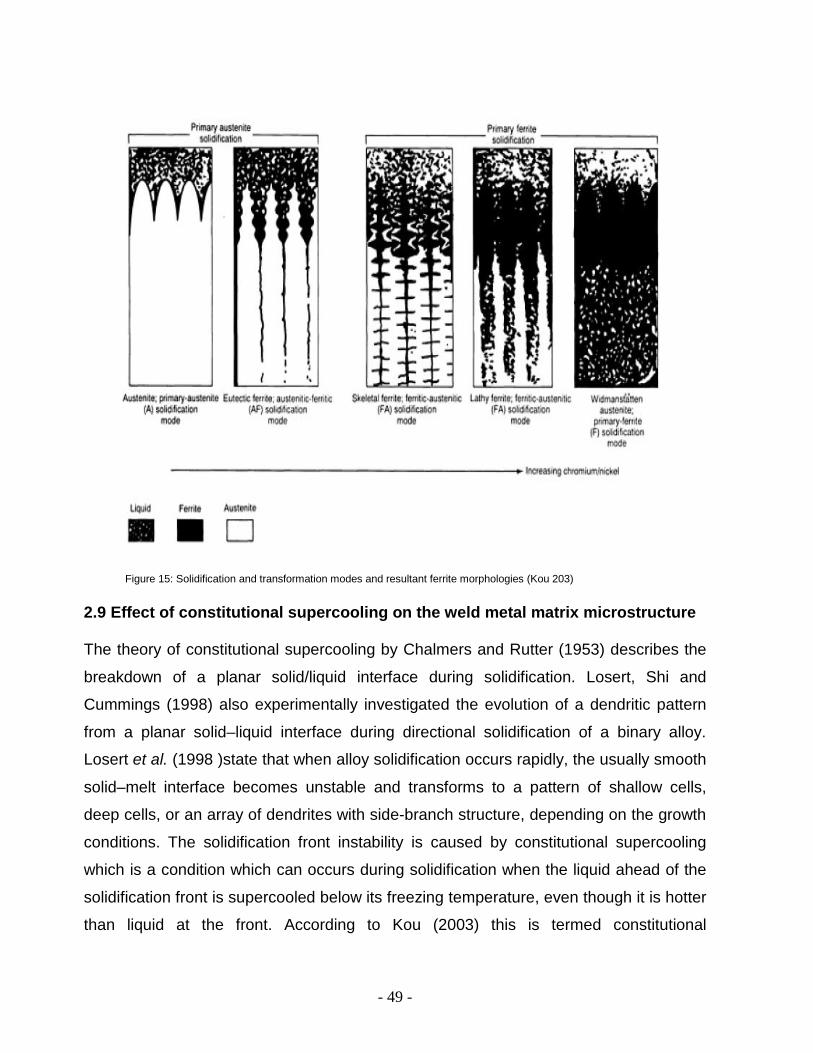
Figure 15 shows these five above mentioned solidification modes and the different
ferrite morphologies in greater detail. The solidification mode sequence can also be
predicted using the chromium and nickel equivalent ratio apart from predictions using
the Fe-Cr-Ni pseudo-binary phase diagram (Plaut, Herrera, Escriba, Rios & Padihla,
2007). The work of Korinko & Malene (2001) recommended that a calculated Creq/Nieq
ratio range of 1.52 to 1.9 be maintained to control the primary mode of solidification as
ferrite-austenite (FA) in order to prevent solidification cracks in type 304L stainless
steel. Primary austenite solidification will occur when the Creq/Nieq ratio is less than 1.48
and primary ferrite solidification will occur when this ratio is greater than 1.48 (Folkhard,
Rabensteiner, Perteneder, Schabereiter & Tosch, 1984). Earlier work by Elmer et al.
(1989) supports the work of Korinko and Malene (2001) and Folkhard et al. (1984) by
pointing out that alloys with a low Creq/Nieq ratio solidify with austenite as the first phase
before any ferrite, prior to the alloy entering the three-phase eutectic triangle of the Fe-
Cr-Ni pseudo-binary phase diagram, and furthermore that their ferrite content will
decrease with increasing in cooling rates because, solute redistribution during
solidification is reduced when cooling rates are high. These low Creq/Nieq ratio alloys will
therefore not have a sufficient amount of delta ferrite to prevent hot solidification
cracking. On the other hand, when the Creq/Nieq ratio of the alloy is high, the alloy will
solidify with ferrite as the first phase before any austenite, prior to the alloy entering the
three-phase eutectic triangle of the Fe-Cr-Ni pseudo-binary phase diagram.
Furthermore, the ferrite content of the high Creq/Nieq ratio alloy will increase with
increasing cooling rates because the delta ferrite to austenite transformation has less
time to occur at high cooling rates. These high Creq/Nieq alloys will therefore contain
sufficient delta ferrite in their structure to prevent hot solidification cracking.
- 49 -
2.9 Effect of constitutional supercooling on the weld metal matrix microstructure
The theory of constitutional supercooling by Chalmers and Rutter (1953) describes the
breakdown of a planar solid/liquid interface during solidification. Losert, Shi and
Cummings (1998) also experimentally investigated the evolution of a dendritic pattern
from a planar solid–liquid interface during directional solidification of a binary alloy.
Losert et al. (1998 )state that when alloy solidification occurs rapidly, the usually smooth
solid–melt interface becomes unstable and transforms to a pattern of shallow cells,
deep cells, or an array of dendrites with side-branch structure, depending on the growth
conditions. The solidification front instability is caused by constitutional supercooling
which is a condition which can occurs during solidification when the liquid ahead of the
solidification front is supercooled below its freezing temperature, even though it is hotter
than liquid at the front. According to Kou (2003) this is termed constitutional
Figure 15: Solidification and transformation modes and resultant ferrite morphologies (Kou 203)

- 50 -
supercooling, to emphasize that it arises from variations in liquid composition. As
constitutional supercooling increases, the solidification mode of the matrix will also
change. As seen in figure 16 the change will happen from planar (region A) to cellular
(region B) and from cellular to columnar dendritic (region C) and then to region D where
a equiaxed dendritic structure will exist. The region where dendrites, whether they be
columnar or equiaxed, and the liquid phase coexist is often called the mushy zone. At a
very high degree of constitutional supercooling the mushy zone can become so wide
that heterogeneous nucleation of equiaxed dendrites is easier than columnar dendrites
that would have to stretch all the way across the mushy zone (Kou 2003).
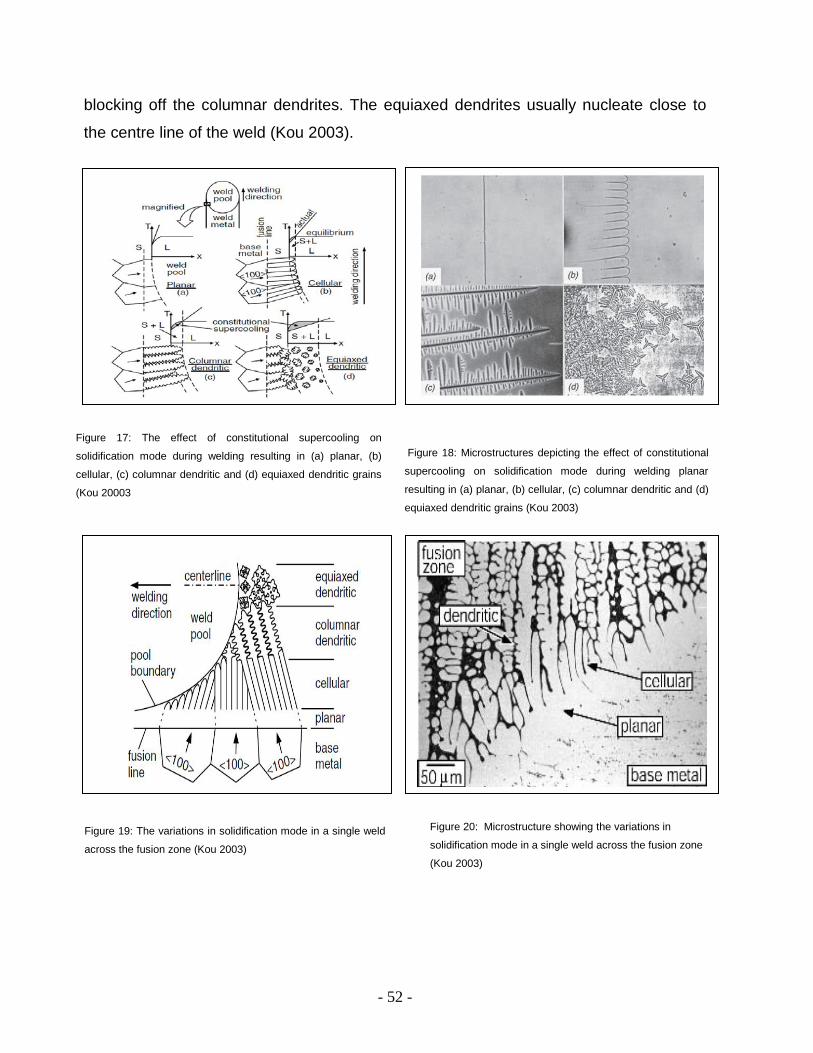
The Schematic in figure 17 and microstructures in figure 6 show more clearly the effect
of constitutional supercooling on the microstructure within the grains of the weld metal.
The changes in solidification mode of the matrix from (a) planar to (b) cellular , columnar
(c) dendritic, and (d) equiaxed dendritic can be seen as the degree of constitutional
supercooling at the pool boundary increases. Constitutional supercooling therefore
Figure 16: The effect of constitutional super-cooling on solidification mode on the (a) planar, (b) cellular, (c) columnar dendritic and (d)
equiaxed dendritic grains 0f the weld metal (Kou 2003)
- 51 -
increases in figure 16, 17 and 18 from a-d. Heterogeneous nucleation aided by
constitutional supercooling promotes the formation of equiaxed grains in the weld metal.
While the solidification mode can vary from one weld to another as shown in figure 17
and figure 18, it can also vary within a single weld from the fusion line to the centerline
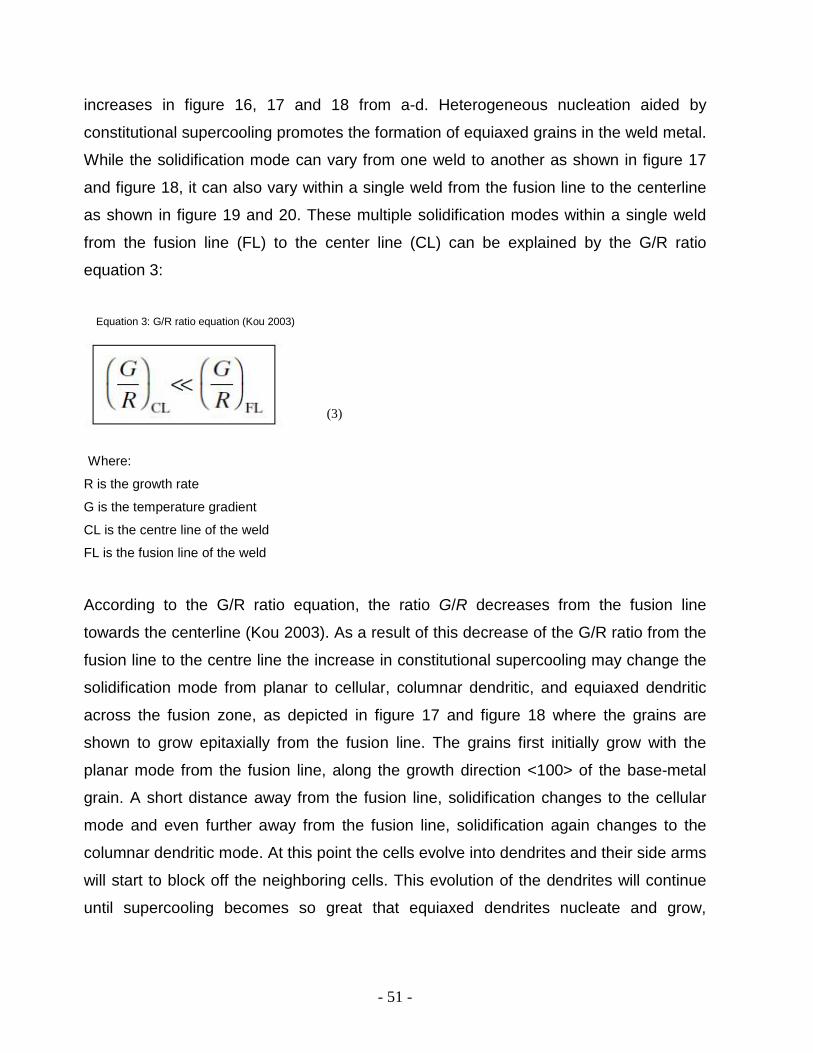
as shown in figure 19 and 20. These multiple solidification modes within a single weld
from the fusion line (FL) to the center line (CL) can be explained by the G/R ratio
equation 3:
Where:
R is the growth rate
G is the temperature gradient
CL is the centre line of the weld
FL is the fusion line of the weld
According to the G/R ratio equation, the ratio G/R decreases from the fusion line
towards the centerline (Kou 2003). As a result of this decrease of the G/R ratio from the
fusion line to the centre line the increase in constitutional supercooling may change the
solidification mode from planar to cellular, columnar dendritic, and equiaxed dendritic
across the fusion zone, as depicted in figure 17 and figure 18 where the grains are
shown to grow epitaxially from the fusion line. The grains first initially grow with the
planar mode from the fusion line, along the growth direction <100> of the base-metal
grain. A short distance away from the fusion line, solidification changes to the cellular
mode and even further away from the fusion line, solidification again changes to the
columnar dendritic mode. At this point the cells evolve into dendrites and their side arms
will start to block off the neighboring cells. This evolution of the dendrites will continue
until supercooling becomes so great that equiaxed dendrites nucleate and grow,
Equation 3: G/R ratio equation (Kou 2003)
(3)
- 52 -
blocking off the columnar dendrites. The equiaxed dendrites usually nucleate close to
the centre line of the weld (Kou 2003).
Figure 19: The variations in solidification mode in a single weld
across the fusion zone (Kou 2003) Figure 20: Microstructure showing the variations in
solidification mode in a single weld across the fusion zone
(Kou 2003)
Figure 17: The effect of constitutional supercooling on
solidification mode during welding resulting in (a) planar, (b)
cellular, (c) columnar dendritic and (d) equiaxed dendritic grains
(Kou 20003
Figure 18: Microstructures depicting the effect of constitutional
supercooling on solidification mode during welding planar
resulting in (a) planar, (b) cellular, (c) columnar dendritic and (d)
equiaxed dendritic grains (Kou 2003)

- 53 -
2.10 Sigma phase transformations In the as-welded condition type 304H stainless steels do not normally contain any sigma
phase because the rapid cooling rate retains the microstructure existing at very high
temperature where sigma phase does not form. However after long-term exposure at
elevated service temperatures between 550-900°C delta ferrite in the weld metal
transforms into sigma, chi and laves phases (Castro & de Cadanet, 1975). Of the
aforementioned three delta ferrite transformation phases, sigma phase has been
studied the most. Transformation to sigma phase is most rapid in the 800-850°C range.
Sigma phase forms in austenitic stainless steels containing more than 16 wt%
chromium, but less than 32 wt% nickel. The sigma phase has a complex tetragonal
structure with 30 atoms per unit cell (Sedriks 1996). Sigma forms very slowly when
forming from the austenite phase in the 300 series austenitic stainless steels, first
developing at the grain boundaries. Its formation is favoured by high chromium
contents, silicon, molybdenum, titanium, small grain size and cold work (Sedriks 1996).
The sigma phase is the most deleterious of the delta ferrite transformation phases but
can require exposure times of thousands of hours, or even of several ten thousands of
hours at the temperature range of its formation for the mechanical consequences of
sigma formation to become apparent. The presence of sigma phase increases
hardness, but it decreases ductility, notch toughness and localized pitting corrosion
resistance. The loss of ductility and toughness due to sigma phase, is generally
intolerant at temperatures under 120-150°C but has little effect on these properties in
the temperature range where it forms (Jorge, Hau & Seijas, 2006). The embrittlement
resulting from the nucleation of ferrite is important only when this phase is present in
sufficient quantity to form a continuous network, as the sigma phase then creates a path
for brittle fracture.
2.10.1 Factors that Influence delta ferrite to sigma phase transformation in weld metal
There are a number of factors that influence the presence of delta ferrite and its quantity
in weld metal. For ferrite to be formed in an austenitic weld, certain compositional and
microstructural conditions are required.

- 54 -
2.10.1.1 Compositional conditions
The structure of a weld after complete cooling depends on the quantity of ferrite which
formed at very high temperatures, and consequently upon relative proportions of
austenite formers and ferrite formers. The combination of the base material and welding
consumable can be either strong, intermediate or non-ferrite forming. As mentioned,
sigma phase formation is promoted by strong ferrite formers and suppressed by strong
austenite formers.
2.10.1.2 Structural conditions
The microstructure of welds cooled in still air can facilitate the formation of compounds
in steel, for example sigma phase. These compounds have such a composition that
they would not form in the same alloy when forged and quenched from annealing
temperatures. This is because segregation during cooling can locally raise the
concentration of ferrite formers, therefore promoting the formation of ferrite and sigma
type compounds without the necessity of extensive diffusion. This is especially true in
the case of austenitic-ferritic welds, because delta ferrite is richer in ferrite formers than
austenite; moreover diffusion rates are higher in ferrite than what they are in austenite.
Transformation to sigma phase is therefore more rapid when it is formed from ferrite
than austenite. It is even possible that, when the weld deposit contains a high proportion
of elements that accelerate the formation of intermetallic compounds, the ferrite that is
present from the initial weld runs is transformed into sigma phase by reheating in to the
550-900°C sigma forming temperature range during deposition of subsequent passes.
This transformation can happen by eutectoid type decomposition (Castro & de Cadanet,
1975).The schematic in figure 19a-d, reveals the transformation sequence of delta
ferrite (δ) islands into sigma phase (σ) and the precipitation sequence of sigma phase
on grain boundaries as exposure time increases. In figure 21a, the islands of delta
ferrite that have nucleated in the austenite matrix are observed. In 21b, shows that
sigma phase is starts to transform within the nucleated delta ferrite islands. Figure 21c,
shows that that next preferred sigma phase nucleation site is on the triple points of the
grain boundaries. Figure 21d, shows that once the delta ferrite islands and triple points

- 55 -
are saturated with sigma phase, the next preferred sigma phase nucleation site is the
actual grain boundaries. It is important to note that the precipitation mechanisms at the
different sites are not the same, for instance; the delta ferrite seems to decompose by
means of a eutectoid reaction (ferrite -> sigma + austenite) while at the grain
boundaries and triple points precipitation occurs by the traditional precipitation
mechanism (Plaut et al. 2007).
2.11 Measurement & Predictive Estimation of Delta Ferrite in Weld Metal Deposits
2.11.1 Methods and difficulties in measurement of delta ferrite
There are several methods of measuring ferrite; some of the commonly used methods
are:
• Metallographic evaluation
• X-ray diffraction
• Magnetic permeability
• Magnetic determination
• Calculation of ferrite from chemistry.
Figure 21: Sigma phase precipitation in an austenitic stainless steel containing delta ferrite (Escriba el al, 2006)

- 56 -
2.11.1.1 Metallographic evaluation
The metallographic method was initially used as the primary method to quantify the
amount of delta ferrite present in weld metal.
Difficulty: The statistical accuracy of this method, which was done by point counting,
was however highly influenced by the ferrite colony size. The introduction of automated
techniques had done little to improve upon operator variances. The biggest deterrent
from using this method to quantify ferrite content for the entire sample was the
observation that changes in ferrite content within the same substrate made
quantification representative of the entire sample difficult.
2.11.1.2 X-ray diffraction
The use of x-ray diffraction as a ferrite measurement technique can also be used.
Difficulty: The limitation with this technique is that the diffraction patterns tend to diffuse
in nature and are subject to interpretation which makes this method very subjective.
Consistent accuracy is therefore a challenge using this technique.
2.11.1.3 Magnetic permeability measurements
Ferrite quantification through magnetic permeability measurements is another method
that can be utilized to quantify the amount of ferrite present. Magnetic permeability is
proportional to ferrite percentage or ferrite number and can be measured with the aid of
a Severn Gage. This method requires that a magnetic field be induced on the substrate
and the resulting field strength be measured to establish the magnetic permeability.
With this technique, the overall permeability of a two phase alloy containing one
ferromagnetic and one non-ferromagnetic phase depends on the individual permeability,
the content and demagnetization factor of the ferromagnetic phase at a given strength
of the magnetizing field (Priceputu et al. 2011).

- 57 -
2.11.1.4 Magnetic determination
The magnetic determination method can also be used to quantify the ferrite present.
Magnetic determinations are done with the use of a ferrite scope to quantify the amount
of ferrite present in the sample and give the ferrite content by producing a ferrite
percentage or ferrite number. An experiment by Lundin, Chou & Sullivan (1980)
measured the ferrite content using this technique. In order to minimize the error due to
weld metal inhomogeneity, the average value of 15 determinations was taken from
different locations in the centre, and four inches along the pad was used. The ferrite
number readings were made on all ground pads using an Aminco-Brenner Magne
Gage.
2.11.1.5 Calculation of ferrite from chemistry
Ferrite quantity can also be predicted from the weld metal chemistry. Ferrite
determination from chemistry has been extensively used in industry and is considered a
statistically viable option for ferrite prediction. Schaeffler, DeLong and the World
Research Council (1992) introduced constitution diagrams as a non-destructive method
to relate alloy composition to the amount of ferrite present in an alloy. Schaeffler-
DeLong and Delong-WRC diagrams are simple graphical methods as long as the
values calculated are not too high. Schaeffler (1949) first studied quantitatively the
effect of these elements upon the structure, and particularly upon the ferrite content of
weld metals deposited under well-defined thermal conditions (Castro & de Cadanet,
1975). Schaeffler (1949) published what has become known as the Schaeffler diagram
in Figure 22. This diagram proposed a relationship among alloy elements that promote
the formation of ferrite (chromium-equivalent elements) and elements that promote the
formation of austenite and the suppression of ferrite (nickel-equivalent elements). To
use this diagram, both the chromium and nickel equivalents are first calculated from the
composition of a given weld bead and these equivalents are then plotted as coordinates
on the Schaeffler constitution diagram. This allows an estimated weld-metal
microstructure to be determined from the boundaries given in the diagram (ASM, 1993).

- 58 -
DeLong (1974) recognized the effect of nitrogen in promoting austenite at the expense
of ferrite. This is because nitrogen, as a strong austenite phase promoter, retards the
formation of ferrite. He developed the DeLong diagram in figure 23 that covered a more-
restricted composition range than the Schaeffler diagram but included the effect of
nitrogen. Delong’s work therefore increased the accuracy of the Schaeffler diagram and
revealed that, for a given chemistry, his estimations predicted increased ferrite over that
of Schaeffler.
In 1974 the DeLong diagram in figure 23 was published and in that same year, the
measurement of ferrite in austenitic stainless steel weld metals was standardized by the
ANSI/AWS A4.2 specification. This meant that ferrite number determinations moved
towards magnetically determined ferrite numbers (FN), rather than the
metallographically determined "percent ferrite" used by the Schaeffler diagram (ASM
1993).
The DeLong diagram became part of the "Boiler and Pressure Vessel Code" of the
American Society of Mechanical Engineers (ASME) but was subsequently replaced by
the WRC diagrams in the 2005 publication of the ASME boiler pressure vessel code.
Figure 22: Schaeffler constitution diagram for stainless steel weld metal (Schaeffler, 1949)

- 59 -
The Schaeffler and Delong diagrams were replaced by the WRC-1988 and
subsequently the WRC-1992 diagram in figure 24 because they were found to contain a
number of flaws.
According to Siewert, McCowan and Olson (1989) the WRC-1988 diagram accounted
for the following flaws in the Schaeffler and DeLong diagrams:
(i) The fact that the DeLong diagram is essentially a finely tuned subset of the
Schaeffer range, designed specifically for the 300-series stainless steel welds
containing small amounts of ferrite, was the first flaw. The refined nature of the
DeLong diagram forced engineers to reference the Schaeffler diagrams for alloys
containing more than 15 wt% ferrite. The DeLong diagram also gives a
relationship between the ferrite number and magnetic percentage ferrite content.
For ferrite content percentages of 4 and less, the ferrite number will be equivalent
to the ferrite content percentage.
Figure 23: DeLong constitution diagram for stainless steel weld metal, the Schaeffler austenite-martensite boundary
is included for reference (Long & De Long, 1974)
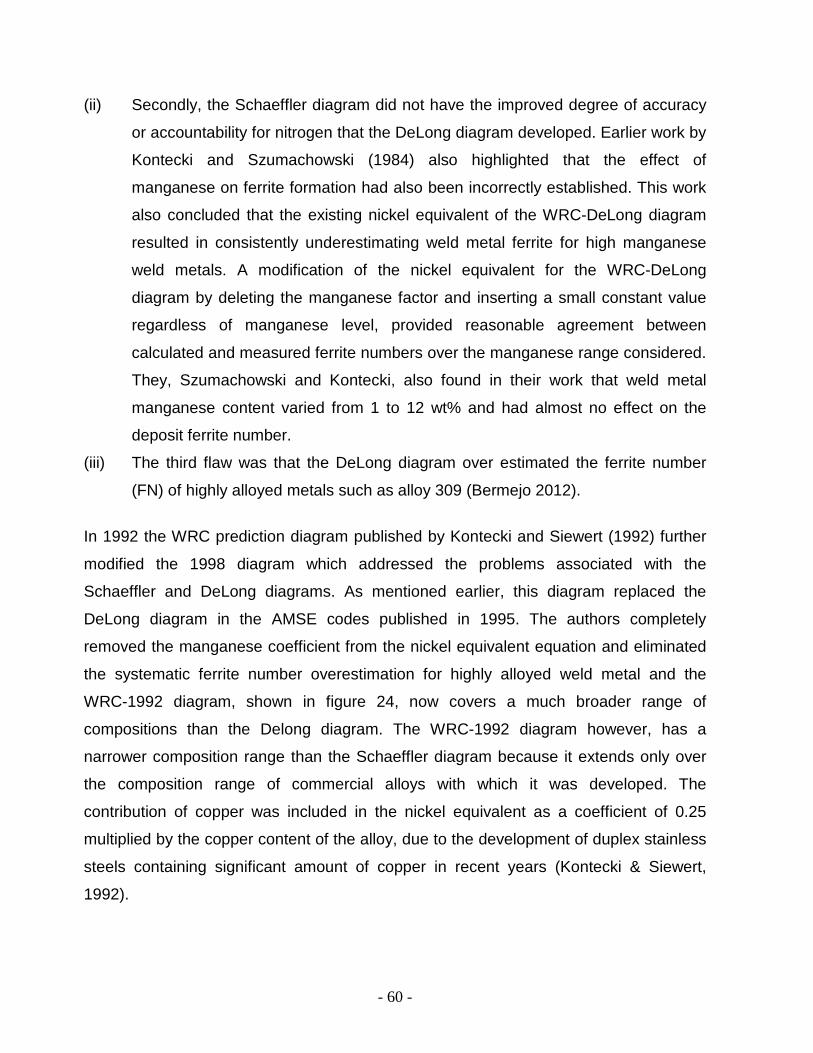
- 60 -
(ii) Secondly, the Schaeffler diagram did not have the improved degree of accuracy
or accountability for nitrogen that the DeLong diagram developed. Earlier work by
Kontecki and Szumachowski (1984) also highlighted that the effect of
manganese on ferrite formation had also been incorrectly established. This work
also concluded that the existing nickel equivalent of the WRC-DeLong diagram
resulted in consistently underestimating weld metal ferrite for high manganese
weld metals. A modification of the nickel equivalent for the WRC-DeLong
diagram by deleting the manganese factor and inserting a small constant value
regardless of manganese level, provided reasonable agreement between
calculated and measured ferrite numbers over the manganese range considered.
They, Szumachowski and Kontecki, also found in their work that weld metal
manganese content varied from 1 to 12 wt% and had almost no effect on the
deposit ferrite number.
(iii) The third flaw was that the DeLong diagram over estimated the ferrite number
(FN) of highly alloyed metals such as alloy 309 (Bermejo 2012).
In 1992 the WRC prediction diagram published by Kontecki and Siewert (1992) further
modified the 1998 diagram which addressed the problems associated with the
Schaeffler and DeLong diagrams. As mentioned earlier, this diagram replaced the
DeLong diagram in the AMSE codes published in 1995. The authors completely
removed the manganese coefficient from the nickel equivalent equation and eliminated
the systematic ferrite number overestimation for highly alloyed weld metal and the
WRC-1992 diagram, shown in figure 24, now covers a much broader range of
compositions than the Delong diagram. The WRC-1992 diagram however, has a
narrower composition range than the Schaeffler diagram because it extends only over
the composition range of commercial alloys with which it was developed. The
contribution of copper was included in the nickel equivalent as a coefficient of 0.25
multiplied by the copper content of the alloy, due to the development of duplex stainless
steels containing significant amount of copper in recent years (Kontecki & Siewert,
1992).

- 61 -
Work by Lippold and Savage (1982) shows that the solidification mode of austenitic
stainless steels is more accurate than the FN for predicting resistance to solidification
cracking. This is because during solidification as primary delta ferrite, more phosphorus
and sulphur are absorbed into the delta ferrite before it transforms to austenite resulting
in greater dispersion of these harmful elements in the microstructure. For this reason,
solidification mode boundaries, depicted as broken lines in figure 24, were included in
the WRC-1992 diagram. These lines enable the user to predict the primary solidification
mode of austenitic welds. The A and AF phase fields on the diagram denote primary
austenite solidification. Alloys in these areas will potentially be susceptible to
solidification cracking. Alloys situated in the F and FA phase fields solidify as primary
delta ferrite and will be resistant to hot cracking. The phase fields in figure 24 are
explained in detail as follows:
• Area A denotes primary solidification as austenite with no further transformation
down to room temperature (high Nieq).
• Area AF denotes primary solidification as austenite with subsequent partial
transformation to ferrite on cooling (slightly high Nieq).
• Area FA denotes primary solidification as ferrite with subsequent partial
transformation to austenite (slightly high Creq) representing the favoured solidification
mode.
• Area F denotes primary solidification as ferrite with no further transformation (high
Creq).

- 62 -
2.12 Control of Ferrite Content/Ferrite Number
2.12.1 Heat Input Heat input to the base metal or underlying weld beads must be restricted when
conditions can induce corrosion due to sensitization or embrittlement due to sigma
formation. In this respect, the submerged arc welding and pulsed spray MIG welding
processes have disadvantages because of the high heat input of these processes.
These high heat input welding processes require the use of filler wires with higher a
ferritic tendency than moderate energy processes to prevent hot cracking during
solidification (Castro & de Cadanet, 1975). A case study looking into weld cracking in a
72 inch stainless steel duct using SMAW and SAW conducted by Wilks (2002)
supported this higher ferritic tendency filler wire requirement for the high heat input
processes. He showed that virtually all circumferential and longitudinal welds done with
SAW contained significant cracks while the welds done with SMAW contained no
cracks. The cracks evaluated generally propagated down the centerline of the weld, but
fracture deviated along the details of the weld solidification structures. These
solidification structures contained impurity concentrations along the grain boundaries as
Figure 24: WRC-1992 constitution diagram (Kontecki and Siewert, 1992)
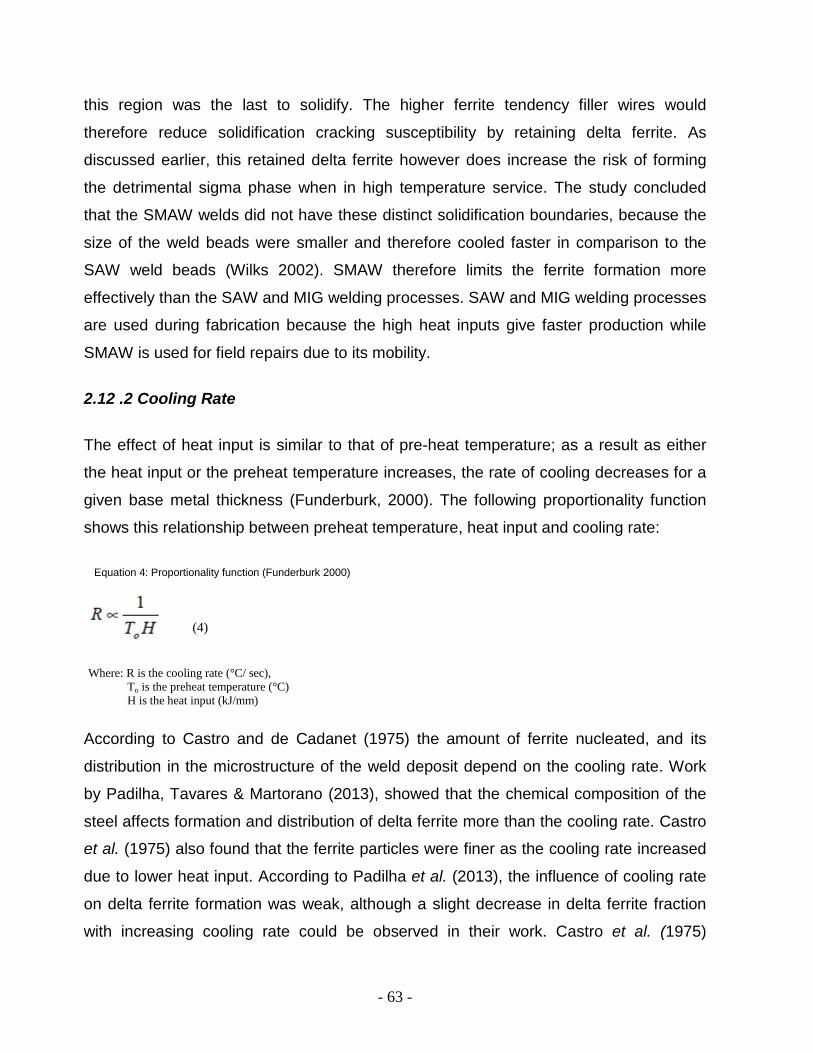
- 63 -
this region was the last to solidify. The higher ferrite tendency filler wires would
therefore reduce solidification cracking susceptibility by retaining delta ferrite. As
discussed earlier, this retained delta ferrite however does increase the risk of forming
the detrimental sigma phase when in high temperature service. The study concluded
that the SMAW welds did not have these distinct solidification boundaries, because the
size of the weld beads were smaller and therefore cooled faster in comparison to the
SAW weld beads (Wilks 2002). SMAW therefore limits the ferrite formation more
effectively than the SAW and MIG welding processes. SAW and MIG welding processes
are used during fabrication because the high heat inputs give faster production while
SMAW is used for field repairs due to its mobility.
2.12 .2 Cooling Rate
The effect of heat input is similar to that of pre-heat temperature; as a result as either
the heat input or the preheat temperature increases, the rate of cooling decreases for a
given base metal thickness (Funderburk, 2000). The following proportionality function
shows this relationship between preheat temperature, heat input and cooling rate:
According to Castro and de Cadanet (1975) the amount of ferrite nucleated, and its
distribution in the microstructure of the weld deposit depend on the cooling rate. Work
by Padilha, Tavares & Martorano (2013), showed that the chemical composition of the
steel affects formation and distribution of delta ferrite more than the cooling rate. Castro
et al. (1975) also found that the ferrite particles were finer as the cooling rate increased
due to lower heat input. According to Padilha et al. (2013), the influence of cooling rate
on delta ferrite formation was weak, although a slight decrease in delta ferrite fraction
with increasing cooling rate could be observed in their work. Castro et al. (1975)
Where: R is the cooling rate (°C/ sec), To is the preheat temperature (°C) H is the heat input (kJ/mm)
(4)
Equation 4: Proportionality function (Funderburk 2000)
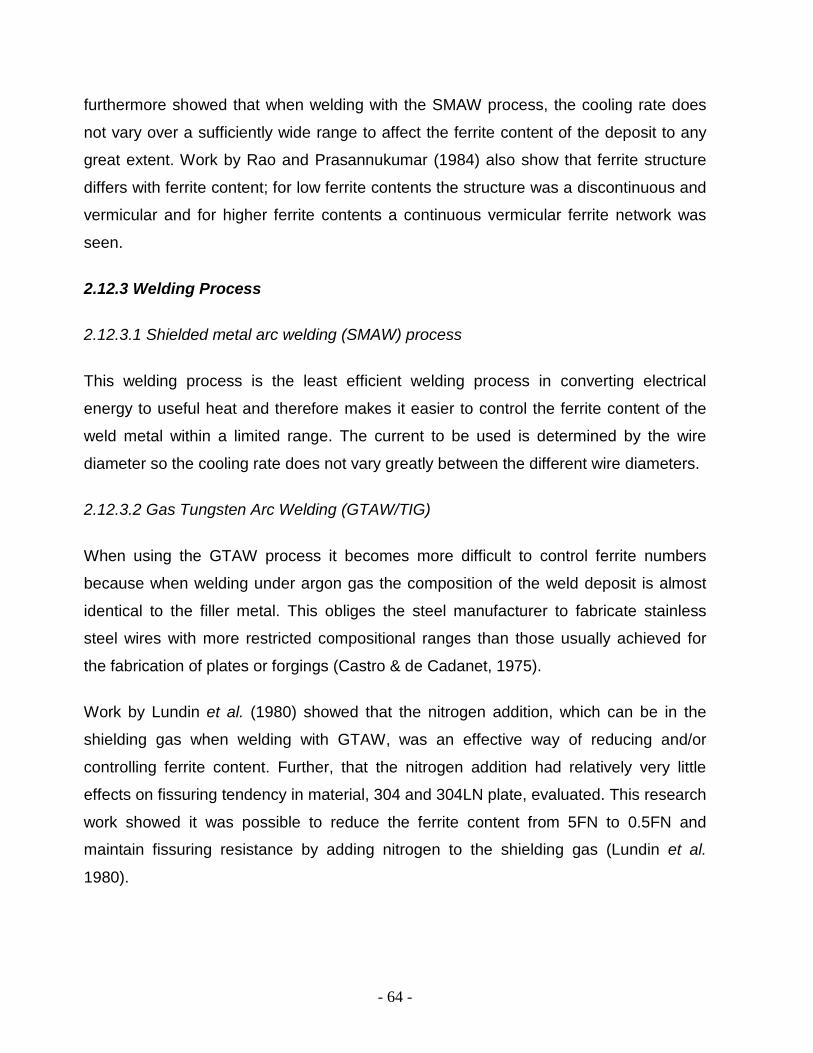
- 64 -
furthermore showed that when welding with the SMAW process, the cooling rate does
not vary over a sufficiently wide range to affect the ferrite content of the deposit to any
great extent. Work by Rao and Prasannukumar (1984) also show that ferrite structure
differs with ferrite content; for low ferrite contents the structure was a discontinuous and
vermicular and for higher ferrite contents a continuous vermicular ferrite network was
seen.
2.12.3 Welding Process
2.12.3.1 Shielded metal arc welding (SMAW) process
This welding process is the least efficient welding process in converting electrical
energy to useful heat and therefore makes it easier to control the ferrite content of the
weld metal within a limited range. The current to be used is determined by the wire
diameter so the cooling rate does not vary greatly between the different wire diameters.
2.12.3.2 Gas Tungsten Arc Welding (GTAW/TIG)
When using the GTAW process it becomes more difficult to control ferrite numbers
because when welding under argon gas the composition of the weld deposit is almost
identical to the filler metal. This obliges the steel manufacturer to fabricate stainless
steel wires with more restricted compositional ranges than those usually achieved for
the fabrication of plates or forgings (Castro & de Cadanet, 1975).
Work by Lundin et al. (1980) showed that the nitrogen addition, which can be in the
shielding gas when welding with GTAW, was an effective way of reducing and/or
controlling ferrite content. Further, that the nitrogen addition had relatively very little
effects on fissuring tendency in material, 304 and 304LN plate, evaluated. This research
work showed it was possible to reduce the ferrite content from 5FN to 0.5FN and
maintain fissuring resistance by adding nitrogen to the shielding gas (Lundin et al.
1980).
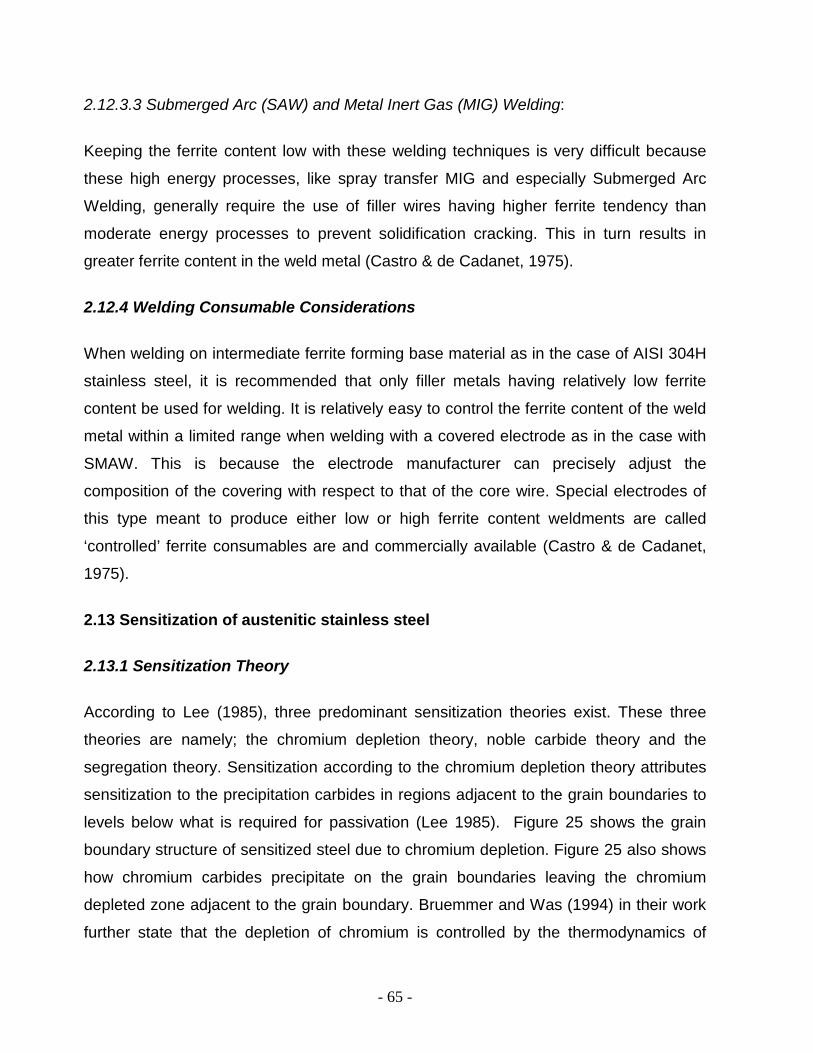
- 65 -
2.12.3.3 Submerged Arc (SAW) and Metal Inert Gas (MIG) Welding:
Keeping the ferrite content low with these welding techniques is very difficult because
these high energy processes, like spray transfer MIG and especially Submerged Arc
Welding, generally require the use of filler wires having higher ferrite tendency than
moderate energy processes to prevent solidification cracking. This in turn results in
greater ferrite content in the weld metal (Castro & de Cadanet, 1975).
2.12.4 Welding Consumable Considerations
When welding on intermediate ferrite forming base material as in the case of AISI 304H
stainless steel, it is recommended that only filler metals having relatively low ferrite
content be used for welding. It is relatively easy to control the ferrite content of the weld
metal within a limited range when welding with a covered electrode as in the case with
SMAW. This is because the electrode manufacturer can precisely adjust the
composition of the covering with respect to that of the core wire. Special electrodes of
this type meant to produce either low or high ferrite content weldments are called
‘controlled’ ferrite consumables are and commercially available (Castro & de Cadanet,
1975).
2.13 Sensitization of austenitic stainless steel
2.13.1 Sensitization Theory
According to Lee (1985), three predominant sensitization theories exist. These three
theories are namely; the chromium depletion theory, noble carbide theory and the
segregation theory. Sensitization according to the chromium depletion theory attributes
sensitization to the precipitation carbides in regions adjacent to the grain boundaries to
levels below what is required for passivation (Lee 1985). Figure 25 shows the grain
boundary structure of sensitized steel due to chromium depletion. Figure 25 also shows
how chromium carbides precipitate on the grain boundaries leaving the chromium
depleted zone adjacent to the grain boundary. Bruemmer and Was (1994) in their work
further state that the depletion of chromium is controlled by the thermodynamics of

- 66 -
carbide formation and differences between the diffusivities of chromium and carbon and
that carbide formation occurs in a temperature range where carbides are
thermodynamically stable and chromium diffusion is sufficiently rapid for carbide
nucleation and growth in a finite time frame. A method of illustrating precipitation
behavior is by the use of a time-temperature precipitation (TTP) diagram which is shown
in Figure 26. The TTP diagram shows that carbide nucleation and growth occurs first in
the chromium rich delta ferrite and on the delta ferrite-austenite boundary, followed by
precipitation at high angle grain boundaries, incoherent twin boundaries and finally, at
coherent twins. The diagram shown in Figure 26 specifically for 304 type austenitic
stainless steel but trends time-temperature precipitation diagrams are also available for
316 SS, duplex alloys and high-chromium stainless steels. It is important to note that
delta ferrite will not be present in all alloys, but is possible in many austenitic stainless
steels depending on bulk composition and processing treatment. Carbon is an
extremely effective austenite stabilizer, and its content is a critical factor in determining
whether ferrite will remain in 304 type stainless steel. The effect of carbon content on
the isothermal precipitation of M23C6 chromium carbides in 304 type austenitic stainless
steels is shown in the time-temperature sensitization (TTS) curves in figure 27. Figure
27 shows that as carbon content decreases, the time required for sensitization
increases while as temperature required for sensitization decreases.
Figure 25: Grain boundary structure of sensitized steel (Kou 2003)
- 67 -
Figure 26: Time-temperature-precipitation (TTP) for 304 type stainless steel (Stickler & Vincier, 1961)
Figure 27: Time-temperature-sensitization (TTS) carbide precipitation curves for type 304 stainless steel (Nickel Institute, 1992).

- 68 -
2.13.2 Low Temperature HAZ Sensitization (LTS) behaviour
Low temperature sensitization occurs in the localized heat affected zone (HAZ) adjacent
to the weld upon welding austenitic stainless steel (Povich 1978). Tedmon et al. (1971)
noted that the “local” equilibrium concentration of chromium in the precipitated
chromium carbide decreases considerably as sensitization temperature decreases. It is
important to note that Tedmon (1971) was first to separate the “nucleation” and
“diffusion” reactions of chromium depletion. Schmidt et al. (1983) quantified the
compositions of the chromium carbide particle formed during low temperature
sensitization (LTS) at temperatures below 500°C to contain 28 wt% chromium,
compared to carbides formed at higher temperatures, 600-800°C, which contain 70-95
wt% chromium. Low temperature sensitization-enhanced susceptibility to corrosion still
existed, even in the case where the chromium content of the carbide was only 28 wt%
because other mechanisms such as low temperature solute segregation may contribute
to the increased susceptibility toward corrosion (Schmidt et al., 1983).
Work by Andresen, Solomon and Taylor (1981) showed that slow cooling rates required
to produce sensitization in 304L and 316L are not normally encountered during
conventional welding practices. The American Petroleum Institute (API) recommended
practice 852 (2009), which gives welding guidelines for chemical, oil and gas industries
recommends a maximum welding inter-pass temperature of 175°C to prevent low
temperature sensitization during welding for welding austenitic stainless steels.
Tedmon’s (1971) work which separated the nucleation and diffusion reactions of carbide
precipitation and growth showed that carbides may be nucleated by “brief” exposure to
temperatures in the normal sensitization range, as experienced during welding, without
a detrimental degree of chromium depletion. Povich (1978) conducted quantitative TEM
studies on a welded section that underwent a low temperature heat treatment directly
after welding. The quantitative TEM studies concluded that no “new” carbides nucleated
during low temperature heat treating carbides and that the carbides nucleated during
welding increased in size after the heat treatment. The relevance of LTS to industrial
processes may be described as follows: When type 304 stainless steel components are
welded together, carbides are nucleated in the HAZ but produce very limited

- 69 -
sensitization. However, after many years at process operating temperatures, the degree
of sensitization may progress via LTS to enhance the possibility that intergranular stress
corrosion cracking would occur (Povich 1978).
2.14 Etching of austenitic stainless steels
Metallographic etching is a technique used to highlight different metallurgical features of
metals at microscopic levels. Some of the features highlighted include grain boundaries,
phase differences and non-metallic inclusions (Petzow 1978). By studying the
character, quantity and distribution of these different metallurgical features, metallurgists
are capable of predicting and explaining physical properties and performance failures of
a given metal sample. An optical microscope with a magnification ranging between 50X
to 1000X is required to evaluate the metallurgical features of most metals. To evaluate
these metallurgical features, a metallic sample must be polished to a very fine mirror-
like finish and then etched in a chemical solution to create contrast needed between the
different phases and features of the metals microstructure. The chemical solutions used
are known as etchants and are used to selectively corrode some of the features. The
etched metallurgical features show up as darker regions. This is possible because
differences in the composition, structure or phase of a metal will create electrochemical
potentials that alter the relative rates of corrosion when exposed to an etchant. Metal
etching can be either electrolytic or chemical.
2.14.1 Electrolytic etching
According to Petzow (1978), electrolytic etching which is also known as anodic etching
applies electrical potential to the specimen using an external electrical circuit. Figure 28
shows a typical setup consisting of the specimen, which is the anode and its counter-
electrode, the cathode, immersed in an electrolyte. The electrolyte is the etchant that is
to be used. The voltage is regulated with a voltmeter. During electrolytic etching, the
specimen is submerged face-up in the electrolyte. The stainless steel cathode is the
placed in the electrolyte while the anode is placed on the surface of the specimen.

- 70 -
When the current is applied, the positive metal ions leave the specimen surface and
diffuse into the electrolyte; an equivalent number of electrons remain in the material.
This results in direct etching, shown as segment A—B of the current density versus
voltage curve in Fig 29. In segment A-B of figure 27, the specimen is dissolved without
the formation of a precipitated layer. Segment B-E of figure 27 shows the region of the
curve where an insoluble layer is precipitated on the surface of the anode, also known
as indirect etching. In segment B-E, metal ions leaving the material react with nonmetal
ions from the electrolyte and form an insoluble compound; the precipitated layers will
then form on the specimen surface (Petzow 1978). Direct or electrolytic etching
therefore involves the process of electrolysis, which is also the basis for electro-
polishing.
Figure 28: Basic laboratory setup for electrolytic etching and polishing (Petzow 1978)

- 71 -
Electrolytic etching using strong basic solutions produces coloured films and is widely
used with stainless steels to color delta ferrite or sigma phase. Electrolytic reagents,
which are often used in the etching of austenitic and duplex grades, provide great
control of the etching process and are highly reproducible (Bramfitt & Benscoter, 2002).
These electrolytic etching reagents are generally quite simple in composition. The
metallurgical feature selectivity of various hydroxide electrolytic etching reagents has
been shown in table 9. Strong hydroxide etching solutions attack sigma phase
preferentially to carbides and weak hydroxide solutions attack carbides much more
readily than sigma phase. Therefore, to reveal sigma phase, 10 N KOH or 20% NaOH is
employed, and to reveal carbides, concentrated ammonium hydroxide, NH4OH, is used.
Table 8 below shows some etchants that can be used for electrolytic etching of
stainless steel to reveal delta ferrite and sigma phase. Research conducted by Van der
Voort (2011), austenitic stainless steel underwent electrolytic etching in 20% NaOH,
caustic, at 3 Volts dc for 10 seconds. The delta ferrite was colored tan and blue while
the sigma phase was colored orange-brown with carbides visible, but not clearly etched
(Van der Voort 2011).
Figure 29: Idealized current density versus applied voltage for many common electrolytes with regions for electrolytic etching and polishing
as indicated (Petzow 1978)

- 72 -
Etching Reagent Comments
50g NaOH and 100ml H2O Electrolytic etch at 2-6 V dc, 5-10 s to reveal sigma
phase in austenitic grades
56g KOH and 100ml H2O Electrolytic etch at 1.5-3 V dc for 3 s to reveal
sigma phase (red-brown) and ferrite (Bluish). Chi
colored same as sigma.
20g NaOH and 100ml H2O Electrolytic etch at 20 V for 5-20 s to outline and
color delta ferrite tan
10ml HCl and 90ml methanol Electrolytic etch at 1.5 V dc, 20°C to attack sigma
phase. Use at 6 V dc for 3-5 s to reveal structure.
10g oxalic acid and 100ml H20 Popular electrolytic etch, 6 V dc, 25-mm spacing.
15-30 s reveals carbides, grain boundaries
revealed after 45-60 s; sigma phase outlines after 6
s. Lower voltage (1-3 V dc) can be used. Dissolves
carbides. Sigma strongly attacked. Austenite note
attacked. Good for revealing carbides. Use with
care under a hood.
2.14.2 Chemical etching Unlike electrolytic etching, normal etching does not require external current because the
etching solutions contain an oxidizing agent, such as nitric acid or hydrogen peroxide,
that takes the place of the electric current used in electrolytic etching. The elaborate
equipment used in electrolytic etching is therefore not required for chemical etching.
Uniform dissolution of the surface of a particular metal in a specific solution is due to the
presence of either a passivating oxide film or a viscous diffusion layer. The rates of
metal removal are high enough to remove scratches and deformation from fine grinding.
Chemical etching is a very versatile technique and can be applied to etching of round,
curved surfaces and for simultaneous etching of all of the sides of a square,
rectangular, or flat specimen. One major disadvantage is that a given volume of solution
can only polish a limited number of specimens as some solutions must be mixed fresh
and must be discarded immediately after use; they therefore cannot be stored as stock
solutions. Another disadvantage is that many of the etching solutions are dangerous to
Table 9: Electrolytic etchants for etching sigma phase, carbides and delta ferrite (Bramfitt & Benscoter,2002)

- 73 -
use with most having to be used under a chemical hood, to avoid contact with the
solution or its vapors. The sample can be held with tongs and submerged in the etching
solution for the etching operation. Some chemical etchants work better by swabbing and
with these chemical etchants; the solution is placed in a shallow, wide dish and the
solution is rubbed against the surface of the specimen using cotton that has dipped in
the etchant. With some specimen, the solution volume relative to the sample size is
important. Therefore, for best results, attention must be given to the technique. Most
specimens are ground to 600-grit SiC, although in a few instances, a coarser final grind
works best. In general, the finer the mechanical finish, the less time is required for
chemical polishing, and difficulties with pitting and other preferential attack are reduced.
A film sometimes forms on the specimen surface, which must be removed by treatment
with an appropriate solution. Table 10 lists some etchants that commonly used for the
chemical etching austenitic stainless steel.
Etching Reagent Comments
3 parts HCl, 2 parts glycerol, 1 part HNO3 Glyceregia. Popular etch for all stainless steel
grades. Use fresh; never store. Discard when
reagent is orange colored. Use with care under a
hood. Add HNO3 last. Swab a few seconds to a few
minutes. Attacks sigma phase, outlines carbides.
Substitution of water for glycerol increases attack
rate.
15ml HCl, 5ml HNO3 , 100ml H2O Dilute aqua regia for austenitic grades. Uniform
etching of austenite; outlines carbides, sigma
phase, and ferrite (sometimes attacked)
4g KMNO4 (potassium permanganate), 4g NaOH
and 100ml H2O
Groesbeck’s reagent. Use at 60-90°C to min.
Colors carbides dark, sigma phase gray, ferrite and
austenite not affected.
1g picric acid, 5ml HCl, 100ml ethanol Villela’s reagent. Use at room temperature to 1 min.
Outlines second-phase particles (carbides, sigma
phase, and delta ferrite); etches martensite. Can be
stored.
Table 10: Chemical etchants for etching sigma phase, carbides and delta ferrite (Bramfitt & Benscoter, 2002)
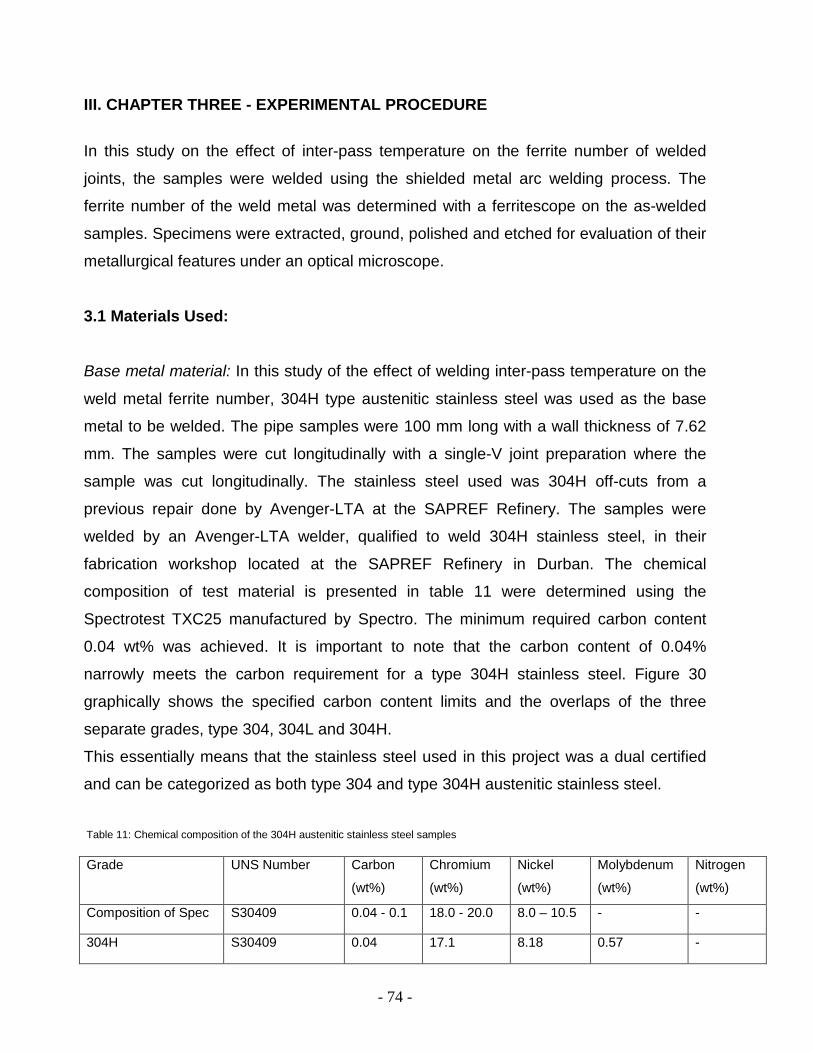
- 74 -
III. CHAPTER THREE - EXPERIMENTAL PROCEDURE
In this study on the effect of inter-pass temperature on the ferrite number of welded
joints, the samples were welded using the shielded metal arc welding process. The
ferrite number of the weld metal was determined with a ferritescope on the as-welded
samples. Specimens were extracted, ground, polished and etched for evaluation of their
metallurgical features under an optical microscope.
3.1 Materials Used: Base metal material: In this study of the effect of welding inter-pass temperature on the
weld metal ferrite number, 304H type austenitic stainless steel was used as the base
metal to be welded. The pipe samples were 100 mm long with a wall thickness of 7.62
mm. The samples were cut longitudinally with a single-V joint preparation where the
sample was cut longitudinally. The stainless steel used was 304H off-cuts from a
previous repair done by Avenger-LTA at the SAPREF Refinery. The samples were
welded by an Avenger-LTA welder, qualified to weld 304H stainless steel, in their
fabrication workshop located at the SAPREF Refinery in Durban. The chemical
composition of test material is presented in table 11 were determined using the
Spectrotest TXC25 manufactured by Spectro. The minimum required carbon content
0.04 wt% was achieved. It is important to note that the carbon content of 0.04%
narrowly meets the carbon requirement for a type 304H stainless steel. Figure 30
graphically shows the specified carbon content limits and the overlaps of the three
separate grades, type 304, 304L and 304H.
This essentially means that the stainless steel used in this project was a dual certified
and can be categorized as both type 304 and type 304H austenitic stainless steel.
Table 11: Chemical composition of the 304H austenitic stainless steel samples
Grade UNS Number Carbon
(wt%)
Chromium
(wt%)
Nickel
(wt%)
Molybdenum
(wt%)
Nitrogen
(wt%)
Composition of Spec S30409 0.04 - 0.1 18.0 - 20.0 8.0 – 10.5 - -
304H S30409 0.04 17.1 8.18 0.57 -
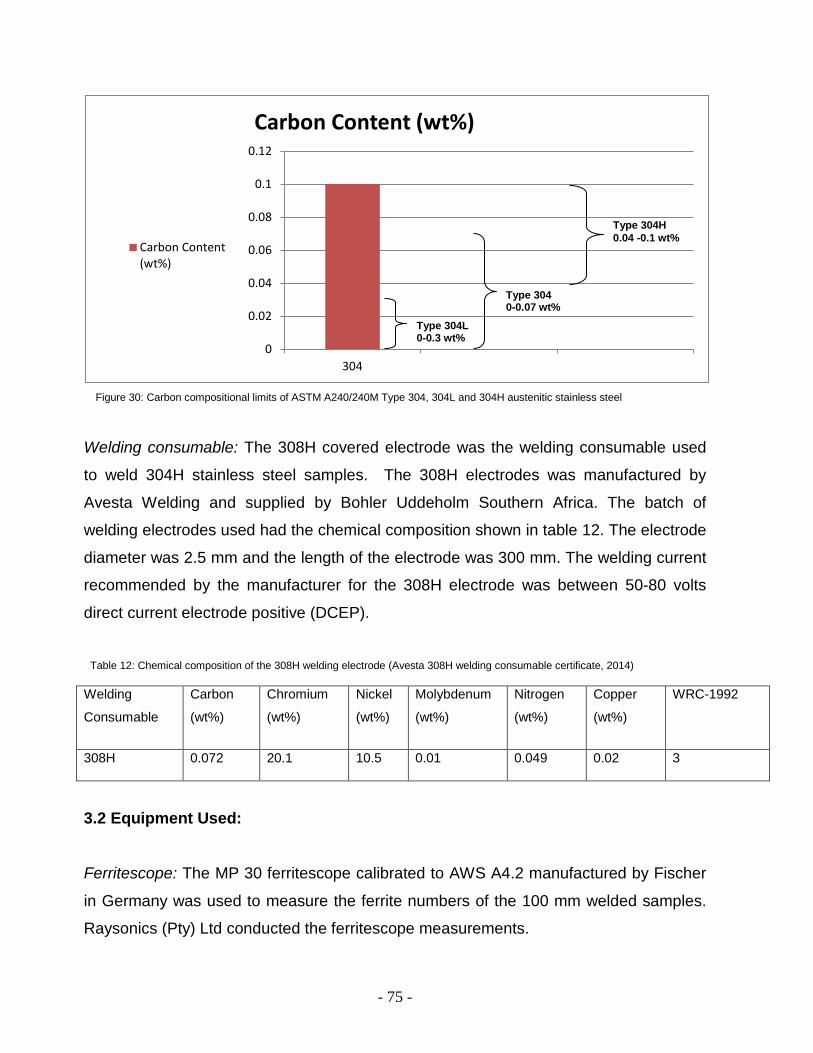
- 75 -
Welding consumable: The 308H covered electrode was the welding consumable used
to weld 304H stainless steel samples. The 308H electrodes was manufactured by
Avesta Welding and supplied by Bohler Uddeholm Southern Africa. The batch of
welding electrodes used had the chemical composition shown in table 12. The electrode
diameter was 2.5 mm and the length of the electrode was 300 mm. The welding current
recommended by the manufacturer for the 308H electrode was between 50-80 volts
direct current electrode positive (DCEP).
Welding
Consumable
Carbon
(wt%)
Chromium
(wt%)
Nickel
(wt%)
Molybdenum
(wt%)
Nitrogen
(wt%)
Copper
(wt%)
WRC-1992
308H 0.072 20.1 10.5 0.01 0.049 0.02 3
3.2 Equipment Used: Ferritescope: The MP 30 ferritescope calibrated to AWS A4.2 manufactured by Fischer
in Germany was used to measure the ferrite numbers of the 100 mm welded samples.
Raysonics (Pty) Ltd conducted the ferritescope measurements.
0
0.02
0.04
0.06
0.08
0.1
0.12
304
Carbon Content (wt%)
Carbon Content(wt%)
Table 12: Chemical composition of the 308H welding electrode (Avesta 308H welding consumable certificate, 2014)
Figure 30: Carbon compositional limits of ASTM A240/240M Type 304, 304L and 304H austenitic stainless steel
Type 304L 0-0.3 wt%
Type 304 0-0.07 wt%
Type 304H 0.04 -0.1 wt%

- 76 -
Grinding and polishing machines: Manual grinding and polishing machines in the
metallogrpahy laboratory at the Witwatersrand University were used to grind and polish
the samples.
Metallographic compression mounting press: The Struers CitoPress-1 automatic
compression mounting press was used to mount the specimens extracted from the
samples.
Electrolytic etching machine: The electrolytic etching equipment used in this research
was built by the University of the Witwatersrand.
Grinding and polishing consumables: Polishing pads, silicon carbide grit paper, cotton
swabs, abrasive cutting disks, phenolic resin commonly known as Bakelite powder,
Light microscope: To evaluate the microstructures and metallurgical features of the
welded samples the Lecia DM6000M digital microscope was used.
Infrared thermometer: The Top Tronic, T306 model, infrared thermometer was used to
measure and control the inter-pass temperature. The T306 model can be used from the
minimum temperature -50°C up to the maximum temperature of 700°C.
Chemical analysis: To do the chemical analysis of the 304H base metal and weld metal
stationary metal analyzers at the SAPREF refinery central stores was used. This metal
analyzer used was the Spectrotest TXC25 manufactured by Spectro. Analysis for the
nitrogen content was done by Scrooby’s laboratory services using the combustion
method.
3.3 Procedure: 3.3.1 Joint preparation and welding Single-V longitudinal joints were prepared for welding on one side of the four 100 mm
long samples with the shielded metal arc welding (SMAW) process. The joints had a
bevel angle of between 50-60°C, a root face of 2 mm and a root gap of 3 mm. The four
samples were marked as A, B, C and D and each of the weld joints were welded at a
different inter-pass temperature between 100 – 200°C. In order to remove the moisture
from the 308H electrodes, they were placed in an oven heated to 250°C for 30 minutes

- 77 -
prior to the welding of the samples. The electrodes that were not in use were kept in the
oven during the welding operation. Table 13 represents welding variables for each of
the welds which include the inter-pass temperature ranges and welding amperages and
voltage used for the welding of samples A, B, C and D. The electrode manufacturer’s
maximum recommended Amperage was 80 Amps. This could be achieved with
samples A and B which were welded at inter-pass temperatures of 105-110°C and 135-
140°C respectively. Keeping within the manufacturers amperage limits while trying to
maintain an inter-pass temperature of 165-170°C and 195-200°C was difficult to do
when welding samples C and D. This was because the heat loss was so high in
austenitic stainless steel resulting in rapid cooling of the weld bead and base metal
leaving insufficient time to adequately clean the weld bead by removing the slag layer
before welding on the next pass. The decision was then made to increase the heat input
slightly when welding sample 3 by increasing the amperage from 80 to 82 to achieve
the required165-170°C inter-pass temperature. When welding sample 4 the amperage
was further increased from 82 to 103 Amps to allow sufficient heat input for proper
removal of the slag before applying the next pass at the required inter-pass temperature
of 195-200°C. The voltage remained in the recommended range of 20-30 V. The weld
direction and bead sequenced was kept the same for all the samples.
Figure 31 shows the welded pipes with after sections were cut out for mounting.
Figure 31: Welded pipe samples after sections were cut out
Section A 105°C – 110°C
Section A 135°C – 140°C
Section A 165°C – 170°C
Section A 195°C – 200°C

- 78 -
The inter-pass temperature was measured with an infrared thermometer. The
measurement location was on the base metal, 2.5 mm from the weld toe for all the
welding passes at reference point A as shown in Figure 32. Reference point A was
located 25 mm from the weld toe where welding of the bead started.
Inter-pass
Temperature
Root Run
(Amps)
1st Pass
(Amps)
2nd Pass
(Amps)
3rd Pass
(Amps)
Cap
(Amps)
Voltage
DCEP
Sample 1 105 - 110°C 40 80 80 80 80 20-30V
Sample 2 135 - 140°C 40 80 80 80 80 20-30V
Sample 3 165 - 170°C 40 81 82 82 82 20-30V
Sample 4 195 - 200°C 40 82 103 103 103 20-30V
3.3.2 Ferrite measurement After the welding of the four pipe sections was completed, the weld bead was cleaned
using a stainless steel wire brush and a ferrite number measurement using the Fischer
MP30 ferritescope. All the readings were taken in the centre line of the as-weld bead
along the full length of the 100 mm weld bead of the samples as shown at location B of
the schematic in Figure 32. The ferritescope was chosen to measure the ferrite content
in addition to FN numbers determined using the WRC 1992 constitution diagram
because it was believed to be an accurate method. Other ferrite measurement methods
include metallographic evaluation and x-ray diffraction. The metallographic evaluation
method is done by point counting with the aid of a microscope, this is however not
accurate due to inhomogeniety that exists in the weld metal microstructure and the
evaluation will therefore not be representative for the entire welded sample. The the x-
ray diffraction method is also not as accurate as the ferritescope because the diffraction
patterns from x-ray diffraction tend to diffuse in nature and furthermore they are subject
to interpretation which makes this method subjective. Consistent accuracy is therefore a
challenge using the metallographic evaluation and the x-ray diffraction techniques. In
order to minimize the error due to weld metal inhomogeneity, the average of 45 ferrite
measurements was taken along the full length of the weld bead using the ferritescope
Table 13: Welding variables used for welding the pipe samples
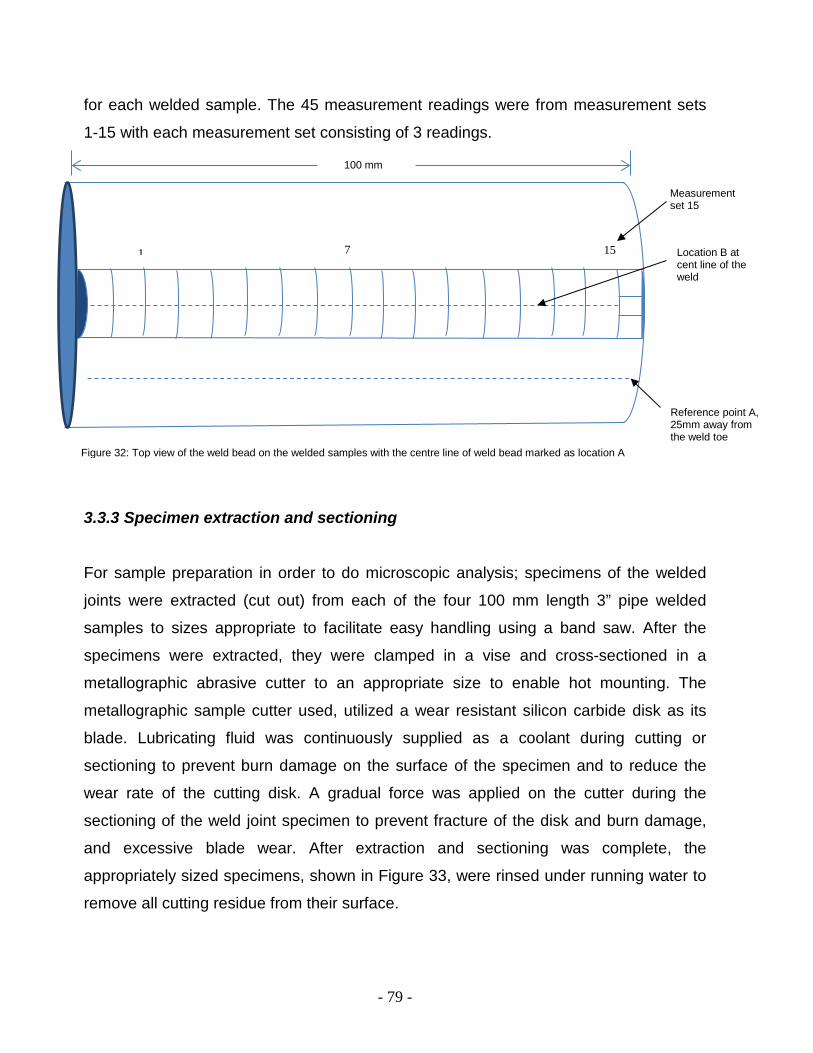
- 79 -
for each welded sample. The 45 measurement readings were from measurement sets
1-15 with each measurement set consisting of 3 readings.
3.3.3 Specimen extraction and sectioning For sample preparation in order to do microscopic analysis; specimens of the welded
joints were extracted (cut out) from each of the four 100 mm length 3” pipe welded
samples to sizes appropriate to facilitate easy handling using a band saw. After the
specimens were extracted, they were clamped in a vise and cross-sectioned in a
metallographic abrasive cutter to an appropriate size to enable hot mounting. The
metallographic sample cutter used, utilized a wear resistant silicon carbide disk as its
blade. Lubricating fluid was continuously supplied as a coolant during cutting or
sectioning to prevent burn damage on the surface of the specimen and to reduce the
wear rate of the cutting disk. A gradual force was applied on the cutter during the
sectioning of the weld joint specimen to prevent fracture of the disk and burn damage,
and excessive blade wear. After extraction and sectioning was complete, the
appropriately sized specimens, shown in Figure 33, were rinsed under running water to
remove all cutting residue from their surface.
Reference point A, 25mm away from the weld toe
Figure 32: Top view of the weld bead on the welded samples with the centre line of weld bead marked as location A
1 15 7
Measurement set 15
Location B at cent line of the weld
100 mm

- 80 -
3.3.4 Specimen mounting Prior to starting the specimen mounting operation the mounting press mold assembly
was cleaned with a cloth to remove all debris from previous mounting operations. One
specimen was placed in the centre of the mounting assembly ram and the ram was
thereafter lowered. Two scoops of the Bakelite resin was poured into the lowered mold.
The mold assembly was locked tightly and the automatic mounting press was started.
The mounting time for the specimen was set for 10 minutes at a temperature of 200°C.
When mounting press indicated that mounting of the specimen was complete, the
assembly cover was unlocked and the mounted specimen was removed from the press.
The mounting press mould assembly was then cleaned and all residues from the
mounting operation were removed. The process was repeated for the mounting of each
specimen. The mounting made the specimens easier to handle during grinding,
polishing and etching steps that followed. The mould that the specimens were in was
30mm in diameter which allowed sufficient space for the marking of the mounted
specimens with a hand held engraver according to their inter-pass temperatures for
identification. The specimens A, B, C and D were marked as 105-110°C, 135-140°C,
165-170° and 195-200°C respectively.
Figure 33: Welded pipe samples with sections that were cut out for mounting and sample preparation
Section A 105°C – 110°C
Section B 135°C – 140°C
Section C 165°C – 170°C
Section D 195°C – 200°C
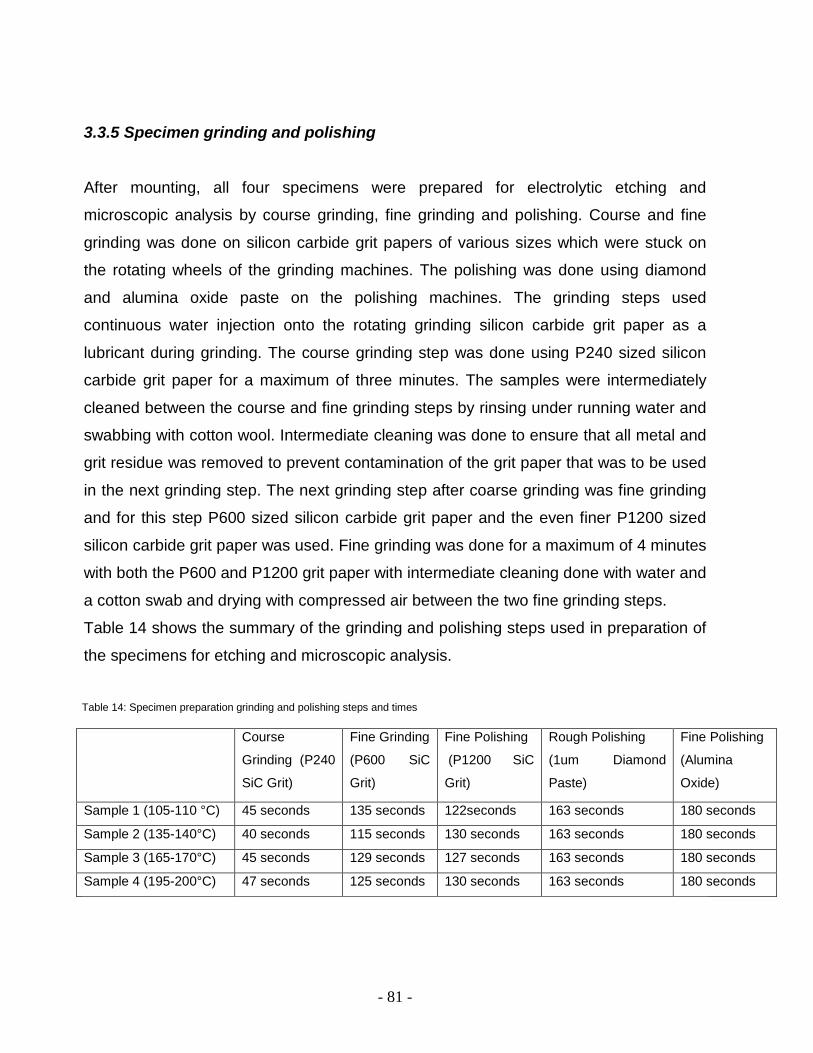
- 81 -
3.3.5 Specimen grinding and polishing After mounting, all four specimens were prepared for electrolytic etching and
microscopic analysis by course grinding, fine grinding and polishing. Course and fine
grinding was done on silicon carbide grit papers of various sizes which were stuck on
the rotating wheels of the grinding machines. The polishing was done using diamond
and alumina oxide paste on the polishing machines. The grinding steps used
continuous water injection onto the rotating grinding silicon carbide grit paper as a
lubricant during grinding. The course grinding step was done using P240 sized silicon
carbide grit paper for a maximum of three minutes. The samples were intermediately
cleaned between the course and fine grinding steps by rinsing under running water and
swabbing with cotton wool. Intermediate cleaning was done to ensure that all metal and
grit residue was removed to prevent contamination of the grit paper that was to be used
in the next grinding step. The next grinding step after coarse grinding was fine grinding
and for this step P600 sized silicon carbide grit paper and the even finer P1200 sized
silicon carbide grit paper was used. Fine grinding was done for a maximum of 4 minutes
with both the P600 and P1200 grit paper with intermediate cleaning done with water and
a cotton swab and drying with compressed air between the two fine grinding steps.
Table 14 shows the summary of the grinding and polishing steps used in preparation of
the specimens for etching and microscopic analysis.
Course
Grinding (P240
SiC Grit)
Fine Grinding
(P600 SiC
Grit)
Fine Polishing
(P1200 SiC
Grit)
Rough Polishing
(1um Diamond
Paste)
Fine Polishing
(Alumina
Oxide)
Sample 1 (105-110 °C) 45 seconds 135 seconds 122seconds 163 seconds 180 seconds
Sample 2 (135-140°C) 40 seconds 115 seconds 130 seconds 163 seconds 180 seconds
Sample 3 (165-170°C) 45 seconds 129 seconds 127 seconds 163 seconds 180 seconds
Sample 4 (195-200°C) 47 seconds 125 seconds 130 seconds 163 seconds 180 seconds
Table 14: Specimen preparation grinding and polishing steps and times

- 82 -
After grinding was completed, the specimens were polished using soft polishing cloths
with diamond paste and alumina oxide as polishing lubricants for rough and final
polishing respectively. Rough polishing was done for a maximum of three minutes on
the polishing machine utilizing a polishing cloth with 1 micron (um) diamond paste as
the lubricant. The specimens were cleaned with a cotton swab dipped in ethanol for
intermediate cleaning after the rough polishing step. As the last polishing step, final
polishing was done for three minutes on a separate polishing machine which used a soft
cloth and alumina oxide as the lubricating and polishing medium. After final polishing
the specimens had a thin matte film on their surface which was removed by swabbing
with cotton wool dipped in ethanol immediately after polishing to give a mirror surface
finish. Samples A, B, C and D were placed in a vacuum desiccator after final polishing
to protect the surface from any oxidation caused by the presence of moisture and dust.
3.3.6 Specimen etching
For the evaluation of the delta-ferrite and sigma phase that may have transformed from
delta ferrite, the four specimens were placed in a glass beaker and submerged in
sodium hydroxide solution commonly known as caustic, NaOH, one at a time for
electrolytic etching. A caustic solution with a concentration 21% was used as the
electrolyte to reveal the different metallurgical features e.g. delta ferrite, sigma phase,
chromium carbides and grain boundaries in the stainless steel welded samples. The
cathode and anode were connected to an external circuit. The stainless steel cathode
wire was then placed inside the electrolyte and the anode wire was placed on the
surface of the metal sample. The etching process was done for a maximum of 60
seconds at 66 volts. To reveal the primary solidification phase of the specimens were
etched with Villela’s reagent by swabbing for 1 minute at room temperature. In addition
to Villela’s reagent, the specimens were electrolytically etched using oxalic acid for 45 –
60 seconds at room temperature to evaluate the morphology of the primary solidification
phase. To reveal the M23C6 chromium carbide phase that may have precipitated during
welding of the four specimens, the four specimens were etched by immersion in

- 83 -
Groesbeck etchant at 60°C for 10 min. The etching with Villela’s reagent and Groesbeck
was done at Megchem (Pty) Ltd.
After every etching operation, the specimens were removed from the glass beaker using
tongs and rinsed under running water. The specimens were then dried using a handheld
electric hair dryer and stored in a desiccator for storage.
3.3.7 Microscopy After drying the etched specimens, they underwent metallurgical evaluation under the
light microscope. The specimens were each evaluated at X50, X100, X500 and X1000
magnification and photomicrographs of the microstructures observed at various
magnifications were taken. The specimens were evaluated for their solidification
phases, sigma phase and the presence of M23C6 chromium carbides that may have
formed during welding and subsequent cooling of the specimens.
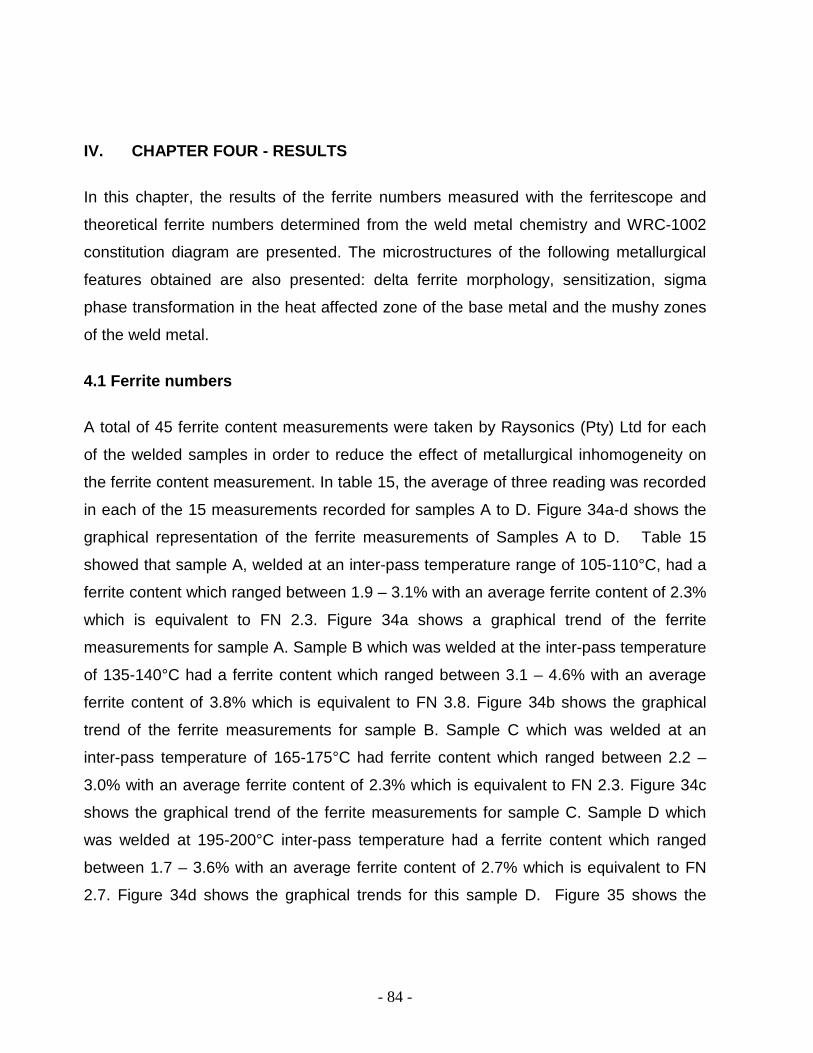
- 84 -
IV. CHAPTER FOUR - RESULTS
In this chapter, the results of the ferrite numbers measured with the ferritescope and
theoretical ferrite numbers determined from the weld metal chemistry and WRC-1002
constitution diagram are presented. The microstructures of the following metallurgical
features obtained are also presented: delta ferrite morphology, sensitization, sigma
phase transformation in the heat affected zone of the base metal and the mushy zones
of the weld metal.
4.1 Ferrite numbers
A total of 45 ferrite content measurements were taken by Raysonics (Pty) Ltd for each
of the welded samples in order to reduce the effect of metallurgical inhomogeneity on
the ferrite content measurement. In table 15, the average of three reading was recorded
in each of the 15 measurements recorded for samples A to D. Figure 34a-d shows the
graphical representation of the ferrite measurements of Samples A to D. Table 15
showed that sample A, welded at an inter-pass temperature range of 105-110°C, had a
ferrite content which ranged between 1.9 – 3.1% with an average ferrite content of 2.3%
which is equivalent to FN 2.3. Figure 34a shows a graphical trend of the ferrite
measurements for sample A. Sample B which was welded at the inter-pass temperature
of 135-140°C had a ferrite content which ranged between 3.1 – 4.6% with an average
ferrite content of 3.8% which is equivalent to FN 3.8. Figure 34b shows the graphical
trend of the ferrite measurements for sample B. Sample C which was welded at an
inter-pass temperature of 165-175°C had ferrite content which ranged between 2.2 –
3.0% with an average ferrite content of 2.3% which is equivalent to FN 2.3. Figure 34c
shows the graphical trend of the ferrite measurements for sample C. Sample D which
was welded at 195-200°C inter-pass temperature had a ferrite content which ranged
between 1.7 – 3.6% with an average ferrite content of 2.7% which is equivalent to FN
2.7. Figure 34d shows the graphical trends for this sample D. Figure 35 shows the

- 85 -
graphical comparison the ferrite average ferrite measurement values obtained for
samples A, B, C and D.
Measurement Location on pipe
Specimen A
105°C-110°C
Specimen B
135°C-140°C
Specimen C
155°C-170°C
Specimen D
195°C-200°C
1 2.5 3.7 2.2 2.4
2 3.1 4.6 2.6 2.9
3 2.6 4.5 2.6 3.1
4 2.4 4.1 2.6 3.1
5 1.9 4.0 3.0 2.9
6 2.3 3.8 2.7 3.2
7 2.3 3.5 2.7 3.6
8 1.9 3.1 2.3 2.6
9 2.5 3.7 2.7 2.6
10 2.2 3.5 2.5 2.1
11 2.1 4.1 2.3 1.7
12 2.4 4.0 2.9 2.4
13 2.4 4.0 2.4 2.5
14 2.5 3.5 2.8 2.9
15 2.4 3.0 2.4 2.0
Measurement Average
2.3 3.8 2.3 2.7
Table 15: Ferritescope ferrite content measurement readings for sample A to D welded at various inter-pass temperatures
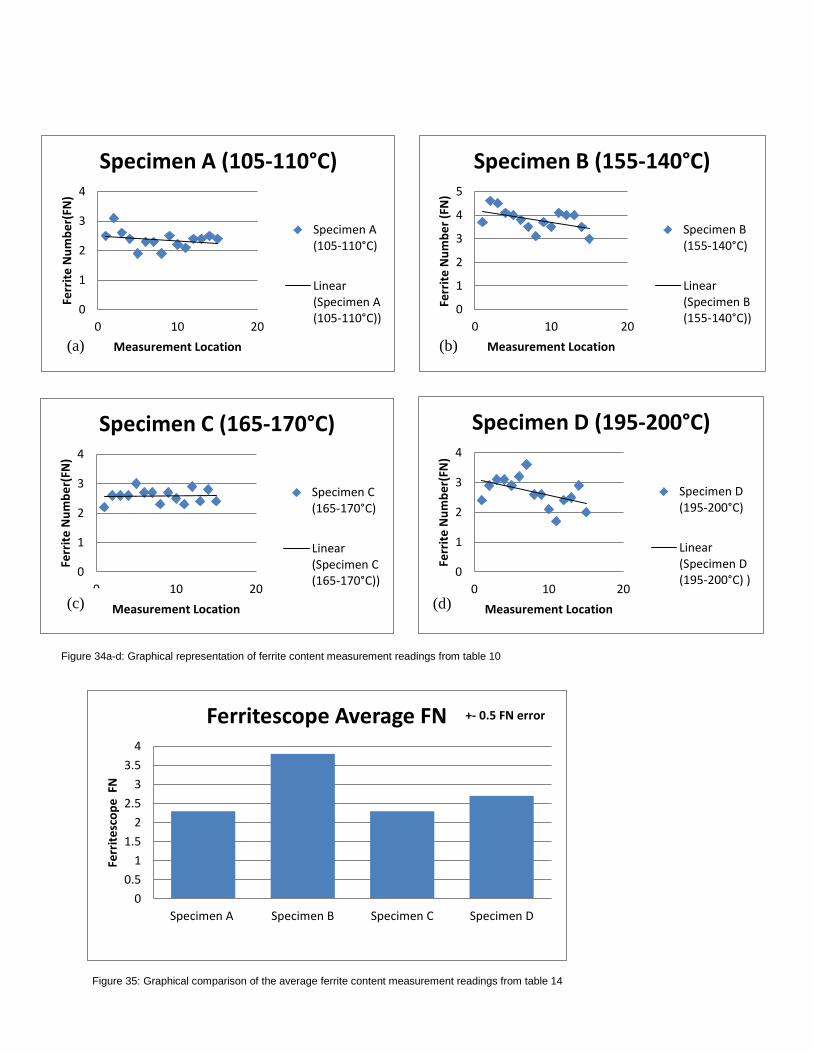
- 86 -
00.5
11.5
22.5
33.5
4
Specimen A Specimen B Specimen C Specimen D
Ferr
itesc
ope
FN
+- 0.5 FN error Ferritescope Average FN
Figure 35: Graphical comparison of the average ferrite content measurement readings from table 14
0
1
2
3
4
0 10 20
Ferr
ite N
umbe
r(FN
)
Measurement Location
Specimen A (105-110°C)
Specimen A(105-110°C)
Linear(Specimen A(105-110°C))
0
1
2
3
4
5
0 10 20
Ferr
ite N
umbe
r (FN
)
Measurement Location
Specimen B (155-140°C)
Specimen B(155-140°C)
Linear(Specimen B(155-140°C))
0
1
2
3
4
0 10 20
Ferr
ite N
umbe
r(FN
)
Measurement Location
Specimen C (165-170°C)
Specimen C(165-170°C)
Linear(Specimen C(165-170°C))
0
1
2
3
4
0 10 20
Ferr
ite N
umbe
r(FN
)
Measurement Location
Specimen D (195-200°C)
Specimen D(195-200°C)
Linear(Specimen D(195-200°C) )
Figure 34a-d: Graphical representation of ferrite content measurement readings from table 10
(c)
(a) (b)
(d)

- 87 -
The chemistry of the as-deposited weld metal for specimens A, B, C and D in table 16
was determined with a spectrometer with the combustion method used for the nitrogen
content analysis.
The Creq/Nieq ratio of the weld metal and WRC-1992 ferrite numbers in table 17 was
determined using the weld chemical composition in table 16. As seen in Figure 36 and
37, the Creq/Nieq ratio and FN values showed an increase with an increase in inter-pass
temperature respectively.
Specimen Inter-pass
Temp (°C)
Carbon
(wt %)
Chromium
(wt %)
Nickel
(wt %)
Molybdenum
(wt %)
Niobium
(wt %)
Copper
(wt %)
Nitrogen
(wt %)
A 105 - 110 0.042 18.5 9.89 0.12 0.015 0.059 0.115
B 135 - 140 0.044 18.5 9.82 0.12 0.014 0.053 0.0780
C 165 - 170 0.048 18.6 9.55 0.17 0.015 0.094 0.0782
D 195 - 200 0.047 18.7 9.47 0.18 0.013 0.096 0.0800
Table 16: Chemical compositions of the weld metals of specimens A to D
Specimen Crequivalent Niequivalent Creq/Nieq Ratio WRC-1992 FN
A 18.63 13.67 1.36 1.0
B 18.62 12.93 1.44 2.0
C 18.78 12.81 1.46 2.5
D 18.88 12.73 1.48 3.0
Table 17: The calculated chromium-nickel-equivalents and WRC-1992 ferrite numbers of the weld metals of specimens A to D
1.3
1.35
1.4
1.45
1.5
Specimen A Specimen B Specimen C Specimen D
Creq
/Ni eq
Rat
io
Welded Samples
Creq/Nieq Ratio
Figure 36: Graphical comparison of the Creq/Nieq ratio from table 17

- 88 -
The ferrite numbers were predicted by plotting the WRC-1992 constitution diagram in
figure 38, using the chromium and nickel equivalents calculated from the weld
chemistry.
0
0.5
1
1.5
2
2.5
3
3.5
Specimen A Specimen B Specimen C Specimen D
WRC
-199
2 FN
WRC-1992 FN Values
Figure 38: Ferrite numbers plotted on WRC-1992 calculated using the weld metal chemistry of specimens A, B, C and D
A
B
C
D
Figure 37: Graphical comparison of the WRC-1992 calculated ferrite numbers (FN) from table 17

- 89 -
4.2 Metallurgical feature evaluation
The microstructures of the four specimens were determined with various etchants. The
solidification phases and the secondary phases that resulted from transformation and
precipitation during welding at the various inter-pass temperatures were evaluated. The
phases of interest were austenite, delta ferrite, sigma phase and M23C6 chromium
carbides.
4.2.1 Solidification phases
Specimens A, B, C and D welded at inter-pass temperatures of 105-110, 135-140, 165-
170 and 195-200°C respectively were etched in Villela’s reagent to determine the
primary solidification phase. Figure 39a-d shows the photomicrographs at X200
magnification.

- 90 -
4.2.2 Delta ferrite morphology The microstructure of specimens A, B, C and D were electrolytically etched with oxalic
acid for metallurgical evaluation at X200.
(a)
Figure 39: Weld metal microstructure of specimens A to D at X200 magnification after chemical etching with Villela’s reagent
(b)
(c) (d)
δ
γ

- 91 -
4.2.2 Presence of carbides in the heat affected zone
The schematic of the welded joint in figure 40 shows regions 1, 2, 3, 4 and 5 of the
welded joint which are the base metal, heat affected zone of the base metal, the fusion
line of the base metal and weld metal, the columnar dendritic region of the weld metal
and the mushy zone of the weld metal respectively. Figure 41a-c show the etched base
metal, heat affected zone and fusion line of sample A. Figure 41a-c show the etched
microstructure of base metal, heat affected zone and fusion line for specimen A which
are region 1, 2 and 3 of the weld joint schematic in figure 40.
Figure 42 is a backscatter SEM image taken at X1000 and Figure 43 is an in-lens SEM
image of specimen C taken at X10000 in the heat affected zone of specimen C.
Figure 41: Microstructures of the (a) base metal, (b) heat affected zone and (c) fusion line for specimen A at X200 magnification after etching with oxalic acid.
(1) (3)
(4)
(2)
Figure 40: Schematic of weld joint showing (1) base metal, (2), heat affected zone-HAZ, (3) fusion line, (4) columnar dendritic zone and (5) mushy zone.
(a) (b) (c)
(5) HAZ HAZ
Base Metal
Weld Metal
(1) (2) (3)

- 92 -
Figure 42: Microstructures of the heat affected zone and fusion line for specimen C at X1000 magnification after etching with oxalic acid.
Figure 43: SEM Image of the heat affected zone for specimen C at X10000 magnification after etching with oxalic acid
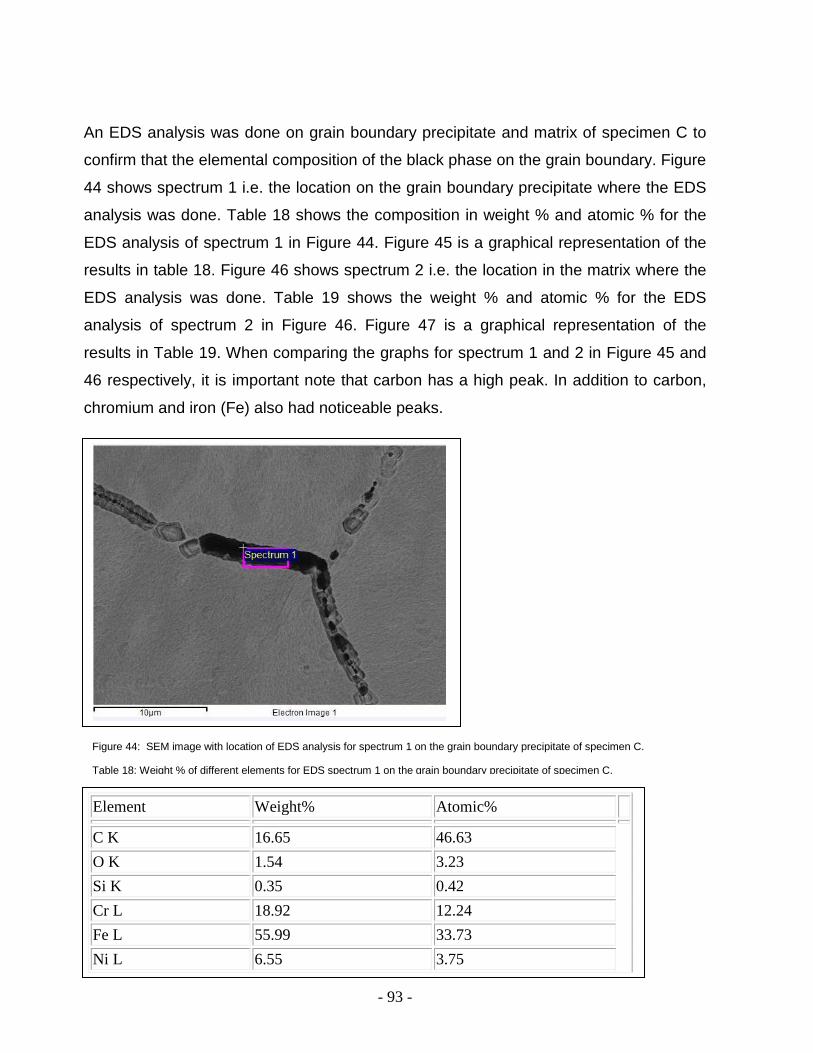
- 93 -
An EDS analysis was done on grain boundary precipitate and matrix of specimen C to
confirm that the elemental composition of the black phase on the grain boundary. Figure
44 shows spectrum 1 i.e. the location on the grain boundary precipitate where the EDS
analysis was done. Table 18 shows the composition in weight % and atomic % for the
EDS analysis of spectrum 1 in Figure 44. Figure 45 is a graphical representation of the
results in table 18. Figure 46 shows spectrum 2 i.e. the location in the matrix where the
EDS analysis was done. Table 19 shows the weight % and atomic % for the EDS
analysis of spectrum 2 in Figure 46. Figure 47 is a graphical representation of the
results in Table 19. When comparing the graphs for spectrum 1 and 2 in Figure 45 and
46 respectively, it is important note that carbon has a high peak. In addition to carbon,
chromium and iron (Fe) also had noticeable peaks.
Element Weight% Atomic% C K 16.65 46.63 O K 1.54 3.23 Si K 0.35 0.42 Cr L 18.92 12.24 Fe L 55.99 33.73 Ni L 6.55 3.75
Table 18: Weight % of different elements for EDS spectrum 1 on the grain boundary precipitate of specimen C.
Figure 44: SEM image with location of EDS analysis for spectrum 1 on the grain boundary precipitate of specimen C.

- 94 -
Figure 45: Graph of Spectrum 1 EDS analysis of grain boundary precipitate of specimen C.
Figure 46: SEM image with location of EDS analysis (spectrum 2) on the matrix of specimen C.

- 95 -
4.2.3 Delta ferrite morphology Figures 48a-b, 49a-b, 50a-b and 51a-b were electrolytically etched with oxalic acid for
metallurgical evaluation at X500 and X1000 magnification. Figures 48 to 51 show the
microstructures of the columnar dendritic zone, region 4 in Figure 48, of the weld metal
for samples A to D respectively at X500 and X1000 magnification.
Element Weight% Atomic% C K 1.79 7.73
Cr L 22.10 22.03
Fe L 66.80 62.01
Ni L 9.31 8.22
Table 19: Weight % of different elements for EDS spectrum 2 on the matrix of specimen C.
Figure 47: Graph of Spectrum 2 EDS analysis of the matrix of specimen C.

- 96 -
Figure 49: Microstructures of the columnar dendritic zone for specimen B welded at 135-140°C inter-pass temperature at (a) X500 and (b) X1000
after etching with oxalic acid.
(a)
(a)
(b)
(b)
Figure 48: Microstructures of the columnar dendritic zone for specimen A welded at 105-110°C inter-pass temperature at (a) X500 and (b) X1000
after etching with oxalic acid.
- 97 -
(a)
Figure 51: Microstructures of the columnar dendritic zone for specimen D welded at 195-200°C inter-pass temperature at (a) X500 and (b) X1000
after etching with oxalic acid.
Figure 50: Microstructures of the columnar dendritic zone for specimen C welded at 165-170°C inter-pass temperature at (a) X500 and (b) X1000
after etching with oxalic acid.
(b)
(a) (b)

- 98 -
4.2.4 Evaluation for Sigma phase transformation in the weld metal For evaluation of the delta ferrite phase in the weld metal, specimens A to D were
electrolytically etched with 21% NaOH, and evaluated with the optical microscope at
X1000 magnification. The micrographs were taken in the mushy zone near the centre-
line of the weld beads of specimens A, B, C and D as shown in Figure 52.
Figure 53a-d shows the micrographs taken in the mushy zone of specimens A-D at
X1000.
Figure 52: Location of the mushy zone in the weld metal of specimen A to D
Mushy Zone
(a) (b)

- 99 -
4.2.5 Low temperature sensitization of heat affected zone
The specimens were etched in Groesbeck reagent to determine the effect of welding
inter-pass temperature on the precipitated M23C6 carbide secondary phase. Figures
54a-d show stereographs of specimen A, B , C and D welded at 105-100°C, 135-140°C,
165-170°C and 195-200° inter-pass temperatures respectively taken at X6.7
magnification. Figure 55a-d show micrographs of the heat affected zone (HAZ) of the
base metal at X1000 magnification.
Figure 53: Micrographs of the microstructures of specimens A to D at X1000 magnification after electrolytic etching with NaOH
(c)
(d)

- 100 -
(a)
(d) (c)
(b)
Figure 54: Stereographs of the weld after Groesbeck etchant at X6.7 magnification
Base Metal
Weld Metal
Fusion Line
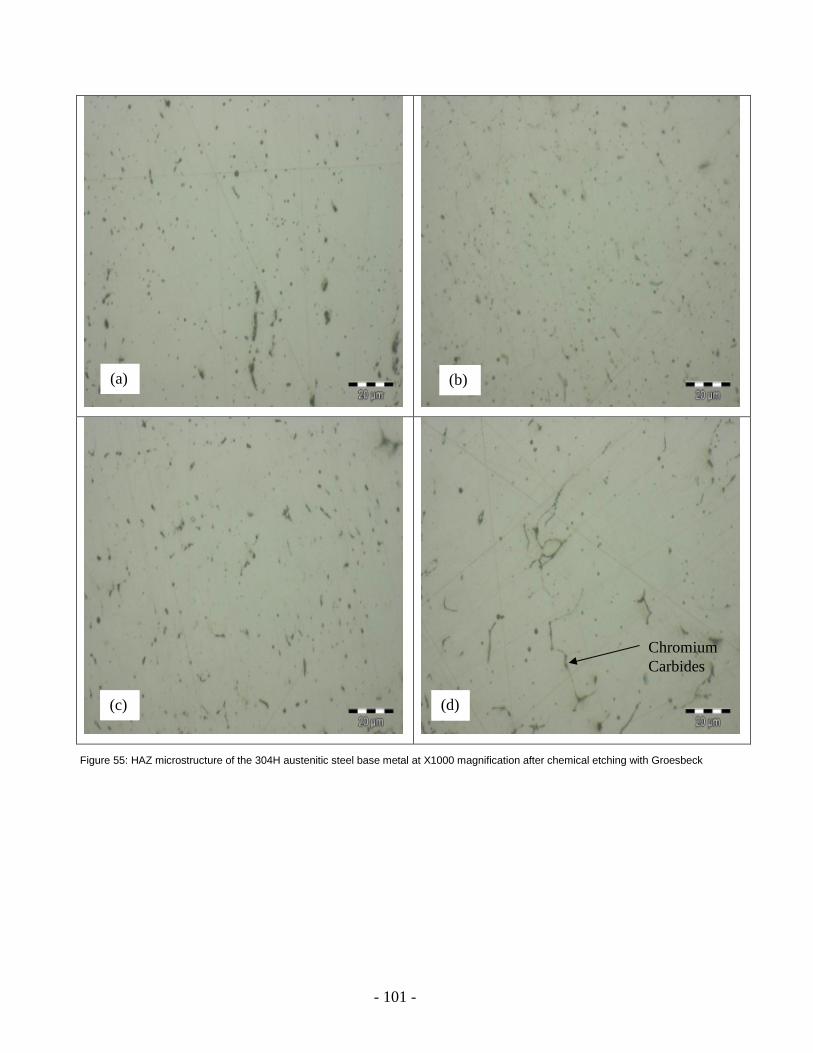
- 101 -
Figure 55: HAZ microstructure of the 304H austenitic steel base metal at X1000 magnification after chemical etching with Groesbeck
(a) (b)
(d) (c)
Chromium Carbides
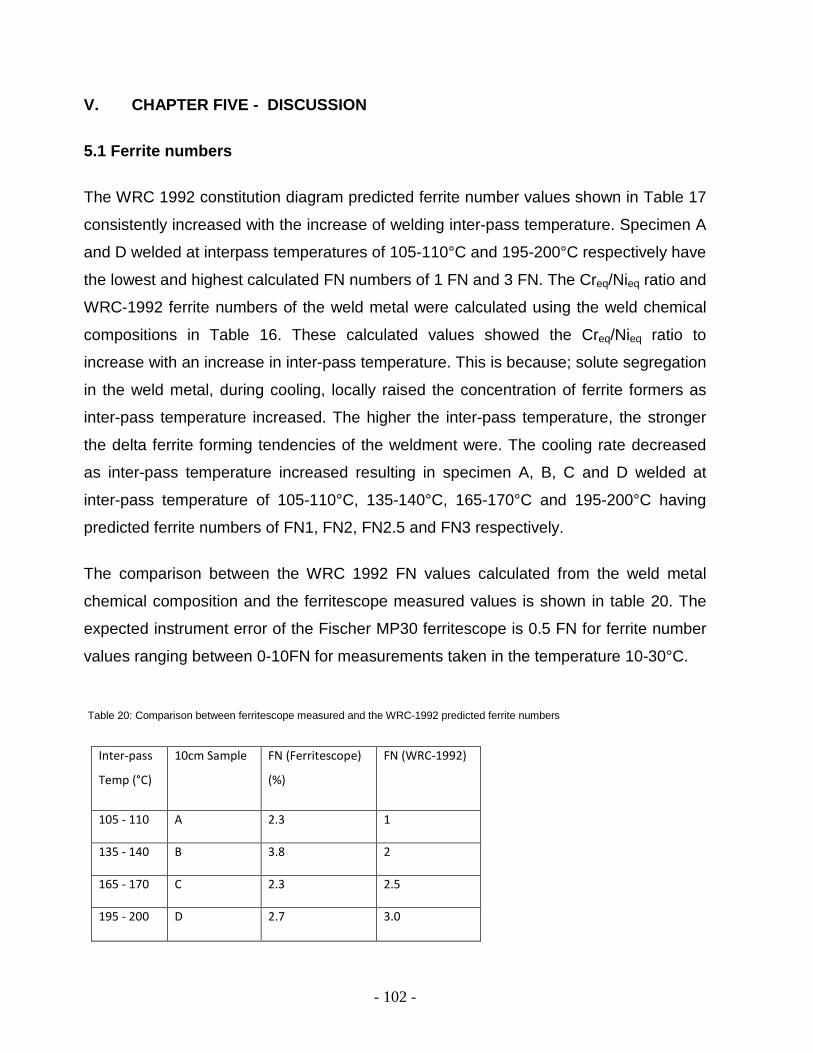
- 102 -
V. CHAPTER FIVE - DISCUSSION
5.1 Ferrite numbers
The WRC 1992 constitution diagram predicted ferrite number values shown in Table 17
consistently increased with the increase of welding inter-pass temperature. Specimen A
and D welded at interpass temperatures of 105-110°C and 195-200°C respectively have
the lowest and highest calculated FN numbers of 1 FN and 3 FN. The Creq/Nieq ratio and
WRC-1992 ferrite numbers of the weld metal were calculated using the weld chemical
compositions in Table 16. These calculated values showed the Creq/Nieq ratio to
increase with an increase in inter-pass temperature. This is because; solute segregation
in the weld metal, during cooling, locally raised the concentration of ferrite formers as
inter-pass temperature increased. The higher the inter-pass temperature, the stronger
the delta ferrite forming tendencies of the weldment were. The cooling rate decreased
as inter-pass temperature increased resulting in specimen A, B, C and D welded at
inter-pass temperature of 105-110°C, 135-140°C, 165-170°C and 195-200°C having
predicted ferrite numbers of FN1, FN2, FN2.5 and FN3 respectively.
The comparison between the WRC 1992 FN values calculated from the weld metal
chemical composition and the ferritescope measured values is shown in table 20. The
expected instrument error of the Fischer MP30 ferritescope is 0.5 FN for ferrite number
values ranging between 0-10FN for measurements taken in the temperature 10-30°C.
Inter-pass
Temp (°C)
10cm Sample FN (Ferritescope)
(%)
FN (WRC-1992)
105 - 110 A 2.3 1
135 - 140 B 3.8 2
165 - 170 C 2.3 2.5
195 - 200 D 2.7 3.0
Table 20: Comparison between ferritescope measured and the WRC-1992 predicted ferrite numbers

- 103 -
5.2 Metallurgical feature evaluation
5.2.1 Solidification phases
Figure 39a-d show the main solidification phases of the welded specimens to be delta
ferrite in an austenite matrix. The dendrites are of a columnar dendritic morphology. As
shown by the arrows in figure 39d, the dark phase in the micrographs is the
interdendritic delta ferrite phase (δ) with the lighter phase being the austenite matrix (γ).
No micro-fissuring resulting from solidification cracking was observed in any of the
welded specimens even though the predicted ferrite numbers of all the specimens was
below FN 4. The Creq/Nieq ratio of the weld metal, as calculated from the weld metal
chemistry, was 1.36, 1.44, 1.46 and 1.48 for specimens A, B, C and D respectively. It is
worth noting that micrographs of specimen A, B and C in figure 39a to 39c respectively
are similar in appearance after etching while specimen D in figure 39d appeared
different to specimens A, B and C which could be as a result of darker etching. The
Creq/Nieq ratios of specimens A, B and C were below 1.48. The Creq/Nieq ration of
specimen D was equal to 1.48. The Creq/Nieq ratio of the specimens increased with an
increase in inter-pass temperature with the inter-pass temperature range of 105-110°C
having the lowest ratio of 1.36 and the inter-pass temperature range of 195-200°C
having the highest ratio of 1.48. The solidification mode is therefore expected to be a
combination of the austenite-ferrite (AF) and the ferrite-austenite (FA) solidification
modes. The weld metal microstructural evaluation of the specimens revealed that
specimen A had an austenitic matrix with a columnar dendritic morphology and delta
ferrite with an interdendritic morphology which indicates the austenite-ferrite (AF)
solidification following the L→ L + γ → L+ γ + δ → γ + δ solidification sequence.
Specimens A, B, C and D all had a mixed delta ferrite morphology containing some
interdendritic with predominantly vermicular delta ferrite which is an indication of a
combination of the austenite-ferrite (AF) and ferrite-austenite (FA) solidification modes.
Some areas of the weld metal therefore followed the FA, L→ L + δ → L + δ + γ → γ + δ,
solidification sequence while other areas of the weld bead followed the AF solidification
sequence similar to that already described for specimen A. This mixed solidification
mode is not surprising as the Creq/Nieq ratios for specimens B, C and D were 1.44, 1.46

- 104 -
and 1.48 respectively which were very close to the 1.48 ration required for the FA
solidification mode to start dominating.
No solidification cracking was observed in any of the specimens evaluated in this study
even though all the specimens had ferrite contents well below FN 4 in the center line of
the weld beads. The minimum ferrite content of FN 5 was required to prevent
solidification cracking. This observation supports research that indicates that controlling
of the primary solidification mode as delta ferrite is more important a factor in preventing
solidification cracking than trying to control the actual ferrite content of the weld metal.
By controlling the weld metal chemistry to have a chromium-nickel-equivalent ratio to be
close to 1.48 ensured that delta ferrite would be part of the primary solidification phase
which has higher solubility for the sulphur and phosphorus impurities present at high
temperatures than what austenite does and therefore reducing susceptibility of the weld
metal to solidification cracking.
5.2.2 Delta ferrite morphology
Figure 41a showed an annealed structure consisting of equiaxed austenite grains with
annealing twins. Figure 41b showed a location of the heat affected zone which was
exposed to temperatures in the sensitization range during welding because the
precipitated carbides are both within the grains and on some of the grain boundaries.
Grain growth was also evident. Figure 41c showed the coarse grain structure of the
base metal on the fusion line. As aforementioned in the, Figures 48, 49, 50, and 51
showed the microstructures of the columnar dendritic zone of the weld metal for
samples A to D respectively. The columnar dendritic zone is region 4 of the schematic
in figure 35. The presence of delta ferrite in the weld metal microstructures of
specimens A to D of figures 48 to 51 indicates that the 308H weld metal welded to the
304H base metal passed through the 3 phase region of the Cr-Ni-Fe phase diagram
shown in Figure 14. A mixed morphology with mostly vermicular delta ferrite and some
interdendritic delta ferrite in specimens A B, C and D was observed in figures 48 to 51.
This mixed morphology resulted from differences in chromium content to due solute
segregation during cooling. In the regions of the weld microstructure where the delta

- 105 -
ferrite had dendritic arms, the delta ferrite was the first phase to solidify (FA solidification
mode) and became the nuclei for the delta ferrite-austenite transformation. As the
chromium rich weld metal cooled into the (δ + γ) two-phase region, the outer portions of
the dendrites having less chromium transform to austenite. The delta ferrite-austenite
transformation therefore started at the boundary of the delta ferrite dendritic arms and
rapidly progressed to the core of the delta ferrite dendrite. This morphology where delta
ferrite has dendritic arms is called vermicular ferrite. The regions of the microstructures
for specimens A to D where the core of the delta ferrite, with no distinct dendritic arms,
was located at the austenitic grain boundary, austenite was the first phase to solidify
before the delta ferrite solidified (AF solidification mode). It is worth noting that the delta
ferrite morphology of specimen B in figure 49 revealed a combination of a vermicular-
lathy and interdendritic morphology. The lathy ferrite of specimen B in figure 49 was an
indication of the higher chromium content in the some regions of the weld metal in this
sample while the vermicular morphology showed that some regions were lower in
chromium content than the lathy ferrite regions; both the vermicular and lathy ferrite
regions followed the FA solidification mode sequence.
5.2.3 Sigma phase transformation in the weld metal
The transformation sequence of delta ferrite to sigma phase is such that only after all
the nucleated delta ferrite has transformed to sigma phase will the austenite to sigma
phase transformation occur on the grain boundary starting at the triple points of the
grain boundary. The austenite to sigma phase transformation is slow and only occurs
after long term exposure in the sigmatization temperature. Electrolytic etching with 20%
NaOH will the delta ferrite phase blue/tan and the sigma phase will be coloured brown-
orange (van der Voort, 2011). The microstructure at the mushy zone revealed the
presence of delta ferrite dendrites in an austenitic matrix. The welded specimens A to D
in figure 53a-d respectively showed no distinct presence of sigma phase in their as-
welded condition.

- 106 -
5.2.4 Low temperature sensitization of heat affected zone
Low temperature sensitization occurred after welding in the heat affected zone (HAZ)
adjacent to the fusion zone of specimens A, B, C and D welded at 105-100°C, 135-
140°C, 165-170°C and 195-200° inter-pass temperatures respectively. Figures 54a-d
show stereographs taken at X6.7 magnification while Figure 55a-d shows micrographs
taken at X1000 magnification. The evaluation at X1000 magnification, shown in figure
55a-d, indicated a difference in the carbide between specimens A, B, C and specimen
D. Specimens A to C at X1000 showed nucleated carbides with no carbide networks
while specimen D revealed discontinuous networks of carbides that had formed during
the welding of this specimen at an inter-pass temperature 195-200°C. This is because
specimens A, B and C were briefly exposed to the sensitization temperature range upon
cooling. The chromium carbides nucleated in specimen D which was welded at 195-
200°C formed a discontinuous network of carbides through diffusion. The carbide
networks that started to form show that specimen D experienced enough slow cooling
through the sensitization temperature range. This confirms that the cooling rate
experienced in specimen D was slower than those experienced during the welding of
specimens A, B and C. The EDS analysis of the grain boundary using SEM confirmed
that the grain boundary precipitate, spectrum 1 shown in Figure 45, had a carbon peak
that was relatively higher than that of the EDS analysis for matrix, spectrum 2 shown in
Figure 47. Unfortunately the high peak of carbon in the spectrum could not be quantified
with the EDS because the carbon is a light element with a Kα value of 0.277. The Kα
value for carbon is therefore too low to quantify with the EDS.

- 107 -
VI CHAPTER SIX - CONCLUSION
The study into the effect of welding inter-pass temperature when welding 304H type
austenitic stainless steel using the shielded metal arc welding (SMAW) process
revealed the following points:
a) The ferrite numbers calculated using chemical composition of the weld metal and
the WRC 1992 constitution diagram showed a positive correlation between the
welding inter-pass temperature and the ferrite number. The predicted ferrite
numbers plotted on the WRC 1992 diagram increased with an increase in inter-
pass temperature while the measured ferrite number values did not. The lack of
correlation between the calculated ferrite numbers and measured ferrite number
values can be attributed to the instrument error of 0.5FN and/or ferrite
measurement procedures not being adequately followed.
b) Etching with Groesbeck reagent revealed that the nature of low temperature
sensitisation in the heat affected zones (HAZ) of the base metal changed with an
increase in inter-pass temperature. A maximum inter-pass temperature of 165-
170°C should be maintained to avoid sensitisation when welding 304H austenitic
stainless steel. The maximum temperature limit of 170°C is consistent with API
recommended practice 582. When considering the effects of inter-pass
temperature on low temperature sensitization, it is clear that interpass
temperature has a stronger influence on sensitization than what is does on ferrite
number. The interpass temperature reduces the cooling rate of the weld which
result in the formation of discontinuous chromium carbide networks at interpass
temperatures of 170°C because the cooling rate allows sufficient time for
chromium carbide diffusion while the weld passes through the sensitization
temperature range. The chromium carbide grain boundary precipitate was
confirmed with a SEM EDS analysis.
- 108 -
c) Primary solidification mode changed with an increase in inter-pass temperature.
The Creq/Nieq ratios of specimens A, B and C were below 1.48 which indicates
that the theoretical dominating primary modes of solidification would be the
austenite-ferrite (AF) solidification mode in figure 15. The Creq/Nieq ratio of
specimen D was 1.48 which indicates that the theoretically dominating primary
solidification mode would start changing from the AF primary solidification mode
to the ferrite-austenite (FA) solidification mode. No solidification cracking was
observed in any of the specimens evaluated in this study even though all the
specimens had ferrite contents well below FN 5 in the center line of the weld
beads. The SAPREF Refinery internal quality standards required a minimum
ferrite content of FN 5 to prevent solidification cracking. This observation
supports research that indicates that controlling of the primary solidification mode
as delta ferrite is more important a factor in preventing solidification cracking than
trying to control the actual ferrite content of the weld metal.
d) After evaluating the solidification phase and the evolution of secondary phases of
the specimens after welding. The shielded metal arc welding variables used in
the welding of specimen B, welded at an inter-pass temperature of 135-140°C,
were the most optimum as they resulted in an average weld metal ferritescope
ferrite content measurement of 3.8%, equivalent to FN 3.8, which was closest to
the desired weld metal ferrite number of 5-8 FN.

- 109 -
VII CHAPTER SEVEN - FUTURE WORK OPPORTUNITIES
• To determine the influence of welding interpass temperature on delta ferrite
content and solidifation mode on 304H stainless steel when welding with
higher heat input welding process e.g. GMAW and SAW.
• The parent metal used in this research fell marginally in the Type 304H range
and could have been classified as a Type 304 stainless steel; further work
can be done with the use of Type 304H parent material which has a carbon
content greater than 0.071 wt%.

- 110 -
VIII REFERENCES
1. Albright, L.F., & Hansen, D.A., 2009, ‘Albright’s chemical engineering
handbook’,CRC Press, Boca Raton, Florida.
2. Ahlblom, B., Sandström, R., 1982, ‘Hot workability of stainless steels: influence of
deformation parameters, microstructural components, and restoration processes’,
International Metals Reviews, vol. 27, Issue 1, pp.1-27.
3. American Petroleum Institute., 2003,’Calculation of heater tube thickness in
petroleum and natural gas industries’, American Petroleum Institute recommended
practice 530, 5th ed, API Publishing Services, Washingtin DC.
4. American Petroleum Institute., 2009, ‘Welding guidelines for the chemical, oil and
gas industries’, American Petroleum Institute 582, 2nd ed, API Publishing Services,
Washingtin DC.
5. Andresen, P. L., Solomon, H. D., & Taylor, D. F., 1981, ‘Basic Studies on the
Variabilities of Fabrication-Related Sensitization Phenomena in Stainless Steels’,
EPRI NP-1823, Project 1072-1, Final Report, May 1981, pp. 2–18.
6. ASME. 1977 (July). 1977 code cases, nuclear components, 1977 ed., case N-47-12 (1592-12), appendix 1-14, table 1-14.6A, p. 152. New York.
7. Atlas steels, 2011, Atlas Tech Note No. 8. August 2011. pdf, viewed 20 April 2014, from http://www.atlassteels.com.au/documents.
8. Bermejo, M., 2012, ‘Predictive and measurement methods for delta ferrite
determination in stainless steels’, Welding journal, April 2012, pp. 11-12.
9. Binder, W.D., Brown, C.M., 1946, ‘Proceedings of the American society for testing and materials’, Vol. 46, pp. 593.
10. Bramfitt, B., & Benscoter, A., 2002, metallographic guide: practices and procedures
for irons and steels‘, ASM International, Materials Park.
11. Briant, C.L., 1882, ‘Effects of nitrogen and cold work on the sensitization of
austenitic stainless steels’, EPRI NP-2457, Project 1574-1, final report, June 1982.
12. Bruemmer, S., & Gas, G.,1994, ‘Microstructural and microchemical mechanisms
controlling intergranular stress corrosion cracking in light-water-reactor systems’,
Journal of Nuclear Materials 216, pp. 348-363.

- 111 -
13. Castro, R & de Cadanet, J.J., 1975, Welding metallurgy of stainless & heat resistant
steels, Cambridge University Press Bentley House, Euston, London.
14. Chalmers, B., & Rutter, J.W., 1953,’Á prismatic substructure formed during
solidification of metals’, Canadian Journal of Physics, vol. 31, no. 1, pp.15-39.
15. Davis, J.R., 1994, ‘ASM specialty handbook: stainless steels’, ASM International, Ohio.
16. Dillon, C.P., & Dekker, M., 1995, ‘Corrosion resistance of stainless steels: high-temperature applications, pp. 245-269.New York.
17. Long, C.J., & Delong W.T., 1974 ‘Ferrite in austenitic stainless steel weld metal’,
Welding Journal 52(7), pp. 281s-297s.
18. Elmer, J.W., Allen, S. M., and Eagar, T.W., 1989, Metallurgical and materials
transactions, Vol 20A, 1989, pp. 2117.
19. Escriba, D.M., Pimenta Jr, F.C., Plaut, R.L., & Padihla, A.F., 2006, ‘Comparative
study on sigma phase precipitation of three types of stainless steels: austenitic,
superferritic and duplex’, Materials Science and Technology, 22(9), 1098-1104.
20. Folkhard, E., Rabensteiner, G., Perteneder, E., Schabereiter, H., & Tosch, J., 1984,
Welding metallurgy of stainless steels, Springer-verlag/Wien, New York.
21. Funderburk, R. S., 1998, ‘Key concepts in welding engineering: the importance of
inter-pass temperature’, Welding Innovation, vol. xv, No 1.
22. Funderburk, R. S., 2000, ‘Taking your weld’s temperature’, Modern Steel
Conctruction, February 2000.
23. Handbook committee & Olson, D.L., 1993, ASM handbook: Welding, brazing, and
soldering, vol. 6, ASM International.
24. Handbook committee & Olson, D.L., 1993, ASM handbook: Metallography and
Microstructures, vol. 9, ASM International.
25. Hedström, P., Lienert, U., Almer, J., & Odén, M., 2008, ‘Elastic strain evolution and ε-martensite formation in individual austenite grains during in situ loading of a metastable stainless steel’, Mater Letter, Vol. 62, pp. 338-340.
26. Jorge, L., Seijas, H., & Seijas, A., 2006, ‘Sigma phase embrittlement of stainless
steel in fcc service’, NACE International Conference, San Diego Ca, 16 March 2006.
27. Kaushish, J. P., 2008, ‘Manufacturing processes’, Prentice-Hall, Connaught Circus,
New Delhi.

- 112 -
28. Keown, S.R., 1980, ‘Hot ductility of wrought austenitic stainless steels part I: Effect
of alloying additions’, In: Hot working and forming processes, The Metals Society,
pp. 140-147. London.
29. Kontecki, D. J., & Siewert, T.A., 1992, ‘WRC-1992 constitution diagram for stainless
steel weld metals:A modification of the WRC-1998 diagram’, Welding Journal , May
1992, pp. 171s-178s.
30. Korinko, P.S., & Malene, S.H., ‘Considerations for the weldability of type 304L and
316L stainless steels’, Practical failure analysis, vol. 1, no 4, pp. 61-68.
31. Kou, S., 2003, Welding Metallurgy, 2nd ed, John Wiley and Son Inc, Hoboken, New
Jersey.
32. Kujanpaa, V., Suutala, N., Takalo, T. & Moisio, T., 1979, Welding Research International, vol.9, pp. 55.
33. Kutz, M., 2002, Handbook of materials selection, John Wiley and Sons, New York.
34. Lacombe, P., Baroux, B., Beranger, G., 1993, ‘Stainless Steels’, Editions of the Pysiques Les Ultis, pp. 42.
35. Lee, C.H., 1985, ‘The effect of welding variables on HAZ sensitization behaviour of
austenitic stainless steels’, The University of Tennessee, March 1985.
36. Losert, W., Shi, B.Q., & Cummings, H.Z., 1998, ‘Evolution of dendritic patterns
during alloy solidification: Onset of the initial instability’ Proceedings of the National
Academy of Science of the United States, vol. 95, no 2, January 1998, pp. 431-438.
37. Lippold, J.C., & Savage, W.F., 1982, ‘Solidification of austenitic stainless steel
weldments: part 3 – The effect of solidification behaviour on hot cracking
susceptibility’, Welding Journal, vol. 61, no 12, December 1982, pp. 338-396.
38. Lundin, C.D., Chou, C.P.D., & Sullivan, C.J., 1980, ‘Hot cracking resistance of
austenitic stainless steel weld metals’, WRC Bulletin 256, 226-252.
39. Marshall, P., 1984, Austenitic Stainless Steels: Microstructure and mechanical
properties, Elsevier Applied Science, pp. 23, London.
40. Mehl, R.F., 1972, ‘Metals Handbook: Atlas of microstructures of industrial alloys’, 8th
Ed, vol. 7, Materials Park, Ohio.
41. Milada,M., Zreibaa, M., Elhalouanib, F., Baradaib, C., 2008, ‘The effect of cold work on structure and properties of AISI 304 stainless steel’, Journal of Materials Processing Technology, Vol. 203, pp.80–85.

- 113 -
42. Mumtaz, K., Takahashi, S., Echigoya, J., Kumara, K., Zhang, L., Kikuchi, H., Ara, K., & Sato, M., 2004, ‘Magnetic measurements of the reverse martensite to austenite transformation in a rolled austenitic stainless steel’, Journal of Material Science, Vol 39, pp. 1997–2010.
43. M´Esz´Arosa, I., & Proh´Aszkab, J., 2005, ‘Magnetic investigation of the effect of ά-martensite on the properties of austenitic stainless steel’, Journal of Material Processing Technology, Vol 161, pp 162–168.
44. Nickel Development Institute., 1992, ‘Guidelines for welded fabrication of nickel-
containing steels for corrosion resistant service’, The Nickel Development Institute
Reference Book Series N° 1100, 26-27. Viewed from,
www.nickelinstitute.org/index.cfm/ci_id/15786/la_id/1.htm
45. Ogawa, T., & Tsunetomi, E., 1982, ‘Hot cracking susceptibility of austenitic stainless
steels’, Welding Journal, March 1982, pp. 82-93.
46. Petzow, G., 1978, Metallographic etching: techniques for metallogrpahy,
ceramography, plastography, 2nd Ed, ASM International, Metals Park, Ohio.
47. Padilha, A.F., Tavares, C.F., Martorano, M.A., 2013, ‘Delta ferrite formation in
austenitic stainless steel castings’, Material Science Forum Vols. 730-732, pp.733-
738.
48. Padilha, A.F., Plaut, R.L., & Rios, P.R., 2007, In: Totten GE (editor). Stainless steels heat treatment (chapter 12). Steel heat treatment handbook, 2 ed, pp. 695-739, CRC Press, Boca Raton, Florida.
49. Padilha, A.F, Plaut, R.L., & Rios, P.R., 2003, ‘Annealing of cold-worked austenitic stainless steels’, ISIJ International (Japan), 43(2), pp. 135-143.
50. Padilha, A.F, & Guedes, L.C., 1994, ‘Austenitic stainless steels: Microstructure and properties’, pp. 27-61, Hemus Publishing Limited, São Paulo.
51. Plaut, L. R., Herrera, C., Escriba, M. D., Rios, P. R., & Padilha A. F., 2007, ‘A short
review on wrought stainless steel at high temperatures: processing, microstructure,
properties and performance’, Materials Research, vol. 10, no 4, October 2007, pp.
453-460.
52. Priceputu, I.L., Moisa, B., Chiran, A., Nicolescu, G., & Bacinschi, Z., 2011, ‘Delta
ferrite influence in AISI 321 stainless steel welded tubes’, The Scientific Bulletin of
Valahia University – Materials and Mechanics 6(9), 87-96.
53. Povich, M.J., & Rao, P., 1978, ‘Low temperature sensitization of welded type 304
stainless steels’, Corrosion vol.34, No. 8

- 114 -
54. Rao, K., & Prasannakumar, S., 1984, ‘Assessment criterion for variability of delta
ferrite in austenitic weld and clad metals’, Welding Research Supplement, July 1984,
pp. 231-236.
55. Rivlin, V.G., & Raynor, G.V., 1980, International Metals Reviews, vol. 1, pp. 21-38.
56. Schmidt, C.G., Caligiuri, R.D., Eiselstein, L.E., & Wing, S., 1983, ‘Low tempeterature
sensitization of type 304 stainless steel weld heat affected zone’, EPRI Project
T110-1, final report, November 1983.
57. Schramm, R. E., & Reed, R. P., 1975, ‘Stacking fault energies of seven commercial
austenitic stainless steels’, Metallurgic. Material. Transaction. A., Vol. 6, pp 1345-
1351.
58. Sedriks, J.A., 1996, Corrosion of stainless steels, 2nd Ed, John Wiley and Sons Inc,
Third Avenue, New York.
59. Siewert, T.A., McCowan, C.N., & Olson, D.L., 1989, ‘Stainless steel weld metal:
prediction of ferrite content’ WRC Bulletin(324), pp. 36
60. Singh, R., 2011, Applied welding engineering: processes, codes and standards,
Elsevier, viewed 04 February 2014, from http://books.google.co.za/books.
61. Smith, G. V., 1969, ‘An evaluation of the yield, tensile, creep, and rupture strengths of wrought 304, 316, 321, and 347 stainless steels at elevated temperatures’, ASTM data series DS 5S2 prepared for the Metal Properties Council, American Society of Testing and Materials. February 1969, Philadelphia.
62. Stickler, R., Vincier, A., 1961, ‘Nucleation of M23C6 on various phase boundaries in
an Fe-18Cr-8Ni-0.52Mo-0.038C stainless steel’ Acta Metallurgica: vol.9, pp.898.
63. Svensson, L.E., Hidesjo, C.,1999, ‘Exploiting Advances in Arc Welding Technology:
Consumables for welding high strength steels’, Abington Publishing, Cambridge, England.
64. Svensson, L. E., 1994, ‘Control of Microstructures and Properties in Steel Arc
Welds’, CRC Press Inc, Boca Raton, Florida.
65. Van der Voort, G.F., 1999, Metallogrpahy: Principles and practice, ASM
International, Materials Park, pp. 227.
66. Voorhees, H. R., 1979, ‘Interim data summary’, Metal Properties Council, January 1979, contract no. 174-1, project D.

- 115 -
67. Wilks, G.W., 2002, ‘Weld cracking in a 72-inch stainless steel fcu duct’, Stainless
Steel World, 21-26.
68. XU, L., Zang, J., & Chen, Y., 2010, ‘Effect of heat input on the microstructure and
mechanical properties of 07MnCrMoVR weld joints’, Chinese Journal of Mechanical
Engineering 24, 1-6.