the influence of selenium status on immune …
TRANSCRIPT

University of Kentucky University of Kentucky
UKnowledge UKnowledge
Theses and Dissertations--Animal and Food Sciences Animal and Food Sciences
2012
THE INFLUENCE OF SELENIUM STATUS ON IMMUNE FUNCTION THE INFLUENCE OF SELENIUM STATUS ON IMMUNE FUNCTION
AND ANTIOXIDANT STATUS IN THE HORSE AND ANTIOXIDANT STATUS IN THE HORSE
Mieke Brummer University of Kentucky, [email protected]
Right click to open a feedback form in a new tab to let us know how this document benefits you. Right click to open a feedback form in a new tab to let us know how this document benefits you.
Recommended Citation Recommended Citation Brummer, Mieke, "THE INFLUENCE OF SELENIUM STATUS ON IMMUNE FUNCTION AND ANTIOXIDANT STATUS IN THE HORSE" (2012). Theses and Dissertations--Animal and Food Sciences. 7. https://uknowledge.uky.edu/animalsci_etds/7
This Doctoral Dissertation is brought to you for free and open access by the Animal and Food Sciences at UKnowledge. It has been accepted for inclusion in Theses and Dissertations--Animal and Food Sciences by an authorized administrator of UKnowledge. For more information, please contact [email protected].

STUDENT AGREEMENT: STUDENT AGREEMENT:
I represent that my thesis or dissertation and abstract are my original work. Proper attribution
has been given to all outside sources. I understand that I am solely responsible for obtaining
any needed copyright permissions. I have obtained and attached hereto needed written
permission statements(s) from the owner(s) of each third-party copyrighted matter to be
included in my work, allowing electronic distribution (if such use is not permitted by the fair use
doctrine).
I hereby grant to The University of Kentucky and its agents the non-exclusive license to archive
and make accessible my work in whole or in part in all forms of media, now or hereafter known.
I agree that the document mentioned above may be made available immediately for worldwide
access unless a preapproved embargo applies.
I retain all other ownership rights to the copyright of my work. I also retain the right to use in
future works (such as articles or books) all or part of my work. I understand that I am free to
register the copyright to my work.
REVIEW, APPROVAL AND ACCEPTANCE REVIEW, APPROVAL AND ACCEPTANCE
The document mentioned above has been reviewed and accepted by the student’s advisor, on
behalf of the advisory committee, and by the Director of Graduate Studies (DGS), on behalf of
the program; we verify that this is the final, approved version of the student’s dissertation
including all changes required by the advisory committee. The undersigned agree to abide by
the statements above.
Mieke Brummer, Student
Dr. L.M. Lawrence, Major Professor
Dr. D.L. Harmon, Director of Graduate Studies

THE INFLUENCE OF SELENIUM STATUS ON IMMUNE FUNCTION AND ANTIOXIDANT STATUS IN THE HORSE
DISSERTATION
A dissertation submitted in partial fulfillment of the requirements for the degree Doctor of Philosophy in the
College of Agriculture at the University of Kentucky
By Mieke Brummer
Lexington, Kentucky
Director: Dr. L.M. Lawrence, Professor of Animal Science Lexington, Kentucky
2012
Copyright © Mieke Brummer 2012

ABSTRACT OF DISSERTATION
THE INFLUENCE OF SELENIUM STATUS ON IMMUNE FUNCTION AND ANTIOXIDANT STATUS IN THE HORSE
Selenium (Se) has received a lot of attention for its antioxidant and immune modulating properties. Yet, comparably few studies have focused on the horse. Therefore the objectives of this research were to evaluate the influences of Se status on immune function and antioxidant defense in horses. Twenty eight horses were allocated to one of 4 dietary Se treatments: low (LS), adequate (AS), high organic (SP) and high inorganic (SS). First, horses assigned to LS, SP and SS were depleted of Se and received a low Se diet (0.07 ppm Se) for 35 wk, while AS received an adequate Se diet (0.14 ppm Se). During week 28 to 35 immune function was evaluated using a vaccine challenge with keyhole limpet hemocyanin (KLH) and equine influenza as antigens. Then, a 29 wk repletion phase followed. The LS and AS received the same diets described above while SP received an organic Se supplemented diet (0.3 ppm; Sel-Plex, Alltech, Nicholasville, KY) and SS an inorganic Se supplemented diet (0.3 ppm; sodium selenite). Immune function was assessed using a vaccine challenge with ovalbumin (OVA) and equine influenza as antigens during week 22 to 29. Samples collected throughout the depletion and repletion phases were used to assess change in Se status, antioxidant status and oxidative stress. Finally, a mild exercise test served to assess exercise induced oxidative stress. The experimental model responded as hypothesized, evaluated by blood Se and glutathione peroxidase (GPx) activity. Upon vaccination with KLH, antibody response was faster in AS than LS. Antigen specific mRNA expression of T-bet was also higher for AS than LS. Following OVA vaccination humoral and cell-mediated vaccination responses were similar across treatments. However, non-specific stimulation of peripheral blood mononuclear cells indicated suppressed mRNA expression of selected cytokines for LS compared to AS, SP and SS. Antioxidant capacity and oxidative stress were unaffected by change in Se status. A difference in GPx response post exercise was also noted between SP and SS. Low Se status impaired some measures of immune function. Supplementation at 0.3 ppm may benefit horses as indicated by higher GPx activity in idle and exercised horses.

Key words: Equine, keyhole limpet hemocyanin, ovalbumin, glutathione peroxidase, oxidative stress
Mieke Brummer Student’s Signature
July 2012 Date

THE INFLUENCE OF SELENIUM STATUS ON IMMUNE FUNCTION AND ANTIOXIDANT STATUS IN THE HORSE
By Mieke Brummer
Dr. L.M. Lawrence Director of Dissertation
Dr. D.L. Harmon
Director of Graduate Studies
July 2012 Date

iii
ACKNOWLEDGEMENT
Appreciation is extended to the following persons for their contributions:
Dr. Lawrence for her exceptional guidance, support and countless hours dedicated to all
aspects of my PhD program and research.
Dr. Horohov for providing me with the opportunity to learn and conduct all the
immunology related assays in his laboratory.
Dr. Boling and Dr. Dawson for their contributions to my research projects and PhD
program and serving as committee members.
Alltech: Dr. T.P. Lyons and Dr. Dawson for funding my PhD program and the Alltech-
UK Nutrigenomics Alliance for funding my research.
The laboratory technicians, especially Susan Hayes and Alejandra Betancourt, and the
long list of fellow graduate students who assisted with the day-to-day execution of the
research studies, sample collection and sample processing.
A special thank you to my wonderful husband Vaughn, my parents Gerhard and Elmarie,
my brother Wichard, and my Pablo for all the moral support and understanding.
All the unforgettable horses who participated in my research studies: Vivano, Ionian, Aly
Sangue, Eighth Note, Shipper, Spanish Note, Iddy Bitty, Charlmar, Menka, Miss Alibye,
Miss Olive, Tonosi, Thunder, T.E., Windspiel, Smart Girl, Lilly, Cashmere, Sweet
Champagne, Betty, Linus, Marksman, Kelo, Easy, Crafty, Bounce, Silver and Nip.

iv
TABLE OF CONTENTS ACKNOWLEDGEMENT ................................................................................................. iii
LIST OF TABLES .............................................................................................................. x
LIST OF FIGURES ......................................................................................................... xiii
FREQUENTLY USED ABBREVIATIONS ................................................................... xiv
CHAPTER 1: Introduction ................................................................................................. 1
CHAPTER 2: Literature Review ........................................................................................ 4
Soil selenium distribution................................................................................................ 4
Selenium supplementation .............................................................................................. 5
Selenium metabolism ...................................................................................................... 6
Selenoproteins ................................................................................................................. 8
Selenium supplementation and the horse .......................................................................... 11
Selenium toxicity and deficiency .................................................................................. 11
Selenium requirements .................................................................................................. 13
Current dietary Se recommendations: ........................................................................... 14
Effect of Se source on response variables ..................................................................... 15
The effect of selenium on the immune system ................................................................. 19
The immune system ...................................................................................................... 20
Assessing immune response: ......................................................................................... 23
Selenium and the equine immune system ..................................................................... 25
Selenium and immune function in other species ........................................................... 27
Selenium and immune function: Mechanism of action .................................................... 40
Selenium as antioxidant during exercise........................................................................... 46
Summary and study objectives: ........................................................................................ 55
CHAPTER 3: The relationship between selenium status, antioxidant status and the immune system of the horse ............................................................................................. 68
INTRODUCTION ............................................................................................................ 68
MATERIALS AND METHODS ...................................................................................... 69
Animals and Sampling: ................................................................................................. 69
Se and antioxidant status: .............................................................................................. 70

v
Complete Blood Count (CBC): ..................................................................................... 71
Peripheral blood mononuclear cell (PBMC) isolation: ................................................. 71
IFNγ and TNFα Intracellular Staining: ......................................................................... 71
Relative expression of cytokine mRNA ........................................................................ 72
Lymphocyte proliferation:............................................................................................. 73
Statistical analysis: ........................................................................................................ 73
RESULTS AND DISCUSSION ....................................................................................... 74
CONCLUSION ................................................................................................................. 77
CHAPTER 4: Effect of Selenium Deficiency on the Vaccination Response and Immune Function in the Adult Horse .............................................................................................. 82
INTRODUCTION ............................................................................................................ 82
MATERIALS AND METHODS ...................................................................................... 83
Animals: ........................................................................................................................ 83
Experimental design: ..................................................................................................... 83
Diets and treatments: ..................................................................................................... 84
Blood sampling procedures: .......................................................................................... 85
Vaccine challenge: ........................................................................................................ 85
Laboratory procedures: ................................................................................................. 86
Peripheral blood mononuclear cell isolation: ................................................................ 86
In vitro cell cultures: ..................................................................................................... 87
Intracellular staining for IFNγ and TNFα: .................................................................... 88
Cytokine mRNA expression in stimulated PBMC: ...................................................... 88
Lymphocyte proliferation:............................................................................................. 89
KLH specific IgG production:....................................................................................... 90
Equine influenza (A/equine/KY/5/02) antibody production: ........................................ 91
Complete blood count analysis: .................................................................................... 92
Selenium Status: Whole blood selenium ....................................................................... 93
Selenium Status: Whole blood glutathione peroxidase activity .................................... 93
Statistical analysis ......................................................................................................... 93
RESULTS ......................................................................................................................... 94
Selenium and vitamin E status: ..................................................................................... 94

vi
Complete blood count data:........................................................................................... 94
KLH vaccination response: ........................................................................................... 94
Equine influenza vaccination response: ........................................................................ 95
Mitogen stimulation: ..................................................................................................... 95
DISCUSSION ................................................................................................................... 96
CONCLUSION ............................................................................................................... 101
CHAPTER 5: The Effect of Selenium Supplementation on Vaccination Response and Immune Function in Adult Horses .................................................................................. 112
INTRODUCTION .......................................................................................................... 112
MATERIALS AND METHODS .................................................................................... 113
Animals: ...................................................................................................................... 113
Experimental design, diets and treatments: ................................................................. 113
Blood sampling: .......................................................................................................... 116
Vaccine challenge: ...................................................................................................... 116
Laboratory procedures: ............................................................................................... 117
Selenium Status: Whole blood selenium ..................................................................... 117
Selenium Status: Whole blood glutathione peroxidase (GPx) activity ....................... 117
Complete blood count analysis (CBC): ....................................................................... 118
Peripheral blood mononuclear cells (PBMC): ............................................................ 118
In vitro cell cultures: ................................................................................................... 118
Intracellular staining for IFNγ and TNFα: .................................................................. 119
Cytokine mRNA expression in stimulated PBMC ...................................................... 120
In vivo cytokine expression: Paxgene analysis ........................................................... 120
Lymphocyte proliferation:........................................................................................... 121
Antibody production: OVA specific ELISA ............................................................... 122
Equine influenza (KY/5/02) antibody production:...................................................... 122
Statistical analysis: ...................................................................................................... 124
RESULTS ....................................................................................................................... 124
Selenium and vitamin E status: ................................................................................... 124
Complete blood count data:......................................................................................... 125
OVA vaccination response: ......................................................................................... 125

vii
Flu vaccination response: ............................................................................................ 126
General immune response: .......................................................................................... 126
DISCUSSION ................................................................................................................. 127
CONCLUSION ............................................................................................................... 135
CHAPTER 6: Measures of Antioxidant Status of the Horse in Response to Selenium Depletion and Repletion ................................................................................................. 148
INTRODUCTION .......................................................................................................... 148
MATERIALS AND METHODS .................................................................................... 149
Animals: ...................................................................................................................... 149
Experimental design, diets and treatments: ................................................................. 149
Depletion phase: .......................................................................................................... 150
Repletion phase: .......................................................................................................... 151
Blood sampling procedures: ........................................................................................ 152
Laboratory procedures: ............................................................................................... 153
Selenium Status: Whole blood selenium ..................................................................... 153
Selenium Status: Whole blood GPx activity ............................................................... 153
Complete blood count analysis (CBC): ....................................................................... 154
Serum total antioxidant capacity (TAC): .................................................................... 154
Serum malondialdehyde (MDA) concentration: ......................................................... 154
Triiodothyronine (T3) and thyroxine (T4): ................................................................. 155
Statistical analysis: ...................................................................................................... 155
RESULTS ....................................................................................................................... 155
Depletion phase: .......................................................................................................... 155
Repletion phase: .......................................................................................................... 156
DISCUSSION: ................................................................................................................ 158
CONCLUSION ............................................................................................................... 168
CHAPTER 7: Effect of Selenium Status on the Response of Unfit Horses to Exercise 180
INTRODUCTION .......................................................................................................... 180
MATERIALS AND METHODS .................................................................................... 181
Animals: ...................................................................................................................... 181
Experimental design, diets and housing: ..................................................................... 181

viii
Exercise test: ............................................................................................................... 183
Sampling protocol: ...................................................................................................... 183
Selenium Status: Whole blood selenium and GPx activity ......................................... 184
Serum malondialdehyde concentration: ...................................................................... 184
Whole blood cytokine mRNA expression: ................................................................. 184
Serum creatine kinase (CK) and aspartate aminotransferase (AST): .......................... 185
Fasting insulin and glucose: ........................................................................................ 185
Statistical analysis: ...................................................................................................... 186
RESULTS ....................................................................................................................... 186
DISCUSSION ................................................................................................................. 188
CONCLUSION ............................................................................................................... 194
CHAPTER 8: Conclusions and Implications .................................................................. 205
LITERATURE CITED: .................................................................................................. 207
APPENDIX A: ADDITIONAL DATA TABLES .......................................................... 222
Appendix Table 4.a. Composition of the adequate and low Se balancer pellet1 fed during the depletion and repletion phase. ................................................................ 222
Appendix Table 4.b. Example of the calculated total dietary Se intake* for a 500 kg horse......................................................................................................................... 223
Appendix Table 4.c. Intracellular production of IFNγ in response to in vitro stimulation with different mitogens1. ...................................................................... 224
Appendix Table 4.d. Intracellular production of TNFα in response to in vitro stimulation with different mitogens1. ...................................................................... 225
Appendix Table 4.e. Relative quantity of mRNA expression of transcription factors and cytokines in response to in vitro stimulation with equine influenza KY02. ..... 226
Chapter 5: .................................................................................................................... 227
Appendix Table 5.a. Intracellular production of IFNγ in response to in vitro stimulation with different mitogens1. ...................................................................... 227
Appendix Table 5.b. Intracellular production of TNFα in response to in vitro stimulation with different mitogens1. ...................................................................... 228
Appendix Table 5.c. The mRNA expression as relative quantity of cytokines2 in peripheral blood mononuclear cells stimulated with ovalbumin in vitro. ............... 229
Appendix Table 5.d. Relative quantity of mRNA expression of transcription factors and cytokines in response to in vitro stimulation with equine influenza KY02. ..... 230

ix
Chapter 6: .................................................................................................................... 232
Appendix Table 6.a. The thyroxine/triiodothyronine ratio evaluated in response to Se depletion and Se repletion. ...................................................................................... 232
Appendix Table 6.b. Lymphocyte and neutrophil numbers in horses on different dietary Se treatments during the repletion phase1. .................................................. 233
APPENDIX B: Laboratory protocols ............................................................................. 234
Methods relating to selenium and antioxidant status: ................................................. 234
Whole blood glutathione peroxidase activity: ............................................................. 234
Total Hemoglobin Assay:............................................................................................ 236
Total Antioxidant Assay: ............................................................................................ 237
Thiobarbituric Acid Reactive Substances Assay: ....................................................... 238
Methods relating to Immunology: ............................................................................... 240
PBMC isolation and antigen specific stimulation: ...................................................... 240
Autologous serum ....................................................................................................... 241
Lymphocyte proliferation assay: ................................................................................. 242
IFN γ / TNF α Staining (Intracellular Staining) .......................................................... 243
Total RNA purification: Paxgene Kit protocol ........................................................... 245
Total RNA purification: RNAstat samples ................................................................. 246
Reverse transcription of RNA ..................................................................................... 247
RealTime-PCR ............................................................................................................ 248
OVA/KLH ELISA PROTOCOL ................................................................................ 249
Influenza Specific IgGa, IgGb, IgG(T) ELISA procedure .......................................... 251
Influenza hemagglutination inhibition protocol .......................................................... 252
VITA ............................................................................................................................... 253
x
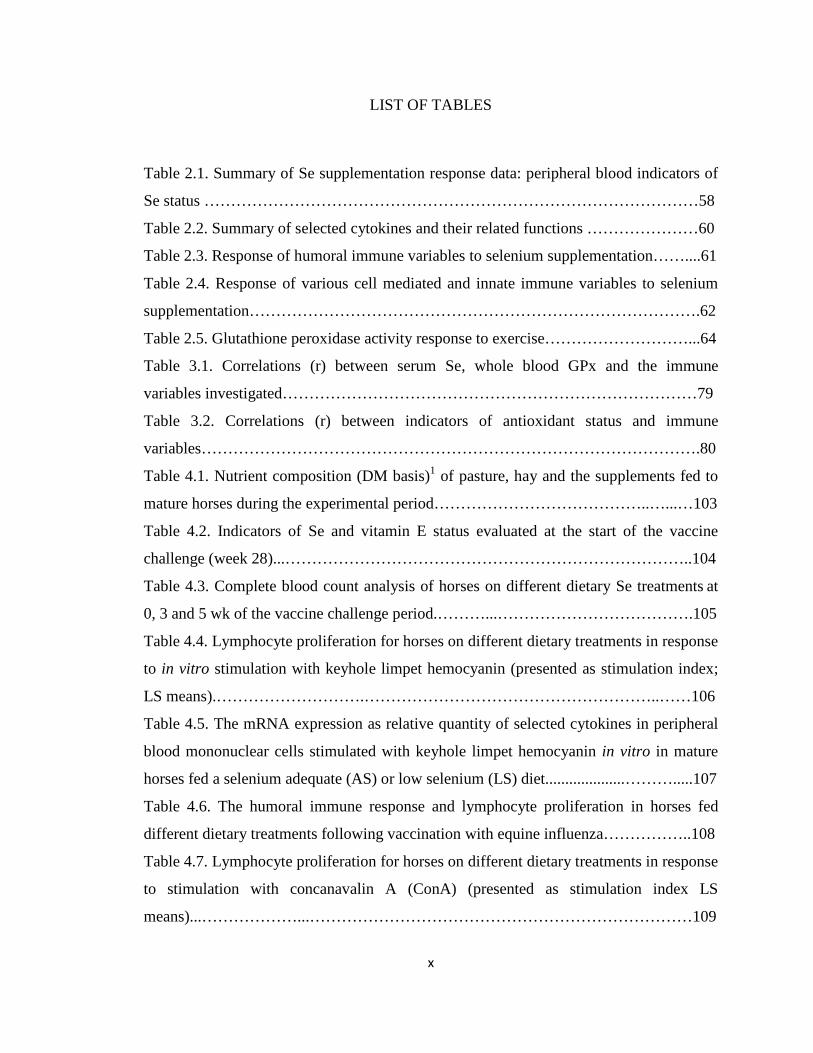
LIST OF TABLES
Table 2.1. Summary of Se supplementation response data: peripheral blood indicators of
Se status …………………………………………………………………………………58
Table 2.2. Summary of selected cytokines and their related functions …………………60
Table 2.3. Response of humoral immune variables to selenium supplementation……....61
Table 2.4. Response of various cell mediated and innate immune variables to selenium
supplementation………………………………………………………………………….62
Table 2.5. Glutathione peroxidase activity response to exercise………………………...64
Table 3.1. Correlations (r) between serum Se, whole blood GPx and the immune
variables investigated……………………………………………………………………79
Table 3.2. Correlations (r) between indicators of antioxidant status and immune
variables………………………………………………………………………………….80
Table 4.1. Nutrient composition (DM basis)1 of pasture, hay and the supplements fed to
mature horses during the experimental period…………………………………..…...…103
Table 4.2. Indicators of Se and vitamin E status evaluated at the start of the vaccine
challenge (week 28)...…………………………………………………………………..104
Table 4.3. Complete blood count analysis of horses on different dietary Se treatments at
0, 3 and 5 wk of the vaccine challenge period.………...……………………………….105
Table 4.4. Lymphocyte proliferation for horses on different dietary treatments in response
to in vitro stimulation with keyhole limpet hemocyanin (presented as stimulation index;
LS means).……………………….………………………………………………..……106
Table 4.5. The mRNA expression as relative quantity of selected cytokines in peripheral
blood mononuclear cells stimulated with keyhole limpet hemocyanin in vitro in mature
horses fed a selenium adequate (AS) or low selenium (LS) diet....................……….....107
Table 4.6. The humoral immune response and lymphocyte proliferation in horses fed
different dietary treatments following vaccination with equine influenza……………..108
Table 4.7. Lymphocyte proliferation for horses on different dietary treatments in response
to stimulation with concanavalin A (ConA) (presented as stimulation index LS
means)...………………...………………………………………………………………109

xi
Table 5.1. Nutrient composition (DM basis) of pasture and hay sampled throughout the
experimental period and balancer pellet fed during the Se repletion phase….……..….137
Table 5.2. Example of calculated dietary Se intake for a 500 kg horse………….…......138
Table 5.3. Indicators of Se and vitamin E status at the onset of the vaccine challenge
(presented as LS Means ±SE)…………………………………………………………..139
Table 5.4. Complete blood count analysis of horses on different dietary treatments during
the vaccine challenge……….……………..…………………………………………………...140
Table 5.5. Lymphocyte proliferation in response to different stimulations in horses on
different dietary treatment (presented as stimulation index LS means)…….………….141
Table 5.6. Humoral immune response variables in response to vaccination of mature
horses on different dietary treatments with equine influenza (KY02)…………..……...142
Table 5.7. mRNA expression as relative quantity of cytokines and transcription factors in
peripheral mononuclear cells stimulated with PMA from horses on different dietary
treatments during the vaccine challenge……...………………………………………...143
Table 5.8. Relative quantity of mRNA expression of cytokines in un-stimulated whole
blood from horses on different dietary treatments during the vaccine challenge…...….145
Table 6.1. Nutrient composition (DM basis) of pasture and hay sampled throughout the
experimental period and balancer pellet fed during the Se depletion phase..……….….169
Table 6.2. Example of the calculated total dietary Se intake for a 500 kg horse during the
depletion and repletion phase………..………………………………………………….170
Table 6.3. Nutrient composition (DM basis) of pasture and hay sampled throughout the
experimental period and balancer pellet fed during the Se repletion phase…….…..….171
Table 6.4. Whole blood Se concentration (ng/mL) and glutathione peroxidase activity
(mU/mg Hb) of mature horses during the depletion phase (LS Means)………………..172
Table 6.5. Change in total antioxidant capacity (TAC) and malondialdehyde (MDA)
concentration of horses during Se depletion phase (LS Means)....……………………..173
Table 6.6. Change in lymphocyte and neutrophil numbers in horses during the depletion
phase(LS Means).………….…………………………………………………………...174
Table 6.7. Whole blood Se concentration (ng/mL) measured throughout the repletion
phase (LS Means)………………………………………………………………………175
xii
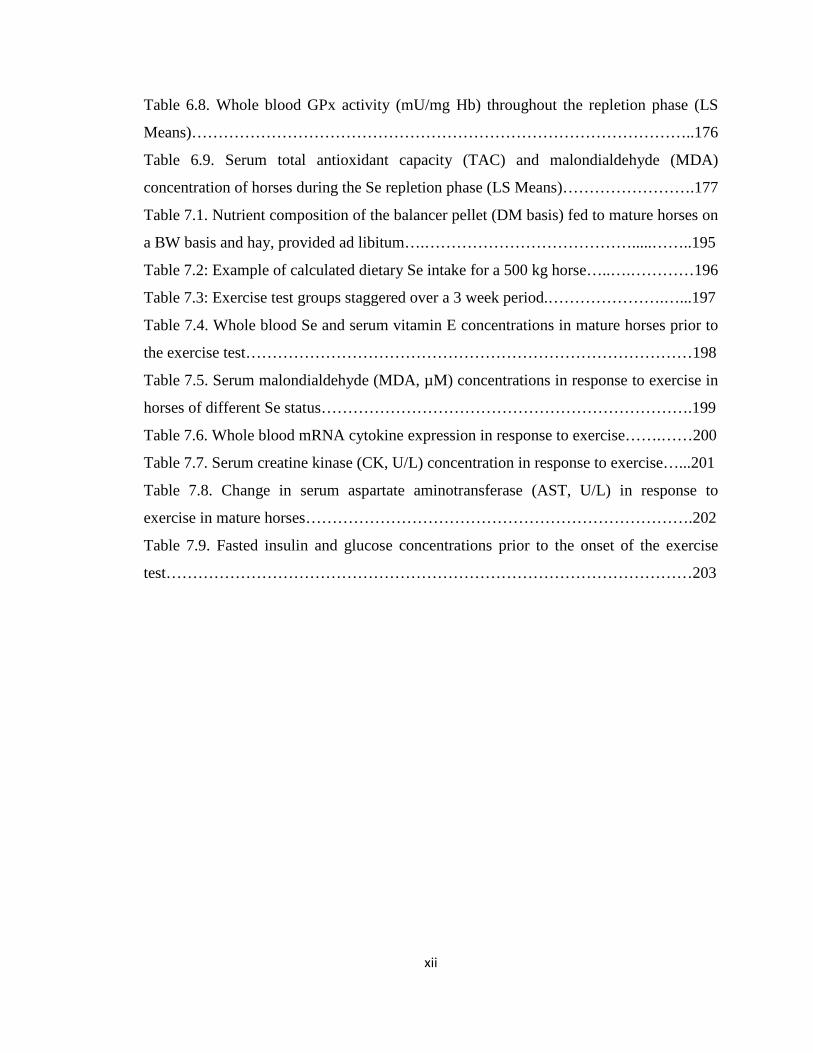
Table 6.8. Whole blood GPx activity (mU/mg Hb) throughout the repletion phase (LS
Means)…………………………………………………………………………………..176
Table 6.9. Serum total antioxidant capacity (TAC) and malondialdehyde (MDA)
concentration of horses during the Se repletion phase (LS Means)…………………….177
Table 7.1. Nutrient composition of the balancer pellet (DM basis) fed to mature horses on
a BW basis and hay, provided ad libitum….………………………………….....……..195
Table 7.2: Example of calculated dietary Se intake for a 500 kg horse…..….…………196
Table 7.3: Exercise test groups staggered over a 3 week period.………………….…...197
Table 7.4. Whole blood Se and serum vitamin E concentrations in mature horses prior to
the exercise test…………………………………………………………………………198
Table 7.5. Serum malondialdehyde (MDA, µM) concentrations in response to exercise in
horses of different Se status…………………………………………………………….199
Table 7.6. Whole blood mRNA cytokine expression in response to exercise…….……200
Table 7.7. Serum creatine kinase (CK, U/L) concentration in response to exercise…...201
Table 7.8. Change in serum aspartate aminotransferase (AST, U/L) in response to
exercise in mature horses……………………………………………………………….202
Table 7.9. Fasted insulin and glucose concentrations prior to the onset of the exercise
test………………………………………………………………………………………203

xiii
LIST OF FIGURES
Figure 2.1. Selenium metabolism pathway as adapted from Combs (2001), Rayman
(2001), Papp et al. (2007) and Hesketh (2008)…………………………………………..65
Figure 2.2. Detoxification of H2O2 by glutathione peroxidase via glutathione
recycling………………………………………………………………………………….66
Figure 2.3. Experimental design and treatment allocation during the depletion and
repletion phase…………………………………………………………………………...67
Figure 3.1. The correlation between the amounts of IFNγ produced by stimulated
lymphocytes and whole blood glutathione peroxidase activity (μmol NADPH
oxidized·mL-1·min-1·g protein) (r = 0.78; p = 0.0002; n=17)…………………………….81
Figure 4.1. Sampling and vaccination time points for KLH vaccination………………………110
Figure 4.2. Anti-KLH-IgG response to KLH vaccination in mature horses………...….111
Figure 5.1. Sampling and vaccination time points for OVA vaccination……………....146
Figure 5.2. Anti-OVA-IgG levels in response to OVA vaccination of mature
horses.…………………………………………………………………………………..147
Figure 6.1. Experimental design and treatment allocation during the depletion (196 d) and
repletion (189 d) phase…………………………………………….……………………178
Figure 6.2. Serum vitamin E concentration (µg/mL) throughout the depletion and
repletion phases……..…………………………………………………………………..179
Figure 7.1. Change in whole blood glutathione peroxidase activity (mU/mg hb) in
response to exercise in unfit horses on different dietary treatments……………..……..204

xiv
FREQUENTLY USED ABBREVIATIONS
Abbreviations relating to selenium and antioxidant measures
AST - Aspartate amino-transferase
CBC – Complete blood count
CK – Creatine kinase
GPx - Glutathione peroxidase
ID - Iodothyronine deiodinases
H2O2 – Hydrogen peroxide
MDA – Malondialdehyde
ROS – Reactive oxygen species
Se - Selenium
Se-Cys - Seleno-cysteine
Se-Met - Selenomethionine
T3 - Triiodothyronine
T4 – Thyroxine
TAC – Total antioxidant capacity
TBARS – Thiobarbituric acid reactive substances
TrxR - Thioredoxin reductase

xv
Abbreviations relating to immunology
CMI – Cell-mediated immune response
Con A – Concanavalin A
ELISA - Enzyme-linked immunosorbent assay
GATA3 – Transcription factor, GATA-binding protein 3
HA titer – Hemagglutination titer
IgG – Immunoglobulin G
IFNγ – Interferon
IL- Interleukin
KLH – Keyhole limpet hemocyanin
OVA - Ovalbumin
PBMC – Peripheral blood mononuclear cells
PHA - Phytohemagglutinin
PMA - Phorbol 12-myristate 13-acetate
RBC – Red blood cell
SRBC – Sheep red blood cell
T-bet – Transcription factor, T-box expressed in T-cells
Th – T-helper cell
TNFα – Tumor necrosis factor alpha

1
CHAPTER 1: Introduction
Selenium (Se) was recognized as an essential trace mineral in 1957 by Schwarz
and Foltz who demonstrated that Se prevented necrotic liver degeneration in rats
(Schwarz and Foltz, 1957). They also determined that organic Se could be replaced with
inorganic Se salts. Finally, the authors hypothesized that Se could play a part in oxidative
metabolism in the liver (Schwarz and Foltz, 1957). Since, Se has been shown to not only
be involved in the antioxidant mechanism of the body (Hargreaves et al., 2002), but has
also been shown to play a role in immune function (Beck et al., 2001). One of the unique
characteristics of Se is the fact that it can be incorporated into proteins. Incorporation into
proteins is either non-specific as Se-methionine (Se-Met) into organs and skeletal
muscles where it contributes to the Se-stores of the body (Schrauzer, 2000), or specific as
Se-cysteine (Se-Cys), during the synthesis of the selenoproteins (Papp et al., 2007).
Approximately 25 selenoproteins have been identified, although not all of their functions
have been fully characterized (Surai, 2006). It is via these selenoproteins that Se is
thought to exert its effects on both the antioxidant (Hargreaves et al., 2002) and the
immune system (Goldson et al., 2011).
Because soil Se content tends to vary and the Se content of forages and plants
depend on the soil Se content, dietary Se intake can be varied. As a consequence many
areas, such as central Kentucky, are marginal in Se (Kubota et al., 1967). Without
supplementation the Se status of horses kept in these areas will decline over time.

2
Selenium is believed to contribute to the antioxidant mechanism of the body via
the selenoenzyme glutathione peroxidase (GPx), which functions to neutralize hydrogen
peroxide and protect against oxidative damage (Battin and Brumaghim, 2009).
Glutathione peroxidase activity as well as serum Se concentration has been shown to be
altered post exercise, hypothesized to be indicative of the role of Se in combating
exercise induced oxidative stress (Akil et al., 2011; White et al., 2011).
Selenium has also been shown to be important for the optimal functioning of the
immune system, although the exact mechanism through which Se and the immune system
interact remains unknown. In studies with mice, Se status has been shown to affect the
mRNA expression of some immune modulating cytokines (Li and Beck, 2007) and
cytokine receptor, e.g. interleukin-2 receptor (Roy et al., 1994). Alteration in lymphocyte
proliferation has also been linked with Se status (Roy et al., 1994). Studies investigating
the effect of Se on the equine immune system are limited (Knight and Tyznik, 1990;
Janicki, 2001; Thorson et al., 2010) and the relationship of Se status to immune related
cytokines in the horse has not been investigated.
Currently the NRC (2007) recommends a dietary Se intake of 1 mg/d for a 500 kg
mature, idle horse. The research conducted by Janicki (2001) indicated that a higher Se
intake of 3 mg/d by broodmares may be beneficial for immune function of their foals.
Improved immune function through appropriate Se supplementation can be of benefit to
the horse industry, especially if greater protection from exercise induced oxidative stress
can be attained at the same time.

3
The primary hypothesis was that Se status would affect immune function and
antioxidant status. To test this hypothesis the first objective of this current research was
to evaluate the effect of Se status on oxidative stress and antioxidant status as horses were
first depleted of Se, then repleted using two different sources of Se. The second objective
was to determine if Se status affected the ability of the immune system to respond to both
a novel and previously administered vaccine. To investigate these objectives a three
phase experiment was conducted over a period of 18 mo.
Phase 1: The aim of phase 1 was to determine the effect of a low Se diet on
indicators of Se status, oxidative stress and immune function.
Phase 2: The aim of phase 2 was to determine if Se repletion with either organic
or inorganic Se would result in changes in oxidative stress, antioxidant variables and
immune function as assessed by means of a vaccine challenge.
Phase 3: The aim of the final phase was to evaluate the effect of Se status on
oxidative stress and indicators of muscle damage in response to mild exercise.
Copyright © Mieke Brummer 2012

4
CHAPTER 2: Literature Review
Soil selenium distribution
Herbivores rely on plants to meet their selenium (Se) requirements (Montgomery
et al., 2011). However, the Se content of plants tends to reflect the amount and
bioavailability of Se in the soil (Ferguson and Karunasinghe, 2011), with the exception of
some plants that are capable of accruing Se such as the Astragalus species (Whanger,
2002; Montgomery et al., 2011). Geographically, soil Se concentration and
bioavailability can be diverse. Alkaline soils tend to have a higher Se bioavailability and
therefore better Se absorption by plants, while acidic soils, especially when combined
with high rainfall, tend to have poor Se bioavailability (MacDonald et al., 1976). Acidic
soils are therefore often associated with Se deficient pastures and crops (MacDonald et
al., 1976). Similarly, low soil Se bioavailability has been reported in areas prone to acid
rain (Brown and Arthur, 2001). Regions known to be low in Se include areas in the
Eastern United States, New Zealand, North East China (Brown and Arthur, 2001), parts
of Europe, Egypt (Montgomery et al., 2011) and parts of South Africa (Van Ryssen,
2001).
Dietary Se intake by humans is thought to be insufficient in many areas around
the world (Hesketh, 2008). Dietary Se intake is reported to be influenced by variability in
soil Se, resulting in variation in the Se status of humans (Brown and Arthur, 2001;
Ferguson and Karunasinghe, 2011) as well as grazing herbivores (Van Ryssen, 2001).
For instance, it is hypothesized that the Se status of humans in Europe have declined due

5
to less wheat being imported from the USA (Brown and Arthur, 2001). Several factors
are involved and affect the final in vivo effect of Se including the amount consumed, the
extent of digestion, absorption, how it is metabolized, and eventually how much is
excreted (Ferguson and Karunasinghe, 2011).
Selenium supplementation
Studies showing a relationship between dietary Se and the activity of the Se
containing protein (selenoprotein) glutathione peroxidase (GPx) introduced the concept
of improving functional Se status by means of dietary Se supplementation (Brown and
Arthur, 2001). The functional response to Se supplementation is not always observed,
which could be attributed to sufficient endogenous Se supply or the inability to activate
the protein of interest (Brown and Arthur, 2001). Recently, it has also been determined
that humans may have single-nucleotide polymorphisms that can affect the way in which
micronutrients such as Se are metabolized by different persons (Méplan et al., 2007;
Hesketh, 2008).
Many different dietary forms of Se supplementation exist, ranging from Se-
enriched foods via Se-fertilization of crops to the direct consumption of Se supplements
(Brown and Arthur, 2001; Montgomery et al., 2011). Se supplementation is normally
provided via the direct addition of Se to the concentrate portion of the animal’s diet.
Alternatively, it can be provided in the form of a selenized salt block (Hintz, 1999). The
source of dietary Se supplementation can either be inorganic or organic. Inorganic Se is
normally in the form of a mineral salt such as sodium selenite (Na2SeO3) or sodium

6
selenate (Na2SeO4). Selenomethionine (Se-Met) is a well-known organic form of Se
(Juniper et al., 2008). Generally, Se-Met is the main form of Se found in Se enriched
grains as well as selenized yeast (Whanger, 2002). Selenized yeast products are currently
used in the manufacture of organic Se supplements. The production of selenized yeast
requires the aerobic fermentation by Saccharomyces cerevisiae in Se enriched beet or
cane sugar (Rayman, 2007). Different companies tend to use their own specific strains of
this yeast. The final yeast cream end product of this fermentation process is pasteurized
and dried, and at least 90% of the Se should be bound to the yeast or in the complexed
organic form (Rayman, 2007).
Selenium metabolism
Vendeland et al. (1992) conducted a study with rats, investigating the intestinal
absorption of different forms of Se (Se-Met, selenite and selenate). The researchers
found that although all forms of dietary Se were absorbed in the small intestine (SI),
some forms of Se were more readily absorbed (and at different rates) in specific sections
of the SI compared to others. Overall, Se-Met was reported to be most rapidly absorbed.
When comparing the inorganic forms, selenate was found to be more efficiently absorbed
in the distal portions of the small intestine while selenite absorption in the duodenum
exceeded that of selenate (Vendeland et al., 1992). A potential reason for these
differences may lie in the transport of Se across the intestine. Selenate is actively
transported by sodium dependent transporters localized in the distal portion of the small
intestine (Vendeland et al., 1992), while selenite is passively absorbed via simple
7
diffusion throughout the small intestine (Surai, 2006). Absorption of Se-Met occurs via
sodium-dependent amino acid transporters (Schrauzer, 2000).
Once absorbed the different sources of Se are not metabolized in the exact same
way. Deagen et al. (1987) compared the metabolism of seleno-cysteine (Se-Cys), Se-Met
and sodium selenite in mature rats. They reported that dietary Se-Cys was degraded by
Se-Cys-lyase to alanine and hydrogen selenide in the liver. Once in the selenide form it
followed the exact same metabolic pathway as sodium selenite. Se-Met on the other hand
was found to increase tissue Se levels beyond that of Se-Cys or sodium selenite. It was
hypothesized that the elevated tissue levels were due to the fact that Se-Met could
substitute for Met during protein synthesis, allowing for non-selenoprotein incorporation
of Se-Met (Deagen et al., 1987). Studies conducted in species such as pigs (Mahan and
Peters, 2004), broilers (Payne and Southern, 2005), cattle (Juniper et al., 2008) and
catfish (Wang and Lovell, 1997) have all reported higher tissue Se levels when organic
sources of Se were used.
The basic Se metabolism pathway is illustrated in Figure 2.1 (Combs, 2001; Papp
et al., 2007; Rayman, 2007; Hesketh, 2008). Once absorbed, Se is transported to the liver
(Wichtel, 1998). Se-Cys, whether of dietary origin or derived from Se-Met metabolism, is
degraded and converted to selenide (H2Se) in the liver (Schrauzer, 2000). Similarly,
selenate and selenite are reduced to selenide. Selenide will either be used for the
production of selenoproteins, or will be excreted via breath (dimethyl selenide; (CH3)2Se)
or urine (trimethyl selenonium ion; (CH3)3Se+) as depicted. As stated earlier, excess Se-
Met that is not metabolized after absorption can be non-specifically incorporated into

8
organs such as liver and kidneys or skeletal muscle where it contributes to the body’s Se
storage pool (Schrauzer, 2000).
The synthesis of selenoproteins from selenide involves several steps. Se-Cys is
synthesized directly on the tRNA using selenide, ATP and seryl-tRNA (Hesketh, 2008).
Seryl-tRNA[SER]SEC is converted to phosphoseryl-tRNA[SER]SEC by the enzyme
phosphoseryl tRNA kinase. Phosphorus is then replaced by Se donated by selenide, a
process initiated by selenophosphate synthetase (Papp et al., 2007) and selenocysteine
synthetase to transform selenophosphate to selenocysteyl-tRNA (Sec-tRNA[SER]SEC)
(Hesketh, 2008). Se-Cys is normally incorporated at the functional site of the
selenoprotein (Brown and Arthur, 2001). The step of Se incorporation occurs during
translation by means of a modified UGA codon, directed by a Se-Cys-insertion-sequence
(SECIS) (Lei et al., 2007). The fact that Se-Cys incorporation takes place during
translation has caused some controversy regarding the significance of measures of
mRNA levels of specific selenoproteins (Hesketh, 2008). Based on its role in
selenoprotein synthesis, selenophosphate synthetase has been considered a potential
regulator of Se metabolism, controlling the incorporation of Se-Cys into selenoproteins
and therefore preventing excessive selenoprotein production, as well as potentially
protecting against toxicity (Brown and Arthur, 2001).
Selenoproteins
Of the selenoproteins that have been functionally characterized, approximately
half are believed to play a role in the antioxidant mechanism (Ferguson and

9
Karunasinghe, 2011). The most thoroughly characterized selenoproteins include
glutathione peroxidase (GPx), thioredoxin reductase (TrxR), selenoprotein-P (Se-P) and
iodothyronine deiodinase (ID) (Hesketh, 2008).
Glutathione peroxidase is a selenoenzyme associated with the antioxidant
mechanism by means of regulation of hydroperoxide levels inside the cell (Arthur, 1997;
Ferguson and Karunasinghe, 2011). As depicted in Figure 2.2, the function of GPx is to
reduce hydrogen peroxide to water using glutathione as a donor of reducing equivalents.
(Urso and Clarkson, 2003). Glutathione peroxidase has a substrate specificity for
glutathione (Surai, 2006). To maintain glutathione levels in the cell the oxidized
glutathione disulfide has to be recycled by glutathione reductase, using NADPH as
substrate (Urso and Clarkson, 2003). GPx was one of the very first selenoproteins
identified and used as an indicator of Se status (Brown and Arthur, 2001) as GPx activity
has been shown to respond to dietary Se supplementation (Surai, 2006). In addition to its
role in providing protection against hydroperoxide damage, GPx may also be considered
as a storage pool of Se because each GPx enzyme contains 4 Se-Cys residues (Brown and
Arthur, 2001). Several different forms of GPx have been identified based on its location
and function. These forms include GPx-1 (intracellular); GPx-2 (gastrointestinal); GPx-4
(cell membrane associated and acts on phospholipid hydroperoxide as well as functioning
in the sperm capsule); and GPx-3 (plasma) (Brown and Arthur, 2001).
Thioredoxin reductase (TrxR) is involved in the redox system of the cell (Brown
and Arthur, 2001). It functions within a system that consists of thioredoxin, thioredoxin
peroxidase and TrxR, TrxR being the only selenoprotein in this system. The thioredoxin
system can also oxidize glutathione, thereby forming a link between the thioredoxin and

10
glutathione systems (Surai, 2006). The thioredoxin system regulates transcription factors
and provides reducing equivalents for DNA synthesis and regeneration of ubiquinol-10
that helps to prevent peroxidation of lipids in the cell (Ferguson and Karunasinghe,
2011). It also plays a role in apoptosis and modulation of protein phosphorylation via
activation of protein kinases (Surai, 2006).
Iodothyronine deiodinase (ID) is a selenoenzyme responsible for the conversion
of the prohormone thyroxine (T4) to its active form, triiodothyronine (T3) (Brown and
Arthur, 2001; Calamari et al., 2009b; Muirhead et al., 2010). Thyroid hormones are
essential for health as these hormones not only affect metabolism but also affect growth,
development and differentiation (Surai, 2006). Calculating the ratio between T3 and T4 is
thought to be a functional indicator of ID and possibly an indicator of Se status (Brown
and Arthur, 2001; Calamari et al., 2009b).
The remaining selenoproteins are less well characterized on a functional basis.
Selenoprotein-P (Se-P) seems to be responsible for Se transport (Ferguson and
Karunasinghe, 2011). It is estimated that approximately 60% of plasma Se is carried by
Se-P, as it can carry 10 Se atoms (Brown and Arthur, 2001). Another selenoprotein of
interest is selenoprotein-S (Se-S). It functions in the membrane of the endoplasmic
reticulum (ER), and is thought to play an important role in protein folding (Hesketh,
2008). Selenoprotein-W is less well characterized in terms of function but is believed to
play a role in muscle metabolism (Brown and Arthur, 2001), as it appears to be more
abundant in skeletal and cardiac muscle than other organs (Surai, 2006). Recently, it was
reported that selenoprotein K is an ER-localized membrane protein, potentially involved
in calcium flux in cells (Verma et al., 2011). Other selenoproteins that have been

11
identified but not yet functionally characterized include selenoproteins -L, -N, and -M, all
thought to be associated with redox function (Hesketh, 2008).
Selenium supplementation and the horse
Selenium toxicity and deficiency
A concern regarding Se supplementation is toxicity, whether acute or chronic. Se
toxicity is also referred to as alkali disease or blind staggers (Stowe, 1998). The first case
on record of Se toxicosis was in 1856 in Madison, Nebraska (Underwood, 1962). Since,
the identification of areas known to be high in Se has decreased the number of Se toxicity
cases in both horses and cattle (Hintz, 1999). Chronic toxicosis symptoms include
cracked hooves, ataxia and hair loss from mane and tail (Hintz, 1999), while acute signs
of toxicity typically involve some neurological signs, including hyper-excitability, ataxia,
sweating, shortness of breath, fever and in some cases death (Desta et al., 2011). A much
publicized case of acute Se toxicity in horses was the 2009 polo pony case in which 20
polo ponies died within 6 h after the parenteral administration of a vitamin/mineral mix
(Desta et al., 2011). During an attempt to reproduce a commercial vitamin-mineral
supplement (Biodyl®, Merial), a calculation error resulted in the accidental intravenous
administration of approximately 2 g of Se as sodium selenite to each horse (Desta et al.,
2011). The lethal injectable amount of Se has been reported to be 1.49 mg/kg BW or 0.75
g / 500kg horse (Néspoli et al., 2001).
Cases of chronic dietary Se toxicosis also exist. Horses kept in a feedlot in
Nebraska that were provided with excessively high Se hay exhibited signs of toxicosis.

12
Removing the hay allowed for full recovery without any recorded deaths (Stowe, 1998).
Dietary Se supplementation at appropriate levels is thought to be safer than the parenteral
administration of Se, as many unfavorable reactions have been reported with the use of
injectable Se in other species (Stowe, 1998). Hintz (1999) stated that the actual
mechanism of toxicity is not well understood, but thought to relate to oxidative
metabolism in cells. According to the NRC (2007) the maximum tolerable level of
dietary Se for horses is 5 mg/kg DM, although earlier versions of the NRC estimated that
it may be closer to 2 mg/kg DM (NRC, 2007).
Although Se toxicity can occur, Se deficiency can be a problem in geographically
low Se areas, as discussed earlier in this review. Low serum Se concentration is
frequently used as an indicator of a Se status, but controversy exists as to whether a
deficiency can be diagnosed on serum Se concentration alone when no other symptoms
are present (NRC, 2007). White muscle disease has been associated with foals of low Se
status (Muirhead et al., 2010). White muscle disease is also a problem in other young
livestock animals such as calves and lambs, and Se deficiency has been identified as the
contributing factor (Underwood, 1962). In addition, Se deficiency in other livestock
species has in general been associated with nutritional myopathy, Se-responsive diseases
such as muscular weakness in new-borns, un-thriftiness, weight loss, and diarrhoea
(Koller and Exon, 1986).

13
Selenium requirements
The first investigation into the Se requirements of the horse was conducted in
1967 by Stowe et al. at the University of Kentucky. The research involved the analysis of
542 serum samples obtained from experimentally fed (both oral and parenteral Se
supplementation) horses on the research farm, as well as samples from Thoroughbred and
Standardbred mares, foals, weanlings, and yearlings from horse farms in the area, as well
as Thoroughbreds in training in Lexington, KY and New York. Stowe (1967) noted a
tendency for Se supplemented foals to have a higher average daily gain in comparison to
the Se deficient foals. From this research it was concluded that a horse required an oral
Se intake of 2.4 µg/kg BW per day (1.2 mg / 500 kg horse per day) (Stowe, 1967).
Interestingly, Stowe (1967) also found foals to have a lower Se status in comparison to
their dams and hypothesized on the existence of a Se-dependent microbial organism that
hindered the uptake of milk Se or a component in the milk that affected Se absorption.
Similarly, a study that evaluated the Se status of mares and foals under normal
management conditions reported that foals had lower Se levels compared to their dams,
but mares of higher Se status had foals of higher Se status (Lee et al., 1995). The authors
also concluded from their study that whole blood GPx activity was a more accurate long
term indicator of Se status than whole blood Se.
The research by Stowe (1967) was followed by that of Shellow et al. (1985), also
conducted at the University of Kentucky. Shellow et al. (1985) conducted a depletion-
repletion study using 4 different levels of sodium selenite over a 12 week period. Prior to
the start of the repletion period the horses were kept on a low Se basal diet (0.06 ppm Se).
The researchers reported that plasma Se levels reached a maximum response by 35 d of

14
repletion. There were no differences between feeding 0.16 or 0.26 ppm Se, and the
plateau was observed within the same period of time as reported by Stowe et al. (1967).
In addition the maximum whole blood response was observed at 6 wk, with no additional
benefit when feeding more than 0.11 ppm Se (Shellow et al., 1985). The slower whole
blood response was attributed to the slow red blood cell (RBC) turn-over of the horse
which can be from 140 to 160 d (Shellow et al., 1985). The lack of plasma GPx response
observed led to the conclusion that the basal diet or endogenous stores provided enough
Se to maintain GPx activity, and therefore there was no advantage in supplementing
mature idle horses with Se levels greater than 0.1 ppm (Shellow et al., 1985). More
recently the reference range for serum Se levels in an adult horse has been established at
130 – 160 ng/mL (Stowe and Herdt, 1992). The reference range for whole blood Se is
180-240 ng/mL with whole blood GPx activity being in the range of 40 – 160 EU/g hb
(Stowe, 1998).
Current dietary Se recommendations:
Earlier versions of the NRC have referred to mineral requirements based on a
specific dietary concentration sufficient to prevent adverse effects on the animal. The
2007 version of the NRC expresses mineral requirements as a daily amount of the
particular mineral per kg body weight required by a particular physiological class based
on estimated feed intakes. This change was implemented in an attempt to more clearly
define mineral requirements in the horse (NRC, 2007). The current Se requirements for a
500 kg horse is 1 mg per day, and includes horses that are idle, in light exercise, breeding

15
and non-breeding stallions, as well as pregnant mares (NRC, 2007). This estimated
requirement increases to 1.13 mg per day and 1.25 mg per day for horses in moderate to
heavy exercise respectively, and 1.25 mg per day for a lactating mare (NRC, 2007). The
Se requirement for growing animals starts at less than half of its mature Se requirement
and increases over time until the age of 2 years when the daily requirement would be
similar to that of the mature animal (NRC, 2007). The FDA permits a total dietary Se
intake of 0.3 mg/kg DM (Karren et al., 2010), and keeping in line with that some feed
manufacturers produce concentrate feed containing approximately 0.6 mg Se/kg DM to
allow for a total dietary intake of 0.3 mg Se/kg DM (Stowe, 1998) when used in
combination with low Se forage. Similarly Hintz (1999) stated that using concentrates
containing 0.1 mg Se/kg DM may not provide sufficient amounts of Se to meet the Se
requirement of horses kept in deficient areas.
Effect of Se source on response variables
The initial studies conducted to establish the Se requirements of the horse used
sodium selenite as the source of Se (Stowe, 1967; Shellow et al., 1985). More recently
the use of organic Se supplements in horse diets have received a lot of interest and
several studies have been conducted using organic sources of Se (Pagan et al., 1999;
Janicki, 2001; Richardson et al., 2006; Calamari et al., 2009a; Calamari et al., 2009b;
Calamari et al., 2010; Karren et al., 2010; Thorson et al., 2010).
Richardson et al. (2006) compared the effects of an organic source of Se (Zn-L-
selenomethionine) fed at 5.1 mg Se/d to that of sodium selenite fed at 4.7 mg Se/d and
16
included a control group receiving 1.3 mg Se/d. They used eighteen 18 mo old American
Quarter Horse and American Paint Horses. The study was conducted over a period of 56
d, preceded by a 28 d adaptation period on the control diet only. A response to
supplementation was observed within 28 d as measured by plasma Se, indicating the
sensitivity of plasma Se concentration to dietary intake (Richardson et al., 2006). A trend
existed for higher plasma Se concentration at 28 d in horses receiving organic Se when
compared to inorganic, indicative of a faster response to supplementation. However, over
the entire 56 d supplementation period the response to supplementation was similar
regardless of Se source (Richardson et al., 2006). Plasma GPx activity was not affected
by Se supplementation or source. Middle gluteal muscle samples indicated an increase in
Se concentration over time, but this increase was regardless of dietary Se source or intake
(Richardson et al., 2006). Red blood cell GPx activity increased faster within the first 28
d in the organic supplementation group than the inorganic group. This response was
attributed to a single horse, although not a statistical outlier (Richardson et al., 2006).
However, at d 56 there was no difference in GPx activity regardless of treatment. Muscle
GPx activity decreased in all treatment groups over time, and although not fully
explained was thought to indicate that factors other than Se may play a role in muscle
GPx activity (Richardson et al., 2006). White et al. (2011) looked at similar variables, in
horses fed sodium selenite at either 0.1 or 0.3 mg/kg DM, even though the
supplementation period of 34 d was much shorter. These authors reported an increase in
plasma Se, but plasma, RBC, muscle GPx and thioredoxin reductase activity remained
unaffected by supplementation (White et al., 2011).

17
Calamari et al. (2007, 2009a, 2009b, 2010) published several reports from a study
with lightly exercised mature horses. The study consisted of a 112 d supplementation
period followed by a 112 d withdrawal period. The treatment groups included a low Se
control group (0.085 mg/kg DM), 3 Se yeast treatment groups receiving 0.2, 0.3 or 0.4
mg/kg DM, and a sodium selenite treatment group receiving 0.3 mg/kg DM for
comparison. The horses responded within 28 days to Se supplementation as measured by
whole blood and plasma Se concentration. While plasma Se levels plateaued within 75 d
to 90 d, the same plateau was not observed across all treatments for whole blood Se
concentration (Calamari et al., 2009b). The researchers reported that the Se yeast
treatment groups displayed a faster whole blood Se response in comparison to the sodium
selenite group. The Se yeast treatment groups also had higher whole blood and plasma
Se-Met levels when compared to the other groups (Calamari et al., 2009a). However, Se
source did not affect whole blood GPx activity. A correlation of 0.86 (P < 0.001) existed
between whole blood Se and GPx activity (Calamari et al., 2009b). Although whole
blood GPx activity increased in the supplemented groups, it did not reach a plateau over
the 112 d experimental period, leading to the conclusion that the supplementation period
was too short to accommodate red blood cell turn over (Calamari et al., 2009b). These
results were similar to those reported by Richardson et al. (2006). Upon withdrawal of the
supplement (Calamari et al., 2007), GPx activity declined over time. The decline was
slower than anticipated and after a 112 d withdrawal period GPx activity was still higher
in the supplemented groups compared to the control. This slow decline was also
attributed to the slow equine red blood cell turnover of 140-150 d (Calamari et al., 2007).
When calculating the rate of GPx activity decline it was found to be greater in the horses

18
receiving the sodium selenite supplement at 0.3 mg/kg DM, than in the horses receiving
selenized yeast at 0.2 or 0.3 mg/kg DM. The authors concluded that organic Se is
potentially a better source of Se in terms of maintaining GPx activity during periods of
deficiency (Calamari et al., 2007).
A study was conducted investigating the effect of plane of nutrition as well as Se-
Met supplementation (0.3 mg/kg DM) in the form of Se yeast on broodmares and their
foals (Karren et al., 2010). The 4 treatment groups consisted of mares kept on a pasture-
only diet (0.19 mg Se/kg DM), a pasture and Se supplement diet (0.49 mg Se/kg DM), a
pasture and grain diet (0.35 mg Se/kg DM) or a pasture, grain and Se supplement diet
(0.65 mg Se/kg DM). All diets provided more than the recommended amount of Se. Se
supplementation was provided for the final 110 d of pregnancy and was ended at
parturition. Blood samples were obtained from the broodmares every 14 d until
parturition, and then from the foals prior to nursing and every 14 d until they were 56 d
old (Karren et al., 2010). Middle gluteal muscle biopsies were taken every 28 d prior to
parturition from the broodmares and from foals when they were 12 h, 28 and 56 d old.
Although plasma GPx activity remained similar, plasma, colostrum and muscle Se
concentrations were greater in mares receiving Se supplementation compared to the un-
supplemented groups (Karren et al., 2010). Foals from supplemented mares reportedly
had greater plasma and muscle Se concentrations, yet plasma GPx activity was found to
be similar when compared to foals from un-supplemented mares.
Pagan et al. (1999) compared the digestibility of an organic selenized yeast (Sel-
plex; 0.4 ppm Se) supplement to that of an inorganic source, sodium selenite (0.41 ppm
Se) supplement in exercising thoroughbreds. The selenized yeast supplement was found

19
to be more digestible than sodium selenite (57.3% vs. 51.1%) and had a higher level of
retention (Pagan et al., 1999). Urinary Se excretion was not affected by Se source, except
for immediately post exercise, when urinary Se excretion was higher in the sodium
selenite supplemented horses (Pagan et al., 1999).
Table 2.1 contains a summary of studies that investigated the effect of Se source
or dose on peripheral blood variables used as indicators of Se status in horses. Not all of
the studies fed the same amounts of Se or measured every indicator presented in the table,
and there is a large amount of variation in the response data. The sensitivity of the
enzyme GPx to storage time and temperature of assay conditions does make it difficult to
compare absolute values of GPx activity across studies. However, the absolute
concentration of Se measured in blood or plasma should allow for comparison across
studies. The length of supplementation can also potentially affect study outcomes as
plasma Se is thought to be more sensitive to change in dietary Se intake, while whole
blood Se and GPx activity should give an indication of long term Se status (Shellow et
al., 1985).
The effect of selenium on the immune system
The effect of Se on the immune system has received a lot of attention over the
years and research interest has focused on human and animal models. Se has been shown
to affect both innate and acquired components of the immune system (Arthur et al.,
2003).

20
The immune system
The immune system can be divided into two major components: The non-specific
innate immune system and the highly specific adaptive immune system. The innate
immune system functions as the first line of defense. It includes anatomic barriers (skin,
mucus membranes), physiological barriers (body temperature, low stomach pH,
lysozymes in tears, complement system), phagocytic barriers (neutrophils, macrophages)
and inflammatory barriers (acute phase proteins, kinins) (Goldsby et al., 2000; Tosi,
2005). The adaptive immune response involves B- and T- lymphocytes and is capable of
detecting antigens by means of antigen specific receptors (Iwasaki and Medzhitov, 2010).
Although different, the innate and the adaptive immune components work together to
eliminate invading pathogens.
The adaptive immune response can be further subdivided into the humoral and the
cell-mediated immune (CMI) components. The humoral immune response is associated
with antibody production and involves the B-lymphocytes or B-cells. The CMI response
involves T-lymphocytes or T-cells and in contrast to B-cells, antigen presentation via
antigen presenting cells (e.g. dendritic cells) is required for activation of the T-cells.
While both T- and B-lymphocytes are key to the defense against extracellular pathogens,
T-lymphocytes are critical for immunity to intracellular pathogens. T-lymphocytes
include both T-helper (Th; CD4) and cytotoxic T cells (CTL’s; CD8). While Th cells
produce cytokines that stimulate and activate B-cells, CTL’s, macrophages etc, CTL’s
have the ability to destroy intracellular pathogen infected cells (Goldsby et al., 2000;
Calder, 2007).

21
Communication between the different components of the immune system is of
utmost importance. One of the major forms of communication is through the cytokines
(Calder, 2007). Cytokines are proteins that regulate immune cells by binding cytokine
receptors present on cell surfaces (Calder, 2007). Cytokines regulate many stages of the
immune response, including the activation, proliferation and differentiation of effector
cells (Blecha, 1988; Horohov, 2003). Individual cytokines may have multiple biological
functions (Horohov, 2003) and can act in an autocrine, paracrine or endocrine manner
(Goldsby et al., 2000). In general, the adaptive immune system is thought to function by
mounting different types of responses. One type of response is called a T-helper 1 (Th1)
response. It is initiated by interleukin (IL) –12, and involves the cytokines IL-2,
interferon γ (IFN γ) and tumor necrosis factor α (TNFα). The Th1 response is associated
with CMI responses (Horohov, 2003), and plays a central role in defense during
intracellular virus and bacterial invasion (Kaiko et al., 2008). A T-helper 2 (Th2)
response is initiated by IL-1β and is associated with the cytokines IL-4, IL-5 and IL-13
(Horohov, 2003). Upon recognition of a specific antigen the decision of the immune
system to promote a Th1 or a Th2 type of response results in the activation of the
appropriate transcription factors. T-bet is a transcription factor associated with the
activation of a Th1 response while the transcription factor GATA-3 is associated with a
Th2 response (Chinen et al., 2006). In addition cytokines are also classified as pro- or
anti-inflammatory (Opal and DePalo, 2000). Cytokines are regarded as pro-inflammatory
if they induce a state of inflammation by stimulating a pro-inflammatory cascade when
released (Dinarello, 2000). However, inflammation is a regulated process, and the release
of pro-inflammatory cytokines is normally followed by the production of anti-

22
inflammatory cytokines that control the inflammatory response (Pusterla et al., 2006a). It
is the net effect of the balance of the pro- and anti-inflammatory cytokines that will
determine the type of inflammatory response observed (Dinarello, 2000; Opal and
DePalo, 2000). It should be noted that a combination of many factors affects cytokine
response (e.g. when the cytokine is released, the tissue that it is released in, and the other
cytokines that are present in that same area). Also, pro- and anti-inflammatory function
may not be as definitive as when initially classified, as some cytokines (e.g. IL-6) appear
to have both pro- and anti-inflammatory functions (Opal and DePalo, 2000). Table 2.2
contains a summary of a selection of cytokines, their target cells and associated functions.
Antigen recognition is a complex process. The B- and T-lymphocytes have the
ability to recognize specific sites on antigens called epitopes. In addition to these
epitopes, T-lymphocytes also require these epitopes to be associated with the major
histocompatibility complex (MHC) found on antigen presenting cells (APC) (Goldsby et
al., 2000). Upon recognition, antigens are internalized and processed for presentation on
the MHC together with the release of stimulatory cytokines and other surface molecules.
Extracellular antigens (such as bacteria) are normally eliminated by means of antibody
production, while intracellular antigens (such as viruses) are more efficiently eliminated
by the cytotoxic T-cells (Goldsby et al., 2000). Extracellular antigens are processed
within the APC’s using the exocytic pathway and are presented in association with MHC
II found on professional APC (macrophages, dendritic cells). Intracellular antigens are
processed in the endocytic pathway and are presented in association with MHC I found
on most nucleated cells (Goldsby et al., 2000; Iwasaki and Medzhitov, 2010).

23
The development of a primary immune response can be summarized as follows:
The APC of the innate immune system (dendritic cells and macrophages) are equipped
with “pattern recognition receptors” (PPR) that enables these cells to recognize specific
molecular patterns called “pathogen associated molecular patterns” (PAMP’s). These are
invariable regions found on most bacteria, viruses and other pathogens (Iwasaki and
Medzhitov, 2010) (Akira et al., 2006). The PAMP’s stimulate cells to produce factors
such as cytokines (IL-1 and TNFα) and various chemokines. Once stimulated, the
dendritic cells or macrophages migrate to the lymphoid tissues where they can present the
naïve Th cells with the antigen-MHC II complex (Kaiko et al., 2008). This complex,
together with co-stimulatory factors, induces clonal expansion of the naïve Th cells. Over
the next 3-7 d following exposure to the antigen, the number of antigen specific Th cells
increase within the secondary lymphoid tissues. Those Th cells that recognize the antigen
peptide-MHC presented on antigen specific B-cells move into B-cell follicles to further
stimulate additional antibody production (Jenkins et al., 2001).
Assessing immune response:
The humoral immune response is frequently assessed by means of a vaccine
challenge. The presence of an adjuvant in the vaccine tends to increase the magnitude of
this response. In humans, tetanus toxoid or oral polio vaccinations are often used
(Fraker, 1994). Evaluating the CMI response is often done using in vitro assays that
require culturing lymphocytes with mitogens to induce proliferation, differentiation
(Fraker, 1994) and cytokine production (Calder, 2007). Lymphocyte proliferation is a
popular functional measure of the ability of the lymphocytes to respond to specific
antigens and mitogens. Mitogens can stimulate T cells by bypassing their antigen-specific

24
receptors thereby producing an oligoclonal response. The mitogens concanavalin A
(ConA) and phytohemagglutinin (PHA) are typically used to assess T-cell proliferation,
while pokeweed mitogen stimulates both T- and B cells (Calder, 2007).
The nutrient composition of the culture media is of utmost importance,
particularly when conducting research using cells from animal models that have been
depleted of a specific nutrient (Fraker, 1994). To better reflect the in vivo environment in
such studies, the use of autologous serum is thought to be more appropriate (Fraker,
1994), and has indeed been shown to affect proliferation results in pigs deficient in either
Se or vitamin E (Lessard et al., 1991).
Quantitation of cytokines can provide information on disease or inflammatory
progression (Sullivan et al., 2000) and provides a functional assessment of the immune
system (Calder, 2007). The most common approaches to evaluate cytokine production
include detection of secreted cytokine protein by ELISA or radioimmunoassay, detection
of intracellular cytokines of specific cells by flow cytometry, and detecting messenger
RNA (Sullivan et al., 2000). Although detection of the cytokine protein may provide the
most biologically relevant information (Sullivan et al., 2000), the lack of availability of
validated equine specific assays makes these methods unavailable for most equine
cytokines. Instead, detection of cytokine-specific mRNA is widely used to assess equine
immune function (Swiderski et al., 1999; Spencer et al., 2005; Pusterla et al., 2006b;
Horohov et al., 2008; McFarlane and Holbrook, 2008; Riihimaki et al., 2008; Adams et
al., 2009).

25
Selenium and the equine immune system
Although there has been some interest in the interaction between the equine
immune system and Se status in the horse, only a limited number of studies have been
conducted. The results reported below are summarized in Table 2.3.
One of the first studies to investigate the effect of Se on the immune response of
the horse was performed by Baalsrud and Overnes (1986). These researchers were
interested in the effect of Se, with or without the addition of supplementary vitamin E, on
antibody production. Sodium selenite was used as source of Se, fed at 5 mg Se/d, while
vitamin E was supplemented as 600 mg α-tocopheryl acetate. Horses were adapted to
their diets for 12 wk, followed by a 12 wk vaccination period. Every 2 wk throughout the
24 wk experimental period the horses were dosed intravenously with Escherichia coli
culture. During the vaccination period horses were vaccinated against tetanus, as well as
equine influenza strain A equi 1 and 2, at the start and again at wk 6 of the vaccination
period. Antibody titres against E. coli O-antigens, Clostridium tetani and equine
influenza strains were followed on a weekly basis. Horses supplemented with both Se and
vitamin E showed the strongest response to tetanus and influenza, followed by the
vitamin E supplementation alone. No difference was detected between the Se only and no
supplementation groups (Baalsrud and Overnes, 1986). The E coli titres were also similar
between the treatments. The authors did note that the group receiving the Se supplement
alone consisted of only 3 horses, and none of these horses appeared to be good overall
immune responders potentially affecting the study outcome.

26
In contrast, a later study interested in antigen induced humoral response did see an
effect of Se supplementation on immune response (Knight and Tyznik, 1990). Prior to the
onset of the study ponies were kept on a low Se diet for at least 9 mo. The ponies were
then assigned to either a high Se (0.22 mg/kg DM) or low Se (0.02 mg/kg DM) diet.
Upon assignment to dietary treatment the ponies received an i.m. injection of sheep red
blood cells (SRBC), followed by a second injection 2 wk later. Blood samples were
collected weekly and indicated overall higher serum IgG levels and hemagglutination
(HA) titers in response to the SRBC in ponies fed the high Se diet (Knight and Tyznik,
1990). The authors stated that they were unable to provide a possible a mechanism of
action to explain the effect of Se on antibody production.
In 1993, a study examined the effects of Se and phosphorus (P) depletion on
Thoroughbred mares and weanlings (Greiwe-Crandell et al., 1993). The mares and
weanlings received a diet either low or adequate in both P and Se. Dietary P and Se
intake was manipulated using a combination of pasture (<0.08 mg Se/kg DM), hay
(<0.08 mg Se/kg DM) and concentrate (6 mg Se/kg DM) known to be low or adequate in
Se and P. An unexpected outbreak of mild pneumonia with nasal discharge affected the
weanlings on the study. The authors noted that all of the 11 Se and P deficient weanlings
contracted pneumonia early-October and recovered by early-December. Two of these
weanlings also had to be treated to allow for full recovery. In contrast a shorter recovery
period was noted for the Se and P adequate weanlings. These weanlings were only
affected by mid-December, and with the exception of 2, they all recovered by mid-
January. They also did not require additional medical treatment (Greiwe-Crandell et al.,
1993). The aim of this study was not to investigate immune response to dietary treatment,

27
however, the authors stated that their observations may suggest a role of adequate Se
nutrition in viral defense (Greiwe-Crandell et al., 1993).
A more recent study conducted on broodmares and foals found that foals from
mares receiving 3 mg Se/d had greater serum IgG concentrations at 2 wk of age than
foals from mares receiving only 1 mg Se/d (Janicki, 2001). In contrast, Se-Met
supplementation (0.3 mg/kg DM in addition to basal diet; 0.49 mg Se/kg DM total dietary
intake) of broodmares during the last trimester of pregnancy did not affect colostral IgG
concentrations or serum IgG concentration of their foals compared to foals from
unsupplemented mares (0.19 mg Se/kg DM total dietary Se intake). However, foals were
only sampled at 6 hourly intervals from birth until 24 h post birth, and the diet fed to the
unsupplemented mares contained almost twice the recommended Se intake (Thorson et
al., 2010).
Selenium and immune function in other species
While relatively few studies have examined the effect of Se on the equine
immune system, more information is available in other species. Antibody response was
evaluated in broiler chicks utilizing 3 different dietary Se levels (0, 0.1 or 0.2 mg/kg;
sodium selenite), with or without the addition of vitamin E (Singh et al., 2006). Se alone
was found to have no effect on HA titer against Newcastle disease or total
immunoglobulin, but a synergistic effect was observed when Se and vitamin E was
provided together (Singh et al., 2006). A study conducted on growing Japanese quail,
using a range of different Se treatments (0.2 to 1.0 mg Se/kg DM; sodium selenite) found

28
HA titers against SRBC to increase as dietary Se intake increased (Biswas et al., 2006).
In addition it was reported that cell-mediated immunity, as assessed by the change in foot
web thickness induced by intradermal injection of PHA, was also increased with an
increase in Se supplementation (Biswas et al., 2006).
Reffett et al. (1988b) evaluated the effect of low Se status on the primary and
secondary humoral immune response of calves challenged with infectious bovine
rhinotracheitis virus (IBRV). For an 84 d period calves received a diet either deficient
(0.03 mg/kg) or adequate (0.2 mg/kg, sodium selenite) in Se. Blood samples were
obtained every 14 d to monitor Se status via GPx activity, together with liver samples
taken at d 84, also for GPx activity determination. These samples validated the deficient
Se status of the calves on the low Se diet. The calves were challenged 28 d later via
intranasal inoculation with IBRV, followed by second intranasal inoculation 35 d later
(Reffett et al., 1988b). Serum antibody titer and serum immunoglobin (IgG and IgM)
levels were evaluated for a 50 d period from the time of the first inoculation. A fever
response was observed in both groups within the first 3 d after the first inoculation,
although no effect was observed on feed intake. It was noted that whole blood and plasma
GPx activity increased in the Se adequate calves after inoculation. The increase was
attributed to an improved ability to clear the oxygen metabolites that resulted from the
immune challenge in the adequate Se calves when compared to the Se deficient calves
(Reffett et al., 1988b). Serum IgM was higher in Se adequate calves at all time points,
while serum IgG remained unaffected by Se treatment. After an initial increase in serum
IBRV antibody titers, the titers decreased in the Se deficient calves but remained elevated
in the Se adequate calves. The second inoculation resulted in an increase in the antibody

29
titers associated with a normal memory response, though at the end of the challenge
period Se deficient calves still exhibited lower antibody titer levels in comparison to the
Se adequate calves. It would appear as if Se status affected both primary and secondary
response, although the effect was more prominent during the secondary (memory)
response phase (Reffett et al., 1988b).
Another bovine immune challenge study (Nemec et al., 1990) looked at the effect
of Se supplementation with or without the addition of vitamin E on antibody and HA titer
response to vaccination with brucella abortus strain 19. The Se supplementation was
provided in two 30 g boluses containing 3 g elemental Se each administered 84 d prior to
the immune challenge. Blood was collected at various time points prior to and post the
immune challenge. No effect of treatment was observed for serum IgG, IgM or total
antibody levels post vaccination. Agglutination titers also did not show any change over
time. In contrast to Reffett et al. (1988b), the humoral response was not improved in
heifers supplemented with Se when compared to the un-supplemented control group
(Nemec et al., 1990).
Nicholson et al. (1993) measured antibody response in growing beef cattle fed a
basal diet of silage, with or without the addition of Se supplements. The study was
conducted in 2 phases. During the first phase Se supplementation was provided from 3
different sources: Se-yeast, Se-fertilized silage or sodium selenite. An un-supplemented
group served as the control. After 8 wk on the assigned diets the cattle were challenged
with SRBC. Following the SRBC challenge each of the 4 treatment groups were
subdivided and regrouped to form two dietary treatment groups with an equal number
distribution of animals from previous treatment arrangement in each group. One group

30
received Se-yeast, while the other received the un-supplemented control diet. After 12 wk
on this diet the cattle were vaccinated with 1 mg ovalbumin (OVA) followed by both
OVA and SRBC vaccinations 5 wk later (wk 17 of the study). Anti-OVA and anti-SRBC
titers were determined by HA assay. No effect of treatment was observed on anti-SRBC
titers after the first or the second phase. However, after both initial and booster OVA
vaccination the decline in anti-OVA titers was more rapid in the cattle on the low Se
control diet than those receiving Se supplementation. It was concluded that Se
supplementation did support immune function in cattle (Nicholson et al., 1993),
confirming the findings of Reffett et al. (1988b).
The immune response in lambs challenged with parainfluenza3 virus (PI3V) was
evaluated in lambs fed diets containing either no Se or vitamin E supplements, a
combination of the Se and vitamin E supplements, or Se and vitamin E supplements
alone (Reffett et al., 1988a). In the supplemented groups Se supplementation (sodium
selenite) was provided at 0.2 mg Se/kg DM while vitamin E was supplemented at a rate
of 20 mg alpha-tocopheryl-acetate/kg DM. The lambs were kept on their respective diets
for 10 wk, followed by a 70 d immune challenge period. On d 0 and 35 of the challenge
period lambs received an intratracheal inoculation with PI3V, and the subsequent
immune response was followed by measuring immunoglobulin concentrations as well as
PI3V titers (Reffett et al., 1988a). It was stated that the expected fever response was
milder than what was normally observed when challenging with PI3V. The results
indicated that Se supplementation alone resulted in higher IgM levels on d 14, 35 and 49
when compared to other treatments. Serum IgG concentrations were not affected by Se or
vitamin E. Serum titer levels increased in all treatments within 14 d. Between d 14 and 35

31
serum titer continued to increase in the Se only treatment group while it decreased in the
other treatment groups. Then, following the second challenge, the expected increase in
titers due to memory response was observed in all treatment groups, except the group
receiving Se alone. This was thought to be the result of the high titer that was already
present in the Se alone treatment group prior to the second vaccination. The authors
concluded that Se supplementation was important for adequate immune response (Reffett
et al., 1988a). Humoral immune response was also evaluated in male lambs by Kumar et
al. (2009). Lambs were fed diets supplemented with sodium selenite or an unspecified
organic form of Se at 0.15 mg/kg DM. An un-supplemented group served as a control
(Kumar et al., 2009). At d 0 of the feeding period the lambs were vaccinated i.m. using a
killed Pasturella multocida vaccine with adjuvant. The antibody response was followed
over the next 90 d. Similar to Reffett et al. (1988a) the authors reported that antibody
levels were higher in the Se supplemented groups when compared to the control group.
However, no effect of Se source was detected (Kumar et al., 2009).
Although the majority of farm animal models reported an effect of Se status on
the humoral immune response, human and mouse studies do not show a similar trend.
Beck et al. (2001) reported no effect of dietary Se treatment on influenza antibody titers
in mice receiving a Se adequate (sodium selenite) or deficient diet. The authors
interpreted these results as a lack of effect of Se status on B-lymphocyte function (Beck
et al., 2001). Similarly, Se treatment did not affect the polio-antibody levels of human
subjects supplemented with various levels of Se (0, 50, 100 µg/d) as sodium selenite
(Broome et al., 2004). Likewise, no difference was detected in lung influenza titers
obtained from mice challenged with influenza virus. This was in spite of a higher

32
mortality rate (50%) recorded for the mice on an adequate Se diet when compared to the
deficient group (Li and Beck, 2007).
The results reported in the literature are summarized in Table 2.3 and Table 2.4.
Table 2.3 contains the results from studies reported above relating to the humoral
immune response. Table 2.4 summarizes the results from the studies below, reporting
variables that relate to the CMI response and innate immunity.
As shown in Table 2.3 Se supplementation appears to affect the humoral response
to a greater extent in livestock than rodents and humans. However, when evaluating the
CMI response (Table 2.4) it may be noted that Se supplementation appears to have more
of an effect on CMI response when human and rodent models are used, compared to
livestock. However, a very important consideration is that, in comparison to the farm
animal model, supplementation response studies that have been published using rodent
and human subjects have often used more molecular approaches.
Cao et al. (1992) found no difference in the ability of lymphocytes from
Se deficient or Se adequate (sodium selenite) cattle to proliferate in response to Con A
within the first 36 h of incubation. However, when the incubation period was extended to
48 h, Se deficient cells were not able to proliferate to the same extent as the adequate
cells (Cao et al., 1992). In contrast, Aziz and Klesius (1985) evaluated lymphocyte
proliferation and IL-2 production in lymphocytes obtained from Se-adequate (source of
Se not reported) or deficient goats. They found no difference in ability of the
lymphocytes to proliferate or produce IL-2 in response to stimulation with Con A (Aziz
and Klesius, 1985).

33
Wuryastuti et al. (1993) conducted a study on pregnant sows, investigating the
effect of Se supplementation (0.3 mg/kg DM as sodium selenite) with or without
additional vitamin E (60 mg all-rac-α-tocopheryl acetate/kg DM) on lymphocyte
proliferation, using 3 different types of mitogens (PHA; ConA and poke weed), and
neutrophil function. The sows were supplemented for 90 d prior to parturition through d 4
of lactation. Similar to Aziz and Klesius (1985) no effect of treatment was observed in
the ability of the cells to proliferate (Wuryastuti et al., 1993). However, the authors did
note that the phagocytic and microbicidal capabilities of neutrophils were lower in the
Se-deficient sows on d 90 and at parturition (Wuryastuti et al., 1993). A 25 d study
conducted by Lessard et al. (1991) with weanling pigs investigated the effect of a diet
deficient in both Se and vitamin E on immune response, compared to a control group
receiving 33 IU DL-alpha-tocopheryl acetate and 0.2 mg Se/kg DM (sodium selenite).
The pigs were fed their respective diets for 21 d, at which point they received an oral
inoculation with Samonella typhisius (1x10⁹ organisms). After an additional 4 d the pigs
were euthanized. Blood was collected on d 21 and 25 to isolate PBMC and granulocytes.
Lymphocyte proliferation, cytotoxic activity of natural killer cells, antibody dependent
cell mediated cytotoxicity and respiratory burst of granulocytes were evaluated. The
samples taken on d 21 indicated no effect of treatment on any of the variables
investigated. However, on d 25 lymphocyte proliferation was lower in the pigs on the
deficient diet. In contrast, peak respiratory burst activity of granulocytes was observed in
the pigs on the deficient diet. Interestingly though, these treatment differences were only
observed when heat inactivated autologous serum was used instead of traditional fetal
bovine serum (Lessard et al., 1991). Malá et al. (2009) investigated the effect of Se

34
supplementation on a few innate immune variables in goat kids. The study included 3
dietary Se treatments: organic (Se-lactate-protein complex), inorganic (disodium
selenate) or no additional supplementation (control). Dietary treatments were assigned 3
mo prior to parturition and continued during the lactation phase of the does. Upon
weaning at 69 d of age the kids were placed on the same treatment as their dams. The
innate immune response of the kids was evaluated when they were 120 d old. The
researchers did not detect any differences in leukocyte numbers, leukocyte differential
counts or phagocytic activity (Malá et al., 2009).
Although limited studies have been conducted looking at the effect of Se on the
CMI response in farm animals, more in depth studies have been done using the mouse
and human model. A study conducted with human subjects over the age of 65 yr found
that Se supplementation (100 µg/d as Se-yeast) over 6 mo period improved lymphocyte
proliferation with a 138% increase in response to poke weed mitogen (Peretz et al.,
1991). However the same response was not observed when other mitogens such as PHA
or OKT3 (anti-CD3 monoclonal antibody) was used. The conflicting results were thought
to be due to a combination of the age of the research subjects and the specificity of the
mitogens. Elderly humans have been reported to have fewer T-lymphocytes when
compared to younger humans. In addition OKT3 stimulates T-lymphocytes, while poke
weed stimulates both T and B-cell populations, potentially accounting for the different
results (Peretz et al., 1991). Roy et al. (1994) investigated the effect of 8 wk of in vivo Se
supplementation (200 µg/d as sodium selenite) on lymphocyte proliferation (PHA as
mitogen) and IL-2 receptor expression in human subjects previously depleted of Se. IL-2
receptor expression was determined by means of a 125I-IL-2 binding assay (Roy et al.,

35
1994). Although no treatment differences were observed after 48 h of incubation, at 72 h
Se supplementation improved proliferation by 45.1% (Roy et al., 1994). The IL-2
receptor expression was also significantly increased when compared to subjects on the
placebo treatment (Roy et al., 1994). In a companion paper, Kiremidjian-Schumacher et
al. (1994) reported that the Se supplementation also resulted in a 118% increase in
cytotoxic lymphocyte mediated tumor cytotoxicity. In addition, natural killer cell activity
was increased by 82.3%. Roy et al. (1994) concluded that supplementation of Se, as
sodium selenite, either dietary or in vitro to cell cultures, increased lymphocyte
proliferation and IL-2 receptor expression, indicating the ability of Se to modulate T-cell
response. In addition, Kiremidjian-Schumacher et al. (1994) stated that Se
supplementation was capable of inducing changes in immune function. Another study
evaluated the response of human lymphocytes to in vitro supplementation of Se alone or
in combination with vitamin E (Lee and Wan, 2002). In contrast to Roy et al. (1994) they
found adding Se in vitro (0.5µM sodium selenite) followed by stimulation with PHA or
LPS did not improve lymphocyte proliferation. However, when no mitogen was added,
i.e. the in vitro Se addition alone, proliferation was improved in comparison to the control
(Lee and Wan, 2002). An important consideration though is that the Se status of the
volunteers from which the lymphocytes were obtained was not reported. In addition, Lee
and Wan (2002) reported an increase in total T-cells, Th cells and T-suppressor cells as
measured by flow cytometry in response to in vitro Se supplementation, again in the
absence of mitogens. In the presence of PHA the in vitro Se supplementation elevated
total T-cells and T-helper cells only (Lee and Wan, 2002). Utilizing human subjects of
marginal Se status, Broome et al. (2004) investigated the effect of Se supplementation on

36
the development of the immune response to a live attenuated poliomyelitis vaccine given
as a single oral dose. The vaccine was preceded by 6 wk of supplementation with sodium
selenite (0, 50 or 100 µg/d). Se supplemented groups showed a greater proliferative
response 7 d after administration of the vaccine. Similarly, stimulated whole blood
cultures indicated higher levels of IFNγ and IL-10 at d 7 in Se supplemented groups. Se
supplemented groups were also found to have lower fecal shedding of virus, interpreted
as enhanced viral clearance (Broome et al., 2004).
Petrie et al. (1989) evaluated cytotoxic T cell and natural killer cell cytotoxicity in
mice fed a diet containing either 0.1 mg/kg or 4 mg Se/kg as sodium selenite. The mice
were supplemented for 4 wk before splenic cells were harvested. Cytotoxic T
lymphocytes were also generated from peritoneal exudate cells (PEC) through
intraperitoneal infection of tumor cells, followed by recovery of the cell suspension. They
reported a 65% increase in splenic natural killer cell activity in comparison to the control
mice. The mice on the high Se diet also showed higher levels of anti-tumor cytotoxicity
levels as measured by the cytotoxic T cells generated from PEC (Petrie et al., 1989). To
investigate the effect of Se status on macrophage function, Vunta et al. (2008) kept mice
on a Se deficient (0.01 mg/kg DM) or adequate (0.4 mg/kg DM; Se source not reported)
diet for 100 d. After intraperitoneal injection with LPS, cells were isolated from lung
tissue. Macrophage infiltration into the lungs was determined by flow cytometry. A 50%
higher lung infiltration was found in Se deficient mice when compared to Se adequate
mice, implicating a role of Se in the control of macrophage infiltration of tissues. Upon
further investigation both TNFα and cyclooxygenase-2 (COX-2) expression by
macrophages were found to be lower in the Se adequate mice (Vunta et al., 2008). It was

37
concluded that adequate Se status may be of importance in the regulation of pro-
inflammatory gene expression in macrophages, which in turn may affect organ tissue
infiltration by macrophages (Vunta et al., 2008).
Using mice, Beck et al. (2001) evaluated the effect of Se status on the intensity of
an influenza infection after exposure to influenza virus strain A/Bangkok/1/79; H3N2.
Mice were kept on a diet that was either deficient or adequate in Se. The source of Se in
the adequate diet was sodium selenite. At various time points post infection (intra-nasal)
selected mice were euthanized for the evaluation of lung histopathology, bronchoalveolar
lavage cells (BAL), and cytokine and chemokine mRNA levels in mediastinal lymph
nodes. Lung pathology indicated Se deficient mice had more inflammation at d 4, 6, 10
and 21 d post infection. Lung pathology started to decline in the adequate mice after d 6,
while it persisted in the deficient mice until d 21. Evaluation of BAL cells revealed
higher numbers of CD8 and macrophages in the Se deficient mice on d 5 post infection,
which may relate to those results reported by Lee and Wan (2002) in terms of change in
T cell numbers. Finally, IFNγ and IL-2 mRNA levels were overall lower in the Se
deficient mice. IL-4 and IL-5 were lower in the deficient mice on d 4, but were
comparable to adequate mice by d 14. IL-10 and IL-13 were elevated in the deficient
mice by d 6 when compared to adequate mice (Beck et al., 2001). From d 14 onwards IL-
4, -5, -10 and -13 were higher in the deficient mice (Beck et al., 2001). The lung
pathology results were thought to be linked with the measured changes in mRNA levels
of the cytokines in the lungs (Beck et al., 2001). Based on the cytokine responses, the
researchers concluded that the immune responses in the lungs of Se-deficient mice were

38
skewed towards a Th2 response, the opposite of what would be expected after a viral
challenge (Beck et al., 2001).
In a follow up study, Sheridan et al. (2007) investigated the effect of
selenoprotein levels on immune response in mice after an intra-nasal challenge with the
same influenza virus (A/Bangkok/1/79; H3N2). This research group took a different
approach from the traditional manipulation of dietary Se intake by using transgenic mice
with a mutant (Sec) tRNA[Ser]Sec that resulted in lower levels of selenoprotein production.
For control purposes “wild type” mice were used. The mice were infected with the
influenza virus, and then euthanized at different intervals to study the development of the
immune response over time. Across treatments, an overall decrease in lung mRNA
cytokine expression (IFNα, IFNβ, TNFα, IL-6) was observed but chemokine (MCP-1 and
MIP-1α) mRNA expression was elevated in the mutant mice at d 2 post infection, and the
mRNA expression of cytokine IFNγ was elevated in the mutant mice on d 7 post
infection (Sheridan et al., 2007). No difference was observed in lung pathology when
comparing the mutant and wild type mice, however the wild type mice exhibited faster
viral clearance. Upon closer inspection it was found that although the mutant mice did
have lower selenoprotein levels, GPx activity was still 82% of that of the wild type, and
higher than that of dietary induced Se deficient mice used in their laboratory. Therefore
the authors concluded that there appeared to be a threshold GPx value above which lung
pathology is prevented (Sheridan et al., 2007).
Li and Beck (2007) then conducted a similar study to Beck et al. (2001), this time
using different influenza strain (A/PuertoRico/8/34). Mice were provided with either a
deficient (0.002mg/kg DM) or adequate Se diet (0.2 mg/kg DM, sodium selenite) for 4
39
wk. As before the mice were infected with the virus (intra-nasal) and a selection of mice
were then euthanized at various time points post infection for the evaluation of lung
histopathology, lung virus titers, chemokine protein levels and cytokine mRNA levels in
lung tissue using RT-PCR (Li and Beck, 2007). In contrast to their previous work (Beck
et al., 2001), but similar to Sheridan et al. (2007), the authors did not detect a difference
in lung pathology between dietary treatments. Further, at d 7 half of the Se adequate mice
had died, while all Se-deficient mice were still alive. Se-deficient mice were found to
have lower chemokine (RANTES and MIP-1α) levels in lung tissue as well as higher
levels of IL-2 expression followed by elevated IL-4 levels. Apart from a trend for
elevated IFNγ levels in the deficient mice, no other cytokines were affected (Li and Beck,
2007). These results were in contrast to those reported earlier by Beck et al. (2001). It
was concluded that not only the Se status, but also the virulence of the strain of virus used
in the infectious study should be considered when interpreting results (Li and Beck,
2007).
As stated earlier in this review, the results from the studies discussed above are
summarized in Table 2.3 and 2.4. Again it is obvious that different responses are
observed between rodent and human studies and livestock studies. Again, this difference
may simply be due to the different approaches that have been used when studying these
different models.

40
Selenium and immune function: Mechanism of action
The exact mechanism of action through which Se affects the immune response
has not yet been defined. The antioxidant role of Se has received a lot of consideration as
the potential mechanism of action. More recently other potential mechanisms have been
considered. Baalsrud and Overnes (1986) suggested that Se affects the immune system
through its ability to reduce peroxides and protect vital organelles and cell processes
involved in mounting an immune response. Lessard et al. (1991) thought that the
inclusion of Se at appropriate levels may help to control cellular oxidative reactions
which may in turn affect the ability of immune cells to function properly.
Cao et al. (1992) reported that a key to the mechanism of action may lie in the
role of Se in modulation of the arachidonic acid metabolism. They reported that low Se
status was associated with a reduction in the metabolites of the 5-lipoxygenase pathway,
as measured in in vitro cell cultures (bovine), which in turn was linked to lower
lymphocyte proliferation. The suppressed proliferative response was reportedly reversed
by the addition of specific lipoxygenase pathway products. This potential mechanism of
action is supported by molecular based research done by Vunta et al. (2008) using mice
as their research model which showed that Se adequate cells favorably convert
arachidonic acid to 15d-PGJ2 (a cyclopentenone prostaglandin) which has an adverse
effect on the pro- inflammatory signal transduction pathways as it inhibits the activation
of nuclear factor – kappa-β (NF-κβ) dependent gene expression (Vunta et al., 2008). NF-
κβ is a transcription factor that initiates the transcription of numerous cytokines,
specifically the pro-inflammatory cytokines (Tosi, 2005).

41
Many other researchers have since contributed to the body of research suggesting
that the mechanism of action lies in the antioxidant properties of Se, preventing the over-
activation of NF-κβ by high levels of ROS (Beck et al., 2001; Zeng and Combs Jr, 2008).
Beck et al. (2001) proposed two potential mechanisms of action based on their work with
Se deficient mice and influenza, that may work in unison. They proposed that Se
deficiency resulted in higher levels of ROS leading to more severe oxidative stress in
comparison to Se adequate mice. The elevated oxidative stress levels in Se deficient mice
stimulate the activation of NF-κβ to a greater extent than in Se adequate mice, resulting
in greater levels of inflammation observed in the Se deficient mice. Secondly they
proposed that host Se status affected the virus itself in that Se deficiency allowed changes
in the viral genome resulting in mutations into more virulent strains, affecting the extent
of inflammation observed (Beck et al., 2001). The involvement of the transcription factor
NF-κβ is a concept that has been considered by others (Duntas, 2009). The immune
system depends on NF-κβ to bind to DNA and activate the expression of the genes that
encode the proteins that are involved in the immune response (Maggini et al., 2007),
including the production of pro-inflammatory proteins such as TNFα and IL-6 (Duntas,
2009). The activation and movement of NF-κβ into the nucleus is via the phosphorylation
of I-kappa-beta-alpha (Iκβα). It is proposed that Se status regulates GPx activity, which in
turn regulates intracellular ROS levels. Low ROS levels (due to adequate GPx) preserve
Iκβα, resulting in low NF-κβ activity, controlling inflammatory protein levels, and
therefore state of inflammation (Duntas, 2009).
The in vitro work conducted by Lee and Wan (2002) led them to conclude that the
mechanism of action lies in the improved free radical scavenging capabilities of Se

42
adequate cells. Their studies showed inhibition of lymphocyte proliferation by H2O2 in a
dose dependent manner, implicating the importance of adequate Se status to neutralize
H2O2 and allow for optimal proliferation (Lee and Wan, 2002). The research conducted
by Saito et al. (2003), utilizing a human cell line, complements the results from Lee and
Wan (2002).
Saito et al (2003) showed that the suppressed proliferation response of Se
deficient cells could be overturned in a dose dependent manner by the in vitro addition of
Se. It was further observed that the selenoprotein TrxR was more highly preserved in the
cultured cells under Se deficiency conditions than GPx. Cell death occurred after the first
cell division, and the proliferated cells were even lower in TrxR and GPx. However, the
addition of vitamin E to Se deficient cells also reduced cell death, even though the
selenoprotein levels were not increased. It was concluded that the accumulation of lipid
hydroperoxides resulted in cell death and that the ability of the selenoproteins to
neutralize lipid hydroperoxides was the means through which they supported cell
proliferation (Saito et al., 2003). Maggini et al. (2007) stated that the mechanism of
action may lie in the maintenance of the redox balance in the cell by the selenoproteins.
The selenoenzyme TrxR is involved in the regulation of the redox status of the cells. In
turn the redox status affects enzymes, transcription factors as well as NF-κβ (Maggini et
al., 2007). However, the balance between selenoproteins and non-selenoproteins
contributing to the maintenance of redox status makes it difficult to pinpoint the
mechanism of action and therefore selenoprotein knockout mouse models may be
essential to fully comprehend the mechanism of action (Conrad and Schweizer, 2010).
Hoffmann (2007) also stated that the mechanism of action will not be fully understood

43
until the specific functions of the different selenoproteins in the immune cell, as well as
the response of selenoproteins to an immune challenge have been determined. In
addition, selenoproteins could potentially have functions other than the commonly
accepted elimination of ROS in immune cells (Hoffmann, 2007; Hoffmann and Berry,
2008).
Regardless of their precise function, the importance of selenoproteins in immune
cell function was demonstrated in a mouse knockout model study in which mouse T-
lymphocytes were lacking selenoproteins (Shrimali et al., 2008). Proliferation was
affected in the selenoprotein knock out T-lymphocytes, however chemically blocking
endogenous ROS production in vitro by the addition of N-acetyl cysteine resulted in
normal proliferative response. It was concluded that selenoproteins potentially play a role
in T-cell receptor activation, arguing an antioxidant mechanistic role for Se (Shrimali et
al., 2008). Ueno et al. (2008) evaluated the mitogenic response of T-cells derived from
spleens of mice kept on a Se deficient or adequate diet for 8 wk. Se was then added in
vitro to the cells. At the time that the spleens were harvested, tissue Se status was also
determined for various other organs. Interestingly it was reported that the decrease of Se
concentration in the spleen and thymus was not as great as that of the liver, kidney, heart
or whole blood. Glutathione peroxidase activity and TrxR measured in the splenic cells
indicated that TrxR activity was conserved to a greater extent than GPx activity. These
results indicated a potential resistance to Se deficiency in the lymphoid organs (Ueno et
al., 2008). The mitogenic response to ConA, calculated and expressed as cell growth,
indicated suppressed cell growth in deficient cells without Se added in vitro (Ueno et al.,
2008). Cells that received additional Se in vitro as sodium selenite (0.01-0.1 µmol/L)

44
showed the greatest increase in cell growth when compared to the other sources used
(sodium selenate, sodium selenide, selenocystamine dichloride, seleno-DL-cystine, seleno-
DL-ethionine seleno-L-methionine). Supplementation below 0.01 µmol/L resulted in very
little difference between Na2SeO4, seleno-DL-cystine and seleno-L-methionine, while
exceeding 0.1µmol/L had a suppressive effect. Finally, in vitro supplementation with
sodium selenite elevated both GPx and TR in the cultured cells. The recovery of GPx
activity was not to a comparable level to the adequate cells, while TR was similar to the
adequate cells. This observation led to the conclusion that TR may play an essential role
in immune cell proliferation (Ueno et al., 2008).
Continuing the focus on selenoproteins, Goldson et al. (2011) evaluated the
response of selected selenoproteins (SEPS1; SEPR and SEPW1) to an influenza vaccine
challenge. Humans were used as research subjects, allocated to one of 6 treatments for 12
wk. The different treatments included a placebo, Se-yeast tablets providing either 50, 100
or 200 µg Se/d, or meals made with low Se onions or Se enriched onions. At wk 10, all
research subjects were vaccinated with a trivalent flu vaccine. Blood samples were
collected for PBMC isolation prior to vaccination and 1 and 2 wk post vaccination. The
PBMC RNA was isolated and selenoprotein expression measured using RT-PCR. SEPS1
was elevated in the Se-yeast treatment in a dose dependent manner 1 wk post vaccination
compared to placebo treatment, but decreased to prior levels at the 2 wk post time point.
A treatment effect was observed for SEPW1 indicating the highest Se-yeast treatment
group to have lower expression of this selenoprotein compared to the other treatment
groups. In addition an overall trend was observed for higher levels of these selenoproteins
in the Se enriched onion group. The SEPS1 results leads to the conclusion that SEPS1

45
might be of interest to research defining the role of Se in the immune response (Goldson
et al., 2011).
The final proposition of a potential mechanism of action is through increased T-
cell receptor signal strength (Hoffmann et al., 2010). These researchers found that
increased Se intake in mice resulted in an increase in early cell signaling via elevated
Ca2+ flux and nuclear factor activated T-cells. They further reported that Se did not affect
phosphorylation of extracellular kinases and had no effect on oxidative stress levels.
Increased T-cell receptor signal strength can potentially result in improved proliferation
and differentiation. Higher Se intake was also found to increase T-cell receptor induced
oxidative burst in activated T-cells, and the upregulated levels of TrxR and GPx that they
measured were thought to be a precautionary adaptation to neutralize the resulting ROS
(Hoffmann et al., 2010). Finally, increased Se intake resulted in a more reduced
intracellular environment, theorized to induce an immune response bias towards Th1,
benefiting antiviral response and cytotoxic T-cell production (Hoffmann et al., 2010). In
a follow up study from the same laboratory, it was reported that the involvement of
selenoprotein K in receptor mediated Ca2+ flux in immune cells may be a clue to the
mechanism of action (Verma et al., 2011). Selenoprotein K knockout mice were used to
study Ca2+ flux in immune cells, which was found to be lower in the knockout mice when
compared to the wild type controls. T-cell proliferation was impaired, while T-cell
migration capacity was almost completely absent, and similarly neutrophil function was
suppressed. Efficient Ca2+ flux is important for immune cell activation. The research
findings from this laboratory suggest that the mechanism of action for Se and the immune

46
system may lie in the regulation of Ca2+ flux, implicating the importance of selenoprotein
K in immune function (Verma et al., 2011).
Selenium as antioxidant during exercise
The generation of energy in the mitochondria of cells depends on oxygen
metabolism. Although the majority of O2 will be reduced to H2O via the electron
transport system, even under normal circumstances, this process is not always 100%
complete. Incomplete reduction of O2 results in the generation of reactive oxygen species
(ROS), described as reactive O2-containing radicals with unpaired electrons that
compromise the stability of the compound. The major ROS generated are superoxide
radicals (O2-), hydroxyl radicals (˙OH) and hydrogen peroxide (H2O2). Although H2O2
does not have an unpaired electron, it is included under the term ROS based on its
reactivity (Ji, 1999; Surai, 2006; Battin and Brumaghim, 2009). During strenuous
physical exercise the consumption of O2 increases dramatically. In humans it is estimated
that strenuous exercise results in a 20-fold increase in O2 demand (Ji, 1999), while the
increase in O2 demand in the horse is 30-fold (Deaton et al., 2002; Hargreaves et al.,
2002). This increase in demand for O2 also results in an increase in the amount of ROS
produced (Avellini et al., 1999; Ji, 1999). In addition, other sources of ROS in the body
exist such as the ROS generated by the immune system during respiratory burst. High
intensity exercise can also induce inflammatory responses that contribute to ROS
production in the body (Ji, 1999).

47
The antioxidant mechanism is comprised of multiple layers of defense. It includes
both non-enzymatic antioxidants (vitamin E, vitamin C, carotenoids, ubiquinols,
flavonoids, glutathione and uric acid) and antioxidant enzymes (superoxide dismutase,
catalase, GPx and the thioredoxin system). When working in unison, the various
components of the antioxidant system are capable of preventing as well as repairing
oxidative damage (Ji, 1999; Urso and Clarkson, 2003; Surai, 2006; Battin and
Brumaghim, 2009).
Under normal conditions the antioxidant mechanism is capable of neutralizing the
effect of ROS production, creating a pro-/anti- oxidant balance within the body. With
training the antioxidant mechanism adjusts to maintain this balance (Yur et al., 2008).
However, during a strenuous exercise session, this delicate balance may be perturbed to
the point that the antioxidant mechanism cannot compensate for the increased ROS. This
results in oxidative stress and potentially oxidative damage to tissues, cell membranes
and DNA structures (Deaton et al., 2002). In horses, exercise induced oxidative stress has
been thought to contribute to muscle damage and fatigue, exercise intolerance and even
poor performance (de Moffarts et al., 2005). Ogonski et al. (2008) stated that the impact
of ROS on performance may be of such a nature that it should be considered an important
and routine variable, such as lactate, when evaluating exercise response studies in horses.
In horses, oxidative stress may be assessed by measuring malondialdehyde (MDA)
concentrations in plasma or serum using the TBARS assay (Ducharme et al., 2009).
MDA is the end product of lipid peroxidation when cell membranes are damaged by ROS
(Ducharme et al., 2009).

48
Se is believed to exert its antioxidant effects through the selenoproteins such as
GPx, although some in vitro evidence indicate that Se-Met and Se-Cys may be capable of
reducing ROS DNA damage (Battin and Brumaghim, 2009). The function of GPx is to
reduce peroxides such as H2O2 and is discussed in an earlier section of this literature
review. The complexity of the antioxidant system also results in synergistic interactions
between the different antioxidants (Deaton et al., 2002). As a consequence very little
research exists looking at the effect of Se alone on exercise induced oxidative stress.
Akil et al. (2011) evaluated the effect of Se supplementation on exercised induced
oxidative stress in adult rats. The rats were given 200 µg Se/d (intraperitoneal) for 4 wk.
After 4 wk the rats completed a 30 min forced swim exercise test. Un-supplemented rats
served as controls. Samples taken immediately post exercise indicated lower plasma
MDA and lactate levels in supplemented rats. Serum GPx protein levels and serum Se
levels were also elevated in the supplemented rats. The authors concluded that the Se
supplementation contributed to maintaining the pro-/anti- oxidant balance when
compared to the control group, and that Se did participate in the antioxidant mechanism
during exercise induced oxidative stress (Akil et al., 2011).
Pagan et al. (1999) compared Se-yeast and sodium selenite supplementation in
exercised Thoroughbreds. Although investigating oxidative stress was not one of their
objectives, they did report an increase in whole blood and plasma Se post exercise. While
plasma Se level returned to basal levels within 24 h in the sodium selenite group, it
remained elevated in the Se-yeast supplemented group (Pagan et al., 1999). Similarly, a
study that included 56 endurance horses competing in 25 to 100 mile endurance races
reported an increase in whole blood Se concentrations 1 hr after completion of the

49
endurance race (Haggett et al., 2010). Although some variation existed in whole blood Se
concentration (all within normal range with one exception), Se status did not have an
effect on performance (Haggett et al., 2010). White et al. (2011) supplemented 12
untrained Thoroughbreds with sodium selenite at a rate of either 0.1 (control) or 0.3 mg
Se/ kg DM for 34 d. The horses were then subjected to a prolonged exercise test at
submaximal activity with sampling before and at 0, 6 and 24 h post exercise. Although
creatine kinase (CK) levels increased in response to the exercise, there was no effect of
treatment on CK, used as an indicator of muscle damage. Elevated total serum lipid
hydroperoxides were observed post exercise in the control group compared to the
supplemented group and reported to indicate improved protection against oxidative stress
in the supplemented horses. RBC GPx activity did not respond similarly between
treatments to exercise. Post exercise RBC GPx activity was lower in the 0.3 mg Se/kg
supplemented group while RBC GPx only decreased at the 6 h post exercise time point in
the control horses. In contrast, muscle GPx activity was elevated 6 h post exercise in the
0.3 mg Se/kg group compared to baseline values, while it remained unchanged in the
control group (White et al., 2011). Se supplementation at 0.3 mg/kg DM was thought to
provide better protection against exercise induced oxidative damage possibly via the
changes observed in the GPx activity of muscle and RBC (White et al., 2011).
Brady et al. (1978) also investigated the effect of Se on exercise induced oxidative
stress. They supplemented one group of horses with 0.15 mg Se/kg DM trace-mineral salt
for 4 wk while an un-supplemented group served as control. Total dietary Se intake was
not reported. Blood samples were obtained before and at 1 and 24 h post exercise, which
consisted of a 2.2 km run in deep sand within a 10 min period. In contrast to White et al.

50
(2011), no effect of treatment was observed on Se status, although these horses were not
supplemented at comparable levels. A decline in RBC GPx was observed post exercise,
but this decline was unaffected by treatment. An increase in RBC MDA after exercise
was reported, indicating that there was an increase in oxidative damage. CK was also
found to increase due to the exercise, but this increase was independent of treatment. The
authors concluded that the unresponsiveness of their horses to the Se supplements may be
indicative of an adequate Se status of both control and supplemented group. However,
they hypothesized that their study outcome may have been different if they had included
a Se deficient group of horses (Brady et al., 1978). Taking a different approach, Janiak et
al. (2010) were interested in evaluating the change in GPx that would potentially occur in
young horses (16 to 20 mo) on an adequate Se diet (providing 3.02 mg Se/d from natural
feedstuffs) in response to training. Horses were sampled before and following a 4 mo
training period, as well as pre, 0 and 1 h post exercise at the end of the 4 mo period. RBC
lysate GPx activity increased over the 4 mo training period, but decreased immediately
post exercise, then recovered by 1 h post (Janiak et al., 2010).
Some studies have also investigated the effect of a combination of antioxidants on
exercise induced oxidative stress. Avellini et al. (1999) supplemented horses for 70 d
with a combination of vitamin E (40 mg/kg DM) and Se (0.02 mg/kg DM) in addition to
their basal diet (total dietary vitamin E and Se intakes not reported). During this 70 d
period horses were trained and completed a ridden exercise test at the end of the 70 d.
The exercise test consisted of two gallop sessions with samples taken prior to, in-between
and after the gallops. The MDA levels prior to the start of the trial were higher than those
measured after 70 d of training and supplementation. The level of MDA increased in

51
response to the exercise test, but it was still lower than prior to the study. Lymphocyte
GPx activity was increased as a result of the supplementation, but was unaffected by the
exercise test. It was concluded that the training, in conjunction with the vitamin E and Se
supplementation, resulted in improved extracellular antioxidant capacity, subsequently
reducing cellular damage as measured by MDA levels (Avellini et al., 1999). In contrast,
an exercise study conducted with 6 Thoroughbreds, supplemented with vitamin E,
vitamin C and Se for 6 wk, found no effect of exercise or treatment on plasma MDA
(Deaton et al., 2002). Measures of circulating antioxidants (glutathione, vitamin E or uric
acid) were also unaffected (Deaton et al., 2002). It was noted though that the standardized
exercise test performed on a treadmill did not seem to induce oxidative stress. The horses
were in regular treadmill training for the 6 wk supplementation period, and may have
been too adapted to the exercise. It was concluded that antioxidant supplementation may
only be beneficial if a deficiency existed (Deaton et al., 2002).
de Moffarts et al. (2005) evaluated the effect of a multi-antioxidant or placebo
supplement in 40 Thoroughbred race horses. The daily supplement provided a
combination of vitamin C (11.5 g), vitamin A (0.5 g) and vitamin E (7 g), Zn (769 mg),
Cu (187 mg) and Se (7 mg). Horses were supplemented for 12 wk while completing their
training (same trainer) and racing schedule as normal. Samples were taken prior to, at 6
and 12 wk. Overall an increase was observed in both water and lipid soluble plasma
antioxidants. RBC Se and GPx activity were increased over time in the supplemented
group while they decreased in the placebo group as expected due to the deficient Se
levels in the basal diet. However, CK levels remained comparable between the treatments
and no significant performance improvement effects were observed. Focusing just on the

52
Se component, the decreased RBC GPx activity appeared to have no effect on the
performance of these horses (de Moffarts et al., 2005). Ji et al. (1990) investigated the
effect of 7 wk of vitamin E supplementation (300 mg d,1-tocopherol acetate/kg DM) on
RBC enzyme activity using treadmill conditioned American Quarter Horses. Neither
treatment nor exercise affected RBC antioxidant enzymes, including GPx, catalase and
superoxide dismutase. Yet the treadmill test did result in an 18-fold increase in lactate. It
was theorized that equine blood may have enough antioxidant reserves so that a single
strenuous bout of exercise would not have affected antioxidant enzyme activity (Ji et al.,
1990).
Some research studies simply evaluated the effect of exercise on the antioxidant
system, although for observational types of studies it should be kept in mind that
supplementation may not always be reported accurately by participants. Hargreaves et al.
(2002) evaluated the effect of endurance exercise on antioxidant status and muscle
damage in 35 horses competing in an official 80 or 160 km endurance race. Dietary
composition was not reported. The horses that completed the 80 km race had elevated
GPx activity, though it returned to baseline 1 h post exercise. The horses that completed
the 160 km endurance race had elevated GPx activity at 142 and 160 km, but it returned
to baseline values 1 h post exercise. The authors hypothesized that the 1 h post exercise
decrease in GPx may have been the result of depleted glutathione stores. In both cases
CK and AST levels were correlated with GPx activity, interpreted as indicative of
adequate antioxidant protection (Hargreaves et al., 2002). Similarly, it was reported that
horses exercised on the treadmill until the point of fatigue had an increase in RBC GPx
activity, but at 1 and 24 h post exercise GPx activity had returned to normal (Smarsh et

53
al., 2010). Using trained Standardbred trotters, Ogonski et al. (2008) evaluated the effect
of exposure to the extreme exertion experienced during a race on the antioxidant status of
the horses. The plasma total antioxidant status of the horses was found to decrease after
the race. In addition, it was noted that the greatest decrease in antioxidant status was
measured in the horses that displayed the best performance as determined by heart rate
and respiration recovery post exercise (Ogonski et al., 2008). In an example of extreme
endurance exercise, oxidative stress by itself was evaluated in 9 Arabian type horses
competing in a 210 km race over a 3 day period (Gondim et al., 2009). It was determined
that apart from electrolytes, horses were not provided with any additional antioxidant
supplements, and all horses were kept on a diet consisting of a performance horse level
concentrate, corn oil and hay. Blood samples were obtained prior to the onset of the race
and at the end of each day. Only five horses completed the 210 km race. Plasma MDA
increased and then stabilized, especially in the more competitive horses. Plasma CK
levels increased up to d 2, and then decreased. Interestingly, horses that were eliminated
throughout the race all showed highly elevated CK levels, while those horses that
finished were always within the normal biological range. The finishers also had higher
glutathione reductase capacities. It was hypothesized that the eliminated horses were not
able to compensate for the increase in oxidative stress (Gondim et al., 2009).
Not all equine studies reported an increase in GPx activity in response to exercise.
A summary of these studies appear below in Table 2.5 for comparison. GPx has been
shown to be consistent in adapting in response to training as cells respond to consistent
exercise training by activating the synthesis of antioxidant enzymes. (Ji, 1999). Williams
(2010) hypothesized elevated GPx activity in response exercise may be indicative of an

54
increase in pro-oxidant scavenging activity. Regardless a complete understanding of the
changes in GPx due to exercise and the direct impact on equine athletes is still lacking
(White et al., 2011).

55
Summary and study objectives:
Selenium is a micro nutrient that has received a lot of attention in the research
world for both its antioxidant and immune modulating properties. In contrast, comparably
few studies in this research area have focused on the horse. Those researchers that have
evaluated the effect of Se on the equine immune system have mostly concentrated on the
humoral immune response. Improving immune function and antioxidant capacity by
optimizing Se status can be of benefit for all classes of horses without requiring a large
financial investment on the horse owner’s part. Therefore the overall objectives of this
research were to evaluate immune- and antioxidant function in horses of low, adequate or
high Se status for an extended period of time. We hypothesized that horses of low Se
status would exhibit a suppressed immune response and experience higher levels of
oxidative stress due to a compromised antioxidant mechanism. We were also interested in
determining if source of Se (i.e. Se-yeast vs sodium selenite) could have an effect on the
observed responses. To meet these objectives we conducted a preliminary study followed
by a three-phase long term study over 18 mo period. The specific aims were:
Aim 1 (Preliminary study Chapter 3): To investigate the relationship between Se status,
antioxidant status and immune function in a group of horses ranging from deficient to
adequate Se status.
Aim 2 (Chapter 4): To determine if Se depletion over an extended period of time (8 mo)
would affect measures of immune function as compared to horses kept on a Se adequate
diet. The objectives were to evaluate the ability of the immune system of horses of low

56
Se status to respond to a novel vaccine challenge (keyhole limpet hemocyanin; KLH) as
measured by in vitro lymphocyte proliferation, peripheral blood mononuclear cell
(PBMC) intracellular cytokine production, PBMC cytokine mRNA expression and
antigen specific antibody production. The second objective was to evaluate the ability of
the immune system of horses of low Se status to mount an anamnestic respond to an
equine influenza vaccine (KY02) that all horses had been vaccinated with before. Again
in vitro lymphocyte proliferation, PBMC intracellular cytokine production, PBMC
cytokine mRNA expression, flu specific IgGa, IgGb and IgG(T) production and
hemagglutination titer was measured.
Aim 3 (Chapter 5): Determine the impact of repleting Se deficient horses with either
organic (0.3 ppm) or inorganic Se (0.3 ppm) on immune function. The study objectives
were to assess the effect of Se status on immune function in response to a novel vaccine
challenge (ovalbumin) by means of in vitro assessment of lymphocyte proliferation,
intracellular cytokine production, cytokine mRNA expression, antigen specific antibody
production. The second objective was to assess the effect of Se status on memmory
immune function in response to an equine influenza vaccine (KY02) challenge by means
of in vitro assessment of lymphocyte proliferation, PBMC intracellular cytokine
production, PBMC cytokine mRNA expression, whole blood cytokine expression,
antigen specific IgGa, IgGb and IgG(T) production and hemagglutination titer.

57
Aim 4 (Chapter 6): To evaluate the effect of long term Se depletion and repletion on
complete blood count analysis, glutathione peroxidase activity, total antioxidant capacity,
and malondialdehyde concentration as indicator of oxidative stress.
Aim 5 (Chapter 7): To evaluate the effect of Se status on malondialdehyde concentration,
pro-inflammatory cytokine expression and indicators of muscle damage in response to
mild exercise.
Brief experimental design description (Aims 2 to 5):
The study was conducted in three continuous phases: A 28 wk Se depletion phase
and 7 wk vaccine challenge, followed by a 22 wk Se repletion phase and 7 wk vaccine
challenge (29 wk), as illustrated in Figure 2.3. The final vaccine challenge after the
repletion phase was followed with an exercise test that will be defined as phase 3. In
order to accommodate the repletion phase, the horses were blocked by age and gender
and randomly allocated within block to one of 4 treatment groups prior to the start of the
study. Each treatment group consisted of seven horses. As is evident from Figure 2.3, one
group received the same adequate Se diet throughout the study and functioned as a
control.

58
Table 2.1. Summary of Se supplementation response data: peripheral blood indicators of Se status.
Study Study length
Se status
prior to study
Source Total Se intake (DM)
Final Plasma/serum
Se (ng/mL) Final plasma GPx
activity Final Whole
blood Se
Final whole blood (WB) or red blood
cell (RBC) GPx activity
Stowe, 1967 60 d Deficient Control Purified diet 36.8 ± 13.1 (SD) * * *
Deficient Sodium selenite 0.500 mg/kg 142.0 ± 12.4 * * *
Deficient Sodium selenite 1.000 mg/kg 153.0 ± 14.3 * * * Deficient Sodium selenite 2.000 mg/kg 167.0 ± 19.5 * * *
Shellow et al., 1985 140 d * Control 0.070 mg/kg 69.0 ± 3.0 (SE) 0.690 U/mL plasma 104.0 ± 5.0 (SE) ng/mL *
* Sodium selenite 0.162 mg/kg 110.0 ± 4.0 0.743 U/mL plasma 176.0 ± 12.0 ng/mL *
* Sodium selenite 0.288 mg/kg 143.0 ± 4.0 0.736 U/mL plasma 208.0 ± 3.0 ng/mL *
* Sodium selenite 0.460 mg/kg 140.0 ± 8.0 0.742 U/mL plasma 183.0 ± 12.0 ng/mL *
Richardson et al., 2006 56 d Marginal Control 1.3 mg/d 96.0 ± 8.0 (SEM) 11.8 mU/mg protein * 278 mU/mg Hb (RBC)
Marginal Sodium selenite 4.7 mg/d 151.0 ± 8.0 12.3 mU/mg protein * 438 mU/mg Hb (RBC) Marginal Zn-L-selenomethionine 5.1 mg/d 169.0 ± 8.0 10.0 mU/mg protein * 238 mU/mg Hb (RBC)
Calamari et al., 2009 112 d Marginal Control 0.085 mg/kg 92.8 ± 13.9 (SED) 0.839 U/mL plasma 178 ± 22.3 (SED) ng/g 171 U/g Hb (WB)
Marginal Se-yeast 0.182 mg/kg 169.6 ± 13.9 0.917 U/mL plasma 348.2 ± 22.3 ng/g 244 U/g Hb (WB)
Marginal Se-yeast 0.290 mg/kg 180.0 ± 13.9 1.098 U/mL plasma 448.5 ± 22.3 ng/g 291 U/g Hb (WB)
Marginal Se-yeast 0.395 mg/kg 208.1 ± 13.9 0.878 U/mL plasma 489.0 ± 22.3 ng/g 298 U/g Hb (WB)
Marginal Sodium selenite 0.288 mg/kg 184.2 ± 13.9 1.070 U/mL plasma 381.0 ± 22.3 ng/g 299 U/g Hb (WB)

59
Table 2.1. Continued.
Karren et al., 2010 110 d * Pasture 0.190 mg/kg 224 ± 6.0 (SE) 6.85 mU/mg protein * *
* Pasture+Se yeast 0.490 mg/kg 255 ± 5.0 7.56 mU/mg protein * *
* Pasture+grain 0.350 mg/kg 253 ± 7.0 7.37 mU/mg protein * *
* Pasture+grain+Se yeast 0.650 mg/kg 260 ± 6.0 7.14 mU/mg protein * *

60
Table 2.2. Summary of selected cytokines and their related functions*.
Cytokine Secreting Cells Target cells Functions
IL-1β Macrophages & others Macrophages
Activation and co-stimulation of other cytokines; pyrogenic [1]; synergistic
relationship with TNFα; pro-inflammatory; tissue damage [5]
IL-2 T-cells T-, B-cells and macrophages
Proliferation; IFNγ secretion; antibody production [1, 7]
IL-6 T-, B-cells macrophages T-and B-cells
Pro-inflammatory and co-stimulatory; proliferation and differentiation [1]; Anti-inflammatory via inhibition of TNFα and
IL-1 [4]
IL-8 Macrophages
and endothelial cells
Neutrophils Chemokine, neutrophil chemo-attractant, activates degranulation of neutrophils [5];
adherence to vascular endothelium [6]
IL-10 Th2 and T-
regulatory cells; B-cells
T-, B-cells and macrophages, dendritic cells
Immune suppression, down regulates Th1 [1]; reduce suppress IL-2 and IFNγ;
deactivate macrophage pro-inflammatory synthesis [4]
IL-13 Activated T-cells (Th2)
B-cells, macrophages
Regulation of CMI [1]; suppress monocyte/ macrophage TNFα; IL-8, IL-1
production [4]
TNFα T-cells,
macrophages, monocytes
Neutrophils, macrophages,
monocytes
Activation of acute phase proteins [2]; synergistic relationship with IL-1; pro-
inflammatory; tissue damage [5]
IFNγ Th1, cytotoxic T-cells and NK
cells
T-cells; macrophages,
NK-cells, others
Activation of APC's and CMI; increased MHC II expression [3]; antiviral [5]
*[1] = Tato and Cua (2008a); [2] = Tato and Cua (2008b); [3] = Tato and Cua (2008c); [4] = Opal and DePalo (2000); [5] = Dinarello (2000); [6] = Goldsby et al. (2000); [7] = Farrar et al. (1982b).

61
Table 2.3. Response of humoral immune variables to selenium supplementation*.
*L indicates control diet below adequate Se concentration; A indicates control diet contains adequate Se concentration
Study Species Se Status Se Source Variable Response Broome et al. (2004) Human Supplemented Sodium selenite Polio-antibody Similar to controlL* Beck et al. (2001) Mouse Deficient * Flu-antibody Similar to controlL Li and Beck (2007) Mouse Deficient * Flu-antibody Similar to controlL Baalsrud and Overnes (1986) Horse Supplemented Sodium selenite Total antibody Similar to controlL Janicki (2001) Horse Supplemented Sodium selenite/ Se-yeast Serum IgG HigherA Knight and Tyznik (1990) Horse Supplemented Sodium selenite Serum IgG HigherL
Horse Supplemented Sodium selenite HA titer HigherL Thorson et al. (2010) Horse Supplemented Selenomethionine Serum IgG Similar to controlA Nemec et al. (1990) Cattle Supplemented Elemental Se (bolus) Salmonella antibody Similar to controlL
Cattle Supplemented Elemental Se (bolus) B. abortus antibody Similar to controlL
Cattle Supplemented Elemental Se (bolus) HA titer Similar to controlL Nicholson et al. (1993) Cattle Supplemented Se-yeast Anti-OVA titer Slower decline vs. controlL Reffett et al. (1988b) Cattle Supplemented Sodium selenite Serum IgG Similar to controlL
Cattle Supplemented Sodium selenite Serum IgM HigherL
Cattle Supplemented Sodium selenite HA titer HigherL
Kumar et al. (2009) Sheep Supplemented Unspecified org source P. multocida antibody HigherA
Reffett et al. (1988a) Sheep Supplemented Sodium selenite Flu-antibody Higher primary responseL
Sheep Supplemented Sodium selenite Serum IgM HigherL
Sheep Supplemented Sodium selenite Serum IgG Similar to controlL Singh et al. (2006) Chicken Supplemented Sodium selenite HA titer Similar to controlL
Chicken Supplemented Sodium selenite Total IgG Similar to controlL Biswas et al. (2006) Quail Supplemented Sodium selenite HA titer HigherA

62
Table 2.4. Response of various cell mediated and innate immune variables to selenium supplementation*.
Study Species Se Status Se source Variable Response Broome et al. (2004) Human Supplemented Sodium selenite Lymphocyte proliferation HigherL Human Supplemented Sodium selenite Various cytokines (protein) HigherL Human Supplemented Sodium selenite Natural killer cell activity Similar to controlL Kiremidjian-Scumacher
Human Supplemented Sodium selenite Cytotoxicity levels of cytoxic Tcells HigherL
et al. (1994) Human Supplemented Sodium selenite Natural killer cell activity HigherL Lee and Wan (2002) Human In vitro suppl. Sodium selenite Lymphocyte proliferation with mitogen Similar to controlL
Human In vitro suppl. Sodium selenite Lymphocyte proliferation no mitogen HigherL
Human In vitro suppl. Sodium selenite Total T- & T-helper cell number (culture) HigherL Peretz et al. (1991) Human Supplemented Se-yeast Lymphocyte proliferation HigherA Roy et al. (1994) Human Supplemented Sodium selenite Lymphocyte proliferation HigherL Human Supplemented Sodium selenite T-cell IL-2 receptor expression HigherL
Beck et al. (2001) Mouse Deficient * Lung IL-4, -5, -10, -13 (lymph node mRNA)
HigherA
Mouse Deficient * IFNγ (lymph node mRNA) LowerA Li and Beck (2007) Mouse Deficient * RANTES and MIP-1α (lung, mRNA) LowerA Mouse Deficient * IL-2, -4 (lung, mRNA) HigherA Petrie et al. (1989) Mouse Supplemented Sodium selenite Natural killer cell activity HigherA Mouse Supplemented Sodium selenite Cytotoxicity levels of cytoxic Tcells HigherA Sheridan et al. (2007) Mouse Se-prot KO * IFNγ, IFNβ, TNFα, IL-6 (lung mRNA) LowerA Mouse Se-prot KO * IFNγ (Lung mRNA) d 7 post challenge Similar to controlA Ueno et al. (2008) Mouse In vitro suppl. * Spleen T-cell proliferation Similar to controlL Vunta et al. (2008) Mouse Supplemented N/A Macrophage TNFα and COX2 expression LowerL
*L indicates control diet below adequate Se concentration; A indicates control diet contains adequate Se concentration

63
Table 2.4. Continued.
*L indicates control diet below adequate Se concentration; A indicates control diet contains adequate Se concentration
Study Species Se Status Se source Variable Response Lessard et al. (1991) Pig Supplemented Sodium selenite Lymphocyte proliferation HigherL Pig Supplemented Sodium selenite Natural killer cell activity LowerL Pig Supplemented Sodium selenite Granulocyte respiratory burst Similar to controlL Wuryastuti et al. (1993) Pig Supplemented Sodium selenite Lymphocyte proliferation Similar to controlL Pig Supplemented Sodium selenite Neutrophil function HigherL Biswas et al. (2006) Quail Supplemented Sodium selenite Foot web thickness HigherA Cao et al. (1992) Cattle Deficient * Lymphocyte proliferation SuppressedA Azis and Klesius Goat Deficient * Lymphocyte proliferation Similar to controlA (1985) Goat Deficient * IL-2 levels Similar to controlA Malá et al. (2009) Goat Supplemented Org/Inorg Leukocyte numbers/phagocytic activity Similar to controlA

64
Table 2.5. Glutathione peroxidase activity response to exercise.
Study Species Control or treatment Se intake
Study length
Initial fitness
Type of exercise
GPx* response post exercise
Akil et al. (2011)
Rat 0 or 200 µg/d (intraperitoneal)
4 wk Unfit 30 swim test
Higher than control (serum)
White et al. (2011)
Horse 0.1 or 0.3 mg/d 34 d Unfit Mild prolonged exercise
Lower than control (RBC)
White et al. (2011)
Horse 0.1 or 0.3 mg/d 35 d Unfit Mild prolonged exercise
Higher than control (muscle)
Brady et al. (1978)
Horse Basal (N/A) or 0.15 mg Se/kg DM
4 wk N/A 2.2km trot in 10 min
Similar to control (RBC)
de Moffarts et al. (2005)
Horse 0 or 7 mg/d 12 wk Fit Race training
Higher than control (RBC)
Janiak et al. (2010)
Horse 3.02 mg Se/d (no control)
4 mo In training
Trotter training
Increase with training (RBC)
Hargreaves et al. (2010)
Horse N/A * In training
Endurance race
Elevated (RBC)
* GPx = glutathione peroxidase

65
Figure 2.1. Selenium metabolism pathway as adapted from Combs (2001), Rayman (2007), Papp
et al. (2007) and Hesketh (2008). Abbreviations: GS-Se-SG = selenodiglutathione; (CH3)2Se =
dimethyl selenide; (CH3)3Se+ = trimethyl selenonium ion; H2Se = selenide; HSePO3 =
selenophosphate.

66
Figure 2.2. Detoxification of H2O2 by glutathione peroxidase via glutathione recycling.
Adapted from Urso and Clarkson (2003).

67
Figure 2.3. Experimental design and treatment allocation during the depletion and repletion
phases.
Copyright © Mieke Brummer 2012
28 horses
Depletion Phase Adequate Se diet
n = 7
Repletion Phase Adequate Se diet
n = 7
Depletion Phase Low Se diet
n = 21
Repletion Phase Low Se diet
n = 7
Repletion Phase Organic Se diet
n = 7
Repletion Phase Inorganic Se diet
(SS) n = 7

68
CHAPTER 3: The relationship between selenium status, antioxidant status and the immune system of the horse
INTRODUCTION
Only a few studies have investigated the effect of Se on the equine immune
system (Knight and Tyznik, 1990; Janicki, 2001; Thorson et al., 2010) and the
relationship between Se status and immunomodulating cytokines in the adult horse have
not been investigated. In the horse, the majority of Se research conducted has focussed on
the effect of Se supplementation on overall Se status and GPx activity (Shellow et al.,
1985; Richardson et al., 2006; Calamari et al., 2009b; Karren et al., 2010). One study that
investigated the effect of Se on immune function in the horse reported that ponies on a
high Se diet (0.22 ppm) had higher IgG concentrations in response to an immunological
challenge than ponies on a Se deficient (0.02 ppm) diet (Knight and Tyznik, 1990).
Another study conducted on broodmares and foals found that foals from Se supplemented
mares had greater serum IgG concentrations at 2 wk of age than foals from un-
supplemented mares (Janicki, 2001). In contrast, supplementing broodmares with
selenomethionine during the last trimester of pregnancy was reported to have no effect on
colostrum or foal serum IgG concentrations (Thorson et al., 2010). In other species Se
status has been shown to affect the mRNA expression of a selected cytokines (Li and
Beck, 2007), IL-2 receptor (Roy et al., 1994) and lymphocyte proliferation (Broome et
al., 2004). Understanding the effect of Se status on the equine immune system will be of
benefit to the horse, especially those horses kept in areas marginal in Se. Therefore the
objective of this study was to investigate the relationship between the Se status of the
horse (serum Se concentration and whole blood GPx activity), indicators of cell-mediated

69
immune function and antioxidant status (total antioxidant capacity, TAC;
malondialdehyde concentration, MDA). We investigated in vivo cytokine gene
expression in whole blood and in vitro cytokine gene expression in stimulated PBMC
using RT-PCR. The cytokines investigated included IFNγ, TNFα, IL-2, IL-8, and IL-10.
Lymphocyte proliferation was also investigated. We hypothesized that horses of lower Se
status would have lower lymphocyte proliferation and that Se status would affect
intracellular cytokine production and cytokine gene expression.
MATERIALS AND METHODS
Animals and Sampling:
This research project was approved by the Institutional Animal Care and Use
Committee of the University of Kentucky.
The aim was to sample horses that would be diverse with regard to Se status. To
achieve this, 24 horses that had been on pasture and fed various amounts of concentrate
for 4 mo (May to September) were used. The pastures had been sampled and determined
to be deficient in Se content (0.04 ppm Se on dry matter (DM) basis). Sixteen horses,
including 8 mares and 8 geldings (mean age ± SD; 11.4 yr ± 5.24), had been kept on
pastures with sufficient forage availability to maintain body weight. These horses
received no dietary supplementation except for access to an iodized salt block. The
remaining 8 horses, which included 5 mares and 3 geldings (10.1 yr ± 5.96), were kept on
pastures with more limited pasture availability, but similar Se content, and were
supplemented with a pelleted grain-based concentrate containing at least 0.3 ppm Se (as

70
fed basis, McCauley Bros Inc., Versailles, KY). Horses receiving additional concentrate
were provided with a quantity sufficient to maintain body condition (on average 2.7 kg of
the concentrate per day). Each horse was sampled once only.
Se and antioxidant status:
Whole blood (7 mL) was collected in lithium-heparin tubes (Becton Dickson,
Franklin Lakes, NJ) for GPx activity analysis. Blood was also collected in tubes with no
additive (Becton Dickson) for serum separation. Whole blood and serum were stored at -
80˚C until analysis. Whole blood GPx activity was measured using the method of Paglia
and Valentine (1967). Final GPx activity was then expressed as μmol NADPH
oxidized·mL-1·min-1∙g protein (μmol EU/g protein). Serum was analyzed for Se content
by means of inductively coupled plasma-mass spectroscopy (DCPAH, Michigan State
University, Lansing, MI). Serum TAC was determined using a method that compared the
ability of the antioxidants in the serum sample to inhibit the oxidation of 2,2’-azino-di-[3-
ethylbenzthiazoline sulphonate] to that of Trolox, a water soluble tocopherol analogue
(Caymenchemical; Ann Arbor, MI). Serum MDA concentration was measured using a
thiobarbituric reactive substances (TBARS) method (Caymenchemical). This method was
based on the reaction of MDA with thiobarbituric acid under acidic, high temperature
conditions, using MDA to create a standard curve. Serum vitamin E analysis was
conducted by the Veterinary Diagnostic Laboratory, Iowa State University by means of
HPLC analysis with UV detection.

71
Complete Blood Count (CBC):
A CBC analysis was performed for each horse by a commercial equine hospital
(Rood & Riddle, Lexington, KY). The number of neutrophils and lymphocytes were
calculated for each horse using the CBC data.
Peripheral blood mononuclear cell (PBMC) isolation:
For PBMC isolation, venous blood (30 mL) was collected into heparinized tubes
(Kendall, Monoject blood collection tubes, Mansfield, MA). The PBMC were isolated
using Ficoll-Paque Plus (Amersham Biosciences, Piscataway, NJ) gradient
centrifugation. Approximately 15 mL of plasma was layered on top of 10 mL Ficoll-
Paque Plus in a 50 mL centrifuge tube (Fisher) and centrifuged for 30 min at 500 x g. The
interface cells were collected, washed 3 times with phosphate buffered saline (Sigma),
counted and re-suspended at the required concentrations in RPMI 1640 (Gibco, Grand
Island, NY) supplemented with 2.5% fetal equine serum (Sigma), 2mM L-glutamine
(Sigma), 100 U/mL penicillin/streptomycin (Sigma) and 55 μM 2-mercaptoethanol
(Gibco), as described by (Adams et al., 2008).
IFNγ and TNFα Intracellular Staining:
The PBMC were plated (4 x 10⁶ cells per mL) in 3.5 mL culture wells (TPP,
Trasadingen, Switzerland), and stimulated for 4 h with PMA (25 ng/mL; Sigma) and
ionomycin (1μM; Sigma) as described in Adams et al. (2008). Un-stimulated PBMC
cultures incubated with media alone served as the control. To assess IFNγ and TNFα
production, intracellular staining was performed, as previously described (Breathnach et
al., 2006; Adams et al., 2009). The stained cells were analyzed by means of flow
72
cytometry (FACSCalibur, Becton Dickson, San Jose, CA). The percentage of
lymphocytes producing IFNγ and TNFα and the mean fluorescence intensity (MFI) of the
stained cells were determined using Cell Quest software (Becton Dickson, San Jose, CA).
The percentage gated refers to the percentage of lymphocytes, identified and gated based
on the forward and side scatter parameters, producing IFNγ or TNFα, while MFI refers to
the intensity of the IFNγ or TNFα signal in the cells producing IFNγ or TNFα
(Breathnach et al., 2006). Using the computer software, markers were placed on the
isotype control antibody labelled stimulated cells so that 1% of cells were IFNγ or TNFα
positive. The MFI and percentage gated values reported are values corrected for each
individual sample subtracting the isotype control MFI and % gated values from the
stimulated values. Some of the intracellular staining results did not reflect proper staining
and were therefore excluded from the results. However the results that were included (n =
17) represented a range of Se status.
Relative expression of cytokine mRNA
Stimulated PBMC, as described for intracellular staining, were used to assess the
in vitro gene expression of IFNγ, TNFα, IL-2 and IL-10. The stimulated PBMC were
lysed by the addition of 1mL RNA-STAT 60 (Tel-Test, Isotex Diagnostics Inc.,
Friendswood, TX) and stored at -80ºC until total RNA was extracted according to
manufacturer’s protocol.
In vivo cytokine gene expression of IFNγ, TNFα, IL-10 and IL-8 was assessed by
collecting 2.5 mL blood via jugular venipuncture into PAXgene blood RNA tubes

73
(PreAnalytiX, Valencia, CA). Total RNA was extracted using the PAXgene RNA
extraction kit (Qiagen, Valencia, CA), according to the manufacturer’s protocol.
Reverse transcription was conducted as described by Breathnach et al. (2006).
Cytokine gene expression was measured by means of RT-PCR (7900 HT Fast Real-Time
PCR system, Applied Biosystems, Foster City, CA) using equine specific intron spanning
primer/probe sets (Breathnach et al., 2006; Adams et al., 2009). Relative change in gene
expression was calculated as described in (Livak and Schmittgen, 2001). Mean of the un-
stimulated cells served as calibrator and results were expressed as relative quantity (RQ)
calculated as 2-ΔΔCT. Beta-glucuronidase was used as the internal control (Breathnach et
al., 2006). In vivo cytokine gene expression in un-stimulated whole blood analysis was
completed for 16 horses, representing a range of Se status.
Lymphocyte proliferation:
Isolated PBMC were plated (2x10⁶ cells per mL) in 96 well flat-bottom plates
(TPP, Trasadingen, Switzerland) and incubated with ConA (10 μg/mL). Following 72 h
incubation in a 37ºC, 5% CO2 humidified incubator, PBMC were pulsed with 0.5 μCi 3H-
thymidine, incubated for an additional 18 h, and frozen (-20ºC) until analysis. DNA was
extracted from the PBMC onto fiber filter pads using a Tomtec harvester (J/B Industries
Inc, IL) and liquid scintillation counting performed (Wallac Inc., Gaitheisburg, MD).
Corrected counts per minute were used for statistical analysis.
Statistical analysis:
Statistical analysis was conducted using SAS 9.1 (SAS Institute Inc., Cary, NC).
The PROC CORR procedure was used to evaluate relationships between immune

74
variables and indicators of Se and antioxidant status. Significance was set at p < 0.05 and
a trend for significance at p < 0.1.
RESULTS AND DISCUSSION
The serum Se concentration of the horses on this study ranged from 69 to 193
ng/mL. The adequate range for serum Se in the adult horse is 130 to 160 ng/mL (Stowe
and Herdt, 1992). To investigate the relationship between the Se status and the chosen
immune variables, it was important to sample a group of horses that represented a range
in Se status. The individuals on this study met that requirement as there were individuals
with low, moderate and high serum Se concentrations. Whole blood GPx activity ranged
from 25.43 to 46.75 μmol EU/g protein and was correlated with serum Se concentration
(r = 0.71, P = 0.0001). A similar correlation (r = 0.75; P < 0.001) was reported for plasma
Se concentration and whole blood GPx activity in horses fed various levels of Se-yeast or
sodium selenite (Calamari et al., 2009b). Although serum Se concentration is used for
clinical interpretation of Se status (Stowe and Herdt, 1992), selenoproteins such as GPx
are thought to provide a more functional measure of Se status (Gromadzinska et al.,
2008). Both indicators of Se status confirmed that the horses included in this study
represented a range in Se status.
A positive correlation was found between the amount of IFNγ produced by
stimulated lymphocytes (MFI) and whole blood GPx (r = 0.78; P = 0.0002; Figure 3.1).
However, no correlation was observed between the amount of IFNγ produced and serum
Se (Table 3.1). Relative gene expression for IFNγ by in vitro stimulated PBMC was not

75
correlated with any of the indicators of Se status. A lack of relationship also existed
between Se status and in vivo gene expression of IFNγ. The cytokine IFNγ is considered
to be pro-inflammatory as it potentiates the actions of the tumor necrosis factor cytokines
that are known to stimulate pro-inflammatory cascades. At the same time, IFNγ has
essential anti-viral properties and activates the pathway for cytotoxic T-cell activation
(Dinarello, 2000). Other studies have also indicated a relationship between Se status and
IFNγ. Broome et al. (2004) reported that greater amounts of IFNγ were produced by polio
virus-stimulated whole blood cultures (in vitro) from Se supplemented humans, 7 d after
challenge with a polio virus vaccine. Another study reported that Se deficient mice
challenged with a mild strain of influenza virus (A/Bangkok/1/79) had a decrease in
mediastinal lymph node IFNγ mRNA levels compared to Se adequate mice (Beck et al.,
2001). Se deficient mice were also found to be more susceptible to infection and
developed more severe inflammation in their lungs than the mice that were of adequate
Se status (Beck et al., 2001). Therefore the observed relationship between the amount of
IFNγ produced and GPx activity is consistent with previous work, although no
correlation existed for IFNγ gene expression in stimulated PBMC in this study.
A correlation existed between serum Se concentration and the relative gene
expression of IL-10 (r = 0.42; P = 0.0414) by PBMC stimulated in vitro. IL-10 is an anti-
inflammatory cytokine that functions as an inhibitor of pro-inflammatory cytokines such
as TNFα and IFNγ, as well as IL-2 (Opal and DePalo, 2000). Dunstan et al. (2006) found
no correlation between plasma Se levels and IL-10 production by lymphocytes from
human subjects stimulated in vitro, but Beck et al. (2001) reported Se deficient mice to
have higher IL-10 expression in mediastinal lymph node tissue than Se adequate mice in

76
response to an immune challenge. Even though IL-10 is expected to suppress pro-
inflammatory cytokines such as IFNγ, positive correlations with Se status were found for
both of these cytokines. In addition a trend was observed for a correlation between serum
Se and gene expression of TNFα (r = 0.38; P = 0.0660) in in vitro stimulated PBMC.
Similarly, a trend was observed between serum Se concentration and the percentage of
lymphocytes, stimulated in vitro, producing TNFα (r = 0.45; P = 0.0731). From this
preliminary study it would appear that higher Se status may be associated with an
increase in both pro- and anti-inflammatory cytokine expression in the horse. The
possibility exists that the increased IL-10 mRNA was in response to elevated levels of the
pro-inflammatory cytokines.
Although previous studies have found a relationship between lymphocyte
proliferation and Se status (Roy et al., 1994; Broome et al., 2004) there was no
correlation between the Se status of the horses and lymphocyte proliferation in this study.
Similarly there was no relationship between Se status and IL-2, a cytokine associated
with proliferation (Farrar et al., 1982a). In addition, no relationship existed between Se
status and neutrophil or lymphocyte numbers in this study. Although Se status has been
reported to affect IgG concentrations in horses, the absence of an effect on lymphocyte
proliferation and cell numbers suggest that the effect is not mediated through lymphocyte
number. Wuryastuti et al. (1993) also reported a lack of effect of Se intake on
lymphocyte proliferation.
The mean serum TAC was 0.99 ± 0.02 mM. No relationship existed between
TAC and serum Se concentration or GPx activity. Similarly MDA concentration (mean =
5.39 ± 0.35 µM) was not correlated with serum Se or GPx. Dunstan et al. (2006) reported

77
a positive correlation between IL-10 and TAC in humans, but noted that animal models
tend to report negative correlations between these two variables. Indeed, our study found
a negative correlation (P = 0.025) between the gene expression of IL-10 and TAC (Table
3.2). Similarly, negative correlations existed between TAC, the amount of IFNγ produced
(r = - 0.64; P = 0.0054), and the gene expression for IFNγ (r = - 0.40; P = 0.0505) and
TNFα (r = - 0.45; P = 0.0283) by PBMC stimulated in vitro. Given the pro-inflammatory
nature of both IFNγ and TNFα, the negative association with antioxidant capacity is an
interesting finding, and may indicate that additional components of the antioxidant
mechanism, other than Se, may have an effect on the equine immune system.
In elderly human patients vitamin E has been shown to enhance the immune
system by affecting variables such as lymphocyte proliferation (Meydani et al., 1990).
Vitamin E concentrations of the horses on this study indicated that they were of adequate
vitamin E status (mean = 3.8 ± 0.24 µg/mL), as indicated by vitamin E concentrations
above 2 ug/mL (NRC, 2007). Vitamin E status was not correlated with TAC, MDA or
indicators of Se status. It is possible that the lack of correlation between Se status and
some of the immune variables such as lymphocyte proliferation could have been the
result of adequate vitamin E status and other components of TAC that may be interesting
to investigate. A stronger relationship between Se status and the immune variables might
have been evident if the horses also had a low vitamin E status.
CONCLUSION
In conclusion, horses with low Se status were able to sustain most aspects of their
immune function, but IFNγ production by stimulated lymphocytes was compromised.

78
The significant role of IFNγ in viral immune defence of the body suggests that adequate
Se nutrition should be an important consideration for horses kept in Se marginal regions.

79
Table 3.1. Correlations (r) between serum Se, whole blood GPx and the immune
variables investigated.
*Upon closer evaluation some of the staining and mRNA expression data were omitted. Although the number of observations varies they are representative of the range of Se status.
Number of Serum selenium Whole blood GPx
observations* r P-value r P-value
Amount IFNγ produced 17 0.34 0.1768 0.78 0.0002
IFNγ producing lymphocytes 17 0.32 0.2180 0.06 0.8274
RQ IFNγ In vitro 24 0.15 0.4844 0.09 0.3621
RQ IFNγ In vivo 16 0.43 0.1119 0.33 0.2199
Amount TNFα produced 17 0.35 0.1650 0.43 0.0825
TNFα producing lymphocytes 17 0.45 0.0731 0.29 0.2585
RQ TNFα In vitro 24 0.38 0.0660 -0.06 0.7650
RQ TNFα In vivo 16 0.43 0.0950 0.49 0.0556
RQ IL-10 In vitro 24 0.42 0.0414 -0.01 0.9667
RQ IL-10 In vivo 16 0.29 0.2770 -0.04 0.8881
RQ IL-8 In vivo 16 -0.21 0.4314 0.27 0.3077
RQ IL-2 In vitro 24 0.07 0.7433 0.13 0.5594
Proliferation 24 0.12 0.5727 0.04 0.8401
Number of Neutrophils 24 -0.13 0.5590 -0.06 0.7870
Number of Lymphocytes 24 0.33 0.1101 0.18 0.3909

80
Table 3.2. Correlations (r) between indicators of antioxidant status and immune
variables.
Number of TAC MDA
observations r P-value r P -value
Amount IFNγ produced 17 -0.6428 0.0054 0.0249 0.9243
IFNγ producing lymphocytes 17 -0.3251 0.2030 0.3277 0.1991
RQ IFNγ In vitro 24 -0.4036 0.0505 -0.2381 0.2624
RQ IFNγ In vivo 16 0.1598 0.5693 0.3200 0.2449
Amount TNFα produced 17 -0.4401 0.0770 0.0230 0.9301
TNFα producing lymphocytes 17 -0.4285 0.0862 0.2121 0.4138
RQ TNFα In vitro 24 -0.4480 0.0283 -0.3127 0.1368
RQ TNFα In vivo 16 0.0526 0.8467 0.1515 0.5753
RQ IL-10 In vitro 24 -0.4560 0.0250 -0.0402 0.8521
RQ IL-10 In vivo 16 0.2210 0.4107 -0.0945 0.7275
RQ IL-8 In vivo 16 -0.1814 0.5012 -0.1207 0.6561
RQ IL-2 In vitro 24 -0.0948 0.6596 0.0077 0.9714
Proliferation 24 0.1947 0.3620 -0.2927 0.1651
Number of Neutrophils 24 -0.0408 0.8496 -0.1535 0.4741
Number of Lymphocytes 24 -0.0496 0.8179 0.2975 0.1579
*Upon closer evaluation some of the staining and mRNA expression data were omitted. Although the number of observations varies they are representative of the range of Se status.

81
Figure 3.1. The correlation between the amounts of IFNγ produced by stimulated
lymphocytes and whole blood glutathione peroxidase activity (μmol NADPH
oxidized·mL-1·min-1·g protein) (r = 0.78; P = 0.0002; n=17).
Copyright © Mieke Brummer 2012
0
10
20
30
40
50
60
0 10 20 30 40 50
Whole blood glutathione peroxidase activity
Mea
n flu
ores
cenc
e in
dex

82
CHAPTER 4: Effect of Selenium Deficiency on the Vaccination Response and Immune Function in the Adult Horse
INTRODUCTION
Selenium (Se) is a trace mineral that has been shown to affect the humoral and
cell-mediated components of the immune system in many different species (Roy et al.,
1994; Finch and Turner, 1996; McKenzie et al., 1998). However, limited research has
focused on the effect of Se on the equine immune system. Knight and Tyznik
(1990) found ponies fed a diet containing 0.22 ppm Se had higher serum IgG levels and
antibody titers in response to a sheep red blood cell vaccination than ponies fed a diet
containing 0.02 ppm Se. In contrast, Baalsrud and Overnes (1986) reported no effect of
Se supplementation on antibody titers unless combined with vitamin E, in comparison to
an un-supplemented control group of low Se and vitamin E status. These studies focused
on the effect of Se on humoral immunity, and cell-mediated immune function was not
investigated. Se supplementation has been shown to affect the cell-mediated immune
response in other species (Broome et al., 2004) and Se deficiency has also been reported
to have an impact on cell-mediated immune function in response to an immune challenge
(Beck et al., 2001; Li and Beck, 2007). Therefore, the aim of this study was to evaluate
the effect of long term Se depletion on vaccine response and immune function as
compared to horses fed an adequate Se (NRC, 2007) diet. The first objective was to
evaluate primary and memory vaccine responses, evaluating both humoral and cell-
mediated variables of immune response. The second objective was to assess cell-
mediated immune function to mitogen stimulation in vitro. It was hypothesized that cell-
mediated immune function as measured by mitogen stimulation would be suppressed in

83
horses of low Se status, and consequently low Se horses would have a poor vaccine
response.
MATERIALS AND METHODS
Animals:
This research project was approved by the Institutional Animal Care and Use
Committee of the University of Kentucky.
Twenty eight mature horses, aged 5 to 23 yr, were used in this study. The 28
horses included 8 geldings and 20 mares. The geldings consisted of 6 Thoroughbreds
(TB), 1 American Quarter Horse (AQH) and 1 Standardbred, while the mares consisted
of 19 TB and 1 AQH. All horses were kept at the University of Kentucky equine research
farm, Maine Chance, Lexington, KY, for at least 60 d prior to the start of this study.
Experimental design:
The aim of this experiment was to compare the immune response of Se adequate
and Se deficient horses. Therefore it was necessary to deplete a group of horses of Se. A
diet low in Se (LS) was fed to 21 horses while 7 horses were fed an adequate Se (AS) diet
and served as the control group. This resulted in an unbalanced design, but was necessary
to accommodate a subsequent experiment that was to follow immediately upon
completion of this experiment. One TB mare in LS was removed from the study
following colic. Therefore LS consisted of 20 horses, while AS consisted of 7 horses.

84
Diets and treatments:
Horses were kept on pasture in groups of 4 to 8 for the duration of the study.
Horses were allocated to pastures so that all treatments were equally represented.
Pastures were sampled prior to the start of the study to establish Se content, and on a
monthly basis thereafter while pasture availability was sufficient to sample. Although the
Se content of the pastures fluctuated, it remained marginal (Table 4.1; 0.03 - 0.07 mg
Se/kg DM) at all times. When pasture availability declined, horses were fed hay that was
produced on the same research farm (< 0.06 mg Se/kg DM), and cracked corn (< 0.04 mg
Se/kg DM). Horses had ad libitum access to water and an iodized salt block.
Custom formulated (Table 4.1) adequate Se (2.52 mg Se/kg DM) or low Se (0.48
mg Se/kg DM) supplements (McCauley Bros, Inc., Versailles, KY) were fed to meet the
horses’ nutritional requirements (NRC, 2007) above that provided by pasture, hay and
corn. The composition of the balancer pellets appear in Appendix A Table 4.a. Horses
were weighed on a monthly basis for the duration of the study by means of a portable,
large animal scale (Trancell Technology TI-500BWL, Buffalo Grove, IL) and body
weight (BW) was used to calculate (Appendix A Table 4.b.) the amount of supplement
needed by each horse. The supplement was fed to the horses using individual feeding
pens constructed for this purpose. The amount of supplement fed to each horse resulted in
a total dietary Se intake 0.06 ppm Se on a dry matter basis for LS and 0.12 ppm Se on a
DM basis for AS. The recommended Se intake for a mature horse is 0.0002 mg/kg BW/d
(NRC, 2007). Horses were kept on their respective diets for a period of 28 wk prior to the
vaccine challenge.

85
Blood sampling procedures:
Blood samples were taken prior to the start of the study and every 4 wk thereafter
during the depletion period. All blood samples were obtained via jugular venipuncture.
Blood was collected in 7 mL lithium heparin blood collection tubes (Becton Dickson,
Franklin Lakes, NJ) for analysis of whole blood selenium and whole blood glutathione
peroxidase activity (GPx). Blood was also collected in untreated blood collection tubes
for serum separation (Becton Dickson) and EDTA containing tubes (Becton Dickson) for
CBC analysis.
A vaccine challenge was conducted following the 28th wk of the depletion period.
During the vaccine challenge additional blood samples were taken to isolate PBMC. For
the isolation of PBMC, blood was collected in sodium heparin (Wickliff Veterinary
Pharmacy, Lexington, KY) treated (100 µL per tube) 15 mL vacutainer tubes (Kendall,
Monoject blood collection tubes, Mansfield, MA).
Vaccine challenge:
At the end of the 28 wk depletion period a vaccine challenge was used to evaluate
the effect of the Se status on immune response. Vaccination and sampling time points are
described in Figure 4.1. The selected vaccination and sampling time points, as well as the
methods developed to evaluate the immune response to the novel vaccine, were tested
prior to the initiation of the vaccine challenge in this study.
Keyhole limpet hemocyanin (Sigma, Saint Louis, MO; KLH) vaccines were
prepared under sterile conditions in a laminar flow hood (NuAire Biological safety
cabinets, Plymouth, MN). The KLH was dissolved in sterile physiological saline (Butler;

86
Lexington, KY) at a concentration appropriate to allow the final vaccine volume to be 1
mL (i.e. 10 mg KLH/mL for the first vaccine, 5 mg KLH/mL for the second vaccine).
The vaccine was administered in the pectoral muscle after appropriate cleaning of the
vaccination area with ethanol.
Pre-vaccination blood samples were taken immediately prior to administration of
the first KLH vaccine. The 3 wk post vaccination blood samples were also collected
immediately prior to the administration of the second KLH vaccine (5 mg KLH). At this
time horses were also vaccinated using a combination vaccine containing equine
influenza strain KY 02 (Prestige V; Intervet, Summit, NJ) to evaluate memory immune
response. This vaccine was selected as all horses had received this vaccine as part of the
routine vaccination protocol followed on the research farm prior to the start of the study.
All horses were therefore expected to display a memory response to this KY 02 influenza
strain.
Laboratory procedures:
Peripheral blood mononuclear cell isolation:
The PBMC were isolated at the pre (0 wk), 3 and 5 wk time points using Ficoll-
Paque Plus (Amersham Biosciences, Piscataway, NJ) gradient centrifugation.
Approximately 30 mL of plasma was layered on top of 10 mL Ficoll-Paque Plus in a 50
mL centrifuge tube (Fisher, Florence KY) and centrifuged for 30 min at 500 x g. The
interface cells were collected, washed 3 times with phosphate buffered saline (Sigma),
counted (Vi-cell counter; Beckman Coulter, Miami, FL) and re-suspended at the required
concentrations for each assay in RPMI 1640 (Gibco, Grand Island, NY). The RPMI 1640

87
was supplemented with 2mM L-glutamine (Sigma), 100 U/mL penicillin/streptomycin
(Sigma) and 55 μM 2-mercaptoethanol (Gibco), as described by Adams et al. (2008), and
2.5% heat inactivated autologous serum. Autologous serum was used so that each horse’s
PBMC’s were exposed in vitro to its own serum, mimicking the amount of Se that PBMC
would be exposed to in vivo. The autologous serum was heat inactivated by incubating
the serum sample, collected as for serum separation, from each horse at the same time
when blood was collected for PBMC isolation, and placing it in a 56˙C water bath for 30
min (Lessard et al., 1991). The sample was then centrifuged at 800 x g for 10 min, the
serum aspirated and used to enrich the RPMI 1640 as stated above.
In vitro cell cultures:
Isolated PBMC were plated in 3.5 mL culture wells (TPP, Trasadingen,
Switzerland), at a concentration of 4 x 10⁶ cells per mL. Four culture wells were set up
per horse. The cells were then stimulated in separate culture wells with either media
alone (control), PMA (25ng/mL; Sigma) and ionomycin (1μM; Sigma), KLH (200
μg/mL; Sigma) or equine influenza virus (A/equine/KY/5/02). The PMA/ionomycin was
only added for the last 4 h of the 24 h incubation period. Influenza virus for in vitro cell
culture stimulations was prepared using 10-d-old embryonated chicken eggs as described
by Adams et al. (2011). Influenza stimulation was conducted as follows: 2x10⁷ PBMC’s
were first transferred to a microcentrifuge tube (Fisher). Equine influenza virus was then
added to the cells at a multiplicity of infection (MOI) of 1. The cells and virus were
incubated for 45 min in a 37˙C water bath. The cells were then centrifuged, re-suspended
in autologous serum containing media, and plated in the culture wells at 4 x 10⁶ cells per
mL. Once plated, cell cultures were placed in a 37˙C, 5% CO2 humidified incubator.

88
After 20 h Brefeldin A (2µL/well; Sigma) was added to all cell cultures. At this time 10
µL PMA (Sigma) and ionomycin (Sigma) was also added to the PMA designated wells.
Cells were then incubated for an additional 4 h.
After a total incubation period of 24 h, 2 x 10⁶ PBMC’s from each culture well
were removed for intracellular staining for the cytokines IFNγ and TNFα using a flow
cytometer, while the remaining stimulated PBMC’s were used to evaluate in vitro mRNA
expression of cytokines using RT-PCR as described by Breathnach et al (2006).
Intracellular staining for IFNγ and TNFα:
To assess IFNγ and TNFα production, intracellular staining was performed, as
previously described (Breathnach et al., 2006; Adams et al., 2009). The stained cells were
analyzed using a flow cytometer (FACSCalibur, Becton Dickson, San Jose, CA). Using
Cell Quest software (Becton Dickson, San Jose, CA) the percentage of lymphocytes,
identified and gated based on the forward and side scatter parameters, producing IFNγ or
TNFα was calculated. The mean fluorescence intensity (MFI) was determined as a
measure of the amount of cytokine produced by means of the intensity of the IFNγ or
TNFα signal (Breathnach et al., 2006). Using the computer software, markers were
placed on the antibody labelled un-stimulated cells so that 1% of cells were IFNγ or
TNFα positive. This marker was then set and used as the marker on the stimulated cells.
Cytokine mRNA expression in stimulated PBMC:
The PBMC stimulated as described above were used to assess the relative
quantity of in vitro mRNA expression of IFNγ, TNFα, IL – 1, IL-2, IL-6, IL-8, IL-10, IL-
13, as well as transcription factors GATA-3 and T-bet. Primer probe set sequences for the

89
detection of these equine cytokines have been published elsewhere (Saulez et al., 2010;
Adams et al., 2011; Soboll Hussey et al., 2011).
After in vitro cell culture, 2x10⁶ cells were lysed by the addition of 1mL RNA-
STAT 60 (Tel-Test, Isotex Diagnostics Inc., Friendswood, TX) and stored at -80˙C until
total RNA was extracted according to manufacturer’s protocol. Reverse transcription was
conducted as described by Breathnach et al. (2006).
Cytokine gene expression was measured by means of RT-PCR (7900 HT Fast
Real-Time PCR system, Applied Biosystems, Foster City, CA) using equine specific
intron spanning primer/probe sets (Breathnach et al., 2006; Adams et al., 2009). Beta-
glucuronidase (BGUS) was used as the internal control (Breathnach et al., 2006).
Relative change in gene expression was calculated as 2-ΔΔCT where ΔΔCT = [(average
gene of interest CT − average BGUS CT)horse − (average gene of interest CT − average
BGUS CT)calibrator] as described in Livak and Schmittgen (2001). The average of the un-
stimulated PBMC cultures was used as the calibrator.
Lymphocyte proliferation:
The 3H-Thymidine incorporation method was used to evaluate lymphocyte
proliferation. Isolated PBMC were plated at a concentration of 2x10⁶ cells/mL in 96 well
flat-bottom plates (TPP, Trasadingen, Switzerland). Again 4 cultures were set up in
triplicate for each horse containing either media alone, ConA (10 μg/mL; Sigma) or KLH
(150 μg/mL Sigma). Equine influenza stimulated proliferation was evaluated utilizing
PBMC stimulated with equine influenza as described above. These influenza simulated
cells were then plated at 2x10⁶ cells/mL. After a 72 h incubation period in a 37˙C, 5%

90
CO2 humidified incubator, PBMC were pulsed with 0.5μCi 3H-thymidine and incubated
for an additional 18 h period, and frozen to lyse cells (-20ºC). DNA was extracted from
the cells onto fiber filter pads (Perklin Elmer Inc., Waltham, MA) using a Tomtec
harvester (J/B Industries Inc, IL) and liquid scintillation counting performed (Beta
counter; Wallac Inc., Gaitheisburg, MD). The results are reported as the stimulation index
of corrected counts per minute of stimulated cells, divided by the corrected counts per
minute for the media alone cells.
KLH specific IgG production:
Serum KLH specific antibody levels were measured by means of an ELISA assay.
Briefly, Immunolon I - B microtiter plates (Fisher Scientific, Hanover Park, IL) were
coated overnight at 4˙C with 300 μg KLH per well. Coated plates were then washed with
PBS/0.05% TWEEN®-20 (PBS-T; Sigma) and blocked with PBS containing 0.5%
polyvinyl alcohol (Sigma) for 1 h. The serum samples were diluted 1:300 in PBS-T.
Plates were washed with PBS-T and serum was added to wells in triplicate. Plates were
incubated at 37˙C for 1 h. Plates were washed with PBS-T and secondary antibody
(Peroxidase–conjugated AffiniPure Goat Anti-Horse IgG; Jackson Immuno Research,
West Grove, PA) was added to each well at 1:2500 dilution. Again plates were incubated
at 37˙C for 1 h. After washing plates with PBS-T, substrate (3,3´ 5,5´,-
tetramethylbenzidine; Sureblue TMB 1, KPL, Gaithersburg, MD) was added and color
developed for 30 s before the reaction was stopped (TMB Stop Solution, KPL,
Gaithersburg, MD). Optical density was measured at 450 nm (Bio-Rad, Hercules, CA). A
standard curve developed from the serum of a previously vaccinated animal shown to

91
have a strong response to the vaccine was used to create a standard curve on each plate
for the determination of relative ELISA units.
Equine influenza (A/equine/KY/5/02) antibody production:
Influenza specific antibody production was evaluated by means of a
hemagglutination inhibition (HI) assay as well as an ELISA assay. Influenza virus
(A/equine/KY/5/02) for the HI assay was prepared using 10-d-old embryonated chicken
eggs, but the virus was concentrated from the collected allantoic fluid by polyethylene
glycol precipitation and purified by sucrose gradient centrifugation as described by
Adams et al. (2011).
Equine influenza (A/equine/KY/5/02) antibody (IgGa, IgGb, IgG(T)) levels were
determined using the ELISA method. The 96-well Immunolon I - B microtiter plates
(Fisher Scientific, Hanover Park, IL) were coated overnight at 4ºC with 10
hemagglutination units per well of purified influenza virus. Coated plates were then
washed with PBS/0.05% TWEEN®-20 (PBS-T; Sigma, St. Louis, MO) and blocked with
2% non-fat dried milk powder in PBS-T (Sigma) for 1 h at 37˙C. A standard curve was
constructed using serial dilutions of a serum sample from an influenza virus hyper
immune horse. This allowed for the calculation of relative antigen-specific antibody
concentrations in all experimental serum samples. Serum samples were diluted in PBS-
T, so that OD values fell within the standard curve (IgGa, IgGb and IgG(T) at 1:100).
Plates were incubated for 1 h at 37˙C. Plates were washed with PBS-T and incubated for
1 h at 37˙C with monoclonal antibodies specific for IgGa (CVS 40), IgGb (CVS 39) and
IgG(T) (CVS 48). Following washes with PBS-T, plates were incubated with the

92
secondary antibody, horseradish peroxidase-conjugated goat-anti-mouse IgG antibody
(Jackson Laboratories Inc., West Grove, PA) for 1 h at 37˙C. Again, plates were washed
and substrate (3,3´ 5,5´,-tetramethylbenzidine; Sureblue TMB 1, KPL) was added and
color developed. The reaction was stopped (TMB Stop Solution, KPL) and the optical
density determined at 450 nm using a 96 well plate reader (BioRAD, Hercules, CA).
Relative serum antibody concentrations expressed as ELISA units were calculated by
comparison with the standard curve.
To conduct the HI titer assay each serum sample was trypsin-periodate treated to
remove non-specific inhibitors of virus hemagglutination which are present in serum
samples. This was done by adding 100 µL trypsin to 100 µL serum followed by 30 min
incubation in a 56˙C water bath. Then 300 µL periodate was added and samples
incubated at room temperature for 15 min, followed by the addition of 500 µL 0.6%
glycerol in saline. This yielded a final serum dilution of 1:10. Next 25 µL PBS was added
to all the wells of a round bottom 96 well plate (Thermo Fisher U-bottom micro titer
vinyl plate). Then 50 µL of the treated serum was added to the first well on the plate, and
25 µL was then titrated across the row. Finally 25 µL virus (1:8 dilution) was then added
to all wells. Plates were incubated for 30 min at room temperature. Buttons of non-
agglutination were then read, and the titer allocated to the last non agglutinating dilution
for each sample.
Complete blood count analysis:
Complete blood count analyses were performed by a local commercial equine
hospital (Rood and Riddle Equine Hospital, Lexington, KY).
93
Selenium Status: Whole blood selenium
Whole blood Se concentration was determined by the Diagnostic Center for
Population and Animal Health (Michigan State University; Lansing, MI) by means of
inductively coupled plasma-mass spectroscopy.
Selenium Status: Whole blood glutathione peroxidase activity
Whole blood GPx activity was determined using the Bioxytech GPx-340 assay kit
(OXIS research, Portland, OR), based on the method developed by Paglia and Valentine
(1967). The kit was adapted for use with a microplate reader, as recommended by the
manufacturer. Briefly, whole blood samples were diluted 1:40 in the buffer provided by
the kit and kept on ice. Each sample was then added to a solution containing glutathione,
glutathione reductase, and nicotinamide adenine dinucleotide phosphate (NADPH). Tert-
butyl hydroperoxide was added to initiate the reaction, and the change in absorbance was
measured at 340 nm over a 5 min period using a microplate reader with kinetic test
capabilities (Versamax tuneable microplate reader, Molecular Devices, Sunnyvale, Ca).
The GPx activity of each sample was calculated from the change in absorbance and
expressed as units of enzyme activity per mg hemoglobin (mU/mg Hb).
Statistical analysis
Data were analyzed as a repeated measures design using the Proc Mixed function
of SAS 9.1 (SAS Institute Inc., Cary, NC) with least square means separation procedure.
The model included time, treatment and block as fixed effects, while horse was included
as a random effect. Data were tested for normality, and log transformed when required
94
for statistical analysis. Data were back transformed and are presented in tables and
figures as least squares means.
RESULTS
Selenium and vitamin E status:
At the time of vaccination the whole blood Se concentration and GPx activity of
LS was lower than the Se concentration (P < 0.0001) and GPx activity (P = 0.011) of AS
(Table 4.2). Serum vitamin E concentration did not differ between treatments (P =
0.4538) and ranged from 3.1 to 7.4 µg/mL in individual horses.
Complete blood count data:
During the vaccine challenge horses receiving the LS diet had an overall higher
neutrophil count (effect of treatment; P = 0.010), but there was no effect of time or
treatment x time (P > 0.05). There was no effect of treatment, time or treatment x time
interaction for lymphocyte numbers or lymphocyte to neutrophil ratio (Table 4.3).
KLH vaccination response:
The antibody response to KLH vaccination (Figure 4.2) was not affected by
treatment (P = 0.2082) but there was an effect of time (P < 0.0001) and a treatment x
time interaction (P = 0.0464). Separation of means indicated AS produced more KLH
antibodies at the 3 wk post vaccination time point compared to LS (P < 0.05). However,
KLH antibody production at subsequent time points was similar between treatments.
Lymphocyte proliferation in response to KLH stimulation was unaffected (P > 0.05) by

95
Se status (Table 4.4). The mRNA expression of selected cytokines for PBMC stimulated
in vitro with KLH is presented in Table 4.5. The mRNA expression of the transcription
factor T-bet was affected by treatment (P = 0.025) and time (P = 0.046). Overall T-bet
expression was higher for AS than LS. In addition a trend existed for higher IL-1
(treatment, P = 0.070) in AS compared to LS. The mRNA expression of the remaining
cytokines were unaffected by Se status. Similarly intracellular IFNγ and TNFα
production by KLH stimulated lymphocytes were unaffected by Se status (Appendix A
Table 4 c and d).
Equine influenza vaccination response:
Overall Se status did not have an effect on IgGa, IgGb, IgGT or influenza titers
(Table 4.6). Lymphocyte proliferation (Table 4.6) in response to influenza stimulation
was also similar between AS and LS. Lymphocyte intracellular IFNγ and TNFα
production in response to in vitro influenza stimulation was unaffected by Se status
(Appendix A Table 4 c and d). The mRNA expression of cytokines stimulated with
influenza in vitro was also not affected by Se status (Appendix A Table 4 e).
Mitogen stimulation:
Stimulation of lymphocytes with ConA indicated that the ability of the cells to
proliferate was comparable between AS and LS (Table 4.7). Similarly PBMC
intracellular IFNγ and TNFα production and cytokine mRNA expression in response to
PMA stimulation were not affected by Se status (Appendix A Table 4 c and d).

96
DISCUSSION
The onset of the vaccine challenge followed a 28 wk feeding period. At that time
Se status was lower for LS compared to AS, as indicated by whole blood Se and GPx
activity. Mean whole blood Se concentration of LS fell below the adequate reference
range for mature horses (180 to 240 ng/mL) as reported by Stowe (1998). The GPx
activity for LS was also at the lower end of the adequate GPx activity range (40 to 160
EU/g hb) (Stowe, 1998). The selenoenzyme GPx was one of the first selenoproteins
identified, and has subsequently been used as an indicator of Se status (Brown and
Arthur, 2001). The current Se requirements (NRC, 2007) of the horse is based on
research studies that used GPx as an indicator of Se status (Stowe, 1967; Shellow et al.,
1985). Therefore, at the time of vaccination horses in LS were considered to be of low Se
status, while horses in AS were in adequate Se status. Vitamin E and Se have a
synergistic relationship and vitamin E status has been shown to affect immune function
across different species (Finch and Turner, 1996), including the horse (Baalsrud and
Overnes, 1986; Petersson et al., 2010). Vitamin E status was assessed at the initiation of
the vaccine challenge, and found to be adequate (> 2 µg/mL; NRC (2007)) and similar
across treatments. Because micronutrient status may be important when evaluating
lymphocyte function in vitro (Lee and Wan, 2002) the supplements fed to the horses were
formulated to meet their micronutrient requirements (with the exception of Se in the
supplement used for the LS group). Therefore any differences in immune function
observed between treatments can be attributed to the differences in Se status between
groups.
Calamari et al. (2009a) reported no effect of Se supplementation on neutrophil
numbers in horses, although a trend for a linear increase in lymphocyte numbers with an

97
increase in Se supplementation was observed. In this study, the number of lymphocytes
and lymphocyte to neutrophil ratio did not differ between AS and LS. However, LS did
have a higher number of neutrophils. The reason for the differences between the two
studies is not clear, although the experimental designs are different in that a longer
feeding period was accommodated in the current study compared to Calamari et al.
(2010) (196 d vs 112 d) and these researchers also incorporated a light exercise regime in
their study.
A novel antigen (KLH) was used to assess the primary immune response,
evaluating both humoral and cell-mediated components. The antigen KLH has previously
been used to assess vaccination response in horses (Edmonds et al., 2001; Sturgill and
Horohov, 2010). Prior to participation in this study all horses were vaccinated with a
combination vaccine that contained the KY02 equine influenza strain. Therefore memory
response was evaluated using this same vaccine.
The KLH-specific IgG levels increased over time in both groups. However, AS
responded quicker to the first vaccine and had higher antibody levels at 3 wk than LS.
The response to the first vaccination can be regarded as the true primary response,
indicating a quicker humoral response for the adequate horses. Antibody production was
comparable between LS and AS after the second vaccination. Similarly, Knight and
Tyznik (1990) reported ponies fed a diet containing 0.22 ppm Se had higher serum IgG
levels and antibody titers in response to a sheep red blood cell vaccination compared to
ponies fed a diet low in Se (0.02 ppm Se). However, in contrast to our results, the ponies
on the higher Se diet maintained higher antibody levels in response to a second
vaccination at 2 wk (Knight and Tyznik, 1990). Baalsrud and Overnes (1986) evaluated

98
antibody production in horses supplemented with vitamin E (80 ppm α-tocopheryl
acetate), Se (0.5 ppm as sodium selenite) or a combination of the two. Horses on an un-
supplemented Se (0.03 ppm) and vitamin E (18 mg α-tocopheryl acetate/kg) diet served
as the control group. Horses were kept on this diet for 12 wk prior to the vaccine
challenge. The reported serum Se values suggested that the control group was of low Se
status. Following vaccination, at the start and wk 6 of the vaccination period, antibody
titres against Clostridium tetani and equine influenza strains were evaluated. It was
reported that horses had not been vaccinated against these antigens before. In contrast to
our study no difference was detected between the Se only and control group (Baalsrud
and Overnes, 1986), although the vitamin E alone and vitamin E and Se combination
treatments did respond better than the control group.
In addition Baalsrud and Overnes (1986) evaluated antibody titres against E. coli
O-antigens. The horses were exposed to E. coli at a prior occasion so their response to
this exposure may be viewed as a memory type of response. It was reported that antibody
titres against E. coli were comparable between treatments (Baalsrud and Overnes, 1986).
Influenza-specific antibody production and influenza HA titres were unaffected by Se
status in our study. These results suggest that Se status may not affect the anamnestic
humoral immune response.
Lessard et al. (1991) reported that the effect of Se status on lymphocyte
proliferation was dependent on the use of autologous serum in culturing media. In this
study antigen specific lymphocyte proliferation in response to KLH and influenza
stimulation in vitro was not affected by Se status even though autologous serum was
used. This is in contrast to research conducted by Broome et al. (2004) in humans that

99
reported peak lymphocyte proliferation in response to polio virus stimulation to occur
earlier (d 7) in Se supplemented groups compared to the placebo treatment group (d 14).
It should be noted that in our study proliferation in response to KLH did increase over
time, indicating that the KLH vaccination itself did have an effect on the ability of cells
to proliferate in response to in vitro stimulation with KLH.
T-bet is a transcription factor associated with the activation of the Th1 response,
associated with intracellular pathogen defense, while GATA-3 is associated with a Th2
response related to extracellular pathogen defense (Chinen et al., 2006). In addition, the
specific cytokines produced by either Th1 or Th2 subset also play a role in inhibiting the
other subset (Yates et al., 2004). Higher expression of the transcription factor T-bet was
found for the KLH stimulated PBMC from the AS horses which may suggest a Th1
biased response in the AS horses. However, we did not observe a corresponding increase
in expression of IFNγ in PBMC from the AS horses. Beck et al. (2001) evaluated the
immune response in mice, fed a low or an adequate Se diet, upon exposure to influenza
virus strain A/Bangkok/1/79; H3N2. Based on the cytokine responses measured these
researchers concluded that the immune response observed in the lungs of Se-deficient
mice were skewed towards a Th2 response, the opposite of what would be expected after
a viral challenge (Beck et al., 2001). Intracellular production of IFNγ and TNFα,
following stimulation with KLH and influenza in vitro was also not affected by Se status.
Broome et al. (2004) reported higher IFNγ production (pg/mL) by polio virus stimulated
whole blood on d 7 in Se supplemented human subjects compared to the placebo group.
These researchers also noted that the overall pattern of Th1 and Th2 cytokine release was
not affected by Se status.

100
The relative mRNA cytokine expression measured in KLH and influenza
stimulated PBMC indicated no difference between LS and AS for any of the cytokines
measured, with the exception of a trend for IL-1 (KLH stimulated PBMC) to be higher in
horses of adequate Se status. This cytokine is regarded as a pro-inflammatory cytokine
that targets macrophages, and has a synergistic relationship with TNFα (Dinarello, 2000).
In addition IL-1 is reported to be involved in the activation and stimulation of other
cytokines (Tato and Cua, 2008a). However, in our study all other cytokines were present
at similar mRNA levels, including TNFα in both groups.
In addition to vaccine response, we also investigated immune function in response
to stimulation with the mitogens, ConA and PMA. Our results indicated
lymphoproliferative response to ConA was not affected by Se status. Lack of effect of Se
status on lymphocyte proliferation has been reported by other researchers (Aziz and
Klesius, 1985; Wuryastuti et al., 1993). In contrast, Cao et al. (1992) reported Se
deficient bovine cells were not able to proliferate to the same extent as Se adequate cells.
However, the blood Se and GPx activity reported for the cattle suggests that the Se
deficient cattle were of lower Se status and the Se adequate cattle of higher Se status than
the horses in this study. Research has also indicated that the in vitro addition of Se to cell
cultures obtained from deficient animals improved lymphocyte response (Finch and
Turner, 1996) while the addition of H2O2 in vitro has been shown to suppress lymphocyte
proliferation in a dose dependent manner, implicating the importance of adequate Se
status in the neutralization of H2O2 for optimal lymphocyte proliferation (Lee and Wan,
2002). In our study a difference existed in GPx activity between AS and LS. Therefore, if
low GPx activity resulted in higher, proliferation inhibiting levels of H2O2, we would

101
have noted a difference in the lymphoproliferative responses of LS and AS.
Supplementation of human subjects with vitamin E have been reported to increase
lymphocyte proliferation (Meydani et al., 1990). Adequate vitamin E status of the horses
on this trial may therefore have contributed to the lack of difference in proliferation
observed between LS and AS.
Intracellular IFNγ and TNFα production as well as mRNA expression of
cytokines and transcription factors in PBMC stimulated with PMA were similar across all
treatments, indicating of a lack of effect of Se status on the ability of the cells to express
these cytokines. It has been proposed that the ability of Se to affect immune response lies
in its antioxidant properties. Adequate Se status is thought to control reactive oxygen
species levels, leading to lower levels of oxidative stress, which in turn prevents the over-
activation of NF-κβ (Beck et al., 2001). Activation of NF-κβ stimulates the production of
pro-inflammatory proteins associated with immune response such as IL-6 and TNFα
(Duntas, 2009). Vitamin E forms a part of the antioxidant mechanism of the body,
preventing oxidative stress (Surai, 2006), therefore adequate vitamin E status may also
have contributed to the lack of Se status on cell-mediated immune response to non-
specific stimulation.
CONCLUSION
Overall Se status did affect the humoral and cell-mediated immune response
observed to vaccination with a novel antigen. The AS horses responded faster to the
initial vaccine by producing greater amounts of KLH-specific antibodies in response to
the first vaccine, and more effectively priming a cellular immune response, as evidenced
by the overall increased expression of T-bet in the AS horses. Although vaccination

102
response was diminished in LS, cell-mediated immune function as measured by non-
specific stimulation in vitro was unaffected by Se status. This study outcome suggests
that low Se status could affect immune response to primary vaccination in horses kept in
Se deficient areas of the U.S.

103
Table 4.1. Nutrient composition (DM basis)1 of pasture, hay and the supplements fed to
mature horses during the experimental period.
Item
Pasture Grass Hay Alfalfa Hay
Adequate Se supplement2
Low Se supplement2
DM % 92.17 89.70 89.7 89.2 90.1
DE Mcal/kg 2.11 2.10 2.22 3.35 3.38
CP % 13.27 16.30 16.2 36.5 34.8
ADF % 41.83 36.10 34.2 9.2 8.5
NDF % 59.90 59.70 50.6 15.4 14.9
Starch % 0.47 1.50 1.9 5.1 7.8
Calcium % 1.06 1.10 1.06 4.07 4.16
Phosphorus % 0.36 0.47 0.4 2.16 2.07
Magnesium % 0.22 0.29 0.24 0.45 0.47
Potassium % 1.59 1.77 2.15 2.05 1.98
Sodium % 0.01 0.02 0.03 0.85 0.88
Iron ppm 728.33 570.00 376 806 802
Zinc ppm 34.67 33.00 32 448 427
Copper ppm 8.00 9.00 7 160 154
Selenium ppm 0.07 0.07 0.06 2.52 0.48 1 Equi-analytical laboratories; Ithaca, NY 2 McCauley Bros, Inc., Versailles, KY

104
Table 4.2. Indicators of Se and vitamin E status evaluated at the start of the vaccine
challenge (week 28).
Variable AS1 LS1 P-value
Whole blood Se (ng/mL) 211.14a 164.70b <0.0001 Whole blood GPx (mU/mg hb) 55.00a 42.72b 0.0011 Serum vitamin E (µg/mL) 4.70a 5.11a 0.4538 a,b Means within row lacking a common superscript differ, P < 0.05

105
Table 4.3. Complete blood count1 analysis of horses on different dietary Se treatments at
0, 3 and 5 wk of the vaccine challenge period2.
Week
Main effect (P-value) Item 0 3 5 SEM Treatment Time Treatment x time Lymphocyte (x 103)
AS 2.48 2.53 2.53 0.38 0.192 0.836 0.904 LS 2.83 3.08 2.88 0.23
Neutrophil (x 103) AS 4.46 4.24 4.26 0.33 0.010 0.676 0.608
LS 5.22 5.20 5.67 0.20 Ratio (N/L)
AS 2.00 1.76 1.82 0.41 0.391 0.694 0.733 LS 2.06 1.90 2.37 0.24
1Complete blood count analysis conducted by Rood and Riddle Equine Hospital (Lexington, KY) 2Vaccinations administered at wk 0 and wk 3

106
Table 4.4. Lymphocyte proliferation for horses on different dietary treatments1 in
response to in vitro stimulation with keyhole limpet hemocyanin2 (presented as
stimulation index3; LS means).
Week
Main effect (P-value) Item 0 3 5 SEM Treatment Time Treatment x time AS1 1.41 1.77 3.60 0.49 0.182 0.001 0.131 LS1 1.31 1.70 2.18 0.29
1Dietary treatments (total dietary Se): LS = low Se (0.06 ppm DM); AS = Adequate Se (0.12 ppm DM) 2Vaccinations administered at wk 0 and wk 3 3Stimulation index: Lymphocyte proliferation in response to in vitro stimulation keyhole limpet hemocyanin

107
Table 4.5. The mRNA expression as relative quantity of selected cytokines in peripheral
blood mononuclear cells stimulated with keyhole limpet hemocyanin in vitro in mature
horses fed a selenium adequate (AS) or a low selenium (LS) diet1.
Week
Main effect (P-value) Item2 0 3 5 SEM Treatment Time Treatment x time T-bet
AS3 (n=4) 1.91 1.27 2.78 0.39 0.025 0.046 0.268 LS3 (n=8) 0.11 1.38 0.58 0.34
GATA 3 AS (n=4) 1.54 2.60 1.04 0.56 0.498 <0.0001 0.476
LS (n=10) 1.22 2.76 0.64 0.32 IL-1
AS (n=4) 25.34 9.48 6.13 4.16 0.070 0.016 0.123 LS (n=10) 5.07 11.11 2.25 2.49
IL-6 AS (n=4) 7.93 3.69 3.52 2.98 0.406 0.344 0.126
LS (n=10) 1.24 5.19 1.63 1.75 IL-8
AS (n=4) 1.14 0.72 0.72 0.27 0.728 0.001 0.372 LS (n=10) 1.37 0.92 0.58 0.15
IL-10 AS (n=4) 11.14 8.49 6.42 3.22 0.242 0.046 0.342
LS (n=10) 3.63 8.27 3.03 1.93 IL-13
AS (n=4) 2.17 1.50 1.97 1.38 0.740 0.331 0.240 LS (n=9) 0.65 1.27 1.41 0.87
1 Vaccinations administered at wk 0 and wk 3 2Upon analysis datasets from some horses were omitted as indicated in the table 3Dietary treatments (total dietary Se): LS = low Se (0.06 ppm DM); AS = Adequate Se (0.12 ppm DM)

108
Table 4.6. The humoral immune response and lymphocyte proliferation in horses fed
different dietary treatments following vaccination with equine influenza.
Week2
Main effect (P-value) Item 0 5 7 SEM Treatment Time Treatment x time
IgGa1 AS3 105 336 167 117 0.389 <0.0001 0.261
LS3 174 392 296 69 IgGb1
AS 3763 4460 3873 3515 0.464 0.697 0.775 LS 3972 8629 7634 2084
IgGT1 AS 4397 4711 4794 1774 0.200 0.016 0.858
LS 6564 7675 7500 1053 Flu titer4
AS 156 208 208 36 0.222 0.016 0.943 LS 87 148 143 22
SI5 AS 4.62 4.31 * 3.9 0.794 0.395 0.479 LS 6.84 3.46 * 2.4
1IgGa, IgGb and IgGT measured as ELISA units relative to a standard curve produced from a high responding horse 20 = pre vaccination, 5 = 2 wk post vaccination, 7 = 4 wk post vaccination for equine influenza 3Dietary treatments (total dietary Se): LS = low Se (0.06 ppm DM); AS = Adequate Se (0.12 ppm DM) 4Hemagglutination inhibition assay using equine influenza A/equine/KY/5/02 5SI = stimulation index: Lymphocyte proliferation in response to stimulation with equine influenza strain A/equine/KY/5/02

109
Table 4.7. Lymphocyte proliferation for horses on different dietary treatments in
response to stimulation with concanavalin A (ConA) (presented as stimulation index2 LS
means).
Week
Main effect (P-value) Item 0 3 5 SEM Treatment Time Treatment x time AS 16.44 8.81 6.25 5.05 0.994 0.099 0.397 LS 12.24 12.01 7.36 3.02
1Dietary treatments (total dietary Se): LS = low Se (0.06 ppm DM); AS = Adequate Se (0.12 ppm DM) 2SI = stimulation index: Lymphocyte proliferation in response to in vitro stimulation with ConA

110
Figure 4.1. Sampling and vaccination time points for KLH vaccination. White arrows
denote blood collection for determination of Se status, antibody production and
peripheral blood mononuclear cell isolation. Black arrows denote blood collection for
antibody production determination only. 1Keyhole limpet hemocyanin (KLH), Sigma Saint Louis, MO. 2Prestige V, Intervet, Summit, NJ

111
Figure 4.2. Anti-KLH-IgG response1 to KLH vaccination2 in mature horses3. 1Treatment P = 0.2082; time P = <0.0001; treatment x time P = 0.0464 2Vaccinations administered at wk 0 and wk 3 of the vaccine challenge period 3Dietary treatments (total dietary Se): LS = low Se (0.06 ppm DM); AS = Adequate Se (0.12 ppm DM) * Treatment differences within time point (P < 0.05)
Copyright © Mieke Brummer 2012

112
CHAPTER 5: The Effect of Selenium Supplementation on Vaccination Response and Immune Function in Adult Horses
INTRODUCTION
Selenium has been shown to affect immune function, although the exact
mechanism through which Se and the immune system interact remains unknown. In
studies with mice, Se status has been shown to affect the mRNA expression of some
immune modulating cytokines (Li and Beck, 2007) and cytokine receptor, e.g.
interleukin-2 receptor (Roy et al., 1994). Alteration in lymphocyte proliferation has also
been linked to Se status (Roy et al., 1994). However, studies investigating the effect of Se
supplementation on the equine immune system are limited (Knight and Tyznik, 1990;
Janicki, 2001; Thorson et al., 2010; Montgomery et al., 2012) and the relationship of Se
status to immune related cytokines in the adult horse has not been investigated. Therefore
the aim of this study was to evaluate the effect of Se status and source of supplementation
on the vaccination response and immune function of the horse. The first objective was to
determine if Se status affected the primary response to vaccination with a novel antigen
(ovalbumin) and memory response to an equine influenza vaccine. Measures of vaccine
response included both humoral and cell-mediated components of the immune system:
antigen-specific antibody production, lymphocyte proliferation, intracellular cytokine
production and cytokine mRNA expression in response to antigen stimulation in vitro.
The second objective was to determine if cell-mediated immune function was affected by
Se status using in vitro cell cultures stimulated with non-specific mitogens. Immune
function was assessed using lymphocyte proliferation, intracellular cytokine production
and cytokine mRNA expression by PBMC. Un-stimulated whole blood mRNA cytokine

113
expression was used to assess in vivo cytokine expression. We hypothesized that horses
of low Se status would have diminished immune function, contributing to a poor vaccine
response.
MATERIALS AND METHODS
Animals:
This research project was approved by the Institutional Animal Care and Use
Committee of the University of Kentucky.
Twenty eight mature horses, aged 5 to 23 yr, were used in this study and included
8 geldings and 20 mares. The geldings consisted of 6 Thoroughbreds, 1 American
Quarter Horse and 1 Standardbred, while the mares consisted of 19 Thoroughbreds and 1
American Quarter Horse.
Experimental design, diets and treatments:
In preparation for this study the 28 horses were blocked by age and gender and
randomly allocated within block to one of 4 dietary Se treatments: a low Se group (LS),
adequate Se group (AS) an organic Se group (Sel-Plex®, Alltech Inc., Nicholasville, KY;
SP) and an inorganic Se group (sodium selenite; SS). For 35 wk prior to the onset of this
experiment horses assigned to the LS, SP and SS treatments were kept on a low Se diet
(0.06 ppm) to allow for the depletion of their Se stores while AS was provided with an
adequate Se diet (0.12 ppm). The results of the depletion phase were reported previously
114
(Chapter 4). The depletion phase was immediately followed by the repletion
(supplementation) phase.
Throughout the repletion phase the horses were kept out on pasture, but were
allocated to pasture so that all treatments were represented in each pasture. Pastures were
sampled on a monthly basis until pasture availability was too low to sample. The Se
content of the pastures fluctuated but remained marginal in Se (0.03 - 0.07 ppm DM;
Table 5.1). When pasture availability declined in winter, horses were fed hay that was
produced on the same farm (0.06 ppm DM), and cracked corn (< 0.16 ppm DM) to
maintain an adequate calorie intake. Horses had ad libitum access to water and an iodized
salt block. Horses were weighed on a monthly basis by means of a portable, large animal
scale (Trancell Technology TI-500BWL; Buffalo Grove, IL) and BW was used to
calculate supplementation rates. The Se intake as well as other nutrient intakes from
pasture was calculated based on estimated pasture intake of 2.25% of BW (Table 5.2).
Custom formulated adequate Se (2.52 ppm DM) or low Se (0.53 ppm DM) protein–
vitamin-mineral balancer pellets (McCauley’s; Versailles, KY) were fed to meet each
horse’s trace mineral requirements above that provided by pasture. The composition of
the balancer pellets appear in Appendix A Table 4.a. The balancer pellet was fed on an
individual basis, using feeding pens constructed for this purpose.
The 29 wk repletion phase followed the depletion phase. Horses originally
assigned to AS and LS remained on their respective diets, while SP and SS were provided
with their assigned supplements. The respective Se supplements were top-dressed on the
balancer pellet. To account for the yeast component in the Se-yeast supplement, the same
strain of brewer’s yeast was used as carrier for the sodium selenite supplement. Horses on

115
the AS and LS treatments received the brewer’s yeast carrier only. This allowed for a
similar brewer’s yeast intake between the four treatment groups. A small amount of water
was added to the balancer pellet and top-dressed supplement prior to feeding to improve
the palatability and texture. The horses were closely monitored to ensure that the allotted
supplement and balancer pellet was completely consumed.
Total dietary Se intake for the LS group was calculated to be 60% of the NRC
(2007) recommended amount of 1 mg Se per day for a 500 kg horse (or 0.1 mg Se/kg
DM), while the AS group received a total of 120% of the recommended amount of Se.
Horses on the SP and SS treatments were calculated to receive a total dietary Se intake of
340% (0.3 mg Se/kg DM) of the recommended Se intake. To achieve this 2.74 mg
supplemental Se (SP or SS respectively) was added to the low Se balancer pellet as
indicated in Table 5.2. Total dietary Se intake was calculated to be equal among horses
within treatment on a per kg BW basis. The horses were kept on their respective diets for
a period of 22 wk prior to the onset of the vaccine challenge. This period was chosen to
ensure that the turnover of circulating red blood cells would be sufficient to identify
change in Se status through measurements of whole blood Se and GPx activity. Horses
remained on the same diets throughout the 7 wk vaccine challenge. Prior to the vaccine
challenge two Thoroughbred mares and one gelding had to be removed from the study
due to unrelated medical reasons. Therefore the AS, LS and SS groups consisted of 6
horses each, while the SP group consisted of 7 horses.

116
Blood sampling:
Blood samples were taken prior to the start of the repletion phase and every 4 wk
thereafter, to monitor Se status and during the vaccine challenge as indicated in Figure
5.1. All blood samples were obtained via jugular venipuncture. Blood was collected in 7
mL lithium heparin blood collection tubes (Becton Dickson, Franklin Lakes, NJ) for
analysis of whole blood Se and GPx activity. Blood was also collected in untreated blood
collection tubes for serum separation (Becton Dickson) and EDTA containing tubes
(Becton Dickson) for CBC analysis. During the vaccine challenge, additional blood
samples were taken to isolate peripheral blood mononuclear cells (PBMC). For the
isolation of PBMC, blood was collected in 15 mL, sodium heparin (Wickliff Veterinary
Pharmacy, Lexington, KY) treated (100 µL per tube), vacutainer tubes (Kendall,
Monoject blood collection tubes, Mansfield, MA).
Vaccine challenge:
Upon completion of the 22 wk repletion period a novel vaccine challenge was
used to assess immune response. The vaccine challenge was completed over 7 wk.
Vaccination and sampling time points for the vaccine challenge are described in Figure
5.1. The ovalbumin (Sigma, Saint Louis, MO; OVA) vaccines were prepared under
sterile conditions in a laminar flow hood (NuAire Biological safety cabinets, Plymouth,
MN). The OVA was dissolved in sterile physiological saline (Butler; Lexington, KY) at a
concentration appropriate to allow the final vaccine volume to be 1 mL (i.e. 10 mg
OVA/mL). The vaccine was administered i.m. in the pectoral muscle following thorough
cleaning of the area with ethanol.
117
Pre-vaccination blood samples were taken immediately prior to the first
vaccination. Horses were then injected with 10 mg OVA (Sigma) followed by a second
10 mg OVA injection 3 wk later (wk 25). Horses were also vaccinated against equine
influenza strain KY 02 (Prestige V; Intervet, Summit, NJ) at the time of the second OVA
vaccine i.e. 3 wk post the initial OVA vaccine (wk 25), to evaluate memory immune
response. This vaccine was selected as all horses had been vaccinated with this vaccine 8
mo prior. All horses were therefore expected to display a memory response to the KY 02
influenza strain. The influenza vaccine was administered intramuscular in the neck, again
following thorough cleaning of the vaccination area with ethanol.
Laboratory procedures:
Selenium Status: Whole blood selenium
Whole blood Se concentration was determined by the Diagnostic Center for
Population and Animal Health (Michigan State University; Lansing, MI) by means of
inductively coupled plasma-mass spectroscopy.
Selenium Status: Whole blood glutathione peroxidase (GPx) activity
Whole blood GPx activity was determined using the Bioxytech GPx-340 assay kit
(OXIS research, Portland, OR) (Richardson et al., 2006), based on the method developed
by Paglia and Valentine (1967). The GPx activity of each sample was calculated from the
change in absorbance and expressed as units of enzyme activity per mg hemoglobin
(mU/mg Hb).

118
Complete blood count analysis (CBC):
The CBC analyses were performed by a local commercial equine hospital (Rood
and Riddle Equine Hospital, Lexington, KY). The number of lymphocytes and
neutrophils were then calculated from this analysis.
Peripheral blood mononuclear cells (PBMC):
The PBMC were isolated using Ficoll-Paque Plus (Amersham Biosciences,
Piscataway, NJ) gradient centrifugation. Approximately 30 mL of plasma was layered on
top of 10 mL Ficoll-Paque Plus and centrifuged for 30 min at 500 x g. Interface cells
were collected, washed 3 times with phosphate buffered saline (Sigma), counted (Vi-cell
counter; Beckman Coulter, Miami FL) and re-suspended at the required concentrations
for each assay in RPMI 1640 (Gibco, Grand Island, NY). The RPMI 1640 (Gibco) was
supplemented with 2mM L-glutamine (Sigma), 100 U/mL penicillin/streptomycin
(Sigma), 55 μM 2-mercaptoethanol (Gibco) and 2.5% heat inactivated autologous serum.
Autologous serum was used so that the PBMC from each horse were incubated in media
containing its own serum, especially as serum Se would vary between horses on different
dietary treatments. Autologous serum was heat inactivated as described by Lessard et al.
(1991).
In vitro cell cultures:
The PBMC were plated in 3.5 mL culture wells (TPP, Trasadingen, Switzerland)
at a final concentration of 4 x 10⁶ cells per mL. Four culture wells were prepared per
horse for in vitro stimulation of cells: media alone (control); phorbol 12-myristate 13-
acetate (PMA; 25 ng/mL) and ionomycin (1μM), added for the last 4 h of incubation;

119
OVA (5 μg/mL) and equine influenza virus. Prior to plating, PBMC’s intended to be
stimulated with equine influenza virus (KY/5/02) were transferred to microcentrifuge
tubes and incubated in a 37˙C water bath for 45 min with KY/5/02 virus at a multiplicity
of infection (MOI) of 1. Following incubation the influenza stimulated PBMC were
centrifuged (300 x g for 5 min) and the PBMC pellet suspended in the supplemented
media. After adding PBMC to the cell culture wells the plates were placed in a 37˙C, 5%
CO2 humidified incubator for 20 h. After 20 h Brefeldin A (2 μL/well) was added to all
cell cultures. At this time the PMA and ionomycin (10 μL/well) was added to the PMA
wells and all PBMC incubated for an additional 4 h. After a total incubation period of 24
h, 2 x 10⁶ PBMC’s from each culture were used for intracellular staining for interferon-γ
(IFNγ) and tumor necrosis factor-α (TNFα) using a flow cytometer, while in vitro mRNA
expression of cytokines was measured on the remaining stimulated PBMC’s using RT-
PCR as described by Breathnach et al (2006).
Intracellular staining for IFNγ and TNFα:
Intracellular staining was performed to assess IFNγ and TNFα production, as
previously described (Breathnach et al., 2006; Adams et al., 2009). The stained cells were
analysed using a flow cytometer (FACSCalibur, Becton Dickson, San Jose, CA). Using
Cell Quest software (Becton Dickson, San Jose, CA) markers were placed on the
unstimulated (media alone) cells so that 1%of the cells were IFNγ or TNFα positive.
These markers were then used to analyze the stimulated cells. The percentage of
lymphocytes, identified and gated based on the forward and side scatter parameters,
producing IFNγ or TNFα was calculated. The mean fluorescence intensity (MFI) was

120
determined as a measure of the amount of cytokine produced as indicated by the intensity
of the IFNγ or TNFα signal (Breathnach et al., 2006).
Cytokine mRNA expression in stimulated PBMC
The PBMC stimulated as described above were used to assess the in vitro gene
expression of IFNγ, TNFα, Granzyme B (GrzB), IL (interleukin) -1, IL-2, IL-6, IL-8, IL-
10, IL-13, GATA-3 and T-bet. After stimulation, 2 x 10⁶ cells were lysed by the addition
of 1 mL RNA-STAT 60 (Tel-Test, Isotex Diagnostics Inc., Friendswood, TX) and stored
at -80˚C until total RNA was extracted following the manufacturer’s protocol. Relative
quantity of cytokine gene expression was determined by means of RT-PCR (Applied
Biosystems, Foster City, CA) using equine specific intron spanning primer/probe sets
(Applied Biosystems, Foster City, CA) as previously described (Breathnach et al., 2006;
Adams et al., 2009). Relative change in gene expression was calculated as described in
Livak and Schmittgen (2001), and results were expressed as relative quantity (RQ)
calculated as 2-ΔΔCT with the un-stimulated PBMC cultures of each treatment group
serving as calibrators for stimulated samples within the treatment as no statistical
differences were detected between the un-stimulated samples. Beta-glucuronidase was
used as the internal control (Breathnach et al., 2006).
In vivo cytokine expression: Paxgene analysis
In vivo mRNA expression of IFNγ, TNFα, IL-6, IL-8 and IL-10 in unstimulated
whole blood was assessed by collecting 2.5 mL blood via jugular venipuncture into
PAXgene blood RNA tubes (PreAnalytiX, Valencia, CA). Total RNA was extracted
using the PAXgene RNA extraction kit (Qiagen, Valencia, CA), according to the

121
manufacturer’s protocol. Reverse transcription was conducted as described by
Breathnach et al. (2006). RT-PCR was performed and relative quantity of mRNA
calculated as described above for the stimulated PBMC. Samples taken prior to the onset
of the dietary supplementation period were analysed and the mean for each cytokine
calculated and used as the calibrator.
Lymphocyte proliferation:
The 3H-Thymidine incorporation method was used to evaluate lymphocyte
proliferation. Isolated PBMC were plated at a concentration of 2 x 10⁶ cells per mL in 96
well flat-bottom plates (TPP, Trasadingen, Switzerland). Again 4 cultures were set up in
triplicate for each horse: media alone (control), concanavalin A (ConA; 10 μg/mL) as
mitogen to stimulate proliferation (Lis and Sharon, 1998), OVA (25 μg/mL), and equine
influenza. To evaluate proliferation in response to influenza virus, PBMC stimulated with
the purified equine influenza virus KY/5/02 as described above were added to wells
containing media alone. After a 72 h incubation period in a 37ºC, 5% CO2 humidified
incubator, PBMC were pulsed with 0.5μCi 3H-thymidine, incubated for an additional 18
h period, and frozen (-20ºC). DNA was extracted from the cells onto fiber filter pads
(Perklin Elmer Inc., Waltham, MA) using a Tomtec harvester (J/B Industries Inc, IL) and
liquid scintillation counting performed (Wallac Inc., Gaitheisburg, MD). The results are
reported as the stimulation index of corrected counts per minute of stimulated cells,
divided by the corrected counts per minute for control cells.

122
Antibody production: OVA specific ELISA
Serum OVA specific antibody levels were measured by means of an ELISA
assay. Briefly, Immunolon I-B microtiter plates (Fisher Scientific, Hanover Park, IL)
were coated overnight at 4˙C with 300 μg OVA per mL. The following day plates were
washed with PBS/0.05% TWEEN®-20 (PBS-T; Sigma, St. Louis, MO) and blocked with
PBS containing 0.5 % polyvinyl alcohol (Sigma). Serum samples were diluted 1:300 in
PBS-T and added to wells in triplicate. Plates were incubated at 37˙C for 1 h. After
washing plates with PBS-T the secondary antibody, Peroxidase – conjugated AffiniPure
Goat Anti-Horse IgG (Jackson Immuno Research, West Grove, PA), was added to each
well at a dilution of 1:2500. Following incubation at 37˙C for 1 h plates were washed
again using PBS-T, and substrate (3,3´ 5,5´,-tetramethylbenzidine; Sureblue TMB 1,
KPL, Gaithersburg, MD) was added. Color was developed for 30 s before the reaction
was stopped (TMB Stop Solution, KPL, Gaithersburg, MD). Optical density was
measured at 450 nm (Bio-Rad Laboratories, Hercules, CA). A standard curve developed
from the serum of a previously vaccinated animal shown to have a strong response to the
vaccine was used for the determination of relative ELISA units. The standard curve was
constructed on every plate and used to calculate the relative serum antibody
concentrations (expressed as ELISA units) by comparison with the standard curve
constructed using the dilutions of the positive control serum.
Equine influenza (KY/5/02) antibody production:
Influenza specific antibody production was evaluated by means of a
hemagglutination inhibition (HI) assay as well as an ELISA assay.

123
Equine influenza (KY 02) antibodies (IgGa, IgGb, IgG(T)) were measured using
an ELISA assay. The 96-well Immunolon I - B microtiter plates (Fisher Scientific,
Hanover Park, IL) were coated overnight at 4˙C with 10 hemagglutination units per well
of purified influenza virus (KY/5/02). The coated plates were then washed with PBS-T
(Sigma) and blocked with 2% non-fat dried milk powder dissolved in PBS-T (Sigma) for
1 h at 37˙C. Serum samples (diluted in PBS-T at 1:100) were added following the
blocking and washing step. Plates were incubated for 1 h at 37˙C. Plates were then
washed with PBS-T and incubated for 1 h at 37˙C with monoclonal antibodies specific
for IgGa (CVS 40), IgGb (CVS 39) and IgG(T) (CVS 48). Following another wash cycle
with PBS-T (Sigma), plates were again incubated with the secondary antibody
(horseradish peroxidase-conjugated goat-anti-mouse IgG antibody; Jackson Laboratories
Inc., West Grove, PA) for 1 h at 37˙C. Again, plates were washed, substrate (3,3´ 5,5´,-
tetramethylbenzidine; Sureblue TMB 1, KPL) was added and color developed. The
reaction was stopped (TMB Stop Solution, KPL) and the optical density determined at
450 nm using a 96 well plate reader (BioRAD, Hercules, CA). A standard curve was
constructed using serial dilutions of a serum sample from an influenza virus hyper
immune horse. This allowed for the calculation of relative antigen-specific antibody
concentrations in all experimental serum samples. Relative serum antibody
concentrations expressed as ELISA units were calculated by comparison with the
standard curve.
For equine influenza HI assay each serum sample was trypsin-periodate treated to
remove non-specific inhibitors of virus hemagglutination which are present in serum
samples. This was done by adding 100 µL trypsin to 100 µL serum followed by 30 min

124
incubation in a 56˙C water bath. Then 300 µL periodate was added and samples
incubated at room temperature for 15 min, followed by the addition of 500 µL 0.6 %
glycerol in saline. This yielded a final serum dilution of 1:10.
Next 25 µL PBS was added to all the wells of a round bottom 96 well plate
(Thermo Fisher U-bottom micro titer vinyl plate). Then 50 µL of the treated serum was
added to the first well on the plate, and 25 µL was then titrated across the row. Finally 25
µL virus (1:8 dilution) was then added to all wells. Plates were incubated for 30 min at
room temperature. Buttons of non-agglutination were then read, and the titer allocated to
the last non agglutinating dilution for each sample.
Statistical analysis:
Data were analyzed as a repeated measures design using the Proc Mixed function
of SAS 9.2 (SAS Institute Inc., Cary, NC) with least square means separation procedure.
The model included time, treatment and block as fixed effects, while horse was included
as a random effect. Data were tested for normality, and log transformed when required
for statistical analysis. Data were back transformed and are presented as least squares
means. Significance was set at P < 0.05 and a trend at P < 0.1.
RESULTS
Selenium and vitamin E status:
At the initiation of the vaccine challenge whole blood Se concentration and whole
blood GPx activity (Table 5.3) were higher for SP and SS when compared to AS, which
125
in turn exceeded whole blood Se but not GPx activity of LS (P < 0.0001). Serum vitamin
E concentration (Table 5.3) was similar across all treatment groups (P = 0.9876) and
indicated adequate vitamin E status.
Complete blood count data:
The CBC data (Table 5.4) collected during the vaccination period indicated no
effect of treatment or treatment x time (P > 0.05) on lymphocyte numbers, neutrophil
numbers or the ratio of lymphocytes to neutrophils. However, there was an overall effect
of time (P < 0.05) on both lymphocyte and neutrophil numbers.
OVA vaccination response:
The anti-OVA-IgG values (Figure 5.2) indicated a trend for an effect of treatment
(P = 0.0655), an effect of time (P < 0.0001) and a treatment x time interaction (P =
0.0065). Overall there was a trend for antibody production to be lower for AS compared
to the other dietary treatments, but separation of means showed no difference among
treatments in response to the initial vaccine (wk 2 and 3). The second vaccine elicited a
stronger antibody response (wk 4, 5, 6 and 7). At wk 4 LS and SS antibody levels were
similar but higher than AS and SP. At wk 5 and 6 antibody production was comparable
between LS, SP and SS, but LS and SS had higher antibody levels than AS. At the final
time point SS antibody production was higher compared to AS and SP, but similar to LS.
Lymphocyte proliferation in response to OVA stimulation was similar between the
different treatments (Table 5.5). The intracellular production of IFNγ and TNFα in
response to in vitro OVA stimulation, measured by flow cytometry, indicated no effect of
Se status on the percentage of lymphocytes producing IFNγ or TNFα. However, a higher

126
(treatment, P = 0.031) mean fluorescence index (MFI) was observed for IFNγ in LS when
compared to AS and SP, but MFI was comparable between LS and SS (Appendix A
Table 5 a and b). Similarly the PBMC mRNA expression of cytokines in response to
OVA stimulation (Appendix A Table 5 c) indicated no effect of Se status on any of the
cytokines evaluated.
Flu vaccination response:
The humoral immune response to the flu vaccination is presented in Table 5.6.
Although there was an effect of time on IgGa, IgGb, IgGT and the influenza titer, no
effects of treatment or treatment x time interactions existed. Lymphocyte proliferation in
response to in vitro flu stimulation was also not affected by treatment. Intracellular
production of IFNγ and TNFα in PBMC stimulated in vitro with flu was unaffected by
treatment (Appendix A Table 5 a, Table 5 b, Table 5d). The mRNA cytokine expression
of PBMC stimulated in vitro with flu (Appendix A, Table 5d) indicated higher IL-6
expression in AS pre-vaccination compared to SS, and higher IL-6 expression in AS
compared to LS at 2 wks following vaccination with influenza (treatment x time P =
0.026). Similarly, mRNA expression of IL-8 increased following the influenza
vaccination in SP, while it decreased in the other 3 dietary treatment groups (treatment x
time, P = 0.045).
General immune response:
Lymphocyte proliferation in response to ConA stimulation (Table 5.5) indicated
no difference in the ability of the lymphocytes to proliferate, regardless of dietary
treatment. Intracellular production of IFNγ and TNFα in lymphocytes stimulated with

127
PMA was also unaffected by treatment (Appendix A Table 5 a and b). In contrast, the
PBMC mRNA expression of several cytokines stimulated in vitro with PMA (Table 5.7)
indicated an overall suppression of several cytokines in LS cells. LS had a lower
expression of IL-8 (P = 0.024) and IL-13 (P = 0.008) compared to AS, SP and SS. LS
also had lower expression of IL-6 (P = 0.002) and IL-10 (P = 0.026) when compared to
AS and SP, and lower expression of IL-1 compared to AS and SS. The mRNA expression
of IL-6 and IL-10 was higher in SP than SS but comparable to AS. Un-stimulated whole
blood mRNA expression of selected cytokines (Table 5.8) indicated an overall higher
expression of IL-10 for SS compared to other treatment groups (P = 0.043). A trend for
treatment x time interaction (P = 0.057) existed for IL-6. Separation of means revealed
IL-6 expression of SP to be lower at wk 0 compared to LS, but similar to AS and SS. In
addition IL-6 mRNA expression remained similar across all time points for LS and AS,
but increased from wk 0 to wk 3 in SP and SS (P < 0.05).
DISCUSSION
Supplementation with Se has been reported to affect immune function across
different species (Finch and Turner, 1996; McKenzie et al., 1998; Broome et al., 2004).
Preliminary work conducted in our laboratory indicated that low Se status did affect some
measures of immune function (Brummer et al., 2009; Brummer et al., 2011). Therefore,
we were interested in evaluating the effect of Se supplementation on immune function in
horses that were previously of low Se status. After 22 wk on the supplemented diets the
whole blood Se concentrations and GPx activity between treatments were different,
reflecting the different dietary Se intakes between treatments. The reference range for

128
adequate whole blood Se concentration is 180 to 240 ng/mL (Stowe, 1998). At the onset
of the vaccine challenge the range of Se concentrations between dietary treatments were
as follow: LS, 101 to 149 ng/mL; AS, 168 to 202 ng/mL; SP, 232 to 278 ng/mL; SS, 232
to 281 ng/mL. Therefore, horses in the LS group had whole blood Se concentration below
the reference range and all the other horses in SP and SS had values above or at the upper
end of the reference range. Whole blood GPx activity was measured as a biological
indicator of Se status and was reflective of whole blood Se concentrations. In addition,
serum vitamin E concentrations were similar between treatments and indicative of
adequate vitamin E status. Vitamin E status has been linked to immune function
(Meydani et al., 1990; Beck, 2007). Therefore a similar vitamin E status across
treatments was important to ensure correct interpretation of the immune response results.
Based on the above variables our experimental model responded as hypothesized, and
therefore the immune variable response anticipated to present an accurate representation
of the effect of Se status on immune function.
The CBC analysis conducted throughout the vaccination period served to monitor
the overall health of the horses, and to evaluate lymphocyte and neutrophil numbers.
Change in lymphocyte numbers in response to Se supplementation in the horse have been
reported (Calamari et al., 2010). However, in this study Se status did not affect any of
these variables. Therefore differences observed in immune response would likely not be
due to altered lymphocyte or neutrophil numbers in vivo.
Vaccination response was assessed using OVA and equine influenza as antigens.
These antigens allowed the evaluation of both primary and memory vaccination response
on an in vivo (humoral response) and in vitro (antigen specific cell-mediated response)

129
basis. The OVA-specific antibody response followed the expected pattern of response as
a small increase in antibody production was observed in response to the first vaccine,
followed by a much stronger antibody response after administration of the second vaccine
at 3 wk. Lower antibody levels in response to vaccination as a result of Se deficiency has
been reported before (Reffett et al., 1988b; Finch and Turner, 1996). Similarly higher
antibody levels have been associated with Se supplementation (Reffett et al., 1988a;
Knight and Tyznik, 1990; Biswas et al., 2006). In our study, the response to the first
OVA vaccination resulted in a similar primary antibody response across treatments. This
was in contrast to previous work from our laboratory that indicated lower primary
antibody response in horses of low Se status compared to horses of adequate Se status
(Brummer et al., 2011). Knight and Tyznik (1990) reported higher antibody production in
Se supplemented ponies (0.2 ppm) compared to un-supplemented ponies (0.02 ppm) in
response to two sheep red blood cell vaccinations, 2 wk apart. In our study, the response
to the second vaccine indicated that low Se status did not affect the ability of the horses
to produce antibodies, as LS antibody levels were similar to SS throughout the 7 wk
vaccination period. This is in agreement with Baalsrud and Overnes (1986) who reported
similar antibody production in response to vaccination between horses on Se
supplemented or un-supplemented diets. Horses receiving a combination of Se and
vitamin E did have improved antibody production compared to the control group
(Baalsrud and Overnes, 1986). Therefore it is likely that the adequate vitamin E status of
our horses allowed for a normal response antibody response to vaccination even in horses
with low Se status.

130
In this study, SS antibody production exceeded that of SP and AS at the final time
point. Comparing SP and SS it would appear as if the antibody response was greater for
SS, regardless of similar Se intakes. It has been hypothesized that Se improves humoral
immune response by protecting immune cells from excess H2O2 allowing for optimal
functioning (Baalsrud and Overnes, 1986; Knight and Tyznik, 1990). However, in this
study differences in antibody response were observed regardless of similar GPx activity.
It is also noteworthy that the AS treatment group did not have a very strong antibody
response to the OVA vaccination, as indicated by the trend for overall lower antibody
production by AS. Because Se deficiency has been associated with lower antibody
production, it was interesting to note that antibody production in this study was
unaffected for LS. Overall, the primary humoral response was unaffected by Se status,
although there was an effect of source of Se on antibody production following the second
vaccination with OVA at specific time points. Influenza specific antibody production as
well as HA titers were unaffected by Se status.
Antigen specific cell-mediated measures of immune function were evaluated by
means of in vitro stimulation of PBMC with OVA and equine influenza. When using in
vitro methods to assess the effect of a nutrient on immune function the nutrient
composition of the culture media is of utmost importance (Fraker, 1994). To better reflect
the in vivo environment in such studies the use of autologous serum is thought to be more
appropriate (Fraker, 1994) and has indeed been shown to affect lymphocyte proliferation
results in pigs deficient in either Se or vitamin E (Lessard et al., 1991). Therefore heat
inactivated autologous serum was used in the culture media for all the in vitro stimulation
assays.

131
Lymphocyte proliferation in response to OVA stimulation did not exhibit an
effect of Se status on observed response. In addition the pre-vaccination proliferation
response was similar to the post vaccination proliferative response, indicating no effect of
OVA vaccination on in vitro measures of OVA stimulated lymphocyte proliferation.
Lymphocyte proliferation in response to influenza stimulation was also unaffected by Se
status. In contrast, enhanced proliferation in response to in vitro stimulation with polio
virus has been reported in human subjects supplemented with Se compared to placebo
controls (Broome et al., 2004). Intracellular production of IFNγ and TNFα indicated that
although the number of IFNγ producing cells was not affected by Se status, the amount of
IFNγ produced by these lymphocytes (mean fluorescence index) was higher for the LS
group. Yet, Se status did not affect the relative mRNA expression of IFNγ. Similarly Se
status had no effect on the relative expression of any of the other cytokines and
transcription factors in OVA or influenza stimulated PBMC. These results suggest that Se
status only had limited effects on the cell-mediated response to vaccination, whether a
novel or previously administered vaccine was used. However, together with the
lymphocyte proliferation results, comparing pre-vaccination response to post-vaccination
response data suggests that the OVA vaccination in general did not have a strong effect
on cell-mediated measures. It is possible that the previously tested in vitro stimulation
protocol was not sufficient in this case, that there was a failure of cells to recognize the
antigen in vitro, or there was a stronger stimulation of the humoral component of the
immune system by the OVA vaccination. In addition, previous work conducted indicated
lower expression of the transcription factor T-bet in horses of low Se status compared to

132
horses of adequate Se status in response to vaccination with keyhole limpet hemocyanin
(Brummer et al., 2011), but that response was not observed here.
Along with vaccination response, we also evaluated cell-mediated immune
function by assessing response to non-specific mitogen stimulation in vitro. Mitogen
stimulation is non-specific and targets a large proportion of the cells in culture, as
opposed to highly specific antigen stimulation (Calder, 2007). The use of mitogens also
provides a measure of the functional capacity of cells (Touraine et al., 1977; Vance et al.,
2004).
Lymphocyte proliferation in response to ConA stimulation was unaffected by Se
status. This is in contrast to studies showing an increase in proliferation in response to Se
supplementation (Lessard et al., 1991; Peretz et al., 1991; Roy et al., 1994). Previous
research from our laboratory also indicated no effect of Se status on lymphocyte
proliferation (Chapter 3 and Chapter 4). Recently, lymphocyte proliferation was reported
to be similar between foals of 1 mo of age, regardless of the source of Se (sodium selenite
or Se-yeast) fed to their dams (Montgomery et al., 2012). It has been suggested that
lymphocyte proliferation is enhanced by Se supplementation due to a role of Se in the
modulation of the arachidonic acid metabolism (Cao et al., 1992). Using in vitro assays
with bovine cells the authors reported that low Se status was associated with a reduction
in the metabolites of the 5-lipoxygenase pathway, which in turn was linked to lower
lymphocyte proliferation. The suppressed proliferation response was reportedly reversed
by the addition of specific lipoxygenase pathway products (Cao et al., 1992).
Collectively, our results suggest that lymphocyte proliferation in the horse may not be as

133
sensitive to Se status as reported in other species or that differences in proliferation may
be too small to detect or responses among horses too variable.
Intracellular production of IFNγ and TNFα in response to non-specific stimulation
indicated no differences between dietary treatment groups. However, differences were
observed in the relative mRNA expression of several cytokines. Overall LS had lower
relative expression of IL-8 and IL-13 compared to AS, SP and SS. IL-8 is a cytokine that
functions as a neutrophil chemo-attractant and activator of the degranulation of
neutrophils (Dinarello, 2000). Wuryastuti et al. (1993) reported reduced phagocytic and
microbicidal ability of neutrophils isolated from Se deficient sows, while Aziz and
Klesius (1985) reported Se deficiency affected the ability of lymphocytes to modulate
neutrophil migration. Therefore the lower expression of IL-8 upon stimulation with PMA
in the LS group was an interesting observation. IL-13 is associated with the regulation of
cell-mediated responses (Tato and Cua, 2008a). In addition, IL-6 and IL-10 expression
was also lower in LS compared to AS and SP. In contrast, Beck et al. (2001) reported
mRNA levels of IL-10 and IL-13 were elevated in Se deficient mice by d 6 post
vaccination with an influenza virus strain when compared to adequate mice. These
authors also reported elevated IL-4, IL-5, IL-10 and IL-13 from d 14 onwards, the
opposite of what was expected following a viral challenge (Beck et al., 2001).
Relative mRNA expression of cytokines in un-stimulated whole blood provides
an in vivo measure of cytokine production in the horse. Here the relative expression of
IL-10 was higher in SS compared to LS, AS and SS. The cytokine IL-10 is described as
one of the most important anti-inflammatory cytokines (Opal and DePalo, 2000). IL-10 is
produced by the B-cells and T-helper (Th) cells involved in the humoral response (Th2)
134
(Goldsby et al., 2000). IL-10 also down regulates the Th1 cells that provide defense
against intracellular pathogen response via IL-2 and IFNγ production (Opal and DePalo,
2000). Although IFNγ expression in the un-stimulated whole blood samples was similar
across treatments, the SS treatment group did have a strong humoral (Th2) response to
the OVA vaccination. A trend also existed for the relative expression of IL-6 to increase
from wk 0 to wk 3 in SP and SS. Although IL-6 is a cytokine with both pro and anti-
inflammatory properties, it can be regarded as anti-inflammatory due to its ability to
down regulate TNFα and IL-1. In our study un-stimulated whole blood expression of
TNFα was unaffected by Se status. In mice, TNFα expression in macrophages from LPS
stimulated lung cells were found to be lower in the Se adequate mice compared to mice
of low Se status (Vunta et al., 2008).
Comparing the effect of source of Se supplementation, the SP group had a higher
mRNA expression of IFNγ and IL-2 at wk 3 of the vaccination period in response to
PMA stimulation compared to SS, while SS elicited a stronger humoral response to OVA
immediately following this time point. Although OVA specific stimulation at this time
indicated no difference between IFNγ and IL-2 for SS and SP, PMA stimulation suggests
a stronger Th1 type of response in SP at wk 3, while the higher antibody production
following this time point in SS may suggest a stronger humoral (Th2) response in SS. At
wk 3 in vivo IL-10 mRNA expression was also higher for SS compared to SP. Similarly
Broome et al. (2004) reported higher levels of IFNγ and IL-10 at day 7 post vaccination
with a polio virus in stimulated whole blood cultures from Se supplemented groups
compared to an un-supplemented group of marginal Se status, using humans as research
subjects.

135
The mechanism of action of Se on the immune system is a subject that has
received a lot of interest, yet the exact mechanism remains elusive. The role of NF-κβ has
been considered. NF-κβ is a transcription factor that initiates the transcription of
cytokines, specifically the pro-inflammatory cytokines (Tosi, 2005) including the
production of pro-inflammatory proteins such as TNFα and IL-6 (Duntas, 2009). It has
been hypothesized that the antioxidant properties of Se prevent the over-activation of NF-
κβ by high levels of ROS (Beck et al., 2001; Zeng and Combs Jr, 2008). In our study LS
had lower GPx activity which could potentially result in higher ROS levels, but TNFα
and IL-6 were not elevated in LS. Another proposed mechanism suggests that a higher Se
intake may improve T-cell receptor strength signaling via elevated Ca2+ flux (Hoffmann
et al., 2010). Recently, a study using selenoprotein K knockout mice also suggested that
the mechanism of action for Se and the immune system may lie in the regulation of Ca2+
flux, implicating the importance of selenoprotein K in immune function (Verma et al.,
2011). In our study the PMA/ionomycin (calcium ionophore) stimulation protocol results
in the activation of PBMC’s via activation of the Protein Kinase C as well as calcium
signaling pathways. The overall suppressed cytokine mRNA expression observed for the
low Se group despite the addition of ionomycin to the cultures may support these
proposed mechanisms of action.
CONCLUSION
In conclusion, our study indicated that Se status, either high or low, did not affect
the ability of the horses to mount an immune response to a novel antigen, or to a
previously administered antigen as measured by antigen specific antibody production and

136
antigen specific cytokine production. However, general cell-mediated immunity appeared
suppressed in the horses of low Se status, as measured by relative expression of cytokines
in in vitro stimulated PBMC. In addition, in vivo relative cytokine gene expression was
also affected by Se status. However, no clear advantage in immune function was
observed comparing supplementation at 0.12 ppm with 0.3 ppm. Collectively these
results suggest that adequate Se supplementation is important to maintain immune
function in the horse.
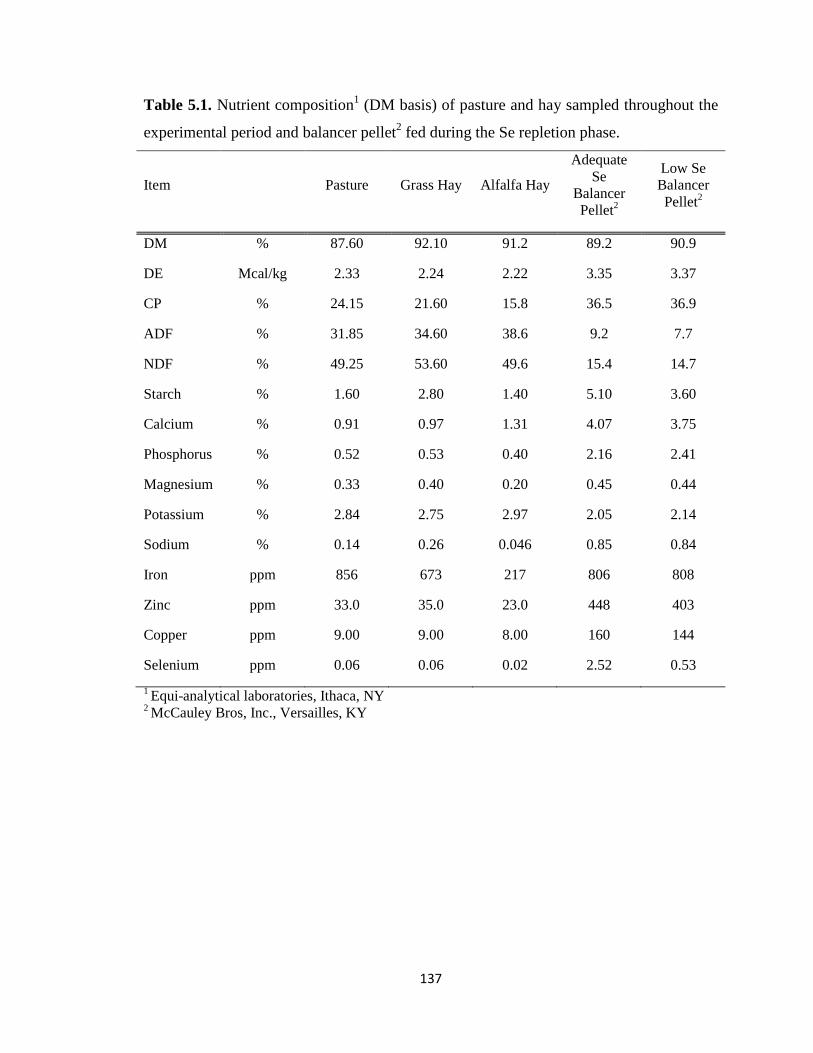
137
Table 5.1. Nutrient composition1 (DM basis) of pasture and hay sampled throughout the
experimental period and balancer pellet2 fed during the Se repletion phase.
Item
Pasture Grass Hay Alfalfa Hay
Adequate Se
Balancer Pellet2
Low Se Balancer Pellet2
DM % 87.60 92.10 91.2 89.2 90.9
DE Mcal/kg 2.33 2.24 2.22 3.35 3.37
CP % 24.15 21.60 15.8 36.5 36.9
ADF % 31.85 34.60 38.6 9.2 7.7
NDF % 49.25 53.60 49.6 15.4 14.7
Starch % 1.60 2.80 1.40 5.10 3.60
Calcium % 0.91 0.97 1.31 4.07 3.75
Phosphorus % 0.52 0.53 0.40 2.16 2.41
Magnesium % 0.33 0.40 0.20 0.45 0.44
Potassium % 2.84 2.75 2.97 2.05 2.14
Sodium % 0.14 0.26 0.046 0.85 0.84
Iron ppm 856 673 217 806 808
Zinc ppm 33.0 35.0 23.0 448 403
Copper ppm 9.00 9.00 8.00 160 144
Selenium ppm 0.06 0.06 0.02 2.52 0.53 1 Equi-analytical laboratories, Ithaca, NY 2 McCauley Bros, Inc., Versailles, KY

138
Table 5.2. Example of calculated dietary Se intake1 for a 500 kg horse.
Se source Low Se (mg) Adequate Se (mg) Se-Yeast (mg) Sodium selenite (mg)
Pasture 0.56 0.56 0.56 0.56 Balancer pellet 0.16 0.86 0.16 0.16 Supplement * * 2.74 2.74 Total (mg/d) 0.72 1.42 3.46 3.46 Total (mg/kg DM) 0.062 0.12 0.30 0.30 1 Total DM intake estimated at 2.25% of BW or 11.6 kg DM per day

139
Table 5.3. Indicators of Se and vitamin E status at the onset of the vaccine challenge (LS
Means ±SE).
Variable LS1 AS1 SP1 SS1 P-value
Whole blood Se (ng/mL) 116.5±6.3a 185.4±6.8b 256.3±6.8c 250.3±6.8c <0.0001
Whole blood GPx (mU/mg hb) 37.4±3.6a 52.1±4.0a 69.3±3.4b 72.9±3.6b <0.0001
Serum vitamin E (µg/mL) 3.6±0.47a 3.8±0.51a 3.8±0.47a 3.9±0.50a 0.9876 a,b,c Means within row lacking a common superscript differ, P < 0.05 1Dietary treatments (total dietary Se): LS = low Se (0.06 mg Se/kg DM); AS = Adequate Se (0.12 mg Se/kg DM); SP = organic Se (0.3 mg Se/kg DM, Sel-Plex, Alltech Inc., Nicholasville, KY); SS = inorganic Se (0.3 mg Se/kg DM, sodium selenite)

140
Table 5.4. Complete blood count1 analysis of horses on different dietary treatments2
during the vaccination challenge3.
Week
Main effect (P-value) Item 0 3 5 SEM Treatment Time Treatment x time Lymphocyte (x103)
LS 2.35 2.50 2.70 0.26 0.479 0.008 0.440 AS 2.23 2.15 2.98 0.26
SP 2.54 2.44 2.61 0.24 SS 2.93 2.57 3.10 0.26 Neutrophil (x103)
LS 3.73 3.60 4.18 0.31 0.480 0.0003 0.898 AS 3.23 3.50 3.78 0.32
SP 3.29 3.47 3.97 0.31 SS 3.73 4.08 4.38 0.31 Ratio
LS 1.67 1.56 1.63 0.29 0.670 0.682 0.375 AS 1.45 1.63 1.24 0.29
SP 1.38 1.50 2.25 0.27 SS 1.42 1.60 1.50 0.29 1Complete blood count analysis conducted by Rood and Riddle Equine Hospital (Lexington, KY)
2Dietary treatments (total dietary Se): LS = low Se (0.06 mg Se/kg DM); AS = Adequate Se (0.12 mg Se/kg DM); SP = organic Se (0.3 mg Se/kg DM, Sel-Plex, Alltech Inc., Nicholasville, KY); SS = inorganic Se (0.3 mg Se/kg DM, sodium selenite)
3Vaccinations were administered at wk 0 and wk 3

141
Table 5.5. Lymphocyte proliferation in response to different stimulations1 in horses on
different dietary treatments2 (presented as stimulation index LS means).
Week3 Main effect (P-value) Item 0 3 5 SEM Treatment Time Treatment x time ConA
LS 25.7 11.0 12.7 4.75 0.443 <0.0001 0.998 AS 24.5 7.67 9.31 4.78
SP 28.7 11.1 13.1 4.41 SS 22.3 8.26 10.4 4.75 OVA
LS 0.97 1.06 1.14 0.092 0.428 0.781 0.225 AS 0.98 0.86 0.95 0.094
SP 0.97 0.91 0.92 0.085 SS 0.84 1.07 0.88 0.092 Influenza
LS 2.90 * 2.95 0.77 0.424 0.305 0.767 AS 1.39 * 1.29 0.80
SP 1.71 * 1.39 0.72 SS 2.65 * 1.97 0.77
1ConA (concanavalin A), OVA (ovalbumin) and Influenza (Equine influenza strain KY 2002) 2Dietary treatments (total dietary Se): LS = low Se (0.06 mg Se/kg DM); AS = Adequate Se (0.12 mg Se/kg DM); SP = organic Se (0.3 mg Se/kg DM, Sel-Plex, Alltech Inc., Nicholasville, KY); SS = inorganic Se (0.3 mg Se/kg DM, sodium selenite) 3Vaccinations were administered at wk 0 and wk 3

142
Table 5.6. Humoral immune response variables in response to vaccination of mature
horses on different dietary treatments2 with equine influenza (KY02).
Week
Main effect (P-value) Item 0 5 7 SEM Treatment Time Treatment x time
IgGa3 LS 66 1277 356 393 0.7279 <0.0001 0.7778
AS 96 579 291 408 SP 42 709 276 370 SS 170 626 410 397 IgGb3
LS 839 2817 4365 2599 0.285 <0.0001 0.447 AS 716 1756 3217 2664
SP 2338 8009 9252 2422 SS 2389 7690 10562 2599 IgGT3
LS 5344 6628 7030 2018 0.325 0.025 0.561 AS 2191 2632 2613 2079
SP 4490 7983 8445 1883 SS 5031 5089 5458 2019 Influenza titer4
LS 82 167 133 53 0.430 <0.0001 0.289 AS 75 195 169 55
SP 105 232 226 53 SS 147 267 267 50 10 = pre vaccination, 5 = 2 wk post vaccination, 7 = 4 wk post vaccination for equine influenza
2Dietary treatments (total dietary Se): LS = low Se (0.06 mg Se/kg DM); AS = Adequate Se (0.12 mg Se/kg DM); SP = organic Se (0.3 mg Se/kg DM, Sel-Plex, Alltech Inc., Nicholasville, KY); SS = inorganic Se (0.3 mg Se/kg DM, sodium selenite) 3IgGa, IgGb and IgGT measured as ELISA units relative to a standard curve produced from a high responding horse 4Hemagglutination inhibition

143
Table 5.7. mRNA expression as relative quantity of cytokines1 and transcription factors
in peripheral mononuclear cells stimulated with PMA from horses on different dietary
treatments2 during the vaccine challenge3.
Week Main effect (P-value)
Item Diet1 0 3 5 SEM Treatment Time Treatment
x time Tbet LS 52.31 51.47 41.28 53.3 0.734 0.020 0.539
AS 167.36 127.63 143.21 55.4 SP 25.21 49.09 44.07 49.8 SS 25.80 37.08 57.20 53.3 GATA 3 LS 4.62 6.53 6.50 1.02 0.913 0.049 0.152
AS 5.93 5.87 4.71 0.99 SP 4.80 5.87 5.90 0.92 SS 4.46 4.79 5.74 1.01 GranzymeB LS 222.50 158.93 229.81 75.0 0.581 0.338 0.612
AS 247.18 241.30 288.97 78.0 SP 140.21 123.91 152.47 70.2 SS 98.10 94.13 103.73 75.0 IFNγ LS 391036 99935a 392527 91506 0.876 < 0.01 < 0.0001
AS 548946 225988ab 292075 91280 SP 323839 298318b 242302 82354 SS 448286 118959a 205065 88132 TNFα LS 3743b 807a 1148b 1964 0.037 < 0.01 0.001
AS 12639a 4541b 4257a 1923 SP 2690b 1427ab 2871ab 1740 SS 3333b 1082a 4717ab 1864 IL-1 LS 5.29 1.52 1.69 2.53 0.002 < 0.01 0.079
AS 21.24 3.49 6.59 2.33 SP 3.77 2.07 3.25 2.12 SS 5.89 3.68 5.79 2.29 IL-2 LS 243704 125236a 188408 53000 0.677 < 0.01 0.003
AS 191891 133682a 125565 54958 SP 187074 190925a 242967 49540 SS 194951 72421b 99365 45722

144
Table 5.7. Continued.
Week Main effect (P-value)
Item Diet1 0 3 5 SEM Treatment Time Treatment x time IL-6 LS 13.27a 2.27a 3.43a 5.47 0.002 < 0.01 < 0.0001 AS 59.24b 15.95b 13.64b 5.62 SP 32.24c 8.33bc 15.63b 5.10 SS 9.14a 4.95ac 9.94b 5.47 IL-8 LS 11.3 3.30 2.18 3.10 0.024 < 0.01 0.489
AS 25.3 8.72 4.50 3.17 SP 11.5 5.08 6.12 2.89 SS 13.6 8.34 7.21 3.10 IL-10 LS 1710a 604b 538a 448.3 0.026 < 0.01 < 0.0001
AS 4867b 1811a 1315b 420.1 SP 2214a 614b 1397b 430.5 SS 2363ab 397c 1362b 472.7 IL-13 LS 1673 1604 1173 1971 0.008 0.481 0.315
AS 3415 9968 4229 2024 SP 4030 6583 7690 1838 SS 7179 4964 6143 1971 1IL = Interleukin 2Dietary treatments (total dietary Se): LS = low Se (0.06 mg Se/kg DM); AS = Adequate Se (0.12 mg Se/kg DM); SP = organic Se (0.3 mg Se/kg DM, Sel-Plex, Alltech Inc., Nicholasville, KY); SS = inorganic Se (0.3 mg Se/kg DM, sodium selenite) 3Vaccinations were administered at wk 0 and wk 3

145
Table 5.8. Relative quantity of mRNA expression of cytokines1 in un-stimulated whole
blood from horses on different dietary treatments2 during the vaccine challenge3.
Week Main effect (P-value) Item Diet 0 3 5 SEM Treatment Time Treatment x time IFNγ LS 0.592 0.444 0.615 0.140 0.336 0.367 0.235
AS 0.608 0.636 0.713 0.145
SP 0.596 0.685 0.528 0.131
SS 1.038 0.789 0.809 0.140
TNFα LS 1.002 0.926 0.944 0.148 0.603 0.329 0.639
AS 1.166 1.020 0.924 0.153
SP 1.196 1.172 1.121 0.138
SS 1.077 1.128 1.134 0.148
IL-6 LS 0.922 1.040 1.180 0.287 0.422 0.030 0.057
AS 0.635 0.522 0.720 0.294
SP 0.353 0.819 1.176 0.267
SS 0.477 0.713 0.753 0.287
IL-8 LS 1.243 1.216 1.276 0.257 0.696 0.759 0.788
AS 1.104 1.003 0.843 0.263
SP 0.933 0.781 1.018 0.239
SS 0.851 0.994 1.071 0.257
IL-10 LS 0.738 0.793 0.762 0.210 0.043 0.655 0.598
AS 0.823 0.889 0.704 0.218
SP 0.730 0.828 0.630 0.198 SS 1.774 1.316 1.555 0.210
1IL=Interleukin 2Dietary treatments (total dietary Se): LS = low Se (0.07 mg Se/kg DM); AS = Adequate Se (0.14 mg Se/kg DM); SP = organic Se (0.3 mg Se/kg DM, Sel-Plex, Alltech Inc., Nicholasville, KY); SS = inorganic Se (0.3 mg Se/kg DM, sodium selenite) 3Vaccinations were administered at wk 0 and wk 3

146
Figure 5.1. Sampling and vaccination time points for OVA vaccination. White arrows
denote blood collection for determination of Se status, antibody production and
peripheral blood mononuclear cell isolation. Black arrows denote blood collection for
antibody production determination only. 1Ovalbumin (OVA), Sigma Saint Louis, MO. 2Prestige V, Intervet, Summit, NJ

147
Figure 5.2. Anti-OVA-IgG levels in response1 to OVA vaccination2 of mature horse3. 1Treatment P = 0.0655; time P = <0.0001; treatment x time P = 0.0065. 2The 10 mg ovalbumin vaccinations were administered at wk 0 and wk 3, immediately after obtaining blood samples at those time points 3Dietary treatments (total dietary Se): LS = low Se (0.06 mg Se/kg DM); AS = Adequate Se (0.12 mg Se/kg DM); SP = organic Se (0.3 mg Se/kg DM, Sel-Plex, Alltech Inc., Nicholasville, KY); SS = inorganic Se (0.3 mg Se/kg DM, sodium selenite) a,b means within time point lacking common superscripts differ, P < 0.0.5
Copyright © Mieke Brummer 2012

148
CHAPTER 6: Measures of Antioxidant Status of the Horse in Response to Selenium Depletion and Repletion
INTRODUCTION
The antioxidant system is complex and consists of many different antioxidant
components. In addition, synergistic interactions are known to exist between some of the
antioxidants (Deaton et al., 2002; Surai, 2006), further complicating the assessment of the
antioxidant system. Glutathione peroxidase (GPx) was one of the first identified
selenoenzymes, and its activity is influenced by the selenium (Se) status of the body
(Brown and Arthur, 2001). GPx is a component of the antioxidant system as it regulates
hydrogen peroxide levels inside the cell (Arthur, 1997; Ferguson and Karunasinghe,
2011). Therefore it seems likely that total antioxidant status might decline when Se status
declines. Serum malondialdehyde (MDA) is an end product of lipid peroxidation that
occurs when cell membranes are damaged by reactive oxygen species (Ducharme et al.,
2009) such as hydrogen peroxide (Surai, 2006). Serum MDA has therefore been used as a
measure of oxidative stress in the horse. Although some studies have evaluated the
relationship between dietary Se intake and GPx activity in horses, few studies have
investigated the relationship between Se status, GPx activity and antioxidant status in
response to Se depletion and repletion.
Hence, the objectives of this study were to evaluate the impact of Se depletion,
followed by repletion, on GPx activity, antioxidant status and oxidative stress in the
horse. Secondary objectives were to determine if Se supplementation above NRC
recommended levels (1 mg/d for a 500 kg horse or 0.1 ppm) at 0.3 ppm fed as either
sodium selenite or Se-yeast for a 154 d would affect Se status as indicated by whole

149
blood Se and GPx activity. In addition serum vitamin E concentration, triiodothyronine
(T3), thyroxine (T4), lymphocyte and neutrophil numbers were evaluated throughout the
Se depletion and repletion phases. Iodothyronine deiodinase is a selenoenzyme
responsible for the conversion of T4 to T3 (Brown and Arthur, 2001).
We hypothesized that depletion of Se would result in a decrease in TAC and an
increase in MDA. Upon supplementation with 0.3 ppm we hypothesized that whole blood
Se and GPx activity would increase which would result in an increase in TAC, T3/T4
ratio and a decrease in MDA. Low Se status was also expected to result in low
lymphocyte numbers.
MATERIALS AND METHODS
Animals:
This research project was approved by the Institutional Animal Care and Use
Committee of the University of Kentucky.
Twenty eight mature horses, aged 5 to 23 yr, were used in this study. The 28
horses included 8 geldings and 20 mares. The geldings consisted of 6 Thoroughbreds, 1
American Quarter Horse and 1 Standardbred, while the mares consisted of 19
Thoroughbreds and 1 American Quarter Horse.
Experimental design, diets and treatments:
The study was conducted in two phases as depicted in Figure 6.1. The first phase
was a Se depletion phase (196 d), immediately followed by a Se repletion phase (189 d).

150
Preceding the onset of the depletion phase, horses were blocked by age and gender and
randomly assigned within block to one of four treatment groups: LS, AS, SP or SS which
are explained later. Throughout the study horses were kept out on pasture. The horses
were allocated to pastures so that all treatment groups were represented within each
pasture. Prior to and throughout the study pastures were sampled periodically when
pasture availability was sufficient. Although the Se content of the pastures fluctuated, it
remained marginal in Se (range 0.03 to 0.08 ppm DM) at all times. When pasture
availability declined in winter, horses were fed hay that was produced on the same farm
(Se < 0.05 ppm DM), and cracked corn (Se < 0.16 ppm DM) to provide additional
calories. Horses had ad libitum access to water and an iodized salt block. The horses were
weighed on a monthly basis.
Depletion phase:
During the depletion phase, AS received an adequate Se diet and served as a
control, while the remaining three groups (LS, SP, and SS) received a low Se diet with
the goal of depleting Se stores. The three depleting groups were statistically grouped
together so that only 2 treatment groups existed: AS (n = 7) and LS (n = 21). One TB
mare had to be removed from the depleting group during the depletion phase, therefore
LS treatment group consisted of n = 20.
To ensure that nutrients other than Se were provided, a custom formulated low Se
(0.48 ppm DM) protein–vitamin-mineral balancer pellet was fed to the Se depleting
horses (Table 6.1, McCauley Bros, Inc., Versailles, KY). The composition of the
ballancer pellets appear in Appendix A Table 4.a. The horses assigned to AS were fed a

151
similar pellet that contained 2.52 ppm Se on a DM basis. The adequate and low Se
balancer pellets allowed for the manipulation of dietary Se intake. Individual feeding
pens were constructed to feed the balancer pellets on an individual BW basis. The
calculated (Table 6.2) total Se intake for the horses on the low Se diet (LS) was 60 % of
the NRC (2007) recommended amount of 1 mg Se per day for a 500 kg horse or 0.1 ppm
DM, while horses on the adequate Se diet (AS) received a calculated total Se intake of
120 % of the recommended amount of Se. Horses were kept on their respective diets for a
period of 196 d to allow for Se depletion.
Repletion phase:
During the repletion phase the horses in the AS group remained on the same
adequate diet, while two of the depleted groups were now supplemented with either an
organic (SP, Se-yeast; Sel-Plex®, Alltech Inc. Nicholasville, KY) or inorganic (SS,
sodium selenite) Se supplement (Figure 6.1). The 7 horses initially allocated to the LS
group remained on the low Se diet. One TB mare was removed from the repletion period
due to an eye injury, and consequently her entire data set was also removed from the
repletion phase. Therefore the number of experimental units per dietary treatment for the
repletion phase was as follows: repletion phase LS and SS consisted of n = 6 horses each,
while AS and SP consisted of n = 7 horses.
Throughout the repletion phase horses had access to pasture, and to hay when
pasture availability declined. Similar to the depletion phase custom formulated adequate
Se (2.52 ppm DM) or low Se (0.53 ppm DM) protein–vitamin-mineral balancer pellets
(Table 6.3, McCauley’s; Versailles, KY) were fed. The same individual feeding protocol

152
from the depletion phase was followed during the repletion phase, except that SP and SS
supplements were top-dressed on the balancer pellet. The AS and LS horses received
brewer’s yeast to account for the yeast component in the Se-yeast supplement and
brewer’s yeast was also used as carrier for the sodium selenite supplement. A small
amount of water was added to the balancer pellet and top-dressed supplement prior to
feeding to improve the palatability and texture. The horses were monitored to ensure that
allotted supplement and balancer pellet was entirely consumed.
During the repletion period the total dietary Se intakes were calculated (Table 6.2)
to be as follows: LS received 60 % of the NRC (2007) recommendation. The AS group
received a total of 120 % of the recommended amount of Se. Horses on the SP and SS
treatments received 300 % (0.3 ppm DM) of the recommended Se intake. Total dietary Se
intake was calculated to be equal between horses within treatment on a BW basis. The
horses were kept on their respective diets for a period of 189 d. This supplementation
period was selected to ensure that the turnover of red blood cells would be sufficient for
the identification of change in indicators of Se status (whole blood Se concentration and
GPx activity).
Blood sampling procedures:
Baseline blood samples were taken at the start of each phase, and every 4 wk
thereafter throughout the Se depletion and repletion phases. Blood was collected in 7 mL
lithium heparin blood collection tubes (Becton Dickson, Franklin Lakes, NJ) for analysis
of whole blood Se and whole blood GPx activity. Blood was also collected in untreated
blood collection tubes for serum separation (Becton Dickson) and EDTA containing

153
tubes (Becton Dickson) for complete blood count (CBC) analysis. Whole blood was
transferred to storage vials and kept at -80˙C until analysis. Serum separation was
conducted by allowing blood samples to clot for approximately 60 min at room
temperature. Samples were then centrifuged at 2500 x g for 20 min at 4˙C. Serum was
aspirated, transferred to storage vials and stored at - 80˙C until analysis.
Laboratory procedures:
Selenium Status: Whole blood selenium
Whole blood Se concentration was analyzed by the Diagnostic Center for
Population and Animal Health (Michigan State University; Lansing, MI) by means of
inductively coupled plasma-mass spectroscopy.
Selenium Status: Whole blood GPx activity
Whole blood GPx activity was determined using the Bioxytech GPx-340 assay kit
(OXIS research, Portland, OR) (Richardson et al., 2006). This assay is based on the
method developed by Paglia and Valentine (1967). The GPx activity of each sample was
calculated from the change in absorbance and expressed as units of enzyme activity per
mg hemoglobin (mU/mg Hb). Hemoglobin values were obtained from the complete
blood count analysis described below.

154
Complete blood count analysis (CBC):
The CBC analyses were performed by a local commercial equine hospital (Rood
and Riddle Equine Hospital, Lexington, KY). Lymphocyte and neutrophil numbers were
then calculated from the CBC analysis.
Serum total antioxidant capacity (TAC):
Serum TAC was determined using a method that compares the ability of the
antioxidants in the serum sample to inhibit the oxidation of 2,2’-azino-di-[3-
ethylbenzthiazoline sulphonate] to that of Trolox, a water soluble tocopherol analogue.
(Antioxidant assay kit; Caymenchemical; Ann Arbor, MI). Samples were analyzed in
triplicate according to the manufacturer protocol (Caymenchemical). The TAC was
determined for the baseline and d 154 samples collected for each phase. The inter-assay
coefficient of variation was 3.82%.
Serum malondialdehyde (MDA) concentration:
Serum MDA concentration was measured using a thiobarbituric acid reactive
substances (TBARS) method (Ducharme et al., 2009). This method was based on the
reaction of MDA with thiobarbituric acid under acidic, high temperature conditions,
using MDA as standard. Samples were analyzed in triplicate according to the directions
supplied by the kit manufacturer (Caymenchemical). Serum MDA was determined on the
baseline and endpoint samples collected for each phase. The inter-assay coefficient of
variation for MDA concentration was 3.68 %.

155
Triiodothyronine (T3) and thyroxine (T4):
A solid phase 125I radio immunoassay (Coat-a-count; Siemens) was used to
measure T3 and T4. The T3/T4 ratio was then calculated. T3/T4 was determined for the
baseline and endpoint samples collected for both phases. The inter-assay coefficient of
variation for T3 and T4 was 2.47 % and 3.14 % respectively.
Statistical analysis:
Data were analyzed as a repeated measures design using the Proc Mixed function
of SAS 9.2 (SAS Institute Inc., Cary, NC) with least square means separation procedure.
Each horse served as experimental unit. The model included time, treatment and block as
fixed effects, while horse was included as a random effect. Data are presented as least
squares means.
RESULTS
Depletion phase:
Whole blood Se concentration and GPx activity for the depletion phase is
presented in Table 6.4. Whole blood Se concentration was similar between AS and LS at
the onset of the depletion phase (P > 0.05). Whole blood Se concentration data during the
depletion phase were affected by treatment (P < 0.0001), time (P < 0.0001) and a
treatment x time interaction existed (P = 0.0073). The whole blood Se concentration of
LS decreased until d 140 before it stabilized, at which time it was lower than in AS.
Whole blood Se concentration at the end of the depletion period (d 196) was different

156
between the two treatment groups (P < 0.05). The Se concentration of AS did decrease
within the first 84 d, likely due to adaptation from a higher Se diet, but then stabilized.
Whole blood GPx activity for the depletion phase was affected by treatment (P < 0.0001)
and time (P < 0.0001) but there was no treatment x time interaction (P = 0.9160). Similar
to Se, whole blood GPx activity in AS initially decreased and then stabilized while GPx
activity decreased in LS. Final GPx activity was lower in LS compared to AS at d 196 (P
< 0.05). A positive correlation existed between whole blood Se and GPx activity (r =
0.63; P < 0.0001).
The T3/T4 ratio decreased over time during the depletion period (P = 0.0179),
this decrease was not affected by Se status (P > 0.05; Appendix A Table 6.a).
Serum TAC (Table 6.5) was not affected by Se status during the depletion phase.
However there was an effect of time (P <0.0001) during the depletion phase due to the
decrease in TAC from d 0 to 196 in both groups. Serum MDA (Table 6.5) concentrations
were higher in AS (treatment, P < 0.0226) and an increase in MDA occurred for both AS
and LS from d 0 to d 196 (time, P = 0.0408) during the depletion phase.
The CBC data collected during the depletion phase (Table 6.6) indicated a trend
for higher lymphocyte numbers for LS compared to AS. The number of neutrophils and
the ratio of lymphocytes to neutrophils were similar between LS and AS.
Repletion phase:
At the start of the repletion phase whole blood Se concentration was similar
between LS, SP and SS. Whole blood Se concentration during the repletion phase (Table
6.7) was affected by treatment (P < 0.0001), time (P < 0.0001), and a treatment x time
157
interaction (P < 0.0001). Within 28 d of starting the repletion phase whole blood Se was
comparable between AS, SP and SS but higher than LS (P < 0.05). On d 154 whole blood
Se concentrations in SP and SS were higher than in AS (P < 0.05), and by d 189 SP
tended (P = 0.08) to have a higher whole blood Se concentration than SS. As expected,
LS and AS maintained their respective low and adequate Se concentrations over time.
Whole blood GPx activity (Table 6.8) during the repletion phase also had an effect of
treatment (P < 0.0001), time (P < 0.0001), and treatment x time interaction (P < 0.0001).
Whole blood GPx activity followed a similar but delayed response to the Se
concentration data. At the beginning of the repletion phase GPx activity was higher for
AS in comparison to LS, SP and SS. At d 154 the GPx activity of SS was comparable to
SP but higher than AS. At the final time point (d 189) the GPx activity of SP and SS were
similar but higher when compared to AS and LS. Between d 154 and 189 GPx activity
plateaued within SS but continued to increase in SP. A strong, positive correlation existed
between whole blood Se and GPx activity (r = 0.82; P < 0.0001). However, within
treatment the correlations differed for these two variables: LS (r = 0.81, P < 0.0001), SP
(r = 0.85; P < 0.0001) and SS (r = 0.87; P < 0.0001) had similar correlations, however,
this correlation was much weaker for AS (r = 0.48; P = 0.0018).
The aim of the repletion phase of this study was to evaluate the effect of Se
supplementation over a period long enough to allow for turnover of the red blood cell
population (140 - 150 d). Therefore the variables discussed below compare change in
samples taken at d 0 and d 154.
Although the T3/T4 ratio increased over time during the repletion phase (P =
0.0726) the increase was unaffected by Se status (P > 0.05; data not shown). This ratio

158
was expected to be affected by low Se status. However, the change within LS over both
phases alone also indicated no effect of depletion on T3/T4 (Appendix A Table 6 a).
Serum TAC (Table 6.9) was not affected by Se status, and remained similar
throughout the repletion phase. Similarly serum MDA concentration (Table 6.9) was
unaffected by treatment and time during the repletion phase (P > 0.05). Serum vitamin E
concentration (Figure 6.2) was monitored across both phases. Although vitamin E
concentrations fluctuated over time (P = 0.0004) there was no effect of treatment or
treatment x time (P > 0.05).
Lymphocyte and neutrophil numbers were similar between treatment groups
throughout the repletion phase. The lymphocyte to neutrophil ratio was also unaffected
by treatment (Appendix A Table 6 b).
DISCUSSION:
Studies showing an increase in the activity of GPx in response to Se
supplementation introduced the concept of improved functional Se status through dietary
Se supplementation (Brown and Arthur, 2001). In this study, the change in whole blood
Se and GPx activity throughout the depletion and repletion phases followed the expected
response, indicating that the Se status of the horse can be manipulated by dietary Se
intake if enough time is allowed for the variables to adjust.
The reference range for whole blood Se in a mature horse is estimated at 180 to
240 ng/mL (Stowe, 1998). Based on this reference range the horses included in this study
were of high Se status at the start of the study; possibly because of the Se content of the

159
commercial feed that the horses were fed prior to the onset of the depletion phase.
Consequently the initial decrease in Se concentration observed for AS from high Se
status to within the adequate range at d 84 was interpreted as a normal response. The
decrease in whole blood Se concentration of LS was faster than that of AS. Within 140 d
the Se concentration of LS was below the adequate reference range, and remained so for
the duration of the study. Yet the diet fed to the LS horses were still providing 70% of
their estimated requirement (NRC, 2007). The observed decrease to below the reference
range within 140 d suggests that the current Se recommendation must close to the
minimum Se requirement for mature idle horses.
Similar to whole blood Se, GPx activity decreased in both AS and LS during the
depletion phase. This decrease was anticipated for LS, but unexpected for AS. It has been
stated that erythrocyte GPx activity will plateau when a whole blood Se concentration of
160 ng/mL is reached (Blackmore et al., 1982). Whole blood Se concentration remained
above this level during the depletion phase. Therefore whole blood GPx activity of AS
was expected to remain similar throughout the depletion period. In contrast it declined,
regardless of adequate whole blood Se concentration and a Se intake of 140% of the
recommended daily Se intake (NRC, 2007). The whole blood GPx activity reference
range is 40 to 160 enzyme units per g hemoglobin (Stowe, 1998), though the sensitivity
of GPx activity to storage times and assay conditions makes it difficult to compare
absolute GPx activity values across studies. In this study GPx activity of LS approached
the lower end of this reference range, while AS remained within the reference range.
The correlation between whole blood Se and GPx during the depletion phase was
not very strong. Calamari et al. (2007) reported a slow decline in GPx activity upon

160
withdrawal of a Se supplement and hypothesized it was due to the slow red blood cell
turnover (140 to 150 d) of the horse, maintaining GPx activity for longer. A slower
change in GPx activity in comparison to Se concentration may explain the weak
correlation found between whole blood Se and GPx activity during the depletion period.
This weak correlation also suggests that whole blood Se may be a more accurate indicator
of Se status at a particular point in time if Se deficiency or a too low Se intake is
suspected. Similarly Ludvíková et al. (2005) found that when identifying low Se status in
the horse, the use of only GPx activity as an indicator resulted in the overestimation Se
status. However, blood GPx activity still remains an important indicator of long term Se
status (Lee et al., 1995).
At the start of the repletion phase the whole blood Se concentration of LS, SP and
SS fell well below the adequate Se range, while AS fell within the adequate range.
Throughout the repletion period the whole blood Se concentration of AS was slightly
higher but still comparable to the whole blood Se concentration reported by Shellow et al.
(1985) of 176 ± 12.0 ng/mL. However, these whole blood concentrations were for horses
fed at a slightly higher rate of 0.162 ppm Se for 140 d (Shellow et al., 1985) than the AS
horses in our study. Within the relatively short supplementation period of 28 d the whole
blood Se concentration of SP and SS increased above LS and became similar to AS. This
rapid response to supplementation has been described before in whole blood (Calamari et
al., 2009b) and plasma (Richardson et al., 2006). Calamari et al. (2009b) reported that
although plasma Se plateaued between d 75 and 90, whole blood Se concentration did not
plateau over a 112 d Se supplementation study that was conducted with lightly exercised
horses. In our study whole blood Se concentrations for SP and SS did reach a plateau

161
between d 154 and 189, observed by lack of change in Se concentrations between these
time points. The Se concentration results for SS and SP suggest that whole blood Se
concentrations would range from 225 to 278 ng/mL when horses are fed diets containing
0.3 ppm Se. In addition there was a trend for higher whole blood Se concentration in SP
horses compared to SS at d 189. These treatment groups were supplemented at a similar
rate. In a study comparing Se-yeast to sodium selenite, Se-yeast was found to have a
higher digestibility (Pagan et al., 1999), which could explain the observed difference in
Se concentrations between SP and SS at d 189.
Whole blood GPx activity required 56 d to respond to supplementation in
comparison to the 28 d for whole blood Se. This delay is likely due to the time required
for the incorporation of GPx in recently formed red blood cells, which is dependent on
red blood cell turnover (Knight and Tyznik, 1990). At d 189 GPx activity was higher for
both SP and SS compared to AS. These results are in agreement with those of Calamari et
al. (2009b) who reported whole blood GPx activity of horses supplemented at 0.29 or
0.39 ppm to be higher when compared to horses receiving 0.085 or 0.182 ppm for 112 d.
At this time horses receiving 0.29 ppm as Se-yeast also had higher GPx activity than
horses receiving 0.29 ppm as sodium selenite. However, it was reported that a plateau
was not reached for GPx activity within the 112 d feeding period (Calamari et al., 2009b).
In the current study, a plateau was reached in GPx activity for the SS group between d
154 and 189, but not for the SP treatment which had higher GPx activity at d 189
compared to d 154. This suggests that maximum GPx activity was reached for SS, but not
SP, even though the supplementation rate was similar between these groups. As SP whole
blood Se concentration did reach a plateau one may hypothesize as to whether SP GPx

162
activity would have plateaued at a later time point or exceeded that of SS if the feeding
period was extended.
Whole blood GPx activity appeared to increase faster in SS than SP. The GPx
activity of SS was higher compared to AS at d 154, but similar between AS and SP.
Sodium selenite supplementation has been reported to be more effectively incorporated
into GPx than organic Se in finishing pigs as observed by a faster increase in GPx activity
(Mahan et al., 1999). However, the authors reported that this effect was more prominent
at lower levels of Se inclusion (0.05 and 0.10 ppm).
A strong correlation existed between whole blood Se concentration and GPx
activity during the repletion period (r = 0.82), similar to the correlation (r = 0.86)
reported by Calamari et al. (2009b). Within treatment the correlation between Se and
GPx for AS was weak and similar to the correlation observed during the depletion phase.
Throughout the study AS maintained an adequate Se status, while the other groups went
through a depletion phase, lowering Se stores as indicated by lower GPx activity.
Therefore, the lack of a strong correlation for AS may simply be the result of adequate Se
stores capable of buffering any change in whole blood Se or a narrow range of whole
blood Se and GPx values. The strong correlations observed for LS, SP and SS may be the
result of a lack of Se stores that can be used as alternate source of Se (e.g. muscle Se
stores) for GPx synthesis. Consequently a stronger correlation was observed between
whole blood Se and GPx activity.
The current Se requirement for horses is estimated at 1 mg Se per day for a 500
kg adult horse (NRC, 2007) or a dietary concentration of 0.1 ppm (assuming a dry matter

163
intake of 2% of BW). This requirement is estimated based on the studies conducted by
Stowe (1967) and Shellow et al. (1985), indicating no additional benefit to feeding higher
amounts of Se, based on plasma GPx response. Richardson et al. (2006) stated that a 56 d
supplementation period, comparing Zn-L-selenomethionine (total Se intake 5.1 mg Se/d)
and sodium selenite (total Se intake 4.7 mg/d) to a control (total Se intake 1.3 mg Se/d)
did not affect plasma, red blood cell or muscle GPx activity. The authors reported a trend
for the organic supplementation group to have a faster red blood cell GPx response within
the first 28 d but this was attributed to the response of a single horse within that
treatment. Similarly Karren et al. (2010) reported no difference in plasma GPx between
horses provided a total Se intake of 0.19 mg/kg (pasture) and intakes of 0.35 mg/kg DM
(pasture and grain), 0.49 mg/kg DM (pasture and Se-yeast) or 0.65 mg/kg DM (pasture,
grain and Se-yeast) for 110 d. In other species such as growing/finishing pigs a higher
serum GPx was reported when comparing Se intake of 0.15 or 0.3 ppm over 90 d, even
though the difference was small (Mahan and Peters, 2004). More recently it has been
suggested that the lack of detectable change in GPx activity in response to
supplementation levels above 0.1 ppm could be due to the shorter experimental periods
used in research trials, relative to the length of red blood cell turnover of the horse
(Richardson et al., 2006; Calamari et al., 2009b). In this current study, both depletion and
repletion phases exceeded red blood cell turnover (~150 d), and it was demonstrated that
a dietary Se intake of 0.3 ppm resulted in higher GPx activity, regardless of Se source,
when compared to a dietary Se intake of 0.12 ppm. In addition, maximum GPx activity
was achieved for SS between d 154 and 189. These results are in agreement with
Calamari et al. (2009b) who also reported higher GPx activity with higher Se intakes.

164
Although the current Se requirement of the horse is estimated at 0.1 mg/kg DM or 0.1
ppm, based on whole blood GPx activity in this study, horses may benefit from higher
dietary Se levels, especially horses in geographically low Se areas.
As stated warlier GPx is a component of the antioxidant mechanism of the body.
The antioxidant mechanism is complex, consisting of a range of different non-enzymatic
(vitamin E, vitamin C, carotenoids, ubiquinols, flavonoids, glutathione and uric acid) and
enzymatic (superoxide dismutase, catalase, GPx, thioredoxin system) antioxidants. When
working in unison the various components of the antioxidant system are capable of
preventing as well as repairing oxidative damage (Ji, 1999; Urso and Clarkson, 2003;
Surai, 2006; Battin and Brumaghim, 2009). A variety of different measures of antioxidant
capacity exist including oxygen radical absorbance capacity, trolox equivalent
antioxidant capacity assay and ferric reducing ability assay (Cao and Prior, 1998). Serum
or plasma antioxidant capacity is a variable that is frequently included in equine exercise
studies (Avellini et al., 1999; de Moffarts et al., 2005; Ogonski et al., 2008). Although the
horses were not exercised during this study, we were interested in determining if the
overall antioxidant capacity of the horses would be affected by low or high Se status.
Because of expected changes in GPx activity, we hypothesized that antioxidant status and
oxidative stress would be altered in response to this change in Se status. The lack of
response in TAC to change in Se status may suggest a lack of specificity of the assay to
account for the GPx - associated antioxidant capacity. However, it has been suggested
that GPx may only play a small role in the total cellular antioxidant system (Ho et al.,
1997), and based on these results the same may be true for the extracellular total
antioxidant system. Calamari et al. (2009a) measured the total plasma antioxidants in

165
lightly exercised horses on different dietary Se treatments using an assay that tests
antioxidant capacity via the addition of hypochlorous acid. In contrast to our studies they
reported lower total plasma antioxidants for the Se – yeast treatments compared to
sodium selenite, with a linear decrease as Se – yeast supplementation increased. The
authors hypothesized that this decrease in total plasma antioxidants was indicative of a
decrease in free radical formation likely due to an increase in chain breaking antioxidants
(e.g. thioredoxin system or phospholipid hydroperoxide GPx) not detected by their assay.
The difference in methods used to evaluate TAC between the current study and Calamari
et al. (2009a) makes it difficult to draw a direct comparison between the two studies.
Malondialdehyde is an end product of lipid peroxidation in biological membranes
(Urso and Clarkson, 2003; Ducharme et al., 2009). Therefore, serum MDA concentration
is frequently used as an indicator of oxidative stress, most commonly measured using the
TBARS assay, but also via HPLC and spectrophotometry (Urso and Clarkson, 2003). The
TBARS assay has been used to evaluate MDA as an indicator of oxidative stress in the
horse (Ducharme et al., 2009). Oxidative stress is normally a variable of interest in
exercise related studies because exercise has been shown to increase free radical
production (Ji, 1999). However, we were interested in evaluating oxidative stress in these
idle horses with low and high Se status to determine if low levels of GPx would impact
oxidative stress in non-exercising horses. The results indicated a higher MDA
concentration for the AS horses compared to the LS horses during the depletion phase
with an increase in MDA for both treatments over time. However, this MDA increase
was similar for both treatments and likely due to factors other than Se status. The MDA
concentrations measured during the repletion phase were higher than those measured

166
during the depletion phase, while the depletion values were similar to MDA
concentrations measured in exercising horses (Ducharme et al., 2009). The TBARS assay
can reportedly cross react with other saturated and unsaturated nonfunctional aldehydes
and carbohydrates, which may explain the overall higher values observed during the
repletion phase. Regardless though, Se status did not affect MDA concentration. Similar
to the TAC results, this lack of difference may indicate that the antioxidant mechanism
adjusted to account for the change in GPx activity.
It has been proposed that GPx prevents damage to phagocytic cells by
neutralizing high levels of H2O2 (Knight and Tyznik, 1990). Therefore we were interested
in determining the effect of Se status on lymphocyte and neutrophil numbers. A
preliminary study conducted in our laboratory found a higher number of lymphocytes in
horses of higher Se status (see Chapter 3). Similarly, Calamari et al. (2009a) reported a
trend for an effect of Se intake on lymphocyte numbers as a trend for a linear dose effect
on lymphocyte numbers. In contrast the current study indicated a trend for higher
lymphocyte numbers in the depleting LS group during the depletion phase. However, this
was not observed for the repletion period. Neutrophil numbers were not affected by Se
status during the depletion or repletion phase.
Vitamin E acts as a lipid soluble antioxidant, protecting cell membranes and
preventing lipid peroxidation (Ronéus et al., 1986). It has been suggested that Se may
have a sparing effect on vitamin E requirement, and as a consequence many studies have
been conducted in other species supplementing both vitamin E and Se (MacDonald et al.,
1976; Whanger et al., 1977; Scheideler et al., 2010; Tahmasbi et al., 2012). In horses,
serum vitamin E concentration is used as an indicator of vitamin E status. A vitamin E

167
concentration above 2 µg/mL is considered adequate, while 1.5 to 2 µg/mL is a marginal
status (NRC, 2007). Across the depletion and repletion period serum vitamin E ranged
from 1.9 to 8.1 µg/mL for samples from individual horses. The 1.9 µg/mL was the only
marginal value that was observed throughout the entire study. Across all other time points
the serum vitamin concentration for this specific horse ranged from 2.6 to 5.8 µg/mL.
Vitamin E supplementation has been reported to alleviate “selenium responsive
disorders” such as myopathies in horses and cattle or exudative diathesis in poultry
(Finch and Turner, 1996). Therefore, this synergistic relationship may explain the lack of
effect of Se status on the TAC, MDA and immune cell numbers. At the same time high
Se status did not improve MDA or TAC measurements over that of horses on adequate
Se diet.
Iodothyronine deiodinase (ID) is a selenoenzyme responsible for the conversion
of the pro-hormone thyroxine (T4) to its active form, triiodothyronine (T3) (Brown and
Arthur, 2001; Calamari et al., 2009b; Muirhead et al., 2010). Calculating the ratio
between T3 and T4 is thought to be a functional indicator of ID (Brown and Arthur,
2001; Calamari et al., 2009b). The current study found that the ratio of T3 to T4 was
unaffected by Se status although it did increase from the baseline to final time points of
both phases across all treatments. Thyroid hormones are essential to health as they are
involved in metabolism, growth and development. Based on in vitro studies, ID seems to
be more protected from Se deficiency than GPx (Köhrle, 2000). Calamari et al. (2009b)
reported a lack of effect of Se source or Se dose on plasma T3, T4 and the ratio of T3 to
T4. Muirhead et al. (2010) evaluated the Se, T3 and T4 levels in a group of horses in
Prince Edward Island and reported a correlation between T4 and Se levels, but not T3. In

168
contrast, Dalir-Naghadeh and Rezaei (2008) reported a lower T3 to T4 ratio in lambs
diagnosed with Se deficiency myopathy compared to healthy lambs. Although the LS
horses were of low Se status according to whole blood Se and GPx activity, no physical
signs of deficiency were observed. The lack of effect of Se status on this selenoenzyme in
our study may also suggest a higher priority of ID for available Se in the horse.
CONCLUSION
In conclusion, a higher Se intake (0.3 ppm of diet DM) provided over a longer
period of time does have an effect on GPx activity, increasing it above that of horses fed
just above the NRC requirement. This response should be a consideration when
formulating diets, especially for horses kept in geographically low Se areas as Se intake
from forage may be lower than anticipated. However, antioxidant status and serum MDA
were unaffected by change in GPx activity. Adequate vitamin E status may have played a
role in the lack of effect of low Se status on MDA and TAC variables. The importance of
high GPx levels in the antioxidant system may need to be further defined.
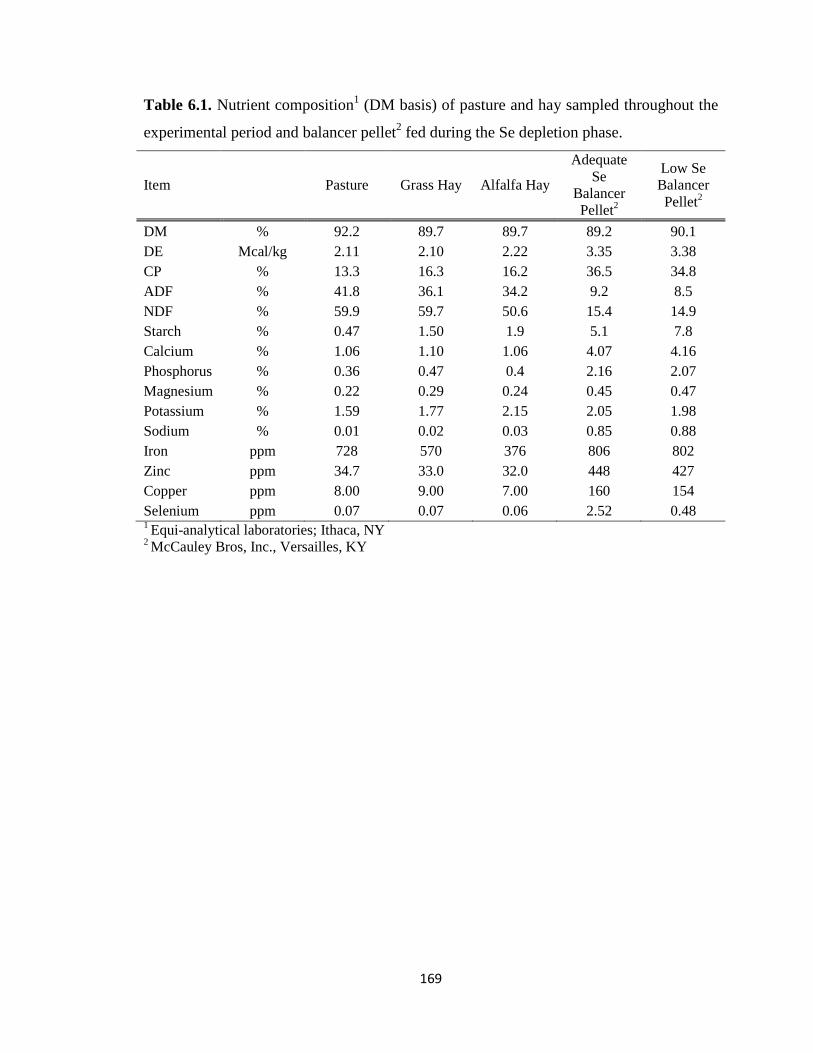
169
Table 6.1. Nutrient composition1 (DM basis) of pasture and hay sampled throughout the
experimental period and balancer pellet2 fed during the Se depletion phase.
Item Pasture Grass Hay Alfalfa Hay
Adequate Se
Balancer Pellet2
Low Se Balancer Pellet2
DM % 92.2 89.7 89.7 89.2 90.1 DE Mcal/kg 2.11 2.10 2.22 3.35 3.38 CP % 13.3 16.3 16.2 36.5 34.8 ADF % 41.8 36.1 34.2 9.2 8.5 NDF % 59.9 59.7 50.6 15.4 14.9 Starch % 0.47 1.50 1.9 5.1 7.8 Calcium % 1.06 1.10 1.06 4.07 4.16 Phosphorus % 0.36 0.47 0.4 2.16 2.07 Magnesium % 0.22 0.29 0.24 0.45 0.47 Potassium % 1.59 1.77 2.15 2.05 1.98 Sodium % 0.01 0.02 0.03 0.85 0.88 Iron ppm 728 570 376 806 802 Zinc ppm 34.7 33.0 32.0 448 427 Copper ppm 8.00 9.00 7.00 160 154 Selenium ppm 0.07 0.07 0.06 2.52 0.48 1 Equi-analytical laboratories; Ithaca, NY 2 McCauley Bros, Inc., Versailles, KY

170
Table 6.2. Example of the calculated total dietary Se intake1 for a 500 kg horse during
the depletion and repletion phase.
Depletion phase Repletion phase Se source LS AS LS AS SP SS
Pasture (mg) 0.56 0.56 0.56 0.56 0.56 0.56 Balancer pellet (mg) 0.17 0.86 0.16 0.86 0.16 0.16 Supplement (mg) * * * * 2.74 2.74 Total (mg) 0.73 1.42 0.72 1.42 3.46 3.46 Total (mg/kg DM) 0.063 0.12 0.062 0.12 0.30 0.30 1Total intake estimated at 2.25% of BW or 11.6 kg DM per day 2Dietary treatments: LS = low Se, AS = Adequate Se, SP = organic Se (Sel-Plex, Alltech Inc., Nicholasville, KY), SS = inorganic Se (sodium selenite)

171
Table 6.3. Nutrient composition1 (DM basis) of pasture and hay sampled throughout the
experimental period and balancer pellet2 fed during the Se repletion phase.
Item Pasture Grass Hay Alfalfa Hay
Adequate Se
Balancer Pellet2
Low Se Balancer Pellet2
DM % 87.6 92.1 91.2 89.2 90.9 DE Mcal/kg 2.33 2.24 2.22 3.35 3.37 CP % 24.2 21.6 15.8 36.5 36.9 ADF % 31.9 34.6 38.6 9.2 7.7 NDF % 49.3 53.6 49.6 15.4 14.7 Starch % 1.60 2.80 1.40 5.10 3.60 Calcium % 0.91 0.97 1.31 4.07 3.75 Phosphorus % 0.52 0.53 0.40 2.16 2.41 Magnesium % 0.33 0.40 0.20 0.45 0.44 Potassium % 2.84 2.75 2.97 2.05 2.14 Sodium % 0.14 0.26 0.05 0.85 0.84 Iron ppm 856 673 217 806 808 Zinc ppm 33.0 35.0 23.0 448 403 Copper ppm 9.00 9.00 8.00 160 144 Selenium ppm 0.06 0.06 0.02 2.52 0.53 1 Equi-analytical laboratories, Ithaca, NY 2 McCauley Bros, Inc., Versailles, KY

172
Table 6.4. Whole blood Se concentration (ng/mL) and glutathione peroxidase activity
(mU/mg Hb) of mature horses during the depletion phase (LS Means).
Selenium Glutathione peroxidase
activity Time (d) LS1 AS1 LS AS
0 251.7aw 261.8aw 64.5aw 75.9bw 84 202.1ax 228.2ax 54.4ax 62.8bxy 140 173.5ay 205.2bxy 52.7ax 65.5bx 168 160.7ay 182.9ay 46.7ay 57.4bxy 196 165.1ay 211.8bx 43.1ay 55.5by
SEM 4.42 7.47 2.04 3.44 Main effect (P-values)
Treatment
<0.0001 <0.0001 Time
<0.0001 <0.0001
Treatment x time 0.0073 0.916 a,b means within row and variable lacking common superscripts differ, P < 0.0.5 w,x,y means within column lacking common superscripts differ, P < 0.05 1Dietary treatments (total dietary Se): LS = low Se (0.06 ppm DM); AS = Adequate Se (0.12 ppm DM)

173
Table 6.5. Change in total antioxidant capacity (TAC) and malondialdehyde (MDA)
concentration of horses during Se depletion phase (LS Means).
TAC (mM)1 MDA (µM)2 Treatment1 0 d 196 d SEM 0 d 154 d SEM LS 1.181 0.703 0.020 3.480 4.110 0.230 AS 1.118 0.729 0.034 4.520 4.940 0.397
Main effects (P-values) Main effects (P-values)
Treatment 0.7417 Treatment 0.0226
Time
<0.0001 Time
0.0408
Treatment x time 0.0740 Treatment x time 0.8307 1Dietary treatments (total dietary Se): LS = low Se (0.06 ppm DM); AS = Adequate Se (0.12 ppm DM)

174
Table 6.6. Change in lymphocyte and neutrophil numbers in horses during the depletion
phase1 (LS Means).
Lymphocyte (103) Neutrophil (103) Ratio Time (d) AS LS AS LS AS LS
0 2.82 3.53 4.13 4.94 1.48 1.503 56 2.83 2.97 4.66 4.85 1.73 1.716 84 2.32 2.74 4.34 4.51 1.94 1.754 112 2.52 3.00 4.02 4.32 1.65 1.545 140 2.46 3.00 3.81 3.93 1.65 1.377 168 2.41 3.02 4.01 4.61 1.70 1.594 196 2.33 2.84 5.63 5.32 2.47 2.043
SEM 0.27 0.16 0.39 0.23 0.220 0.130 Main effect (P-value)
Treatment 0.0573 0.2917 0.2736 Time 0.0005 <0.0001 <0.0001 Treatment x time 0.7527 0.3342 0.8379 1Dietary treatments (total dietary Se): LS = low Se (0.06 ppm DM); AS = Adequate Se (0.12 ppm DM)

175
Table 6.7. Whole blood Se concentration (ng/mL) measured throughout the repletion
phase (LS Means).
Time (d) Diet 0 28 56 154 189 SEM
LS 122.0aw 118.0aw 121.6aw 116.5aw 125.5aw 7.2 AS 185.9bw 179.4bx 182.9bw 184.5bw 194.5bw 6.8 SP 121.9aw 168.7bx 189.1by 255.4cz 254.8cz* 7.1 SS 127.0aw 175.3bx 195.0by 250.3cz 240.0cz* 7.2
Main effect (P-values) Treatment <0.0001 Time <0.0001 Treatment x time <0.0001
a,b means within column lacking common superscripts differ, P < 0.0.5 w,x,y means within row lacking common superscripts differ, P < 0.05 * trend to differ, P < 0.1 1Dietary treatments (total dietary Se): LS = low Se (0.06 ppm DM); AS = Adequate Se (0.12 ppm DM)
2Dietary treatments (total dietary Se): LS = low Se (0.06 ppm DM); AS = Adequate Se (0.12 ppm DM); SP = organic Se (0.3 ppm DM, Sel-Plex, Alltech Inc., Nicholasville, KY); SS = inorganic Se (0.3 ppm DM, sodium selenite)
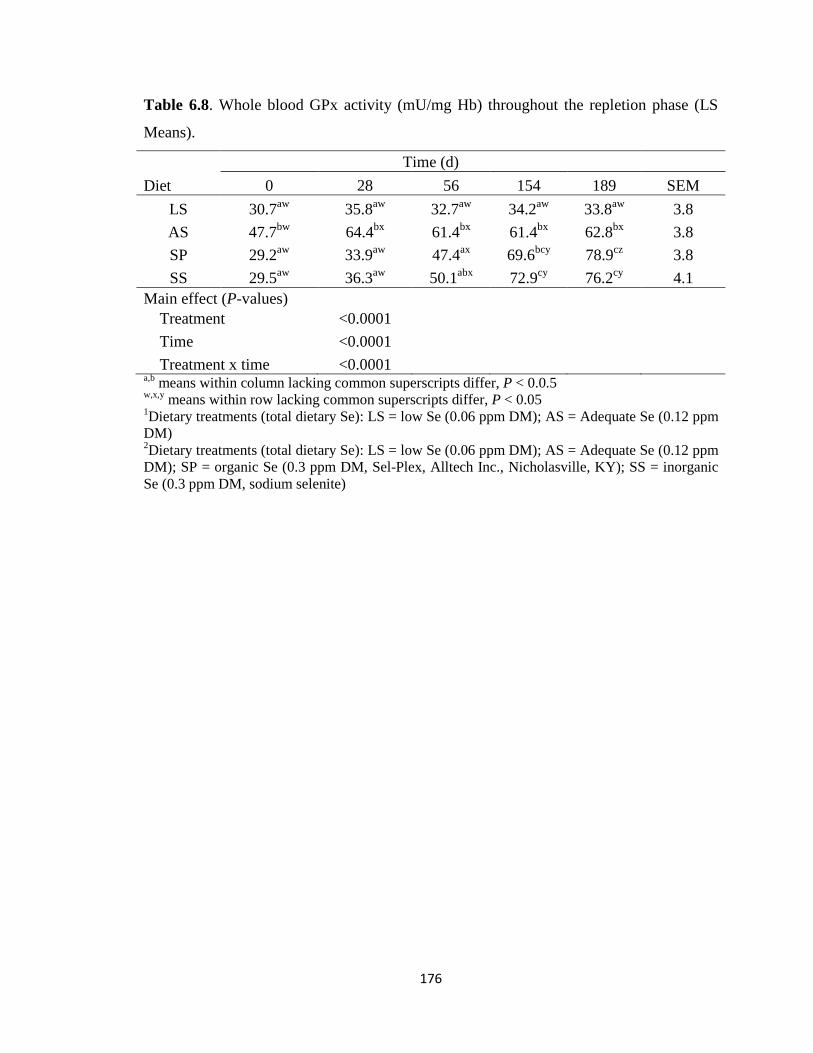
176
Table 6.8. Whole blood GPx activity (mU/mg Hb) throughout the repletion phase (LS
Means).
Time (d) Diet 0 28 56 154 189 SEM
LS 30.7aw 35.8aw 32.7aw 34.2aw 33.8aw 3.8 AS 47.7bw 64.4bx 61.4bx 61.4bx 62.8bx 3.8 SP 29.2aw 33.9aw 47.4ax 69.6bcy 78.9cz 3.8 SS 29.5aw 36.3aw 50.1abx 72.9cy 76.2cy 4.1
Main effect (P-values) Treatment <0.0001 Time <0.0001 Treatment x time <0.0001
a,b means within column lacking common superscripts differ, P < 0.0.5 w,x,y means within row lacking common superscripts differ, P < 0.05 1Dietary treatments (total dietary Se): LS = low Se (0.06 ppm DM); AS = Adequate Se (0.12 ppm DM)
2Dietary treatments (total dietary Se): LS = low Se (0.06 ppm DM); AS = Adequate Se (0.12 ppm DM); SP = organic Se (0.3 ppm DM, Sel-Plex, Alltech Inc., Nicholasville, KY); SS = inorganic Se (0.3 ppm DM, sodium selenite)

177
Table 6.9. Serum total antioxidant capacity (TAC) and malondialdehyde (MDA)
concentration of horses during the Se repletion phase (LS Means).
TAC (mM) MDA (µM) Treatment1 0 d 154 d SEM 0 d 154 d SEM LS 0.557 0.568 0.014 8.060 8.920 0.93 AS 0.528 0.550 0.013 8.160 8.150 0.87 SP 0.551 0.562 0.013 7.690 6.870 0.87 SS 0.553 0.573 0.014 8.000 7.925 0.93
Main effects Main effects
Treatment 0.1651 Treatment 0.7482
Time
0.1404 Time
0.9795
Treatment x time 0.7349 Treatment x time 0.6177 1Dietary treatments (total dietary Se): LS = low Se (0.06 ppm DM); AS = Adequate Se (0.12 ppm DM); SP = organic Se (0.3 ppm DM, Sel-Plex, Alltech Inc., Nicholasville, KY); SS = inorganic Se (0.3 ppm DM, sodium selenite)

178
Figure 6.1. Experimental design and treatment allocation during the depletion (196 d)
and repletion phase (189 d). 1 Se source: sodium selenite. Total calculated dietary Se intake: 0.12 ppm DM 2 Total calculated dietary Se intake: 0.06 ppm DM 3 Selplex®, Alltech Inc., Nicholasville, KY. Total calculated dietary Se intake: 0.3 ppm DM
4 Sodium selenite. Total calculated dietary Se intake: 0.3 ppm DM

179
Figure 6.2. Serum vitamin E concentration (µg/mL)1 throughout the depletion2 and
repletion3 phases 1Treatment P = 0.7455; time P = 0.0004; treatment x time P=0.8853. 2Dietary treatments (total dietary Se): LS = low Se (0.06 ppm DM); AS = Adequate Se (0.12 ppm DM)
3Dietary treatments (total dietary Se): LS = low Se (0.06 ppm DM); AS = Adequate Se (0.12 ppm DM); SP = organic Se (0.3 ppm DM, Sel-Plex, Alltech Inc., Nicholasville, KY); SS = inorganic Se (0.3 ppm DM, sodium selenite)
Copyright © Mieke Brummer 2012

180
CHAPTER 7: Effect of Selenium Status on the Response of Unfit Horses to Exercise
INTRODUCTION
Glutathione peroxidase (GPx) is a selenoenzyme associated with the antioxidant
mechanism. It regulates hydro peroxide levels inside the cell (Arthur, 1997; Ferguson and
Karunasinghe, 2011) by reducing hydrogen peroxide to water using glutathione as a
donor of reducing equivalents (Urso and Clarkson, 2003). Hydrogen peroxide is very
reactive and can also generate hydroxyl radicals, regarded as a harmful reactive oxygen
species (ROS) (Surai, 2006). During strenuous physical exercise the consumption of O2
increases dramatically. This increase in demand for O2 results in an increase in the
amount of ROS produced (Avellini et al., 1999; Ji, 1999). Under normal conditions the
antioxidant mechanism is capable of neutralizing the effect of ROS production, creating a
pro-/anti- oxidant balance within the body. With training the antioxidant mechanism
adjusts to maintain this balance (Yur et al., 2008). Vitamin E is another important
component of the antioxidant mechanism and is known to function in a synergistic
manner with Se. Vitamin E is lipophilic, and located in the cell membrane, where it acts
to protect against ROS damage (Ji, 1999), while Se contributes to the protection of cell
membranes from ROS damage via GPx (Surai, 2006).
The objective of this study was to evaluate the effect of selenium (Se) status and
low intensity exercise on unfit horses. We hypothesized that horses with low Se status
would not be able to recover as rapidly post exercise and that low Se status would lead to
higher ROS levels during and following exercise, resulting in an increase in serum
malondialdehyde (MDA) concentration, serum creatine kinase (CK), serum aspartate
aminotransferase (AST) and pro-inflammatory cytokine and granzyme B gene expression

181
in whole blood. Using these same indicators we hypothesized that the exercise would
have less of an impact on the horses of high Se status.
MATERIALS AND METHODS
Animals:
Twenty five horses, aged 7 to 23 yr, were used in this study and consisted of 7
geldings and 18 mares. The geldings included of 5 Thoroughbreds, 1 American Quarter
Horse and 1 Standardbred. The mares consisted of 17 Thoroughbreds and 1 American
Quarter Horse.
Experimental design, diets and housing:
The horses were blocked by age and gender, and randomly allocated within block
to one of 4 treatment groups so that each treatment group. The 4 treatment groups
included an adequate Se group (AS, n = 6; 0.12 ppm Se), a low Se group (LS, n = 6; 0.06
ppm Se), a high organic Se group (SP, Sel-Plex®, Alltech Inc., Nicholasville, KY; n = 7;
0.3 ppm Se) and a high inorganic Se group (SS, sodium selenite; n = 6; 0.3 ppm Se).
The horses received their respective dietary treatments for at least 29 wk prior to
the onset of the exercise test. During this period all horses were kept on pasture. The
horses allocated to LS, SP and SS received a custom formulated low Se balancer pellet
(0.53 ppm; LS, SP, SS; McCauley Bros Inc., Versailles, KY) while the horses allocated
to AS received an adequate Se balancer pellet (2.52 ppm; AS). The balancer pellets were
fed in individual feeding pens constructed for this purpose. The ingredient compositions
of the balancer pellets appear in Appendix A Table 4.a. while the nutrient compositions

182
appear in Table 7.1. In addition to the balancer pellet, the SP and SS horses received their
additional Se supplements top-dressed on the balancer pellets. As the Sel-plex product is
a yeast based product, and brewer’s yeast was used as carrier for the sodium selenite
supplement, brewer’s yeast alone was fed to the LS and AS horses to allow for a similar
brewer’s yeast intake between treatments, During the exercise test horses were kept on
the same balancer pellet/supplement feeding regime as the 29 wk before.
Total dietary Se intake was calculated (Table 7.2) and balanced on a per kg BW
basis for each horse. The total calculated Se intake for the LS group was 60% of the NRC
(2007) recommended amount of 1 mg Se per day for a 500 kg horse (approximately 0.1
ppm Se; DM basis), while horses in the AS group received a calculated total of 120% of
the recommended amount of Se. Horses in the SP and SS groups received 300% of the
NRC recommended amount of Se.
To accommodate all the horses on the study for the exercise test, and to maintain
accurate sampling times, the horses were divided into three groups and tested over a 3 wk
period (Table 7.3). All treatments were represented within each group. Five d prior to the
exercise test, the horses were moved to individual, partially covered pens (3 x 15 m) that
were more conveniently located with respect to the exercise equipment. The horses were
provided with the same grass hay that was fed during the preceding 29 wk on an ad
libitum basis. During the day (0800 h to 1600 h) horses were turned out on pasture. Due
to limited pasture availability hay was also provided ad libitum in the pasture.

183
Exercise test:
Prior to the exercise test horses were familiarized with the 6 horse exerciser
(Stratton Equine Enterprise Inc., Lexington, KY) to ensure that horses were able to
transition from walk to trot, trot to walk and reverse when asked to work in the opposite
direction. For the adaptation a light exercise protocol, consisting of a total of 8 min walk
and 2 min trot was used over a period of 3 days. Horses were not worked on the day
preceding the exercise test.
The exercise test consisted of 4 min walk (1.4 m/s); 4 min trot (2.9 m/s); reverse;
4 min walk (1.4 m/s); 4 min trot (2.9 m/s); reverse; 4 min walk (1.4 m/s); 4 min trot (2.9
m/s); reverse; 4 min walk (1.4 m/s); 4 min trot (2.9 m/s); 4 min walk (1.4 m/s). This
protocol allowed for a total of 20 min at a walk, covering 1.67 km, and 16 min at a trot
covering 2.74 km for a total distance of 4.41 km in 36 min.
Sampling protocol:
On the day before the exercise test all hay and feed was removed from the
individual pens at 1900 h. At 0700 h the next morning, pre-exercise blood samples were
collected. These samples included whole blood samples collected in lithium heparin
blood collection tubes (Becton Dickson, Franklin Lakes, NJ) for GPx analysis, blood
samples collected in untreated vacutainer tubes (Becton Dickson) for serum separation
and sodium fluoride (15 mg) potassium oxalate (12 mg) treated vacutainer tubes (Becton
Dickson) for plasma separation, and whole blood collected in PAXgene blood RNA tubes
(PreAnalytiX, Valencia, CA) for cytokine and granzyme B mRNA expression. After the
pre-exercise sample collection horses were provided with their balancer pellet and

184
supplements. The horses started the exercise test exactly 1 h after receiving their ration.
Horses were sampled immediately after the exercise test (as they left the exerciser; 0 h)
and at 4 and 24 h post exercise. Whole blood, serum and plasma samples were kept at -
80˙C until analysis while PAXgene blood samples were stored at -20˙C until analysis.
Selenium Status: Whole blood selenium and GPx activity
Whole blood Se concentration was determined by the Diagnostic Center for
Population and Animal Health (Michigan State University; Lansing, MI) by means of
inductively coupled plasma-mass spectroscopy.
Whole blood GPx activity was determined using the Bioxytech GPx-340 assay kit
(OXIS research, Portland, OR), based on the method developed by Paglia and Valentine
(1967). The GPx activity of each sample was calculated from the change in absorbance
and expressed as units of enzyme activity per mg haemoglobin (mU/mg Hb).
Haemoglobin was measured using a haemoglobin kit (Sigma, Saint Louis, MO).
Serum malondialdehyde concentration:
Serum malondialdehyde (MDA) concentration was measured using a
thiobarbituric acid reactive substances (TBARS) method (Caymenchemical; Ann Arbor,
MI). The method is based on the reaction of MDA with thiobarbituric acid under acidic,
high temperature conditions, using a MDA standard.
Whole blood cytokine mRNA expression:
In vivo mRNA expression of interferon gamma (IFNγ), tumor necrosis factor
alpha (TNFα), interleukin (IL) -1, IL-6 and granzyme B were assessed at pre-, 0 h post-,

185
4 h post- and 24 h post exercise. Total RNA was extracted using the PAXgene RNA
extraction kit (Qiagen, Valencia, CA), according to the manufacturer’s protocol. Reverse
transcription was conducted as described by Breathnach et al. (2006). Cytokine gene
expression was measured by means of RT-PCR (7900 HT Fast Real-Time PCR system,
Applied Biosystems, Foster City, CA) using equine specific intron spanning primer/probe
sets (Adams et al., 2009; Liburt et al., 2010; Saulez et al., 2010). Relative change in gene
expression was calculated as 2-ΔΔCT using the method described by Livak and Schmittgen
(2001). The average of the pre exercise time point served as calibrator. Beta-
glucuronidase was used as the internal control (Breathnach et al., 2006).
Serum creatine kinase (CK) and aspartate aminotransferase (AST):
Serum CK and AST was determined by a local equine hospital (Rood and Riddle
Equine Hospital, Lexington, KY). All 4 time points (pre-, 0 h post-, 4 h post- and 24 h
post exercise) were analysed for these two indicators of muscle damage.
Fasting insulin and glucose:
A solid phase 125I radio immunoassay (Coat-a-count; Siemens) was used to
determine insulin levels on the fasted pre-exercise time point. Glucose was analysed
using an automated method (Konelab Arena 20XTi; ThermoScientific, West Palm Beach,
FL; Thermotrace glucose hexokinase infinity reagent Konelab 301). A 1000 mg/dL
glucose stock (Fisher) was used to prepare the standard curve.

186
Statistical analysis:
Data were analysed as a repeated measures design using the Proc Mixed function
of SAS 9.2 (SAS Institute Inc., Cary, NC) with least square means separation procedure.
The model included time, treatment and group as fixed effects, while horse was included
as a random effect. Data were tested for normality, and log transformed when required
for statistical analysis. When applicable, ANOVA procedure was used to evaluate data at
a single time point (insulin and glucose). Data were back transformed and are presented
as least squares means.
RESULTS
Prior to the exercise test whole blood Se concentration was higher for SP and SS
compared to AS, and higher for AS than LS (P < 0.0001). Serum vitamin E concentration
was similar between treatments (P = 0.9876). Whole blood Se and vitamin E data are
presented in Table 7.4.
Whole blood GPx activity (Figure 7.1) was affected by treatment (P < 0.0001)
and a treatment x time interaction existed (P = 0.0318), but not by time (P > 0.05). Post
exercise GPx activity decreased for LS, and did not recover by 24 h. The GPx activity of
AS did not change post exercise. In response to exercise GPx activity increased in SP at 4
h, but returned to pre values by 24 h. In contrast, GPx activity decreased in SS,
recovering by 24 h.
Serum MDA concentration (Table 7.5) was not affected by treatment (P > 0.05)
but was affected by time (P < 0.0001) and a treatment x time (P = 0.0187) interaction

187
existed. At 24 h MDA concentration was higher compared to the pre exercise time point.
Upon separation of the means the only difference existed between AS and SP at the 4 h
time point with a lower MDA concentration for SP. In addition a positive correlation
existed between GPx activity and MDA at the 0 h time point (r = 0.46; P = 0.0198). This
correlation did not exist at the other time points.
Whole blood mRNA expression of granzyme B and TNFα were not affected by
Se status, but did change in response to exercise (Table 7.6). The expression of granzyme
B increased immediately following exercise (0 h) followed by a decrease to below pre-
exercise values at 4 and 24 h post exercise. Immediately post exercise (0 h) TNFα
expression decreased to below the pre exercise value. At 4 h TNFα expression was higher
compared to pre and 0 h, however, it was comparable to the pre-exercise time point at 24
h post exercise. Whole blood mRNA expression of IL-1 indicated a trend (treatment, P =
0.0629) for higher expression in SP compared to AS and LS. A trend also existed for IL-1
expression of SS to be higher than AS. The mRNA expression of IFNγ and IL-6 was not
affected by Se status or exercise.
Serum CK (Table 7.7) and AST (Table 7.8) were affected by time (P < 0.05).
Serum CK was higher immediately post exercise, compared to pre, 4 and 24 h post
exercise. Serum AST was decreased at 24 h compared to pre, 0 and 4 h post exercise. No
correlations existed between MDA and these indicators of muscle damage.
Fasted glucose and insulin levels (Table 7.9) were not affected by Se status (P >
0.05).

188
DISCUSSION
The exercise test was conducted following a 29 wk feeding period. Throughout
this period the LS group received a diet that was lower in Se than the current
recommendation of 1 mg Se/d for a 500 kg horse (NRC, 2007) with the intent to lower
the Se status of this group, while the dietary Se concentrations of the other treatment
groups were similar to or exceeded, this recommendation. Therefore, at the end of this
feeding period, the Se concentrations of LS fell below the whole blood Se reference
range of 180 to 240 ng/mL (Stowe, 1998), while the Se concentrations of AS fell within
this range. The Se concentration for SS was at the upper end of this reference range while
SP fell above this range. Serum samples taken at the same time for vitamin E analysis
indicated that all horses were of adequate vitamin E status, and no difference in serum
vitamin E existed among treatments. Because of the synergistic relationship between Se
and vitamin E (Ji, 1999) it was important to establish and consider vitamin E status of the
horses in this study for a more accurate assessment of the effect of Se status on the
variables of interest.
The response of GPx activity to exercise in the horse has been inconsistent. Some
studies report an increase in GPx activity (White et al., 2011), while others report a lack
of response (Brady et al., 1978). This inconsistent response of GPx to exercise has also
been reported in other species (Ji, 1999). When interpreting the change in GPx activity
for this current study it is important to keep in mind that, although statistically significant,
the numerical changes in GPx activity within each of the treatments were not large,
therefore the biological impact of these changes remain unclear. Regardless, the AS
group that served as control did not show any change in GPx activity at any time post
exercise. However, GPx activity decreased in LS without recovering over the 24 h period.

189
The inability of GPx to recover within the 24 h period may be reflective of depleted Se
stores, unable to restore GPx. In addition, GPx also acts as a storage pool of Se as each
GPx enzyme contains 4 Se-Cys residues (Brown and Arthur, 2001). Therefore if the
exercise increased the Se requirement for a different selenoprotein of higher importance
than GPx it may also impede the recovery of GPx activity post exercise. In that sense it
would have been interesting to assess the impact of repeated exercise bouts in this group
of low Se horses.
Although supplemented at a similar rate, the SP and SS groups had different post
exercise GPx activity responses. An increase in post exercise GPx activity was observed
for the SP group, peaking at 4 h and returning to baseline levels by 24 h. In contrast, SS
had a decrease in GPx activity, with the lowest activity value at 4 h, also returning to
baseline levels at 24 h. At the 4 h time point GPx in SS was still higher compared to AS.
Elevated GPx activity post exercise has been hypothesized to be indicative of an increase
in pro-oxidant scavenging activity (Hargreaves et al., 2002; Williams, 2010), while a
decrease in GPx activity post exercise is thought to be indicative of the saturation of
enzyme activity (Janiak et al., 2010). Exercise is associated with ROS production,
therefore GPx activity was expected to increase post exercise in response to elevated
ROS levels in an attempt to neutralise hydrogen peroxides, but to a lesser degree in the
low Se horses, due to lower Se stores. The increase in GPx in the SP group alone was
unexpected, however it is likely the desired response to prevent oxidative damge.
Some research has been done to evaluate the effect of higher Se intake levels in
response to exercise. White et al. (2011) supplemented 12 untrained Thoroughbreds with
sodium selenite at a rate of 0.1 (control) or 0.3 mg Se/kg DM for 34 d. The horses were

190
then subjected to a prolonged exercise test at submaximal activity with sampling points at
pre, 0, 6 and 24 h post exercise. Similar to our SS group, post exercise RBC GPx activity
was decreased in the 0.3 mg Se/kg group while RBC GPx of the control group only
decreased at the 6 h post exercise time point. Muscle GPx activity was elevated 6 h post
exercise in the 0.3 mg Se/kg group compared to baseline values, while it remained
unchanged in the control group.
The return of whole blood GPx to basal levels at 24 h in SS was potentially due to
restoring of GPx. The source of Se in the balancer pellet fed to the AS horses was also
sodium selenite, but the same changes was not observed for this group, indicating that
either the changes were too small to detect, or the observed changes for SS was the result
of the higher Se intake. Overall the whole blood GPx response observed for the SP group
was more comparable to the muscle GPx response observed by White et al. (2011) in
horses supplemented similar amounts of Se as sodium selenite. If the increase in GPx
activity post exercise does indicate an increase in ROS scavenging, this may be the most
desired response post exercise for increased protection against oxidative damage, while
the decrease in activity observed for SS may be less desired.
MDA is the end product of lipid peroxidation, initiated by cell membrane damage,
and may be used as an indicator of oxidative stress (Urso and Clarkson, 2003; Ducharme
et al., 2009). In the current study MDA increased over time and the 24 h MDA
concentration was higher compared to the pre exercise values, indicating that the exercise
test did result in increased oxidative stress. At 4 h the MDA concentration was lower for
SP compared to AS. This response coincided with the highest GPx activity for SP, which,
similarly, was also higher than the GPx activity of AS at 4 h. However, the only

191
correlation between GPx activity and MDA existed immediately post exercise. Ducharme
et al. (2009) measured plasma MDA in horses subjected to a stepwise exercise test and
found an increase in MDA in response to exercise, but the increase was noted during the
exercise phase and did not change during the recovery period.
In response to our mild exercise test both TNFα and granzyme B mRNA
expression were affected. Lymphocyte populations are reported to move into peripheral
blood in response to acute exercise, while intense exercise over a long period of time
results in a decrease in lymphocytes and increase in neutrophils. Similarly cytokine levels
are also affected by exercise (Pedersen and Toft, 2000). Exercise is reported to increase
ROS production which in turn activates nuclear factor kappa beta (NFκβ) (Peake et al.,
2007). The immune system requires NF-κβ to bind to DNA and activate the expression of
the genes that encode the proteins that are involved in the immune response (Maggini et
al., 2007) including the production of pro-inflammatory proteins such as TNFα and IL-6
(Duntas, 2009). NFκβ is therefore thought to regulate exercise induced cytokine
production (Peake et al., 2007). It is of interest that this is also one of the proposed
mechanisms through which Se is thought to affect the immune system. The
selenoenzyme GPx is hypothesized to reduce intracellular ROS levels which limits the
activation of NFκβ, and thereby regulates inflammatory protein production (Beck et al.,
2001; Zeng and Combs Jr, 2008; Duntas, 2009).
Colahan et al. (2002) reported no change in IL-1, IL-6 and TNFα expression in
leukocytes in response to exercise and attributed this to the exercise conditioned state of
the horses. Liburt et al. (2010) evaluated cytokine expression in muscle and whole blood
of unfit horses subjected to an incremental exercise test on a treadmill. They reported

192
blood IFNγ, TNFα, IL-1 to increase at 0 h, 6 h and 2 and 6 h respectively post exercise,
while IL-6 expression was only elevated in muscle. It was concluded that IL-6 response
may relate more to change in muscle metabolism than muscle damage itself (Liburt et al.,
2010). Similarly we did not observe a change in IL-6 expression. We did observe an
increase in TNFα at 4 h which may relate to the 6 h increase in TNFα observed by Liburt
et al. (2010). The expression of IL-1 was not affected by exercise but there was a trend
for it to be affected by treatment, being the highest in SP horses compared to LS and AS
and similar to SS. The cytokine IL-1 is associated with the inflammatory cascade,
although the impact of pro-inflammatory cytokines depends on the presence of anti-
inflammatory cytokines which suppress the pro-inflammatory cascade (Dinarello, 2000).
IL-1 also stimulates the expression of other cytokines such as IL-2 and IL-6, although
here IL-6 was similar across all treatments. In addition, some degree of inflammation has
been reported to contribute to exercise adaptation and protein synthesis (Liburt et al.,
2010).
Granzyme B is one of the mediators involved in the death of target cells, released
by cytotoxic cells such as lymphokine-activated killer (LAK) cells (Liu et al., 2011).
Horohov et al. (1996) reported an increase in LAK cell activity in horses following a
strenuous bout of exercise. The LAK cells are involved in immunological surveillance
and it was noted that this increase may provide additional protection from immune insult
(Horohov et al., 1996). Granzyme B has been shown to be associated with LAK cell
activity, and mRNA expression of granzyme B has been reported to be a useful indicator
of LAK cell activity (Liu et al., 2011). Our results showed that granzyme B expression
changed in response to the mild exercise test. Although our horses were unfit, the

193
changes observed in response to exercise, regardless of how mild it was, may be
indicative of the sensitivity of whole blood granzyme B expression to exercise stress.
Collectively the changes observed would suggest that even this mild exercise test
did result in a pro-inflammatory response, although this may in part be the result of the
unfit status of the horses.
Exercise induced oxidative stress has been thought to contribute to muscle
damage (de Moffarts et al., 2005). Therefore we also evaluated serum muscle enzymes
(CK and AST) as indicators of muscle damage. The Se status of the horses on our study
did not affect CK or AST. Both indicators indicated an overall change over time,
although it should be considered that these values still within or close to the reference
range used by Rood and Riddle Equine Hospital (Lexington, KY) of 50 to 250 U/L for
CK and 80 to 250 U/L for AST. Serum CK was elevated immediately post exercise, but
returned to baseline levels at 4 and 24 h. White et al. (2011) also reported an increase in
CK levels in response to the exercise but also observed no effect of Se treatment on CK.
In contrast, AST did not increase in response to exercise. A faster increase and decline in
CK, followed by a later peak in AST in response to exercise has been reported (Siciliano
et al., 1997), however, our results only conform to the CK response. In our study there
was no correlation between CK and MDA. A correlation between these variables has
been reported in human studies (Urso and Clarkson, 2003). Williams et al. (2004) used
plasma lipid hydro peroxide as an indicator of oxidative stress in endurance horses, and
reported a weak but positive correlation between lipid hydro peroxide and both CK and
AST. The lack of correlation observed for our study may simply relate to the small

194
increases observed for these indicators of muscle damage and the mild exercise that was
imposed.
Some reports have indicated that selenate had the ability to act as an insulin
mimic (Stapleton, 2000). In addition, a recent in vitro study using rat skeletal muscle
cells indicated that while sodium selenite delayed insulin signalling, the same effect was
not observed for the organic source of Se, selenomethionine (Pinto et al., 2011).
Therefore we were interested in determining if fasted glucose and insulin would differ
between the different Se treatments. However, no differences were detected for glucose
or insulin levels between treatments.
CONCLUSION
In conclusion, it appears that the source and level of Se intake may affect the post
exercise GPx response observed in unfit horses. Low Se status resulted in suppressed
GPx activity post exercise. Because most exercise studies are conducted using fit or
trained horses, the different responses observed in this study may be related to the level
of fitness of these horses, and the intensity of the exercise test. Yet, it may be more
representative of the non-competitive horse kept for recreational purposes who might
graze Se deficient pasture and receive variable levels of Se supplementation. In addition,
changes in MDA, TNFα and granzyme B indicate that the exercise did induce some
physiological changes. Based on the changes in whole blood GPx post exercise, organic
Se supplementation as Se-yeast may provide better protection against oxidative damage.
However, the limited changes observed for MDA, pro-inflammatory cytokines, CK and
AST suggest that overall Se status did not have a substantial impact on the ability of these
unfit horses to recover from mild exercise.

195
Table 7.1. Nutrient composition of the balancer pellet1 (DM basis) fed to mature horses
on a BW basis and hay1, provided ad libitum.
Item Adequate Se
Balancer Pellet2 Low Se
Balancer Pellet2 Hay
DM % 89.2 90.9 92.1 DE Mcal/kg 3.35 3.37 2.24 CP % 36.5 36.9 21.6 ADF % 9.2 7.7 34.6 NDF % 15.4 14.7 53.6 WSC % 13.8 13.9 6.3 ESC % 13.6 11.6 2.7 Starch % 5.1 3.6 2.8 NFC % 38.5 38.8 15.6 Calcium % 4.07 3.75 0.97 Phosphorus % 2.16 2.41 0.53 Magnesium % 0.45 0.44 0.4 Potassium % 2.05 2.14 2.75 Sodium % 0.85 0.84 0.26 Iron ppm 806 808 673 Zinc ppm 448 403 35 Copper ppm 160 144 9 Manganese ppm 389 383 108 Molybdenum ppm 5.3 4.4 0.4 Selenium ppm 2.52 0.53 0.06 1 Equi-analytical laboratories; Ithaca, NY 2 McCauley Bros, Inc., Versailles, KY
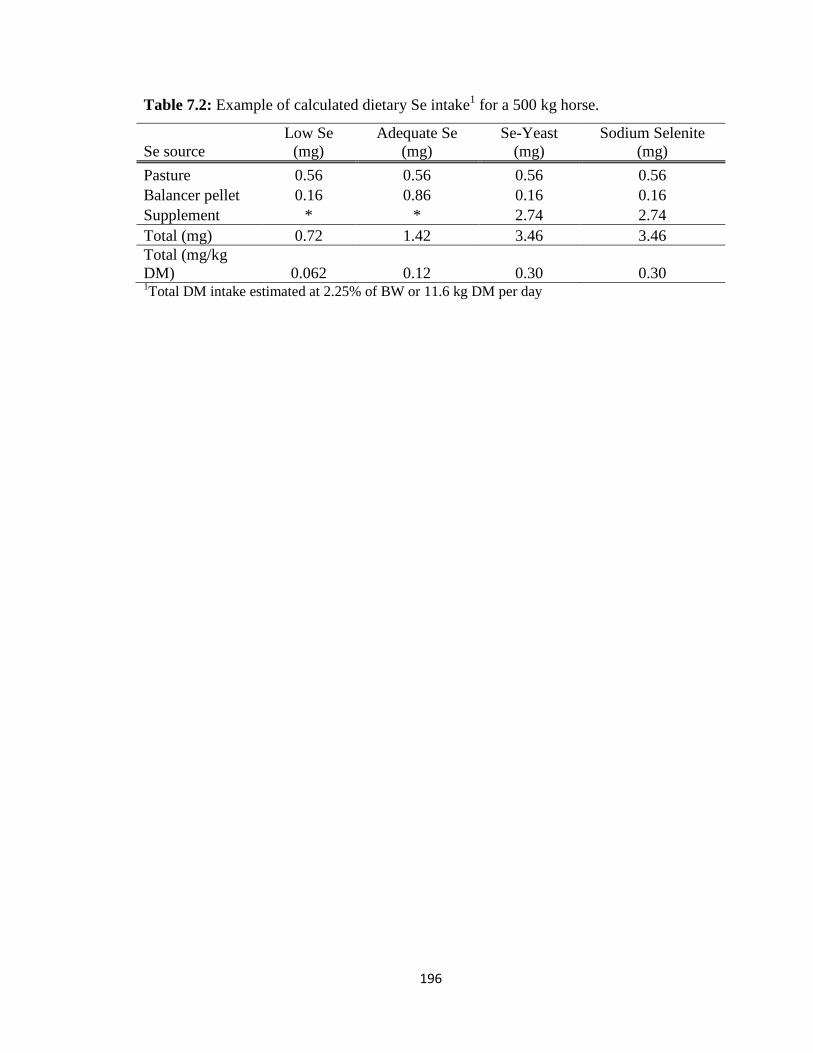
196
Table 7.2: Example of calculated dietary Se intake1 for a 500 kg horse.
Se source Low Se
(mg) Adequate Se
(mg) Se-Yeast
(mg) Sodium Selenite
(mg) Pasture 0.56 0.56 0.56 0.56 Balancer pellet 0.16 0.86 0.16 0.16 Supplement * * 2.74 2.74 Total (mg) 0.72 1.42 3.46 3.46 Total (mg/kg DM) 0.062 0.12 0.30 0.30 1Total DM intake estimated at 2.25% of BW or 11.6 kg DM per day

197
Table 7.3: Exercise test groups1 staggered over a 3 week period. Time # Horses Gender Age range
Group 1 Wk 1 7 Geldings 13-18 yr Group 2 Wk 2 12 Mares 7-14 yr Group 3 Wk 3 6 Mares 14-23 yr
1All treatments were represented in each group

198
Table 7.4. Whole blood Se and serum vitamin E concentrations in mature horses prior to
the exercise test.
Dietary treatments1 Variable LS AS SP SS P-value Selenium (ng/mL) 125.5±7.6a 195.4±7.0b 255.7±7.0c 240±7.5c <0.0001 Vitamin E (µg/mL) 3.62±0.5a 3.83±0.47a 3.76±0.47a 3.85±0.51a 0.9876
a,b,cMeans within row lacking a common superscript differ, P < 0.05 1Dietary treatments (total dietary Se concentration): LS = low Se (0.06 mg Se/kg DM); AS = Adequate Se (0.12 mg Se/kg DM); SP = organic Se (0.3 mg Se/kg DM, Sel-Plex, Alltech Inc., Nicholasville, KY); SS = inorganic Se (0.3 mg Se/kg DM, sodium selenite)

199
Table 7.5. Serum malondialdehyde (MDA, µM) concentrations in response to exercise in
horses of different Se status.
Time (h) post exercise Main effect (P-values) Diet1 Pre 0 4 24 SEM Treatment Time Treatment x time LS 6.7a 6.4a 5.8ab 8.9a 0.55 0.7813 <0.0001 0.0187 AS 6.2a 7.9ab 6.5a 9.1a 0.56
SP 6.2a 9.2b 4.6b 8.8a 0.51 SS 6.8a 7.6ab 5.6ab 8.9a 0.55
a,b means within column lacking a common superscript differ P < 0.05 1Dietary treatments (total dietary Se): LS = low Se (0.06 mg Se/kg DM); AS = Adequate Se (0.12 mg Se/kg DM); SP = organic Se (0.3 mg Se/kg DM, Sel-Plex, Alltech Inc., Nicholasville, KY); SS = inorganic Se (0.3 mg Se/kg DM, sodium selenite)

200
Table 7.6. Whole blood mRNA cytokine expression in response to exercise. Time (post exercise) Main effect (P-value)
Item Diet1 Pre 0 h 4 h 24 h SEM Treatment Time Treatment x Time GRZB2 LS 0.83 0.95 0.63 0.70 0.20 0.169 <0.0001 0.503
AS 1.12 1.39 0.83 0.83 0.20 SP 1.06 1.28 0.76 0.85 0.18 SS 1.47 1.85 1.06 1.12 0.20
TNFα LS 1.24 1.35 2.01 1.50 0.51 0.278 0.0004 0.256
AS 0.57 0.29 1.02 0.80 0.53 SP 1.87 1.57 2.16 1.99 0.48 SS 1.81 1.56 1.99 2.07 0.51
IFNγ LS 0.97 0.97 1.08 0.88 0.21 0.614 0.259 0.584
AS 1.10 0.77 0.80 0.81 0.22 SP 1.24 1.04 1.04 0.94 0.20 SS 1.16 1.30 1.22 1.13 0.21
IL-1 LS 0.94 0.91 1.03 0.95 0.14 0.063 0.209 0.993
AS 0.85 0.82 0.88 0.86 0.15 SP 1.24 1.18 1.29 1.19 0.13 SS 1.05 0.97 1.17 0.92 0.14
IL-6 LS 1.68 1.43 1.54 1.65 0.35 0.638 0.908 0.248
AS 1.05 1.08 0.86 0.99 0.36 SP 1.35 0.90 1.11 0.97 0.33 SS 0.91 1.26 1.62 1.17 0.35
1Dietary treatments (total dietary Se): LS = low Se (0.06 mg Se/kg DM); AS = Adequate Se (0.12 mg Se/kg DM); SP = organic Se (0.3 mg Se/kg DM, Sel-Plex, Alltech Inc., Nicholasville, KY); SS = inorganic Se (0.3 mg Se/kg DM, sodium selenite) 2GRZB = granzyme B

201
Table 7.7. Serum creatine kinase (CK, U/L) concentration in response to exercise. Time (h) post exercise Main effect (P-values) Diet1 Pre 0 4 24 SEM Treatment Time Treatment x time LS 221 229 231 217 34 0.675 0.0281 0.1635 AS 262 274 233 245 34
SP 244 328 247 215 32 SS 274 281 283 273 34
1Dietary treatments (total dietary Se): LS = low Se (0.06 mg Se/kg DM); AS = Adequate Se (0.12 mg Se/kg DM); SP = organic Se (0.3 mg Se/kg DM, Sel-Plex, Alltech Inc., Nicholasville, KY); SS = inorganic Se (0.3 mg Se/kg DM, sodium selenite)

202
Table 7.8. Change in serum aspartate aminotransferase (AST, U/L) in response to exercise in mature horses. Time (h) post exercise Main effect (P-values) Diet1 Pre 0 4 24 SEM Treatment Time Treatment x time LS 260 271 270 267 19.7 0.5927 0.0311 0.759 AS 297 303 286 279 20.3
SP 294 295 291 262 18.4 SS 303 307 308 284 19.7
1Dietary treatments (total dietary Se): LS = low Se (0.06 mg Se/kg DM); AS = Adequate Se (0.12 mg Se/kg DM); SP = organic Se (0.3 mg Se/kg DM, Sel-Plex, Alltech Inc., Nicholasville, KY); SS = inorganic Se (0.3 mg Se/kg DM, sodium selenite)

203
Table 7.9. Fasted insulin and glucose concentrations prior to the onset of the exercise
test.
Variable LS1 AS1 SP1 SS1 P-value Glucose (mg/dL) 89.1±1.3 88.59±1.3 88.22±1.2 86.1±1.3 0.3646 Insulin (uIU/mL) 7.15±1.7 8.47±1.7 6.56±1.6 7.9±1.7 0.8593 1Dietary treatments (total dietary Se): LS = low Se (0.06 mg Se/kg DM); AS = Adequate Se (0.12 mg Se/kg DM); SP = organic Se (0.3 mg Se/kg DM, Sel-Plex, Alltech Inc., Nicholasville, KY); SS = inorganic Se (0.3 mg Se/kg DM, sodium selenite)

204
Figure 7.1. Change1 in whole blood glutathione peroxidase activity (mU/mg hb) in
response to exercise in unfit horses on different dietary treatments2. 1Treatment P < 0.0001; time P = 0.7496; treatment x time P = 0.0318. 2Dietary treatments (total dietary Se): LS = low Se (0.06 mg Se/kg DM); AS = Adequate Se (0.12 mg Se/kg DM); SP = organic Se (0.3 mg Se/kg DM, Sel-Plex, Alltech Inc., Nicholasville, KY); SS = inorganic Se (0.3 mg Se/kg DM, sodium selenite)
Copyright © Mieke Brummer 2012

205
CHAPTER 8: Conclusions and Implications
The results from this research indicate that the Se status of the horse can be
manipulated through supplementation, affecting the traditional indicators of Se status,
whole blood Se concentration and GPx activity. In addition, Se supplementation at 0.3
ppm DM was demonstrated to increase GPx activity compared to horses fed 0.12 ppm
which is just above the NRC recommended level of 0.1 ppm DM. Similarly, the
difference in GPx activity between horses receiving 0.3 or 0.12 ppm DM was also
detectable post exercise. This suggests that both idle and exercising horses may benefit
from a higher level of supplementation than currently recommended. In terms of source
of Se, a trend existed for higher whole blood Se in the Se-yeast supplemented group after
a 189 d feeding period. The outcome of the exercise study also indicated that Se-yeast
resulted in a more favorable GPx response in comparison to sodium selenite at a similar
supplementation rate, although the physiological impact requires further investigation.
Change in Se status over the 18 mo study did not have an impact on TAC or oxidative
stress as measured by MDA concentration. The adequate vitamin E status of the horses
may have played a role in this finding, adjusting to account for Se deficiency.
The immune related results of our study indicated that initial humoral response
and some indicators of cell-mediated immunity were affected by low Se status. At the
time of the first vaccine challenge horses of low Se status exhibited a slower antibody
response to the first KLH vaccine and lower mRNA expression of transcription factor T-
bet in response to KLH stimulation compared to adequate Se horses. The humoral and
cell-mediated response to the OVA vaccine challenge was unaffected by low Se status. In

206
addition OVA did not result in a strong cell-mediated response. However, the non-
specific cell-mediated response to PMA stimulation was affected by Se status as the
expression of selected cytokines was suppressed in the low Se horses. This may imply
that the duration of Se deficiency affects the measured immune response. The humoral
response to OVA vaccination for horses receiving 0.3 ppm Se exceeded that of horses
receiving the NRC adequate Se diet although general cell mediated response was similar.
Therefore, it is not clear from our results whether immune function is improved by
feeding Se at levels above 0.12 ppm.
Collectively, it appears that the immune function of the horse is affected by Se
status, however, more so by low Se status than high Se status. Whole blood GPx activity
did indicate an advantage to feeding 0.3 ppm DM over lower levels of Se, and may be
especially important when formulating diets for horses in geographically low Se areas.
Copyright © Mieke Brummer 2012
207
LITERATURE CITED:
Adams, A. A., C. C. Breathnach, M. P. Katepalli, K. Kohler, and D. W. Horohov. 2008. Advanced age in horses affects divisional history of T cells and inflammatory cytokine production. Mechanism of Ageing and Development 129: 656-664.
Adams, A. A., M. P. Katepalli, K. Kohler, S. E. Reedy, J. P. Stilz, M. M. Vick, B. P. Fitzgerald, L. M. Lawrence, and D. W. Horohov. 2009. Effect of body condition, body weight and adiposity on inflammatory cytokine responses in old horses. Veterinary Immunology Immunopathology 127: 286-294.
Adams, A. A., T. L. Sturgill, C. C. Breathnach, T. M. Chambers, L. Siger, J. M. Minke, and D. W. Horohov. 2011. Humoral and cell-mediated immune responses of old horses following recombinant canarypox virus vaccination and subsequent challenge infection. Veterinary Immunology and Immunopathology 139: 128-140.
Akil, M., U. Gurbuz, M. Bicer, A. Sivrikaya, R. Mogulkoc, and A. Baltaci. 2011. Effect of selenium supplementation on lipid peroxidation, antioxidant enzymes, and lactate levels in rats immediately after acute swimming exercise. Biological Trace Element Research 142: 651-659.
Akira, S., S. Uematsu, and O. Takeuchi. 2006. Pathogen recognition and innate immunity. Cell 124: 783-801.
Arthur, J. R. 1997. Selenium proteins. Journal of Equine Veterinary Science 17: 422-423.
Arthur, J. R., R. C. McKenzie, and G. J. Beckett. 2003. Selenium in the immune system. The Journal of Nutrition 133: 1457S-1459S.
Avellini, L., E. Chiaradia, and A. Gaiti. 1999. Effect of exercise training, selenium and vitamin E on some free radical scavengers in horses (Equus caballus). Comparative Biochemistry and Physiology Part B: Biochemistry and Molecular Biology 123: 147-154.
Aziz, E. S., and P. H. Klesius. 1985. The effect of selenium deficiency in goats on lymphocyte production of leukocyte migration inhibitory factor. Veterinary Immunology and Immunopathology 10: 381-390.
Baalsrud, K. J., and G. Overnes. 1986. Influence of vitamin E and selenium supplement on antibody production in horses. Equine Veterinary Journal 18: 472-474.
Battin, E., and J. Brumaghim. 2009. Antioxidant activity of sulfur and selenium: A review of reactive oxygen species scavenging, glutathione peroxidase, and metal-binding antioxidant mechanisms. Cell Biochemistry and Biophysics 55: 1-23.
Beck, M. A. 2007. Selenium and vitamin E status: Impact on viral pathogenicity. The Journal of Nutrition 137: 1338-1340.

208
Beck, M. A., H. K. Nelson, Q. Shi, P. Van Dael, E. J. Schiffrin, S. Blum, D. Barclay, and O. A. Levander. 2001. Selenium deficiency increases the pathology of an influenza virus infection. The FASEB Journal 15: 1481-1483.
Biswas, A., J. Mohan, and K. V. Sastry. 2006. Effect of higher levels of dietary selenium on production performance and immune responses in growing Japanese quail. British Poultry Science 47: 511-515.
Blackmore, D. J., C. Campbell, C. Dant, J. E. Holden, and J. E. Kent. 1982. Selenium status of Thoroughbreds in the United Kingdom. Equine Veterinary Journal 14: 139-143.
Blecha, F. 1988. Immunomodulation: A means of disease prevention in stressed livestock. Journal of Animal Science 66: 2084-2090.
Brady, P. S., P. K. Ku, and D. E. Ullrey. 1978. Lack of effect of selenium supplementation on the response of the equine erythrocyte glutathione system and plasma enzymes to exercise. Journal of Animal Science 47: 492-496.
Breathnach, C. C., T. Sturgill-Wright, J. L. Stiltner, A. A. Adams, D. P. Lunn, and D. W. Horohov. 2006. Foals are interferon gamma-deficient at birth. Veterinary Immunology and Immunopathology 112: 199-209.
Broome, C. S., F. McArdle, J. A. M. Kyle, F. Andrews, N. M. Lowe, C. A. Hart, J. R. Arthur, and M. J. Jackson. 2004. An increase in selenium intake improves immune function and poliovirus handling in adults with marginal selenium status. American Journal of Clinical Nutrition 80: 154-162.
Brown, K. M., and J. R. Arthur. 2001. Selenium, selenoproteins and human health: a review. Public Health Nutrition 4: 593-599.
Brummer, M., S. Hayes, S. M. McCown, A. A. Adams, D. W. Horohov, and L. M. Lawrence. 2011. Selenium Depletion Reduces Vaccination Response in Horses. Journal of Equine Veterinary Science 31: 266.
Brummer, M., J. E. Ringler, A. G. Parks, S. Hayes, A. A. Adams, D. W. Horohov, and L. M. Lawrence. 2009. Selenium Status and Equine Immune Function. Journal of Equine Veterinary Science 29: 362-363.
Calamari, L., F. Abeni, and G. Bertin. 2010. Metabolic and hematological profiles in mature horses supplemented with different selenium sources and doses. Journal of Animal Science 88: 650-659.
Calamari, L., F. P. Cappelli, S. Care, and G. Bertin. 2009a. Effect of Se source and dose on selenomethionine and selocysteine levels in blood and plasma of mature horses. Italian Journal of Animal Science 8: 694-696.
209
Calamari, L., F. P. Cappelli, A. Ferrari, and G. Bertin. 2007. Glutathione peroxidase responses in mature horses following the withdrawal of an organic selenium supplement. Italian Journal of Animal Science 6: 275-277.
Calamari, L., A. Ferrari, and G. Bertin. 2009b. Effect of selenium source and dose on selenium status of mature horses. Journal of Animal Science 87: 167-178.
Calder, P. C. 2007. Immunological parameters: What do they mean? The Journal of Nutrition 137: 773S-780S.
Cao, G., and R. L. Prior. 1998. Comparison of different analytical methods for assessing total antioxidant capacity of human serum. Clinical chemistry 44: 1309 - 1315.
Cao, Y. Z., J. F. Maddox, A. M. Mastro, R. W. Scholz, G. Hildenbrandt, and C. C. Reddy. 1992. Selenium deficiency alters the lipoxygenase pathway and mitogenic response in bovine lymphocytes. The Journal of Nutrition 122: 2121-2127.
Chinen, J., F. Finkelman, and W. T. Shearer. 2006. Advances in basic and clinical immunology. Journal of Allergy and Clinical Immunology 118: 489-495.
Colahan, P. T., C. Kollias-Baker, C. M. Leutenegger, and J. H. Jones. 2002. Does training affect mRNA transciption for cytokine production in circulating leucocytes? Equine Veterinary Journal 34: 154-158.
Combs, G. F. 2001. Selenium in global food systems. British Journal of Nutrition 85: 517-547.
Conrad, M., and U. Schweizer. 2010. Unveiling the molecular mechanisms behind selenium-related diseases through knockout mouse studies. Antioxidants and Redox Signaling 12: 851-861.
Dalir-Naghadeh, B., and S. A. Rezaei. 2008. Assessment of serum thyroid hormone concentrations in lambs with seleium deficiency myopathy. American Journal of Veterinary Research 69: 659-663.
de Moffarts, B., N. Kirschvink, T. Art, J. Pincemail, and P. Lekeux. 2005. Effect of oral antioxidant supplementation on blood antioxidant status in trained thoroughbred horses. The Veterinary Journal 169: 65-74.
Deagen, J. T., J. A. Butler, M. A. Beilstein, and P. D. Whanger. 1987. Effects of dietary selenite, selenocystine and selenomethionine on selenocysteine lyase and glutathione peroxidase activities and on selenium levels in rat tissues. The Journal of Nutrition 117: 91-98.
Deaton, C. M., D. J. Marlin, C. A. Roberts, N. Smith, P. A. Harris, F. J. Kelly, and R. C. Schroter. 2002. Antioxidant supplementation and pulmonary function at rest and exercise. Equine Veterinary Journal 34: 58-65.

210
Desta, B., G. Maldonado, H. Reid, B. Puschner, J. Maxwell, A. Agasan, L. Humphreys, and T. Holt. 2011. Acute selenium toxicosis in polo ponies. Journal of Veterinary Diagnostic Investigation 23: 623-628.
Dinarello, C. A. 2000. Proinflammatory Cytokines. Chest 118: 503-508.
Ducharme, N. G., L. A. Fortier, M. S. Kraus, S. Hobo, H. O. Mohammed, M. P. McHugh, R. P. Hackett, L. V. Soderholm, and L. M. Mitchell. 2009. Effect of a tart cherry juice blend on exercise-induced muscle damage in horses. American Journal of Veterinary Research 70: 758-763.
Dunstan, J. A., L. Breckler, J. Hale, H. Lehmann, P. Franklin, G. Lyonso, S. Y. L. Ching, T. A. Mori, A. Barden, and S. L. Prescott. 2006. Associations between antioxidant status, markers of oxidative stress and immune responses in allergic adults. Clinical & Experimental Allergy 36: 993-1000.
Duntas, L. H. 2009. Selenium and Inflammation: Underlying anti-inflammatory mechanisms. Hormone and Metabolic Research 41: 443-447.
Edmonds, J. D., D. W. Horohov, M. R. Chapman, S. S. Pourciau, K. Antoku, K. Snedden, and T. R. Klei. 2001. Altered immune responses to a heterologous protein in ponies with heavy gastrointestinal parasite burdens. Equine veterinary journal 33: 658-663.
Farrar, J. J., W. R. Benjamin, M. L. Hilfiker, M. Howard, W. L. Farrar, and J. Fuller-Farrar. 1982a. The biochemistry, biology and role of Interleukin 2 in the induction of cytotoxic T cell and antibody-forming B cell responses. Immunological Review 63: 129-166.
Farrar, J. J., W. R. Benjamin, M. L. Hilfiker, M. Howard, W. L. Farrar, and J. Fuller-Farrar. 1982b. The biochemistry, biology and role of Interleukin 2 in the induction of cytotoxic T cell and antibody-forming B cell responses. . Immunological Review 63: 129-166.
Ferguson, L. R., and N. Karunasinghe. 2011. Nutrigenetics, nutrigenomics and selenium. Frontiers in Genetics 2: 1-10.
Finch, J. M., and R. J. Turner. 1996. Effects of selenium and vitamin E on the immune responses of domestic animals. Research in Veterinary Science 60: 97-106.
Fraker, P. 1994. Nutritional immunology: Methodological considerations. Journal of Nutritional Immunology 2: 87-92.
Goldsby, R. A., T. J. Kindt, and B. A. Osborne. 2000. Kuby immunology. 4th ed. W.H. Freemand and company, United States of America.
Goldson, A. J., S. J. Fairweather-Tait, C. N. Armah, Y. Bao, M. R. Broadley, J. R. Dainty, C. Furniss, D. J. Hart, B. Teucher, and R. Hurst. 2011. Effects of

211
selenium supplementation on selenoprotein gene expression and response to influenza vaccine challenge: A randomised controlled trial. PLoS ONE 6: e14771.
Gondim, F. J., C. C. Zoppi, L. dos Reis Silveira, L. Pereira-da-Silva, and D. Vaz de Macedo. 2009. Possible relationship between performance and oxidative stress in endurance horses. Journal of Equine Veterinary Science 29: 206-212.
Greiwe-Crandell, K. M., G. A. Morrow, and D. S. Kronveld. 1993. Phosphorus and selenium depletion in thoroughbred mares and weanlings. In: 13th Equine nutrition and physiology society symposium p39-41.
Gromadzinska, J., E. Reszka, K. Bruzelius, W. Wasowicz, and B. Akesson. 2008. Selenium and cancer: biomarkers of selenium status and molecular action of selenium supplements. European Journal of Nutrition 47 Suppl 2: 29-50.
Haggett, E., K. G. Magdesian, J. Maas, B. Puschner, J. Higgins, and C. Fiack. 2010. Whole blood selenium concentrations in endurance horses. The Veterinary Journal 186: 192-196.
Hargreaves, B. J., D. S. Kronfeld, J. N. Waldron, M. A. Lopes, L. S. Gay, K. E. Saker, W. L. Cooper, D. J. Sklan, and P. A. Harris. 2002. Antioxidant status and muscle cell leakage during endurance exercise. Equine Veterinary Journal 34: 116-121.
Hesketh, J. 2008. Nutrigenomics and selenium: Gene expression patterns, physiologcal targets, and genetics. Annual Review of Nutrition 28: 157-177.
Hintz, H. F. 1999. The many phases of selenium. In: Kentucky Equine Research Nutrition Conference for Feed Manufacturers. p 87-93.
Ho, Y., J. Magnenat, R. T. Bronsoni, J. Cao, M. Gargano, M. Sugawara, and C. D. Funk. 1997. Mice deficient in cellular glutathione peroxidase develop normally and show no increased sensitivity to hyperoxia. Journal of Biological Chemistry 272: 16644–16651.
Hoffmann, F. W., A. C. Hashimoto, L. A. Shafer, S. Dow, M. J. Berry, and P. R. Hoffmann. 2010. Dietary selenium modulates activation and differentiation of CD4+ T cells in mice through a mechanism involving cellular free thiols. The Journal of Nutrition 140: 1155-1161.
Hoffmann, P. 2007. Mechanisms by which selenium influences immune responses. Archivum Immunologiae et Therapiae Experimentalis 55: 289-297.
Hoffmann, P. R., and M. J. Berry. 2008. The influence of selenium on immune responses. Molecular Nutrition & Food Research 52: 1273-1280.
Horohov, D. 2003. Equine cytokines: Past, present and future. Journal of Equine Veterinary Science 23: 331-332.

212
Horohov, D., T. L. Keadle, S. S. Pourciau, M. A. Littlefield-Chabaud, S. G. Kamerling, M. L. Keowen, D. D. French, and P. A. Melrose. 1996. Mechanism of exercise-induced augmentation of lymphokine activated killer (LAK) call activity in the horse. Veterinary Immunology and Immunopathology 53: 221-233.
Horohov, D. W., C. C. Breathnach, T. L. Sturgill, C. Rashid, J. L. Stiltner, D. Strong, N. Nieman, and R. E. Holland. 2008. In vitro and in vivo modulation of the equine immune response by parapoxvirus ovis. Equine Vet J 40: 468-472.
Iwasaki, A., and R. Medzhitov. 2010. Regulation of adaptive immunity by the innate immune system. Science 327: 291-295.
Janiak, M., M. Suska, W. Dudzińska, and E. Skotnicka. 2010. Blood glutathione status and activity of glutathione-metabolizing antioxidant enzymes in erythrocytes of young trotters in basic training. Journal of Animal Physiology and Animal Nutrition 94: 137-145.
Janicki, K. M. 2001. The effect of dietary selenium source and level on broodmares and their foals. M.S. Thesis, University of Kentucky, Lexington, KY.
Jenkins, M. K., A. Khoruts, E. Ingulli, D. I. Mueller, S. J. McSorley, R. L. Reinhardt, A. Itano, and K. A. Pape. 2001. In vivo activation of antigen-specific CD4 T cells. Annual Review of Immunology 19: 23-45.
Ji, L. L. 1999. Antioxidants and oxidative stress in exercise. Proc for Experimental Biology and Medicine. Society for Experimental Biology and Medicine (New York, N.Y.) 222: 283-292.
Ji, L. L., D. A. Dillon, K. D. Bump, and L. M. Lawrence. 1990. Antioxidant enzyme response to exercise in equine erythrocytes. Journal of Equine Veterinary Science 10: 380-383.
Juniper, D. T., R. H. Phipps, E. Ramos-Morales, and G. Bertin. 2008. Effect of dietary supplementation with selenium - enriched yeast or sodium selenite on selenium tissues distributionand meat quality in beef cattle. Journal of Animal Science 86: 3100-3109.
Kaiko, G. E., J. C. Horvat, K. W. Beagley, and P. M. Hansbro. 2008. Immunological decision-making: how does the immune system decide to mount a helper T-cell response? Immunology 123: 326-338.
Karren, B. J., J. F. Thorson, C. A. Cavinder, C. J. Hammer, and J. A. Coverdale. 2010. Effect of selenium supplementation and plane of nutrition on mares and their foals: selenium concentrations and glutathione peroxidase. Journal of Animal Science 88: 991-997.

213
Kiremidjian-Schumacher, L., M. Roy, H. Wishe, M. Cohen, and G. Stotzky. 1994. Supplementation with selenium and human immune cell functions. Biological Trace Element Research 41: 115-127.
Knight, D. A., and W. J. Tyznik. 1990. The effect of dietary selenium on humoral immunocompetence of ponies. Journal of Animal Science 68: 1311-1317.
Köhrle, J. 2000. The deiodinase family: selenoenzymes regulating thyroid hormone availability and action. Cellular and Molecular Life Sciences 57: 1853-1863.
Koller, L. D., and J. D. Exon. 1986. The two faces of selenium deficiency and toxicity are similar in animals and man. Canadian Veterinary Journal 50: 297-306.
Kubota, J., W. H. Allaway, D. L. Carter, E. E. Gary, and V. A. Lazar. 1967. Selenium in crops in the United States in relation to selenium-responsive diseases of animals. Journal of Agricultural and Food Chemistry 15: 448-453.
Kumar, N., A. K. Garg, R. S. Dass, V. K. Chaturvedi, V. Mudgal, and V. P. Varshney. 2009. Selenium supplementation influences growth performance, antioxidant status and immune response in lambs. Animal Feed Science and Technology 153: 77-87.
Lee, C.-Y., and J. Wan. 2002. Immunoregulatory and antioxidant performance of α-tocopherol and selenium on human lymphocytes. Biological Trace Element Research 86: 123-136.
Lee, J., E. S. McAllister, and R. W. Scholtz. 1995. Assessment of selenium status in mares and foals under pratical management conditions. Journal of Equine Veterinary Science 15: 240-245.
Lei, X. G., W. Cheng, and J. P. McClung. 2007. Metabolic regulation and function of glutathione peroxidase. Annual Review of Nutrition 27: 41-61.
Lessard, M., W. C. Yang, G. S. Elliott, A. H. Rebar, J. F. Van Vleet, N. Deslauriers, G. J. Brisson, and R. D. Schultz. 1991. Cellular Immune responses in pigs fed a vitamin E - and selenium-deficient diet. Journal of Animal Science 69: 1575-1582.
Li, W., and M. A. Beck. 2007. Selenium deficiency induced an altered immune response and increased survival following influenza A/Puerto Rico/8/34 infection. Experimental Biology and Medicine 232: 412-419.
Liburt, N. R., A. A. Adams, A. Betancourt, D. W. Horohov, and K. H. McKeever. 2010. Exercise-induced increases in inflammatory cytokines in muscle and blood of horses. Equine Veterinary Journal 42: 280-288.
Liu, C., A. Betancourt, D. A. Cohen, A. A. Adams, L. Sun, and D. W. Horohov. 2011. Granzyme B-mRNA expression by equine lymphokine activated killer (LAK)

214
cells is associated with the induction of apoptosis in target cells. Veterinary Immunology and Immunopathology 143: 108-115.
Livak, K. J., and T. D. Schmittgen. 2001. Analysis of relative gene expression data using real-time quantitative PCR and the 2(-Delta Delta C(T)) method. Methods 25: 402-408.
Ludvíková, E., L. Pavlata, M. Vyskočil, and P. Jahn. 2005. Selenium status of horses in the czech republic. Acta Veterinaria Brno 74: 369-375.
MacDonald, D. W., R. G. Christian, G. R. Whenham, and J. Howell. 1976. A review of some aspects of vitamin E-selenium responsive diseases with a note on their possible incidence in Alberta. Canadian Veterinary Journal 17: 61-71.
Maggini, S., E. S. Wintergerst, S. Beveridge, and D. H. Hornig. 2007. Selected vitamins and trace elements support immune function by strengthening epithelial barriers and cellular and humoral immune responses. British Journal of Nutrition 98: S29-S35.
Mahan, D. C., T. R. Cline, and B. Richert. 1999. Effects of dietary levels of selenium-enriched yeast and sodium selenite as selenium sources fed to growing-finishing pigs on performance, tissue selenium, serum glutathione peroxidase activity, carcass characteristics, and loin quality. Journal of Animal Science 77: 2172-2179.
Mahan, D. C., and J. C. Peters. 2004. Long-term effects of dietary organic and inorganic selenium sources and levels on reproducing sows and their progeny. Journal of Animal Science 82: 1343-1358.
Malá, S., F. Kovářů, Ľ. Mišurová, L. Pavlata, R. Dvořák, and M. Číž. 2009. Influence of selenium on innate immune response in kids. Folia Microbiologica 54: 545-548.
McFarlane, D., and T. C. Holbrook. 2008. Cytokine dysregulation in aged horses and horses with pituitary pars intermedia dysfunction. J Vet Intern Med 22: 436-442.
McKenzie, R. C., T. S. Rafferty, and G. J. Beckett. 1998. Selenium: an essential element for immune function. Immunology Today 19: 342-345.
Méplan, C., L. K. Crosley, F. Nicol, G. J. Beckett, A. F. Howie, K. E. Hill, G. Horgan, J. C. Mathers, J. R. Arthur, and J. E. Hesketh. 2007. Genetic polymorphisms in the human selenoprotein P gene determine the response of selenoprotein markers to selenium supplementation in a gender-specific manner (the SELGEN study). The FASEB Journal 21: 3063-3074.
Meydani, S., M. Barklund, S. Liu, M. Meydani, R. Miller, J. Cannon, F. Morrow, R. Rocklin, and J. Blumberg. 1990. Vitamin E supplementation enhances cell-mediated immunity in healthy elderly subjects. The American Journal of Clinical Nutrition 52: 557-563.

215
Montgomery, J. B., J. J. Wichtel, M. G. Wichtel, M. A. McNiven, and J. T. McClure. 2011. The efficacy of selenium treatment of forage for the correction of selenium deficiency in horses. Animal Feed Science and Technology 10.1016/j.anifeedsci.2011.07.018.
Montgomery, J. B., J. J. Wichtel, M. G. Wichtel, M. A. McNiven, J. T. McClure, F. Markham, and D. W. Horohov. 2012. The effects of selenium source on measures of selenium status of mares and selenium status and immune function of their foals. Journal of Equine Veterinary Science.
Muirhead, T. L., J. J. Wichtel, H. Stryhn, and J. T. McClure. 2010. The selenium and vitamin E status of horses in Prince Edward Island. Canadian Veterinary Journal 51: 979-985.
Nemec, M., M. Hidiroglou, K. Nielsen, and J. Proulx. 1990. Effect of vitamin E and selenium supplementation on some immune parameters following vaccination against brucellosis in cattle. Journal of Animal Science 68: 4303-4309.
Néspoli, P. B., M. D. Duarte, P. S. Bezerra Jr, J. Döbereiner, and P. V. Peixoto. 2001. Clinical and pathological aspects of experimental poisoning by sodium selenite in horses. Pesquisa Veterinária Brasileira 21: 109-116.
Nicholson, J. W. G., R. S. Bush, and J. G. Allen. 1993. Antibody responses of growing beef cattle fed silage diets with and without selenium supplementation. Canadian Journal of Animal Science 73: 355-365.
NRC. 2007. National Research Council: Nutrient requirements of horses. 6th rev. ed. ed. The National Academies Press, Washington, DC.
Ogonski, T., R. Pikula, and G. Majewski. 2008. Blood plasma antioxidants and dehydration in three-month-long trained Standardbred trotters before and after an intensive race. Medycyna Wet. 64: 421-426.
Opal, S. M., and V. A. DePalo. 2000. Anti-inflammatory cytokines. Chest 117: 1162-1172.
Pagan, J. D., P. Karnezos, M. A. P. Kennedy, T. Currier, and K. E. Hoekstra. 1999. Effect of selenium source on selenium digestibility and retention in exercised thoroughbreds. In: Equine Nutrition and Physiology Society Symposium. p 135-140.
Paglia, D. E., and W. N. Valentine. 1967. Studies on the quantitative and qualitative characterization of erythrocyte glutathione peroxidase. . Journal of Laboratory and Clinical Medicine 70: 158-169.
Papp, L. V., J. Lu, A. Holmgren, and K. K. Khanna. 2007. From Selenium to Selenoproteins: Synthesis, Identity, and Their Role in Human Health. Antioxidants & Redox Signaling 9: 775-806.

216
Payne, R., and L. Southern. 2005. Comparison of inorganic and organic selenium sources for broilers. Poultry Science 84: 898-902.
Peake, J. M., K. Suzuki, and J. S. Coombes. 2007. The influence of antioxidant supplementation on markers of inflammation and the relationship to oxidative stress after exercise. The Journal of Nutritional Biochemistry 18: 357-371.
Pedersen, B. K., and A. D. Toft. 2000. Effects of exercise on lymphocytes and cytokines. British Journal of Sports Medicine 34: 246-251.
Peretz, A., J. Neve, J. Desmedt, J. Duchateau, M. Dramaix, and J. Famaey. 1991. Lymphocyte response is enhanced by supplementation of elderly subjects with selenium-enriched yeast. The American Journal of Clinical Nutrition 53: 1323-1328.
Petersson, K. H., D. B. Burr, M. Gomez-Chiarri, and C. S. Petersson-Wolfe. 2010. The influence of vitamin E on immune function and response to vaccination in older horses. Journal of Animal Science.
Petrie, H., L. Klassen, P. Klassen, J. O'Dell, and H. Kay. 1989. Selenium and the immune response: 2. Enhancement of murine cytotoxic T-lymphocyte and natural killer cell cytotoxicity in vivo. Journal of Leukocyte Biology 45: 215-220.
Pinto, A., B. Speckmann, M. Heisler, H. Sies, and H. Steinbrenner. 2011. Delaying of insulin signal transduction in skeletal muscle cells by selenium compounds. Journal of Inorganic Biochemistry 105: 812-820.
Pusterla, N., K. G. Magdesian, S. Mapes, and C. M. Leutnegger. 2006a. Expression of molecular markers in blood of neonatal foals with sepsis. American Journal of Veterinary Research 67.
Pusterla, N., W. D. Wilson, P. A. Conrad, S. Mapes, and C. M. Leutenegger. 2006b. Comparative analysis of cytokine gene expression in cerebrospinal fluid of horses without neurologic signs or with selected neurologic disorders. Am J Vet Res 67: 1433-1437.
Rayman, M. P. 2007. The use of high-selenium yeast to raise selenium status: how does it measure up? British Journal of Nutrition 92: 557.
Reffett, J. K., J. W. Spears, and T. T. Brown. 1988a. Effect of dietary selenium and vitamin E on the primary and secondary immune response in lambs challenged with parainfluenza3 virus. Journal of Animal Science 66: 1520-1528.
Reffett, J. K., J. W. Spears, and T. T. Brown. 1988b. Effect of dietary selenium on the primary and secondary immune response in calves challenged with infectious bovine rhinotracheitis virus. Journal of Nutrition 118: 229-235.

217
Richardson, S. M., P. D. Siciliano, T. E. Engle, C. K. Larson, and T. L. Ward. 2006. Effect of selenium supplementation and source on the selenium status of horses. Journal of Animal Science 84: 1742-1748.
Riihimaki, M., I. Lilliehook, A. Raine, M. Berg, and J. Pringle. 2008. Clinical alterations and mRNA levels of IL-4 and IL-5 in bronchoalveolar cells of horses with transient pulmonary eosinophilia. Res Vet Sci 85: 52-55.
Ronéus, B. O., R. V. J. Hakkarainen, C. A. Lindholm, and J. T. Työppönen. 1986. Vitamin E requirements of adult standardbred horses evaluated by tissue depletion and repletion. Equine Veterinary Journal 18: 50-58.
Roy, M., L. Kiremidjian-Schumacher, H. Wishe, M. Cohen, and G. Stotzky. 1994. Supplementation with selenium and human immune cell functions 1. Effect on lymphocyte proliferation 2. Receptor expression. Biological Trace Element Research 41: 103-113.
Saito, Y., Y. Yoshida, T. Akazawa, K. Takahashi, and E. Niki. 2003. Cell death caused by selenium deficiency and protective effect of antioxidants. Journal of Biological Chemistry 278: 39428-39434.
Saulez, M. N., J. Godfroid, A. Bosman, J. L. Stiltner, C. C. Breathnach, and D. W. Horohov. 2010. Cytokine mRNA expressions after racing at a high altitude and at sea level in horses with exercise-induced pulmonary hemorrhage. American Journal of Veterinary Research 71: 447-453.
Scheideler, S. E., P. Weber, and D. Monsalve. 2010. Supplemental vitamin E and selenium effects on egg production, egg quality, and egg deposition of α-tocopherol and selenium. The Journal of Applied Poultry Research 19: 354-360.
Schrauzer, G. N. 2000. Selenomethionine: A review of its nutritional significance, metabolism and toxicity. Journal of Nutrition 130: 1653-1656.
Schwarz, K., and C. M. Foltz. 1957. Selenium as an intergral part of factor 3 against dietary necrotic liver degeneration. Journal of American Chemical Society 79: 3292-3293.
Shellow, J. S., S. G. Jackson, J. P. Baker, and A. H. Cantor. 1985. The influence of dietary selenium levels of selenium and glutathione peroxidase activity in the horse. Journal of Animal Science 61: 590-594.
Sheridan, P. A., N. Zhong, B. A. Carlson, C. M. Perella, D. L. Hatfield, and M. A. Beck. 2007. Decreased selenoprotein expression alters the immune response during influenza virus infection in mice. The Journal of Nutrition 137: 1466-1471.
Shrimali, R. K., R. D. Irons, B. A. Carlson, Y. Sano, V. N. Gladyshev, J. M. Park, and D. L. Hatfield. 2008. Selenoproteins mediate T cell immunity through an antioxidant mechanism. Journal of Biological Chemistry 283: 20181-20185.

218
Siciliano, P. D., A. L. Parker, and L. M. Lawrence. 1997. Effect of dietary vitamin E supplementation on the integrity of skeletal muscle in exercised horses. Journal of Animal Science 75: 1553-1560.
Singh, H., S. Sodhi, and R. Kaur. 2006. Effects of dietary supplements of selenium, vitamin E or combinations of the two on antibody responses of broilers. British Poultry Science 47: 714-719.
Smarsh, D. N., N. Liburt, J. Streltsova, K. McKeever, and C. A. Williams. 2010. Oxidative stress and antioxidant status in intensely exercising horses administered nutraceutical extracts. Equine Veterinary Journal 42: 317-322.
Soboll Hussey, G., S. Hussey, B. Wagner, D. Horohov, G. Van de Walle, N. Osterrieder, L. Goehring, S. Rao, and D. Lunn. 2011. Evaluation of immune responses following infection of ponies with an EHV-1 ORF1/2 deletion mutant. Veterinary Research 42: 23.
Spencer, J. A., P. Deinnocentes, E. M. Moyana, A. J. Guarino, S. E. Ellison, R. C. Bird, and B. L. Blagburn. 2005. Cytokine gene expression in response to SnSAG1 in horses with equine protozoal myeloencephalitis. Clin Diagn Lab Immunol 12: 644-646.
Stapleton, S. R. 2000. Selenium: an insulin mimetic. Cellular and Molecular Life Sciences 57: 1874-1879.
Stowe, H. D. 1967. Serum selenium and related paramaters of naturally and experimentally fed horses. Journal of Nutrition 93: 60-64.
Stowe, H. D. 1998. Selenium supplementation for horse feed. Notingham University Press, Nottingham, UK.
Stowe, H. D., and T. H. Herdt. 1992. Clinical assessment of selenium status of livestock. Journal of Animal Science 70: 3928-3933.
Sturgill, T. L., and D. W. Horohov. 2010. Vaccination Response of Young Foals to Keyhole Limpet Hemocyanin: Evidence of Effective Priming in the Presence of Maternal Antibodies. 30: 359-364.
Sullivan, K. E., J. Cutilli, L. M. Piliero, G. Ghavimi-Alagha, S. E. Starr, D. E. Campbell, and S. D. Douglas. 2000. Measurement of cytokine secretion, intracellular protein expression, and mRNA in resting and stimulated peripheral blood mononuclear cells. Clinical and Diagnostic Laboratory Immunology 7: 920-924.
Surai, P. 2006. Selenium in nutrition and health. Nottingham University Press Nottingham, United Kingdom.
219
Swiderski, C. E., T. R. Klei, and D. W. Horohov. 1999. Quantitative measurement of equine cytokine mRNA expression by polymerase chain reaction using target-specific standard curves. J Immunol Methods 222: 155-169.
Tahmasbi, A. M., M. Kazemi, M. M. Moheghi, J. Bayat, and A. M. Shahri. 2012. Effects of selenium and vitamin E and night or day feeding on performance of Holstein dairy cows during hot weather. Journal of Cell and Animal Biology 6: 33-40.
Tato, C. M., and D. J. Cua. 2008a. Snapshot: Cytokines I. Cell 132: 324.
Tato, C. M., and D. J. Cua. 2008b. Snapshot: Cytokines III. Cell 132: 900.
Tato, C. M., and D. J. Cua. 2008c. Snapshot: Cytokines IV. Cell 132: 1062.
Thorson, J. F., B. J. Karren, M. L. Bauer, C. A. Cavinder, J. A. Coverdale, and C. J. Hammer. 2010. Effect of selenium supplementation and plane of nutrition on mares and their foals: foaling data. Journal of Animal Science 88: 982-990.
Tosi, M. F. 2005. Innate immune responses to infection. Journal of Allergy and Clinical Immunology 116: 241-249.
Touraine, J. L., J. W. Hadden, F. Touraine, E. M. Hadden, R. Estensen, and R. A. Good. 1977. Phorbol myristate acetate: a mitogen selective for a T-lymphocyte subpopulation. The Journal of Experimental Medicine 145: 460-465.
Ueno, H., G. Hasegawa, R. Ido, T. Okuno, and K. Nakamuro. 2008. Effects of selenium status and supplementary seleno-chemical sources on mouse T-cell mitogenesis. Journal of Trace Elements in Medicine and Biology 22: 9-16.
Underwood, E. J. 1962. Trace elements in human and animal nutrition. Second edition ed. Academic Press, London, United Kingdom.
Urso, M. L., and P. M. Clarkson. 2003. Oxidative stress, exercise, and antioxidant supplementation. Toxicology 189: 41-54.
Van Ryssen, J. B. B. 2001. Geographical distribution of the selenium status of herbivores in South Africa. South African Journal of Animal Science 31: 1-8.
Vance, C. K., S. Kennedy-Stoskopf, A. R. Obringer, and T. L. Roth. 2004. Comparative studies of mitogen- and antigen-induced lymphocyte proliferation in four captive rhinoceros species. Journal of Zoo and Wildlife Medicine 35: 435-446.
Vendeland, S. C., J. A. Butler, and P. D. Whanger. 1992. Intestinal absorption of selenite, selenate, and selenomethionine in the rat. The Journal of Nutritional Biochemistry 3: 359-365.
Verma, S., F. W. Hoffmann, M. Kumar, Z. Huang, K. Roe, E. Nguyen-Wu, A. S. Hashimoto, and P. R. Hoffmann. 2011. Selenoprotein K Knockout Mice Exhibit
220
Deficient Calcium Flux in Immune Cells and Impaired Immune Responses. The Journal of Immunology 186: 2127-2137.
Vunta, H., B. J. Belda, R. J. Arner, C. Channa Reddy, J. P. Vanden Heuvel, and K. Sandeep Prabhu. 2008. Selenium attenuates pro-inflammatory gene expression in macrophages. Molecular Nutrition & Food Research 52: 1316-1323.
Wang, C., and R. T. Lovell. 1997. Organic selenium sources, selenomethionine and selenoyeast, have higher bioavailability than an inorganic selenium source, sodium selenite, in diets for channel catfish (Ictalurus punctatus). Aquaculture 152: 223-234.
Whanger, P. D. 2002. Selenocompounds in Plants and Animals and their Biological Significance. Journal of the American College of Nutrition 21: 223-232.
Whanger, P. D., P. H. Weswig, J. A. Schmitz, and J. E. Oldfield. 1977. Effects of selenium and vitamin E on blood selenium levels, tissue glutathione peroxidase activities and white muscle disease in sheep fed purified or hay diets. The Journal of Nutrition 107: 1298-1307.
White, S., L. K. Warren, and J. Bobel. 2011. Effects of dietary selenium supplementation and exercise on antioxidant enzyme activity in equine blood and skeletal muscle. Journal of Equine Veterinary Science 31: 266-267.
Wichtel, J. J. 1998. A review of selenium deficiency in grazing ruminants. Part 1: New roles for selenium in ruminant metabolism. New Zealand veterinary journal 46: 47-52.
Williams, C. A. 2010. Antioxidant research and its application to feeding horses. In: Kentucky Equine Research Nutrition Conference: Feeding and Veterinary Management of the Sport Horse, Lexington, KY. p 17-22.
Williams, C. A., D. S. Kronfeld, T. Hess, K. E. Saker, J. N. Waldron, K. M. Crandell, R. M. Hoffman, and P. Harris. 2004. Antioxidant supplementation and subsequent oxidative stress of horses during an 80km endurance race. Journal of Animal Science 82: 588-594.
Wuryastuti, H., H. D. Stowe, R. W. Bull, and E. R. Miller. 1993. Effects of vitamin E and selenium on immune responses of peripheral blood, colostrum, and milk leukocytes of sows. Journal of Animal Science 71: 2464-2472.
Yates, A., R. Callard, and J. Stark. 2004. Combining cytokine signalling with T-bet and GATA-3 regulation in Th1 and Th2 differentiation: a model for cellular decision-making. Journal of Theoretical Biology 231: 181-196.
Yur, F., S. Dede, Y. Deger, and D. Kilicalp. 2008. Effects of vitamin E and selenium on serum trace and major elements in horses. Biological Trace Element Research 125: 223-228.

221
Zeng, H., and G. F. Combs Jr. 2008. Selenium as an anticancer nutrient: roles in cell proliferation and tumor cell invasion. The Journal of Nutritional Biochemistry 19: 1-7.

222
APPENDIX A: ADDITIONAL DATA TABLES
Chapter 4:
Appendix Table 4.a. Composition of the adequate and low Se balancer pellet1 fed during
the depletion and repletion phase.
Item Adequate Se pellet (%)
Low Se pellet2 (%)
Soybean meal (dehulled) 60.0 60.0 Ground oats 8.25 8.25 Wheat bran 7.50 7.50 Defluorinated phosphate 7.50 7.50 Molasses 6.60 6.60 Dehydrated alfalfa meal 5.00 5.00 Calcium carbonate 2.50 2.50 Salt 1.25 1.25 Mineral pre-mix* 0.50 0.50 Vitamin pre-mix** 0.50 0.50 Soybean oil 0.30 0.30 Mold inhibitor (buffered propionic and sorbic acid) 0.10 0.10 1McCauley Bros, Inc., Versailles, KY 2 Mineral pre-mix used for low Se balancer pellet did not contain any Se. *Mineral pre-mix proprietary to McCauley Bros, Inc., Versailles, KY. Pre-mix used for adequate Se balancer pellet contained Se, added as sodium selenite. **Vitamin pre-mix proprietary to McCauley Bros, Inc., Versailles, KY.

223
Appendix Table 4.b. Example of the calculated total dietary Se intake* for a 500 kg
horse.
Se source Adequate Se diet Low Se diet
Pasture/Hay 0.56 0.56
Balancer pellet 0.86 0.17
Total (mg/d) 1.42 0.73
Total (mg/kg DM) 0.12 0.063
* Total DM intake estimated at 2.25% of BW or 11.6 kg DM per day

224
Appendix Table 4.c. Intracellular production of IFNγ in response to in vitro stimulation
with different mitogens1.
Week
Main effect (P-value)
Item Diet 0 3 5 SEM Treatment Time Treatment
x time IFNγ
KLH
% gated AS2 0.59 0.69 1.22 0.23 0.085 0.069 0.027
LS2 0.50 0.99 1.09 0.13
KLH MFI AS 11.79 6.76 6.02 1.25 0.114 0.001 0.071
LS 7.93 5.95 6.12 0.74
PMA
% gated AS 30.41 24.3 21.5 3.21 0.265 0.005 0.650
LS 25.74 23.5 19.3 1.90
PMA MFI AS 37.02 25.1 27.0 1.76 0.361 0.026 0.714
LS 30.38 24.6 23.7 1.04
FLU
% gated AS 1.69 * 1.46 1.08 0.968 0.042 0.746
LS 2.00 * 2.16 0.64
FLU MFI AS 18.01 * 10.1 4.02 0.903 0.235 0.748
LS 13.14 * 11.1 2.37
1Mitogens include KLH (keyhole limpet hemocyanin); PMA (phorbol 12-myristate 13-acetate); FLU (equine influenza strain KY02) 2Dietary treatments (total dietary Se): LS = low Se (0.06 mg Se/kg DM); AS = Adequate Se (0.12 mg Se/kg DM)

225
Appendix Table 4.d. Intracellular production of TNFα in response to in vitro stimulation
with different mitogens1.
Week
Main effect (P-value)
Item
Diet 0 3 5 SEM Treatment Time Treatment x time
TNFα
KLH %
gated AS2 0.43 0.82 0.77 0.24 0.734 0.790 0.562
LS2 0.73 1.12 1.33 0.14
KLH MFI AS 15.08 12.2 11.1 1.85 0.166 0.531 0.289
LS 16.77 12.7 11.5 1.10
PMA
% gated AS 58.83 57.1 53.7 3.61 0.941 0.033 0.957
LS 59.13 58.5 54.5 2.13
PMA MFI AS 53.74 44.8 47.5 3.98 0.908 0.007 0.610
LS 52.18 46.9 45.7 2.35
FLU
% gated AS 0.52 * 1.30 0.35 0.691 0.718 0.504
LS 0.82 * 1.31 1.86
FLU MFI AS 12.56 * 8.90 1.68 0.899 0.139 0.924
LS 10.94 * 8.86 1.00
1Mitogens include KLH (keyhole limpet hemocyanin); PMA (phorbol 12-myristate 13-acetate); FLU (equine influenza strain KY02) 2Dietary treatments (total dietary Se): LS = low Se (0.06 mg Se/kg DM); AS = Adequate Se (0.12 mg Se/kg DM)

226
Appendix Table 4.e. Relative quantity of mRNA expression of transcription factors and
cytokines in response to in vitro stimulation with equine influenza KY02.
1Dietary treatments (total dietary Se): LS = low Se (0.06 mg Se/kg DM); AS = Adequate Se (0.12 mg Se/kg DM)
Week
Main effect (P-value) Item 0 5 SEM Treatment Time Treatment x time T-bet
AS1 2.62 3.31 1.10 0.589 0.615 0.646 LS1 2.56 1.74 0.55
GATA 3 AS 7.23 6.95 8.42 0.563 0.146 0.866
LS 8.02 7.64 3.90 IFNγ
AS 7.23 6.95 8.40 0.599 0.496 0.510 LS 8.02 7.64 3.90
TNFα AS 2.13 4.18 1.25 0.542 0.943 0.360
LS 2.66 2.25 0.59 IL-1
AS 7.23 6.95 8.42 0.994 0.039 0.960 LS 8.02 7.65 3.91
IL-2 AS 1.19 2.42 0.76 0.506 0.095 0.377
LS 1.18 1.94 0.34 IL-6
AS 2.84 5.28 1.23 0.377 0.012 0.678 LS 1.43 2.48 0.52
IL-8 AS 1.85 2.2 0.78 0.833 0.743 0.663
LS 1.72 1.94 0.35 IL-10
AS 2.39 3.7 0.84 0.275 0.872 0.179 LS 2.96 2.02 0.41
IL-13 AS 1.32 1.4 1.18 0.601 0.637 0.837
LS 0.58 1.89 0.68

227
Chapter 5:
Appendix Table 5.a. Intracellular production of IFNγ in response to in vitro stimulation
with different mitogens1.
Week Main effect (P-value)
Item Diet2 0 3 5 SEM Treatment Time Treatment x
time IFNγ
OVA
% gated LS 1.46 0.83 1.12 0.15 0.801 0.605 0.490
AS 0.91 0.87 1.27 0.15
SP 1.24 0.90 1.11 0.14
SS 0.87 1.16 1.33 0.15
OVA MFI LS 7.72 10.4 6.17 1.09 0.031 0.118 0.433
AS 4.88 6.19 5.09 1.11
SP 4.59 6.81 6.93 1.01
SS 6.17 6.40 6.41 1.09
PMA
% gated LS 36.79 40.6 38.0 3.23 0.180 0.041 0.422
AS 37.07 40.2 38.5 3.36
SP 28.40 32.1 32.3 3.03
SS 37.86 36.9 38.7 3.24
PMA MFI LS 34.22 35.5 35.7 2.28 0.443 0.001 0.415
AS 31.73 37.5 35.8 2.35
SP 30.86 35.6 31.2 2.13
SS 28.52 33.1 34.1 2.28
FLU (KY02)
% gated LS 4.26 * 2.82 1.09 0.721 0.849 0.451
AS 2.60 * 2.71 1.27
SP 1.65 * 1.92 1.08
SS 3.85 * 3.50 1.12
FLU (KY02) MFI LS 19.09 * 12.16 4.70 0.694 0.008 0.804
AS 15.26 * 7.99 5.47
SP 8.68 * 6.33 4.86 SS 15.05 * 10.37 4.69
1Cell stimulated with KLH (keyhole limpet hemocyanin); PMA ( phorbol 12-myristate 13-acetate) or FLU (equine influenza strain KY02) 2Dietary treatments (total dietary Se): LS = low Se (0.06 mg Se/kg DM); AS = Adequate Se (0.12 mg Se/kg DM); SP = Sel-Plex (0.3 mg Se/kg DM); SS = Sodium Selenite (0.3 mg Se/kg DM)

228
Appendix Table 5.b. Intracellular production of TNFα in response to in vitro stimulation
with different mitogens1.
Week Main effect (P-value)
Item Diet2 0 3 5 SEM Treatment Time Treatment
x time TNFα
OVA % gated LS 0.97 1.32 1.45 0.17 0.441 0.009 0.424
AS 1.20 1.23 1.08 0.17
SP 1.18 1.57 1.43 0.15
SS 0.99 1.65 1.41 0.17
OVA MFI LS 12.03 13.98 9.15 2.59 0.243 0.257 0.360
AS 11.83 13.59 7.65 2.59
SP 13.05 10.49 9.21 2.37
SS 13.23 13.43 17.9 2.56
PMA % gated LS 69.56 66.56 66.7 2.99 0.705 0.019 0.943
AS 70.50 66.83 70.2 3.09
SP 68.05 65.62 67.9 2.79
SS 72.50 68.28 72.2 2.99
PMA MFI LS 76.99 74.77
54.26 5.11 0.921 0.001 0.1911
AS 65.85 72.26 66.3 5.24
SP 66.72 70.68 58.6 4.76
SS 70.38 72.06 63.9 5.11
FLU (KY02) % gated LS 3.04 * 2.30 0.74 0.916 0.007 0.8779
AS 1.62 * 2.09 0.85
SP 1.80 * 2.51 0.76
SS 1.56 * 2.41 0.74
FLU (KY02) MFI LS 8.35 * 5.79 0.78 0.970 <0.001 0.1044
AS 7.42 * 6.84 0.90
SP 7.25 * 6.27 0.80 SS 8.64 * 5.87 0.78
1Cell stimulated with KLH (keyhole limpet hemocyanin); PMA (phorbol 12-myristate 13-acetate) or FLU (equine influenza strain KY02) 2Dietary treatments (total dietary Se): LS = low Se (0.06 mg Se/kg DM); AS = Adequate Se (0.12 mg Se/kg DM); SP = Sel-Plex (0.3 mg Se/kg DM); SS = Sodium Selenite (0.3 mg Se/kg DM)

229
Appendix Table 5.c. The mRNA expression as relative quantity of cytokines2 in
peripheral blood mononuclear cells stimulated with ovalbumin in vitro.
Week Main effect (P-value) Item Diet1 0 3 5 SEM Treatment Time Treatment x time Tbet LS 1.97 1.26 1.07 0.58 0.532 0.355 0.108
AS 1.95 0.98 1.78 0.59
SP 0.59 0.85 0.91 0.54
SS 1.01 2.65 1.54 0.58
GATA 3 LS 0.90 0.98 0.87 0.17 0.541 0.258 0.095
AS 1.24 0.76 0.98 0.17
SP 0.63 0.85 0.89 0.15
SS 0.80 1.03 1.11 0.17
Granzyme B LS 1.62 1.05 1.03 0.68 0.973 0.807 0.120
AS 2.27 1.50 1.84 0.71
SP 2.61 2.20 2.53 0.63
SS 0.75 1.61 0.88 0.68
IL-1 LS 1.34 0.65 1.69 0.78 0.819 0.022 0.873
AS 2.76 0.65 1.07 0.79
SP 1.75 1.25 1.33 0.72
SS 2.43 0.74 1.71 0.78
IL-6 LS 0.63 0.25 0.32 0.43 0.166 0.002 0.758
AS 1.14 0.95 1.34 0.43
SP 1.13 0.25 0.83 0.40
SS 0.71 0.25 0.55 0.43
IL-8 LS 1.84 0.91 1.57 0.68 0.718 0.044 0.925
AS 2.05 0.83 0.97 0.69
SP 1.80 1.67 1.56 0.63
SS 2.52 1.64 1.77 0.68
IL-10* LS (n=5) 1.38 0.85 0.75 0.41 0.240 0.005 0.529
AS (n=6) 2.02 1.27 1.02 0.38
SP (n=5) 2.71 1.01 1.61 0.42 SS (n=3) 1.86 1.09 1.70 0.55
1Dietary treatments (total dietary Se): LS = low Se (0.06 mg Se/kg DM); AS = Adequate Se (0.12 mg Se/kg DM); SP = organic Se (0.3 mg Se/kg DM, Sel-Plex, Alltech Inc., Nicholasville, KY); SS = inorganic Se (0.3 mg Se/kg DM, sodium selenite) 2IL = Interleukin *Upon analysis of IL-10 datasets from some horses were omitted as indicated in the table

230
Appendix Table 5.d. Relative quantity of mRNA expression of transcription factors and
cytokines in response to in vitro stimulation with equine influenza KY02.
Week Main effect (P-value)
Item Diet1 0 5** SEM Treatment Time Treatment x time
Tbet LS 2.27 1.65 0.74 0.632 0.653 0.960
AS 3.14 2.02 0.81 SP 1.70 1.65 0.72 SS 2.26 2.16 0.74
GATA 3 LS 1.25 1.37 0.21 0.993 0.543 0.485
AS 1.51 1.00 0.21 SP 1.15 1.30 0.19 SS 1.24 1.29 0.21
GranzymeB LS 12.54 11.79 4.94 0.899 0.265 0.512
AS 7.89 1.58 5.30 SP 3.87 4.49 4.80 SS 2.46 5.69 5.16
TNFα LS 5.69 0.40 2.46 0.675 0.010 0.232
AS 7.97 0.31 2.83 SP 2.50 1.80 1.29 SS 2.21 1.33 2.76
IL-1 LS 1.04 0.16 2.24 0.702 0.007 0.076
AS 7.93 0.97 2.36 SP 0.89 1.79 2.09 SS 0.60 0.62 2.50
IL-2 LS 4.90 2.14 1.06 0.399 0.077 0.183
AS 1.29 0.62 1.02 SP 1.04 1.41 1.00 SS 1.27 1.07 1.15
IL-6 LS 2.74ab 0.31a 1.62 0.057 0.0004 0.026
AS 7.57a 3.89b 1.87 SP 2.84ab 0.91ab 1.51 SS 1.16b 1.11ab 1.83
IL-8 LS 1.92w 0.31x 1.52 0.812 <0.001 0.045
AS 5.86w 1.42x 1.56 SP 1.42w 1.93w 1.41 SS 1.91w 0.84x 1.70
IL-10 LS 1.04 0.40 0.79 0.149 0.8582 0.5987
AS 2.60 1.32 0.80 SP 1.82 2.42 0.70 SS 2.28 1.25 0.97

231
Appendix Table 5.d. Continued.
Week Main effect (P-value)
Item Diet1 0 5** SEM Treatment Time Treatment x time
IL-13 LS 1.20 0.46 0.93 0.440 0.001 0.280
AS 2.21 2.08 0.96 SP 1.26 0.83 0.87 SS 4.40 1.00 1.03
1Dietary treatments (total dietary Se): LS = low Se (0.06 mg Se/kg DM); AS = Adequate Se (0.12 mg Se/kg DM); SP = Sel-Plex (0.3 mg Se/kg DM); SS = Sodium Selenite (0.3 mg Se/kg DM) ** 2 wks following equine influenza vaccination

232
Chapter 6:
Appendix Table 6.a. The thyroxine/triiodothyronine ratio evaluated in response to Se
depletion and Se repletion.
Depletion1 (d) Repletion2 (d) Treatment 0 196 SEM 0 154 SEM LS 0.068 0.159 0.040 0.048 0.109 0.018 AS 0.036 0.055 0.067 0.035 0.051 0.017 SP * * * 0.035 0.052 0.017 SS * * * 0.097 0.087 0.018 Main effects P-value Main effects P-value Treatment 0.2740 Treatment 0.1299 Time
0.0179 Time
0.0726
Treatment x time 0.3604 Treatment x time 0.5191 1Dietary treatments (total dietary Se): LS = low Se (0.06 mg Se/kg DM); AS = Adequate Se (0.12 mg Se/kg DM)
2Dietary treatments (total dietary Se): LS = low Se (0.06 mg Se/kg DM); AS = Adequate Se (0.12 mg Se/kg DM); SP = organic Se (0.3 mg Se/kg DM, Sel-Plex, Alltech Inc., Nicholasville, KY); SS = inorganic Se (0.3 mg Se/kg DM, sodium selenite)

233
Appendix Table 6.b. Lymphocyte and neutrophil numbers in horses on different dietary
Se treatments during the repletion phase1.
Lymphocyte (103) Neutrophil (103) Time (d) LS AS SP SS LS AS SP SS
0 2.38 2.30 2.30 2.77 4.78 4.38 4.52 5.00 28 3.05 2.07 2.40 2.63 4.30 4.34 4.25 4.68 56 2.87 2.39 2.58 2.70 4.00 4.12 3.69 4.84 84 2.89 2.86 3.34 3.16 4.24 4.46 3.80 4.77
121 3.29 2.71 2.85 2.99 4.34 3.99 3.91 4.05 154 2.35 2.22 2.56 2.93 3.73 3.41 3.28 3.73
SEM 0.29 0.26 0.26 0.29 0.40 0.37 0.37 0.40
Main effect (P-value) Main effect (P-value)
Treatment 0.4678 Treatment 0.6057
Time <0.0001 Time <0.0001
Treatment x time 0.2964 Treatment x time 0.7451 1Dietary treatments (total dietary Se): LS = low Se (0.06 mg Se/kg DM); AS = Adequate Se (0.12 mg Se/kg DM); SP = organic Se (0.3 mg Se/kg DM, Sel-Plex, Alltech Inc., Nicholasville, KY); SS = inorganic Se (0.3 mg Se/kg DM, sodium selenite)
Copyright © Mieke Brummer 2012

234
APPENDIX B: Laboratory protocols
Methods relating to selenium and antioxidant status:
Whole blood glutathione peroxidase activity:
Oxis Research Bioxytech GPx – 340 kit (www.percibio.com; Cat No 21017) Method for analysis of whole blood samples: Reagent preparation 1) NADPH
• Add 7.5 mL Assay buffer to vial. Vortex well. • Allow the reagent to reach room temperature before use in the assay. • Keep shielded from light. • Will remain stable at room temperature for 9hrs.
2) Assay Buffer
• Calculate and remove the amount of assay buffer that will be needed to run all the samples for one day (about 30mL/Plate). Refrigerate remaining assay buffer.
• Allow buffer to reach room temp before use in assay. 3) Tert-Butyl Hydroperoxide
• First make up a stock dilution: 50uL tert – Butyl Hydroperoxide into 4950uL nano pure water
• Then make up working solution: 200uL stock + 19.8mL nano pure water. • Working solution will remain stable for entire working day at room temp.
Standard and samples preparation: Standard: Run Std at 1:30 (16.5 uL std + 484.5 uL standard diluent) Keep diluent frozen and std refrigerated after thawing Samples: Dilute samples at 1:40: i.e. 12.5 uL whole blood + 487.5 uL Assay Buffer Thaw samples out as close to when it has to be analyzed as possible, then keep on ice while diluting out. Run assay in triplicate. NB: Remember to include water blank to subtract background activity.

235
Running Assay: Turn microplate on, open correct program (kinetic; 340nm; 30s interval for 5 min), set temperature at 25º C and make sure it starts to warm up. To each well add:
1) 75 uL assay buffer 2) 15 uL sample (triplicate) 3) 75 uL NADPH 4) 75 uL peroxide for activation.
Read immediately Data analysis:
1) Average replicates. 2) Absorbance(30s) – Abs (300s) 3) Change in Abs / 4.5min 4) Change/min – Blank change/min 5) Net change/min / 0.004043 6) x DF (16 x 40 = 640 / 480 for Std) 7) Express as activity/gHb

236
Total Hemoglobin Assay:
(Pointe Scientific Inc.; assay kit number H7504)
1) Add 2 mL reagent to test tube 2) Add 10 μL Standard, low control, high control or sample to test tube 3) Allow to stand at room temperature for atleast 3min 4) Set spec at 540 nm 5) Zero spec using reagent only as blank 6) Read an record absorbance (Must be read within 1 hr) 7) Calculate values
Blank – reagent only Std – 0 μL reagent Std – 5 μL reagent Std – 10 μL reagent Std – 20 μL reagent

237
Total Antioxidant Assay: (Cayman chemicals; assay kit number: 709001) Pre-assay preparation: Set up plate plan Reagent preparation: SEE INSTRUCTION SHEET Standard preparation: Tube Trolox Assay buffer (uL) Trolox concentration (in mM) A 0 1000 0 B 30 970 0.045 C 60 940 0.090 D 90 910 0.135 E 120 880 0.18 F 150 850 0.225 G 220 780 0.330 ***Samples can be diluted with Assay buffer to fall within the range of the STD curve. Assay: 1) To each well add 10 uL sample/STD 10 uL Metmyoglobin 150 uL Chromogen 2) Initiate reaction by adding 40 uL hydrogen peroxide working solution within 1 min 3) Cover plate and incubate for 5 min while shaking gently. 4) Read absorbance at 750 nm.

238
Thiobarbituric Acid Reactive Substances Assay: (Cayman chemicals; assay kit number: 10009055) Pre assay preparation: Serum should not be diluted for this assay All reagents must be at room temperature before use (sit at least 2 hrs on bench) 1) Set up plate plan 2) Prepare reagents a) Thiobarbituric Acid – use to prep “f” b) TBA Acetic Acid add 40 mL + concentrated TBA acetic acid to 160mL nano pure water Stable for 3 months at room temperature c) TBA sodium hydroxide add 20mL concentrated TBA sodium hydroxide to 180mL nano pure water Stable for 3 months at room temperature d) TBA Malondialdehyde standard Ready for use to prepare standard curve e) TBA SDS solution Ready for use f) Color reagent – prepare in 250mL beaker (Need 150mL / plate) for 25 samples + 8 STD: Weigh out 795mg Thiobarbituric Acid add 75mL TBA Acetic acid solution add 75mL TBA sodium hydroxide solution mix until completely dissolved Stable for 24 hours Standard preparation Prepare a stock solution: 250uL MDA standard + 750uL nano pure water Label 8 test tubes and label A-H Prepare std curve as follows from the stock solution: Tube MDA Water (uL) MDA concentration (in uM) A 0 1000 0 B 5 995 0.625 C 10 990 1.25 D 20 980 2.5 E 40 960 5 F 80 920 10 G 200 800 25 H 400 600 50

239
Performing the assay 1) Label vial cups 2) Add 100 uL sample or STD to labeled 5mL vial 3) Add 100 uL SDS solution to vial and swirl to mix 4) Add 4 mL colour reagent forcefully down side of each vial 5) Cap vials, place in holder to keep upright while boiling 6) Boil for 1 hr 7) Remove vials and immediately place on ice. Keep on ice for 10 mins. 8) Centrifuge vials for 10 mins at 1600xg at 4˙C 9) Load 150uL in duplicate from each vial to plate 10) Read absorbance at 530 nm

240
Methods relating to Immunology:
PBMC isolation and antigen specific stimulation:
1) Let heparinized tubes settle for about 20 min. If the cells have settled on top of the red blood cell layer remember to collect from just below the cells to make sure you collect all the cells.
2) Set up 50 mL centrifuge tubes with approx 10 mL ficoll. 1 tube per horse/2 blood tubes.
3) SLOWLY transfer the top layer of the blood (white cells) to the ficoll tubes. Hold the ficoll tube at an angle and add the blood component so that it forms a layer on top of the ficoll.
4) Centrifuge for 30 mins at 500xg (slow brake) [Program 1] 5) Transfer cell layer to new 50 mL tube. The hazy layer is the cell layer. It is very
hard to remove only that portion, so best to remove more than that i.e. remove some of the ficoll layer too. Remember to set pipette on “Slow”.
6) Top off tube with warm PBS (+/- 50 mL). 7) Centrifuge for 10 mins at 500xg (fast break) [Program 3] 8) Dump supernatant; Flick pellets. 9) Top off tube with PBS (+/- 50 mL). 10) Centrifuge for 10 mins at 300xg (fast break) [Program 4] 11) Dump supernatant; Flick pellets. 12) Top off tube with PBS (+/- 35 mL). 13) Centrifuge for 10 mins at 300xg (fast break) [Program 4] 14) Dump supernatant; Flick pellets. 15) Re-suspend in 10 mL PBS 16) Label count cups, 1 cup per sample.
You want 100uL cell solution and 900 uL PBS in each cup. Start by adding 900 uL PBS to each cup ( you can do this while the last centrifuge step is running). Then add 100 uL of the re-suspended cells to each cup. Count.
17) Want 3x10⁶ cells/well in cRPMI+2.5% 18) Transfer 0.5mL to 24 well plate – Already containing 0.5mL Med / med+antigen 19) Incubate 20 hrs 20) Add 2uL Brefeldin A to all wells 21) Add 10uL PMA/IONO to PMA wells. 22) Incubate 4 hrs in 37˙, 5% CO2 incubator 23) Withdraw 0.5 mL for RNA stat – follow RNA stat method 24) Transfer cells to 96 well V bottomed plate (200uL per well in triplicate 25) Spin plate at 500xg for 5min. 26) Flick once. 27) Re-suspend cells in 100 uL paraformaldehyde. 28) Cover with parafilm and refrigerate.

241
Autologous serum Serum must be heat inactivated by incubating for a 30 min period in a 56˙C water bath. Centrifuge serum tubes at 800xg for 10 min and aspirate serum as usual. Prepare autologous media: 250 mL RPMI Remove 6.25 mL Add 2.5 mL PSG Add 250 uL mercapto-ethanol. Add 10 mL of above media to separate 15 mL tubes – 1 per horse. Add 500 uL autologous serum for each individual horse. PS: 500 uL is twice as much as usual but your final cell culture will have half of this
media and half of the un-supplemented media.

242
Lymphocyte proliferation assay: Per well the final assay volume: 100 μL PBMC 100 μL mitogen solution 50 μL 3H-Thymidine Mitogen solutions: Concanavalin A Amersham stock at 1mg/mL Want 4 mL at 10 μg/mL 80 μL Con A + 3920 μL cRPMI 1) Prepare stock solutions day before, plate at 100 μL per well and place in incubator. Use cRPMI as control wells. 2) Isolate cells and wash as described previously 3) Re-suspend PBMC at 2x10⁶ cells/mL 4) Add 100 μL of PBMC per well to already prepared plate 5) Incubate for 72 hr in 5 % CO2 incubator at 37˙C 6) Pulse cells with 3H-Thymidine solution – 50 μL per well
3H-Thymidine solution: 50 μL concentrated 3H-Thymidine + 4950 μL cRPMI 7) Incubate an additional 18 hr 8) Place in Freezer until DNA extraction.

243
IFN γ / TNF α Staining (Intracellular Staining)
1) Centrifuge plate (500xg for 5 min). 2) Flick excess and press on paper towel 3) Add 200 uL PBS – Saponin buffer to each well, mix by pipetting repetitively. 4) Spin plate (500xg for 5 min) 5) Check for cells, flick off excess 6) Add 100uL of stain solution: for 10 wells prepare 1.5mL stain
FITC 1:100 [For 1 mL add 2uL Ab to 998uL saponin buffer; for 1.5 mL add 3 uL to 1497uL saponin buffer] IFN γ 1:100 [For 1 mL add 10uL Ab to 990uL saponin buffer; for 1.5 mL add 15 uL to 1485uL saponin buffer] MOPC-21 Sigma mouse IgG1κ (isot. Cntl) 1:100 [For 1 mL add 10 uL Ab to 990 uL saponin buffer; for 1.5 mL add 15 uL to 1485 uL saponin buffer] HL801 (TNF α; refrigerate) 1:10 [For 1 mL add 100 uL Ab to 900 uL saponin buffer; for 1.5 mL add 150uL to 1350uL saponin buffer]
7) Incubate in an ice cooler with the lid on for a minimum of 30 min. Make 4mL secondary.
8) After incubation, centrifuge plate (500xg for 5 min); Check for cells; Flick off excess
9) Wash with FACS buffer (200 uL in each well, pipette up and down) 10) Centrifuge (500xg for 5 min); check for cells, flick. 11) Wash with FACS buffer (200 uL in each well, pipette up and down) 12) Centrifuge (500xg for 5 min); check for cells, flick. 13) Add 100uL Saponin buffer to IFN γ and IFN γ control wells*** 14) Add 100uL of the secondary Ab (Caltag) Goat F(Ab’) 2 anti mouse IgG (H&L)
FITC (light green top) @ 1:400 [ for 1 mL add 2.5 uL Ab to 997.5 uL saponin buffer; for 1.5 mL add 3.75 uL Ab to 1496.25 uL saponin buffer
15) Incubate in ice cooler with lid on for 30 min 16) After incubation spin plate, Centrifuge (500xg for 5 min) 17) Wash with FACS buffer (200 uL in each well, pipette up and down) 18) Centrifuge (500xg for 5 min); check for cells, flick. 19) Wash with FACS buffer (200 uL in each well, pipette up and down) 20) Centrifuge (500xg for 5 min); check for cells, flick. 21) Put 100 uL FACS Flow into each well (pipette up and down) 22) Label FACS FLOW tubes, add 200uL FACS buffer to each tube. You need 1 tube
per well.

244
23) Transfer contents of each well into a FACS tube, so that total contents of the tube = 300 uL. Remember to swivel tip on bottom of the well to pick up the cells, and go back at least once for maximum cell extraction from well.
***If you use separate plates for IFNg and TNFa you can start process of removing IFNg cells at this point, while TNFa is incubating in secondary

245
Total RNA purification: Paxgene Kit protocol
1) Centrifuge paxgene blood samples 10min @ 2800 x g 2) Discard lid and pour off supernatant 3) Add 4mL of RNAse – free water to pellet 4) Place new lids on tubes; vortex until resuspended 5) Centrifuge 10 min @ 2800 x g 6) Pour off supernatant 7) Add 350µL Buffer 1 to pellet 8) Vortex until pellet is completely resuspended 9) Transfer to labeled 1.5mL eppendorf tubes (aprox. 700 µL) 10) Add 300 µL Buffer 2 11) Add 40 µL Proteinase K 12) Vortex, incubate at room temperature for 5 min 13) Incubate for 10 min in 55۫ C water bath 14) Vortex briefly 15) Centrifuge 10 min at 20000xg 16) Transfer supernatant to new labeled 1.5mL Eppendorf tube. Avoid pellet! 17) Add 350µL 100% ethanol 18) Vortex 19) Label spin columns and place in 2mL collection tube 20) Add 700µL sample to appropriate spin column 21) Centrifuge for 1 min @ 8000 x g 22) Place spin columns into new 2mL collection tubes 23) Add any remaining sample volumes to appropriate spin column 24) Centrifuge for 1 min @ 8000 x g 25) Transfer spin columns into new 2mL collection tubes 26) Add 700µL Buffer 3 to spin columns 27) Centrifuge for 1 min @ 8000 x g 28) Transfer spin columns into new 2mL collection tubes 29) Add 500µL Buffer 4 to spin columns (1st wash) 30) Centrifuge for 1 min @ 8000 x g 31) Transfer spin columns into new 2mL collection tubes 32) Add 500µL Buffer 4 to spin columns (2nd wash) 33) Centrifuge 3 min at max speed (20000xg) 34) Transfer spin columns into new 2mL collection tubes 35) Centrifuge 1 min at max speed (20000xg) 36) Transfer spin columns into new fully labeled 1.5 mL eppendorf tubes 37) Add 40µL Buffer 5 to spin columns (1st elution) 38) Centrifuge for 1 min @ 8000 x g 39) Add 40µL Buffer 5 to spin columns (2nd elution) 40) Centrifuge for 1 min @ 8000 x g 41) Incubate 5 min in 65 ۫ C water bath 42) Immediately place samples on ice if proceeding to second phase or store at -80˚C

246
Total RNA purification: RNAstat samples NB: DO NOT PROCESS MORE THAN 11 SAMPLES AT A TIME
1) Prepare workbench by wiping it down with RNAse away 2) Also wipe off all tip boxes, pipettes and test tube racks 3) Remove samples from -80˚C freezer to thaw 4) Label one 1.5 mL eppendorf tube per sample 5) Start microcentrifuge on fast cool at 4˚C (20 min) 6) Vortex thawed samples to homogenize samples 7) Add 200 µL chloroform to each sample, vortex each sample for 20 s 8) Let samples incubate for 3 min at room temperature 9) Centrifuge samples at 12000g for 15 min at 4˚C 10) Transfer 420 µL of the upper aqueous phase into new eppendorf tubes 11) Add 320 µL pure isopropanol to each sample 12) Pulse vortex each sample 5 times 13) Incubate at -20˚C for atleast 30 min 14) Centrifuge at 20000g for 10 min at 4˚C 15) Set the waterbath at 60˚C 16) Decant supernatants, work quickly to ensure that pellet don’t move 17) Add 800 µL 75% ethanol and pulse vortex 18) Centrifuge at 15000g for 10 min at 4˚C 19) Remove and discard 700µL 20) Centrifuge at 15000g for 10 min at 4˚C 21) Remove as much supernatant as possible, leave pellet untouched 22) Place tubes in hood to dry 23) Add 60 µL RNAse free water per tube 24) Place in the water bath (60˚C) for 10 min 25) Pulsevortex and store at -80 ˚C

247
Reverse transcription of RNA A) First step is to determine the quality of the RNA using a bioPhotometer
1) One “uvette” (cuvette) required per sample, and one for a blank 2) To each cuvette add 95µLRNAse free water; take care to place the water in the
cuvette well 3) To the blank cuvette, add 5µL Buffer 5 from kit. Place tip in well, pipette the
liquid and mix by moving tip from side to side 4) Add 5µL RNA to the appropriate cuvette and take reading. 5) Use reading to calculate amount of RNA and amount of RNAse free water to be
used for transcription process. (Use computer program Rutgers samples #2 version 1.0) A total volume of 41.5µL required.
B) Prepare master mix of reagents for transcription process: Reagents used:
1) ANIV RT 5X buffer (16µL/sample) 2) MgCl2 (16µL/sample) 3) dNTP (4µL/sample) 4) RNAsin (1µL/sample) 5) Oligo primer (1µL/sample) 6) AMV RT reverse transcriptors (0.5µL/sample)
Reagents can be combined in a 1.5mL eppendorf tube in correct ratios according to number of samples. Prepare enough for # samples + 1. Vortex well. C) Transcription process:
1) Set out required number of thermowell PCR tubes 2) Label tubes fully 3) Add calculated quantity of RNAse free water to respective labeled tube 4) Add 38.5µL of the master mix to each tube 5) Add calculated volume of RNA to correct tube. 6) Vortex each sample. Should have total volume of 80µL per sample 7) Place samples in BioRad My IQ single color Real Time PCR detection system
and follow the instrument protocol for the transcription process. 8) Place cDNA in -20˙ C feezer, and left over RNA in the -80˙ C freezer

248
RealTime-PCR cDNA dilution: Dilute cDNA by adding 80 µL RNAse free water to the cDNA. Transfer 135 µL of the diluted cDNA to a 96 well plate (Note which sample is transferred to which well). Plate loading: Eppendorf ep Motion 5070 robot used for loading the 384 well plate Each well will contain 10µL for the reaction, made up of :
1. 0.5 µL primer probe 2. 5 µL TAC 3. 4.5 µL cDNA
TAC and Primer probe is mixed separately in containers placed onto the robot platform 96 well plate containing samples placed on robot platform as well as the 384 well plate. Note instructions for placement. Select program. Note plate barcode. Plate reading: Instrument: 7900 HT Fast Real-Time PCR system, Applied Biosystems Plate scanned for identification and added to the computer program. Run over night.

249
OVA/KLH ELISA PROTOCOL Preparation steps Coat: OVA Coating concentration = 300 µg/mL (i.e. 30 µg /well) KLH Coating concentration = 300 µg/mL (i.e. 30 µg /well) (OVA stock = 2500 µg /mL; So dilute 1.2mL OVA stock in 8.8mL Coating buffer) Samples: Dilute samples at 1:300 i.e. 3.4uL sample into 996.6uL Elisa wash Standard: Horse “A3”, 2 wk post vac 2 for KLH Horse “I10”, 2 wk post vac 2 Dilute standard at 1:40 i.e. 250uL into 9750uL Elisa wash (Add 200uL to top wells; do 3 fold dilutions down the rows i.e.: Add 100 uL Elisa wash to all rows below Transfer 100uL Std from top well to row below; mix by pipetting up and down, transfer 100uL to row below etc etc so the all wells contain 100uL std) Block: Prepare 1% PVA block by mixing 1g PVA and 100mL ddH2O; heat and stir until dissolved (about 1 hr) Just before use dilute 1% PVA with PBS (1:1) Secondary antibody: Add 4uL goat-anti-horse IgG in 10mL Elisa wash (Peroxidase – conjugated AffiniPure Goat Anti-Horse IgG; Jackson Immuno Research, West Grove, PA) Procedure:
1) Add 100uL OVA/coat/well. Refrigerate plate over-night. 2) Wash plate 3 times. 3) Add 200uL PVA per well. Incubate 1 hr at room temperature on bench top 4) Wash plate 3 times. 5) Add 100uL diluted serum samples or standard as described above (triplicate).
Incubate 1 hr at 37’C. 6) Wash 3 times 7) Add 100 uL secondary antibody. Incubate for 1 hr at 37’C.

250
8) Wash 3 times 9) Add 100uL SureBlue. Watch colour development – usually very quick < 1 min 10) Add 100uL Stop solution. 11) Read immediately at 450 nm

251
Influenza Specific IgGa, IgGb, IgG(T) ELISA procedure Antibodies: Monoclonal antibodies IgGa (CVS48) 1:100, IgGb (CVS39) 1:10, IgGT (CVS40) 1:10. Goat anti-mouse (Bethyl Ab Cat No: A90-216P, 0.5mg) 1:5000 Procedure
1) Coat ELISA plates the night before ready to run the ELISA, cover with parafilm/foil and place in the 4˚C overnight. For Influenza ELISAs coat using 10HA/well (example: 1:32=640HA/ml, thus 10HA/well do 1:6.4 dilution in coating buffer). NOTE: Make sure the Coating Buffer pH = 9.6. Coat using 100ul/well.
2) Next morning, wash the plates 3X with ELISA Wash (1 cycle with washer). 3) Block using 2% non-fat dry milk (2 grams + 100 mls—warm 37C water bath to
dissolve) made in ELISA Wash. Add 200ul/well of block to the plate. Incubate 30 mins to 1 hour at Room Temperature (using ELISA incubation box).
4) Wash plates 3X using ELISA washer (1 cycle with washer). 5) Add Serum samples in triplicate @ 100ul/well at appropriate
concentration/dilution. Incubate at room temperature for 1 hour. 6) Wash plates 3X using ELISA washer (1 cycle with washer). 7) Add Primary Antibody (Monoclonal antibody-mAb) to appropriate wells using
the above dilutions @ 100ul/well. Incubate for 1 hour at room temp. 8) Wash plates 3X using ELISA washer (1 cycle with washer). 9) Add Secondary Antibody (Goat anti-mouse-HRP) using 1:5000 dilution to ALL
wells @ 100ul/well. Incubate for 1 hour at room temp 10) Wash plates 3X using ELISA washer (1 cycle with washer). 11) Add substrate (TMB-KPL) to ALL wells @ 50ul/well. Incubation time varies
depending on which antigen using to coat plates with. For Influenza ELISAs incubation time ~ 5.0 minutes.
12) Add Stop Solution (KPL) when wells/substrate reaction has reached appropriate color.
13) Using the ELISA plate reader, measure Optical Density (OD) at 450nm absorbance.

252
Influenza hemagglutination inhibition protocol Each serum sample must be trypsin-periodate treated to remove non-specific inhibitors of virus hemagglutination which are present in serum samples:
1) Add 100 µL trypsin to 100 µL serum 2) Incubate 30 min in a 56˚C water bath. 3) Add 300 µL periodate 4) Incubated at room temperature for 15 min 5) Add 500 µL 0.6% glycerol in saline
This yielded a final serum dilution of 1:10.
1) Next add 25 µL PBS added to all the wells of a round bottom 96 well plate (Thermo Fisher U-bottom micro titer vinyl plate)
2) Add 50 µL of the treated serum to the first well on the plate 3) Titrate 25 µL across the row. 4) Add 25 µL virus (1:8 dilution) all wells. 5) Incubated for 30 min at room temperature 6) Read buttons of non-agglutination 7) The titer is allocated to the last non agglutinating dilution for each sample
Copyright © Mieke Brummer 2012

253
VITA
Mieke Brümmer was born in Pretoria, South Africa on 20th of February 1981. Mieke
obtained her B.Sc. (Agric) Animal Science from the Department of Animal and Wildlife
Sciences, University of Pretoria. In 2007 Mieke completed her M.Sc. (Agric) Animal
Science, Nutrition, also from the University of Pretoria titled: The effect of yeast cell
wall preparations on salmonella colonisation, gastrointestinal health and performance of
broiler chickens. During this time Mieke completed a 10 month research internship at
Alltech Biosciences Center, Nicholasville, KY. In Fall 2007 Mieke started her Ph.D. with
Dr Lawrence at the University of Kentucky.
Throughout her undergraduate and graduate studies Mieke received several awards:
2003: Best third year student in Animal Science from the South African Society of
Animal Science (Transvaal Branch). 2004: Completion B.Sc. Animal Science with a total
of 19 distinctions, 7 of which in final year. 2005 and 2006: University of Pretoria
Master’s student academic achievement bursary. 2006: Professor J.C. Bonsma
Achievement Bursary. 2010: Invited member in the Honor Society of Agriculture
Gamma Sigma Delta, University of Kentucky Chapter, 2010. 2010: International
Ingredient Corporation Pinnacle award. 2011 and 2012: Award recipient at the Animal
and Food Sciences Graduate Association poster symposium, Ph.D. section.
Journal publications:
Brümmer, M., C. Jansen van Rensburg and C.A. Moran. 2010. Saccharomyces
cerevisiae cell wall products: The effects on gut morphology and performance of broiler
chickens. S. Afr. J. Anim. Sci. 40(1):14-21.
McCown S., M. Brummer, S. Hayes, G. Olson, S.R. Smith Jr. and L. Lawrence. 2012.
Acceptability of Teff hay by horses. Journal of Equine Veterinary Science.
doi.org/10.1016/j.jevs.2011.11.008

254
Scientific Meeting Abstracts:
Brummer, M., C. van Rensburg, U. Thielen, J.M. Tricarico, J.L. Pierce, C.A. Moran.
2006. The effect of yeast cell wall mannan preparations on gastrointestinal health and
performance of broiler chicks. 41st Congress of the South African Society of Animal
Sciences (Poster).
Brummer, M., J.E. Ringler, A.G. Parks, S. Hayes, A.A. Adams, D.W. Horohov and
L.M. Lawrence. 2009. Selenium status and equine immune function. Abst. Journal of
Equine Veterinary Science. 29(5):362-363. (Oral).
Parks, A.G., S. Hayes, M. Brummer, J.E. Ringler, K.M. Harvey, S. McCown, B.D.
Cassill and L.M. Lawrence. 2009. The effects of endophyte infected tall fescue
consumption on exercising horses. Abst. Journal of Equine Veterinary Science.
29(5):299-301. (Oral)
Ringler, J.E., S. Hayes, M. Brummer, S.M. McCown, A.G. Parks, and L.M. Lawrence.
2009. Comparison of in vivo digestibility estimates obtained from weanling and mature
horses receiving the same diet. Abst. Journal of Equine Veterinary Science. 29(5):347-
348 (Oral)
Brummer, M. B.D. Cassill, S. Hayes, J.E. Ringler, A.G. Parks and L.M. Lawrence.
2009. Changes in glutathione peroxidase and serum selenium in response to castration.
Abst. Journal of Equine Veterinary Science. 29(5):434-435 (Poster).
Brummer, M., S. Hayes, J.E. Earing, S.M. McCown and L.M. Lawrence. 2010. Short
Term Selenium Depletion and Oxidative Stress in the Adult Horse. Abst. Journal of
Animal Science. Vol 88. E-suppl. 2: 638 (Poster).
Earing, J.E., S.H. Hayes, M. Brummer, S.M. McCown, A.G. Parks, and L.M. Lawrence.
2010. In vivo digestibility and mean retention estimates of young horses receiving the
same diet. Abst. Journal of Animal Science. Vol 88. E-suppl. 2: 639 (Poster).
McCown, S., M. Brummer, J. Earing, S. Hayes, L. Lawrence. 2010. Acceptability of teff
hay by horses. Abst. Journal of Animal Science. Vol 88. E-suppl. 2: 477 (Oral).

255
Brummer, M., S. Hayes, J.E. Earing, S.M. McCown,L.M. Lawrence. 2011 Effect of
Selenium Depletion on Oxidative Stress in Mature Horses. Abst. Journal of Equine
Veterinary Science. 31(5): 257 (Poster)
Brummer, M., S. Hayes, S.M. McCown, A.A. Adams, D.W. Horohov, L.M. Lawrence.
2011. Selenium Depletion Reduces Vaccination Response in Horses. Abst. Journal of
Equine Veterinary Science 31(5):266 (Oral).
Brummer, M., S. Hayes, J. E. Earing, S. M. McCown, and L. M. Lawrence. 2011.
Selenium status declines in horses fed NRC adequate and low selenium diets. Abst.
Journal of Animal Science. E-Suppl. 1: 319 (Poster).
S. McCown, M.Brummer, S. Hayes, J. Earing,L. Lawrence. 2011. Basal insulin and
glucose concentrations in gestating and lactating mares. Abst. Journal of Equine
Veterinary Science 31(5):247-248 (Poster).
S. McCown, M.Brummer, S. Hayes, J. Earing,L. Lawrence. 2011. Nutrient and dry
matter intakes of broodmares fed high forage diets. Abst. Journal of Equine Veterinary
Science 31(5):264-265 (Oral).
Brummer, M., S. Hayes, B.E. Davis, L.A. Strasinger, S. McCown and L.M. Lawrence.
2012. Exercise response in unfit horses of different selenium status. Accepted for poster
presentation at the 2012 Animal Science meeting, Phoenix, AZ.
Brummer, M., S. Hayes, A. Betancourt, A.A. Adams, D.W. Horohov and L.M.
Lawrence. 2012. Selenium supplementation and immune function. Accepted for oral
presentation at the 2012 Animal Science meeting, Phoenix, AZ.