the influence of micro environment factors on …
TRANSCRIPT

THE INFLUENCE OF MICRO ENVIRONMENT FACTORS ON MARKETING MIX
STRATEGY: A CASE OF RETAIL BUSINESSES WITHIN SHOPPING MALLS IN
NAIROBI
BY
MAUREEN WANJIKU GICHIRI
UNITED STATES INTERNATIONAL UNIVERSITY – AFRICA
SUMMER 2020
ii
THE INFLUENCE OF MICRO ENVIRONMENT FACTORS ON MARKETING MIX
STRATEGY: A CASE OF RETAIL BUSINESSES WITHIN SHOPPING MALLS IN
NAIROBI
BY
MAUREEN WANJIKU GICHIRI
A Research Project Submitted to the Chandaria School of Business in Partial
Fulfilment of the Requirement for the Degree of Masters in Management and
Organizational Development (MOD)
UNITED STATES INTERNATIONAL UNIVERSITY – AFRICA
SUMMER 2020

iii
STUDENT’S DECLARATION
I, the undersigned, declare that this is my original work and has not been submitted to
any other college, institution or university other than the United States International
University Africa for academic credit.
Signed: ______________________________ Date: __________________
Maureen Wanjiku Gichiri (659170)
This project has been presented for examination with my approval as the appointed
supervisor.
Signed: _______________________________ Date: _____________________
Dr. Peter Kiriri
Signed: _____________________________ Date: ____________________
Dean, Chandaria School of Business

iv
COPYRIGHT
Maureen 2020©

v
ABSTRACT
Companies develop and execute marketing strategies to understand the customer and
competition and devise ways of persuading the customer to purchase and consume their
products and services. In the face of dynamic changes in their micro and macro environments,
this has become a complex and difficult exercise. The purpose of the study was to investigate
the influence of micro environment factors on marketing mix strategy among retail business in
shopping malls in Nairobi. The objectives were to investigate the influence of customers on
marketing mix strategy among retail business in shopping malls in Nairobi; to establish the
influence of competition on marketing mix strategy among retail business in shopping malls
in Nairobi; and to determine the influence of distribution channels on marketing mix strategy
among retail business in shopping malls in Nairobi.
A descriptive research design was used in the study. The population encompassed retailers
operating in Village Market Mall. There were 239 retailers operating in the mall. Simple
random sampling was used to generate a sample size of 150 retailers for the study. Data was
collected using a validated and standardized questionnaire. The questionnaire was self-
administered to the respondents at their place of work. Collected data was cleaned and analyzed
using SPSS 23 for descriptive and inferential statistics. The descriptive measures included
frequencies, percentages, means and standard deviations. To establish the influence of micro
environment factors on market mix strategy, the study used multiple regressions. The results
were presented using charts, graphs, and tables, accompanied by narrative descriptions.
Findings on the influence of customers on marketing mix strategy show that with regard to
customer behavior, customers were concentrated around where the outlet was operating.
Customers were also attracted to the stores due to the outlet’s design aesthetics and display.
The store was situated in a neighborhood where customers had disposable income that could
allow them to access products and services at the prices offered at the mall. Findings on
customer preferences indicated that customers made decisions based on the prices offered, and
that the preference of one retailer to the other was dependent on the prices of the products.
Customers also preferred the malls due to high perception of product quality and benefits of
effective product promotions, since they were mainly drawn to recognizable brands. Customer
satisfaction levels were comparatively high and driven by product quality, staff responsiveness,
and customer loyalty. Multiple regressions demonstrated that all the dimensions of customers,
notably, customer satisfaction, customer preferences, and customer satisfaction had a positive
and statistically significant influence on marketing mix strategy.
Findings on the influence of competitive forces on marketing mix strategy show that in terms
of the threat of entry, retailers moderately agreed that goods they sold were from patented
innovations and that competitors enjoyed economies of scale. A significant amount of capital
was also needed to enter the market, and government regulation and levels of profitability
influenced competition among retailers. On competitive rivalry, retailers noted that there were
many small competitors in the mall, rather than big competitors. The prices were comparable
with retailers dealing in similar products. Most products had substitutes drawn from the same
group of suppliers. The retailers contended that the price and performance attributes were
competitive. However, the competitiveness of the retailers was greatly dependent on the
competitiveness of the mall. As a result, even though the study reported a positive relationship
between the threat of entry and competitive rivalry, these did not have a statistically significant

vi
influence on marketing strategy. The abundance of substitutes had a negative but not
statistically significant influence on the retail outlet’s marketing strategy.
Findings on the influence of distribution on marketing strategy decisions indicate that direct
distribution channels were characterized by delivering products faster to customers, possessing
considerable control over product marketing and selling, building direct relationships with
customers and accessing goods only in fixed positions. The level of agreement with these
characteristics was slightly above average. Indirect distribution was characterized by
distributing products through agents, building relationships primarily with distributors,
leveraging existing brand recognition, and interacting more with end-users. Findings indicated
comparatively low levels of agreement when compared to direct distribution. Extensive
distribution, characterized by characteristics from the two channel strategies, reported
moderate level of agreement among respondents. Overall, multiple regression demonstrated
that direct distribution was the main predictor of marketing mix strategy, as opposed to indirect
or extensive distribution.
The study concludes that customer related micro-environment factors have a positive and
statistically significant influence on market mix strategy among retail outlets in Kenya.
Multiple regressions showed that customer behavior, customer preferences, and customer
satisfaction had a statistically significant effect on marketing mix strategy. Competition related
micro-environment factors have a positive but not significant effect on marketing strategy
among retail outlets in Kenya. Competition was conceptualized based on Michael Porter’s five
forces theory. Multiple regressions revealed a positive but not significant relationship between
threats of entry and the choice of market mix strategies, a positive but not statistically
significant relationship between competitive rivalry and marketing mix strategies, and a
negative non-significant effect on the choice of marketing mix strategies. Distribution
channels, as micro-environment factors, have a positive and statistically significant influence
on the marketing mix strategy of retail outlets in Kenya. The regression results showed that
direct distribution had a positive and statistically significant effect on marketing mix strategies.
Indirect distribution had a positive effect on marketing mix strategies, but the effect was not
statistically significant, while there was a negative relationship between intensive distribution
and marketing mix strategies.
The study recommends that the retail outlets should upgrade store designs and product display
formats, increase the availability of store information online to aid information searches, and
align operational hours according to customers shopping habits such as time of the day,
weather, or season. The retail outlets should establish competitive prices, increase the quality
of products offered, increase promotions, and stock highly established brands. Finally, with
regard to customer satisfaction, the firm’s marketing strategies should focus on improving the
quality of service, staff responsiveness, and product quality. The retail outlets should innovate,
exploit economies of scale, and build capital reserves in anticipation of changing market
conditions and to respond to market opportunities before other competitors. Retail outlets
should improve the efficiency of product delivery to customers, investing additional resources
in marketing of stores and products.

vii
ACKNOWLEDGEMENT
I am thankful to my employer, fellow classmates and my family.
Special thanks to my supervisor Dr. Kiriri.

viii
DEDICATION
I dedicate this project to my family and friends. A special feeling of gratitude to my parents
Joseph and Cecilia Gichiri whose words of encouragement and push for tenacity ring in my
ears.
Special thanks to my siblings Martin Kiruthi, Maryann Wanjiru and my cousin Dennis Njiiri
who have supported me throughout the process.
I also dedicate this work to my MOD 2019 classmates for being the best cheerleaders during
the course of the entire Masters program.

ix
TABLE OF CONTENTS
STUDENT’S DECLARATION .......................................................................................................... iii
COPYRIGHT ...................................................................................................................................... iv
ABSTRACT .......................................................................................................................................... v
ACKNOWLEDGEMENT ................................................................................................................. vii
DEDICATION ................................................................................................................................... viii
LIST OF TABLES ............................................................................................................................... xi
LIST OF FIGURES ............................................................................................................................ xii
CHAPTER ONE ................................................................................................................................... 1
1.0. INTRODUCTION .................................................................................................................... 1
1.1. Background of the Problem .................................................................................................... 1
1.2. Statement of the Problem ....................................................................................................... 6
1.3. General Objective ................................................................................................................... 8
1.4. Specific Objectives ................................................................................................................. 8
1.5. Significance of the Study ........................................................................................................ 9
1.6. Scope of the Study ................................................................................................................ 10
1.7. Definition of Terms .............................................................................................................. 10
1.8. Chapter Summary ................................................................................................................. 11
CHAPTER TWO ................................................................................................................................ 12
2.0. LITERATURE REVIEW ...................................................................................................... 12
2.1. Introduction .......................................................................................................................... 12
2.2. Customers and Marketing Mix Strategy ............................................................................... 12
2.3. Competition and Marketing Mix Strategy ............................................................................ 19
2.4. Distribution Channels and Marketing Mix Strategy ............................................................. 25
2.5. Chapter Summary ................................................................................................................. 30
CHAPTER THREE............................................................................................................................ 32
3.0. RESEARCH METHODOLOGY .......................................................................................... 32
3.1. Introduction .......................................................................................................................... 32
3.2. Research Design ................................................................................................................... 32
3.3. Population and Sampling Design ......................................................................................... 33
3.4. Data Collection Methods ...................................................................................................... 35
3.5. Research Procedures ............................................................................................................. 35
x
3.6. Data Analysis Methods ......................................................................................................... 37
3.7. Chapter Summary ................................................................................................................. 38
CHAPTER FOUR .............................................................................................................................. 39
4.0. RESULTS AND FINDINGS .................................................................................................. 39
4.1. Introduction .......................................................................................................................... 39
4.2. Demographic Information .................................................................................................... 39
4.4. The Influence of Competition on Marketing Mix Strategy .................................................. 47
4.5. The Influence of Distribution Channels on Marketing Mix Strategy ................................... 51
4.6. Chapter Summary ................................................................................................................. 56
CHAPTER FIVE ................................................................................................................................ 57
5.0. DISCUSSION, CONCLUSIONS AND RECOMMENDATIONS ..................................... 57
5.1. Introduction .......................................................................................................................... 57
5.2. Summary............................................................................................................................... 57
5.3. Discussions ........................................................................................................................... 59
5.4. Conclusion ............................................................................................................................ 65
5.5. Recommendations ................................................................................................................ 66
REFERENCES ................................................................................................................................... 68
APPENDICES .................................................................................................................................... 74
APPENDIX I: INTRODUCTION LETTER .................................................................................... 74
APPENDIX 2: QUESTIONNAIRE ................................................................................................. 75
APPENDIX 3: LIST OF RETAIL OUTLETS ................................................................................. 79
APPENDIX 4: IRB APPROVAL .................................................................................................... 86
APPENDIX 5: NACOSTI PERMISSION ....................................................................................... 87
APPENDIX 6: NACOSTI RESEARCH LICENSE ......................................................................... 88

xi
LIST OF TABLES
Table 3.1: Reliability Coefficients……………………………………………………………36
Table 4.1: Customer Behavior……………………………………………………………….42
Table 4.2: Customer Preferences…………………………………………………………….44
Table 4.3: Customer Satisfaction…………………………………………………………….45
Table 4.4: Model Summary for Customer…………………………………………………...45
Table 4.5: ANOVA for Customer Model……………………………………………………46
Table 4.6: Regression Coefficients for Customer Model……………………………………46
Table 4.7: Threat of Entry……………………………………………………………………47
Table 4.8: Competitive Rivalry……………………………………………………………....48
Table 4.9: Substitutes………………………………………………………………………...49
Table 4.10: Model Summary for Competition Model……………………………………….50
Table 4.11: ANOVA for the Competition Model……………………………………………50
Table 4.12: Regression Coefficients for the Competition Model……………………………51
Table 4.13: Direct Distribution………………………………………………………………52
Table 4.14: Indirect Distribution…………………………………………………………….53
Table 4.15: Intensive Distribution…………………………………………………………...54
Table 4.16: Mode Summary for the Distribution Channel Model……………………………55
Table 4.17: ANOVA for Distribution Channel Model………………………………………55
Table 4.18: Regression Coefficients for Distribution Channel Model………………………56

xii
LIST OF FIGURES
Figure 4.1: Age of Respondents………………………………………………………………40
Figure 4.2: Gender of Respondents………………………………………………………….40
Figure 4.3: Level of Education……………………………………………………………….41
1
CHAPTER ONE
1.0. INTRODUCTION
1.1.Background of the Problem
Companies are increasingly operating in a dynamic and competitive environment, which
demand that they must pay attention not only to the needs and desires of consumers and their
ever-rising demands and expectations, but also understand the competition. In such an
environment, developing and executing an effective marketing strategy is key to profitability
and growth (Egboro, 2015). Companies employ marketing strategies to understand the
customer and competition and devise ways of persuading the customer to purchase and
consume their products and services (Maqin & Hendri, 2017).
Enterprises are influenced by dynamic changes in their micro and macro environments (Yam,
2016). Macro environment factors consist of the economic environment, the political
environment, the socio-cultural environment and the technological environment. These factors
determine variables such as income, living standards, interest rates, savings, and borrowing,
which affect an individual’s level of participation in the market. On the other hand, micro
environment factors consist of the people directly involved in the market and linked to
companies in ways that affect their capability to serve the market. The micro environment
includes customers, competitors, suppliers, distributors and other marketing intermediaries, as
well as the public itself (Yam, 2016).
Customers is the main component of the micro environment since the success of any good or
service in the market. Customers can be examined in terms of customer behavior, customer
experiences, and customer satisfaction (Datta, 2016). Customers are the people who buy the
product or service and enable a company to achieve its profitability objectives (Maqin &
Hendri, 2017). A customer refers to a person or entity that buys a product or service from a
seller (Nugroho & Irena, 2017). Studies such as Nugroho and Irena (2017) found out that
customer behavior is related to marketing mix and contribute to purchase intention. In the
study, customer behavior is captured as the cultural, social and personal psychological
indicators, and marketing mix is measured in terms of the marketing mix components: product,
price, place, and promotion. Arbaina and Suresh (2018) noted that marketing mix strategy can
2
also incorporate price, interior, promotional tool, location, range of products, experiential zone,
quality and availability dimensions. Using quantitative data analysis, researchers have
established a significant link between marketing strategies and consumer behavior (Mehrizi &
Zahedi, 2013).
Customer preferences are associated with marketing strategies. Customers with a high level of
preference have a lower likelihood of switching brands because high levels of satisfaction build
loyalty (Solaiman & Masri, 2017). Consumer preferences can be determined by consumers’
education level (Getzner & Grabner-Krauter, 2015) and also moderated by factors such as
market turbulence, technology, general economy, information of customer needs, intelligence
responsiveness, competition and management competency (Egboro, 2015). Miriti (2016)
established that consumer preferences have a positive and significant effect on marketing mix
strategies: product, price, place, and promotion, on consumer preference. On the contrary,
Sulaiman and Masri (2017) indicated that three components of marketing mix strategy,
notably; product, place, and promotion has a significant effect on consumer preference, while
the fourth component of marketing mix: price, did not have a significant effect on customer
preference for supplements and cosmetics in Malaysia. These studies show that the relationship
between consumer preferences and marketing mix strategies may differ according to industry
or country context.
Customer satisfaction is central to company performance. Consumers are happy when they
fulfil their desires. Shaw (2012) notes that consumer satisfaction can be achieved through
effective marketing strategies. The level of consumer satisfaction influences not only the
resources allocated to marketing but also the objectives and activities included in the marketing
strategy (Ebitu, 2014). According to Agyapong (2017), satisfied customers can spread word-
of-mouth communication about the company. Therefore, companies should identify, anticipate
and satisfy customer requirements (Azizi, Bagherzadeh, & Mombeini, 2015). There is a
significant relationship between the marketing mix and customer satisfaction and loyalty;
however, caution should be exercised in generalization of results (Wahab, Hasan, & Maon,
2016).
The second microenvironment factor under investigation is competition. Competition is
inevitable in every business environment. At the basic level, competition refers to an attempt
3
at winning something. Companies do this by attempting to achieve a higher level of success
comparative to other players (Kaunyangi, 2014). According to Michael Porter’s five forces
theory, the competitive forces are: threat of new entrants, competitive rivalry, threat of
substitutes, bargaining power of buyers and bargaining power of suppliers (Bukirwa &
Kisingu, 2017). The threat of new entrants has been found to influence how companies develop
their marketing strategies (Lawrence, 2011). A firm can threaten the market share of existing
firms if they have substantial resources to show up production and marketing, adopt pricing
strategies that can force bigger competitors to reduce their prices, and execute strategies that
allow it to tap into the market share of competitors (Chiteli, 2013).
Competitive rivalry depends on several factors such as differentiation between the products in
the market, brand loyalty by the buyers and price comparisons by the media. Companies will
apply the necessary strategies so as to retain their share of the market. A highly competitive
business environment results in competitiveness in prices, profitability and performance of
firms in the industry (Kaunyangi, 2014). The main strategies are low cost and differentiation
(Lawrence, 2011). There is a positive and significant relationship between industry
competition and corporate strategy (Ogaga, 2017). An industry’s competitive intensity has a
positive impact on marketing capability (Ocass & Weerawardena, 2017). Takata (2016) found
out that marketing capabilities is the strongest driver of business performance, followed by
competitive rivalry and the power of suppliers (Takata, 2016).
Substitutes influence how a brand performs in the market (Moriasi, Asienyo, & Okao, 2014).
A company’s marketing function entails the identification of substitutes in the market
(Mwaluma, 2014). Firms must invest in marketing strategies to identify the areas of growth, in
terms of possible but related products and services, or making a foray into an industry that is
not the traditional focus of the firm (Azzam, 2018). Introduction of new products or
modification of existing products are important in creating competitive advantage (Camison &
Lopez, 2010). Innovation allows firms to design substitutes that appeal to customers having a
special sensitivity to a particular attribute in the product (Karuoya, 2014). Studies have showed
that substitution influences marketing strategies such as pricing (Okelue, Uchenna, Obinne &
Nonye, 2012).

4
Distribution is the third dimension of microenvironment. Companies must consider the
channels necessary for delivering goods and services to the target markets. A distribution
channel is the route along which goods and services travel from the manufacturer/producer,
through market intermediaries, to the final user, the consumer (Segetlija, Mesaric, & Dujak,
2015). A distribution system is the network of organizations that link producer to customer
(Karanja, Muathe, & Kuria, 2015). A distribution channel can also be understood as an inter-
organizational network or a pathway that provides product flows from the producers to the
consumers. The distribution channel includes various intermediaries such as retailers and
wholesalers. The primary objective of a distributional channel is to bridge the gap between the
place of production and the place of consumption (Singh, 2016). Distribution can either be
direct, indirect, or intensive.
Direct distribution refers to a situation where the producer sells directly to the consumer
without passing the goods through intermediaries (Mwanza & Ingari, 2015). Direct distribution
implies that a company has made a marketing decision on how it wants to connect with the
customer. Koster (2018) investigated the direct distribution strategies for online retailers, and
found out that the choice of distribution strategy was mainly influenced by the complexity of
the product assortment (Koster, 2015). Karanja et al., (2017) demonstrated that distribution
strategy had a significant influence on intermediary performance.
Indirect distribution is where there are intermediaries such as retailers and wholesalers that
obtain products from the producer and sell these to the consumers (Mwanza & Ingari, 2015).
It is used by manufacturers of products such as TVs, scooters, refrigerators, washing machines,
cars, industrial machinery and equipment, among others. Kafaerpour (2015) showed that the
distribution strategy of Samsung Company in Iran influenced their choice of promotional
strategies. Aleksandra, Nada, and Marija (2107) reported that the efficiency of the distribution
channel has a significant effect on performance. Mwanza and Ingari (2015) established that
distribution strategies create competitive advantage, with direct distribution having greater
impact than indirect and intensive distribution strategies.
Intensive distribution is where a firm uses all available outlets to distribute a product. Examples
of products that use this strategy are bread, sweets, newspapers, chewing gums, soda, among
others are distributed to as many available outlets as possible. Intensive distribution informs
5
marketing since the objective is to sell products to as many outlets and consumers as possible.
Aila, Ondiek, Mise, and Odera (2015) investigated the impact of channel strategy on customer
value of soft drink companies in Kenya and found a strong correlation between stock
availability and sales. Marmullaku and Ahmeti (2015) showed that distribution channels have
a significant effect on marketing strategies: pricing, channel structure, and advertising
strategies.
Marketing strategy can be defined as a set of activities or processes for creating,
communicating, delivering and exchanging goods and services in the market. The purpose of
marketing strategy is to enhance purchase intention, and subsequently improve a company’s
sales volumes which can aid in achieving profit objectives in the long term (Nugroho & Irena,
2017). Marketing is done to increase awareness on products and services produced and
delivered in the market (American Marketing Association, 2013).
The marketing mix strategy incorporates four elements, the 4Ps, also known as the marketing
mix. These four controllable variables: product, price, place, and promotion, are manipulated
by a company in the creation of marketing strategies (Nugroho & Irena, 2017). A product is
the tangible good or intangible service that fulfils customer’s needs and expectations. The price
is the value of product offering, and pricing decisions influence supply and demand, product
positioning and profit margins. Promotion refers to the dissemination of product information
to customers, and these include activities such as advertising, public relations, and social media
marketing activities, among others. Finally, the place refers to the ideal locations where
customers can get the right product at the right place. In the digital world, the place also refers
to online platforms where interaction between the customer and the product occurs (Thieu,
Hieu, Binh, Huyen, & Hoang, 2017).
Shopping malls offer a variety of tenant mix, service offerings, and continually run
promotional and advertising campaigns. Thus, shopping malls aspire to provide the totality of
functional and emotional qualities to customers (Kiriri, 1, 2019a). They can be understood as
an aggregation of retail and other commercial establishments that are owned and managed as
a single property (Kotler & Armstrong, 2018). Shopping malls can also be defined as closed,
climate-controlled, lighted shopping centers having retail stored on both sides of an enclosed
walkways (Levy, Weitz, & Pandit, 2014).

6
At the core of a shopping mall is an anchor tenant, who is expected to attract both human and
vehicular traffic into the establishment. It is the traffic to the anchor tenant that is expected to
spill over and benefit non-anchor tenants (Kiriri, 2019a). A shopping mall is designed to attract
the attention of customers to product or service offerings, while also offering a convenient
access to an expanded mix of retailers in a safe, satisfying, and leisurely experience. In addition
to retail centers, shopping malls also provide restrooms, parking, playgrounds and other
amenities to enhance the shopping experience (Kushwaha, Ubeja, & Chatterjee, 2017). Studies
have showed that the performance of retailers in a shopping mall is significantly influenced by
the performance of the anchor tenant. Poor performance by the anchor tenant leads to reduced
business activities in the mall, reduced occupancy rates, low rental income, and general decline
as a result of reduced traffic (Kiriri, 2019a).
The origin of shopping malls can be traced to the United States; however, the phenomenon has
spread to other parts of the world. According to Kiriri (2019b) there have been a massive
growth of shopping malls in Africa over the last decade. An analysis by Sagaci Research (2018)
revealed that from 2011 to 2018, the number of malls increased from 225 to 581. South Africa
has the highest number of malls in Africa, followed by Egypt and Kenya. It was projected that
by 2020, there number of shopping malls in Kenya will grow to 73, making the country the
second largest provider of shopping center space in Sub-Saharan Africa (Sagaci Research,
2018). The shopping malls are concentrated in Nairobi, responsible for 60% of gross leasable
area (GLA), followed by Mombasa (10%) and Kisumu (7.4%) (Kiriri, 2019b).
1.2.Statement of the Problem
One of the key elements of a company’s success is developing the appropriate marketing mix
strategy. However, the marketing mix strategy is affected my micro environment factors;
however, companies continue to face challenges. First, companies cannot implement a one-
size-fits all market strategy as a result of continued differentiation in local markets. This is due
to the changing dynamics in the macro and micro environments. Secondly, the lower costs due
to competition and wider product offerings in the market have made it very difficult for
companies to capture and retain the attention of consumers (Yam, 2016).
Shopping malls provide a unique challenge for businesses. While shopping malls offer a
variety of tenant mix and service offerings, they are also placed where customers have a high

7
bargaining power. This is because the greater diversity of alternatives increases competition
among retailers in the malls, an aspect which can cause price sensitivity. In the absence of
increased customer demand, buyer bargaining power can push down profits. Further, according
to Kiriri (2019a) the performance of retailers in the shopping malls is related to the
performance of the anchor tenant. Poor performance of the anchor tenant as a result of reduced
traffic spills over to other retailers in the shopping mall.
While the understanding the competitive environment is important to strategic marketing,
Ocass and Weerawardena (2017) reiterates that there has been limited research in this area and
that research has failed to examine how the competitive environment affects the greater
understanding about its customers and competitors and how such knowledge can be used to
serve customers better. Further, few studies that have looked at micro environmental factors.
However, even for these studies, very few have studied the relationship between micro
environment factors and marketing mix strategy.
With regard to customers, Mehrizi and Zehedi (2013) examined how customer behavior is
related to marketing strategies in the household appliances market in Japan; Nugroho and Irene
(2017) focused on how consumer characteristics relate to marketing mix and purchase
intention in Indonesia; Arbaina and Suresh (2018) studied the link between consumer behavior
and purchase intention in Bangalore India; and Getzner and Grabner-Krauter (2015) looked at
the relationship between consumer preferences and marketing strategies in Austria. In Kenya,
Miriti (2016) examined the link between marketing strategy and consumer preference. In
general, there are few studies on customers, as a micro environment factor, and how it relates
to marketing mix strategy.
With regard to competition, a majority of studies drew the conceptualization of competition
from Michael Porter’s five competitive forces: threat of entry, threat of substitutes, power of
buyers, power of suppliers, and rivalry between firms. While there are studies on competition,
most of these are focused on how competition is related to business performance as opposed
to marketing strategy. Takata (2016) studied how competitive forces and marketing
capabilities influenced business performance, while Ocass and Weerawardena (2017) looked
at how competitive intensity affected marketing capabilities in a firm. In Kenya, Ogaga (2017)
studied the link between competitive forces and corporate strategy, Bukirwa and Kisingu
8
(2017) investigated the effect of competitive strategies on financial performance of hotels, and
Kaunyangi (2014) explored how competition was affecting the performance of
telecommunication firms.
With regard to distribution channel, Aila, Ondiek, Mise, and Odera (2015) tested whether
distribution factors such as order cycle time and stock availability had an effect on customer
value, measured as sales volumes and found a positive correlation. Kafaerpour (2015) studied
the influence of the distribution strategy on sale promotion at Samsung Company in Iran.
Mwanza and Ingari (2015) examined the role of distribution as a source of competitive
advantage in the FMCG market in Kenya. Marmullaku and Ahmeti (2015) studied factors
affecting three marketing strategies: pricing, market structure and advertising. These factors
were both macro and micro environment factors, as such the study was not limited to micro
environment factors or marketing mix strategy.
The analysis of existing literature shows that there is a research gap in studies focusing on the
influence of micro environmental factors on marketing mix strategy. This study will bridge the
gap in literature on the influence of micro environment factors: customers, competition, and
distribution channels on marketing mix strategy.
1.3.General Objective
The objective of the study was to investigate the influence of micro environment factors on
marketing mix strategy among retail business in shopping malls in Nairobi.
1.4.Specific Objectives
1.4.1. To investigate the influence of customers on marketing mix strategy among retail
business in shopping malls in Nairobi.
1.4.2. To establish the influence of competition on marketing mix strategy among retail
business in shopping malls in Nairobi.
1.4.3. To determine the influence of distribution channels on marketing mix strategy among
retail business in shopping malls in Nairobi.
9
1.5.Significance of the Study
The findings of the study were beneficial for the retailers in shopping malls, policymakers, and
academicians and researchers.
1.5.1. Retailers and Shopping Mall Owners
To beat the stiff competition in shopping malls, retailers must execute effective marketing
strategies in order to capture the customers, increase sales volumes and generate profitability.
This study examines the extent to which micro environmental factors influence marketing mix
strategy, hence insights generated from the study can be used by retailers to enhance their
marketing strategies and achieve profitability objectives.
1.5.2. Shopping Mall Owners/Investors
Since the shopping mall is an aggregation of retail and commercial establishments that provide
a closed, climate-controlled, shopping experience, studies on the relationship between micro
environment and marketing strategy provides important insights on the overall competitiveness
of the shopping mall. Highly performing constituent retailers, especially the anchor tenant, is
an indicator of the performance of the mall. The combination of individual marketing strategies
employed by retailers directly positions the mall in the market and can be used as a proxy
determinant of return on investment.
1.5.3. Policymakers
The shopping mall is an emerging development in Kenya. There has been a rapid expansion in
gross leasable area (GLA), particularly in Nairobi. Understanding the factors that influence
marketing strategies adopted by retailers in shopping malls and relationships with financial
performance can offer policymakers information necessary for building an enabling business
environment for retailers.
1.5.4. Academicians and Researchers
There is a paucity of research on how various macro environment and micro environment
factors affect the adoption and execution of various marketing strategies, particularly in Kenya.

10
The results of the study will also bridge the current gap in literature and inform the necessity
of further research.
1.6.Scope of the Study
The scope of the study was limited to an investigation of the relationship between three micro-
environment factors: customers, competition, and distribution channels, and marketing mix
strategies, with particular focus on 4P market-mix strategies. The study was geographically
limited to retailers operating in Nairobi County. The population was drawn from retailers
operating at the Village Market Mall. A total of 239 retailers operated in the mall. Data was
collected from the retailers using questionnaires. The data collection period was between April
and May 2020. The data collection phase encountered challenges originating from the
coronavirus pandemic. Due to the containment measures such as transport restrictions,
business closures, and social distancing, the researcher was unable to physically administer the
questionnaires to retailers. The problem of face-to-face administration of questionnaires was
mitigated by designing the questionnaire on Google Forms and administering the tool online,
by sending the respondents the link through emails.
1.7.Definition of Terms
1.7.1. Micro Environment Factors
Refers to the people or entities directly involved in the market and linked to companies in ways
that affect their capability to serve the market. The micro environment includes customers,
competitors, suppliers, distributors and other marketing intermediaries, as well as the public
itself (Yam, 2016).
1.7.2. Customer
A customer refers to a person or entity that buys a product or service from a seller (Nugroho
& Irena, 2017).
1.7.3. Competition
Competition can be understood as rivalry or simply two or more companies acting
independently to achieve greater success relative to others, with respect to the goods and
services they deliver in the market to satisfy customer needs and demands (Kaunyangi, 2014).

11
1.7.4. Distribution Channel
A distribution channel to an inter-organizational network or a pathway that provides product
flows from the producers to the consumers. The distribution channel includes various
intermediaries such as retailers and wholesalers (Singh, 2016).
1.7.5. Marketing Mix Strategy
Marketing strategy are the set of activities or processes for creating, communicating, delivering
and exchanging goods and services in the market. The marketing mix strategy incorporates
four elements, the 4Ps, also known as the marketing mix. These are controllable variables that
can be used by a company in the creation of marketing strategies (Nugroho & Irena, 2017).
1.7.6. Shopping Malls
These are closed, climate-controlled, lighted shopping centers having retail stored on both
sides of an enclosed walkways, that provide a variety of tenant mix, service offerings, as well
as restrooms, parking, playgrounds and other amenities to enhance the shopping experience
(Kushwaha, Ubeja, & Chatterjee, 2017).
1.8.Chapter Summary
Chapter One introduces the study. It presents the background of the problem by describing the
relationship between micro environment factors and marketing strategy. The chapter defines
and elucidates the relationship between three micro environment factors; notably, customers,
competition, and distribution channels, on marketing strategy, with particular interest in
shopping malls. After presenting the background of the problem, the chapter describes the
statement of the problem, outlines the purpose of the study and the research objectives, and
detail the significance of the study.
Chapter Two, is the literature review, and presents an empirical review of existing literature.
The review is aligned with the objectives presented in Chapter One and cover analysis on
customers and marketing mix strategy, competition and marketing mix strategy, and
distribution channels and marketing mix strategy. Chapter Three is the methodology chapter.
It details the research design, population and sample, data collection, and data analysis. Chapter
Four presents the results and findings of the study. Finally, Chapter Five presents the summary
of findings, discussions, conclusions and recommendations of the study.

12
CHAPTER TWO
2.0. LITERATURE REVIEW
2.1. Introduction
This chapter presents the empirical review, research gap, and summary of the chapter. The
empirical review is divided to capture the variables in the research objectives, with sub-sections
covering customers and marketing mix strategy, competition and marketing mix strategy, and
distribution channels and marketing mix strategy.
2.2. Customers and Marketing Mix Strategy
2.2.1. Customer Behavior
Consumer behavior can be defined as the characteristics relating to choosing, buying, using
and disposing a product or service in order to meet the needs of a customer (Nugroho & Irena,
2017). The American Marketing Association defines consumer behavior as “the dynamic
interaction of affect and cognition, behavior, and the environment by which human beings
conduct the exchange aspects of their lives” (Peter & Olson, 2010). Studies on consumer
behavior are not only interested in understanding the characteristics of a product that
consumers are more likely to purchase, but also the reasons why the consumer is making the
purchase. Knowledge of consumer behavior can be used to influence consumer decisions in a
number of social fields. Companies must understand consumer behavior in order to respond to
their needs and desires (Bakator, Ivin, Vukovic, & Petrovic, 2016).
One of the current fundamental assumptions in consumer behavior research is that individuals
often purchase products based on a subjective perception of product value. While this does not
mean that the basic functions of a product are not taken into account by individuals, these core
attributes of a product that relate to its primary utility are less important compared to the
subjective perception of the value of the product. What this means is that there is greater focus
on intangible attributes. As a result, consumer behavior research is interested in the profile of
consumers, what they want in a product, how they use a product, and how they react to a
product (Furaiji, Latuszynska, & Wawrzyniak, 2012). There are several characteristics of

13
consumer behavior, and they differ with regard to cultural, social, and personal factors
(Nugroho & Irena, 2017).
Customer behavior therefore encompasses all activities related to acquiring, consuming and
disposing products and services. It is concerned with problem recognition, information search,
alternative evaluation, purchasing and post-purchase evaluation (Lin, Li, & You, 2012). As a
result, understanding consumer behavior is critical in the building of a strong company.
Companies must collect information about different consumers so as to understand how they
are making purchasing decisions. In doing so, the questions or interest are: consumers’ opinion
about the products of companies and competitors, opinion about possible improvements of the
products, reaction to new products, thoughts about the products in use, attitudes about the
products, and hopes and dreams of the consumers about new, present and past products they
used (Hawkins, 2011). This information can inform changes in the market segments, capture
overall trends, and give the company an opportunity to respond and capitalize on consumer
demands (Hawkins, 2011).
Understanding customer behavior is also important because a company must consider the value
of a product or service from the viewpoint of the consumer. This means that even though
companies can set a price depending on various factors, they cannot be blind to the customers’
perceptions about the pricing. A higher price, in the absence of sales, does not lead to a bigger
profit. As a result, companies can focus on increasing sales volumes as a better strategy.
However, to do that, they must keep tab of the reactions and needs of the consumers. It is on
this basis that consumer behavior relates to the formulation of marketing strategy (Bakator,
Ivin, Vukovic, & Petrovic, 2016).
In a study by Nugroho and Irena (2017), the researchers looked at the various psychological
factors as indicators of consumer behavior and investigated how they relate with the marketing
mix and contribute to purchase intention. The product of interest in the study was a brand
designated as “W” which was the biggest brand in the Halal cosmetics market in the Asia
Pacific region, with particular focus on Indonesia. The researchers used a mixed method
incorporating both the qualitative and quantitative elements. Questionnaires were used to
collect data from a sample size of 114 respondents. Using multiple regressions, the results
show that the marketing mix components (product, price, place, promotion) and the customer

14
characteristics (cultural, social, and personal influences) had a significant effect on purchase
intention.
In the same vein, Arbaina and Suresh (2018) studied the determinants of consumer behavior
in the sports wear market in India and how it affects purchase intention. The researchers
selected a sample size of 207 participants. All the participants were drawn from Bangalore city.
Data was collected using questionnaires and analyzed using SPSS for descriptive and
inferential statistics. The determinants under study included price, interior, promotional tool,
location, range of products, experiential zone, quality and availability. The findings revealed
that all these determinants have a significant effect on consumer behavior.
Other researchers have looked into the association between customer behavior and marketing
strategies. In Mehrizi and Zahedi (2013), marketing strategies was held as the independent
variable while customer behavior was the dependent variable. The study focused on marketing
strategies and how they are applied in internet driven markets. The e-markets in question was
the household appliances market in Japan. The objectives of the study were to identify the
patterns of consumer behavior in e-markets, identify the market strategies that were being used,
and use a model to determine how marketing strategies relate to customer behavior. The three
strategies identified were trade-oriented, cooperative and intelligent e-marketing strategies. A
qualitative research method was applied, with grounded theory and Atlas TI software used in
analysis. Additionally, quantitative data was collected and analyzed using SPSS-15 software.
Hierarchical cluster analysis, partial correlation, and stratified regression were employed to
establish relationships. Qualitative data analysis revealed that consumers of household
appliances could be categorized as sentimental, rational and intelligent consumers. Using
quantitative data analysis to establish the relationship between the three marketing strategies
and three categories of consumers, found that there is a significant link between marketing
strategies and consumer behavior (Mehrizi & Zahedi, 2013).
2.2.2. Consumer Preferences
Customer preferences is a related construct to customer behavior. According to Sulaiman and
Masri (2017), preference refers to feelings of pleasure or disappointment that results from the
consumption of a product relative to other products. Businesses aim achieve higher levels of

15
consumer preference for their products, because consumers may switch to other competitive
offers if they are delivered by competitors in the market. Customers with a high level of
preference have a lower likelihood of switching brands because high levels of satisfaction build
loyalty (Solaiman & Masri, 2017). Marketers must understand customer preference as it
influences the effectiveness of the marketing strategy.
Consumer preferences are influenced by a number of underlying factors. Getzner and Grabner-
Krauter (2015) investigated the relationship between consumer preferences and marketing
strategies, with regard to the market for green products in Austria. The study was interested in
socially responsible investments in green shares. It looked at the underlying consumer
characteristics such as demographic variables (education) and individual attitude variables and
how they relate to shares for green companies. The findings revealed that consumers’ education
level was significantly associated with green shares investment. Further, consumers’
willingness to invest in green shares was also significantly associated with the increase in green
shares investment.
A study based in Nigeria examined marketing challenges, identify factors influencing changing
consumer preferences and expectations, and ascertain the relationship between marketing
strategies and consumer preferences and expectations. Egboro (2015) investigated the
marketing challenges influencing the satisfaction of changing consumer preferences and
expectations. Data was collected from a stratified sample of 120 senior staff from a roofing
sheet firm in Enugu state. The study found out that the challenges included market turbulence,
technology, general economy, information of customer needs, intelligence responsiveness,
competition and management competency. All these factors had a significant effect on
consumer preferences.
In terms of the relationship between consumer preferences and marketing mix strategies, Miriti
(2016) studied the influence of marketing strategy on consumer preference. The study focused
on private retail brands in Nairobi City. The objectives entailed determining the influence of
the components of the marketing mix strategy: product, price, place, and promotion, on
consumer preference. Simple random sampling was used to select 90 respondents and
questionnaires were administered to collect data, which were then analyzed using SPSS 20.

16
The findings indicated that the marketing mix strategies had a positive and significant effect
on consumer preferences (Miriti, 2016).
Further, Sulaiman and Masri (2017) investigated the influence of marketing mix on consumer
preference. The researchers focused on the supplements and cosmetics market in Malaysia.
The study was conducted at the University Utara Malaysia. Probability sampling was used to
select a sample size of 379 students from a population of 27,945 students at the University.
Data was analyzed using Pearson correlations and regression analysis. Correlation analysis
indicated that there was a moderate correlation between marketing mix and consumer
preference, while regression analysis indicated that three components of marketing mix
strategy, notably; product, place, and promotion has a significant effect on consumer
preference, while the fourth component of marketing mix: price, did not have a significant
effect on customer preference for supplements and cosmetics in Malaysia.
2.2.3. Customer Satisfaction
Consumer satisfaction refers to the perceived fulfilment of the desires of the consumer after
utilizing a product or a service. Companies are interested in consumer satisfaction because it
is an indicator that is used to allocate budgets to marketing activities. Shaw (2012) notes that
consumer satisfaction can be achieved through effective marketing strategies. These marketing
strategies must be based on identifying the expectations of consumers in terms of product,
price, promotion and place dimensions of the marketing mix strategy. Marketers understand
that adequately satisfying the demands of consumers while attracting new customers is crucial
for overall financial performance of the company. This means that the level of consumer
satisfaction influences not only the resources allocated to marketing but also the objectives and
activities included in the marketing strategy (Ebitu, 2014).
To this end, strategy then is the set of specific plans put in place to achieve specific goals and
objectives over a given period of time. Strategy is the broad statement on how an organization
allocates resources for the achievement of certain ends. Marketing strategy must align with the
demands and satisfaction of consumers to generate insights into competitiveness, achieve
increased sales volumes and forecast future performance. Marketing strategy can be long term
or short term, however, irrespective of the duration, the organization, formulation, evaluation

17
and selection of market-oriented strategies as well as the successful implementation of these
strategies is determined by the level of customer satisfaction (Youjae, 2010).
Customer satisfaction is therefore an indicator of marketing strategy as well as being a
performance indicator. In a competitive marketplace where business organizations compete for
customers, consumer satisfaction is seen as a key differentiator and increasingly has become a
key element of business strategy. Consumer satisfaction provides leading indicator of
consumers purchase intention and loyalty. The central focus of consumer satisfaction on the
part of the supplier is to narrow the gap between consumers’ expectations and perceived
performances of the product or service. The concept is emphasizes delivering satisfaction to
consumers and obtaining profits in return (Ebitu, 2014).
Customer satisfaction can influence a company to grow its competitiveness and occupy a
market leader position in the industry. Customer satisfaction can have a positive effect on
customer loyalty, which is an essential part of keeping a company competitive in the long term.
Customers who are satisfied with the products can help in spreading positive word-of-mouth
communication about the company. This can increase not only performance but also the
corporate reputation of the company (Agyapong, 2017). Companies that cannot satisfy their
customers cannot succeed in overtaking competitors with higher customer satisfaction levels.
The importance of customer satisfaction has brought into the fore the concept of relationship
marketing. The idea of relationship marketing holds that companies should identify, anticipate
and satisfy customer requirements (Azizi, Bagherzadeh, & Mombeini, 2015). According to a
model developed by Hao and Ngo (2012), relationship marketing requires trust, links,
communication, joint ventures, and empathy as determinants of customer satisfaction.
Trust is a key component of a trading relationship and shows that to what extent each part can
count on the other party. Trust is a central variable in long terms exchanges. The success of a
relationship is in fact highly depended on the trust between customer and service provider.
Links relate to the link established between both parties of a relationship (seller and buyer) and
plays a vital role in an integrated status to achieve desired aims. Its
existence in relationship marketing develops customer’s loyalty and it directly creates the
feeling of belonging to the relationship and indirectly to the organization. Empathy allows both
18
parties of a relationship to study the status quo in the view of other party. Empathy is to
understand demands and aims of the other party. Empathy is a
necessary condition to foster mutual relations. Tendency to answer other people’s emotional
mood by a similar emotional mood is called empathy. It means that an individual can
understand the problems of other people even when he/she is not under such circumstances
and to respect and value their opinions and feelings (Azizi et al., 2015). In terms of
communications, relationship marketing is profitable when the management of interactions,
relations and networks are changed to a fundamental issue. Relationship marketing plans to
communicate targeted customers and to keep and foster such relationship by which the goals
of both parties are met (Amini et al., 2010). Another component of relationship marketing is
the mutual relation which causes that each party provides special facilities in next steps based
on received advantages. Finally, joint values include joint beliefs of both parties one behaviors,
goals and policies whether they are important, proper and right or lower important, improper
and wrong. Such joint values and goals lead into more commitment to relationship
(Ogechukwu, Umukoro, & Oboreh, 2013).
Customer satisfaction is also related to customer loyalty. Marketers need to know the needs
and preferences of customers, build products and services that can satisfy them, and focus on
maintaining and retaining a long-term relationship with customers. For customers to be
satisfied, marketers must know the elements of the marketing mix that are more important for
attracting and maintaining the customers. An example of this is the Wahab, Hasan, and Maon
(2016) study that looked into the customer satisfaction for hijab. The researchers note that,
over the past years, the demand for hijab has increased rapidly, and with several brands of hijab
in the market, marketers must consider the designs, patterns, fabrics, colors, labels, and brands,
that would appeal to customer shopping both on online ecommerce sites and physical shops.
As a result, marketers must understand the demands of customers while also evaluating the
hijab delivered by competitors in the market. To establish whether there was any link between
customer loyalty and marketing mix strategy, a total of 234 Alam outlets selling hijab products
participated in a survey. The findings revealed that there was a significant relationship between
the marketing mix and customer satisfaction and loyalty. However, the researchers cautioned
against generalizing the results, calling for more investigations of other outlets, other than the

19
Shah Alam, for a more in-depth understanding of the phenomenon (Wahab, Hasan, & Maon,
2016)
2.3. Competition and Marketing Mix Strategy
2.3.1. Threat of New Entrants
The threat of new entrants is a component of the Porters five forces theory. It refers to the
threat that is caused by new competitors in the market. Profitability in the industry attracts
more competitors with the intention of also gaining from the profit opportunities. When the
barriers of entry are low or does not exist, it means that it is easy for new competitors to enter
the market and this poses a threat to existing players. Increased competition spurs production,
and in the absence of increased consumer demand, it is likely that the profit levels will
decrease. In cases where the barriers of entry are high, new entrants will find it difficult to enter
and exploit profit opportunities in the market (Lawrence, 2011).
The level of the threat posed by new entrants is influenced by several factors. The presence of
well-established brand names increases the level of barriers. High upfront capital investments
lower the threat of new entrants. Markets that have high consumer costs also have higher
barriers to entry. In the opposite cases, markets that do not have well-established and highly
competitive brand names, require low initial capital investments and have low consumer
switching costs have higher threats of entry. Further, if the market does not require economies
of scale and products are undifferentiated, new entrants find it easy to penetrate and exploit
profit opportunities. In summary, the threat of entry is influenced by the levels of production,
differentiation of products, initial capital, switching costs, access to distribution channels,
presence of proprietary technology, and government policy regulations, among other things
(Kaunyangi, 2014).
A firm can threaten the market share of existing firms if they have substantial resources to
show up production and marketing, adopt pricing strategies that can force bigger competitors
to reduce their prices, and execute strategies that allow it to tap into the market share of
competitors (Chiteli, 2013). Mergers and acquisitions also present an alternative through which
resources can be deployed to achieve economies of scale and shake up an industry.

20
2.3.2. Competitive Rivalry
The relative position of a firm in the industry is influenced by its ability to withstand, survive,
and over-compete other companies in the same industry. Withstanding competitive rivalry
ensures that a firm can get above average profitability in the long term. Competitive rivalry
depends on several factors such as differentiation between the products in the market, brand
loyalty by the buyers and price comparisons by the media. Competitive rivalry will also be
high where it‘s costly to leave the industry hence they fight to just stay in (exit barriers); where
the market growth rates are low (growth of a particular company is possible only at the expense
of a competitor); where high strategic stakes are tied up in capital equipment, research or
marketing and where capacity can only be increased by large amounts. In such a scenario,
companies will apply the necessary strategies so as to retain their share of the market. A highly
competitive business environment results in competitiveness in prices, profitability and
performance of firms in the industry (Kaunyangi, 2014).
There are various ways through which a firm can achieve competitive advantage in an
environment of highly competitive intensity. The main strategies are low cost and
differentiation. A firm should pursue cost leadership, differentiation and focus in order to win
competitive rivalries (Lawrence, 2011). Ogaga (2017) investigated the relationship between
industry competition and corporate strategy. Industry competition was measured via entry
barriers, rivalry, buyer’s bargaining power, suppliers’ bargaining power, substitutes,
government, logistics and power play, while the measures of strategy were differentiation, cost
leadership, focus and strategic alliance. In essence, this study focused on corporate strategy as
opposed to marketing strategy. The sample included 63 companies listed at the Nairobi
Securities Exchange as at June 2015. Using hierarchical regression, the results revealed that
industry competition has a moderating effect on the association between corporate strategy and
organizational performance (Ogaga, 2017).
There are various studies that have been done to test the relationship between competitive
rivalry and marketing in various industries across the world. O’Cass and Weerawardena (2017)
sought to determine whether there was a link between an industry’s competitive intensity and
marketing related capabilities. The conceptualization of competitive intensity was based on
Porter’s theoretical framework, which held that an industry’s competitive intensity is
21
determined by the five competitive forces: threat of entry, threat of substitutes, power of
buyers, power of suppliers, and rivalry between firms. In the research marketing abilities are
conceptualized as capabilities built on the premise that all capabilities have common
underlying characteristics. As such, it implies capabilities that are built upon processes that are
developed by firms depending on their internal people and resources. The sample included
CEOs from the IncNet Business Database. From a population of 1000, 247 respondents
proceeded to the study. The regression results revealed that an industry’s competitive intensity
has a positive impact on marketing capability (Ocass & Weerawardena, 2017).
Another study, Takata (2016), tested the effect of industry forces, market orientation, and
marketing capabilities on business performance among Japanese manufacturers. The industry
forces in these cases were the five forces of competition outlined by Porter’s five forces theory:
threat of new entrants, competitive rivalry, threat of substitutes, bargaining power of buyers
and bargaining power of suppliers. The marketing capabilities captured in the study were new
product development, pricing, channel management, and marketing communication. The
survey comprised of 568 Japanese manufacturing companies drawn from a population of 1000
firms listed at the Tokyo Stock Exchange. Data covered the 2009 to 2011 period. Hypotheses
were tested using PLS-SEM and the study found out that marketing capabilities is the strongest
driver of business performance, followed by competitive rivalry and the power of suppliers
(Takata, 2016).
Githaiga, Namusonge, and Kihoro (2016) explored empirical data on the relationship between
marketing strategies and competitiveness among micro and small entrepreneurs in Kenya. The
core of the study was on how entrepreneurial marketing orientation of SMEs help them to
achieve competitiveness. The researchers presented a systematic review of studies that have
used Michael Porter’s Diamond Analysis Model, and how marketing strategies and
competitiveness have been conceptualized in research. The findings showed that adopting a
certain marketing strategy can have a significant effect on firm competitiveness. The study was
a review of empirical literature and therefore did not present statistical analysis of primary data
(Githaiga, Namusonge, & Kihoro, 2016).

22
2.3.3. Threat of Substitutes
A substitute can be defined as a good or service that performs the same function to the buyer.
Substitution comes in different forms and serves various functions in the industry, due to the
fact that they influence the buyer in a different way (Moriasi, Asienyo, & Okao, 2014).
Identification of substitutes in the market is a primary function of market analysis so as to
generate accurate and reliable information for developing a market strategy (Mwaluma, 2014).
Every organization needs to identify the current and future marketing opportunities. This
identification usually involves analysis of the current products that a company delivers and the
markets where they are delivered. No firm can depend on the same products and the same
markets forever, they must invest in marketing strategies to identify the areas of growth, in
terms of possible but related products and services, or making a foray into an industry that is
not the traditional focus of the firm (Azzam, 2018). Increased competitive pressures force
companies to establish new strategies that can enable them to achieve competitive advantage
and enhance performance. One of the ways of doing this is innovating new products.
Introduction of new products or modification of existing products are important in creating
competitive advantage (Camison & Lopez, 2010).
There are various factors that can increase the number of substitutes in the market. These
include the dynamic changes in the economy at large, population demographics, societal values
and lifestyles, governmental legislation and regulation, technological factors, and the
company’s immediate industry and competitive environments (Moriasi, Asienyo, & Okao,
2014). Substitutes are designed to appeal to customers having a special sensitivity to a
particular attribute in the product. In such cases, customers are willing to pay a premium price
in order to get a particular attribute in a product (Karuoya, 2014). As such, substitution is
central to a firm’s profitability because it determines demand. The entry of a substitute from a
competitor can either lead to firm growth or cause a decline in profits. This means that
substitution influences competitive scope because it widens or narrows down the range of
product segments that are available in the market. Substitutes also limit the potential returns of
an industry by placing a ceiling on the prices that firms in that industry can profitably charge
(Chiteli, 2013).
23
In a broad sense, all firms in an industry are competing, in a broad sense, with industries
producing substitute products. Substitutes limit the potential returns of an industry by
placing a ceiling on prices firms in the industry can profitably charge. The more attractive the
price performance alternative offered by substitutes, the firmer the lid on industry
profits (Porter, 1998). Substitutes not only limit profits in normal times, but they also
reduce the bonanza an industry can reap in boom times. Substitutes are bound to be an
ever stronger limit on profitability once capacity is boosted enough to meet demand. Evidence
from the banking sector shows that the intensity of competition influences the price of products
and services, which are, in turn, assumed to determine firms’ profits (Okelue, Uchenna, Obinne
& Nonye, 2012).
The competitive advantage from product price-performance is almost short term, especially in
an era where technologies are altering the existing business boundaries. Advantages can only
be sustained through competence that is enjoyed at the very roots of products. Position vis-à-
vis substitute products is a matter of collective industry actions such that for example although
advertising by one firm may not be enough to bolster the industry’s position against a
substitute, heavy and sustained advertising by all industry participants may well improve the
industry’s collective position. Similar arguments apply to collective response in areas like
product quality improvement, marketing efforts, providing greater product availability
(Chiteli, 2013).
Substitute products that deserve the most attention are those that are subject to trends
improving their price performance trade off with the industry’s product, or are produced by
industries earning high profits. In the latter case, substitutes often come rapidly into play if
some development increases competition in their industries and causes price reduction or
performance improvement. Analysis of such trends can be important in deciding whether to
try to head off a substitute strategically or to plan strategy with it as inevitably a key force.
Pressure from substitute products because substitute products limit the potential returns of an
industry by placing ceilings on prices firms in the industry can charge. Suppliers can exert
bargaining power over participants by threatening to raise prices or reduce quality of purchased
goods and services. They can thus squeeze profitability out of an industry (Moriasi, Asienyo,
& Okao, 2014).

24
The threat of substitution is downstream or indirect, when a substitute replaces a buyer
industry's product. Substitutes are always present, but they are easy to overlook because they
may appear to be very different from the industry's product. It is a substitute to do without, to
purchase a used product rather than a new one, or to do it yourself (bring the service or product
in-house). When the threat of substitutes is high, industry profitability suffers. Substitute
products or services limit an industry's profit potential by placing a ceiling on prices. If an
industry does not distance itself from substitutes through product performance, marketing, or
other means, it will suffer in terms of profitability and growth potential (O’Cass &
Weerawardena, 2017).
The threat of a substitute is high if: it offers an attractive price-performance trade-off to
the industry's product. The better the relative value of the substitute, the tighter is the lid
on an industry's profit potential, the buyer's cost of switching to the substitute is low.
Strategists should be particularly alert to changes in other industries that may make them
attractive substitutes when they were not before. In this way, technological changes or
competitive discontinuities in seemingly unrelated businesses can have major impacts on
industry profitability. Customer loyalty also protects a firm from threat of new entrants and
threat of substitute products. The firm adopting focus strategy can easily stay closer to its
customers and effectively monitor their needs (Mutai, 2012).
The focus of strategy should be to target market segments that are less vulnerable to substitutes
or where a competition is weakest to earn above-average return on investment. Organizations
can make use of the focus strategy by focusing on a specific niche is sometimes referred to as
the niche strategy. Firms pursuing this strategy are willing to serve isolated geographic areas,
satisfy needs of customers with special financing, inventory or servicing problems or even to
tailor the products to somewhat unique (Moriasi et al., 2014).
Established firms have brand identification and customer loyalties, which stem from past
advertising, customer service, product differences or simply being first into the industry.
Differentiation creates a barrier to entry by forcing entrant to spend heavily to overcome
existing customer loyalties (Mutai, 2012). This effort usually involves startup losses and often
takes an extended period of time. Such investments in building a brand name are particularly
risky since they have no salvage value if entry fails. Product differentiation will thus enhance

25
the overall capability of the organization in terms of improving on its products, which will in
turn attract more customers and consumers (Githaiga et al., 2016).
Products in the hospitality industry and telecommunications are mainly substitutes. In a study
of the hotel industry, Bukirwa and Kisingu (2017) looked at those competitive strategies that
firms are adopting to enhance performance. The study was focused on hotels operating in
Mombasa County in Kenya. The study was also founded on Porter’s competitive forces, with
strategies being cost leadership and differentiation. The population consisted of 24 classified
hotels under the Kenya Association of Hotel Keepers and Caterers, from which 144
respondents were drawn. The respondents were administered questionnaires, the responses
from which proceeded to analysis using SPSS 22. Linear regression results demonstrated that
competitive strategies have a positive and significant effect on organizational performance
(Bukirwa & Kisingu, 2017).
With regard to the mobile telecommunications sector in Kenya, Kaunyangi (2014) studied
competition how it affected performance. It looked at three out of the five competitive forces
in Porter’s framework: threat of new entrants, competitive rivalry, and bargaining power of
buyers. The data was collected from the main telecommunications firms in Kenya in 2014:
Airtel Kenya, Orange Kenya, Safaricom, and Yu Mobile. Descriptive statistics showed that
there was a moderately high level of agreement that the competitive forces were affecting
performance. However, the study did not run inferential statistics making it difficult to
establish the relationship between the competitive forces and measures of financial
performance in the industry.
2.4. Distribution Channels and Marketing Mix Strategy
2.4.1. Direct Distribution
The ability to develop a successful strategy in distribution is critical in today’s complex and
fierce competitive environment (Mwanza & Ingari, 2015). Direct distribution refers to a
situation where the producer sells directly to the consumer without passing the goods through
intermediaries. Direct distribution typically entails face-to-face selling, selling over the internet
or mails, so long as there is no distributor, other than the producer. Distribution channels that
26
involve producers selling to nonaffiliated retailers cannot be direct distribution because such
unaffiliated retailers and wholesalers are not the final consumers of the goods.
The choice of direct distribution is informed by a strategy that wants to connect the producer
directly with the consumer so as to lower the overhead. Since, the producer does not share
profits with distributors such as retailers and wholesalers, companies that use direct distribution
have comparatively higher rates of profit (Aleksandra et al., 2017). However, direct
distribution has the disadvantage that it cannot compete with companies that have an extensive
global reach and distribution channel that includes many wholesalers and retailers. Further,
there are limitations with regard to the kind of products that can be sold directly by the producer
to the consumer (Singh, 2016).
Distribution strategies have the overall goal of improving customer experiences. As a result,
distribution is planned with the objective of increasing positive consumer experiences through
the selection of a channel mix, including physical stores, that enrich the experience of
consumers at the point of service, offer value-added services, and serve as a point of research
that can be used to collect information from consumers. It should be noted that distribution
offers companies the opportunity to partner with upstream and downstream activities so as to
enhance efficiencies and control costs. Further, consumers can also partner with other actors
in the supply chain to support process and product innovation (Mwanza & Ingari, 2015).
A study by Koster (2018) looked at the direct distribution strategies for online retailers. The
study noted that online retailers continue to face challenges in organizing their logistic
fulfilment processes after a transaction has been made. The study sampled 55 online retailers,
including those that were exclusively online and those that were traditional with an online
component. The distribution variables studied were delivery lead times, assortments choice,
and the number of online orders. The results showed that the choice of distribution strategy
was mainly influenced by the complexity of the product assortment (Koster, 2015).
Most direct distribution channels utilize the internet to deliver the products. In the mobile and
telecommunications sector, this is the channel of choice for distributing products such as
airtime. Karanja et al., (2017) sought to establish the influence of the distribution strategy on
mobile service providers (MSP) intermediaries. There have been attempts by MSPs to bypass
27
their intermediaries who distribute scratch cards by providing the same services through web-
based recharge platforms. However, MSP intermediaries have also been implementing
different channel strategies have not been studied. The sample selected for the study consisted
of 219 respondents out of 397 intermediary companies operating in Nairobi County and
servicing the four major telecommunications companies: Safaricom, Airtel, Essar and Orange
Telkom. The distribution strategies captured in the study were choice of distribution strategy,
warehousing, operations administration, manpower, customer service and routing. The
regression analysis showed that distribution strategy had a significant influence on
intermediary performance (Karanja et al., 2017).
2.4.2. Indirect Distribution
Indirect distribution refers to a channel where there are intermediaries such as retailers and
wholesalers that obtain products from the producer and sell these to the consumers. Indirect
distribution means that a product moves from the producer, through the distributors,
wholesalers, and retailers, before it can reach the consumer (Koster, 2018). The difference
between direct and indirect distribution is that while there is a direct link between producer
and consumer in direct distribution, there is no direct link between producer and consumer in
indirect distribution (Kafaerpour, 2015).
Most manufacturers of consumer durables such as TVs, scooters, refrigerators, washing
machines, cars, industrial machinery and equipment, among others, use indirect channel of
distribution (Singh, 2016). Other goods include consumer products like cosmetics, detergents,
and soaps. Other consumables such as food grains, clothes, edible oil, sugar, among others also
uses this strategy. It is a convenient strategy that allows goods to be distributed to large scale
retailers. The products that are mostly distributed through this channel enjoy a scattered
demand. Compared to direct distribution, it is the longest distribution channel as a result of
distributors, wholesalers and retailers. As a result of the number of intermediaries, the producer
loses control of the distribution. The speed of delivery may also be slow before the goods reach
the consumers (Marmullaku & Ahmeti, 2015).
In a study by Kafaerpour (2015), which focused on the influence of the distribution strategy
on sale promotion at Samsung Company in Iran, can be understood to primarily focus on direct

28
distribution. The elements of distribution incorporated in the study were stock (in terms of
stock availability, supervision of distribution agents, supervision on product delivery time),
and distribution channels (in terms of sales offices of the company, distribution agents of the
company, supervision of products delivery companies). The findings showed that there is a
slight difference in the importance of stock attributes and distribution attributes at Samsung
Company, but all the attributes had a positive effect on sales promotion (Kafaeipour, 2015).
Indirect distribution typically involves reliance on large retail outlets. Aleksandra, Nada, and
Marija (207) examined the success of distribution channels of retail chains in Republic of
Serbia. The focus was on the 10 largest retail chains in the country. The researcher noted that
distribution channels are becoming increasingly sophisticated, and the performance of the
entire channel has an effect on the manufacturer and the consumer. The study focused on
retailers, as a core intermediary in the distribution channel, in order to understand the partner’s
view, and whether their performance can be used as an indicator of the success of a distribution
channel. The regression results showed that the performance and the role of the retailers
depends on the size of the sales network and the number of sales facilities. The findings also
showed that the largest retail chains are under performing, meaning that the efficiency of the
distribution channel has a significant effect on performance (Aleksandra, Nada, & Marija,
2017).
In the same way, Mwanza and Ingari (2015) examined the role of distribution as a source of
competitive advantage in the FMCG market in Kenya. The study tested how the different types
of distribution: direct distribution, indirect distribution, and intensive distribution, affected the
ability of a firm to create and maintain competitive advantage. Descriptive statistics was used
to analyze the data collected using questionnaires. The findings showed that all the three
strategies were responsible for creating competitive advantage, with direct distribution having
greater impact than indirect and intensive distribution strategies.
Sameer Africa is a manufacturer of vehicle tires and their choice of distribution is the indirect
channel. Adimo and Osodo (2017) was interested in the association between distribution
channel differentiation and organizational performance. The study focused on Sameer Africa
Limited. A sample of 134 respondents were drawn from the company, which included senior
management, heads of department, junior staff and dealers based in Nairobi. The data collected
29
using questionnaires was analyzed using correlation and regression analysis. The findings
revealed that an improvement in channel differentiation strategy by using market trends in
determining the most appropriate channel; using different channels so as to minimize
distribution costs; selling products through intermediary and complimentary firms; and using
different distribution channels to satisfy unique consumer needs, resulted in improved
performance, as measured by market share, revenue growth, sales growth, and customer
satisfaction (Adimo & Osodo, 2017).
2.4.3. Intensive Distribution
Intensive distribution, as the name suggests, means utilizing all available outlets to distribute
a product. Intensive distribution is pursued so as to increase consumer convenience and
satisfaction. Goods such as bread, sweets, newspapers, chewing gums, soda, among others are
distributed to as many available outlets as possible. It informs marketing strategy, when the
objective is to sell the product to as many outlets and customers as possible (Aila et al., 2015).
The primary characteristics of intensive distribution are: maximum number of outlets covered
to maximize availability; target outlets in as many as geographical regions as possible;
consumer convenience products; high number of purchasers; high purchase frequency;
impulsive purchase and low price (Marmullaku & Ahmeti, 2015). Intensive distribution is
pursued when the manufacturer wants to establish a dominant position in the geographic
markets that it serves. This, however, is not limited to indirect distribution. In general,
companies develop distribution strategies with the intention of pursuing dominance and
building long-term commitments with partners on the supply chain and customers. It is these
relationships that influence marketing decisions (Segetlija et al., 2015).
An example of an intensive distribution strategy is that of soft drinks. Aila et al. (2015)
investigated the impact of channel strategy on customer value of soft drink companies in
Kenya. The study sought to establish the link between distribution strategies such as order
cycle time, stock availability, and sales on customer value. The sample consisted of 88 soft
drink companies that were contracted by Equator Bottlers Limited to distribute their products
in Kenya. Using Pearson’s product moment correlations, stock availability and sales were
found to have a strong correlation, while there was a weak correlation between delivery speed

30
and sales. The correlation between order cycle time and sales was negative and weak. In
essence, higher sales were linked to higher stock availability (Aila et al., 2015).
Distribution represents a complex, specialized, sophisticated and coordinated supply chain in
developed countries and increasingly in many developing countries. The distribution sector
includes commission agents, wholesalers and retailers who act as enablers of trade. The
distribution strategy must be carefully integrated with all components of the marketing
program. Before a manufacturer formulates a distribution strategy, two decisions should occur.
These are determining whether the firm will sell directly to end-users or will utilize
intermediaries and selecting the type of channel. Distribution channels evolved through the
utilization of national resources contained within an area of trade. The need to move the
resources to other areas where they were in demand brought about the need for distribution
channels (Singh, 2016).
Marmullaku and Ahmeti (2015) studied the factors affecting marketing strategies; pricing,
channel structure, and advertising strategies. The distribution channels identified as challenges
were classified as traditional merchant wholesaler with global operations, foreign distributors,
export merchants, export management company, manufacturer’s export agents, resident buyer,
and third-party logistics provider. The study found out that as a result of the segmentation of
markets, product positioning and adoption of different strategies in different countries, the
execution of the marketing mix strategies differs and determine success (Marmullaku &
Ahmeti, 2015).
2.5. Chapter Summary
Micro environment factors influence various aspects of business performance; however, there
is minimal focus on how it influences marketing strategies. The literature review delves into
the three components of micro environment factors selected for this study, and critically
evaluates empirical studies that have been published so as to identify the nature of the
relationship between customers and marketing strategy, competition and marketing strategy,
and distribution channels and marketing strategy. In general, while studies have studied various
dimensions of customers, such as customer behavior and customer preference, these are mostly
correlated with measures of business performance, with a few touching on marketing

31
capabilities. With regard to competition, a majority of studies rely on Porter’s five forces
competitive forces and how these relate to business performance. Where the competitive forces
have been related to marketing dimensions, the focus has been on marketing capabilities of a
firm and rarely on marketing mix strategies. There were few studies that examined how
distribution strategies affected market mix strategy, most studies were interested in tackling
the link between distribution channel strategy and performance. The literature analysis shows
that there is a research gap in investigating the influence of micro environment factors on
market mix strategy. The next chapter is the methodology chapter that describes the research
design, population, sample, data collection and data analysis techniques.
32
CHAPTER THREE
3.0.RESEARCH METHODOLOGY
3.1.Introduction
Research methodology is a systematic way of applying the relevant methods to a field of study.
It is built on theoretical analysis within the branch of knowledge on which the study is
grounded. This chapter highlights the research design that will be adopted in the study and
justification, target population, sample, data collection techniques, and data analysis methods.
3.2.Research Design
Research design refers to the strategy used by the researcher in collecting and analyzing data.
It is the plan and structure of investigation conceived to obtain answers to research questions.
It also provides the guide for collecting and analyzing data. This study adopted a descriptive
design. Descriptive designs address specific characteristics of a selected population of subjects
at a point in time, or at varying times for the purpose of comparing the relationship between
variables (Leavy, 2017). Descriptive studies are concerned with finding out who, what, where,
when, and how much. They try to measure the types of activities, how often, when, where and
by whom. Descriptive cross-sectional surveys are helpful in revealing patterns and
connections that might otherwise go unnoticed. Unlike exploratory studies, descriptive studies
are structured, have clear hypothesis, and are guided by research questions (Creswell &
Creswell, 2017). Descriptive research measures variables or set of variables as they exist
naturally. The goal of descriptive research is not primarily concerned with relationships
between variables but rather with the description of individual variables (Cooper & Schindler,
2014).
The study investigated the relationship between micro-environment factors and market mix
strategies. The micro-environment factors captured by the independent variables: customers,
competition, and distribution factors. Customers was measured in terms of customer behavior,
customer experience, and customer satisfaction. Competition factors covered were threat of
entry, competitive rivalry, and substitutes. Distribution factors focused on direct distribution,
indirect distribution, and intensive distribution. The dependent variable was marketing-mix
strategies, measured based on the 4Ps conceptualization.

33
3.3.Population and Sampling Design
3.3.1. Population
A population element is the subject such as a person an organization, customer database, or the
amount of quantitative data on which the measurement is being taken. According to Ngechu
(2004), a population is a well-defined or set of people, services, elements, events, group of
things, or households that are being investigated. In this study, the target population are retail
businesses in shopping malls in Nairobi.
The shopping mall selected in this study was Village Market. The Village Market is one of the
oldest and largest shopping, recreation and entertainment complex in Nairobi Kenya. The
shopping complex opened its doors in 1995 and currently hosts 239 retail outlets. These stores
are categorized as food & restaurants, essentials & other services, health & beauty, arts, crafts
& gifts, furniture & furnishings, fashion & accessories, financial institutions, family
entertainment & recreation center, and & Hotel Tribe (Village Market, 2020). In this study, the
population was the number of all retail outlets at the Village Market Mall.
3.3.2. Sampling Design
3.3.2.1.Sampling Frame
Sampling frame refers to the list of all items in the population (Creswell & Creswell, 2017). In
this case, sampling frame is the list of all the 239 retail outlets identified in the population for
this study. The list presented in Appendix 2 was obtained from the management of Village
Market Mall (Village Market, 2020). While a population is general, the sample frame lists the
specific outlets, from which the sample size will be drawn, excludes retail outlets that will not
be included in the study and includes accurate information about each retail outlet.
3.3.2.2.Sampling Techniques
Sampling is the process of determining the number of respondents or observations to be taken
from the larger population. There are three main types of sampling techniques: probability
sampling, non-probability sampling, and mixed sampling. Probability sampling is one in which
each sample has the same probability of being chosen; non-probability sampling does not
34
follow the theory of probability when sampling from the population; and mixed sampling uses
a combination of the two. variables (Cooper & Schindler, 2014). This study used probability
sampling techniques. According to Creswell & Creswell (2017), the types of probability
sampling include random sampling, stratified sampling, cluster sampling, and systematic
sampling. Each of these sampling techniques have their strengths and limitations and are
adopted depending on the characteristics of the population.
The study used simple random sampling. Simple random sampling is the sampling procedure
for selecting respondents in a population. It is a probability sampling technique where every
unit in the population has an equal chance of being selected. Simple random sampling was
chosen because it generated a sample size that is representative and unbiased, and provided a
valid foundation for estimating a phenomenon in a population.
3.3.2.3.Sample Size
A sample refers to a set of individuals, objects, or observations selected from a statistical
population using a specific procedure (Mugenda & Mugenda, 2003). The sample size is the
number of individual samples or observations measured and selected to participate in a survey
(Mugenda & Mugenda, 2003). The sample was drawn from retail businesses operating in
shopping malls in Nairobi County. The shopping mall selected for this study was the Village
Market Mall. There are 239 retail shops at the mall. To derive the sample size for the study,
Yamane’s (1967) formula was used:
n = N
[1+N (e)2]
Where n is the sample size, N is the population sample and e is the sampling error tolerance.
n = 239
[1+239 (0.05)2]
= 149.61.
The sample size for the study was calculated as 150 retail outlets at Village Market Mall.

35
3.4.Data Collection Methods
The primary data was collected using questionnaires. The instrument comprised of closed-
ended questions to capture the conceptualization of the variables. Questionnaires were
preferred because they were inexpensive and easy to administer to the respondents. They also
gave the respondents adequate time to read, understand, and complete the questions and are
therefore a more reliable data collection tool.
The questionnaire was divided into sections. Section A collected demographic information
about the respondents. Section B, C, and D collected information on independent variables.
Section B collected responses to questions on customers and covered customer behavior,
consumer preference, and customer satisfaction. Section C collected responses to questions on
competition, covering threat of entry, competitive rivalry, and substitutes. Section D collected
responses to questions about distribution, and cover direct distribution, indirect distribution,
and intensive distribution. Section E focused on the dependent variable, marketing mix
strategy, and cover questions on the 4Ps dimensions. The questionnaire used 5-point Likert
scales to rank responses to the questions covering the independent and dependent variables.
3.5.Research Procedures
The researcher carried out a pre-test to collect data for refining the questionnaire before the
final administration of the questionnaire. The importance of pre-testing is to detect ambiguity,
evaluate the type of answers given to determine whether they help the researcher to achieve
the laid down objectives. Pre-tests are also crucial for ensuring the validity and reliability of
the research process and findings (Creswell & Creswell, 2017).
A pre-test sample of 10% of the sample size was used in the study, as recommended by
Mugenda and Mugenda (2003). The questionnaires were administered to the pre-test sample
at their retail shops. The completed questionnaires were used for reliability analysis. Questions
that are not clear and ambiguous were restructured to eliminate ambiguity and improve clarity.
All problems encountered in the pilot testing were addressed and the questionnaire refined in
preparation for the actual data collection exercise.
The tools were tested through validity and reliability techniques. The validity of a questionnaire
is the degree to which it measures what it purports to measure (Bolarinwa, 2015). The validity
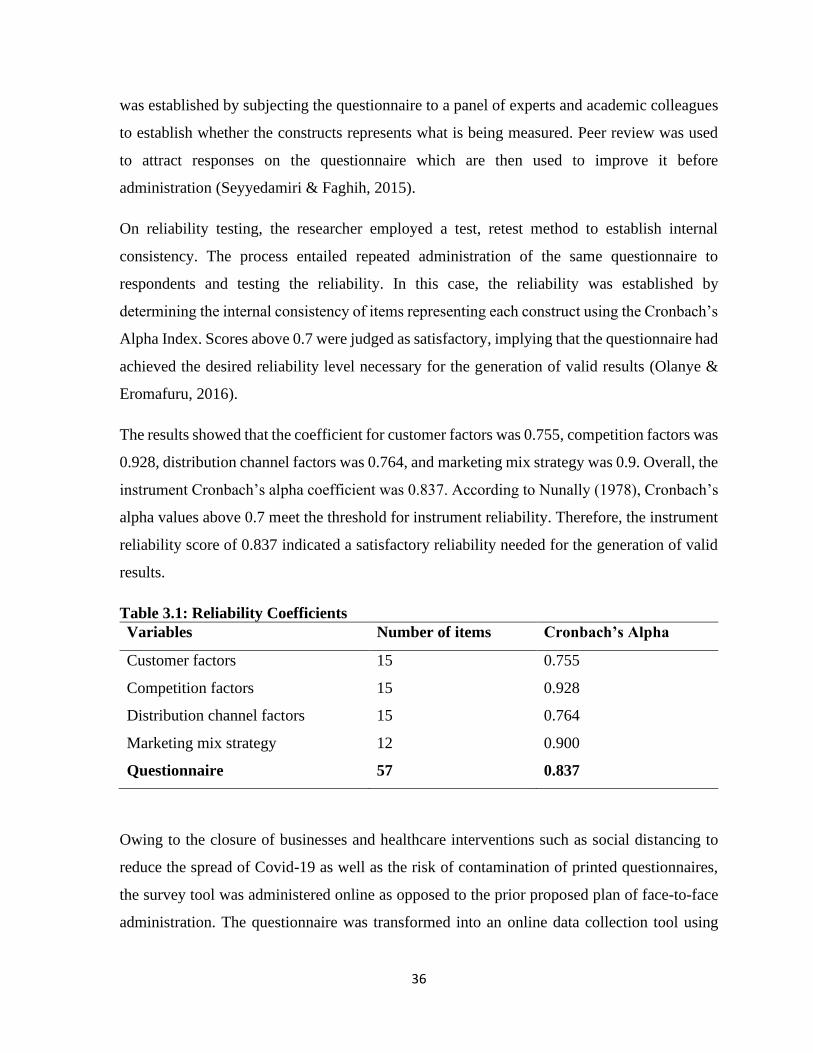
36
was established by subjecting the questionnaire to a panel of experts and academic colleagues
to establish whether the constructs represents what is being measured. Peer review was used
to attract responses on the questionnaire which are then used to improve it before
administration (Seyyedamiri & Faghih, 2015).
On reliability testing, the researcher employed a test, retest method to establish internal
consistency. The process entailed repeated administration of the same questionnaire to
respondents and testing the reliability. In this case, the reliability was established by
determining the internal consistency of items representing each construct using the Cronbach’s
Alpha Index. Scores above 0.7 were judged as satisfactory, implying that the questionnaire had
achieved the desired reliability level necessary for the generation of valid results (Olanye &
Eromafuru, 2016).
The results showed that the coefficient for customer factors was 0.755, competition factors was
0.928, distribution channel factors was 0.764, and marketing mix strategy was 0.9. Overall, the
instrument Cronbach’s alpha coefficient was 0.837. According to Nunally (1978), Cronbach’s
alpha values above 0.7 meet the threshold for instrument reliability. Therefore, the instrument
reliability score of 0.837 indicated a satisfactory reliability needed for the generation of valid
results.
Table 3.1: Reliability Coefficients
Variables Number of items Cronbach’s Alpha
Customer factors 15 0.755
Competition factors 15 0.928
Distribution channel factors 15 0.764
Marketing mix strategy 12 0.900
Questionnaire 57 0.837
Owing to the closure of businesses and healthcare interventions such as social distancing to
reduce the spread of Covid-19 as well as the risk of contamination of printed questionnaires,
the survey tool was administered online as opposed to the prior proposed plan of face-to-face
administration. The questionnaire was transformed into an online data collection tool using

37
Google Forms and administered to the pre-test sample through their emails. The questionnaires
were completed online a 14-day data collection period.
Research ethics is concerned with protecting the dignity of the respondents and the information
obtained in the process of research. The researcher obtained authorization from the University
and appropriate government authorities to ensure that the research complies with ethical
considerations. These ethical authorizations were presented to each respondent so that they can
get an understanding of the nature of the research, the objectives, and the use of the research
findings. The researcher obtained informed consent from the respondents, respected their
anonymity and confidentiality, upheld their privacy, and ensured that there were no data
collection processes that violated established ethical considerations, including preventing harm
and protecting dignity, and defending the rights of the respondents.
3.6.Data Analysis Methods
Data from the questionnaires was entered into an excel sheet, to capture the variables. The data
was cleaned and uploaded in SPSS (version 23) for descriptive and inferential analysis.
Descriptive statistics was used to summarize the measures for the variables into percentages,
means, and standard deviations. Multiple regressions were used to establish the relationship
between the independent variables and the dependent variable, and test whether micro
environment factors have a positive or negative influence on marketing mix strategies
employed by retail businesses in shopping malls in Nairobi.
The study adopted a basic regression model:
The regression model took the form of:
y = α + β1x1 + Ɛ
Where:
y intercept is the endogenous variable
α denotes the y intercept where x is zero; β1 is regression weights attached to the exogenous
variables: x1 and Ɛ is the error term.

38
Replacing for the variables:
MS = α + β1CUST + Ɛ
MS = α + β2 COMP + Ɛ
MS = α + β3 DIST + Ɛ
Where
MS denotes marketing mix strategy
CUST denotes customers, COMP denotes competition, and DIST denotes distribution
channels. The findings for both descriptive and inferential statistics were presented in tables
and figures in addition to an analytical and narrative description of the results.
3.7.Chapter Summary
The chapter presents the methodology of the study. The study adopted a descriptive research
design. The population included the 250 retail outlets at the Village Market Mall. Probability
sampling techniques, specifically, simple random sampling was used to generate the sample
size. Data was collected using questionnaires that have undergone validity and reliability
testing. The questionnaires were administered to respondents in their places of work and the
data collected analyzed using descriptive and inferential statistics. The next chapter presents
data analysis results, findings and interpretations.
39
CHAPTER FOUR
4.0. RESULTS AND FINDINGS
4.1. Introduction
The chapter presents the results and findings of the study. The results contain descriptive and
inferential statistics covering demographic information and the relationship between each of
the independent variables and the dependent variables. All the results are presented using
tables, graphs and pie charts. The findings are accompanied by narrative descriptions which
explain and situate the results within the context of the study.
4.2. Demographic Information
4.2.1. Response Rate
The researcher administered 150 questionnaires to retail businesses at the Village Market Mall.
Out of these, 114 completed and returned the questionnaires. The 114 completed
questionnaires were cleaned and proceeded to analysis. The response rate was calculated as
76.0%. This response rate is interpreted as satisfactory based on Babbie (2007)
recommendations indicating that a response of 50% is adequate for analysis, a response rate of
60% is good, and a response of 70% is very good. As such, the study’s response rate of 76.0%
is very good and was considered adequate for statistical analysis.
4.2.2. Age of Respondents
The descriptive analysis indicate that a majority of respondents were within the productive age
group: 25 years to 54 years. For instance, 32.5% (37) were aged between 25-34 years, 28.1%
(32) were aged between 35-44 years and 30.7% (35) were aged between 45-54 years old. Only
a small number were aged 18-24 years old, 2.6% (3) and above 55 years old, 6.1% (7).

40
Figure 4.1: Age of Respondents
4.2.3. Gender of Respondents
The ratio of male to female was nearly 1:1, with female respondents being slightly more. From
the total number of respondents, 114, 47.4% (54) were male while 52.6% (60) were female.
The distribution of respondents is presented using a pie chart below.
Figure 4.2: Gender of Respondents
2.60%
32.50%
28.10%
30.70%
6.10%
0.00%
5.00%
10.00%
15.00%
20.00%
25.00%
30.00%
35.00%
18-24 years old 25-34 years old 35-44 years old 45-54 years old Over 55 years old
Age distribution (%)
47.40%
53.60%
Gender distribution (%)
Male Female

41
4.2.4. Education Level
The respondents were characterized based on their education level. A majority of the
respondents had a higher educational achievement, with 50.9% (58) having a bachelor’s
degree, 29.8% (34) having a master’s degree, and 0.9% (1) having a PhD level of education.
A minority had a diploma level of education, 16.7% (19) and secondary school level of
education, 1.8% (2).
Figure 4.3: Level of Education
1.80%
16.70%
50.90%
29.80%
0.90%
0.00% 10.00% 20.00% 30.00% 40.00% 50.00% 60.00%
Secondary school certificate
Diploma
Bachelors degree
Masters degree
PhD
Level of education (%)

42
4.3. The Influence of Customers on Marketing Mix Strategy
4.3.1. Customer Behavior
In terms of customer behavior, 17.5% strongly agreed, 48.2% agreed, 24.6% were neutral,
3.5% disagreed, and 6.1% strongly disagreed with the statement that customers were
concentrated where the retail outlet was operating (M=3.70, SD=0.981). Customers were
greatly attracted to the retail store’s design and product display, as indicated by the number of
people who strongly agreed (29.8%) and agreed (57.0%) (M=4.12, SD=0.810). The level of
agreement with customers having adequate disposable income to afford prices at the mall was
slightly above average, at 15.8% strongly agreeing and 58.8% agreeing (M=3.78, SD=0.890).
The same level of agreement was reported for customers going the extra step to search for
information about the retail outlets and the products they offer, as showed by the 8.8% who
strongly agreed and 58.8% who agreed (M=3.65, SD=0.831).
Table 4.1: Customer Behavior
SA A N D SD Means Std.
Deviation
Customer Behavior
Our customers are highly
concentrated where we
operate our retail outlet
17.5% 48.2% 24.6% 3.5% 6.1% 3.70 0.981
Our customers are attracted
to the store design and how
we display our products
29.8% 57.0% 8.8% 1.9% 2.6% 4.12 0.810
Our customers have
adequate disposable income
to afford the prices we offer
10.5% 58.8% 24.6% 3.5% 2.7% 3.76 0.726
Our customers’ shopping
habits are influenced by
time and seasons
15.8% 58.8% 15.8% 7.0% 2.6% 3.78 0.890
Our customers take
initiative to search for
information on products
8.8% 58.8% 23.7% 6.1% 2.6% 3.65 0.831

43
4.3.2. Customer Preferences
In terms of customer preferences, there was an above-average level of agreement with the
position that customers make purchase decisions based on prices. Findings indicate that 14.0%
strongly agreed, 56.1% agreed, 15.8% were neutral, 7.0 % disagreed, and 7.0% strongly
disagreed with the statement (M-3.65, SD=1.034). A comparatively higher number of
customers agreed that they made purchasing decisions because they preferred the retail outlets
in the mall, as indicated by the 17.5% who strongly agreed, 55.3% agreed, and who were 21.9%
neutral in their opinion (M=3.82, SD=0.844). In the same vein, a higher proportion of
customers noted that they bought products from retail outlets in the mall due to comparatively
higher quality of products, with 43.0% strongly agreeing and 45.6% agreeing (M=4.28,
SD=0.796). A moderate number of respondents noted that their purchasing decisions was
mainly influenced by product promotions. Of those surveyed, 14.9% strongly agreed, 53.5%
agreed, 21.1% were neutral, 7.0% disagreed, and 3.5% strongly disagreed with the statement
that their preferences were driven by product promotions (M=3.69, SD=0.932). Similar
responses were obtained for purchasing decisions influenced by product brand identity
(M=3.89, SD=0.870).
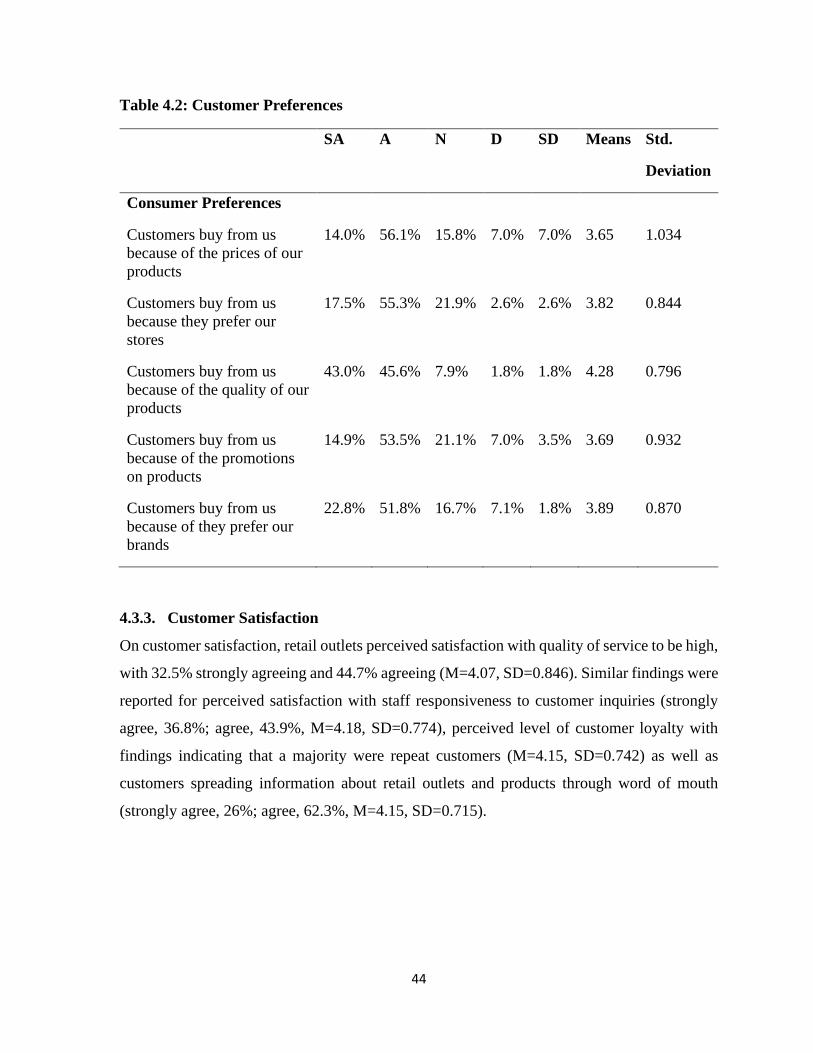
44
Table 4.2: Customer Preferences
SA A N D SD Means Std.
Deviation
Consumer Preferences
Customers buy from us
because of the prices of our
products
14.0% 56.1% 15.8% 7.0% 7.0% 3.65 1.034
Customers buy from us
because they prefer our
stores
17.5% 55.3% 21.9% 2.6% 2.6% 3.82 0.844
Customers buy from us
because of the quality of our
products
43.0% 45.6% 7.9% 1.8% 1.8% 4.28 0.796
Customers buy from us
because of the promotions
on products
14.9% 53.5% 21.1% 7.0% 3.5% 3.69 0.932
Customers buy from us
because of they prefer our
brands
22.8% 51.8% 16.7% 7.1% 1.8% 3.89 0.870
4.3.3. Customer Satisfaction
On customer satisfaction, retail outlets perceived satisfaction with quality of service to be high,
with 32.5% strongly agreeing and 44.7% agreeing (M=4.07, SD=0.846). Similar findings were
reported for perceived satisfaction with staff responsiveness to customer inquiries (strongly
agree, 36.8%; agree, 43.9%, M=4.18, SD=0.774), perceived level of customer loyalty with
findings indicating that a majority were repeat customers (M=4.15, SD=0.742) as well as
customers spreading information about retail outlets and products through word of mouth
(strongly agree, 26%; agree, 62.3%, M=4.15, SD=0.715).
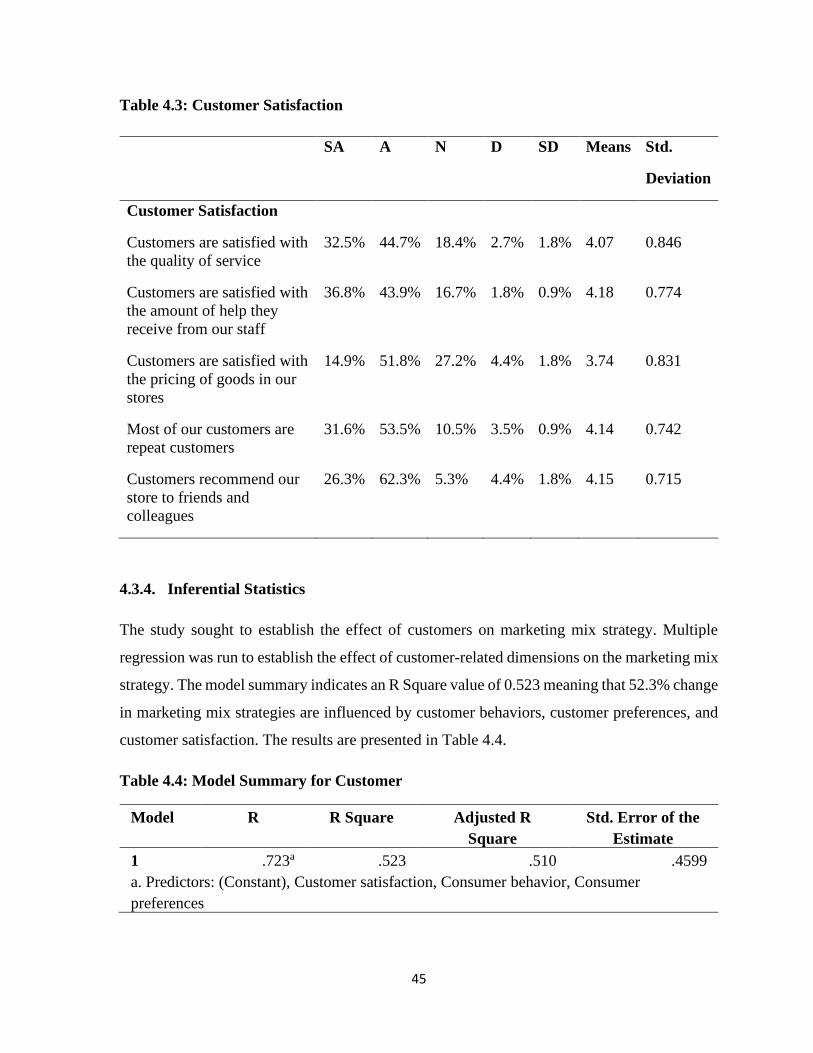
45
Table 4.3: Customer Satisfaction
SA A N D SD Means Std.
Deviation
Customer Satisfaction
Customers are satisfied with
the quality of service
32.5% 44.7% 18.4% 2.7% 1.8% 4.07 0.846
Customers are satisfied with
the amount of help they
receive from our staff
36.8% 43.9% 16.7% 1.8% 0.9% 4.18 0.774
Customers are satisfied with
the pricing of goods in our
stores
14.9% 51.8% 27.2% 4.4% 1.8% 3.74 0.831
Most of our customers are
repeat customers
31.6% 53.5% 10.5% 3.5% 0.9% 4.14 0.742
Customers recommend our
store to friends and
colleagues
26.3% 62.3% 5.3% 4.4% 1.8% 4.15 0.715
4.3.4. Inferential Statistics
The study sought to establish the effect of customers on marketing mix strategy. Multiple
regression was run to establish the effect of customer-related dimensions on the marketing mix
strategy. The model summary indicates an R Square value of 0.523 meaning that 52.3% change
in marketing mix strategies are influenced by customer behaviors, customer preferences, and
customer satisfaction. The results are presented in Table 4.4.
Table 4.4: Model Summary for Customer
Model R R Square Adjusted R
Square
Std. Error of the
Estimate
1 .723a .523 .510 .4599
a. Predictors: (Constant), Customer satisfaction, Consumer behavior, Consumer
preferences

46
The regression model was tested for significance using ANOVA. The findings indicate that
the model is significant, F (3,110) =40.133, p = 0.000, implying that the independent variables
are significant predictors of the dependent variable at 95% Confidence level. The findings are
reported in Table 4.5.
Table 4.5: ANOVA for Customer Model
Model Sum of
Squares
Df Mean
Square
F Sig.
1 Regression 25.469 3 8.490 40.133 .000b
Residual 23.269 110 .212
Total 48.737 113
a. Dependent Variable: Marketing mix strategies
b. Predictors: (Constant), Customer satisfaction, Consumer behavior, Consumer
preferences
The results show that customer-related factors have a significant effect on marketing mix
strategies. Customer behavior had a positive and statistically significant effect on marketing
mix strategies (p=0.000). Customer preferences had a positive and statistically significant
effect on marketing mix strategies (p=0.004). Finally, customer satisfaction also had a positive
and statistically significant effect on marketing mix strategies. The regression coefficients are
reported in Table 4.6.
Table 4.6: Regression Coefficients for Customer Model
Model Unstandardized
Coefficients
Standardized
Coefficients
t Sig.
B Std.
Error
Beta
1 (Constant) .332 .330 1.006 .317
Consumer
behavior
.409 .097 .344 4.225 .000
Consumer
preferences
.306 .103 .292 2.968 .004
Customer
satisfaction
.211 .091 .214 2.313 .023
a. Dependent Variable: Marketing mix strategies
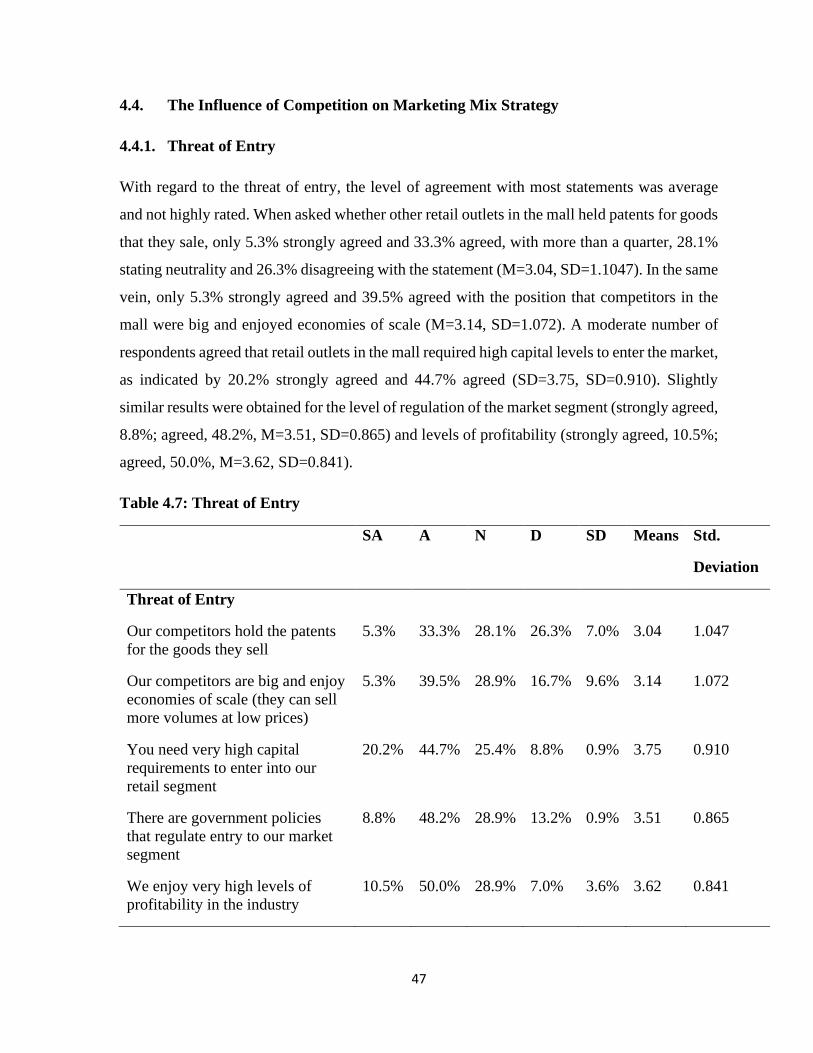
47
4.4. The Influence of Competition on Marketing Mix Strategy
4.4.1. Threat of Entry
With regard to the threat of entry, the level of agreement with most statements was average
and not highly rated. When asked whether other retail outlets in the mall held patents for goods
that they sale, only 5.3% strongly agreed and 33.3% agreed, with more than a quarter, 28.1%
stating neutrality and 26.3% disagreeing with the statement (M=3.04, SD=1.1047). In the same
vein, only 5.3% strongly agreed and 39.5% agreed with the position that competitors in the
mall were big and enjoyed economies of scale (M=3.14, SD=1.072). A moderate number of
respondents agreed that retail outlets in the mall required high capital levels to enter the market,
as indicated by 20.2% strongly agreed and 44.7% agreed (SD=3.75, SD=0.910). Slightly
similar results were obtained for the level of regulation of the market segment (strongly agreed,
8.8%; agreed, 48.2%, M=3.51, SD=0.865) and levels of profitability (strongly agreed, 10.5%;
agreed, 50.0%, M=3.62, SD=0.841).
Table 4.7: Threat of Entry
SA A N D SD Means Std.
Deviation
Threat of Entry
Our competitors hold the patents
for the goods they sell
5.3% 33.3% 28.1% 26.3% 7.0% 3.04 1.047
Our competitors are big and enjoy
economies of scale (they can sell
more volumes at low prices)
5.3% 39.5% 28.9% 16.7% 9.6% 3.14 1.072
You need very high capital
requirements to enter into our
retail segment
20.2% 44.7% 25.4% 8.8% 0.9% 3.75 0.910
There are government policies
that regulate entry to our market
segment
8.8% 48.2% 28.9% 13.2% 0.9% 3.51 0.865
We enjoy very high levels of
profitability in the industry
10.5% 50.0% 28.9% 7.0% 3.6% 3.62 0.841

48
4.4.2. Competitive Rivalry
Competitive rivalry was one of the dimensions of competition investigated in the study. In
general, the level of agreement with statements on the competitive dimensions was moderate.
From the findings, 16.7% strongly agreed and 37.7% agreed with the statement that there are
very many small competitors in the mall (M=3.49, SD=1.053). Comparatively fewer
respondents strongly agreed (7.0%) and agreed (37.7%) with the statement that competitors
were bigger than retail outlets (M=3.21, MD=1.041). There was also moderate level of
agreement with the statement that many retail outlets were offering the same products (strongly
agreed, 9.6%; 51.8% agreed, M=3.47, SD=1.018). Comparative levels of agreement were
recorded for retail outlets offering the same products and same prices (M=3.32, SD=1.083)
and retail outlet growth and profitability being hindered by competitors in the mall (M=3.19,
SD=1.146).
Table 4.8: Competitive Rivalry
SA A N D SD Means Std.
Deviation
Competitive Rivalry
We have very many
competitors in the mall
16.7% 37.7% 24.6% 17.5% 3.5% 3.49 1.053
Our competitors are bigger
than us in terms of market
share
7.0% 37.7% 28.1% 19.3% 7.7% 3.21 1.041
There are many retail
outlets that offer the same
products that we offer.
9.6% 51.8% 17.5% 15.8% 4.4% 3.47 1.018
There are many retail
outlets that offer the same
products we offer at the
same prices
7.9% 46.5% 23.7% 13.2% 8.8% 3.32 1.083
Our growth and
profitability are hindered
by competitors
8.8% 40.4% 19.3% 21.9% 8.8% 3.19 1.146

49
4.4.3. Substitutes
With regard to substitutes, 14.9% strongly agreed and 45.6% agreed that there were many
substitutes to the products offered by retail outlets (M=3.53, SD=1.032). Further, 8.8% of the
respondents strongly agreed and 38.5% agreed that the retail outlets do not offer unique
products (M=3.09, SD=1.245), while 4.4% strongly agreed and 52.6% agreed that retailers are
selling at nearly the same price (M=3.35, 1.057). Slightly over half of the respondents indicated
that they source products from the same suppliers (M=3.19, 1.120), and that the products they
sell were better priced and had better performance features (M=3.19, SD=1.120).
Table 4.9: Substitutes
SA A N D SD Means Std.
Deviation
Substitutes
There are many
substitutes to the products
we offer
14.9% 45.6% 19.3% 17.5% 2.6% 3.53 1.032
We do not offer unique
products. Customers can
either buy from us or buy
from many other stores in
the mall
8.8% 38.5% 21.9% 14.0% 16.7% 3.09 1.245
We sell at nearly the
same price as other retail
outlets offering the same
products in the mall
4.4% 52.6% 21.9% 15.8% 5.3% 3.35 0.977
We source the products
we sell from nearly the
same suppliers
10.5% 39.5% 25.4% 16.7% 8.0% 3.34 1.057
Substitutes to the
products we sell are
better priced and have
better performance
features
8.8% 36.0% 32.5% 11.4% 11.4% 3.19 1.120
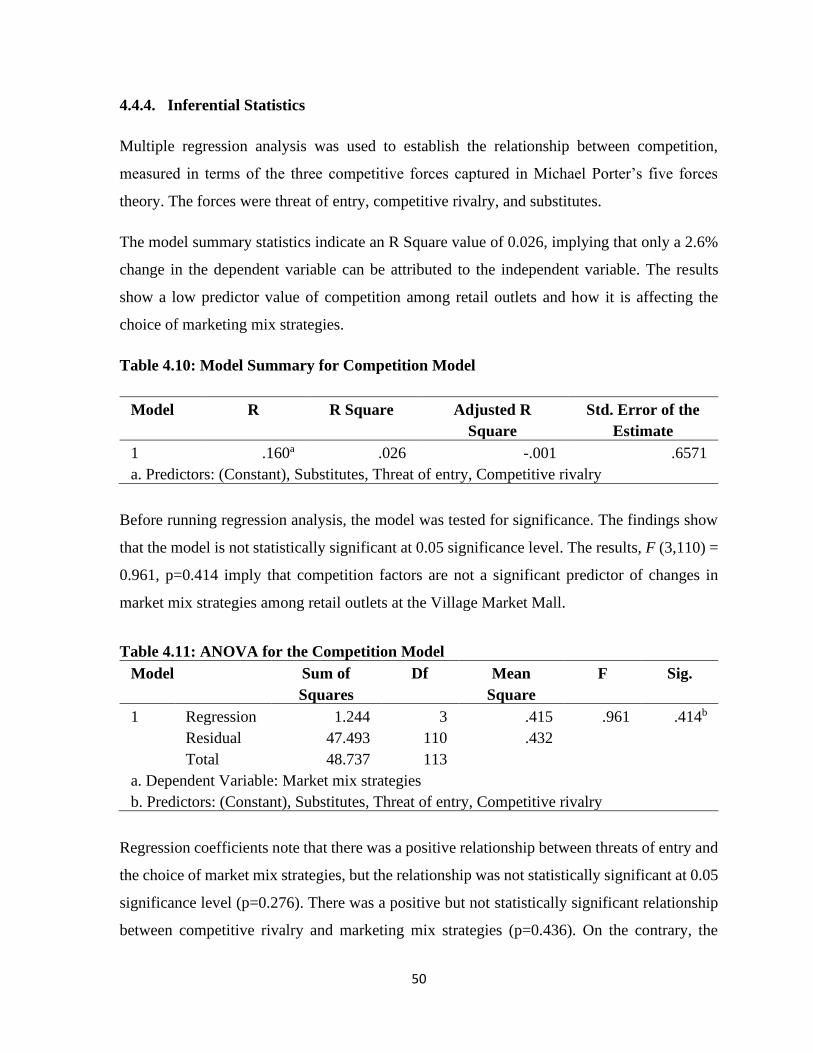
50
4.4.4. Inferential Statistics
Multiple regression analysis was used to establish the relationship between competition,
measured in terms of the three competitive forces captured in Michael Porter’s five forces
theory. The forces were threat of entry, competitive rivalry, and substitutes.
The model summary statistics indicate an R Square value of 0.026, implying that only a 2.6%
change in the dependent variable can be attributed to the independent variable. The results
show a low predictor value of competition among retail outlets and how it is affecting the
choice of marketing mix strategies.
Table 4.10: Model Summary for Competition Model
Model R R Square Adjusted R
Square
Std. Error of the
Estimate
1 .160a .026 -.001 .6571
a. Predictors: (Constant), Substitutes, Threat of entry, Competitive rivalry
Before running regression analysis, the model was tested for significance. The findings show
that the model is not statistically significant at 0.05 significance level. The results, F (3,110) =
0.961, p=0.414 imply that competition factors are not a significant predictor of changes in
market mix strategies among retail outlets at the Village Market Mall.
Table 4.11: ANOVA for the Competition Model
Model Sum of
Squares
Df Mean
Square
F Sig.
1 Regression 1.244 3 .415 .961 .414b
Residual 47.493 110 .432
Total 48.737 113
a. Dependent Variable: Market mix strategies
b. Predictors: (Constant), Substitutes, Threat of entry, Competitive rivalry
Regression coefficients note that there was a positive relationship between threats of entry and
the choice of market mix strategies, but the relationship was not statistically significant at 0.05
significance level (p=0.276). There was a positive but not statistically significant relationship
between competitive rivalry and marketing mix strategies (p=0.436). On the contrary, the
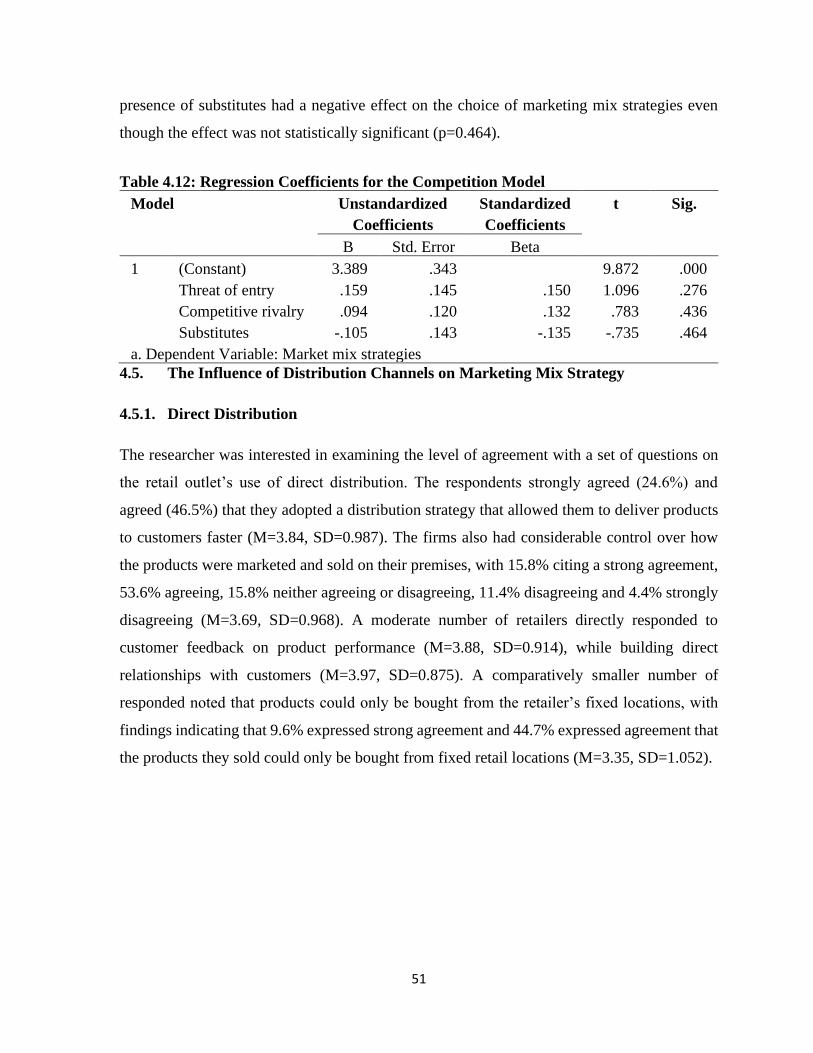
51
presence of substitutes had a negative effect on the choice of marketing mix strategies even
though the effect was not statistically significant (p=0.464).
Table 4.12: Regression Coefficients for the Competition Model
Model Unstandardized
Coefficients
Standardized
Coefficients
t Sig.
B Std. Error Beta
1 (Constant) 3.389 .343 9.872 .000
Threat of entry .159 .145 .150 1.096 .276
Competitive rivalry .094 .120 .132 .783 .436
Substitutes -.105 .143 -.135 -.735 .464
a. Dependent Variable: Market mix strategies
4.5. The Influence of Distribution Channels on Marketing Mix Strategy
4.5.1. Direct Distribution
The researcher was interested in examining the level of agreement with a set of questions on
the retail outlet’s use of direct distribution. The respondents strongly agreed (24.6%) and
agreed (46.5%) that they adopted a distribution strategy that allowed them to deliver products
to customers faster (M=3.84, SD=0.987). The firms also had considerable control over how
the products were marketed and sold on their premises, with 15.8% citing a strong agreement,
53.6% agreeing, 15.8% neither agreeing or disagreeing, 11.4% disagreeing and 4.4% strongly
disagreeing (M=3.69, SD=0.968). A moderate number of retailers directly responded to
customer feedback on product performance (M=3.88, SD=0.914), while building direct
relationships with customers (M=3.97, SD=0.875). A comparatively smaller number of
responded noted that products could only be bought from the retailer’s fixed locations, with
findings indicating that 9.6% expressed strong agreement and 44.7% expressed agreement that
the products they sold could only be bought from fixed retail locations (M=3.35, SD=1.052).

52
Table 4.13: Direct Distribution
SA A N D SD Means Std.
Deviation
Direct distribution
Our strategy is to deliver
products to customers
faster than any other
retail outlet
24.6% 46.5% 20.2% 3.5% 5.3% 3.84 0.987
We have total control of
how the product is
marketed and sold
15.8% 52.6% 15.8% 11.4% 4.4% 3.69 0.968
We directly respond to
customer feedback on
product performance
24.6% 47.4% 21.1% 3.5% 3.5% 3.88 0.914
Our products can only be
bought from our fixed
retail locations
9.6% 44.7% 20.2% 20.2% 5.3% 3.35 1.052
We build direct
relationships with our
customers
23.7% 57.0% 12.3% 3.5% 3.5% 3.97 0.875
We do not market or
create awareness for any
of the products we sell
3.5% 39.5% 10.5% 21.9% 24.6% 2.77 1.296
Our products are low-cost
and are not highly priced
5.3% 39.5% 24.6% 14.0% 16.5% 3.06 1.172
4.5.2. Indirect Distribution
The use of indirect distribution channels was examined based on a set of items. The results
indicate that 8.8% strongly agreed and 53.3% agreed that the firm distributed products through
distribution agents (M=3.41, SD=1.111). Less than half of the respondents expressly agreed
(3.5% strongly agreed and 43.9% agreed) that they focused on building relationships with
distributors more than customers (M=3.08, SD=1.111). The proportion that leveraged on
existing brand recognition was moderately high (M=3.80, SD=0.857) when compared with
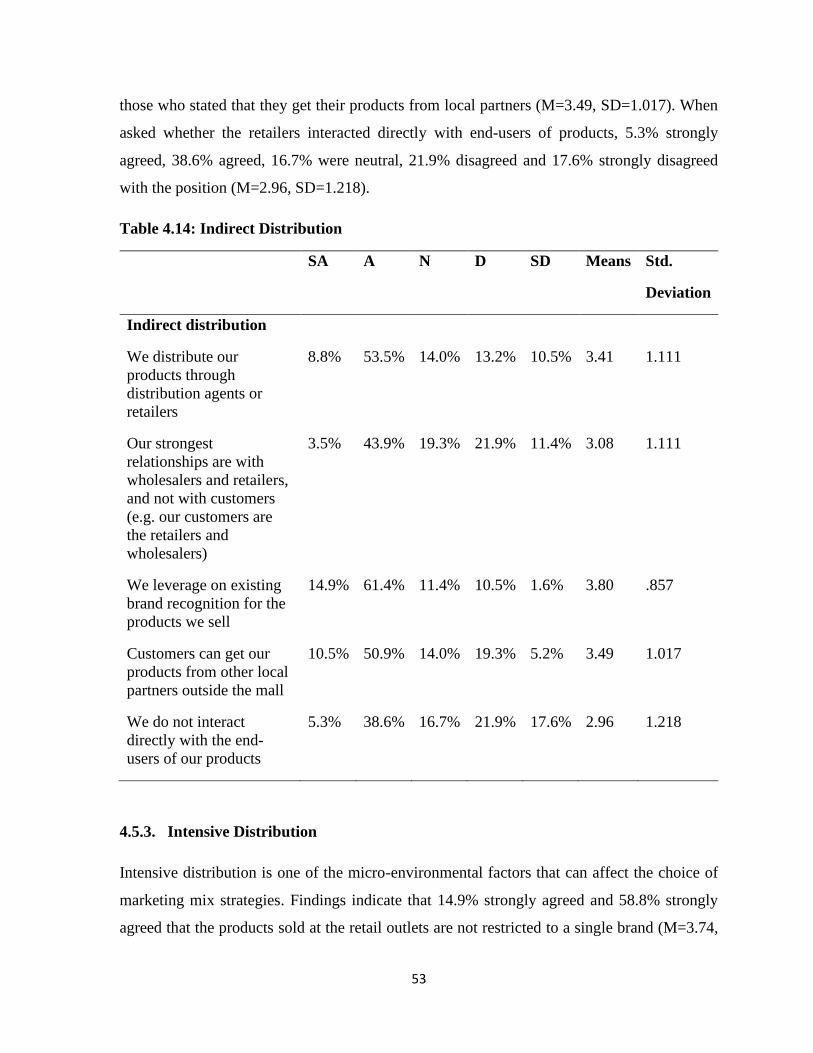
53
those who stated that they get their products from local partners (M=3.49, SD=1.017). When
asked whether the retailers interacted directly with end-users of products, 5.3% strongly
agreed, 38.6% agreed, 16.7% were neutral, 21.9% disagreed and 17.6% strongly disagreed
with the position (M=2.96, SD=1.218).
Table 4.14: Indirect Distribution
SA A N D SD Means Std.
Deviation
Indirect distribution
We distribute our
products through
distribution agents or
retailers
8.8% 53.5% 14.0% 13.2% 10.5% 3.41 1.111
Our strongest
relationships are with
wholesalers and retailers,
and not with customers
(e.g. our customers are
the retailers and
wholesalers)
3.5% 43.9% 19.3% 21.9% 11.4% 3.08 1.111
We leverage on existing
brand recognition for the
products we sell
14.9% 61.4% 11.4% 10.5% 1.6% 3.80 .857
Customers can get our
products from other local
partners outside the mall
10.5% 50.9% 14.0% 19.3% 5.2% 3.49 1.017
We do not interact
directly with the end-
users of our products
5.3% 38.6% 16.7% 21.9% 17.6% 2.96 1.218
4.5.3. Intensive Distribution
Intensive distribution is one of the micro-environmental factors that can affect the choice of
marketing mix strategies. Findings indicate that 14.9% strongly agreed and 58.8% strongly
agreed that the products sold at the retail outlets are not restricted to a single brand (M=3.74,

54
SD=0.992). Similarly, 13.2% strongly agreed and 57.0% agreed that the products sold at the
outlets are interchangeable (M=3.72, SD=0.881). When asked whether the products sold at the
outlet are also sold elsewhere in places supermarkets, 7.9% strongly agreed, 48.2% agreed,
20.2% were neutral, 11.4% disagreed and 12.3% disagreed strongly (M=3.30, SD=1.141).
Only 3.5% strongly agreed and 39.5% agreed that the outlets are not invested in creating
market awareness for the products (M=2.77, SD=1.296). The products sold by retailers were
relatively inexpensive (M=3.06, SD=1.172).
Table 4.15: Intensive Distribution
SA A N D SD Means Std.
Deviation
Intensive distribution
We sell different products
at our stores and are not
restricted to brands from
a single or few industry
14.9% 58.8% 10.5% 7.0% 9.0% 3.74 0.992
The products we sell are
interchangeable. If a
customer finds that one
brand is unavailable from
our shelf, they can pick
another brand rather than
going to another store
13.2% 57.0% 19.3% 7.0% 3.5% 3.72 0.881
The products we sell are
also sold anywhere
outside the mall,
including in supermarkets
and small retail outlets
7.9% 48.2% 20.2% 11.4% 12.3% 3.30 1.141
We do not market or
create awareness for any
of the products we sell
3.5% 39.5% 10.5% 21.9% 24.6% 2.77 1.296
Our products are low-cost
and are not highly priced
5.3% 39.5% 24.6% 14.0% 16.5% 3.06 1.172

55
4.5.4. Inferential Statistics
Multiple regression analysis was used to establish the relationship between distribution channel
and marketing mix strategies. The dimensions of the distribution channel included in the model
were direct distribution, indirect distribution, and intensive distribution.
The findings indicate that the R Square value for the model was 0.300. This means that
independent variables were responsible for the 30.0% variance in marketing mix strategies.
The model summary is presented in Table 4.16.
Table 4.16: Mode Summary for the Distribution Channel Model
Model R R Square Adjusted R
Square
Std. Error of the
Estimate
1 .548a .300 .281 .5567
a. Predictors: (Constant), Intensive distribution, Direct distribution, Indirect distribution
The regression model was tested for statistical significance. The results found out that the
model is statistically significant at 0.05, F (3,110) =15.750, p=0.000. This implies that the
distribution channel factors are statistically significant predictors of marketing mix strategies
at 95% confidence level. The results are presented in Table 4.17.
Table 4.17: ANOVA for Distribution Channel Model
Model Sum of
Squares
Df Mean
Square
F Sig.
1 Regression 14.644 3 4.881 15.750 .000b
Residual 34.093 110 .310
Total 48.737 113
a. Dependent Variable: Market mix strategies
b. Predictors: (Constant), Intensive distribution, Direct distribution, Indirect distribution
The regression coefficients showed the level of significance for each distribution channel
factor. Direct distribution had a positive and statistically significant effect on marketing mix
strategies at 0.05 significance level (p=0.000). Indirect distribution had a positive effect on
marketing mix strategies, but the effect was not statistically significant at 0.05 significance
level (p=0.702). There was a negative relationship between intensive distribution and
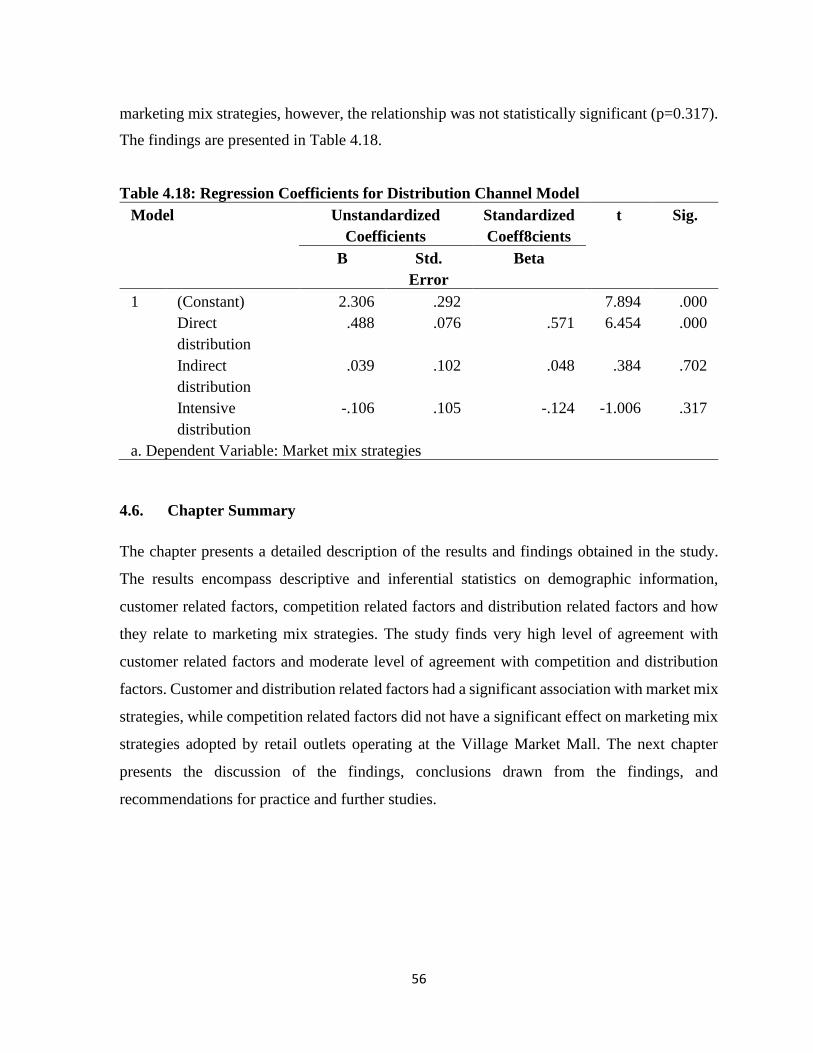
56
marketing mix strategies, however, the relationship was not statistically significant (p=0.317).
The findings are presented in Table 4.18.
Table 4.18: Regression Coefficients for Distribution Channel Model
Model Unstandardized
Coefficients
Standardized
Coeff8cients
t Sig.
B Std.
Error
Beta
1 (Constant) 2.306 .292 7.894 .000
Direct
distribution
.488 .076 .571 6.454 .000
Indirect
distribution
.039 .102 .048 .384 .702
Intensive
distribution
-.106 .105 -.124 -1.006 .317
a. Dependent Variable: Market mix strategies
4.6. Chapter Summary
The chapter presents a detailed description of the results and findings obtained in the study.
The results encompass descriptive and inferential statistics on demographic information,
customer related factors, competition related factors and distribution related factors and how
they relate to marketing mix strategies. The study finds very high level of agreement with
customer related factors and moderate level of agreement with competition and distribution
factors. Customer and distribution related factors had a significant association with market mix
strategies, while competition related factors did not have a significant effect on marketing mix
strategies adopted by retail outlets operating at the Village Market Mall. The next chapter
presents the discussion of the findings, conclusions drawn from the findings, and
recommendations for practice and further studies.
57
CHAPTER FIVE
5.0. DISCUSSION, CONCLUSIONS AND RECOMMENDATIONS
5.1. Introduction
The chapter is the final section of the research project. It summarizes the study, discusses the
findings based on the research objectives, draws conclusions for each objective, and presents
recommendations drawn from the results and findings to inform practice and stimulate further
research on the link between micro-environment factors and marketing strategies.
5.2. Summary
The study sought to investigate the influence of micro-environment factors on marketing mix
strategy. The micro-environment factors in the study were customers, competition, and
distribution. The specific objectives were to investigate the influence of customers on
marketing mix strategy, determine the influence of competitive forces on marketing mix
strategy, and establish the influence of distribution on marketing mix strategy among retail
business in shopping malls in Nairobi.
The study adopted a descriptive research design. The population was drawn from retailers
operating in Village Market Mall. A total of 239 retailers were operating in the mall. A simple
random sampling technique was used to generate a sample size of 150 retailers for the study.
Data was collected using a validated and standardized questionnaire. The questionnaire was
self-administered to the respondents at their place of work. Collected data was cleaned and
analyzed using SPSS 23 for descriptive and inferential statistics. The descriptive measures
included frequencies, percentages, means and standard deviations. To establish the influence
of micro environment factors on market mix strategy, the study used multiple regressions. The
results were presented using charts, graphs, and tables, accompanied by narrative descriptions.
The first objective of the study was to investigate the influence of customers on marketing mix
strategy. Customers were examined on the basis of customer behavior, customer preferences,
and customer satisfaction dimensions. Findings on customer behavior show that customers
were concentrated around where the outlet was operating. Customers were also attracted to the
stores due to the outlet’s design aesthetics and display. The store was situated in a
58
neighborhood where customers had disposable income that could allow them to access
products and services at the prices offered at the mall. Findings on customer preferences
indicated that customers made decisions based on the prices offered, and that the preference of
one retailer to the other was dependent on the prices of the products. Customers also preferred
the malls due to high perception of product quality and benefits of effective product
promotions, since they were mainly drawn to recognizable brands. Customer satisfaction levels
were comparatively high and driven by product quality, staff responsiveness, and customer
loyalty. Multiple regressions demonstrated that all the dimensions of customers, notably,
customer satisfaction, customer preferences, and customer satisfaction had a positive and
statistically significant influence on marketing mix strategy.
The second objective was to investigate the influence of competitive forces on marketing mix
strategy. Three competitive forces: threat of entry, competitive rivalry, and substitutes, were
examined. In terms of the threat of entry, retailers moderately agreed that goods they sold were
from patented innovations and that competitors enjoyed economies of scale. A significant
amount of capital was also needed to enter the market, and government regulation and levels
of profitability influenced competition among retailers. On competitive rivalry, retailers noted
that there were many small competitors in the mall, rather than big competitors. The prices
were comparable with retailers dealing in similar products. Most products had substitutes
drawn from the same group of suppliers. The retailers contended that the price and performance
attributes were competitive. However, the competitiveness of the retailers was greatly
dependent on the competitiveness of the mall. As a result, even though the study reported a
positive relationship between the threat of entry and competitive rivalry, these did not have a
statistically significant influence on marketing strategy. The abundance of substitutes had a
negative but not statistically significant influence on the retail outlet’s marketing strategy.
The third objective investigated the influence of distribution on marketing strategy decisions.
The researcher looked at the different types of distribution channels: direct, indirect and
intensive, and how they influenced marketing strategy decisions. Direct distribution channels
were characterized by delivering products faster to customers, possessing considerable control
over product marketing and selling, building direct relationships with customers and accessing
goods only in fixed positions. The level of agreement with these characteristics was slightly

59
above average. Indirect distribution was characterized by distributing products through agents,
building relationships primarily with distributors, leveraging existing brand recognition, and
interacting more with end-users. Findings indicated comparatively low levels of agreement
when compared to direct distribution. Extensive distribution, characterized by characteristics
from the two channel strategies, reported moderate level of agreement among respondents.
Overall, multiple regression demonstrated that direct distribution was the main predictor of
marketing mix strategy, as opposed to indirect or extensive distribution.
5.3. Discussions
5.3.1. The Influence of Customers on Marketing Mix Strategy
Consumer behaviors influence how customers choose, purchase, use, and dispose of products
or services. The study established that retail outlets. The present study has established that
consumers are shopping at the retail outlets because of proximity. These consumers do not
only live near the shopping mall but also have adequate disposable income to access products
and services provided at the mall. The selection of one retail outlet, among competitors, is
influenced by the store’s design and product display. In addition, they also take the extra step
to examine what retail stores offer through information searches before making a purchasing
decision. Customer behaviors were found to exert a significant influence on the strategies
adopted by the retailers to market themselves and their products.
Other scholars have also observed the phenomenon reported in this study. Bakator et al. (2016)
noted that when companies use pricing strategies as part of the marketing mix strategy, they
must take into account the perceptions of customers about pricing. This is important because
if a company sets a higher price that is above customer expectations, the likelihood of low sales
and low profitability increases. As a result, setting the right price, as a marketing strategy, must
be aligned with price perceptions in the market for the overall goal of higher sales volumes and
higher profit margins to be realized. It is for this reason that Bakator et al. (2016) argued that
companies must understand consumer behavior in order to respond to their needs and desires.
Lin et al. (2012) noted that creating a marketing strategy demands that firms must perform
problem recognition, information search, alternative evaluation, purchasing and post-purchase
evaluation. Nugroho and Irena (2017) added that understanding customer behavior means
60
examining psychological factors that relate to the purchase intention. Such behaviors can be
personal, social or cultural influences and understanding them enables a company to develop
an appropriate marketing strategy.
Other characteristics of consumer behavior that gave been identified in research are price,
interior, promotional tool, location, range of products, experiential zone, quality and
availability. Arbaina and Suresh (2018) found out that these attributes have a statistically
significant influence on both purchase intention and marketing strategy. Mehrizi and Zahedi
(2013) also found a significant link between marketing strategies and consumer behavior.
The study also established that customer preferences play a central role in not only influencing
purchasing decisions but also exert influence on what marketing strategies are deemed
effective by the outlets. The study found out that customers made purchasing decisions based
on prices, and preferred making purchases in the mall due to perceived high-quality products.
Customers also followed product promotions and were influenced by how the retail outlets did
their product placement. Customer preferences had a positive and statistically significant effect
on marketing mix strategies.
Sulaiman and Masri (2017) noted that customer preferences, defined as feelings of pleasure of
disappointment after consuming a product, has a significant effect on whether a customer will
purchase and consume a product again or whether they will opt for products from competitors.
Sulaiman and Masri (2017) reiterate that higher levels of consumer preference not only
increase the likelihood of purchases but are also important indicators that companies use to
develop marketing strategies.
A study by Getzner and Grabner-Krauter (2015) investigated the relationship between
consumer preferences and marketing strategies, and established that personal factors such as
the education level of a customer can influence their willingness to purchase a product. As
such, such personal characteristics must be incorporated in developing models for marketing
strategies. Egboro (2015) demonstrated that customer preferences can also be influenced by
technology, economy, intelligence responsiveness, competition and management competency.
Miriti (2016) found a statistically significant relationship between marketing strategy on
consumer preference among retail brands in Nairobi.

61
Satisfied customers are an indicator of how well the retail outlet is managing customer-related
dimensions. The study established that customer satisfaction was primarily driven by the
perception of product quality and staff responsiveness. Satisfied customers were more likely
to make repeat purchases, were loyal, and marketed the retail outlet through word-of-mouth
recommendations to family and friends. Customer satisfaction also had a positive and
statistically significant effect on marketing mix strategies.
Consumer satisfaction can also be achieved through effective marketing strategies (Shaw,
2012). To be effective, marketing strategies must identify expectations of consumers in terms
of product, price, promotion and place, which are the 4Ps of the marketing mix strategy. Ebitu
(2014) adds that when marketers understand that adequately satisfying the demands of
consumers, then it is possible to execute strategies that are aligned with the overall goal of
improving the financial performance of the company. Marketing strategy can be long term or
short term, however, irrespective of the duration, the organization, formulation, evaluation and
selection of market-oriented strategies as well as the successful implementation of these
strategies is determined by the level of customer satisfaction (Youjae, 2010). Azizi et al. (2015)
concluded that the idea of relationship marketing holds that companies should identify,
anticipate and satisfy customer requirements.
5.3.2. The Influence of Competition on Marketing Mix Strategy
Companies compete with other companies in the market for customers. There are various
factors that influence a company’s competitive position. Michael Porter’s five forces theory is
one model for conceptualizing these relationships. In this study, three out of the five elements
in the theory were incorporated in this study. The researcher looked at the threat of entry,
competitive rivalry, and substitutes, and how these influence decisions on marketing strategies.
The study established that the barriers to market entry were moderately influential, as
demonstrated by patenting, economies of scale, capital outlay, and industry regulation.
According to Lawrence (2011), it is easy for competitors to enter the market when the barriers
of entry are low, however, this increases competition in the absence of increased consumer
demand. Therefore, firms that are not able to thrive in a heightened competitive environment
are likely to suffer from reduced profits. Marketing strategies can help firms to identify and
62
exploit opportunities and stay ahead of competition. Chiteli (2013) adds that having access to
adequate capital is important because forms with substantial financial resources can increase
investments in marketing, adopt pricing strategies that can force bigger competitors to reduce
their prices, and execute strategies that allow it to tap into the market share of competitors.
Results on competitive rivalry showed that there were many small competitors in the market
and fewer big competitors. Kaunyangi (2014) noted that the relative position of a firm in the
market is influenced by its ability to withstand, survive and over-compete other firms in the
same market. With the current study showing that most retail outlets were selling similar
products, this shows that there is little differentiation in the market and customers are more
likely to make their purchasing decisions based on brand loyalty and price comparisons.
Kaunyangi (2014) reiterates that A highly competitive business environment results in
competitiveness in prices, which subsequently affects the profitability and performance of
firms.
In a study by Ogaga (2017) the researchers found out that there is a link between competition
and corporate strategy. The study, which focused on firms listed at the Nairobi Securities
Exchange, revealed that industry competition has a moderating effect on the association
between corporate strategy and organizational performance. O’Cass and Weerawardena (2017)
reported that an industry’s competitive intensity has a positive impact on marketing capability.
On the other hand, Takata (2016) found out that marketing capabilities is the strongest driver
of business performance, followed by competitive rivalry and the power of suppliers. Another
study also reported that adopting a certain marketing strategy can have a significant effect on
firm competitiveness. The study was a review of empirical literature and therefore did not
present statistical analysis of primary data (Githaiga, Namusonge, & Kihoro, 2016).
Findings on substitutes revealed that most retail outlets stocked substitutes and that they did
not offer unique products. These products also retailed at nearly same prices. Substitutes were
found to exert a negative effect on the development of marketing strategies. Azzam (2018)
noted that firms cannot depend on the same products forever, as such, they must invest in
marketing strategies so as to identify new areas of growth. Camison and Lopez (2010) added
that competitive pressures force firms to establish strategies that can help in increasing
competitive advantage. One of those strategies is the introduction of new products or
63
modification of existing products. Retailers must innovate by increasing the diversity of their
product offerings or the abundance of substitutes in the mall can reduce their competitive
advantage.
5.3.3. The Influence of Distribution Channels on Marketing Mix Strategy
Distribution channels differ from firm to firm. The choice of a distribution channel is
determined by a multitude of factors, however, there are three main topologies of distribution:
direct, indirect and intensive. In the study, the level of agreement shows that direct distribution
was the most dominant. Retailers noted that they have adopted a distribution strategy that
allowed faster delivery of products. The retailers also had considerable had considerable
control over how the products were marketed and sold on their premises and directly responded
to customer feedback on product performance. The products were mainly being sold at
retailer’s branded stores and locations. The findings further demonstrated a positive effect of
this choice of distribution on the marketing strategy.
According to Mwanza and Ingari (2015), firms that use direct distribution sell directly to
consumers without passing through intermediaries. They engage in face-selling or sell over the
internet via e-commerce sites. Since the overall goal of distribution is to improve customer
experiences, direct distribution channels allow the outlet to build relationships with the
customer. It is through this phenomenon that distribution positively affects marketing strategy
because consumer experiences can be enhanced through a set of marketing strategies, including
design and branding of the physical stores and offering value-add services. A study by Koster
(2018) looked at the direct distribution strategies for online retailers and revealed that they
enhance delivery lead times.
The presence of indirect distribution channels was also examined among retail outlets at
Village Market. Compared to direct distribution, the level of agreement with characteristic
features of indirect distribution was lower. Nonetheless, there are those who used distribution
agents to get the products to the consumer, focused on retailer-distributor relationship rather
than retailer-customer relationship, leveraged on brand recognition, and interacted to a small
extent with end-users of the products. Regression analyses reported a positive effect on
marketing mix strategies, but the effect was not statistically significant.
64
The indirect distribution channel applies to distributors that outlets that sell through other
retailers. A study by Kafaerpour (2015), focusing on Samsung Company, showed that the
success of the channel is dependent on stock (in terms of stock availability, supervision of
distribution agents, supervision on product delivery time), and distribution channels (in terms
of sales offices of the company, distribution agents of the company, supervision of products
delivery companies). Aleksandra, Nada, and Marija (2017) reported that the performance of
indirect distribution is dependent on the size of the sales network and the number of sales
facilities. In an analysis of the source of competitive advantage among certain FMCG firms in
Kenya, Mwanza and Ingari (2015) demonstrated that direct distribution, indirect distribution,
and intensive distribution had a positive effect on creating competitive advantage. Similar
findings were reported by Adimo and Osodo (2017).
On the other hand, findings on intensive distribution showed comparatively lower level of
agreement with whether the retailers sold different products without restriction to a few brands,
whether what they sold was interchangeable, and whether the products they sold were found
elsewhere outside the mall, such as in supermarkets.
When firms use an intensive distribution channel, their primary objective is to utilize all
possible outlets to distribute their products. Marketing strategy comes into play when
determining not only the kind of product but also the characteristics of potential customers
being targeted. Most firms that adopt intensive distribution have the long-term goal of being
dominant in the industry and controlling the supply chain and customer experiences. This level
of control comes into play when making marketing decisions.
Aila, Ondiek, Mise, and Odera (2015) studied distribution channels in a soft drinks company
in Kenya to determine the effect on delivery cycle time, stock availability and customer value.
Findings indicated that there was a strong correlation between delivery time and stock
availability, and subsequently, customer value. This means that marketing strategies built
around delivery time are more likely to be effective. Marmullaku and Ahmeti (2015) found out
that distribution strategies had a significant effect on marketing strategies such as pricing and
advertising.
65
5.4. Conclusion
5.4.1. The Influence of Customers on Marketing Mix Strategy
Customer related micro-environment factors have a positive and statistically significant
influence on market mix strategy among retail outlets in Kenya. Customer behavior was
expressed in terms of personal, cultural, and social attributes. A majority of customers lived in
the neighborhood of the mall and had disposable incomes allowing them to access products
from the mall. Other behavioral attributes included attraction to store designs and product
displays and shopping at specific time of the day or seasons. Consumer preferences were based
on prices of products, stores, product quality, product promotion and brand identity. Customer
satisfaction showed high levels of satisfaction with the quality of products or services, pricing
of products or services, staff responsiveness, and customer loyalty. Overall, customer
behaviors, customer preferences, and customer satisfaction had a positive and statistically
significant influence on market mix strategies.
5.4.2. The Influence of Competition on Marketing Mix Strategy
Competition related micro-environment factors have a positive but not significant effect on
marketing strategy among retail outlets in Kenya. Competition was conceptualized based on
Michael Porter’s five forces theory. There was a moderate level of agreement with items
relating to threat of entry, competitive rivalry, and substitutes. The threat of entry is determined
by the extent to which firms hold patents as an indicator of innovativeness, exploitation of
economies of scale, capital resources, government policies and industry profitability.
Competitive rivalry was influenced by the number of competitors in the mall, relative sizes of
competitors, products offered by competitors, prices offered by competitors, and profitability
of competitors. Finally, substitutes related to the number of substitutes available to customers
in the mall, level of product differentiation, pricing of substitutes, supplier structure, and
performance features of substitutes. Multiple regressions revealed a positive but not significant
relationship between threats of entry and the choice of market mix strategies, a positive but not
statistically significant relationship between competitive rivalry and marketing mix strategies,
and a negative non-significant effect on the choice of marketing mix strategies.

66
5.4.3. The Influence of Distribution Channels on Marketing Mix Strategy
Distribution channels, as micro-environment factors, have a positive and statistically
significant influence on the marketing mix strategy of retail outlets in Kenya. Distribution
channels are varied and range from direct to indirect to intensive. With respect to direct
distribution, the findings revealed that the firms had adopted a distribution strategy that allowed
them to deliver products to customers faster, and the firms had considerable control over how
the products were marketed and sold on their premises. A moderate number of retailers directly
responded to customer feedback on product performance, while building direct relationships
with customers. The outlets sold from specific branded stores and locations. In terms of indirect
distribution, the results indicated that some firms distributed products through distribution
agents, with even lower numbers focusing on building relationships with distributors more than
customers, leveraging on existing brand recognition, interacting directly with end-users of
products. Intensive distribution is one of the micro-environmental factors that can affect the
choice of marketing mix strategies. Findings indicate that products sold at the retail outlets are
not restricted to a single brand, and they were also sold in outside the mall by retailers such as
supermarkets. The regression results showed that direct distribution had a positive and
statistically significant effect on marketing mix strategies. Indirect distribution had a positive
effect on marketing mix strategies, but the effect was not statistically significant, while there
was a negative relationship between intensive distribution and marketing mix strategies.
5.5. Recommendations
5.5.1. Recommendations for Improvement
5.5.1.1. The Influence of Customers on Marketing Mix Strategy
In terms of customer behavior, retail outlets should upgrade store designs and product display
formats, increase the availability of store information online to aid information searches, and
align operational hours according to customers shopping habits such as time of the day,
weather, or season. In terms of customer satisfaction, the retail outlets should establish
competitive prices, increase the quality of products offered, increase promotions, and stock
highly established brands. Finally, with regard to customer satisfaction, the firm’s marketing
67
strategies should focus on improving the quality of service, staff responsiveness, and product
quality.
5.5.1.2. The Influence of Competition on Marketing Mix Strategy
To improve the competitive position of the firms, the retail outlets should innovate, exploit
economies of scale, and build capital reserves in anticipation of changing market conditions
and to respond to market opportunities before other competitors. There is highly competitive
rivalry at the mall, as characterized by many small outlets selling similar products and similar
prices in the market. Finally, to overcome the abundance of substitutes offered within the mall,
the firms should adopt a differentiation strategy to enhance the variety of product offerings
available to customers.
5.5.1.3. The Influence of Distribution Channels on Marketing Mix Strategy
Direct selling is the most prominent strategy adopted by retail outlets at the mall. To exert
positive impacts on marketing strategies, focus should be on improving the efficiency of
product delivery to customers, investing additional resources in marketing of stores and
products. Retailers should also build enhance experiential satisfaction with customers, while
also establishing more locations where customers can access products.
5.5.2. Recommendations for Further Studies
The scope of the study was limited to investigating the effect of three micro-environment
factors: customers, competition, and distribution, on market mix strategies. Further studies can
examine other micro-environment factors not captured in the study. While competition is
conceptualized under Michael Porter’s theory to comprise of five elements or forces, this study
only investigated three forces. Future studies can incorporate other competitive forces in the
regression models to determine whether there are variances in the relationship with market mix
strategy.
68
REFERENCES
Agyapong, K. (2017). The Effect of Marketing Strategy on Customers Satisfaction: Distance
Education Perspective. International Journal of Innovative Research & Development,
7, 133-139.
Amara, S. (2012). The Effect of Marketing Distribution Channel Strategies on a Firm's
Performance among Commercial Banks in Kenya. Nairobi: University of Nairobi.
American Marketing Association. (2013). Definition of Marketing. American Marketing
Association, 1-10.
Azizi, F., Bagherzadeh, G., & Mombeini, H. (2015). Relationship Marketing Strategy and
Customers' Satisfaction in the Third Millenium Organizations (Case Study: Banking
Industry). International Journal of Scientific Management and Development, 2(12),
728-732.
Azzam, Z. (2018). The Principles of Modern Marketing Theory and Practice. Tokyo: Massara.
Bakator, M., Ivin, D., Vukovic, D., & Petrovic, N. (2016). Analysis of Consumer Behavior and
Marketing Strategy Improvement. VI International Symposium Engineering
Management and Competitiveness 2016 (EMC 2016) 17-18th June, (pp. 201-205).
Kotor, Montenegro.
Bakator, M., Ivin, D., Vukovic, D., & Petrovic, N. (2016). Analysis of Consumer Behavior and
Marketing Strategy Improvement. VI International Symposium Engineering
Management and Competitiveness 2016 (EMC 2016) 17-18th June 2016, (pp. 201-
205). Kotor, Montenegro.
Bolarinwa, A. O. (2015). Principles and methods of validity and reliability testing of
questionnaires used in social and health sciences. Nigerian Postgraduate Medical
Journal, 22(4), 195-201.
Bukirwa, S., & Kisingu, T. (2017). Influence of Competitive Strategies on Organizational
Performance of Hotels in Kenya (A Survey of Hotels in Mombasa County). The
Strategic Journal of Business & Change Management, 4(2(10)), 138-158.

69
Camison, C., & Lopez, A. (2010). An Examination of the Relationship between Manufacturing
Flexibility and Firm Performance: The Mediating Role of Innovation. International
Journal of Operations and Production Management, 30(8), 853-878.
Chiteli, N. (2013). Agent Banking Operations as a Competitive Strategy of Commercial Banks
in Kisumu City. International Journal of Business and Social Science, 4(13), 306-324.
Creswell, J. W., & Creswell, D. J. (2017). Research Design: Qualitative, Quantitative, and
Mixed Methods Approaches. New York: SAGE Publications.
Datta, S. (2016). Customer vs Consumer: A Different Perspective. International Journal in
Management and Social Science, 4(9), 109-114.
Ebitu, E. T. (2014). Marketing Strategies and Consumers' Satisfaction of Cement Products in
Calabar. Nigeria. British Journal of Marketing Studies, 2(6), 52-67.
Egboro, F. (2015). Marketing Challenges of Satisfying Consumers Changing Expectations and
Preferences in a Competitive Market. International Journal of Marketing Studies, 7(5),
41-52.
Furaiji, F., Latuszynska, M., & Wawrzyniak, A. (2012). An Empirical Study of the Factors
Influencing Consumer Behavior in the Electronic Appliances Market. Contemporary
Economics, 6(3), 76-86.
Getzner, M., & Grabner-Krauter, S. (2015). Consumer Preferences and Marketing Strategies
for "Green Shares": Specifics of the Austrian Market. The International Journal of
Bank Marketing, 22(4), 260-278.
Githaiga, R. W., Namusonge, G. S., & Kihoro, J. M. (2016). Marketing Strategies Adoption
and Competitiveness of Micro and Small Enterprises in Food Processing Sub-Sector:
An Empirical Review. IOSR Journal of Humanities and Social Science, 22(2(1)), 18-
22.
Hawkins, M. (2011). Consumer Behavior: Building Marketing Strategy (11 ed.). New York:
McGraw-Hill/Irwin.

70
Kanina, P. M. (2013). Influence of Promotional Mix Strategies on the Growth of Customers of
Patholitsts LANCET Kenya. Nairobi, Kenya: University of Nairobi.
Karanja, S. C., Muathe, S. M., & Kuria, T. J. (2015). Effects of Distribution Strategy on MSP
Intermediary Organisations' Performance in Nairobi, Kenya. Journal of Supply Chain
Management Systems, 4(1&2), 1-9.
Karuoya, L. N. (2014). Factors Influencing Sustainable Competitive Advantage Among Cut
Flower Companies. International Journal of Current Business and Social Services,
1(1), 1-17.
Kaunyangi, T. W. (2014). The Impact of Competition on Performance of Firms in the Mobile
Telecommunication Sector in Kenya. International Journal of Scientific and Research
Publications, 4(11), 1-7.
Kiriri, P. N. (2019a). The Role of Anchor Tenant in Driving Traffic in a Shopping Mall: The
Case of Nakumatt Exit from Three Shopping Malls in Nairobi. Journal of Language,
Technology, Entrepreneurship in Africa(10), 151-162.
Kiriri, P. N. (2019b). Determinants of Shopping Mall Attractiveness: the Case of Shopping
Malls in Nairobi, Kenya. European Journal of Economics and Business Studies, 5(1),
258-270.
Kotler, P., & Armstrong, G. (2018). Principle of Marketing (17 ed.). New York: Pearson
Higher Education.
Kushwaha, T., Ubeja, S., & Chatterjee, A. S. (2017). Factors Influencing Selection of Shopping
Malls: An Exploratory Study of Consumer Perception. Vision: The Journal of Business
Perspectives, 21(3), 274-283.
Lawrence, A. (2011). An Evaluation of Strategies for Achieving Competitive Advantage in the
Leaders Behavioral Integrity. Journal of Business and Social Science, 20(11), 1293-
1312.
Levy, M., Weitz, B. A., & Pandit, A. (2014). Retailing Management (9 ed.). New Delhi:
McGraw Hill Publishing Limited.
71
Lin, S.-J., Li, C.-H., & You, C.-S. (2012). Consumer Behavior and Perception of Marketing
Strategy for Amusement Parks: A Case Study of Taiwan. African Journal of Business
Management, 6(14), 4795-4803.
Maqin, A. R., & Hendri, N. (2017). Comparative Analysis: The Effect of Macro and Micro
Environment on Marketing Strategy and Marketing Performance of Small and Medium
Enterprises (Survey on Group of Small Medium Enterprises of Food and Non-Food
Products in Cianjur Regency, Indonesia). International Journal of Management and
Marketing, 7(5), 70-76.
Mehrizi, M. Y., & Zahedi, S. A.-S. (2013). Effective Marketing Strategies on Consumer
Behavior as a Key Success Factor in E-Marketing. Kuwait Chapter of Arabian Journal
of Business and Management Review, 2(8), 42-52.
Miriti, J. (2016). The Influence of Marketing Strategies on Consumer Preference of Private
Retail Label Brands in Nairobi: A Case of Nakumatt Blue Label. Nairobi: United States
International University - Africa (USIU).
Moriasi, J. K., Asienyo, B. O., & Okao, E. M. (2014). Factors Affecting Competitiveness of
Kenyan Flower in the International Market: A Case Study of Cut-Flower Firms in
Nakuru County. Innovative Space of Scientific Research Journals, 8(4), 1554-1565.
Mulky, A. G. (2015). Distribution Challenges and Workable Solutions. IIMB Management
Review, 25, 179-195.
Mwaluma, J. (2014). Strategies adopted by Law Firms in Kenya in Response to Changes in
the External Environment. Unpublished Thesis. University of Nairobi.
Mwanza, P., & Ingari, B. (2015). Strategic Role of Distribution as a Source of Competitive
Advantage in Fast-Moving Consumer Goods in Kenya. International Journal of
Scientific and Research Publications, 5(10), 1-14.
Nugroho, A. R., & Irena, A. (2017). The Impact of Marketing Mix, Consumer's Characteristics,
and Psychological Factors to Consumer's Purchase Intention on Bramd "W" in
Surabaya. iBuss Management, 5(1), 55-69.
72
Oberiri, A. D. (2016). Impact of Marketing Strategies on Customers' Satisfaction in Nigeria
Bottling Company (NBC) Yola Depot (2008-2016). Journal of Marketing and
Consumer Research, 7, 35-54.
Ocass, A., & Weerawardena, J. (2017). The Effects of Percieved Industry Competitive
Intensity and Marketing Related Capabilities: Drivers of Superior Brand Performance.
Industrial Marketing Management, 39, 571-581.
Ogechukwu, A. D., Umukoro, F., & Oboreh, J. (2013). The Effective Use of Relationship
Marketing Strategy for Customer Satisfaction and Retention by IGBO SMES in
Nigeria. Global Journal of Management and Business Research Marketing, 13(6), 1-
27.
Olanye, A. P., & Eromafuru, E. (2016). The Dimension of Enterpreneurial Marketing on the
Performance of Fast Food Restaurants in Asaba, Delta State, Nigeria. Journal of
Emerging Trends in Economics and Management Sciences, 7(3), 137-146.
Peter, P. J., & Olson, J. C. (2010). Consumer Behavior & Marketing Strategy. New York: The
McGraw Companies.
REB. (2018). Real Estates Board. Retrieved from List of Registered Members:
http://estateagentsboard.or.ke/members.html
Sagaci Research. (2018). Shopping Malls in Africa 2018 Report. Sagaci Research.
Segetlija, Z., Mesaric, J., & Dujak, D. (2015). Importance of Distribution Channels -
Marketing Channels - For National Economy. University of J.J.Strossmayer.
Seyyedamiri, N., & Faghih, N. (2015). Studying enterpreneuiral marketing for information
technology SMEs based on the classic grounded theory. Qscience Connect, 9, 1-13.
Singh, R. (2016). Sales and Distribution Management: A Practice-Based Approach. New
Delhi: Vikas Publishing PVT Ltd.
Takata, H. (2016). Effects of Industry Forces, Market Orientation, and Marketing Capabilities
on Business Performance: A Empirical Analysis of Japanese Manufacturers from 2009
to 2011. Journal of Business Research. doi:dx.doi.org/10.1016/j.jbusres.2016.03.068

73
Thieu, B. T., Hieu, N. T., Binh, P. C., Huyen, N. T., & Hoang, N. V. (2017). Linkages between
Marketing Mix Components and Customer Satisfaction: An Analysis on Google in
Hanoi, Vietnam. Journal of Economics and Business Research, 23(1), 113-148.
Village Market. (2020). Shops. Retrieved from www.villagemarket-kenya.com
Wahab, N., Hasan, L., & Maon, S. (2016). The Relationship Between Marketing Mix and
Customer Loyalty in Hijab Industry: The Mediating Effect of Customer Satisfaction.
Procedia Economics and Finance, 37, 366-371.
Yam, Y. (2016). The Influence of Macro and Micro Environmental Factors on the
Consumption of Mobile Phones and Marketing Strategies. Lismore, NSW: Southern
Cross University.
74
APPENDICES
APPENDIX I: INTRODUCTION LETTER
Dear Respondent,
My name is Maureen Wanjiku Gichiri. I’m a student at USIU pursuing a Masters in
Management and Organizational Development. As part of the program, I’m required to do field
research work. My research is focused on “The Influence of Micro Environment Factors on
Marketing Mix Strategy: A Case of Retail Businesses Within Shopping Malls in Nairobi.”
The objective of the study is to investigate how three micro environment factors: customers,
competition, and distribution, and how they affect your marketing strategy. To do this, I must
collect data from retail businesses at the Village Market.
This email is a request that you help me complete the questionnaire. It will only take 10 minutes
of your time.
The questionnaire will not collect personal information like your name or the name of your
business.
Please click on this link and complete the questionnaire
https://forms.gle/qyS5N86chBp9YVok6
Thank you for the assistance.

75
APPENDIX 2: QUESTIONNAIRE
PART A: BACKROUND INFORMATION
1. What is your age in years?
18-24 years old ( )
25-34 years old ( )
35-44 years old ( )
45-54 years old ( )
Over 55 years old ( )
2. What is your gender?
Male ( )
Female ( )
3. What is your level of education?
Primary school certificate ( )
Secondary school certificate ( )
Diploma ( )
Bachelor degree ( )
Masters degree ( )
PhD ( )
PART B: CUSTOMER FACTORS
4. To what extent do you agree with the following statements about customer-related
factors?
(1=Strongly Disagree, 2=Disagree, 3=Neutral, 4=Agree, 5= Strongly Agree)
1 2 3 4 5
Customer Behavior
a) Our customers are highly concentrated where we operate our
retail outlet
b) Our customers are attracted to the store design and how we
display our products
c) Our customers have adequate disposable income to afford the
prices we offer
d) Our customers’ shopping habits are dependent on the time of day
or weather of the season

76
e) Our customers go the extra step to search for information about us
and the products we offer
Consumer Preferences
a) Customers buy from us because of the prices of our products
b) Customers buy from us because they prefer our stores
c) Customers buy from us because of the quality of our products
d) Customers buy from us because of the promotions on products
e) Customers buy from us because of they prefer our brands
Customer Satisfaction
a) Customers are satisfied with the quality of service
b) Customers are satisfied with the amount of help they receive from
our staff
c) Customers are satisfied with the pricing of goods in our stores
d) Most of our customers are repeat customers
e) Customers recommend our store to friends and colleagues
PART B: COMPETITION FACTORS
5. To what extent do you agree with the following statements about competition-related
factors?
(1=Strongly Disagree, 2=Disagree, 3=Neutral, 4=Agree, 5= Strongly Agree)
1 2 3 4 5
Threat of Entry
a) Our competitors hold the patents for the goods they sell
b) Our competitors are big and enjoy economies of scale (they can
sell more volumes at low prices)
c) You need very high capital requirements to enter into our retail
segment
d) There are government policies that regulate entry to our market
segment
e) We enjoy very high levels of profitability in the industry
Competitive Rivalry
a) We have very many competitors in the mall
b) Our competitors are bigger than us in terms of market share
c) There are many retail outlets that offer the same products that we
offer.
d) There are many retail outlets that offer the same products we offer
at the same prices
e) Our growth and profitability are hindered by competitors
Substitutes
a) There are many substitutes to the products we offer
b) We do not offer unique products. Customers can either buy from
us or buy from many other stores in the mall

77
c) We sell at nearly the same price as other retail outlets offering the
same products in the mall
d) We source the products we sell from nearly the same suppliers
e) Substitutes to the products we sell are better priced and have
better performance features
PART B: DISTRIBUTION CHANNEL FACTORS
6. To what extent do you agree with the following statements about distribution
channel-related factors?
(1=Strongly Disagree, 2=Disagree, 3=Neutral, 4=Agree, 5= Strongly Agree)
1 2 3 4 5
Direct distribution
a) Our strategy is to deliver products to customers faster than any
other retail outlet
b) We have total control of how the product is marketed and sold
c) We directly respond to customer feedback on product
performance
d) Our products can only be bought from our fixed retail locations
e) We build direct relationships with our customers
Indirect distribution
a) We distribute our products through distribution agents or retailers
b) Our strongest relationships are with wholesalers and retailers, and
not with customers (e.g. our customers are the retailers and
wholesalers)
c) We leverage on existing brand recognition for the products we
sell
d) Customers can get our products from other local partners outside
the mall
e) We do not interact directly with the end-users of our products
Intensive distribution
a) We sell different products at our stores and are not restricted to
brands from a single or few industry
b) The products we sell are interchangeable. If a customer finds that
one brand is unavailable from our shelf, they can pick another
brand rather than going to another store
c) The products we sell are also sold anywhere outside the mall,
including in supermarkets and small retail outlets
d) We do not market or create awareness for any of the products we
sell
e) Our products are low-cost and are not highly priced

78
PART B: MARKET MIX STRATEGY
7. To what extent do you agree with the following statements on market-mix strategy?
(1=Strongly Disagree, 2=Disagree, 3=Neutral, 4=Agree, 5= Strongly Agree)
1 2 3 4 5
Product strategies
a) Our marketing strategy presents reliable and accurate information
about goods sold at our stores
b) Our retail outlet stocks a wide variety of products
c) Our products have a broad market appeal
Price strategies
a) Our retail outlet routinely monitors the prices and price changes
implemented by our competitors and respond effectively
b) Our retail outlet clearly communicates our prices to customers
c) Our retail outlet offers discounts on products
Place strategies
a) Our retail outlet is located in an accessible and convenient
location close to our customers
b) Our retail outlet has is a comfortable and clean with clear signs
showing customers directions
c) Our retail outlet is designed to achieve a specific brand and image
Promotion strategy
a) Our retail outlet carries out many promotion campaigns on
products and services
b) Our retail outlet offers a lot of discounts such as cash, sale, and
trade discounts to customers
c) Our promotional strategy successfully elicits attention and
enhances purchase intention

79
APPENDIX 3: LIST OF RETAIL OUTLETS
Shop/Trading Name
Ground Floor Phase 7
1 Pizza Hut
2 Afta Eats
3 Alexandre's Chocolatier
4 Lorenzo
5 Rocco Mama
6 Erita Jewels
7 MAC instore
8 Goodlife Pharmacy
9 Baby shop
10 Bossini
11 Markham
12 Text Book Centre
13 Adidas
14 Nairobi Sports House
15 Artz
16 Optica Limited
17 Sterns
18 Rodeo Drive
19 Safaricom
20 Rupas
21 Techmart
22 Sunny Forex Bureau
23 Healthy U
24 Joo & Co
25 Village Supermarket
26 Village Cellar
27 Pasta Republic
28 Enoteca
29 Hi Kitchen
30 Off the Rocks
31 Taco
32 Zucchini-Ice Cream
33 Sina Shaka
34 Milola
35 Santorini
36 Souk
37 Tiramisu

80
38 Anise
39 Milola
40 Absolute Chocolate
41 Brown Cheese
42 Activation Kitchen
43 Spring Valley Coffee
44 Maru Bhajia
45 East Pocha 254
46 Zeeshan
47 Han Ji's Corner
48 Keventers
First Floor Phase 7
49 Elias
50 SK Collection
51 OdaOmo
52 100years
53 Kshmr
54 DreamNails
55 Vacant
56 Equity Bank
57 Foschini
58 Fiona Kay
59 Woolworths
60 El Baul
61 Trevor Collections
62 Accessorize
63 Designing Africa Collective
64 Safebox
65 HanifabyHanifa
66 Moksh
67 Coco Lili
68 Vacant
69 Vivo Activewear
70 Hotpoint
71 I&M Bank
72 Vacant
73 Rose Jewellery
Second Floor Phase 7
74 Vacant Kiosk
75 Vacant (Ferrari)
76 MP SHAH
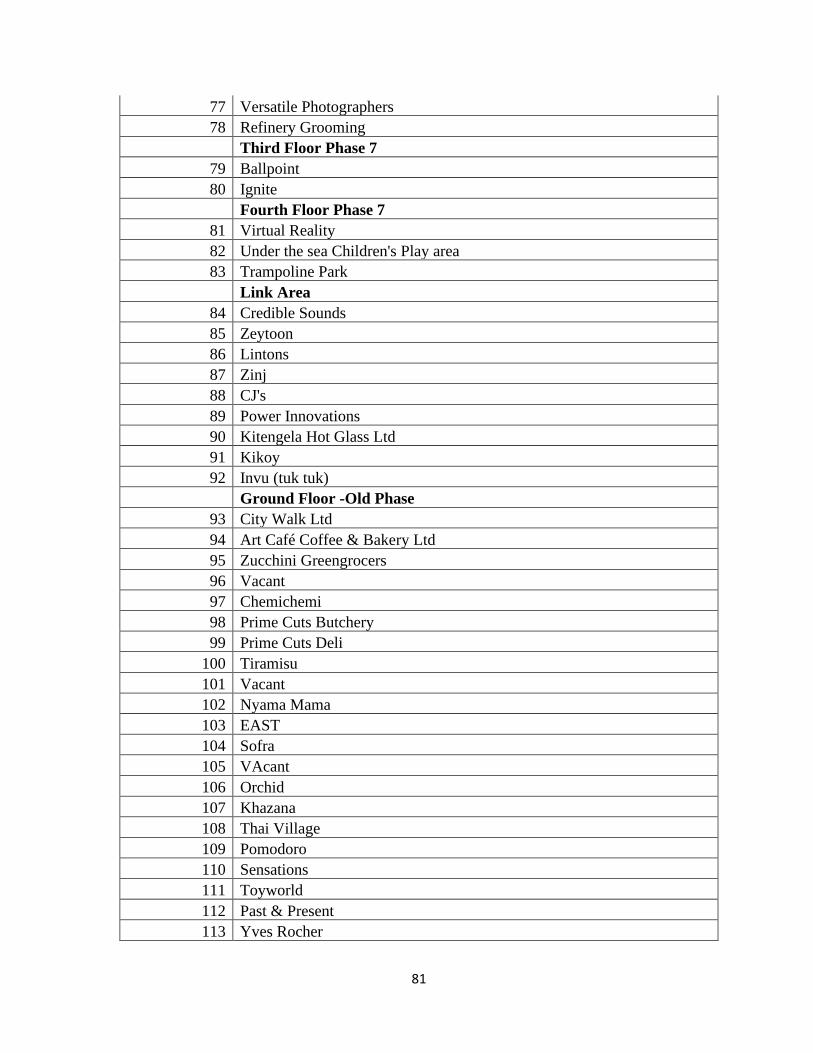
81
77 Versatile Photographers
78 Refinery Grooming
Third Floor Phase 7
79 Ballpoint
80 Ignite
Fourth Floor Phase 7
81 Virtual Reality
82 Under the sea Children's Play area
83 Trampoline Park
Link Area
84 Credible Sounds
85 Zeytoon
86 Lintons
87 Zinj
88 CJ's
89 Power Innovations
90 Kitengela Hot Glass Ltd
91 Kikoy
92 Invu (tuk tuk)
Ground Floor -Old Phase
93 City Walk Ltd
94 Art Café Coffee & Bakery Ltd
95 Zucchini Greengrocers
96 Vacant
97 Chemichemi
98 Prime Cuts Butchery
99 Prime Cuts Deli
100 Tiramisu
101 Vacant
102 Nyama Mama
103 EAST
104 Sofra
105 VAcant
106 Orchid
107 Khazana
108 Thai Village
109 Pomodoro
110 Sensations
111 Toyworld
112 Past & Present
113 Yves Rocher

82
114 Mille Collines
115 Elias
116 Sweet Street
117 Wynton House of Music
118 HandCraft Place
119 Technology House Kenya
120 Technology House Kenya
121 Mocca
122 Fashion& Accessories
123 Kashmir Arts
124 Jit Gems
125 Telkom Kenya Limited
126 Pop-up
127 Village Photoshop
128 One Way
129 Samsonite
130 Bata
131 Rossetti
132 Blue Rhino
133 Artz
134 Kingsway Tyres Ltd
Ex-Nakumatt Ground Floor
135 Homebox +Max
136 Clarks
137 Skechers
138 ANta
139 Gamechangers
140 Bottego
141 Airtel
142 Kenya Valuers
143 Aryana
144 Pop-Up
145 ABSA
146 Bbrood Kiosk
147 Coldstone
148 Vacant Unit
149 JIT Craft
150 Party Shop
151 Maasai Treads
152 Chapa Copy
153 Jaffs

83
154 Garnet Pharmacy
155 Barton collection
156 Beauty Point
157 Haute Perfumerie
158 Blue Lily Flower Crafts
159 All Times
160 Miniso
First Level -Old Phase
161 AA Kenya
162 Tintoria
163 Densey Travel
164 KCB Bank
165 Kalabash
166 Elixir Health
167 Pinkopallino Gallery
168 Trevor Collections
169 Sandstorm Africa
170 Persian Bazaar
171 Salon Natali
172 Nikon
173 Fabric Gallery
174 Grassroots Salon
175 Trevor Collections
176 Osteria
177 Design Living
178 Ella Anatomic
179 Vacant (Lintons)
180 Phoenix Safaris
181 JPR Safari Camps
182 Kazuri Beads
183 Coco Chic
184 Made In Africa
185 Patrick Mavros
186 Nobri| Home
187 Enanai & Ikwetta
188 Exhibition Hall
189 Afrika handmade
190 Pop -Up 1
191 Highport Merchants Ltd -Office
192 VFS International Ltd
193 Ikono Investment Ltd

84
194 Athens
195 JPR offices
196 Wynton House of Music
197 Big unit -Former Athens
198 FAPCL
199 Salvatore
200 Non-Solo Gelato
201 Art Café Coffee & Bakery
3rd Level
202 Dr Kassiri Essajee & Associates
203 Blossom Aesthetics
204 Desert Rose
205 Salon Malibu
206 Vacant
207 TRevor Collections offices
208 Mugg & Bean
209 Local Grill
210 Karel Lounge
211 SBM Bank
212 Commercial Bank of Africa Ltd
First Floor (Ex Nakumatt )
213 Carrefour
214 Diamond Trust Bank (K) Ltd
215 NIC Bank Limited
216 Between The Lines
217 Mac Store
218 New Pop-up
219 Zuku
220 Samsung
221 Rus Interiors
222 Prime Bank
223 KFC
Rooftop
224 Shifaz Veterinary Clinic
225 Mobile Klinik
226 Josh Designer -Service Centre
227 Tropical promoters Limited -
228 Village Sacco -Office
229 Post Office
230 DHL Worldwide Express Ltd
231 AA -Classroom

85
232 N/A
233 Safaricom Limited - Micro Cell Unit
234 CFC Bank Ltd - ATM
235 Tropical promoters Limited-Kiwi Stand
236 Liquid Telecommunications (K) Ltd
237 Jamii Telecommunications Ltd
238 Co-operative Bank of Kenya Ltd
239 Standard Chartered Bank Ltd

86
APPENDIX 4: IRB APPROVAL
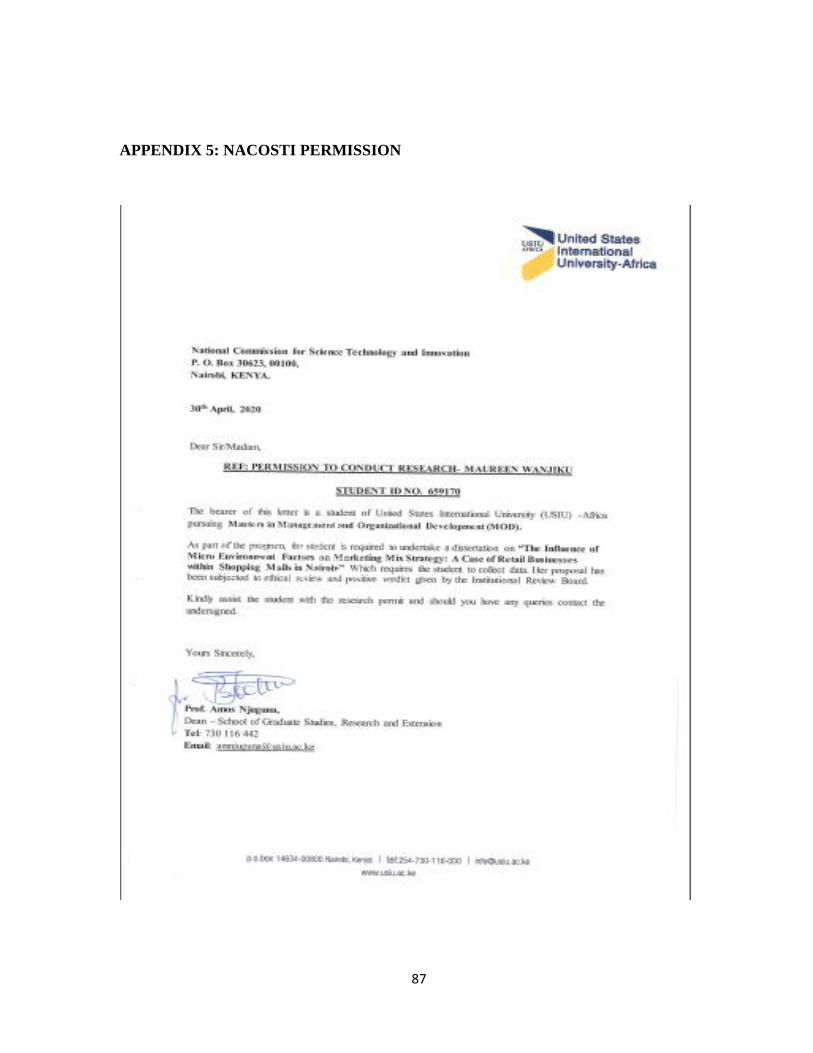
87
APPENDIX 5: NACOSTI PERMISSION

88
APPENDIX 6: NACOSTI RESEARCH LICENSE