the influence of mesh density on the impact response of a
TRANSCRIPT

November 2004
NASA/TM-2004-213501
ARL-TR-3337
The Influence of Mesh Density on the Impact
Response of a Shuttle Leading-Edge Panel
Finite Element Simulation
Karen E. Jackson and Edwin L. Fasanella
U.S. Army Research Laboratory
Vehicle Technology Directorate
Langley Research Center, Hampton, Virginia
Karen H. Lyle and Regina L. Spellman
Langley Research Center, Hampton, Virginia

The NASA STI Program Office . . . in Profile
Since its founding, NASA has been dedicated to the
advancement of aeronautics and space science. The
NASA Scientific and Technical Information (STI)
Program Office plays a key part in helping NASA
maintain this important role.
The NASA STI Program Office is operated by
Langley Research Center, the lead center for NASA’s
scientific and technical information. The NASA STI
Program Office provides access to the NASA STI
Database, the largest collection of aeronautical and
space science STI in the world. The Program Office is
also NASA’s institutional mechanism for
disseminating the results of its research and
development activities. These results are published by
NASA in the NASA STI Report Series, which
includes the following report types:
• TECHNICAL PUBLICATION. Reports of
completed research or a major significant phase
of research that present the results of NASA
programs and include extensive data or
theoretical analysis. Includes compilations of
significant scientific and technical data and
information deemed to be of continuing
reference value. NASA counterpart of peer-
reviewed formal professional papers, but having
less stringent limitations on manuscript length
and extent of graphic presentations.
• TECHNICAL MEMORANDUM. Scientific
and technical findings that are preliminary or of
specialized interest, e.g., quick release reports,
working papers, and bibliographies that contain
minimal annotation. Does not contain extensive
analysis.
• CONTRACTOR REPORT. Scientific and
technical findings by NASA-sponsored
contractors and grantees.
• CONFERENCE PUBLICATION. Collected
papers from scientific and technical
conferences, symposia, seminars, or other
meetings sponsored or co-sponsored by NASA.
• SPECIAL PUBLICATION. Scientific,
technical, or historical information from NASA
programs, projects, and missions, often
concerned with subjects having substantial
public interest.
• TECHNICAL TRANSLATION. English-
language translations of foreign scientific and
technical material pertinent to NASA’s mission.
Specialized services that complement the STI
Program Office’s diverse offerings include creating
custom thesauri, building customized databases,
organizing and publishing research results ... even
providing videos.
For more information about the NASA STI Program
Office, see the following:
• Access the NASA STI Program Home Page at
http://www.sti.nasa.gov
• E-mail your question via the Internet to
• Fax your question to the NASA STI Help Desk
at (301) 621-0134
• Phone the NASA STI Help Desk at
(301) 621-0390
• Write to:
NASA STI Help Desk
NASA Center for AeroSpace Information
7121 Standard Drive
Hanover, MD 21076-1320

National Aeronautics and
Space Administration
Langley Research Center
Hampton, Virginia 23681-2199
November 2004
NASA/TM-2004-213501
ARL-TR-3337
The Influence of Mesh Density on the Impact
Response of a Shuttle Leading-Edge Panel
Finite Element Simulation
Karen E. Jackson and Edwin L. Fasanella
U.S. Army Research Laboratory
Vehicle Technology Directorate
Langley Research Center, Hampton, Virginia
Karen H. Lyle and Regina L. Spellman
Langley Research Center, Hampton, Virginia

Available from:
NASA Center for AeroSpace Information (CASI) National Technical Information Service (NTIS)
7121 Standard Drive 5285 Port Royal Road
Hanover, MD 21076-1320 Springfield, VA 22161-2171
(301) 621-0390 (703) 605-6000
1
The Influence of Mesh Density on the Impact Response of a Shuttle
Leading-Edge Panel Finite Element Simulation
Karen E. Jackson and Edwin L. Fasanella
US Army Research Laboratory, VTD
Hampton, VA
Karen H. Lyle and Regina L. Spellman
NASA Langley Research Center
Hampton, VA
Abstract
A study was performed to examine the influence of varying mesh density on an LS-
DYNA simulation of a rectangular-shaped foam projectile impacting the space shuttle
leading edge Panel 6. The shuttle leading-edge panels are fabricated of reinforced
carbon-carbon (RCC) material. During the study, nine cases were executed with all
possible combinations of coarse, baseline, and fine meshes of the foam and panel. For
each simulation, the same material properties and impact conditions were specified and
only the mesh density was varied. In the baseline model, the shell elements representing
the RCC panel are approximately 0.2-in. on edge, whereas the foam elements are about
0.5-in. on edge. The element nominal edge-length for the baseline panel was halved to
create a fine panel (0.1-in. edge length) mesh and doubled to create a coarse panel (0.4-
in. edge length) mesh. In addition, the element nominal edge-length of the baseline foam
projectile was halved (0.25-in. edge length) to create a fine foam mesh and doubled (1.0-
in. edge length) to create a coarse foam mesh. The initial impact velocity of the foam
was 775 ft/s. The simulations were executed in LS-DYNA version 960 for 6 ms of
simulation time. Contour plots of resultant panel displacement and effective stress in the
foam were compared at five discrete time intervals. Also, time-history responses of
internal and kinetic energy of the panel, kinetic and hourglass energy of the foam, and
resultant contact force were plotted to determine the influence of mesh density. As a
final comparison, the model with a fine panel and fine foam mesh was executed with
slightly different material properties for the RCC. For this model, the average degraded
properties of the RCC were replaced with the maximum degraded properties. Similar
comparisons of panel and foam responses were made for the average and maximum
degraded models.
Introduction
Following the Space Shuttle Columbia disaster on February 1, 2003 and during the
subsequent investigation by the Columbia Accident Investigation Board (CAIB), various
teams from industry, academia, national laboratories, and NASA were requested by
Johnson Space Center (JSC) Orbiter Engineering to apply “physics-based” analyses to
characterize the expected damage to the shuttle thermal protection system (TPS) tile and
Reinforced Carbon-Carbon (RCC) material, for high-speed foam impacts. The forensic

2
evidence from the Columbia debris eventually led investigators to conclude that the
breach to the shuttle TPS was caused by a large piece of External Tank (ET) foam that
impacted and penetrated the lower portion of a left-wing leading-edge panel, shown in
Figure 1. As a result, NASA authorized a series of tests that were performed at
Southwest Research Institute to characterize the impact response of the leading-edge
RCC panels.
Recommendation 3.3-2 of the CAIB report [1] requests that NASA initiate a program to
improve the impact resistance of the wing leading edge. The second part of the
recommendation is to …“determine the actual impact resistance of current materials and
the effect of likely debris strikes.” For Return-to-Flight (RTF), a team consisting of
personnel from NASA Glenn Research Center, NASA Langley Research Center, and
Boeing Philadelphia was given the following task: to develop a validated finite element
model of the shuttle wing leading edge capable of accurately predicting the threshold of
damage from debris including foam, ice, and ablators for a variety of impact conditions.
Since the CAIB report was released, the team has been developing finite element models
of the RCC leading-edge panels; executing the models using LS-DYNA [2], a
commercial nonlinear explicit transient dynamic finite element code; conducting detailed
material characterization tests to obtain dynamic material property data; and, correlating
the LS-DYNA analytical results with experimental data obtained from impacts tests onto
RCC panels. Some of the early results of this research are described in References 3-7.
22 panels per wing
Panel 6
Figure 1. Drawing of the left wing area of the space shuttle.
The purpose of this report is to describe a mesh density study that was performed as part
of the ongoing RTF modeling efforts. In particular, the mesh study was focused on
simulating a rectangular foam projectile, having the same material properties as the BX-
250 foam used on the shuttle ET, impacting the shuttle leading-edge RCC Panel 6 at a
velocity of 775 ft/s. The location of Panel 6 on the left wing of the shuttle is highlighted

3
in Figure 1. An actual impact test of a BX-250 foam block onto RCC Panel 6 was
performed at Southwest Research Institute on June 5, 2003. While the finite element
model was originally developed to generate analytical predictions for correlation with
experimental data obtained from this test, the focus of the mesh density study described
in this report is strictly analytical.
For the mesh discretization study, nine cases were executed with all possiblecombinations of coarse, baseline, and fine meshes of the foam and panel. For eachsimulation, the same material properties and impact conditions were specified and onlythe mesh density was varied. The simulations were executed in LS-DYNA version 960for 6 ms of simulation time. Predicted structural deformations and time-history responsesare compared for each simulation. As a final comparison, the model with a fine paneland fine foam mesh was executed with slightly different material properties for the RCC.For this model, the average degraded properties of the RCC were replaced with themaximum degraded properties. Comparisons of panel deformation, effective stress in thefoam, and selected time-history responses were made for the average and maximumdegraded models.
Model Description
The complete model including the foam projectile and the RCC Panel 6 is shown in
Figure 2. The Panel 6 model was discretized using Belytachko-Tsay quadrilateral shell
elements having nominal element edge lengths of 0.1-, 0.2-, and 0.4-inches for the fine,
baseline, and coarse meshes, respectively. A schematic illustrating the different mesh
densities for the panel is shown in Figure 3. The panel model consisted of 19 different
parts including the panel midsection, two bottom flanges, two side ribs, two apex ribs,
and twelve bolt-holes. These parts are labeled in Figure 4.
Figure 2. Foam projectile and shuttle RCC Panel 6 model.

4
1.6-in.
1.6-in.
Coarse panel mesh
Fine panel mesh1.6-in.
Baseline panel mesh
Figure 3. Comparison of Panel 6 mesh densities.
Apex 1 & 2
Midsection
Ribs 1 & 2Bottom flange Bolt-hole
constraints, typical
Figure 4. Part designations for the RCC Panel 6 model.
The quadrilateral shell elements representing the RCC panel midsection and ribs were
assigned material type 58, designated MAT_LAMINATED_COMPOSITE_FABRIC.
These parts were modeled as a 19-ply laminated composite fabric with the fibers in each
layer oriented in the 0°/90° direction. The bottom flanges were modeled as a 25-ply
laminated composite fabric, having slightly different stiffness and strength properties for
the RCC material. The rib apex parts were also modeled as a 19-ply laminated composite
fabric again having slightly different properties than the RCC material assigned to the
midsection and ribs. Three unique material designations were used to specify the
material properties of the RCC in the model. These three specifications were needed to
account for differences in flight conditioned, mass degraded, and damaged material
states.

5
For each RCC material designation, average degraded material properties were used.
Prior testing of RCC material shows that it is much stiffer and stronger in compression
than in tension, thus requiring a bimodular material model. Also, the stiffness and
strength of pristine RCC material are significantly higher than flight-conditioned
material. Consequently, the term ‘degraded’ refers to the fact that flight-conditioned
material properties were used. RCC also exhibits considerable variability in material
response and it is common to see a band or range of curves used to describe the tensile
and/or compressive response, typically maximum, average, and minimum response
curves. For this study, the term ‘average’ means that the average curve was chosen for
input. In the final analysis performed in this study, a comparison is made between
average and maximum degraded properties. Thus, the term ‘maximum’ refers to the
curve defining the upper limit of the range.
In the actual RCC Panel 6, bolts were used to support and constrain the panel at the bolt-
hole locations. To account for the constraint provided by the bolts in the model, the bolt-
holes were represented using 0.1-in.-thick shell elements that were assigned rigid
material properties using material type 20 MAT_RIGID. Then, these elements were
constrained from translational motion in the x-, y-, and z-directions using the
BOUNDARY_PRESCRIBED_MOTION_RIGID card in LS-DYNA.
The finite element model of the BX-250 foam projectile had overall dimensions of 5.5 x
11.5 x 22.5-in. and was discretized using hexagonal solid elements having nominal
element edge lengths of 0.25-, 0.5-, and 1.0-in. for the fine, baseline, and coarse meshes,
respectively. A schematic illustrating the different foam mesh densities is shown in
Figure 5. Also, a comparison of the total number of nodes and elements in the three foam
and three panel meshes is provided in Table 1. The foam block represented a single part
in the LS-DYNA model, making the total number of parts in the model equal to 20. The
foam block weighed 1.67 lb.
The material properties of the BX-250 foam were represented using material type 83
MAT_FU_CHANG_FOAM with MAT_ADD_EROSION in LS-DYNA. The erosion
card is added to allow for element failure in the foam constitutive model. The
experimental foam material responses were input into the model using the
DEFINE_CURVE command in LS-DYNA. The responses were obtained from the
testing of foam components performed at NASA Glenn Research Center. These tests
were conducted to determine the influence of strain rate on the compressive response of
the foam material. Results for two strain rates, 0.01 s-1
and 25 s-1
, are plotted in Figure 6.
The material response data are plotted only up to 200-psi stress to aid in visualization of
the differences caused by strain rate; however, the stress data at strain values approaching
1 are 70,000 psi and higher. The response of the BX-250 foam, shown in Figure 6, is
typical of other foam responses in that it exhibits a linear response at low strains, and as
crushing begins a “knee” occurs in the response. Then, as stable crushing continues, the
stress increases gradually until the cells within the foam begin to compact. As
compaction initiates and continues, the stress increases dramatically for relatively small
increases in strain. As shown in Figure 6, the influence of strain rate is to increase the
stress at which the knee occurs, to increase the stress during stable crushing, and to lower

6
the strain at which compaction begins. A tensile failure stress of 65-psi was assigned to
the foam.
Coarse foam mesh
1.0-in.
1.0-in.
Fine foam mesh1.0-in.
Baseline foam mesh
Figure 5. Comparison of mesh densities used for the foam.
Table 1. Comparison of the number of elements and nodes per panel and foam mesh.
Panel Foam
Mesh density Number of
elements
Number
of nodes
Number of
elements
Number of
nodes
Coarse 11,170 11,459 1,380 1,872
Baseline 32,109 32,432 11,385 13,248
Fine 128,172 141,723 92,092 99,452
0
50
100
150
200
0 0.2 0.4 0.6 0.8 1
0.01 s-1
strain rate
25.0 s-1
strain rate
Stress, psi
Strain, in/in
Figure 6. Compressive material properties of BX-250 foam for two different strain rates.
7
All of the nodes used to create the foam projectile were assigned an initial velocity of 775
ft/s (9,300 in/s) in the x-direction, which is defined along the long edge of the foam block
(see Figure 2). A CONTACT_ERODING_NODES_TO_SURFACE was specified
between the panel midsection and the foam in the model. For this contact, the panel
midsection was designated the master surface, and the foam was the slave. Due to the
eroding feature of this contact definition, a foam element may fail, or erode, and the
contact will be picked up by the next element.
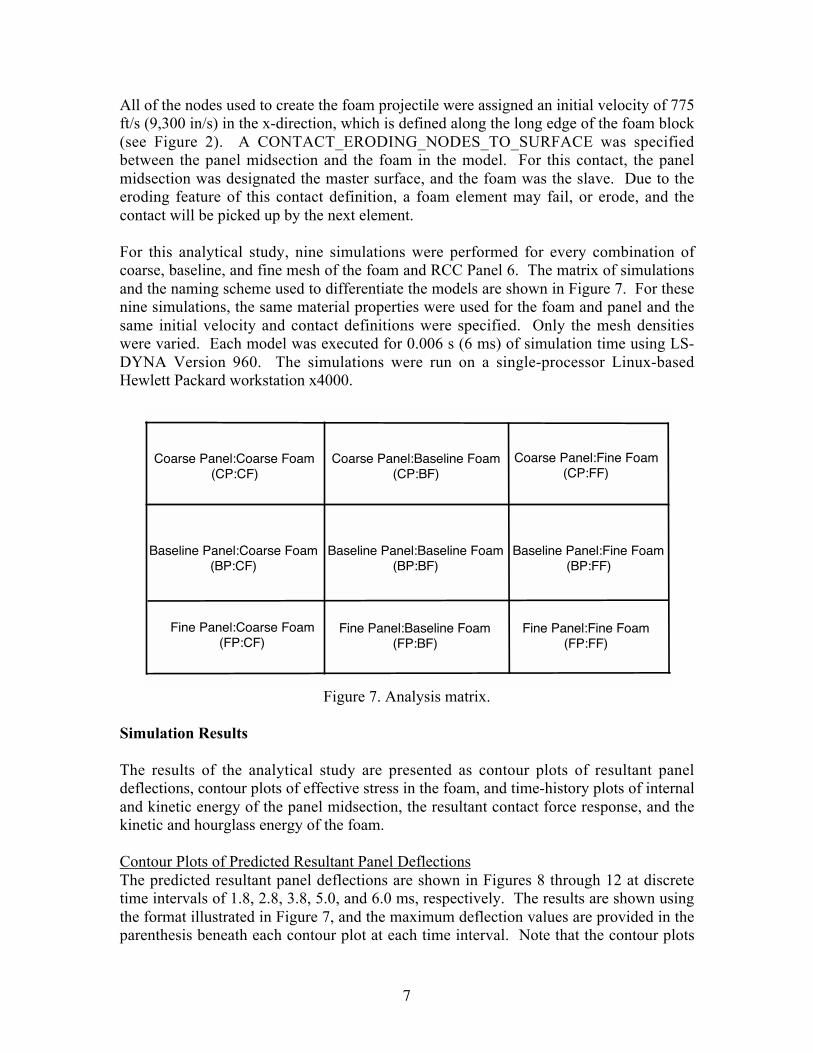
For this analytical study, nine simulations were performed for every combination of
coarse, baseline, and fine mesh of the foam and RCC Panel 6. The matrix of simulations
and the naming scheme used to differentiate the models are shown in Figure 7. For these
nine simulations, the same material properties were used for the foam and panel and the
same initial velocity and contact definitions were specified. Only the mesh densities
were varied. Each model was executed for 0.006 s (6 ms) of simulation time using LS-
DYNA Version 960. The simulations were run on a single-processor Linux-based
Hewlett Packard workstation x4000.
Coarse Panel:Coarse Foam(CP:CF)
Fine Panel:Coarse Foam(FP:CF)
Baseline Panel:Baseline Foam(BP:BF)
Fine Panel:Baseline Foam(FP:BF)
Coarse Panel:Baseline Foam(CP:BF)
Baseline Panel:Coarse Foam(BP:CF)
Baseline Panel:Fine Foam(BP:FF)
Fine Panel:Fine Foam(FP:FF)
Coarse Panel:Fine Foam(CP:FF)
Figure 7. Analysis matrix.
Simulation Results
The results of the analytical study are presented as contour plots of resultant panel
deflections, contour plots of effective stress in the foam, and time-history plots of internal
and kinetic energy of the panel midsection, the resultant contact force response, and the
kinetic and hourglass energy of the foam.
Contour Plots of Predicted Resultant Panel Deflections
The predicted resultant panel deflections are shown in Figures 8 through 12 at discrete
time intervals of 1.8, 2.8, 3.8, 5.0, and 6.0 ms, respectively. The results are shown using
the format illustrated in Figure 7, and the maximum deflection values are provided in the
parenthesis beneath each contour plot at each time interval. Note that the contour plots

8
are shown for the same fringe levels at each time interval; however, the maximum value
of the range is different for each time interval. To orient the reader, the contour plots
shown in Figures 8-12 were created by turning the panel on its edge and viewing the
lower surface of the panel midsection through the bottom flanges.
At 1.8- and 2.8-ms, the trend is that, for a constant panel mesh, increases in foam mesh
density cause a decrease in maximum deflection. However, for a constant foam mesh,
increases in panel mesh density produce an increase in maximum deflection. Given this
trend, the fine panel:coarse foam (FP:CF) model exhibits the maximum deflection of all
the combinations of foam and panel meshes for these two time intervals. No failure of
the panel has occurred by 2.8 ms, as shown in Figure 9.
CP:CF (0.24-in.) CP:BF (0.23-in.) CP:FF (0.22-in.)
BP:CF (0.25-in.) BP:BF (0.23-in.) BP:FF (0.23-in.)
FP:CF (0.27-in.) FP:BF (0.25-in.) FP:FF (0.24-in.)
Figure 8. Resultant deflection plots of RCC Panel 6 at 1.8 ms.

9
CP:CF (0.82-in.) CP:BF (0.78-in.) CP:FF (0.76-in.)
BP:CF (0.85-in.) BP:BF (0.79-in.) BP:FF (0.77-in.)
FP:CF (0.93-in.) FP:BF (0.89-in.) FP:FF (0.93-in.)
Figure 9. Resultant deflection plots of RCC Panel 6 at 2.8 ms.
By 3.8 ms, all of the finely meshed panels have failed, regardless of foam mesh density.
For the fine panel with coarse and baseline foam meshes, failure initiates as a crack in the
rib/apex intersection region, as observed in Figure 10. However, failure of the fine panel
with fine foam (FP:FF) initiates as a crack in the panel midsection. For this model, the
rib/apex crack develops as a secondary damage mode. In general, the FP:FF model
exhibits more extensive damage at this time than seen in the other models. Note that
none of the coarse or baseline panels have failed at this time.

10
CP:CF (1.18-in.) CP:BF (1.15-in.) CP:FF (1.13-in.)
BP:CF (1.22-in.) BP:BF (1.17-in.) BP:FF (0.77-in.)
FP:CF (1.28-in.) FP:BF (1.24-in.) FP:FF (1.96-in.)
Figure 10. Resultant deflection plots of RCC Panel 6 at 3.8 ms.
By 5.0 ms, all of the panels have failed with cracking of the rib area as a common
damage mode, as seen in Figure 11. In all but two cases, the rib cracks initiate at the
interface region between the rib and apex, where the material properties change. The two
exceptions are the baseline panel:baseline foam (BP:BF) and the baseline panel:fine foam
(BP:FF). For these two models, the crack initiates in the rib area only, away from the
rib/apex interface. The rib crack is the only damage seen in the coarse and baseline
panels at this time step. In comparison, the rib crack in the fine panel models has grown
downward, separating a portion of the rib from the panel. By 5.0 ms, the panel
midsection has failed in all of the fine panel models. The panel failure is characterized
by the formation of a large crack in the panel midsection that runs parallel to the rib/panel
interface. Finally, the FP:FF model exhibits a second crack in the panel midsection that
runs normal to the rib/panel interface. A similar crack is not observed in the fine panel
models with coarse or baseline foam meshes.

11
CP:CF (1.12-in.)CP:BF (1.06-in.) CP:FF (1.05-in.)
BP:CF (1.19-in.) BP:BF (1.06-in.) BP:FF (1.06-in.)
FP:CF (1.86-in.) FP:BF (1.65-in.) FP:FF (3.05-in.)
Figure 11. Resultant deflection plots of RCC Panel 6 at 5.0 ms.
By 6.0 ms, the rib/apex cracks in all of the coarse panel models and in the BP:CF model
have grown downward along the rib/panel interface, as shown in Figure 12. The rib
cracks in the baseline panel models with baseline and fine foam are stable, exhibiting no
increase in the crack size or formation of new damage. The damage in the fine panel
models is also stabilized.
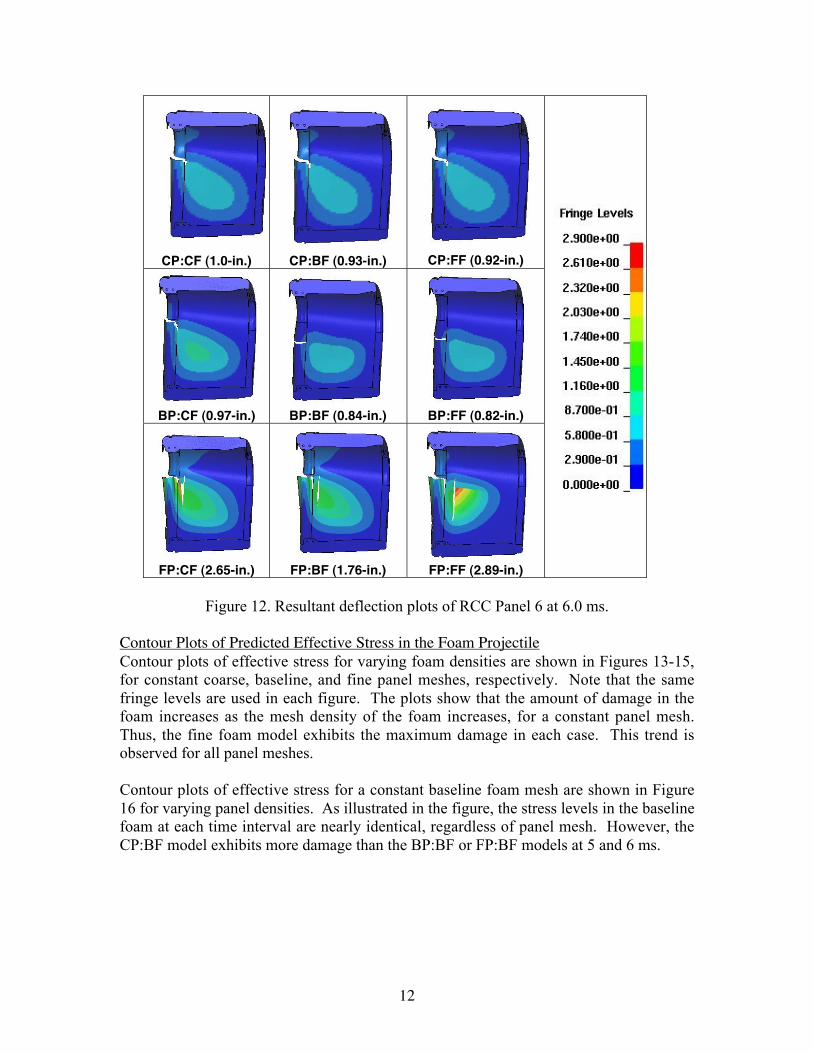
12
CP:CF (1.0-in.) CP:BF (0.93-in.) CP:FF (0.92-in.)
BP:CF (0.97-in.) BP:BF (0.84-in.) BP:FF (0.82-in.)
FP:CF (2.65-in.) FP:BF (1.76-in.) FP:FF (2.89-in.)
Figure 12. Resultant deflection plots of RCC Panel 6 at 6.0 ms.
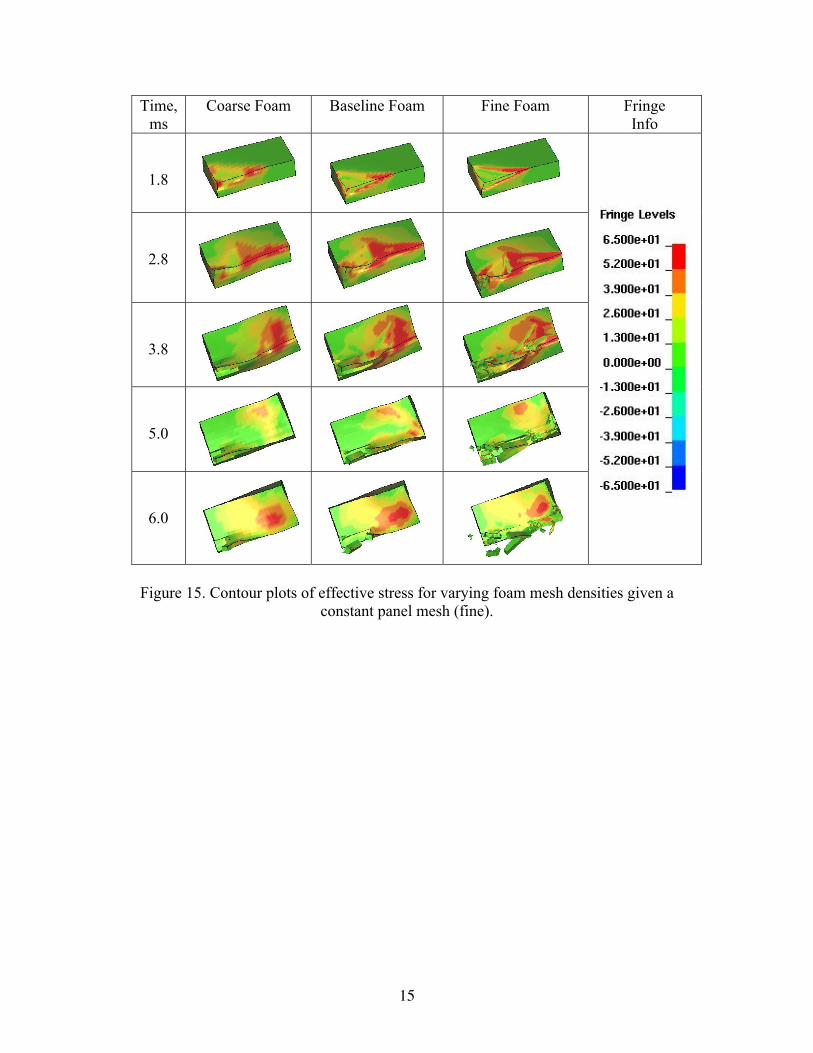
Contour Plots of Predicted Effective Stress in the Foam ProjectileContour plots of effective stress for varying foam densities are shown in Figures 13-15,
for constant coarse, baseline, and fine panel meshes, respectively. Note that the same
fringe levels are used in each figure. The plots show that the amount of damage in the
foam increases as the mesh density of the foam increases, for a constant panel mesh.
Thus, the fine foam model exhibits the maximum damage in each case. This trend is
observed for all panel meshes.
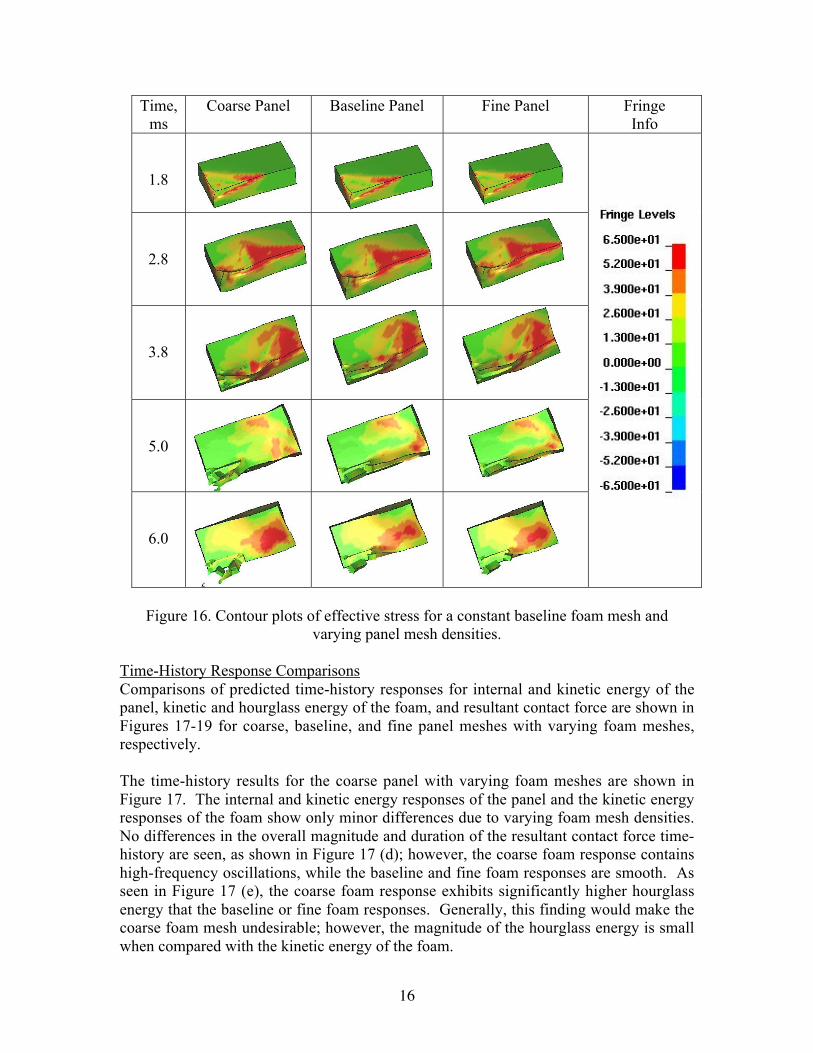
Contour plots of effective stress for a constant baseline foam mesh are shown in Figure
16 for varying panel densities. As illustrated in the figure, the stress levels in the baseline
foam at each time interval are nearly identical, regardless of panel mesh. However, the
CP:BF model exhibits more damage than the BP:BF or FP:BF models at 5 and 6 ms.

13
Time,
ms
Coarse Foam Baseline Foam Fine Foam Fringe
Info
1.8
2.8
3.8
5.0
6.0
Figure 13. Fringe plots of effective stress for varying foam densities given a constant
panel mesh (coarse).

14
Time,
ms
Coarse Foam Baseline Foam Fine Foam Fringe
Info
1.8
2.8
3.8
5.0
6.0
Figure 14. Contour plots of effective stress for varying foam mesh densities given a
constant panel mesh (baseline).
15
Time,
ms
Coarse Foam Baseline Foam Fine Foam Fringe
Info
1.8
2.8
3.8
5.0
6.0
Figure 15. Contour plots of effective stress for varying foam mesh densities given a
constant panel mesh (fine).
16
Time,
ms
Coarse Panel Baseline Panel Fine Panel Fringe
Info
1.8
2.8
3.8
5.0
6.0
Figure 16. Contour plots of effective stress for a constant baseline foam mesh and
varying panel mesh densities.
Time-History Response Comparisons
Comparisons of predicted time-history responses for internal and kinetic energy of the
panel, kinetic and hourglass energy of the foam, and resultant contact force are shown in
Figures 17-19 for coarse, baseline, and fine panel meshes with varying foam meshes,
respectively.
The time-history results for the coarse panel with varying foam meshes are shown in
Figure 17. The internal and kinetic energy responses of the panel and the kinetic energy
responses of the foam show only minor differences due to varying foam mesh densities.
No differences in the overall magnitude and duration of the resultant contact force time-
history are seen, as shown in Figure 17 (d); however, the coarse foam response contains
high-frequency oscillations, while the baseline and fine foam responses are smooth. As
seen in Figure 17 (e), the coarse foam response exhibits significantly higher hourglass
energy that the baseline or fine foam responses. Generally, this finding would make the
coarse foam mesh undesirable; however, the magnitude of the hourglass energy is small
when compared with the kinetic energy of the foam.

17
-200
0
200
400
600
800
1000
1200
1400
0 0.001 0.002 0.003 0.004 0.005 0.006
Coarse foamBaseline foamFine foam
Inte
rnal
Ene
rgy,
in-lb
.
Time, s
-100
0
100
200
300
400
0 0.001 0.002 0.003 0.004 0.005 0.006
Baseline foamCoarse foam
Fine foam
Kin
etic
Ene
rgy,
in-lb
.
Time, s
(a) Internal energy of the panel. (b) Kinetic energy of the panel.
165000
170000
175000
180000
185000
190000
0 0.001 0.002 0.003 0.004 0.005 0.006
Coarse foamBaseline foamFine foam
Kin
etic
Ene
rgy,
in-lb
.
Time, s
(c) Kinetic energy of the foam.
-1000
0
1000
2000
3000
4000
0 0.001 0.002 0.003 0.004 0.005 0.006
Baseline foamCoarse foam
Fine foam
Con
tact
For
ce, l
b.
Time, s
-1000
0
1000
2000
3000
4000
5000
0 0.001 0.002 0.003 0.004 0.005 0.006
Coarse foamBaseline foamFine foam
Hou
rgla
ss E
nerg
y, in
-lb.
Time, s
(d) Contact force. (e) Hourglass energy of the foam.
Figure 17. Predicted time-history responses for a constant coarse panel mesh and varying
foam densities.

18
Similar trends are observed in the time-history responses of the baseline panel with
varying foam mesh densities, plotted in Figure 18. The primary difference between the
coarse and baseline panel responses is that the hourglass energy of the coarse foam curve
is lower for the baseline case. However, the amount of hourglass energy in the coarse
foam is still greater than that in the baseline or fine foam.
The time-history responses for the fine panel with varying foam mesh densities are
shown in Figure 19. Unlike the coarse and baseline panels where only minor differences
were seen in the internal and kinetic energy responses of the panel as a function of
varying foam mesh density, the fine panel results show much larger variations in these
responses, as shown in Figures 19 (a) and (b). In both cases, the FP:CF model exhibits
the highest magnitude response. However, only minor differences in the kinetic energy
responses of the foam, shown in Figure 19 (c), are observed for the differing foam mesh
densities. The resultant contact force responses are of equal magnitude and duration, see
Figure 19 (d), and the coarse foam response exhibits high-frequency oscillations, not seen
in the other responses. The large spike in the fine foam response is attributed to
instabilities in the contact algorithm. Finally, the hourglass energy responses are shown
in Figure 19 (e), with the coarse foam response exhibiting the highest amount of
hourglass energy. However, even for the coarse mesh, the magnitude of the hourglass
energy is only a fraction of the kinetic energy of the foam.
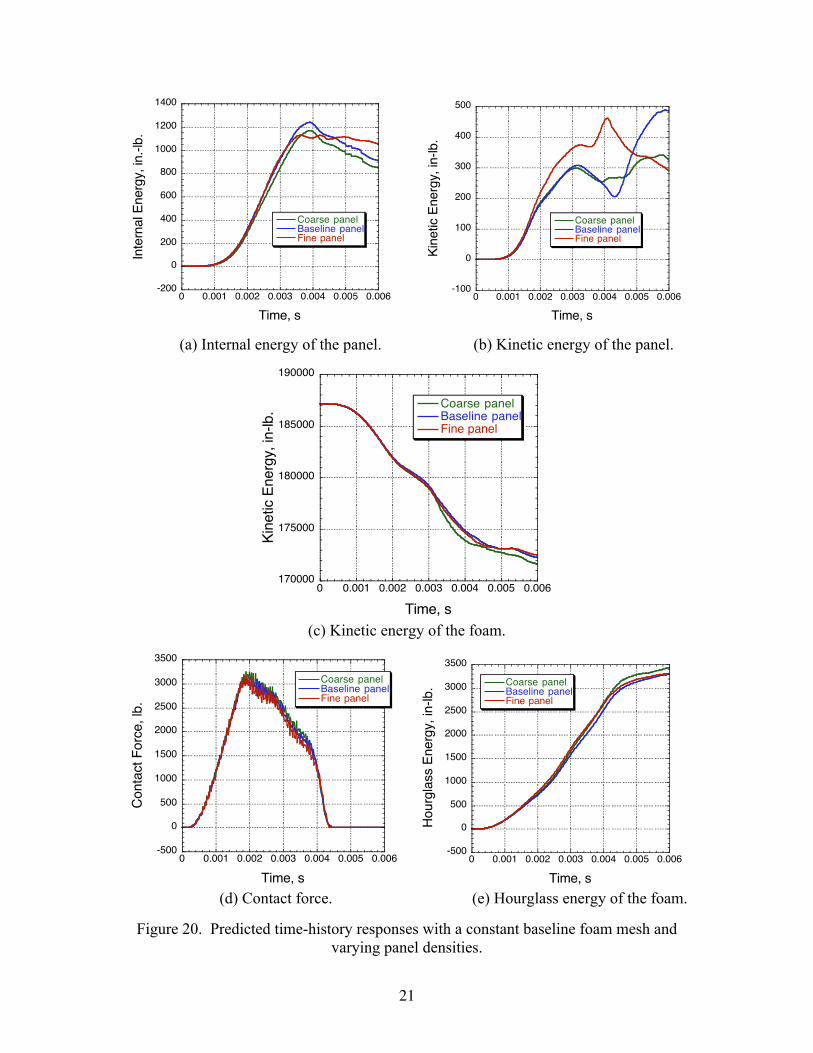
The final time-history comparisons are shown in Figure 20 for a constant baseline foam
mesh with a varying panel mesh. All of the responses are remarkably similar in
magnitude and shape, except for the kinetic energy time-histories of the panel, shown in
Figure 20 (b). In this case, the shapes of the curves vary considerably after 0.0015 s, with
the fine panel model exhibiting the highest magnitude response.
Influence of RCC Material Properties
As a final investigation, a simulation was executed of the fine panel:fine foam (FP:FF)
model in which the maximum degraded properties were used to represent the RCC
material. Comparisons of the FP:FF model executed using the average versus the
maximum degraded RCC properties are shown in Figures 21-23. The contour plots of
resultant panel displacement are shown in Figure 21 for the FP:FF model with average
and maximum degraded RCC properties. Below each plot, the maximum deflection at
that time step is shown in the parenthesis. For every time step, the maximum value of
resultant displacement is higher for the average degraded property case. Also, the
contour plots show that the overall amount of damage is significantly less for the
maximum degraded model than for the average degraded model.

19
-200
0
200
400
600
800
1000
1200
1400
0 0.001 0.002 0.003 0.004 0.005 0.006
Coarse foamBaseline foamFine foam
Inte
rnal
Ene
rgy,
in-lb
.
Time, s
-100
0
100
200
300
400
500
0 0.001 0.002 0.003 0.004 0.005 0.006
Coarse foamBaseline foamFine foam
Kin
etic
Ene
rgy,
in-lb
.
Time, s
(a) Internal energy of the panel. (b) Kinetic energy of the panel.
165000
170000
175000
180000
185000
190000
0 0.001 0.002 0.003 0.004 0.005 0.006
Coarse foamBaseline foamFine foam
Kin
etic
Ene
rgy,
in-lb
.
Time, s
(c) Kinetic energy of the foam.
-1000
0
1000
2000
3000
4000
0 0.001 0.002 0.003 0.004 0.005 0.006
Coarse foamBaseline foamFine foam
Con
tact
For
ce, l
b.
Time, s
-1000
0
1000
2000
3000
4000
5000
0 0.001 0.002 0.003 0.004 0.005 0.006
Coarse foamBaseline foamFine foam
Hou
rgla
ss E
nerg
y, in
-lb.
Time, s
(d) Contact force. (e) Hourglass energy of the foam.
Figure 18. Predicted time-history responses for a constant baseline panel mesh and
varying foam densities.

20
-200
0
200
400
600
800
1000
1200
1400
0 .001 .002 .003 .004 .005 .006
Coarse foam
Fine FoamBaseline Foam
Inte
rnal
Ene
rgy,
in-lb
.
Time, s
-100
0
100
200
300
400
500
0 0.001 0.002 0.003 0.004 0.005 0.006
Coarse foamBaseline foamFine foamK
inet
ic E
nerg
y, in
-lb.
Time, s
(a) Internal energy of the panel. (b) Kinetic energy of the panel.
170000
175000
180000
185000
190000
0 0.001 0.002 0.003 0.004 0.005 0.006
Coarse foamBaseline foamFine foam
Kin
etic
Ene
rgy,
in-lb
.
Time, s
(c) Kinetic energy of the foam.
-1000
0
1000
2000
3000
4000
0 0.001 0.002 0.003 0.004 0.005 0.006
Coarse foamBaseline foamFine foam
Con
tact
For
ce, l
b.
Time, s
-1000
0
1000
2000
3000
4000
5000
0 0.001 0.002 0.003 0.004 0.005 0.006
Coarse foamBaseline foamFine foam
Hou
rgla
ss E
nerg
y, in
-lb.
Time, s
(d) Contact force. (e) Hourglass energy of the foam.
Figure 19. Predicted time-history responses with a constant fine panel mesh and varying
foam densities.
21
-200
0
200
400
600
800
1000
1200
1400
0 0.001 0.002 0.003 0.004 0.005 0.006
Coarse panelBaseline panelFine panel
Inte
rnal
Ene
rgy,
in.-
lb.
Time, s
-100
0
100
200
300
400
500
0 0.001 0.002 0.003 0.004 0.005 0.006
Coarse panelBaseline panelFine panel
Kin
etic
Ene
rgy,
in-lb
.
Time, s
(a) Internal energy of the panel. (b) Kinetic energy of the panel.
170000
175000
180000
185000
190000
0 0.001 0.002 0.003 0.004 0.005 0.006
Coarse panelBaseline panelFine panel
Kin
etic
Ene
rgy,
in-lb
.
Time, s
(c) Kinetic energy of the foam.
-500
0
500
1000
1500
2000
2500
3000
3500
0 0.001 0.002 0.003 0.004 0.005 0.006
Coarse panelBaseline panelFine panel
Con
tact
For
ce, l
b.
Time, s
-500
0
500
1000
1500
2000
2500
3000
3500
0 0.001 0.002 0.003 0.004 0.005 0.006
Coarse panelBaseline panelFine panel
Hou
rgla
ss E
nerg
y, in
-lb.
Time, s
(d) Contact force. (e) Hourglass energy of the foam.
Figure 20. Predicted time-history responses with a constant baseline foam mesh and
varying panel densities.

22
Time,ms
Average DegradedRCC
MaximumDegraded RCC
FringeLevels
1.8
FP:FF (0.24-in.) FP:FF (0.23-in.)
2.8
FP:FF (0.93-in.) FP:FF (0.75-in.)
3.8
FP:FF (1.96-in.) FP:FF (1.43-in.)
5.0
FP:FF (3.05-in.)FP:FF (1.62-in.)
6.0
FP:FF (2.89-in.) FP:FF (0.91-in.)
Figure 21. Contour plots of resultant displacement for the FP:FF model.

23
The contour plots of effective stress in the foam are compared for the maximum and
average degraded models in Figure 22 for five discrete time steps. The distribution of
effective stress and the overall amount of damage in the foam are similar in both models
at each time step.
Time,
ms
Average Degraded
RCC
Maximum
Degraded RCC
Fringe
Info
1.8
2.8
3.8
5.0
6.0
Figure 22. Fringe plots of effective stress for fine foam for average and maximum
degraded RCC material properties.
Finally, the time-history plots of internal and kinetic energy of the panel, resultant contact
force, and kinetic and hourglass energy of the foam are shown in Figure 23 for both the
maximum and average degraded models. The internal energy curves of the panel, shown
in Figure 23 (a), are closely matched for both models up to 0.004 s, after which time the
two curves diverge. The kinetic energy responses of the panel, shown in Figure 23 (b),
are close up to 0.002 s, after which time, the kinetic energy of the average degraded
model continues to increase and peaks at a maximum value of 400-in-lb. and then
decreases, whereas the maximum degraded curve peaks initially at 250-in-lb., falls off,
and then increases again to a peak of 300-in-lb by 0.006 s. The kinetic energy responses
of the foam, plotted in Figure 23 (c), are nearly identical for both the average and
maximum degraded material models. Likewise, the contact force and hourglass energy

24
responses for the two models are very similar, as shown in Figures 23 (d) and (e). Note
that both time-history responses exhibit a large spike in the contact force due to
instabilities in the contact algorithm.
-200
0
200
400
600
800
1000
0 0.001 0.002 0.003 0.004 0.005 0.006
Avg. degraded propertiesMax. degraded propertiesIn
tern
al E
nerg
y, in
-lb.
Time, s
-100
0
100
200
300
400
500
0 0.001 0.002 0.003 0.004 0.005 0.006
Avg. degraded propertiesMax. degraded propertiesK
inet
ic E
nerg
y, in
-lb.
Time, s
(a) Internal energy of the panel. (b) Kinetic energy of the panel.
170000
175000
180000
185000
190000
0 0.001 0.002 0.003 0.004 0.005 0.006
Avg. degraded propertiesMax. degraded properties
Kin
etic
Ene
rgy,
in-lb
.
Time, s
(c) Kinetic energy of the foam.
-500
0
500
1000
1500
2000
2500
3000
3500
0 0.001 0.002 0.003 0.004 0.005 0.006
Avg. degraded propertiesMax. degraded properties
Con
tact
For
ce, l
b.
Time, s
-500
0
500
1000
1500
2000
2500
0 0.001 0.002 0.003 0.004 0.005 0.006
Avg. degraded propertiesMax. degraded propertiesH
ourg
lass
Ene
rgy,
in-lb
.
Time, s
(d) Contact force. (e) Hourglass energy of the foam.
Figure 23. Comparison of predicted time-history responses for the FP:FF model with
average versus degraded RCC Material properties.
25
Discussion of Results
An important factor for consideration in this study is the computational expense required
to run the fine foam and fine panel models. The time step used in executing the model is
equal to the time it takes a sound wave to cross some characteristic length, which is a
function of the smallest element in the model. Thus, the finer the mesh, the smaller the
time step. For example, the initial time step for the CP:CF model was 2.9E-7 s and the
time step for the FP:FF model was 1.4E-7 s. These two models required 4 and 101 hours
of CPU for execution, respectively. For comparison, the BP:BF model had an initial time
step of 2.7E-7 s and required 14 hours of CPU. The baseline mesh discretization is a
good choice for future simulations in that it captures the structural behavior and damage
progression of the panel and foam without the computational expense of the fine mesh
discretization. As shown in Figures 17-19, the coarse foam mesh should be avoided due
to the high levels of hourglass energy in the model.
Another important finding of this study is highlighted in Figure 21, which shows a
comparison of contour plots of resultant panel displacement for two FP:FP models, one
with average degraded properties for the RCC material and the other with maximum
degraded properties. This comparison shows that input of accurate material properties
for the RCC is absolutely necessary to correctly predict the initiation and progression of
impact damage in the panel.
Concluding Remarks
A mesh density study was performed in support of the Shuttle Return-To-Flight program
based on an LS-DYNA simulation of a foam projectile impacting one of the reinforced
carbon-carbon (RCC) leading edge panels on the space shuttle (Panel 6). For the study,
three meshes (coarse, baseline, and fine) were used for the foam and the panel. Thus,
nine simulations were executed representing all possible combinations of foam and panel
meshes. For each simulation, the same material properties and impact conditions werespecified and only the mesh density was varied. Comparisons of contour plots of resultantpanel displacement and effective stress in the foam projectile were made for five discretetime intervals. Also, time-history responses of internal and kinetic energy of the panel,kinetic and hourglass energy of the foam, and the resultant contact force were plotted todetermine the influence of mesh density. As a final comparison, the model with a finepanel and fine foam mesh was executed with slightly different material properties for theRCC material. For this model, the average degraded material properties of the RCC werereplaced with the maximum degraded properties. Comparisons of similar analyticalresults were made between the average and maximum degraded models.
The findings from this study are listed, as follows:
1. Before failure, the trend is that increasing panel mesh density results in increasingmaximum deflection for a constant foam discretization.
2. However, the opposite is true for increasing foam mesh density, which results inlower maximum deflections for a constant panel discretization.

26
3. For any foam mesh, the fine panel fails by 3.8 ms, with the FP:FF modelexhibiting the largest amount of damage, i.e. panel failure followed by ribcracking.
4. By 5.0 ms, all panels have failed, with rib cracking as the common failure mode.5. In all but two cases, the rib cracks initiate at the interface region between the rib
and apex, where the material properties change.6. The two exceptions are the BP:BF and the BP:FF models. For these models, the
crack initiates in the rib area only, away from the rib/apex interface.7. For a constant panel mesh, changes in the foam mesh do not substantially affect
the internal and kinetic energy time-history results; however, in all cases, thehourglass energy of the foam is highest for the coarse mesh and lowest for thefine mesh.
8. The magnitude and duration of the contact force time-histories for all cases werenearly identical; however, the contact responses of the coarse foam modelsgenerally exhibited high-frequency oscillations and the contact responses of theFP:FF models contained large spikes that were attributed to instabilities in thecontact algorithm.
9. The baseline mesh discretization is a good choice for future simulations in that itcaptures the structural behavior and damage progression of the panel and foamwithout the computational expense of the fine mesh discretization.
10. The coarse foam mesh should be avoided due to the high levels of hourglassenergy in the model.
11. The input of accurate RCC material properties to the model is extremelyimportant in correctly predicting the initiation and amount of impact damage tothe panel.
References
1. Gehman, H. W., et al, “Columbia Accident Investigation Board,” Report Volume 1,
U. S. Government Printing Office, Washington, DC, August 2003.
2. Anon., “LS-DYNA Keyword User’s Manual Volume I and II – Version 960,”
Livermore Software Technology Company, Livermore, CA, March 2001.
3. Carney, K., Melis, M., Fasanella, E., Lyle, K, and Gabrys, J.: “Material Modeling of
Space Shuttle Leading Edge and External Tank Materials for Use in the Columbia
Accident Investigation.” Proceedings of 8th
International LS-DYNA User’s Conference,
Dearborn, MI, May 2-4, 2004.
4. Melis, M.; Carney, K.; Gabrys, J.; Fasanella, E.; and Lyle, K.: “A Summery of the
Space Shuttle Columbia Tragedy and the Use of LS-DYNA in the Accident Investigation
and Return to Flight Efforts.” Proceedings of 8th
International LS-DYNA User’s
Conference, Dearborn, MI, May 2-4, 2004.

27
5. Gabrys, J.; Schatz, J.; Carney, K.; Melis, M.; Fasanella, E.; and Lyle, K.: “The Use of
LS-DYNA in the Columbia Accident Investigation.” Proceedings of 8th
International LS-
DYNA User’s Conference, Dearborn, MI, May 2-4, 2004.
6. Lyle, K.; Fasanella, E.; Melis, M.; Carney, K.; and Gabrys, J.: “Application of Non-
Deterministic Methods to Assess Modeling Uncertainties for Reinforced Carbon-Carbon
Debis Impacts.” Proceedings of 8th
International LS-DYNA User’s Conference,
Dearborn, MI, May 2-4, 2004.
7. Fasanella, E. L., Lyle, K. H., Gabrys, J., Melis, M., and Carney, K., “Test and Analysis
Correlation of Foam Impact onto Space Shuttle Wing Leading Edge RCC Panel 8,”
Proceedings of 8th
International LS-DYNA User’s Conference, Dearborn, MI, May 2-4,
2004.

REPORT DOCUMENTATION PAGE Form ApprovedOMB No. 0704-0188
2. REPORT TYPE
Technical Memorandum 4. TITLE AND SUBTITLE
The Influence of Mesh Density on the Impact Response of a Shuttle Leading-Edge Panel Finite Element Simulation
5a. CONTRACT NUMBER
6. AUTHOR(S)
Jackson; Karen E.; Fasanella, Edwin L.; Lyle, Karen H.; and Spellman, Regina L.
7. PERFORMING ORGANIZATION NAME(S) AND ADDRESS(ES)
NASA Langley Research Center U.S. Army Research Laboratory Hampton, VA 23681-2199 Vehicle Technology Directorate NASA Langley Research Center Hampton, VA 23681-2199
9. SPONSORING/MONITORING AGENCY NAME(S) AND ADDRESS(ES)
National Aeronautics and Space AdministrationWashington, DC 20546-0001and U.S. Army Research LaboratoryAdelphi, MD 20783-1145
8. PERFORMING ORGANIZATION REPORT NUMBER
L-19059
10. SPONSOR/MONITOR'S ACRONYM(S)
NASA
13. SUPPLEMENTARY NOTESAn electronic version can be found at http://techreports.larc.nasa.gov/ltrs/ or http://ntrs.nasa.gov
12. DISTRIBUTION/AVAILABILITY STATEMENTUnclassified - UnlimitedSubject Category 05Availability: NASA CASI (301) 621-0390
19a. NAME OF RESPONSIBLE PERSON
STI Help Desk (email: [email protected])
14. ABSTRACT
A study was performed to examine the influence of varying mesh density on an LS-DYNA simulation of a foam projectile impacting the space shuttle leading edge reinforced-carbon-carbon (RCC) Panel 6. Nine cases were executed with all possible combinations of coarse, baseline, and fine meshes of the foam and panel. For each simulation, the same material properties and impact conditions were specified and only the mesh density was varied. In the baseline model, the shell elements representing the RCC panel are 0.2-in. on edge, whereas the foam elements are about 0.5-in. on edge. The element nominal edge-length for the baseline panel was halved to create a fine panel mesh and doubled to create a coarse panel mesh. In addition, the element nominal edge-length of the baseline foam projectile was halved to create a fine foam mesh and doubled to create a coarse foam mesh. The initial impact velocity of the foam was 775 ft/s. Contour plots of resultant panel displacement and effective stress in the foam were compared at five discrete time intervals. Also, selected time-history responses were plotted to determine the influence of mesh density. As a final comparison, the model with a fine panel and fine foam mesh was executed with slightly different RCC material properties.
15. SUBJECT TERMS
Impact simulation; Mesh density; Foam projectile; Space shuttle; LS-DYNA
18. NUMBER OF PAGES
32
19b. TELEPHONE NUMBER (Include area code)
(301) 621-0390
a. REPORT
U
c. THIS PAGE
U
b. ABSTRACT
U
17. LIMITATION OF ABSTRACT
UU
Prescribed by ANSI Std. Z39.18Standard Form 298 (Rev. 8-98)
3. DATES COVERED (From - To)
5b. GRANT NUMBER
5c. PROGRAM ELEMENT NUMBER
5d. PROJECT NUMBER
5e. TASK NUMBER
5f. WORK UNIT NUMBER
23-376-70-30-07
11. SPONSOR/MONITOR'S REPORT NUMBER(S)
NASA/TM-2004-213501 ARL-TR-3337
16. SECURITY CLASSIFICATION OF:
The public reporting burden for this collection of information is estimated to average 1 hour per response, including the time for reviewing instructions, searching existing data sources, gathering and maintaining the data needed, and completing and reviewing the collection of information. Send comments regarding this burden estimate or any other aspect of this collection of information, including suggestions for reducing this burden, to Department of Defense, Washington Headquarters Services, Directorate for Information Operations and Reports (0704-0188), 1215 Jefferson Davis Highway, Suite 1204, Arlington, VA 22202-4302. Respondents should be aware that notwithstanding any other provision of law, no person shall be subject to any penalty for failing to comply with a collection of information if it does not display a currently valid OMB control number.PLEASE DO NOT RETURN YOUR FORM TO THE ABOVE ADDRESS.
1. REPORT DATE (DD-MM-YYYY)
11 - 200401-