the influence of increased air flow on the spatial variation of iron sinter quality
TRANSCRIPT
8/13/2019 The Influence of Increased Air Flow on the Spatial Variation of Iron Sinter Quality
http://slidepdf.com/reader/full/the-influence-of-increased-air-flow-on-the-spatial-variation-of-iron-sinter 1/6
▲645The Journal of The South African Institute of Mining and Metallurgy DECEMBER 2003
Introduction
It is well known that the quality of sinter ismainly governed by the microstructure andphase composition of the sinter. However, assintering conditions are not uniformthroughout the sinter bed, the phasecomposition, and therefore the sinter quality, vary in the sinter bed. From a production point of view it is important to optimize the sintering process with regard to both sinter quality andthe production rate. The aim of this investi-gation was therefore to investigate theinfluence that different production rates wouldhave on sinter quality. This was done by monitoring the temperature-time profiles in the
sinter bed when different air flow rates wereused, and relating these profiles to thestrength of the sinter, the amount of finesproduced and its total magnetite, SFCA andglass contents.
Background
Sintering mechanism
The sintering mechanism is briefly reviewed tofacilitate interpretation of the phasecompositions, which are reported later in this
paper.Iron ore granules, which are charged to the
sinter bed, consist of a large iron ore coreparticle with an adherent coating of fines. Thelayer of fines consists of highly reactive oreparticles, fluxes and other raw materials that are in intimate contact. It is assumed that thesintering reactions begin within the layer of adhering fines1.
Combustion of fine coke particles starts at temperatures between 700°C and 800°C andresults in the formation of CO gas. The surfaceof the iron ore core and its adhering fines are
reduced to magnetite. As the temperature risesto 1100°C , low melting point phases such asFe2O3-CaO, FeO-CaO and FeO-SiO2 are formedby solid-solid reactions2–3. The phase termedSFCA (silico-ferrite of calcium andaluminium), forms in association withmagnetite. Acicular SFCA starts to form below 1185°C; when the temperature has risen to1245°C the unreacted hematite hasdisappeared and the SFCA crystal sizeincreases3. The SFCA begins to decompose when the temperature exceeds 1300°C2,3—forming hematite if the partial pressure of
oxygen is high and the temperature is lowerthan 1350°C, and magnetite when the partialpressure of oxygen is low and the temperatureis higher than 1350°C; the slag componentsare redistributed into the melt. Decompositionof SFCA is enhanced by extended time abovethe decomposition temperature, and increasedmaximum temperature.
The influence of increased air flow on
the spatial variation of iron sinter
quality
by A.M. Garbers-Craig, J.M.A. Geldenhuis, W.J. Jordaan, and
P.C. Pistorius*
Synopsis
The aim of this investigation was to study the influence that varying production rates have on iron sinter quality. This was done by performing sinter pot tests at different pressure drops over thesinter bed, namely 11 kPa and 15 kPa (for 500 mm total beddepths). During each of the sintering processes temperature-timeprofiles were recorded of the top, middle and bottom layers of thesinter bed. On completion of the sinter process the sinter cakes weredivided into top, middle and bottom layers. The physical propertiesof each layer were subsequently characterized by performing atumbler test and a sieve analysis. A comprehensive mineralogicalstudy was also conducted on each layer.
This study revealed that sinters of similar cold strength could beproduced under the examined production rates. However, a higher production rate was accompanied by an increased amount of fines.
The cold strengths of both sinters significantly increased fromthe top layer to the bottom layer of the sinter bed. This strength
variation is not related in any simple way to the phase composition.Keywords: Sinter, sinter bed, production rate, phase
composition, cold strength, tumbler index, sieve analysis,temperature-time profile
* Department of Materials Science and Metallurgical
Engineering, University of Pretoria, Pretoria 0002.© The South African Institute of Mining and
Metallurgy, 2003. SA ISSN 0038–223X/3.00 +0.00. Paper received Apr. 2003; revised paper received Aug. 2003.

8/13/2019 The Influence of Increased Air Flow on the Spatial Variation of Iron Sinter Quality
http://slidepdf.com/reader/full/the-influence-of-increased-air-flow-on-the-spatial-variation-of-iron-sinter 2/6
The influence of increased air flow on the spatial variation of iron sinter quality
Magnetite precipitates on subsequent cooling, and SFCAre-precipitates at lower temperatures, after magnetite andhematite4. Both hematite and magnetite can be resorbed by reaction with the silicate melt to form SFCA (favoured by slow cooling).
Sinter quality
Sinter quality refers to the physical and metallurgicalproperties of the sinter. The quality of sinter is usually defined in terms of:
➤ The physical strength of the sinter at room temperatureas measured by the shatter or tumbler test
➤ The breakdown of sinter following reduction at low temperatures (550°C) determined by the reductiondegradation test (RDI)
➤ The reducibility of the sinter determined by thereducibility test (RI) at 900°C
➤ The high temperature softening and melting properties
of the sinter.
All of these properties are governed by the microstructureof the sinter, in particular the bonding phases—notably SFCA—that make up the majority of phases within sinter (up to 80 vol%)2,3,5,6.
Temperature-time characteristics of sintering
From the discussion on the sintering mechanism it is clearthat the sinter phases are mainly formed during the sinterprocess at temperatures above 1100°C. Therefore, thetemperature-time characteristics of the sinter processcontribute strongly to the microstructure and phasecomposition of sinter.
The temperature profile in the sinter bed is characterizedby a steep rise to a maximum temperature (Tmax ) during theheating cycle7 . The maximum temperature reached is oftenhigher than 1300°C and may be as high as 1350°C8. A gentleslope after reaching maximum temperature indicates therelatively slow cooling of the finished sinter during thecooling cycle.
Due to changes in bed permeability during the sintering process, different temperature profiles are obtained from topto bottom in the sinter bed. Therefore, the heating rate,maximum temperature reached, time at temperatures higherthan 1100°C and the cooling rate will differ in the top, middleand bottom layer of the sinter bed9. Due to the different
temperature-time characteristics there will be a variation inthe phase composition through the sinter bed. Because of these differences the sinter may be classified as follows10:
Top sinter: generally weak and friable giving a poor yield of sinter with an acceptable size grading. This sinter is fused at a high temperature and chilled immediately thereafter. Thesinter is discharged cold from the sinter strand. Middle sinter: This sinter is formed under optimumconditions for fusion and annealing and gives the maximum yield of sinter with acceptable size grading. The sinter isdischarged cold from the sinter strand. Bottom sinter: This sinter is discharged hot and is chilledseverely as it passes through the breaker and over the
discharge screen onto the cooler. This may result in poorphysical properties giving a lower yield of sinter withacceptable size grading. If on-strand cooling applies, thesinter will have almost the same properties as the sinter inthe middle layer.
Experimental procedure
Experiments were designed to investigate the effect of increased production rate on sinter quality. The experiments were performed with a sinter pot, using as feed a mixturebased on that used at a South African integrated steel plant.The sinter mixture contained a mixture of three iron ores,29% return fines and 9.8% waste oxides, 5.5% water and3.2% coke by mass, and sufficient lime and dolomite toobtain the required basicity (CaO/SiO2 = 2). The dry raw materials were mixed together in a rotary mixer. The water was added and further mixing for six minutes resulted inadequate granulation.
The sinter pot was lined with a grid layer (50 mm deep)consisting of -40+20 mm sinter particles, on top of which themixture was placed. The total sinter bed height was 500 mm.The average chemical composition of the produced sinter isshown in Table I.
During the sinter pot tests, the main controlled variable was the pressure drop across the bed. The sinter pot had across-sectional area of 0.16 m2.
The surface of the mixture was ignited with a gas flameunder a pressure drop of 5 kPa over the bed. The ignitiontemperature measured on the surface of the sinter bed was1000°C. After an ignition time of 1.5 minutes the gas flame was extinguished and the pressure drop over the sinter bed was increased to the relevant test pressure drop. In the first series of sinter pot tests the pressure drop was increased to11kPa. To increase the air flow rate the pressure drop over the
sinter bed was increased to 15 kPa during the second series.During tests, the off-gas flow rate was measured at the
outlet of the sinter pot. The temperature profiles in the sinterbed were determined with three thermocouples, which weredistributed vertically at equal intervals. These K-type thermo-couples were inserted into the sinter bed before the sinter was ignited by the gas flame. The off-gas temperature wasmonitored with a thermocouple placed directly below thesinter bed.
Each sinter cake obtained from the sinter pot tests wasphysically divided into three layers to form a top layer,middle layer and bottom layer. The different layers of bothseries were separately prepared for mineralogical and
physical evaluation. Three lots of sample were prepared foreach set of conditions to obtain sufficient material forphysical characterization. This yielded about 70 kg of material from the top layer, 85 kg from the middle layer, and140 kg from the bottom.
▲ 646 DECEMBER 2003 The Journal of The South African Institute of Mining and Metallurgy
Table I
Chemical composition (mass percentages)
of sinter
FeO 6.58
Fe2
O3
67.90
CaO 12.33
MgO 2.73
SiO2 6.01
A12O3 2.03
K2O 0.06
Na2O 0.03
MnO 1.30
TiO2 0.13
P 0.07
S 0.02
C 0.24
8/13/2019 The Influence of Increased Air Flow on the Spatial Variation of Iron Sinter Quality
http://slidepdf.com/reader/full/the-influence-of-increased-air-flow-on-the-spatial-variation-of-iron-sinter 3/6
The physical properties of the sinter in each layer of bothseries were characterized by the sieve analysis and theresistance to degradation by impact and abrasion at roomtemperature, as determined with the ISO 3271 tumblerstrength test.
Samples from each layer were prepared for ICP analysis,point counting (1 000 points were counted per sample) andmicroprobe analysis (using WDS).
Results and discussion
Effect of pressure drop on air flow rate, sintering
time, and temperature profiles
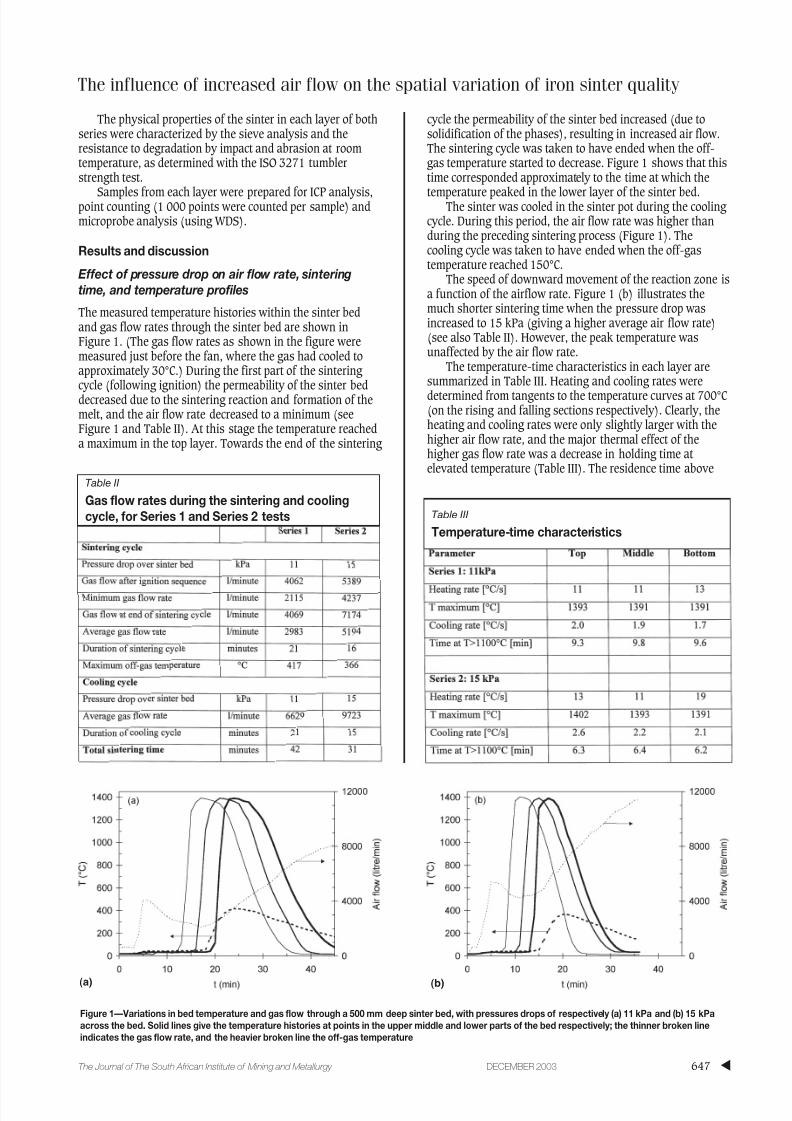
The measured temperature histories within the sinter bedand gas flow rates through the sinter bed are shown inFigure 1. (The gas flow rates as shown in the figure weremeasured just before the fan, where the gas had cooled toapproximately 30°C.) During the first part of the sintering cycle (following ignition) the permeability of the sinter beddecreased due to the sintering reaction and formation of themelt, and the air flow rate decreased to a minimum (seeFigure 1 and Table II). At this stage the temperature reacheda maximum in the top layer. Towards the end of the sintering
cycle the permeability of the sinter bed increased (due tosolidification of the phases), resulting in increased air flow.The sintering cycle was taken to have ended when the off-gas temperature started to decrease. Figure 1 shows that thistime corresponded approximately to the time at which the
temperature peaked in the lower layer of the sinter bed.The sinter was cooled in the sinter pot during the cooling cycle. During this period, the air flow rate was higher thanduring the preceding sintering process (Figure 1). Thecooling cycle was taken to have ended when the off-gastemperature reached 150°C.
The speed of downward movement of the reaction zone isa function of the airflow rate. Figure 1 (b) illustrates themuch shorter sintering time when the pressure drop wasincreased to 15 kPa (giving a higher average air flow rate)(see also Table II). However, the peak temperature wasunaffected by the air flow rate.
The temperature-time characteristics in each layer aresummarized in Table III. Heating and cooling rates were
determined from tangents to the temperature curves at 700°C(on the rising and falling sections respectively). Clearly, theheating and cooling rates were only slightly larger with thehigher air flow rate, and the major thermal effect of thehigher gas flow rate was a decrease in holding time at elevated temperature (Table III). The residence time above
The influence of increased air flow on the spatial variation of iron sinter quality
▲647The Journal of The South African Institute of Mining and Metallurgy DECEMBER 2003
Figure 1—Variations in bed temperature and gas flow through a 500 mm deep sinter bed, with pressures drops of respectively (a) 11 kPa and (b) 15 kPa
across the bed. Solid lines give the temperature histories at points in the upper middle and lower parts of the bed respectively; the thinner broken line
indicates the gas flow rate, and the heavier broken line the off-gas temperature
(a) (b)
Table II
Gas flow rates during the sintering and cooling
cycle, for Series 1 and Series 2 tests Table III
Temperature-time characteristics

8/13/2019 The Influence of Increased Air Flow on the Spatial Variation of Iron Sinter Quality
http://slidepdf.com/reader/full/the-influence-of-increased-air-flow-on-the-spatial-variation-of-iron-sinter 4/6
The influence of increased air flow on the spatial variation of iron sinter quality
1100°C is considered significant because phase formationoccurs in this temperature region; it is assumed that thesintering process is complete when the temperature dropsbelow 1100°C3. Therefore, the longer the residence time inthis temperature region the more time there will be for phase
formation. This may result in the formation of a highercontent of phases (such as SFCA) that enhance sinter quality.
Phase composition of the sinter
This study revealed that the main constituents of the
produced sinter are hematite, magnetite and SFCA, with smallquantities of calcium silicate, glass, periclase, wustite andmanganosite. The volume percentages of these phases, asdetermined by point counting, are given in Table IV. The volume percentages of the main phases are also presented in
Figure 2.
Hematite
Three types of hematite commonly occur in this sinter.Massive hematite particles resemble the original hematiteparticles added to the raw materials mixture. These particles were only partially affected during sintering. In all the layersmassive hematite dominates as the main hematite phase(between 47 and 79% of the total hematite). An example of the microstructure containing massive hematite is shown inFigure 3.
Some of the massive hematite particles display recrys-tallized outer rims (Figure 3). The crystalline hematite occurs
as euhedral to subhedral as well as skeletal and/or dendritic
▲ 648 DECEMBER 2003 The Journal of The South African Institute of Mining and Metallurgy
Figure 2—Physical properties and phase compositions of sinters. The
top pair of graphs shows the changes in tumble index (fraction ofmaterial remaining larger than 6.35 mm in diameter after simulated
handling), and the lower four sets of graphs show the phase
composition. ‘Upper’, ‘lower’ and ‘middle’ refer to the different
positions within the sinter bed. The data for the pressure drop of 11 kPa
are indicated by open circles, and those for 15 kPa by filled triangles
Table IV
Phase analysis of the sinters
Figure 3—Massive hematite displaying a recrystallized rim of crystalline
hematite. The hematite is associated with euhedral to subhedral
magnetite crystals embedded in a silicate-rich glassy matrix. Optical
micrograph (X 200)
A m
o u n t o f p h a s e ( v o l u m e % )
T u m b l e i n d e x ( % )
8/13/2019 The Influence of Increased Air Flow on the Spatial Variation of Iron Sinter Quality
http://slidepdf.com/reader/full/the-influence-of-increased-air-flow-on-the-spatial-variation-of-iron-sinter 5/6
hematite crystals, which crystallized during cooling of thesinter. Between 21 and 49% of the produced hematite iscrystalline hematite that precipitated from the melt.
The remaining hematite consists of very small quantitiesof secondary hematite, which probably formed by re-
oxidation of magnetite at high temperatures. Secondary hematite is usually bound in a matrix of calcium silicate andSFCA.
The massive hematite content (and therefore also thetotal hematite content) of the sinter in series one decreasedfrom the top layer to the bottom layer. In series two,however, the massive hematite content increased from thetop layer towards the bottom layer, but reached a maximumin the middle layer (Table IV). The total hematite content of series one (11 kPa) is lower than the total hematite content of series two (1 5 kPa) (Figure 2).
Magnetite
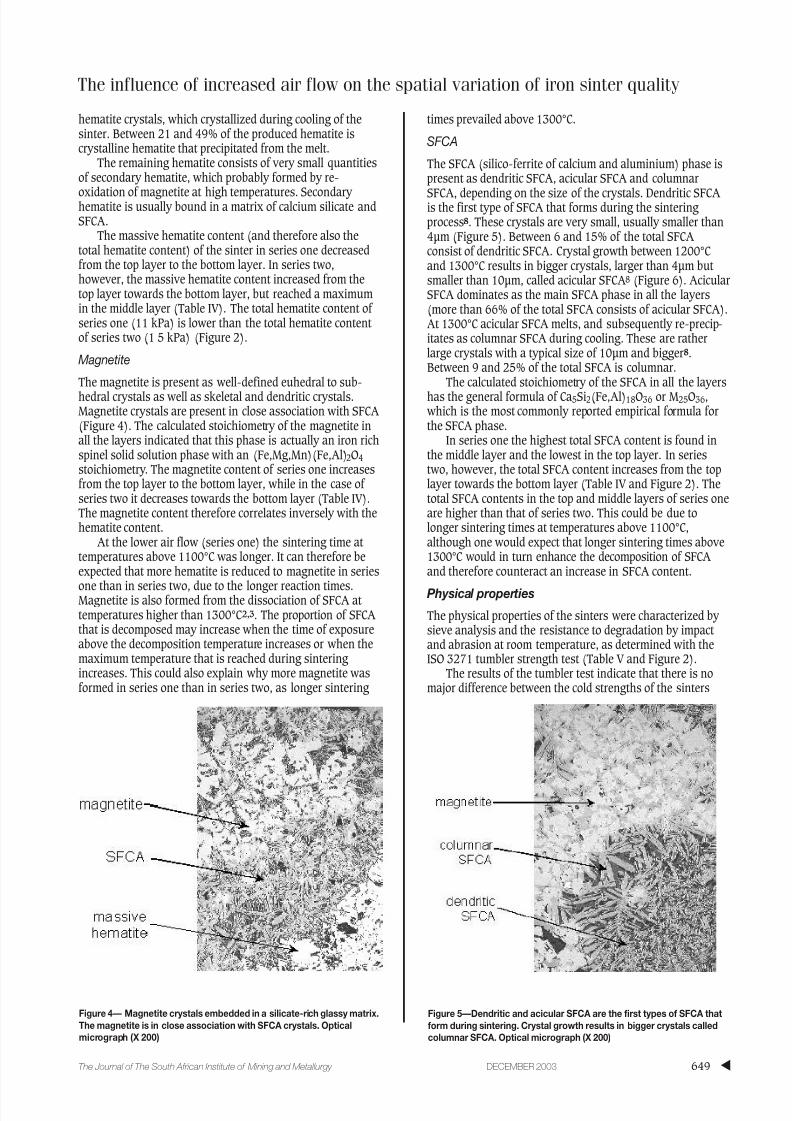
The magnetite is present as well-defined euhedral to sub-
hedral crystals as well as skeletal and dendritic crystals.Magnetite crystals are present in close association with SFCA(Figure 4). The calculated stoichiometry of the magnetite inall the layers indicated that this phase is actually an iron richspinel solid solution phase with an (Fe,Mg,Mn)(Fe,Al)2O4
stoichiometry. The magnetite content of series one increasesfrom the top layer to the bottom layer, while in the case of series two it decreases towards the bottom layer (Table IV).The magnetite content therefore correlates inversely with thehematite content.
At the lower air flow (series one) the sintering time at temperatures above 1100°C was longer. It can therefore beexpected that more hematite is reduced to magnetite in series
one than in series two, due to the longer reaction times.Magnetite is also formed from the dissociation of SFCA at temperatures higher than 1300°C2,3. The proportion of SFCAthat is decomposed may increase when the time of exposureabove the decomposition temperature increases or when themaximum temperature that is reached during sintering increases. This could also explain why more magnetite wasformed in series one than in series two, as longer sintering
times prevailed above 1300°C.
SFCA
The SFCA (silico-ferrite of calcium and aluminium) phase ispresent as dendritic SFCA, acicular SFCA and columnar
SFCA, depending on the size of the crystals. Dendritic SFCAis the first type of SFCA that forms during the sintering process8. These crystals are very small, usually smaller than4µm (Figure 5). Between 6 and 15% of the total SFCAconsist of dendritic SFCA. Crystal growth between 1200°Cand 1300°C results in bigger crystals, larger than 4µm but smaller than 10µm, called acicular SFCA8 (Figure 6). AcicularSFCA dominates as the main SFCA phase in all the layers(more than 66% of the total SFCA consists of acicular SFCA).At 1300°C acicular SFCA melts, and subsequently re-precip-itates as columnar SFCA during cooling. These are ratherlarge crystals with a typical size of 10µm and bigger8.Between 9 and 25% of the total SFCA is columnar.
The calculated stoichiometry of the SFCA in all the layers
has the general formula of Ca5Si2(Fe,Al)18O36 or M25O36, which is the most commonly reported empirical formula forthe SFCA phase.
In series one the highest total SFCA content is found inthe middle layer and the lowest in the top layer. In seriestwo, however, the total SFCA content increases from the toplayer towards the bottom layer (Table IV and Figure 2). Thetotal SFCA contents in the top and middle layers of series oneare higher than that of series two. This could be due tolonger sintering times at temperatures above 1100°C,although one would expect that longer sintering times above1300°C would in turn enhance the decomposition of SFCAand therefore counteract an increase in SFCA content.
Physical properties
The physical properties of the sinters were characterized by sieve analysis and the resistance to degradation by impact and abrasion at room temperature, as determined with theISO 3271 tumbler strength test (Table V and Figure 2).
The results of the tumbler test indicate that there is nomajor difference between the cold strengths of the sinters
The influence of increased air flow on the spatial variation of iron sinter quality
▲649The Journal of The South African Institute of Mining and Metallurgy DECEMBER 2003
Figure 4— Magnetite crystals embedded in a silicate-rich glassy matrix.
The magnetite is in close association with SFCA crystals. Optical
micrograph (X 200)
Figure 5—Dendritic and acicular SFCA are the first types of SFCA that
form during sintering. Crystal growth results in bigger crystals called
columnar SFCA. Optical micrograph (X 200)

8/13/2019 The Influence of Increased Air Flow on the Spatial Variation of Iron Sinter Quality
http://slidepdf.com/reader/full/the-influence-of-increased-air-flow-on-the-spatial-variation-of-iron-sinter 6/6
The influence of increased air flow on the spatial variation of iron sinter quality
that were produced in the two series. The highest tumblerindex is associated with the bottom layer of series 2. Theeffect of position within the sinter bed is much moresignificant than the effect of production rate, as Figure 2clearly illustrates.
The results of the sieve analysis, together with twoimportant size fractions (+16 mm and -10 mm), indicate that more fines are produced in series two than in series one, andthat the quantity of fines decreases from the top layertowards the bottom layer.
The mean particle size of the sinter in series one is alsolarger than the mean particle size of the sinter in series two(Table V). The mean particle size of the top layer is alsosmaller than that of the middle and bottom layers in each
series.It can therefore be concluded that although the coldstrengths of sinter produced in series one and two aresimilar, more fines were produced when production rates were higher.
Correlation between the quantity of phases formed
and sinter quality
Based on literature information, it is expected that thephysical properties of the sinter should be directly affected by the relative amounts of the major phases. However, Figure 2demonstrates that, for these tests, the phase composition was(unexpectedly) not a major influence: there was very littledifference in the tumbler index of the two series, despite theclear and consistent differences in phase composition (whichdifferences in phase composition were discussed above).Rather, the strongest effect by far was the spatial variation insinter quality (through the thickness of the sinter bed).
While there are spatial differences in phase composition,the phase differences between the different vertical positionsare generally smaller than the differences between the sintersproduced at the higher and lower production rates (Figure 2):production rate has a larger effect on phase composition thandoes vertical position. In contrast, the major effect regarding
sinter quality is the vertical positions within the sinter bed,and the production rate has a very minor effect (see Figure2). This conclusion apparently disproves the hypothesis that the phase composition controls sinter quality; a surprising conclusion that is being investigated in further work. Onelikely origin of the spatial variation in sinter quality isdifferences in gross porosity.
Conclusions
Increasing the airflow rate through the sinter bed signifi-cantly increases the production rate of sinter, without a lossin cold strength. The higher production rate did result in theformation of an increased amount of fines, however.
It was also found that the cold strength of the sinter, which was produced under the two selected production rates,significantly increases from the top layer to the bottom layerof the sinter bed. It appears that this difference in strengthcannot be attributed unambiguously to differences in theamounts of phases. Other parameters such as morphology of the phases that are present in the sinter, and porosity, shouldalso be investigated.
References
1. LOO, C.E. et al. Influence of material properties on high-temperature zonereactions in sintering of iron ore. Transactions of the Institute of Mining and Metallurgy, 101, January-April. 1992. pp. C7–C16.
2. SASAKI, M. et al. Consideration on the properties of sinter from the point of view of sintering reactions. Nippon Steel Corporation Tetsu-to-Hagane,
vol. 68. 1982. p. 563–598.3. DAWSON, P.R. Research studies on sintering and sinter quality. Ironmaking and Steelmaking, vol. 20. no. 2. 1993. pp. 17–143.
4. DAWSON, P.R. et al. Influence of alumina on development of complex calcium ferrites in iron ore sinters. Transactions of the Institute of Mining and Metallurgy, 94, June. 1985. pp. C71–C78.
5. BRISTOW , N.J. and W ATERS, A.G. Role of SFCA in promoting high-temperature reduction properties of iron ore sinters. Transactions of the Institute of Mining and Metallurgy, 100, January–April. 1991.pp. C1–C10.
6. MUKHERJEE, T. et al. Structure of fluxed sinter. Iron and Steelmaking 1985. vol. 12, no. 4. pp. C151–C155.
7. LI-HENG H. et al. Sintering conditions for simulating the formation of mineral phases in industrial iron ore sinter. ISIJ International. vol. 29, no.1. 1989. pp. 24–32.
8. DAWSON, P.R. et al. The influence of the sintering temperature profile onthe mineralogy and properties of iron ore sinters. Proc. Australas. Inst.
Min. Metall. no. 289. June/July, 1984. pp. 163–169.9. LI-HENG H. et al. Effect of oxygen potential on mineral formation in limefluxed iron ore sinter. ISIJ International. vol. 29, no.8. 1989. pp. 625–634.
10. DAVIES, W. Some practical applications of fundamental sinter research.Canadian Mining and Metallurgical Transactions, vol. LXIII. 1960.pp. 114–126. ◆
▲ 650 DECEMBER 2003 The Journal of The South African Institute of Mining and Metallurgy
Figure 6—Acicular SFCA in association with massive hematite. Optical
micrograph (X 200)
Table V
Physical properties of the sinter