the influence of crop phylodiversity on herbivorous
TRANSCRIPT
The Pennsylvania State University
The Graduate School Department of Entomology
THE INFLUENCE OF CROP PHYLODIVERSITY ON HERBIVOROUS INSECTS OF
SQUASH AND THEIR NATURAL ENEMIES
A Thesis in
Entomology
by
Angela Marie Coco
2019 Angela Marie Coco
Submitted in Partial Fulfillment of the Requirements
for the Degree of
Master of Science
August 2019

ii
The thesis of Angela M. Coco was reviewed and approved* by the following:
John F. Tooker Associate Professor of Entomology and Extension Specialist Thesis Advisor
Shelby Fleischer Professor of Entomology
Beth K. Gugino Director of Graduate Studies Associate Professor of Vegetable Pathology
Gary W. Felton Professor of Entomology Head of the Department of Entomology
*Signatures are on file in the Graduate School

iii
ABSTRACT
Herbivorous insects can be problematic for growers. Despite regular use of insecticides to
manage their populations, these insects can still cause extensive damage to crops. Integrated Pest
Management (IPM) was developed as an alternative to regular insecticide use to manage insects.
One IPM-based tactic, intercropping, is known to reduce herbivorous insect abundance and
damage in fields. Because the diet of many herbivores is restricted to only closely related taxa
with similar chemistry, diverse plant communities can interfere with their ability to find suitable
hosts via associational resistance. The effectiveness of intercropping against herbivorous insects
may depend on the phylogenetic relatedness of neighboring crops. In my first chapter, I studied in
a vegetable cropping system how evolutionary divergence times among plant species influenced
the effects of associational resistance on the insect community. With butternut squash as a focal
crop in a series of different intercropping combinations, I found that the phylogenetic divergence
of neighboring plants had an inconsistent effect on abundance of herbivorous insects and others
(predators, parasitoids, pollinators, detritivores). When considering relationships between crop
plants and their insect community, my results suggest that the phylogenetic relatedness of
neighboring plants might be one of the mechanisms driving associational resistance against
herbivorous insects but more research is needed.
In my second chapter, I explored parasites and parasitoids of the striped cucumber beetle
(Acalymma vittatum), an economically important pest of cucurbit crops in eastern North America.
I identified several parasitoids and parasites (Celatoria setosa, Centistes diabroticae, Howardula
spp, Nematomorpha, Gregarinasina) and revealed some details on their ecology related to date,
beetle size, and beetle gender. I also found that the striped cucumber beetle and its parasites

iv
appeared to share a density-dependent relationship to one another, and that the phylodiversity of
neighboring crops may have indirectly influenced parasitism of striped cucumber beetles.

v
TABLE OF CONTENTS
LIST OF FIGURES ................................................................................................................. vi
LIST OF TABLES ................................................................................................................... xi
ACKNOWLEDGEMENTS ..................................................................................................... xiii
Chapter 1 How phylogenetic relatedness affects the abundance of insect community in intercrops .......................................................................................................................... 1
Introduction ...................................................................................................................... 1 Materials and Methods ..................................................................................................... 4
Location ............................................................................................................ 4 Treatment and Design ...................................................................................... 5 Data Collection ................................................................................................. 6 Statistics............................................................................................................ 10
Results ......................................................................................................................... 11 Foliage scouting for pest abundance ................................................................ 11 Flower scouting for pest and pollinator abundance .......................................... 12 Sticky traps for abundance ............................................................................... 13 Pitfall traps for epigeal arthropod activity density ........................................... 14 Dissections for parasitism................................................................................. 15
Discussion ........................................................................................................................ 16 Conclusion ....................................................................................................................... 26 References ........................................................................................................................ 27
Tables ............................................................................................................................... 37 Figures .............................................................................................................................. 49
Chapter 2 An explorative survey on the parasites and parasitoids of striped cucumber beetle (Acalymma vittatum) in Pennsylvania ................................................................... 68
Introduction ...................................................................................................................... 68 Materials and Methods ..................................................................................................... 69
Statistics............................................................................................................ 70 Results .............................................................................................................................. 71
Discussion ........................................................................................................................ 73 Conclusion ....................................................................................................................... 75 References ........................................................................................................................ 75
Tables ............................................................................................................................... 78 Figures .............................................................................................................................. 79
Appendix .................................................................................................................................. 89

vi
LIST OF FIGURES
Figure 1-1: Phylogenetic relatedness of crop treatments relative to the focal crop, butternut squash ............................................................................................................... 49
Figure 1-2: Divergence times of crop treatments relative to the focal crop, butternut squash: butternut squash (0 mya), zucchini (32 mya), watermelon (147 mya), soy and garden beans (213.9 mya), peppers and sunflowers (238.3 mya), corn and oats (376.5 mya).. .................................................................................................................... 49
Figure 1-3: Visual schematic of 2017 field layout. Each plot was randomly assigned a treatment and treatments are marked in each plot. Replicate blocks were each 10 plots long. Colored plots were flooded for the entire season and not used for data collection or analysis. Crop treatments included blank (Bl), butternut squash (Bu), zucchini squash (Z), watermelon (W), garden beans (G), soy beans (So), pepper (P), sunflower (S), corn (C), and oats (O). (not to scale) ........................................................ 50
Figure 1-4: Visual representation of plot layout. Butternut squash, the focal crop, is surrounded by four rows of a treatment. In this example, corn is the planted treatment. (Not to scale) ................................................................................................... 51
Figure 1-5: Visual schematic of 2018 field layout. Each plot was randomly assigned a treatment, and 8-plot sets were the block replicates. Crop treatments included blank (Bl), butternut squash (Bu), zucchini squash (Z), watermelon (W), pepper (P), sunflower (S), corn (C), and oats (O). (Not to scale) ....................................................... 51
Figure 1-6: Each crop row in a plot was about 6 m long. Butternut squash foliage was scouted for herbivorous insect abundance assessment in the treatments. The center row of each plot was split into equal 1.6 m subsections and labeled x, y, and z. They were used on a continuous rotation for subplot sampling throughout the field season. To account for edge effect, data were not collected from the outermost 0.6 m of the row on either side. (not to scale). ..................................................................................... 52
Figure 1-7: (+/- 1SE) Data were collected by foliage scouting. Poisson regression for average squash bug abundance by divergence time on August 30th, 2017 (χ21 = 39.06, P = <0.0001, R-squared adj = 15.15%, 1.408 – 0.00793 mya). Squash bug abundance decreased as divergence time increased. ........................................................ 53
Figure 1-8: (+/- 1SE) Data were collected by foliage scouting. Poisson regressions for the abundance of all herbivorous insects pooled (squash bugs, SCB, SPCB) by divergence time on August 30th (χ25 = 87.11, P = <0.0001, R-squared adj = 33.65%, abundance = 1.456 – 0.00736 mya) and cumulative for the field season (χ25 = 75.23, P = <0.0001, R-squared adj = 19.55%, 0.488 – 0.00554 mya) in 2017. Herbivorous insect abundance decreased as divergence time increased. .............................................. 54
Figure 1-9: (+/- 1SE) Data were collected by foliage scouting. Regressions for the abundance of striped cucumber beetle (SCB) by divergence time on July 19th (F1 =
vii
4.69, P = 0.038, R-squared = 12.79%, abundance = 2.831 + 0.00702 mya), August 6th (F1 = 46.71, P = <0.0001, R-squared = 58.60%, abundance = 6.992 – 0.01275 mya), and August 28th (χ21 = 5.67, P = 0.017, R-squared = 8.29%, abundance = 0.598 – 0.00303 mya) in 2018. SCB abundance increased as divergence time increased on July 19th. SCB abundance decreased as divergence time increased on August 6th and August 28th.. ............................................................................................. 55
Figure 1-10: (+/- 1SE) Data were collected by foliage scouting. Regressions for the abundance of all herbivorous insects pooled by divergence time on August 6th (F1 = 36.85, P = <0.0001, R-squared = 52.75%, abundance = 8.751 – 0.01525 mya) and August 28th (χ25 = 40.96, P = <0.0001, R-squared adj = 33.87%, abundance = 3.216 – 0.005675 mya) in 2018. Herbivorous insect abundance decreased as divergence time increased on both dates. ........................................................................................... 56
Figure 1-11: (+/- 1SE) Data were collected by flower scouting. Poisson regression for the abundance of cucumber beetles (SCB, SPCB) by divergence time cumulative for the field season (χ22 = 19.32, P = <0.0001, R-squared adj = 5.14%) in 2017. Cucumber beetle abundance did not appear greatly change in response to divergence time despite significance and explained variance for effect of divergence time alone was very low (χ22 = 10.52, P = 0.001, R-squared adj = 3.12%, abundance = 0.683 – 0.002268 mya) ................................................................................................................. 57
Figure 1-12: (+/- 1SE) Data were collected by flower scouting. Poisson regressions for the abundance of beetles (SCB, SPCB, WCR) by divergence time on August 6th (χ26 = 46.32, P = <0.0001, R-squared adj = 43.34%, abundance = 2.4222 – 0.000736 mya) and cumulative for the field season, but only when number of flowers per plot was included in the model (flowers included: χ26 = 191.53, P = <0.0001, R-squared adj = 43.50%; flowers not included: χ21= 0.10, P = 0.752, R-squared adj = 0.02%, abundance = 2.2753 – 0.000079 mya) in 2018. Beetle abundance decreased as divergence time increased on August 6th. Beetle abundance did not appear to change in response to divergence time for the season, and instead was mainly influenced by number of flowers per plot ............................................................................................... 58
Figure 1-13: (+/- 1SE) Data were collected from sticky traps. Regression for the abundance of long-legged flies (various species) by divergence time on August 30th (F1 = 3.24, P = 0.088, R-squared = 14.55%, abundance = 8.19 – 0.00948 mya) in 2018. Long-legged fly abundance decreased as divergence time increased. ................... 59
Figure 1-14: (+/- 1SE) Data were collected from sticky traps. Regressions for the abundance of striped cucumber beetle by divergence time on June 28th (F1 = 16.94, P = <0.0001, R-squared = 33.93%, abundance = 11.14 – 0.01907 mya) and August 30th (F1 = 7.10, P = 0.015, R-squared = 27.20%, abundance = 7.280 – 0.00944 mya) in 2018. SCB abundance decreased as divergence time increased, and regression slope was larger on June 28th ........................................................................................... 60
Figure 1-15: (+/- 1SE) Data were collected from sticky traps. Regression for the abundance of thrips by divergence time on August 7th, 2018 (F1 = 6.80, P = 0.014,
viii
R-squared = 17.0%, abundance = 64.30 – 0.0788 mya). Thrips abundance weakly decreased as divergence time increased. .......................................................................... 61
Figure 1-16: (+/- 1SE) Data were collected from sticky traps. Regressions for the abundance of tarnished plant bugs (F1 = 7.40, P = 0.014, R-squared = 28.03%, abundance = 9.72 – 0.01580 mya) and spotted cucumber beetles (χ21 = 3.45, P = 0.063, R-squared = 9.55%, abundance = -0.564 + 0.00293 mya) by divergence time on August 30th, 2018. Tarnished plant bug abundance decreased as divergence time increased. SPCB abundance weakly increased as divergence time increased. ................ 62
Figure 1-17: (+/- 1SE) Data were collected from sticky traps. Regression for pooled abundance of all herbivorous insects by divergence time, cumulatively (F1 = 4.3, P = 0.041, R-squared = 4.61%, abundance = 63.24 – 0.0516 mya). Although variable, herbivorous insect abundance decreased as divergence time increased ........................... 63
Figure 1-18: (+/- 1SE) Data were collected from pitfall traps. Regressions for activity density of several epigeal arthropods by divergence time on June 28th, 2018 (Coleoptera [Carabid and Rove beetles]: χ21 = 3.72, P = 0.054, R-squared = 8.24%, activity density = -0.367 + 0.00225 mya; Arachnida [Spiders and Harvestmen]: F1 = 8.01, P = 0.008, R-squared = 19.54%, activity density = 14.89 – 0.0293 mya; Myriapoda [Millipedes and Centipedes]: χ21 = 4.95, P = 0.026, R-squared = 8.27%, activity density = 0.316 + 0.001911 mya). Arachnida activity density decreased as divergence time increased. Coleoptera and Myriapoda activity density weakly increased as divergence time increased ............................................................................ 64
Figure 1-19: (+/- 1SE) Data were collected from pitfall traps. Poisson regressions for activity density of Coleoptera (χ21 = 4.16, P = 0.042, R-squared = 9.01%, activity density = -0.213 – 0.00387 mya) and Myriapoda (χ25 = 36.31, P = 0.007, R-squared = 30.77%, activity density = 1.465 – 0.001851 mya) by divergence time on July 30th, 2018. Both Coleoptera ad Myriapoda activity density decreased as divergence time increased, although Coleoptera had a weaker response than Myriapoda ......................... 65
Figure 1-20: (+/- 1SE) Data were collected from pitfall traps. Regression for activity density of Arachnida by divergence time, cumulatively (F1 = 6.56, P = 0.012, R-squared = 6.12%, activity density = 8.42 – 0.01295 mya). Although there was some variability, Arachnida activity density decreased as divergence time increased.............. 66
Figure 1-21: 2018 average herbivorous insect abundance per plot on sticky traps (top) and foliage (bottom). In crop treatments, sunflower had the lowest average activity density. Foliar abundances were counted on the center row of butternut squash, and sticky traps were placed in the approximate center of the focal crop center row (butternut squash). ............................................................................................................ 67
Figure 2-1: Nematode (Allantonematidae: Howardula spp.) dissected from a SCB on 30 August. (image courtesy of Carolyn Trietsch) ................................................................. 79
Figure 2-2: Lateral view of a Tachinid larvae C. setosa dissected from a SCB on 10 July. (image courtesy of Carolyn Trietsch). ............................................................................. 79
ix
Figure 2-3: Images of a Braconid larvae C. diabroticae dissected from a SCB on 10 July. Lateral view (top image) of a Braconid larvae body and dorsal view (bottom image) of a Braconid larvae head. (images courtesy of Carolyn Trietsch) .................................. 80
Figure 2-4: Braconid egg C. diabroticae dissected from a SCB on 30 August. Ventral view of egg (left image) and closeup ventral view of larval head (right image). To the best of my knowledge, these are the first published images of a C. diabroticae egg. (images courtesy of Carolyn Trietsch) ..................................................................... 81
Figure 2-5: (+/- 1 SE; α = 0.05) Average number of female and male beetles per plot. In a Two-Sample T-Test comparing number of female and male beetles, the average number of male and female beetles per plot was significantly different (H₀: μ₁ - µ₂ = 0; T-Value = -6.78, DF = 191, P-Value = <0.0001). ........................................................ 82
Figure 2-6: (+/- 1 SE; α = 0.05) Average elytron length of female and male beetles per plot. In a Two-Sample T-Test comparing elytron length (mm) and beetle sex, the mean elytron length of male and female beetles was significantly different (H₀: μ₁ - µ₂ = 0; T-Value = 5.37, DF = 227, P-Value = <0.0001).. ................................................ 83
Figure 2-7: (+/- 1 SE; α = 0.05) Average number of parasitic organisms found in a SCB. Parasitic organisms included Tachinid larvae, Braconid larvae, Braconid eggs, nematodes, and other. In a Binary Logistic Regression comparing beetle sex versus total number of parasitic organisms per beetle with male as the event (Y), mean total number of parasitic organisms per beetle was statistically significant (χ21 = 4.53, P-value = 0.033; Y = 0.153 + 0.301 total parasitic organisms). Additional Binary Logistic Regressions comparing each common parasitic organism to beetle sex revealed that Tachinids had a preference for male beetles but Braconids and nematodes had no preference for either sex: Tachinids: (χ21 = 3.94, P-value = 0.047; Y = 0.471 + 0.470 tachinids); Braconids: (χ21 = 02.42, P-value = 0.120); Nematodes: (χ21 = 0.36, P-value = 0.551) ........................................................................................... 84
Figure 2-8: (+/- 1SE) Data were collected from dissecting striped cucumber beetles. Regression for abundance of tachinid larvae inside SCB per plot, by divergence time and date (July 10th: χ21 = 3.68, P = 0.055, R-squared = 8.26%, abundance = 0.265 – 0.00257 divergence time; August 7th: χ25 = 12.58, P = 0.028, R-squared adj = 14.19%, abundance = 0.426 – 0.00233 divergence time; August 30th: χ21 = 3.75, P = 0.053, R-squared = 11.11%, abundance = 0.537 – 0.00303 divergence time). Tachinid larvae abundance decreased as divergence time increased. .............................. 85
Figure 2-9: (+/- 1SE) Data were collected from dissecting striped cucumber beetles. Regression for abundance of braconid larvae and eggs inside SCB by divergence time and date. Braconid larvae and egg abundance decreased in response to divergence time on July 10th (larvae: χ21 = 11.40, P = 0.001, R-squared = 17.04%, abundance = 1.014 – 0.00333 divergence time; eggs: χ21 = 9.25, P = 0.002, R-squared = 20.11%, abundance = 0.741 – 0.00348 divergence time) and August 7th
(larvae: χ25 = 24.50, P = <0.0001, R-squared = 31.05%, abundance = 0.531 – 0.00437 divergence time; eggs: χ21 = 3.39, P = 0.066, R-squared = 7.42%, abundance = 0.364 – 0.00256 divergence time). ............................................................. 86

x
Figure 2-10: Average abundance of SCB and total parasites and parasitoids per plot with polynomial trendlines. Parasite and parasitoid abundance appeared to have an inverse relationship with SCB abundance throughout the season. It is possible that parasites and SCB have a density-dependent relationship, but I was not able to test this using my data. See Chapter 1 for details on SCB collection methods. ..................... 87
Figure 2-11: Gregarinasina dissected from SCB on 30 August. A gregarine (top image) and gregarine syzygy (bottom image). (images courtesy of Carolyn Trietsch). .............. 88
Figure A-1: Precipitation events and totals recorded at the Rock Springs NEWA Weather Station throughout the field season for 2017 and 2018. Excessive rains caused a delay and planting in both years. In 2017, about 20% of plots were flooded throughout the season. Because of this, I relocated to another area of the research farm in 2018. .................................................. 89
Figure A-2: Figure 1 from Razze et al. 2016. “Diagrams of the different buckwheat arrangements implemented in the intercropping field study. A) Buckwheat A, where buckwheat is planted as alternating strips on either side of the squash; B) buckwheat B, where buckwheat is planted in the middle of the squash planted on both sides of the bed; and C) buckwheat C, where buckwheat is planted continuously on both sides of the squash.” ................................... 90

xi
LIST OF TABLES
Table 1-1: Data collection by week for 2017 and 2018. In 2017, data were only collected during the late season because of flooding and rain issues. In 2018, pitfall trap and sticky trap were not possible in July because of frequent rain ......................................... 37
Table 1-2: Basic statistics for herbivorous insects counted on foliage in subplots for 2017. For each date and divergence time (million years ago) from butternut squash, the mean abundances of each herbivorous insect (striped cucumber beetle, spotted cucumber beetle, squash bug) are provided, along with the mean abundances and their associated standard errors for all three herbivores pooled together. ........................ 38
Table 1-3: Significant regression models from trap data in 2017. In 2017, arthropod abundances were rare and most trap data had to pooled for cumulative models because they otherwise didn’t satisfy model assumptions. Significances were found among herbivorous insects counted from foliage scouting and flower scouting efforts (α = 0.1, α = 0.05*, α = 0.01**). ........................................................................... 39
Table 1-4: Basic statistics for herbivorous insects counted on foliage in subplots for 2018. For each date and divergence time (million years ago) from butternut squash, the mean abundances of each herbivorous insect (striped cucumber beetle, spotted cucumber beetle, squash bug, western corn rootworm) are provided, along with the mean abundances and their associated standard errors for all three herbivores pooled together............................................................................................................................. 40
Table 1-5: Significant regression models from collected data in 2018. In 2018, there were some cases where arthropod abundances were rare and most trap data had to be pooled for cumulative models because they otherwise didn’t satisfy model assumptions, such as with flower scouting data. Significances were found with all collection methods except dissections. Among the arthropod groups, herbivorous insects were the most commonly significant (α = 0.1, α = 0.05*, α = 0.01**). (Bees abundance with date as a predator not shown: P = <0.0001). .......................................... 41
Table 1-6: Basic statistics for bees and cucumber beetles counted in flowers for 2017. Abundances were very low. For each date and divergence time (million years ago) from butternut squash, the mean abundances of each bee (squash bee, bumble bee, honey bee) and cucumber beetle (striped cucumber beetle, spotted cucumber beetle) are provided, along with the mean abundances and their associated standard errors for all three bees pooled together, and then all cucumber beetles pooled together .......... 42
Table 1-7: Basic statistics for bees and cucumber beetles counted in flowers for 2018. Abundances were lowest for the 28-Aug sampling date. For each date and divergence time (million years ago) from butternut squash, the mean abundances of each bee (squash bee, bumble bee, honey bee) and cucumber beetle (striped cucumber beetle, spotted cucumber beetle, western corn rootworm) are provided, along with the mean abundances and their associated standard errors for all three bees pooled together, and then all cucumber beetles pooled together ............................. 43
xii
Table 1-8: Basic statistics for natural enemies on sticky traps in both years. Abundances were very low in 2017. For each date and divergence time (million years ago) from butternut squash, the mean abundances of each insect (lady beetle, parasitic wasp, hover fly, long-legged fly) are provided, along with the mean abundances and their associated standard errors for all natural enemies pooled together. ................................. 44
Table 1-9: Basic statistics for herbivorous insects on sticky traps in both years. Abundances were very low in 2017. For each date and divergence time (million years ago) from butternut squash, the mean abundances of each insect (striped cucumber beetle, spotted cucumber beetle, thrips, tarnished plant bug) are provided, along with the mean abundances and their associated standard errors for all herbivorous insects pooled together. ................................................................................ 45
Table 1-10: Average herbivorous insect abundance per crop in 2017 and 2018. For each trap type on each date, the crop with the lowest mean is colored. In both years, sunflower often had the lowest or one of the lowest herbivorous insect mean abundances among all treatments. .................................................................................... 46
Table 1-11: Basic statistics for epigeal arthropod activity density from pitfall traps in both years. For each date and divergence time (million years ago) from butternut squash, the mean activity density for each arthropod (Coleoptera, Arachnida, Myriapoda, Ants) and its associated standard error are provided .................................... 47
Table 1-12: Basic statistics for parasitoid and parasite mean abundances from striped cucumber beetle dissections in both years. For each date and divergence time (million years ago) from butternut squash, the mean abundance for each parasitoid and parasite (tachinid larvae, braconid larvae and eggs, nematodes) and its associated standard error are provided ............................................................................. 48
Table 2-1: Average striped cucumber beetle elytron length, average parasitism, and average number of parasitic species per beetle by date and sex. Three beetles were not included as their sex was unknown due to empty abdominal cavities. ...................... 78
Table 2-2: Season cumulative means for parasitoids and parasites associated with different butternut squash intercrops in 2018.. ................................................................. 78
xiii
ACKNOWLEDGEMENTS
In the Tooker Lab, I would like to thank Elizabeth Rowan, Kirsten Pearsons, Sarah
McTish, Julie Baniszewski, Julie Golinski, Eric Yipp, and Andrew Aschwanden not only for your
knowledge, feedback, statistics sessions, and physical labor, but also for friendship, laughter, and
acceptance that you bestowed to me. You will always have a place in my heart. I am also
appreciative to the army of undergrads that assisted me with data collection and sample sorting,
including Dan Wisniewski, Ken Kim, Ken Koepplinger, Garret Reiter, Hayden Bock, Jen
Halterman, Kyra Hoerr, Brandon Wilt, Sonia Klein, and Amanda Seow. Dan and Hayden were
especially helpful for the duration of my project, and Ken Koepplinger’s tractor skills were great.
I am interminably grateful to my advisor, John Tooker, who was brave enough to accept me as a
graduate student when others rejected me. His patience, thoughtfulness, intuition, encouragement,
and enthusiasm for research have helped me to become a better scientist. I will miss being a
Tookerling and am confident that future graduate students will continue to love this lab.
I am thankful to my committee members, Shelby Fleischer and Beth Gugino, for their
advice, feedback, and contributions to my project. Their input helped me to understand my study
system and have helped me to grow as a person. As a whole, I would also like to thank everyone
in the entomology department for (1) anything that you’ve done to help me on this journey, and
(2) for being incredibly welcoming and friendly. Your presence is the life of the department.
Special thanks to LaTrisha and Marcia whose patience and poise are simply extraordinary.
Thank you, Ian Kaplan and Kathryn Ingerslew from Purdue University, who collaborated
with John and me on this project. Your input was invaluable. Thank you, Nancy Emery from the
University of Colorado, for providing details on the phylogenetic relatedness of my crops.
Maintaining two acres of crops and simultaneously collecting data was no small effort, so I also
want to thank Corey Dillon and Austin Kirt for helping me with farm management and advice,

xiv
and helping to sort out the logistics of food bank donations. Thank you, Dana Roberts, for
teaching me about common pests of cucurbit systems and how to scout for them. Thank you, Dee
Denver, (Dept. of Integrative Biology, Oregon State U.) for helping me to genetically analyze
nematodes. Thank you, Michelle Peiffer, for helping me produce PBS buffer solution and
supplying the ingredients.
I was new to the world of parasitoids and parasites, and Istvan Miko, Andy Deans,
Carolyn Trietsch, Jonah Ulmer all helped me in different ways to understand my system. Thank
you, Istvan, for teaching me how to dissect beetles and encouraging me to pursue my idea. My
second chapter wouldn’t exist without you. Thank you, Andy and Jonah, for showing me how to
identify and preserve larvae. Thank you, Carolyn, for answering all of my random questions,
helping me to photograph my specimens, and hosting craft nights. I was also unfamiliar with
nematodes and would like to thank Mary Barbercheck, Dee Denver, and Dana for helping me to
identify them. Also, thank you Michael Skvarla for confirming the identity of Maggie’s vouchers
and other insects. Although the greenhouse project wasn’t completed, thank you Brandon
Gominho for teaching me everything you knew about Manduca sexta rearing. Special thanks to
Shelly Whitehead and Carolyn Trietsh, whom I shared office space with. In addition to helping
me, you were also delightful company.
Lastly, I would like to thank my family and friends for your love and support during my
graduate experience and my life. I would like to thank my mother and father for taking care of me
with warmth and love, providing me an endless supply of delicious chocolate, and accepting my
infatuation with insects from a young age. I know you wanted a refined princess but got an
energetic, outdoorsy warrior instead, and am grateful you didn’t try too hard to change me. I also
thank my siblings, Michael, Samantha, and Andrew, for tolerating my outgoing nature throughout
the years and for being there when I needed you most. I thank my grandparents, Jean, Audrey,

xv
Joseph, and Michael, for their unconditional love and support from Heaven and Earth. Thank you
to my Penn State Korean Karate cohort for giving me an outlet to become stronger, grow in
confidence, and have fun. Thank you to my undergraduate professors at King’s College who
encouraged me to pursue a graduate degree, and to my friends who have kept in contact with me.
For funding my thesis, I thank the USDA.
1
Chapter 1
How phylogenetic relatedness affects the
abundance of insect community in intercrops
Introduction
Managing pests is one of the many challenges that farmers face. Herbivorous insects are
particularly problematic because they can colonize fields quickly, and in high enough populations
can inflict extensive crop damage, decreasing crop quality and/or yield. Because of threats posed
to crops by herbivorous insects, much of monoculture-based crop production tends to rely heavily
on regular, often prophylactic, insecticide applications (Pimentel et al. 1993, Casida and Quistad
1998, Oerke and Dehne 2004). Unfortunately, despite this preventative insecticide use, outbreaks
of herbivorous insect pests tend to be common in modern fields (Letourneau et al. 2011).
As an alternative to preventative insect management strategies that were popularized after
World War II, entomologists developed a pest management approach that integrated ecological
principles and chemical control (Smith et al. 1976). Integrated Pest Management (IPM) was
meant to help farmers move away from calendar-based insecticide applications and toward an
agroecological approach to combat economic damage from pest insects (Stern et al. 1959). As
originally envisioned, IPM uses multiple management approaches, including cultural and
biological tactics that prevent damage and foster control via natural enemies. Importantly, IPM
established insecticides as a final resort should other tactics fail to keep insect populations below
economic thresholds (Stern et al. 1959, Stenberg 2017). One of the principles emphasized in IPM
is that the ecology of plant-insect interactions should be explored to determine if they might

2
reveal novel management tactics (Stern et al. 1959, Kogan 1998). Planting a diversity of crop
species in a field, such as in a polyculture, is the type of practice that can exploit ecological
interactions to improve insect management. Well-designed polycultures can boost focal crop
yield while distracting herbivorous pests and improving biological control, both of which can
reduce herbivore damage (Lucas-Barbosa et al. 2011, Iverson et al. 2014, Isbell et al. 2017).
Generally speaking, most phytophagous insect species have evolved to only feed on a
limited number of closely related plant taxa (Bernays 1998), which often share similar chemistry
and, as a result, defenses (Erhlich and Raven 1964). Moreover, related plant species tend to have
similar appearances and release similar volatile organic compounds (VOC) as a by-product of
metabolism or defenses (Theis and Lerdau 2003). Having evolved specialized visual and
olfactory senses (Bruce 2015), phytophagous insects can detect these cues, such as the unique
VOC bouquet emitted by their host plant species and host plant shape or size (Dell'Aglio et al.
2016, Gadelha et al. 2017). Once detected, insects can track the cues to find a suitable host plant.
However, cue interference from plant diversity within polycultures can complicate host plant
location for herbivorous insects.
Within plant communities, interactions among plants influence insect communities.
Visual and chemical cues from different plants species can interfere with host-plant location by
herbivorous insect species (Zhang et al. 2016). In monocultures, high densities of host plant
species can attract large numbers of phytophagous insects (Barbosa 2009, Gardner et al. 2015).
According to the Resource-Concentration hypothesis, insect pests perform well in monocultures
because they easily locate an abundant host plant species and are not resource constrained
(Tahvanainen and Root 1973). In polycultures, however, the neighbors of a focal plant species
can reduce its apparency, making it more difficult for herbivorous insects to find and reducing
herbivore abundance (Price et al. 1980, Andow 1991). Specifically, insects foraging for their
host-plant species can be confused by chemical and structural complexity of polycultures (Finch

3
& Collier 2001, Randlkofer et al. 2010), masking host-plant location (Jactel et al. 2011,
Castagneyrol et al. 2014b). Intercropping, an approach to polycultures in which at least two
different crop species are grown together in a field, has been used by growers since ancient times
because it enhances plant performance and decreases herbivore densities by associational
resistance (Papendick et al. 1976, Bach 1980a., Vandermeer 1989, Hamback et al. 2000, Barbosa
et al. 2009, Boudreau 2013).
Associational resistance is an interaction between nearby plants in which the presence of
one plant species decreases the likelihood that its neighboring plant will be found by herbivorous
insects (Price et al. 1980, Barbosa et al. 2009). Associations among neighboring plant species
have been used to develop intercropping approaches that reduce pest damage on focal crops.
Intercropping methods such as trap cropping and push-pull systems function by either repelling
pest insects, attracting them to an alternative host, or increasing species diversity (Bach 1980b.,
Shelton and Badenes-Perez 2005, Gilbert and Webb 2007, Cavanagh et al. 2009, Cadoux et al.
2015, Khan et al. 2016). While many studies have explored the value of associational resistance
(Barbosa et al. 2009), no studies currently appear to have explored the roles of phylogenetic
relatedness for predicting its effects.
Phylogenetic diversity, or phylodiversity, describes the relatedness of species within a
community, and may positively or negatively affect plant success by altering pest populations
(Castillo et al. 2010). Quantifying phylodiversity between plant species using recent advances in
technology have helped address community ecology questions (Sanderson et al. 2004, Cavender-
Bares et al. 2009). Current studies show the potential effects of plant phylodiversity on plant-
insect interactions. For example, plant communities with greater phylogenetically diversity from
the perspective of an insect pollinator tend to be more pollen-limited than plant communities
comprising close relatives (Sargent et al. 2011). Another study proposed that phylogenetic
diversity decreased herbivory in an old field because some herbivores were phylogenetically

4
specialized (Dinnage 2013). However, I am not aware of any studies thus far that have addressed
phylodiversity in an agricultural context as a mechanism for associational resistance.
My research explores whether associational resistance generated between neighboring
crop species with known phylogenetic divergences can influence an agricultural insect
community. I hypothesized that as the evolutionary divergences of neighboring plant species
increased relative to a focal crop species, insect pest abundance would decrease. Moreover, I
expected that the influence of phylogenetic distance would have a neutral or positive effect on
other arthropod functional groups (predators, pollinators, parasitoids, detritivores) because these
groups of insects may not be as closely associated to plant-produced cues as herbivorous insects.
To experimentally explore the influence of phylogenetic distance on associational resistance to
insect communities, I used butternut squash (Cucurbita moschata) as a focal crop species and
surrounded it with rows of crops of different evolutionary divergence times relative to the
butternut squash.
Materials and methods
Location
I conducted my two-year summer field study at The Russell E. Larson Agricultural
Research Center at Rock Springs (Pennsylvania Furnace, PA). The field I used in 2017
(40.709296, -77.948777) was previously planted with wheat. Because excessive rains resulted in
standing water that persisted at one end of the field for the whole summer, in 2018 I relocated my
study to two adjoining fields on a different part of the farm (40.715318,-77.951797). These two
fields had previously been planted with a corn and soybean rotation.
5
Treatments and Design
I used phylogenetic information from collaborators at Purdue University to identify crops
with different divergence times (million years ago) from butternut squash (Cucurbita moschata),
the focal crop species (Figure 1-1), and then selected two crops from each phylogenetic
divergence time to use as treatments, except for crops within the Cucurbitaceae family (nine plant
species total; Figure 1-2). The divergence times and plant species were [Cucurbitaceae: Cucurbita
pepo (butternut squash), 0 mya; Cucurbita pepo (zucchini), 32 mya; Citrullus lanatus
(watermelon), 147 mya], [Fabaceae: Phaseolus vulgaris (common bean) and Glycine max
(soybean), 213.9 mya], [Solanaceae: Capsicum annuum (sweet pepper), 238.3 mya], [Asteraceae:
Helianthus annuus (sunflower), 238.3 mya], [Poaceae: Zea mays (sweet corn) and Avena sativa
(common oats), 376.5 mya] (Figure 1-1, 1-2). Most of these plant species were used in 2017 and
2018 with the exception of Fabaceae, which was excluded in 2018 to make the field experiment
more manageable. In addition to the treatments with different plant species, I also included a
“blank” treatment, which consisted of empty rows on either side of butternut squash, to test for
potential resource concentration effects. As a result, the total number of treatments in 2017 was
ten, whereas in 2018 it was eight.
In 2017, the experimental design was arranged within one field into 50 6.096 m plots,
each five rows wide (Figure 1-3). In each plot, I spaced the rows with 2.1336 m row centers with
3.048 m between plots. In the center (or 3rd) row of each plot, I planted the focal crop, butternut
squash. I used the four remaining rows (rows 1, 2, 4, and 5) for planting the treatment, which was
one of the nine plant species representing a divergence time (eight “other” plant species or
butternut squash planted as a monoculture) and one blank treatment in which only the center row
was planted with butternut squash and the surround four rows were empty (Figure 1-4). I
randomly assigned plot order with a block using a random number generator (Random.org), and

6
this procedure was repeated for each of the five blocks. The design was slightly different in 2018
to accommodate the other location. I used 40 plots which were spaced 1.524 m between rows and
6.096 m between plots across two fields (Figure 1-5). The study site was tilled with a moldboard
plough, and the five rows per plot were laid with black plastic covering planting rows, and
herbicides and mowing were used to control weeds between rows and plots. A single drip
irrigation line was laid in each row between the ground and black plastic. Butternut squash,
watermelon, zucchini, and peppers were planted as seedling plugs. Sunflower, sweet corn, and
oats were direct seeded.
Data Collection
I gathered data using scouting, sticky traps, pitfall traps, and dissections of beetles to find
parasites (further details below). I scouted every other week and other methods occurred monthly.
In response to weather conditions, I modified this schedule as necessary (Table 1-1). When
multiple collection methods occurred during the same week, destructive methods were done last
(sticky traps, pitfall traps, beetle collections). I collected data weekly from the center row
(butternut squash) of each plot. To account for edge effect, 0.6096 m on either end of the
butternut squash row in each plot were excluded from data collection. In 2017, due to
establishment challenges associated with a wet spring and early summer, I collected data from 8
August to 20 September. In 2018, I collected data from 21 June until 30 August 30. I had
difficulty managing weeds, groundhogs, and powdery mildew during our experiment and early
season data were muddy because of issues with plant establishment. Plots that either failed to
establish or those which died off (late season) were excluded from data collection and the
analysis.

7
Foliage Scouting for pest abundance
I scouted butternut squash foliage to assess pest abundances in the treatments. Scouting
occurred in the morning around 8:00 am. The center row of each plot was split into equal 1.61544
m subsections and labeled x, y, and z (Figure 1-6). I counted insects on the stems, leaves, and at
the base of butternut squash plants in a repeating rotation schedule where week A was subsection
x, week B was subsection y, and week C was subsection z. Week A followed week C to repeat
the rotation. Cucurbit pest species counted included striped cucumber beetles (Acalymma
vittatum; SCB), spotted cucumber beetles (Diabrotica undecimpunctata; SPCB), squash bugs
(Anasa tristis), and western corn rootworm (Diabrotica virgifera; WCR).
Flower Scouting for pest and pollinator abundance
I scouted butternut squash flowers to assess pollinators and pest abundances in the
treatments. Scouting occurred in the morning around 7:00 am. I counted insects in the morning
when flowers were open. In each plot, for every mature flower, I counted and sexed insects, and
recorded them as open (pollinator-available) or old. I counted cucurbit pest species including
striped cucumber beetles (A. vittatum) and spotted cucumber beetles (D. undecimpunctata).
Pollinator species counted included squash bees (Peponapis pruinose), bumble bees (Bombus
sp.), and honey bees (Apis mellifera).
Sticky Traps for aerial insect abundance
I used sticky traps to assess the aerial insect community. Using binder clips, I affixed a
15.24 x 20.32 cm double-sided yellow sticky card (Trapro, Dual-Sided Yellow Sticky Traps, TR-
YST-30) vertically to a (~50 cm long) thin bamboo stick and inserted one stick-card setup into

8
the center of each plot so the card was facing parallel to the rows. I adjusted the height of each
trap so the bottom of the sticky card was just above the plant canopy. After 72 h, I collected traps,
stored them in clear magazine bags (ULINE 2 mil 9 x 12 inch Industrial Poly Bags), and placed
them in a freezer for later insect identification. Beneficial insects (pollinators, predators, and
parasitoids) counted included feather legged flies (Tachinidae: Trichopoda pennipes), lady
beetles (Coccinellidae), hover flies (Syrphidae), long-legged flies (Dolichopodidae), and
parasitoids (Hymenoptera). I initially intended to include predaceous wasps (Vespidae), soldier
beetles (Cantharidae: Chauliognathus pensylvanicus), big eyed bugs (Lygaeidae: Geocoris sp),
and minute pirate bugs (Anthocoridae) but occurrences on the sticky traps were rare. I observed
feather legged flies (Tachinidae: Trichopoda pennipes; a squash bug parasitoid), and soldier
beetles (Cantharidae: Chauliognathus pensylvanicus), a cucumber beetle predator, in my plots but
rarely caught them on traps. I counted the following pest insect species: striped cucumber beetles
(A. vittatum), spotted cucumber beetles (D. undecimpunctata), aphids (Aphis sp.), tarnished plant
bugs (Lygus lineolaris), and thrips (Thysanoptera). For counting insects, I subdivided each sticky
trap into 8 equal rectangles (6.35 x 8.89 cm; 4 per side) with a marker. For each sticky card, I
randomly selected one rectangle from each side to use for aphid, parasitoid, and thrips density
counts. I then then multiplied these counts by four to estimate the densities for each of these
insect groups on the entire card. I counted all other insects on the entire card. Due to logistical
challenges, sticky trap data from 2017 is limited.
Pitfall Traps for epigeal arthropod activity density
I used pitfall traps to assess the epigeal arthropod community. I partially filled pitfall
traps (8 cm tall, 11.5 cm diameter Reynolds Del Pak) with 50% propylene glycol as a killing
agent and placed them in the center of each plot between row 2 and 3 in the soil (not under the

9
black plastic) so the tops of the traps were flush with the ground. To keep them protected from
rain and debris, I covered each trap with a plastic plate elevated by a tripod of nails (8.89 cm tall).
I collected traps after they were in the field for 72 hours. I then sorted, identified, and preserved
the invertebrates from the traps. I discarded non-epigeal arthropods such as lightning bugs, wasps,
and house flies, and micro-epigeal arthropods such as springtails and mites. Arthropods I counted
included carabid beetles (Carabidae), rove beetles (Staphylinidae), spiders (Araneae, dominated
by Lycosidae), harvestmen (Opiliones), millipedes (Diplopoda, dominated by Oxidus gracilis and
Julidae), centipedes (Chilopoda), and ants (Formicidae).
Dissections for parasitism rates
In 2018, I collected and dissected striped cucumber beetles to assess parasitism. Field
collections of the beetles were planned to occur shortly after scouting events because they were
potentially temporarily destructive to the pest population. In each plot, I tried to collect 10 beetles
from flowers and foliage by hand or with an insect vacuum. Beetles were kept alive in a
refrigerator or frozen until I dissected them under a microscope in PBS 1X solution. I performed
whole abdominal dissection by securing a beetle with forceps on the thorax (near the scutellum)
and using a second pair of forceps to remove the abdominal cuticle and reveal organs by pulling
at the pygidium (like taking a glove off; dissection method from Istvan Miko, pers.
communication). I sexed beetles and then removed and identified any parasites or parasitoids in
the abdomen. I preserved parasitic organisms and their beetle hosts on slides with glycerin and
later transferred them to 80% ethanol. I reserved several parasitoid insect larvae to rear into
adulthood for vouchers, but none successfully pupated. I therefore based identification of insect
larvae on findings from previous studies.

10
Damage and yield
I intended to assess plant damage and yield of butternut squash to gauge plant health, and
attempted to do so in both years. However, logistical challenges with establishment and high
mortality in young plants because of weather in both years resulted in plots with mixed ages as
plants were replaced, making them incomparable. Additionally, much of the observed cucurbit
damage in my plots occurred on zucchini plants more than butternut squash plants, which was a
treatment crop.
To assess early season feeding damage, I evaluated a subsection of each plot (same
rotation as described in foliage scouting for herbivore abundance). In each sub-plot, I counted the
number of fully developed leaves on plants and measured leaf surface area damage: total of each
leaf using a grid printed on a 21.59x27.94 cm transparency (template from incompetech.com).
The grid was made up of 1x1 cm major blocks subdivided by 0.2x0.2 cm blocks. When plants
began to vine, I also counted the number of new vines. Once nearly all plants were vining, I
planned to terminate early-season damage assessment.
To assess other threats to plant health, I also intended to evaluate pathogens and
additional insect pests. After scouting foliage, I examined the butternut squash plants for evidence
of bacterial wilt (pathogen Erwinia tracheiphila), powdery mildew (possible pathogens: Erysiphe
cichoracearum and Sphaerotheca fuliginea), as well as insects such as squash vine borer (Melittia
satyriniformis). Plants infected with bacterial wilt and dead plants were removed from the plots
and replaced with new plants. All removed plants that exhibited wilt symptoms were also
dissected at the main stem to check for squash vine borer larvae.
To assess yield, I was going to count the number of squash fruits produced by plants in
sub-plots and then finally count number of marketable squash after harvest by inspecting
harvested squash for pest-induced blemishes and disease.
11
Statistics
I used Minitab v.18 to perform all analyses. Data were modeled separately by date and
where applicable, dates were pooled for season cumulative models. For all models, α= 0.05. The
results of my “blank” treatment are not included in the analyses presented in my results.
In all linear regression and Poisson regression models, divergence time was a continuous
variable and block/replicate was a categorical variable. When block was not significant but
divergence was, block was dropped from the model. When a model contained multiple variables
(i.e. divergence time, block, and number of flowers per plot), R-squared (adj) was used. When
only divergence time was significant, R-squared was used. When a data set had a lot of zeros/low
values/rare taxa, and for dissection data, Poisson regression was used instead of linear regression.
For Poisson regressions, sometimes the model would only run when block was removed as a
variable. In 2017, most dates had to be pooled into cumulative models to run because taxa were
rare. Occasionally, taxa were too rare and Poisson models did not run. For all plotted linear
regression and Poisson lines, the trendline includes divergence time and the response variable
only.
Results
Foliage Scouting for pest abundance
In 2017, across all plots, squash bugs were the most abundant insect species I
encountered, followed by spotted cucumber beetles (SPCB) and striped cucumber beetles (SCB).
I found few insect herbivores on leaves and stems, and their abundances varied greatly among
divergence times (Table 1-2). Because of the rarity of herbivore insects on foliage, in most cases
12
only models with pooled data satisfied regression assumptions. Squash bug abundance decreased
as divergence time increased on August 30th (30-Aug, χ21 = 40.18, P = <0.0001, R-squared adj =
10.59%; Table 1-3; Figure 1-7). On the both the August 30th sampling date and cumulatively, the
abundance of all herbivores pooled (squash bugs, SCB, SPCB) sign decreased as divergence time
increased (30-Aug, χ25 = 87.11, P = <0.0001, R-squared adj = 33.65%; Cumulative, χ25 = 75.23,
P = <0.0001, R-squared adj = 19.55%; Table 1-3; Figure 1-8).
In 2018, striped cucumber beetles (SCB) were most abundant, followed by squash bugs,
western corn rootworm (WCR), and spotted cucumber beetle (SPCB) (Table 1-4). Insect
abundances in June and early July were not significantly affected by divergence time (Table 1-4).
Unexpectedly on July 19th, SCB abundance increased as divergence time increased (F1 = 4.69, P
= 0.038, R-squared = 12.79%; Figure 1-9). Later in the field season, a pattern emerged that was
consistent with my phylogenetic diversity-based hypothesis, and it appeared to be mostly driven
by SCB abundance, which decreased as divergence time increased on August 6th and August 28th
(6-Aug, F1 = 46.71, P = <0.0001, R-squared = 58.60%, 28-Aug; χ21 = 5.67, P = 0.017, R-squared
= 8.29%; Table 1-5; Figure 1-9). Abundance of all herbivorous insects responded negatively to
phylodiversity strongest on August 6th (F1 = 36.85, P = <0.0001, R-squared = 52.75%), followed
by August 28th (χ25 = 40.96, P = <0.0001, R-squared adj = 33.87%; Table 1-5; Figure 1-10).
Flower scouting for pest and pollinator abundance
In 2017, cucumber beetles (SCB, SPCB) in squash flowers were very low and their
abundances varied greatly among treatments (Table 1-6). Because of the rarity of herbivore
insects on foliage, in most cases only models with pooled data satisfied regression assumptions. I
only counted insects in flowers for August and September due to weather delaying crop
establishment. Cucumber beetle (SCB and SPCB) abundances responded to divergence time

13
overall (χ22 = 19.32, P = <0.0001), but the explained variation was weak (5.14%) and the slope of
the regression line appeared negligible (Table 1-3; Figure 1-11). Bees (squash bees, bumble bees,
honey bees) were especially rare and failed regression assumptions (Table 1-6).
In 2018, beetle abundance (SCB, SPCB, and WCR) in flowers responded negatively to
phylodiversity on August 6th (χ26 = 46.32, P = <0.0001, R-squared adj = 43.34%; Table 1-5).
Although also cumulatively significant, (χ26 = 191.53, P = <0.0001, R-squared adj = 43.50%;
Table 1-5; Table 1-7; Figure 1-12), the majority of the variation was explained by number of
flowers per plot and the slope of the regression line for divergence time appeared negligible. The
number of flowers in the center row of butternut squash per plot was a stronger predictor of beetle
abundance than divergence time on most dates (Table 1-5). Bee abundance was low (Table 1-7).
Most (64.52%) of the variation was explained by the number of flowers in the center row of
butternut squash per plot, block replicate, and date (χ28 = 207.78, P <0.0001) and I did not detect
a significant effect of divergence time on bee abundance (Table 1-5).
Sticky Traps for abundance
In 2017, from my only bout of sampling with sticky traps, divergence time did not
significantly influence abundance of natural enemies (lady beetle, long-legged fly, parasitoid
wasp) or herbivorous insects (SCB, SPCB, tarnished plant bug, thrips) (Table 1-8; Table 1-9).
Among the natural enemies, parasitoid wasps had the highest average abundance (Table 1-8).
Among the herbivores, thrips were most abundant (Table 1-9).
In 2018, divergence time did not appear to influence abundance of natural enemies on
sticky cards (Table 1-8). The long-legged fly was the only natural enemy that significantly
responded to divergence time on one date, August 30th (F1 = 3.24, P = 0.088, R-squared =
14.55%; Table 1-5; Figure 1-13), and its abundance unexpectedly decreased as divergence time
14
increased. Parasitic wasps were most abundant, followed by lady beetles, hover flies, and long-
legged flies (Table 1-8). Herbivorous insects did respond to divergence time. SCB abundance
decreased as divergence time increased on June 28th (F1 = 16.94, P = <0.0001, R-squared =
33.93%) and August 30th (F1 = 7.10, P = 0.015, R-squared = 27.20%; Table 1-5; Figure 1-14).
Only thrips responded to divergence time on August 7th (F1 = 6.80, P = 0.014, R-squared =
17.0%; Table 1-5; Figure 1-15), but the standard error was variable and they appeared to weakly
decrease as divergence time increased. On August 30th, SPCB (χ21 = 3.45, P = 0.063, R-squared =
9.55%) abundance weakly increased as divergence time increased (Table 1-5; Figure 1-16), and
tarnished plant bug (F1 = 7.40, P = 0.014, R-squared = 28.03%) abundance decreased as
divergence time increased (Table 1-5; Figure 1-16). Pooled together, the abundance for all
herbivorous insects pooled together decreased as divergence time increased. (F1 = 4.3, P =
0.041), but the explained variance was weak and standard error was high (R-squared = 4.61%;
Figure 1-17). Thrips were the most abundant herbivores, followed by SCB, tarnished plant bugs,
and SPCB (Table 1-9).
Pitfall traps for epigeal arthropod activity density
In 2017, divergence time did not significantly influence epigeal activity density for any
groups of epigeal arthropods (Coleoptera, Arachnida, Myriapoda, and ants; Table 1-11).
In 2018, epigeal activity density occasionally responded to divergence time. Because of
the rarity of some taxa, in some cases only models with pooled data satisfied regression
assumptions (Table 1-11). All arthropod groups except ants responded to divergence time on June
28th (Coleoptera: χ21 = 3.72, P = 0.054, R-squared = 8.24%; Arachnida: F1 = 8.01, P = 0.008, R-
squared = 19.54%; Myriapoda: χ21 = 4.95, P = 0.026, R-squared = 8.27%; Table 1-5; Figure 1-
18), but some of the explained variation was weak. Arachnida activity density decreased as
15
divergence time increased, and Coleoptera and Myriapoda activity density weakly increased as
divergence time increased. Both Coleoptera (χ21 = 4.16, P = 0.042, R-squared = 9.01%) and
Myriapoda (χ21 = 36.31, P = 0.007, R-squared = 30.77%) activity density decreased as
divergence time increased, although Coleoptera had a weak response to divergence time on July
30th (Table 1-5; Figure 1-19). Cumulative Arachnida activity density decreased as divergence
time increased, but with variable standard error (F1 = 6.56, P = 0.012, R-squared = 6.12%; Table
1-5; Figure 1-20).
Dissections for parasitism rates (2018 only)
The most abundant taxa found from SCB dissections included a tachinid fly (Celatoria
setosa), a braconid wasp (Centistes diabroticae), and a nematode (possibly Howardula benigna;
Table 1-12), and nematodes were the most abundant. Tachinid larvae negatively associated with
divergence time on all three collection dates (July 10th: χ21 = 3.68, P = 0.055, R-squared = 8.26%;
August 7th: χ25 = 12.58, P = 0.028, R-squared adj = 14.19%; August 30th: χ21 = 3.75, P = 0.053,
R-squared = 11.11%; Figure 2-8). Similarly, Braconid larvae and egg abundance decreased in
response to divergence time on July 10th (larvae: χ21 = 11.40, P = 0.001, R-squared = 17.04%;
eggs: χ21 = 9.25, P = 0.002, R-squared = 20.11%; Figure 2-9) and August 7th (larvae: χ25 = 24.50,
P = <0.0001, R-squared = 31.05%; eggs: χ21 = 3.39, P = 0.066, R-squared = 7.42%; Figure 2-9),
and displayed a stronger response than tachinid larvae. Nematode abundance had no association
with divergence time.

16
Discussion
Within a vegetable intercropping system, I evaluated the effects of phylogenetic-
based plant diversity in space (i.e., the relatedness of neighboring plant species) on the arthropod
community of butternut squash. I found that plant phylogenetic diversity was an occasional
predictor of herbivorous insect abundance in my focal crop, butternut squash. Phylodiversity,
therefore, appears to have played an inconsistent role in my experiments structuring herbivorous
insect communities, and is likely to have influenced the apparency of neighboring plants, which is
derived from interactions of their chemical and visual cues. In a similar experiment exploring
diversity in time (i.e., crop rotations; I explored diversity in space, i.e., intercropping)
phylogenetic relatedness of plant species in a rotation were not predictive of rotational effects on
a specific herbivorous insect. In a crop rotation, however, any effect of the preceding crop species
on herbivores of the following crop species would have to be expressed via legacy effects on soil
(Ingerslew and Kaplan 2018), rather than the mixing of cues that were operating in my field
experiments.
Plant communities produce an impressive assortment of cues, mainly volatile organic
compounds and visual characteristics (size, color, and structure), that change throughout the
season as plants develop and reproduce (Theis and Lerdau 2003, Christensen et al. 2012, Kuper
2013, Najar-Rodriguez et al. 2013, Ishizaki et al. 2016, Pickett and Khan 2016). As phylogenetic
relatedness between neighboring plants increases, their cues are less likely to be similar (Theis
and Lerdau 2003) and the resulting blend of cues is expected to reduce apparency of host plant
species to their herbivorous insects (Andow 1991). In my experiment, I expected that as the
relatedness of the plant neighbors of butternut squash became more distant the apparency of
butternut squash would decline, reducing herbivorous insect abundance. This phenomenon has

17
been observed in natural systems, such as the case where herbivory by the pine processionary
moth was reduced by volatile cues from deciduous non-host tree (Jactel et al. 2011, Castagneyrol
et al. 2014). I found some evidence that increasing phylodiversity reduced mid- to late-season
herbivore abundance on butternut squash, but the effect was inconsistent and variable. For
example, in 2018 striped cucumber beetle abundance decreased with increasing divergence time
in late June and throughout August; Figure 1-9, 1-14). Similarly, a Canadian study that
investigated how genetic relatedness of native plant communities affected the herbivory on
invasive plants found that more phylogenetically isolated invasive plants had less herbivory, and
the phylogenetic relationship between the native and invasive plant species was variable and only
occurred later in the growing season (Hill and Kotanen 2009). A future experiment would help
clarify potential mechanisms behind plant apparency and phylogenetic relatedness of neighboring
plants by testing how prevalent agricultural herbivores respond to quantified visual cues (such as
structure and color) and chemical cues (such as volatile bouquets emitting from intercrops).
Importantly, phylogenetic diversity appeared to increase herbivore abundance in mid-July (Figure
1-9), suggesting that other factors were also influencing the herbivore populations on butternut
squash.
When co-occurring in space and time, closely related plant species are likely to attract
similar herbivores, potentially stressing plants and negatively influencing growth and yield
(Cheplick and Kane 2004, Barbosa et al. 2009, Burns and Strauss 2011, Catola et al. 2018). I
predicted that increasing phylodiversity between neighboring plants in a plot would decrease
herbivorous insect abundance; however, my results did not consistently agree with this
hypothesis. Instead, differences in abundance sometimes appeared variable. Other factors, such as
host-plant specialization, insect life cycles, or plant composition, likely influenced plant-insect
interactions and may have overshadowed the influence of phylogenetic diversity. In other
systems, such as forest polycultures, variable reductions in herbivory appeared to depend on plant
18
species relatedness and herbivore specialization, where specialists were sensitive to host
abundance but generalists responded to phylodiversity of neighboring trees. Despite these
differences, highly divergent mixtures generally had the least herbivore damage (Castagneyrol et
all. 2014). In my vegetable polycultures, which were notably less complex than forest
polycultures, I considered striped cucumber beetles and squash bugs as cucurbit specialists, but
spotted cucumber beetles, thrips, and tarnished plant bugs as generalists (Wadley 1920, Bach
1980b., Metcalf et al. 1998, Capinera 2001, Skinner et al. 2014, Gardner et al. 2015). Contrary to
the results with forest polycultures (Castagneyrol et all. 2014), the generalist and specialist
herbivore species on butternut squash responded similarly to treatments. Despite their feeding
specializations, in both 2017 and 2018 herbivores were generally negatively associated with
divergence from butternut squash (Table 1-3, Table 1-5). Notably, striped cucumber beetle was
the most abundant specialist herbivore I encountered, and was also more associated with
divergence time than any of the other herbivores (Figure 1-9, Figure 1-14). Accordingly, while
both generalist and specialist herbivorous insects appear to decrease in abundance in response to
the phylodiversity of plant neighbors in a cropping system, dominant specialists might be most
affected. This effect likely varies by species and ecosystem, as forest specialist herbivores did not
respond to phylodiversity (Castagneyrol et all. 2014).
Like feeding specialization, insect life cycles are quite variable by species and location,
affecting their relative abundance and behavior. Striped cucumber beetle, for example,
overwinters as an adult, which becomes active in May, and then has one new generation per
summer in Pennsylvania that emerges in the late summer and overwinters (Shelby Fleischer,
Dept. of Entomology, PSU. pers comm). The squash bug, on the other hand, has at least one
generation per summer that emerges beginning in June (depending on weather), continuously lays
eggs throughout the summer, and local populations have differing host-plant preferences
(Nechols 1987, Decker and Yeargan 2008, Doughty et al. 2016). Abundances for both striped
19
cucumber beetles and squash bugs aligned with their expected phenology, but their abundances
also decreased in response to increasing phylodiversity in plots on some dates (Figure 1-3, 1-5).
In 2018, I observed a peak in abundance of striped cucumber beetle on butternut squash in the
first weeks of July and August. Squash bug abundances remained consistent throughout most of
the season (Table 1-4, Table 1-9). The first and second peaks in striped cucumber beetle
abundance were likely caused by colonization from the overwintering generation and emergence
of the new generation. Based on this evidence, the emerging generation may have responded to
phylogenetic differences between treatments more than the overwintered generation. Similarly, in
a trapping experiment with cucumber beetles, the emerging generation of beetles was more
responsive to chemicals emitted from a lure (floral volatiles plus live beetles) than the
overwintered generation (Christie Shee, Dept. of Entomology, Purdue. pers comm.)
In addition to behaviors and life cycles of insects influencing outcomes of my
experiment, the structure and life cycles of plants may have also played a role. Divergence times
were represented by multiple species, and I cannot discount the possibly that species effects
occurred in my experiment, although they were not directly tested. I observed that abundances of
herbivorous insects shifted among crop treatments differently across dates, especially among non-
cucurbit crops (Table 1-10; Figure 1-21) and suspect these shifts in abundance could be related to
plant structure and growth or resource availability. For example, based on phylogeny alone
(Figure 1-1, 1-2), I expected that abundance of herbivorous insects in sunflower intercrops would
be lower than abundance in cucurbit intercrops, and my observations confirmed this expectation.
However, monocultures of butternut squash did not always host the highest abundance of
herbivorous insects. Moreover, squash surrounded by sunflower often had fewer herbivores than
squash neighbored by corn or oat, contrary to my phylogenetic-relatedness hypothesis. Although
not statistically significant, among all my crop species sunflower had the lowest average
abundance of herbivorous insects and cucurbits had the highest (Table 1-10, Figure 1-21).
20
Sunflower, as the tallest crop species in my experiments, may have formed a vegetative barrier
around butternut squash that physically interfered with host-finding by insects. Because
herbivorous insects prefer to land on any green objects rather than soil, they are more likely to
incorrectly land on large plant neighbors (i.e. more vegetative structure) than small plant
neighbors near a host plant (Randlkofer et al. 2010) and often have preferences among the host
plants they will attack (McGrath 2004, Hazzard et al. 2009). Despite both being 238 million years
diverged from butternut squash, my pepper variety was small to medium-sized and bushy, but my
sunflower variety was extra-large and tall. In both years, the cumulative average of herbivorous
insects was higher in pepper plots than sunflower plots (Table 1-10). Because sunflower had
more vegetative structure than pepper, it is possible that more herbivorous insects landed on
sunflower. Additionally, sunflowers, which are genetically distant from many vegetable crops,
are known to improve insect control and boost natural enemy diversity and abundance (Rogers
1992, Tschumi et al. 2016). In an organic sunflower-vegetable intercrop, for example, sunflowers
attracted beneficial insects from 30 different families, such as big-eyed bugs, honeybees, spiders,
ants, lady beetles, assassin bugs, solider beetles, and parasitic wasps, that spilled over to adjacent
neighboring crops (Jones and Gillett 2005). In an agroecosystem, sunflower might be a good
intercrop neighbor for many vegetable species because large sunflower varieties have a lot of
vegetative structure, sunflower is phylogenetically distant from many crops, and it provides
resources for beneficial insects. This concept deserves attention for future research.
Successfully managing insects in a field is one of a grower’s main challenges. Not only
do herbivorous insects cause direct damage to crops by feeding, but many also carry pathogens.
In my system, increasing phylodiversity of neighboring plants sometimes reduced herbivore
abundance, but I was unable to measure pathogen abundance or disease. Increasing diversity in a
field can reduce instances of disease. In a three-year field trial to control aphid-transmitted
disease, pumpkin was intercropped with either sorghum or soybean and peanut; both intercrops
21
significantly reduced disease in pumpkin, and sorghum was most effective with 43-96%
reductions (Damicone et al. 2007). In another aphid-management study, compared to bare ground
buckwheat intercropped with zucchini reduced aphid densities and disease (Razze et al. 2016).
The phylodiversity of intercrops might play a role in reducing pest-mediated pathogens, but there
is likely to be a lot of variability among the insect vectors and pathogens involved. Several of the
insect species I encountered in my plots can transmit pathogens, including viruses and bacteria, to
cucurbits. For example, the most abundant herbivore specialist in my experiment, striped
cucumber beetle, is a casual vector of the pathogen Erwinia tracheiphila, which causes bacterial
wilt. Occurrence of bacterial wilt in cucurbits depends upon cucumber beetle density (Yao et al.
1996), and plants can become diseased when infected beetle frass comes in contact with wounded
foliage or flowers (Sasu et al. 2010). In my experiment, abundance of striped cucumber beetle
was sometimes negatively associated with phylodiversity, especially by mid-July both on
butternut squash foliage and in the aerial space above the squash canopy. I did not, however,
observe differences in beetle abundance in squash flowers. Striped cucumber beetles are attracted
to squash flower fragrance (Andrews et al. 2007, Theis and Adler 2012), and it appears they were
able to follow floral cues despite potentially disruptive cues from my divergent crop mixtures.
Because of the disparity between beetle abundances on foliage and in flowers, it is difficult to
predict how phylodiversity may have influenced the occurrence of bacterial wilt in my
experiment.
My experiment and other studies show that intercropping can reduce herbivore
abundance, but my design did not account for grower feasibility. Intercrops are often used in low-
input agroecosystems, but they can be labor-intensive and are not always compatible with
mechanization. Low-input agriculture relies on sustainable practices like IPM to manage crops,
and limits the use of high-inputs, such as fertilizers and pesticides. Low-input agroecosystems are
regularly used by resource-constrained smallholder farms (Pimentel et al. 1989, Brooker et al.

22
2014). Because intercrops are often not compatible with mechanization, they instead rely on
manual labor, which can be costly (Feike et al., 2012). For an intercrop to be economically
feasible, it needs to be profitable compared to a typical monoculture system (Waddington et al
2007, Bhatti et al. 2013). Using phylogenetic relatedness and considering plant structure as
methods for choosing plant neighbors in intercrops might benefit farmers, but more research is
needed to understand labor input and economic impact of different vegetable intercrops. A first-
step toward phylogenetically minded intercropping is to evaluate established mixtures, and then
proceed toward novel mixture development if necessary. Some crop mixtures are already
commonly used in forage production, such as maize and sorghum or maize and legumes. Maize
and sorghum diverged about 5 million ago whereas maize and legumes diverged about 377
million years ago. Comparing them phylogenetically, maize and legumes are more divergent, so I
would hypothesize this mixture should theoretically have few herbivorous insect pests. However,
because phylodiversity is not the only force active in agroecosystems, formulated mixtures should
also account for other interactions such as plant competition. For example, a study using
buckwheat as a living fertilizer intercropped with zucchini (about 238 million years diverged) to
manage aphids and whiteflies found no yield differences between some intercrop arrangements
(1.06 m spaced rows, Figure A-2) and monocultures, but intercrops did reduce herbivore densities
and disease and increased abundance of natural enemies. These results suggested that
appropriately spaced intercrops can minimize plant-plant competition, while still experiencing
benefits from the mixture and possibly increase yield (Razze et al. 2016).
Intercropping can decrease herbivore abundance, but responses from other insect
groups (e.g., predators and pollinators) are less predictable (Latheef et al. 1984, Kromp 1999,
Hinds and Hooks 2013, Gontijo et al. 2018). For example, intercropping reduced oviposition and
abundance of the carrot rust fly (Psila rosae), but had no effect on predator abundance (Rämert
and Ekbom 1996). Over the two years of my study, I rarely detected signals of pollinators,
23
predators, parasitoids, or decomposers being significantly influenced by the relatedness of
neighboring crops, with some exceptions. For example, I found that abundances of tachinid
larvae, braconid larvae, and braconid eggs had a negative association with divergence time
(Figure 2-8, 2-9). Because parasitoids actively search for host insects, I suspect these were effects
were related to host abundance (i.e. the negative relationship between striped cucumber beetles
and increasing phylodiversity), rather than direct effects. Unlike parasitoids, nematodes did not
respond. Nematode behavior is likely density-independent of plot treatments as they are
distributed in the soil and wait for available hosts.
I also found several associations between abundance and phylodiversity among
arthropods of the epigeal community. Arachnida (mainly spiders) activity density was negatively
associated with divergence time (Figure 1-18; Figure 1-20). Rather than directly responding to
phylodiversity, however, I suspect arachnids may have instead reacted to plant structure or
ground cover. Arachnid communities and their dispersal are known to differ by vegetative cover
and plant structure (Samu et al. 1999, Lyons et al. 2018). The closest divergence times were
represented by cucurbits, vining plants with large, broad leaves that shade soil and provide near-
ground structure. In contrast, the most distant divergence time included grasses, which grow
vertically and provide little ground cover. In 2018, other arthropods of the epigeal community,
Coleoptera and Myriapoda, were positively associated with phylodiversity in late June (Figure 1-
18), but negatively associated with it in late July (Figure 1-19). Phylodiversity never explained
more than 9% of Coleoptera activity density, but explained up to 31% of Myriapoda activity
density. Like Arachnida, perhaps Myriapoda responded to ground cover and structure rather than
plant relatedness. In general, I do not surmise these significant associations between the epigeal
community and phylodiversity were due to direct interactions like the herbivorous insects.
I must acknowledge there were several study limitations which could have influenced the
arthropod and plant communities in my experiments and obscured phylodiversity effects.

24
Persistent precipitation in 2017 and 2018 and associated flooding led to many logistical
challenges, such as delayed planting times, weed management, and outbreaks of powdery
mildew. I was only able to collect late-season data in 2017. Part of my field was permanently
flooded for the entire season and a larger portion was at least ephemerally flooded following
precipitation events. My field was so wet that frogs and toads completed metamorphosis and a
great blue heron occasionally came for a visit. When newly emerged anurans invaded my
research plots, they could have been influencing arthropod populations. Prior to 2017, this field
did not have flooding problems of this scale, and in 2018 the permanently flooded portion was
discontinued for use. Flooding is known to influence arthropods. For example, a specialist
pollinator of butternut squash, the squash bee Peponapis pruinose, often nest in the ground by
cucurbit plants in agricultural fields and soil disturbances negatively affect their populations
(Ullman et al. 2016). The excessively wet field in 2017 may have reduced nesting sites. Bumble
bees, the most abundant pollinators in 2017, are generalists that visit squash flowers but do not
depend on them (Nagamitsu et al. 2012), and therefore were presumably less affected by the
flooded field conditions. I was able to collect data throughout the season in 2018 at my new
location, but not as frequently as planned. Despite powdery mildew’s preference for warm and
dry conditions, a major disease outbreak resulted in early termination of data collection in
August.
I originally planned to assess plant damage in my plots by measuring insect leaf and
squash damage, and occurrence of bacterial wilt and powdery mildew. However, several
logistical challenges stifled my efforts in both years. After a failed polyculture trial with
cucumber as my focal crop, I was forewarned that bacterial wilt was very common at Rock
Springs (Beth K. Gugino, Penn State Dept. of Plant Pathology and Microbiology, pers. Comm.),
and instead chose butternut squash as my focal crop because of its known resistance to bacterial
wilt (McGrath 2004). Although my focal crop was resistant to bacterial wilt, my zucchini

25
treatment crop was not. Zucchini experienced high mortality from bacterial wilt in both 2017 and
2018, so I had to maintain those plots by replacing dead zucchini plants weekly. In addition to
bacterial wilt being problematic for zucchini in 2017 and 2018, squash vine borers (Melittia
cucurbitae) were also a major cause of mortality in 2017 zucchini only. I also had difficulty with
plant establishment that left me with butternut squash plants of various ages, making damage and
yield non-comparable. Finally, excessive wetness from rains caused fast field-wide outbreaks of
powdery mildew which made it unmeasurable.
The black plastic in my plots could have been a confounding factor. When sections of
black plastic showed signs of wear in August in 2018, I observed a density of squash bugs and
some cucumber beetles (both species) taking refuge under it. Based on this observation, my
counts of adult herbivore insects (especially of squash bugs) on foliage and flowers were likely
lower than the actual populations in my plots. Squash bugs are known to aggregate and hide
under black plastic and in other crevices during the day (Doughty et al. 2016). However, most
eggs are also laid on plants during the day (Wadley 1920). Because squash bugs can be elusive,
counting squash bug egg masses on plants might be an alternative solution to scouting adults. The
eggs could also be collected and housed in petri dishes to test for egg parasitoid emergence
(Wilson et al. 2017), although my results from parasitoid abundance on sticky traps and
parasitoids in striped cucumber beetle abdomens suggest there probably wouldn’t have been
differences in squash bug egg parasitoid emergence in my study (Table 1-7, 1-9). Alternatively,
black plastic could be removed completely, but this may lead to greater weed pressure in the plots
which was already an issue even with the plastic. Sections of moveable weed barriers adjacent to
focal plants to count squash bugs hiding underneath might work. Squash bugs are known to hide
under plywood boards in fields (Doughty 2016), but this idea needs to be tested for its efficacy as
a way quantify squash bugs.
26
My experimental scale could have also been a confounding factor. Mobile insects will
adjust foraging in response to resource availability and crowding (Mazzi and Dorn 2012), and
insect size and mobility influences insect community diversity (Olff and Ritchie 2002). Because
my treatment plots were small, highly mobile species may have appeared unresponsive to crop
relatedness. For example, carabid beetles are highly mobile (Jopp and Reuter 2009, Zoltan et al.
2014) and will respond to intercrops and vegetative structure (Hummel et al. 2012). Although I
found significant differences on some dates in carabid activity density between treatments, the
explained variation was low (Figure 1-18; Figure 1-19).
Conclusion
My findings demonstrate that increasing the phylogenetic divergence between
neighboring plants can reduce pest abundance but did not directly affect other insect functional
groups (predators, parasitoids, pollinators, detritivores). Evidence supporting my evolutionary
divergence hypothesis was mainly found in 2018, and low abundances and insect response in
2017 may be attributed to poor field conditions. Further studies are needed to more
comprehensively test this hypothesis at other locations and a larger scale. Additional experiments
should help clarify specific mechanisms that could have influenced my results, such as plant
volatile organic compounds.
Using phylogenetics to design intercropped vegetable systems may help ecologically
minded growers to better manage pest populations in their fields. However, it will be important to
continue working on understanding the effects of crop relatedness at larger scales, plant-plant
interactions, insect life cycles, and considering feasibility for the grower.
27
References
Andow, D. A. 1991. Vegetational Diversity and Arthropod Population Response. Annu. Rev. Entomol.
36: 561–586.
Andrews, E. S., N. Theis, and L. S. Adler. 2007. Pollinator and Herbivore Attraction to Cucurbita
Floral Volatiles. Journal of Chemical Ecology. 33: 1682–1691.
Bach, C. E. 1980a. Effects of Plant Diversity and Time of Colonization on an Herbivore-Plant
Interaction. Oecologia. 44: 319–326.
Bach, C. E. 1980b. Effects of Plant Density and Diversity on the Population Dynamics of a Specialist
Herbivore, the Striped Cucumber Beetle, Acalymma Vittata (Fab). Ecology. 61: 1515–1530.
Balduf, W. V. 1925. The striped cucumber beetle (Diabrotica vittata)its biology; Bulletin of the Ohio
Agricultural experiment station no. 388.
Barbosa, P., J. Hines, I. Kaplan, H. Martinson, A. Szczepaniec, and Z. Szendrei. 2009.
Associational Resistance and Associational Susceptibility: Having Right or Wrong Neighbors.
Annual Review of Ecology, Evolution, and Systematics. 40: 1–20.
Barros-Rios, J., R. A. Malvar, H.-J. G. Jung, and R. Santiago. 2011. Cell wall composition as a
maize defense mechanism against corn borers. Phytochemistry. 72: 365–371.
Bernays, E. A. 1998. Evolution of Feeding Behavior in Insect Herbivores: Success seen as different
ways to eat without being eaten. BioScience. 48: 35–44.
Bhatti, I. H., R. Ahmad, A. Jabbar, M. Nadeem, M. M. Khan, Wasi-ud-Din, and S. N. Vains.
2013. Agronomic performance of mash bean as an intercrop in sesame under different planting
patterns. Emirates Journal of Food and Agriculture. 25: 52–57.
Boudreau, M. A. 2013. Diseases in Intercropping Systems. Annu. Rev. Phytopathol. 51: 499–519.
Brooker, R. W., A. E. Bennett, W.-F. Cong, T. J. Daniell, T. S. George, P. D. Hallett, C. Hawes,
P. P. M. Iannetta, H. G. Jones, A. J. Karley, L. Li, B. M. McKenzie, R. J. Pakeman, E.

28
Paterson, C. Schöb, J. Shen, G. Squire, C. A. Watson, C. Zhang, F. Zhang, J. Zhang, and P.
J. White. 2015. Improving intercropping: a synthesis of research in agronomy, plant physiology
and ecology. New Phytologist. 206: 107–117.
Bruce, T. J. A. 2015. Interplay between insects and plants: dynamic and complex interactions that
have coevolved over millions of years but act in milliseconds. Journal of Experimental Botany.
66: 455–465.
Burns, J. H., and S. Y. Strauss. 2011. More closely related species are more ecologically similar in
an experimental test. Proc Natl Acad Sci USA. 108: 5302.
Cadoux, S., G. Sauzet, M. Valantin-Morison, C. Pontet, L. Champolivier, C. Robert, J. Lieven, F.
Flénet, O. Mangenot, P. Fauvin, and N. Landé. 2015. Intercropping frost-sensitive legume
crops with winter oilseed rape reduces weed competition, insect damage, and improves nitrogen
use efficiency. OCL. 22.
John Capinera. 2001. Handbook of Vegetable Pests, 1st ed. Academic Press.
Casida, J. E., and G. B. Quistad. 1998. Golden Age of Insecticide Research: Past, Present, or Future?
Annu. Rev. Entomol. 43: 1–16.
Castagneyrol, B., H. Jactel, C. Vacher, E. G. Brockerhoff, and J. Koricheva. 2014a. Effects of
plant phylogenetic diversity on herbivory depend on herbivore specialization. Journal of Applied
Ecology. 51: 134–141.
Castagneyrol, B., M. Régolini, and H. Jactel. 2014b. Tree species composition rather than diversity
triggers associational resistance to the pine processionary moth. Basic and Applied Ecology. 15:
516–523.
Castillo, J. P., M. Verdú, and A. Valiente-Banuet. 2010. Neighborhood phylodiversity affects plant
performance. Ecology. 91: 3656–3663.
Catola, S., M. Centritto, P. Cascone, A. Ranieri, F. Loreto, L. Calamai, R. Balestrini, and E.
Guerrieri. 2018. Effects of single or combined water deficit and aphid attack on tomato volatile

29
organic compound (VOC) emission and plant-plant communication. Environmental and
Experimental Botany. 153: 54–62.
Cavanagh, A., R. Hazzard, L. S. Adler, and J. Boucher. 2009. Using Trap Crops for Control of
Acalymma vittatum (Coleoptera: Chrysomelidae) Reduces Insecticide Use in Butternut Squash.
Journal of Economic Entomology. 102: 1101–1107.
Cavender-Bares, J., K. H. Kozak, P. V. A. Fine, and S. W. Kembel. 2009. The merging of
community ecology and phylogenetic biology. Ecology Letters. 12: 693–715.
Cheplick, G. P., and K. H. Kane. 2004. Genetic Relatedness and Competition in Triplasis purpurea
(Poaceae): Resource Partitioning or Kin Selection? International Journal of Plant Sciences. 165:
623–630.
Christensen, S. A., A. Nemchenko, E. Borrego, I. Murray, I. S. Sobhy, L. Bosak, S. DeBlasio, M.
Erb, C. A. M. Robert, K. A. Vaughn, C. Herrfurth, J. Tumlinson, I. Feussner, D. Jackson,
T. C. J. Turlings, J. Engelberth, C. Nansen, R. Meeley, and M. V. Kolomiets. 2012. The
maize lipoxygenase, ZmLOX10, mediates green leaf volatile, jasmonate and herbivore-induced
plant volatile production for defense against insect attack. The Plant Journal. 74: 59–73.
Damicone, J. P., J. V. Edelson, J. L. Sherwood, L. D. Myers, and J. E. Motes. 2007. Effects of
Border Crops and Intercrops on Control of Cucurbit Virus Diseases. Plant Disease. 91: 509–516.
Decker, K. B., and K. V. Yeargan. 2008. Seasonal Phenology and Natural Enemies of the Squash
Bug (Hemiptera: Coreidae) in Kentucky. Environmental Entomology. 37: 670–678.
Dell’Aglio, D. D., M. E. Losada, and C. D. Jiggins. 2016. Butterfly Learning and the Diversification
of Plant Leaf Shape. Frontiers in Ecology and Evolution.
Dinnage, R. 2013. Phylogenetic diversity of plants alters the effect of species richness on invertebrate
herbivory. PeerJ. 1.

30
Dosdall, L. M., J. D. Hummel, G. W. Clayton, J. T. O’Donovan, and K. N. Harker. 2012. Ground
Beetle (Coleoptera: Carabidae) Diversity, Activity Density, and Community Structure in a
Diversified Agroecosystem. Environmental Entomology. 41: 72–80.
Ehrlich, P. R., and P. H. Raven. 1964. Butterflies and plants: A study in coevolution. Evolution. 18:
586–608.
Feike, T., R. Doluschitz, Q. Chen, S. Graeff-Hönninger, and W. Claupein. 2012. How to
Overcome the Slow Death of Intercropping in the North China Plain. Sustainability. 4.
Finch, S., and R. H. Collier. 2001. Host plant finding by insects - undersowing crop plants with
clover reveals the missing link. In The Management of Diamondback Moth and Other Crucifer
Pests. Presented at the Proceedings of the Fourth International Workshop, Melbourne, Australia.
Gadelha, Y. E. A., D. Lange, W. Dáttilo, And B. C. Lopes. 2017. Phenological phases of the host
plant shape plant–treehopper interaction networks. Ecological Entomology. 42: 827–837.
Gardner, J., M. P. Hoffmann, and M. Mazourek. 2015. Striped Cucumber Beetle (Coleoptera:
Chrysomelidae) Aggregation in Response to Cultivar and Flowering. Environmental Entomology.
44: 309–317.
Gilbert, G. S., and C. O. Webb. 2007. Phylogenetic signal in plant pathogen–host range. Proc Natl
Acad Sci USA. 104: 4979.
Gontijo, L. M., A. V. Saldanha, D. R. Souza, R. S. Viana, B. C. Bordin, and A. C. Antonio. 2018.
Intercropping hampers the nocturnal biological control of aphids. Annals of Applied Biology.
172: 148–159.
Hambäck, P., J. Agren, and L. Ericson. 2000. Associational resistance: Insect damage to purple
loosestrife reduced in thickets of sweet gale - ProQuest. Ecology. 81: 1784–1794.
Hill, S. B., and P. M. Kotanen. 2009. Evidence That Phylogenetically Novel Non-Indigenous Plants
Experience Less Herbivory. Oecologia. 161: 581–590.

31
Hummel, J. D., L. M. Dosdall, G. W. Clayton, K. N. Harker, and J. T. O’Donovan. 2012. Ground
Beetle (Coleoptera: Carabidae) Diversity, Activity Density, and Community Structure in a
Diversified Agroecosystem. Environmental Entomology. 41: 72–80.
Ingerslew, K. S., and I. Kaplan. 2018. Distantly related crops are not better rotation partners for
tomato. Journal of Applied Ecology. 55: 2506–2516.
Ishizaki, S., K. Shiojiri, R. Karban, and M. Ohara. 2016. Seasonal variation of responses to
herbivory and volatile communication in sagebrush (Artemisia tridentata) (Asteraceae). Journal
of Plant Research; Tokyo. 129: 659–666.
Iverson, A. L., L. E. Marín, K. K. Ennis, D. J. Gonthier, B. T. Connor-Barrie, J. L. Remfert, B. J.
Cardinale, and I. Perfecto. 2014. REVIEW: Do polycultures promote win-wins or trade-offs in
agricultural ecosystem services? A meta-analysis. Journal of Applied Ecology. 51: 1593–1602.
Jactel, H., G. Birgersson, S. Andersson, and F. Schlyter. 2011. Non-host volatiles mediate
associational resistance to the pine processionary moth. Oecologia. 166: 703–711.
Jones, G. A., and J. L. Gillett. 2005. Intercropping with sunflowers to attract beneficial insects in
organic agriculture. Florida Entomologist. 88: 91–96.
Jopp, F., and H. Reuter. 2005. Dispersal of carabid beetles—emergence of distribution patterns.
Ecological Modelling. 186: 389–405.
Khan, Z., C. A. O. Midega, A. Hooper, and J. Pickett. 2016. Push-Pull: Chemical Ecology-Based
Integrated Pest Management Technology. Journal of Chemical Ecology. 42: 689–697.
Kogan, M. 1998. Integrated Pest Management: Historical Perspectives and Contemporary
Developments. Annu. Rev. Entomol. 43: 243–270.
Kromp, B. 1999. Carabid beetles in sustainable agriculture: a review on pest control efficacy,
cultivation impacts and enhancement. Agriculture, Ecosystems & Environment. 74: 187–228.

32
Kuper, R. 2013. Here and Gone: The Visual Effects of Seasonal Changes in Plant and Vegetative
Characteristics on Landscape Preference Criteria. Landscape Journal: design, planning, and
management of the land. 32: 65–78.
Latheef, M. A., J. H. Ortiz, and A. Q. Sheikh. 1984. Influence of Intercropping on Phyllotreta
cruciferae (Coleoptera: Chrysomelidae) Populations on Collard Plants. Journal of Economic
Entomology. 77: 1180–1184.
Letourneau, D. K., I. Armbrecht, B. S. Rivera, J. M. Lerma, E. J. Carmona, M. C. Daza, S.
Escobar, V. Galindo, C. Gutiérrez, S. D. López, J. L. Mejía, A. M. A. Rangel, J. H. Rangel,
L. Rivera, C. A. Saavedra, A. M. Torres, and A. R. Trujillo. 2011. Does plant diversity
benefit agroecosystems? A synthetic review. Ecological Applications. 21: 9–21.
Lucas-Barbosa, D., J. J. A. van Loon, and M. Dicke. 2011. The effects of herbivore-induced plant
volatiles on interactions between plants and flower-visiting insects. Phytochemistry. 72: 1647–
1654.
Lyons, A., P. A. Ashton, I. Powell, and A. Oxbrough. 2018. Epigeal spider assemblage responses to
vegetation structure under contrasting grazing management in upland calcareous grasslands.
Insect Conservation and Diversity. 11: 383–395.
Mazzi, D., and S. Dorn. 2012. Movement of insect pests in agricultural landscapes. Annals of Applied
Biology. 160: 97–113.
McGrath, M. T. 2004. Attractiveness to Cucumber Beetles and Susceptibility to Bacterial Wilt Varies
Among Cucurbit Crop Types and Varieties. Available online:
vegetablemdonline.ppath.cornell.edu/NewsArticles/Cuc_AttrBeetle.htm
Metcalf, R. L., R. L. Lampman, and P. A. Lewis. 1998. Comparative Kairomonal Chemical Ecology
of Diabroticite Beetles (Coleoptera: Chrysomelidae: Galerucinae: Luperini: Diabroticina) in a
Reconstituted Tallgrass Prairie Ecosystem. Journal of Economic Entomology. 91: 881–890.
Moran, N. A. 1992. The Evolution of Aphid Life Cycles. Annu. Rev. Entomol. 37: 321–348.

33
Nagamitsu, T., S. Tsukuba, F. Ushirokita, and Y. Konno. 2012. Foraging habitats and floral
resource use by colonies of long- and short-tongued bumble bee species in an agricultural
landscape with kabocha squash fields. Applied Entomology and Zoology. 47: 181–190.
Najar-Rodriguez, A., B. Orschel, and S. Dorn. 2013. Season-Long Volatile Emissions from Peach
and Pear Trees In Situ, Overlapping Profiles, and Olfactory Attraction of an Oligophagous Fruit
Moth in the Laboratory. Journal of Chemical Ecology. 39: 418–429.
Nechols, J. R. 1987. Voltinism, Seasonal Reproduction, and Diapause in the Squash Bug (Heteroptera:
Coreidae) in Kansas. Environmental Entomology. 16: 269–273.
Oerke, E.-C., and H.-W. Dehne. 2004. Safeguarding production—losses in major crops and the role
of crop protection. Crop Protection. 23: 275–285.
Olff, H., and M. E. Ritchie. 2002. Fragmented nature: consequences for biodiversity. Landscape and
Urban Planning. 58: 83–92.
Pickett, J. A., and Z. R. Khan. 2016. Plant volatile-mediated signalling and its application in
agriculture: successes and challenges. New Phytologist. 212: 856–870.
Pimentel, D., T. W. Culliney, I. W. Buttler, D. J. Reinemann, and K. B. Beckman. 1989. Low-
input sustainable agriculture using ecological management practices. Agriculture, Ecosystems &
Environment. 27: 3–24.
Pimentel, D., L. McLaughlin, A. Zepp, B. Lakitan, T. Kraus, P. Kleinman, F. Vancini, W. J.
Roach, E. Graap, W. S. Keeton, and G. Selig. 1993. Environmental and economic effects of
reducing pesticide use in agriculture. Agriculture, Ecosystems & Environment. 46: 273–288.
Price, P. W., C. E. Bouton, P. Gross, B. A. McPheron, J. N. Thompson, and A. E. Weis. 1980.
Interactions Among Three Trophic Levels: Influence of Plants on Interactions Between Insect
Herbivores and Natural Enemies. Annu. Rev. Ecol. Syst. 11: 41–65.

34
Randlkofer, B., E. Obermaier, M. Hilker, and T. Meiners. 2010. Vegetation complexity—The
influence of plant species diversity and plant structures on plant chemical complexity and
arthropods. Basic and Applied Ecology. 11: 383–395.
Razze, J. M., O. E. Liburd, and S. E. Webb. 2016. Intercropping buckwheat with squash to reduce
insect pests and disease incidence and increase yield. Agroecology and Sustainable Food
Systems. 40: 863–891.
Rogers, C. E. 1992. Insect pests and strategies for their management in cultivated sunflower. Field
Crops Research. 30: 301–332.
Root, R. B. 1973. Organization of a Plant-Arthropod Association in Simple and Diverse Habitats: The
Fauna of Collards (Brassica Oleracea). Ecological Monographs. 43: 95–124.
Samu, F., K. D. Sunderland, and C. Szinetár. 1999. Scale-Dependent Dispersal and Distribution
Patterns of Spiders in Agricultural Systems: A Review. The Journal of Arachnology. 27: 325–
332.
Sanderson, M. J., J. L. Thorne, N. Wikström, and K. Bremer. 2004. Molecular Evidence on Plant
Divergence Times. American Journal of Botany. 91: 1656–1665.
Sargent, R. D., S. W. Kembel, N. C. Emery, E. J. Forrestel, and D. D. Ackerly. 2011. Effect of
local community phylogenetic structure on pollen limitation in an obligately insect-pollinated
plant. American Journal of Botany. 98: 283–289.
Sasu, M. A., I. Seidl-Adams, K. Wall, J. A. Winsor, and A. G. Stephenson. 2010. Floral
Transmission of Erwinia tracheiphila by Cucumber Beetles in a Wild Cucurbita pepo.
Environmental Entomology. 39: 140–148.
Shelton, A. M., and F. R. Badenes-Perez. 2005. Concepts and applications of trap cropping in pest
management. Annu. Rev. Entomol. 51: 285–308.
35
Skinner, M., B. L. Parker, and J. S. Kim. 2014. Chapter 10 - Role of Entomopathogenic Fungi in
Integrated Pest Management, pp. 169–191. In Abrol, D.P. (ed.), Integrated Pest Management.
Academic Press, San Diego.
Smith, R. F., J. L. Apple, and D. G. Bottrell. 1976. The Origins of Integrated Pest Management
Concepts for Agricultural Crops, pp. 1–16. In Apple, J.L., Smith, R.F. (eds.), Integrated Pest
Management. Springer US, Boston, MA.
Stenberg, J. A. 2017. A Conceptual Framework for Integrated Pest Management. Trends in Plant
Science. 22: 759–769.
Stern, V. M., Smith, Ray F., van den Bosch, Robert, and Hagen, Kenneth S. 1959. The integrated
control concept. Hilgardia, Berkeley. 29: 81–101.
Tahvanainen, J. O., and R. B. Root. 1972. The influence of vegetational diversity on the population
ecology of a specialized herbivore, Phyllotreta cruciferae (Coleoptera: Chrysomelidae).
Oecologia. 10: 321–346.
Theis, N., and M. Lerdau. 2003. The Evolution of Function in Plant Secondary Metabolites.
International Journal of Plant Sciences. 164: S93–S102.
Theis, N., and L. S. Adler. 2012. Advertising to the enemy: enhanced floral fragrance increases beetle
attraction and reduces plant reproduction. Ecology. 93: 430–435.
Tschumi, M., M. Albrecht, J. Collatz, V. Dubsky, M. H. Entling, A. J. Najar-Rodriguez, and K.
Jacot. 2016. Tailored flower strips promote natural enemy biodiversity and pest control in potato
crops. Journal of Applied Ecology. 53: 1169–1176.
Ullmann, K. S., M. H. Meisner, and N. M. Williams. 2016. Impact of tillage on the crop pollinating,
ground-nesting bee, Peponapis pruinosa in California. Agriculture, Ecosystems & Environment.
232: 240–246.
Vandermeer, J. H. 1989. The Ecology of Intercropping. Cambridge University Press, Cambridge.
36
Waddington, S. R., M. Mekuria, S. Siziba, And J. Karigwindi. 2007. Long-term yield sustainability
and financial returns from grain legume–maize intercrops on a sandy soil in subhumid north
central zimbabwe. Experimental Agriculture. 43: 489–503.
Wadley, F. M. 1920. The Squash Bug. Journal of Economic Entomology. 13: 416–425.
Yao, C., E. Bauske, G. Zehnder, and J. Kloepper. 1996. Relationship Between Cucumber Beetle
(Coleoptera: Chrysomelidae) Density and Incidence of Bacterial Wilt of Cucurbits. Journal of
Economic Entomology. 89: 510–514.

37
Tables
Table 1-1: Data collection by week for 2017 and 2018. In 2017, data were only collected during the late season because of flooding and rain issues. In 2018, pitfall trap and sticky trap were not possible in July because of frequent rain.
Week of Tasks
2017
August 6 foliage scouting, flower scouting, pitfall traps
20 flower scouting
27 foliage scouting, flower scouting
September 10 sticky traps
17 foliage scouting, flower scouting
2018
June 17 foliage scouting
24 sticky traps, pitfall traps
July 1 foliage scouting
8 beetle collecting
15 foliage scouting, flower scouting
29 pitfall traps
August 5 foliage scouting, flower scouting, sticky traps, beetle collecting
26 foliage scouting, flower scouting, sticky traps, pitfall traps, beetle collecting
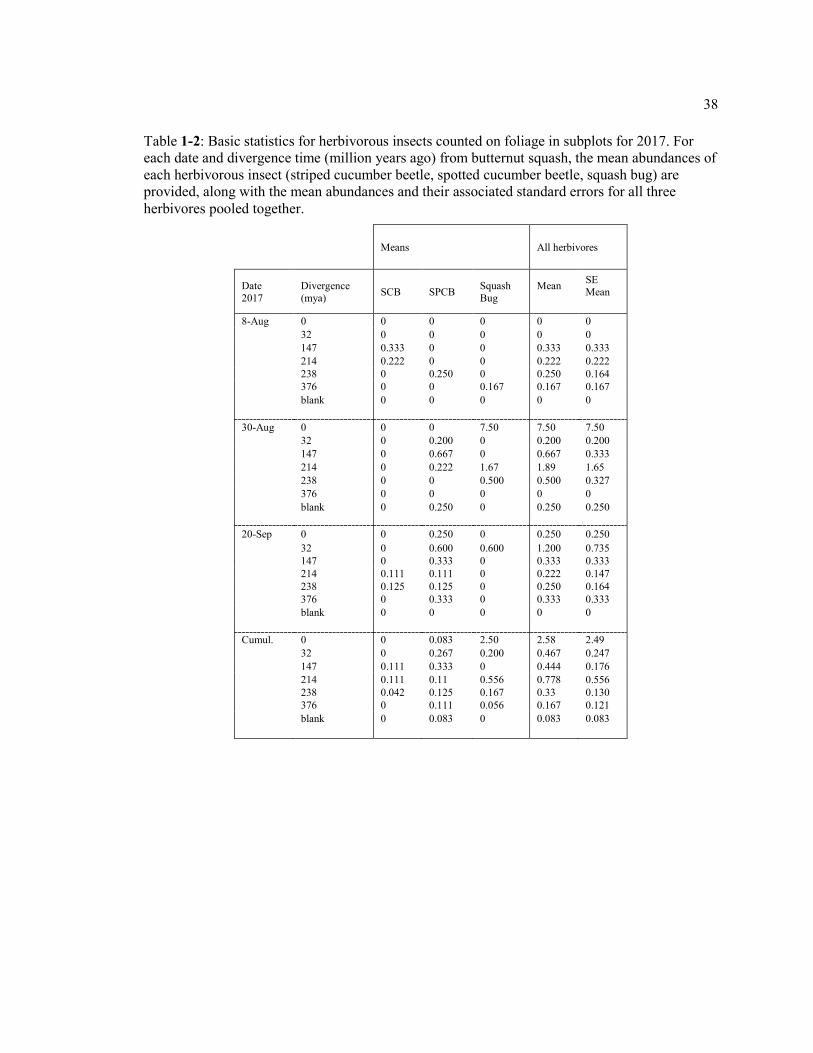
38
Table 1-2: Basic statistics for herbivorous insects counted on foliage in subplots for 2017. For each date and divergence time (million years ago) from butternut squash, the mean abundances of each herbivorous insect (striped cucumber beetle, spotted cucumber beetle, squash bug) are provided, along with the mean abundances and their associated standard errors for all three herbivores pooled together.
Means All herbivores
Date 2017
Divergence (mya) SCB SPCB Squash
Bug Mean
SE Mean
8-Aug 0 0 0 0 0 0 32 0 0 0 0 0 147 0.333 0 0 0.333 0.333 214 0.222 0 0 0.222 0.222 238 0 0.250 0 0.250 0.164 376 0 0 0.167 0.167 0.167 blank 0 0 0 0 0 30-Aug 0 0 0 7.50 7.50 7.50 32 0 0.200 0 0.200 0.200 147 0 0.667 0 0.667 0.333 214 0 0.222 1.67 1.89 1.65 238 0 0 0.500 0.500 0.327 376 0 0 0 0 0 blank 0 0.250 0 0.250 0.250 20-Sep 0 0 0.250 0 0.250 0.250 32 0 0.600 0.600 1.200 0.735 147 0 0.333 0 0.333 0.333 214 0.111 0.111 0 0.222 0.147 238 0.125 0.125 0 0.250 0.164 376 0 0.333 0 0.333 0.333 blank 0 0 0 0 0 Cumul. 0 0 0.083 2.50 2.58 2.49 32 0 0.267 0.200 0.467 0.247 147 0.111 0.333 0 0.444 0.176 214 0.111 0.11 0.556 0.778 0.556 238 0.042 0.125 0.167 0.33 0.130 376 0 0.111 0.056 0.167 0.121 blank 0 0.083 0 0.083 0.083

39
Table 1-3: Significant regression models from trap data in 2017. In 2017, Arthropod abundances were rare and most trap data had to pooled for cumulative models because they otherwise didn’t satisfy model assumptions. Significances were found among herbivorous insects counted from foliage scouting and flower scouting efforts (α = 0.1, α = 0.05*, α = 0.01**).
Collection method
Date (2017) Arthropod DF Poisson
χ2 Diver. time (mya) p-value
Block replicate p-value
Number of flowers p-value
Model p-value
% R-sq/ R-sq (adj)
Foliage scouting
30-Aug
All herbivores 5 87.11 <0.0001** <0.0001** <0.0001** 33.65
Cumul. Squash bug 1 39.06 <0.0001** <0.0001** 15.15
All herbivores 5 75.23 <0.0001** <0.0001** <0.0001** 19.55
Flower scouting Cumul. SCB +
SPCB 2 19.32 0.002* 0.003 <0.0001** 5.14
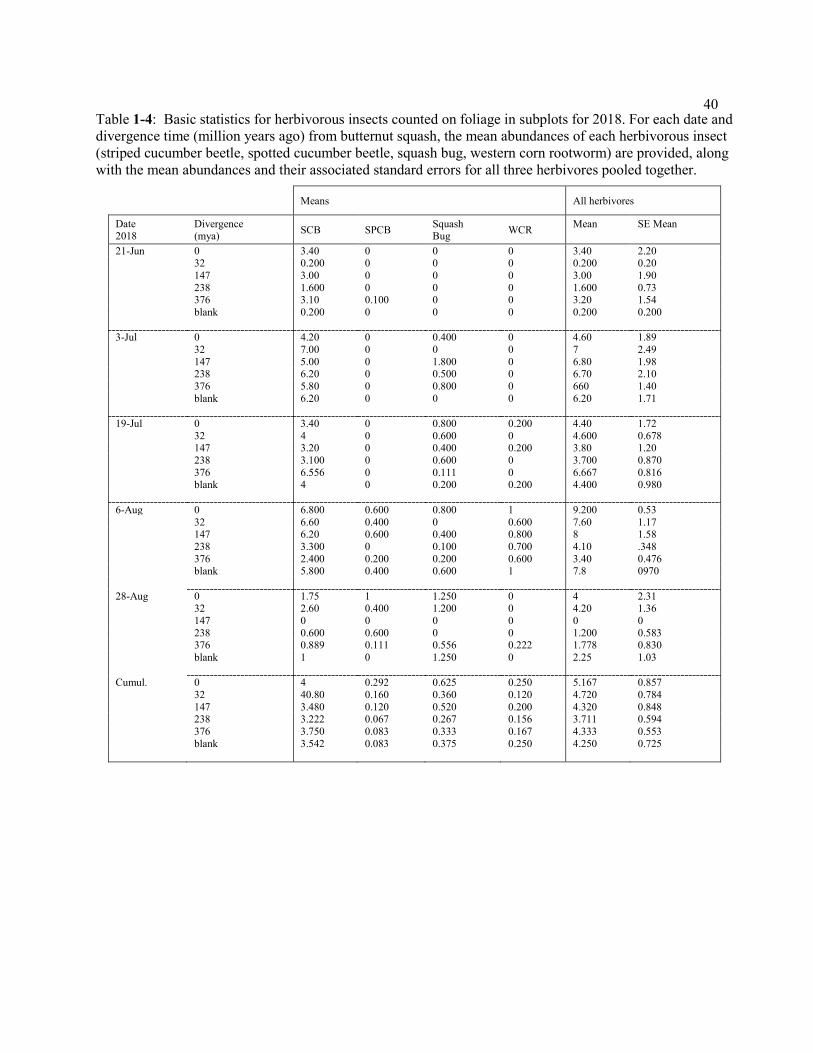
40
Table 1-4: Basic statistics for herbivorous insects counted on foliage in subplots for 2018. For each date and divergence time (million years ago) from butternut squash, the mean abundances of each herbivorous insect (striped cucumber beetle, spotted cucumber beetle, squash bug, western corn rootworm) are provided, along with the mean abundances and their associated standard errors for all three herbivores pooled together.
Means All herbivores
Date 2018
Divergence (mya) SCB SPCB Squash
Bug WCR Mean
SE Mean
21-Jun 0 3.40 0 0 0 3.40 2.20 32 0.200 0 0 0 0.200 0.20 147 3.00 0 0 0 3.00 1.90 238 1.600 0 0 0 1.600 0.73 376 3.10 0.100 0 0 3.20 1.54 blank 0.200 0 0 0 0.200 0.200 3-Jul 0 4.20 0 0.400 0 4.60 1.89 32 7.00 0 0 0 7 2.49 147 5.00 0 1.800 0 6.80 1.98 238 6.20 0 0.500 0 6.70 2.10 376 5.80 0 0.800 0 660 1.40 blank 6.20 0 0 0 6.20 1.71 19-Jul 0 3.40 0 0.800 0.200 4.40 1.72 32 4 0 0.600 0 4.600 0.678 147 3.20 0 0.400 0.200 3.80 1.20 238 3.100 0 0.600 0 3.700 0.870 376 6.556 0 0.111 0 6.667 0.816 blank 4 0 0.200 0.200 4.400 0.980 6-Aug 0 6.800 0.600 0.800 1 9.200 0.53 32 6.60 0.400 0 0.600 7.60 1.17 147 6.20 0.600 0.400 0.800 8 1.58 238 3.300 0 0.100 0.700 4.10 .348 376 2.400 0.200 0.200 0.600 3.40 0.476 blank 5.800 0.400 0.600 1 7.8 0970 28-Aug 0 1.75 1 1.250 0 4 2.31 32 2.60 0.400 1.200 0 4.20 1.36 147 0 0 0 0 0 0 238 0.600 0.600 0 0 1.200 0.583 376 0.889 0.111 0.556 0.222 1.778 0.830 blank 1 0 1.250 0 2.25 1.03 Cumul. 0 4 0.292 0.625 0.250 5.167 0.857 32 40.80 0.160 0.360 0.120 4.720 0.784 147 3.480 0.120 0.520 0.200 4.320 0.848 238 3.222 0.067 0.267 0.156 3.711 0.594 376 3.750 0.083 0.333 0.167 4.333 0.553 blank 3.542 0.083 0.375 0.250 4.250 0.725
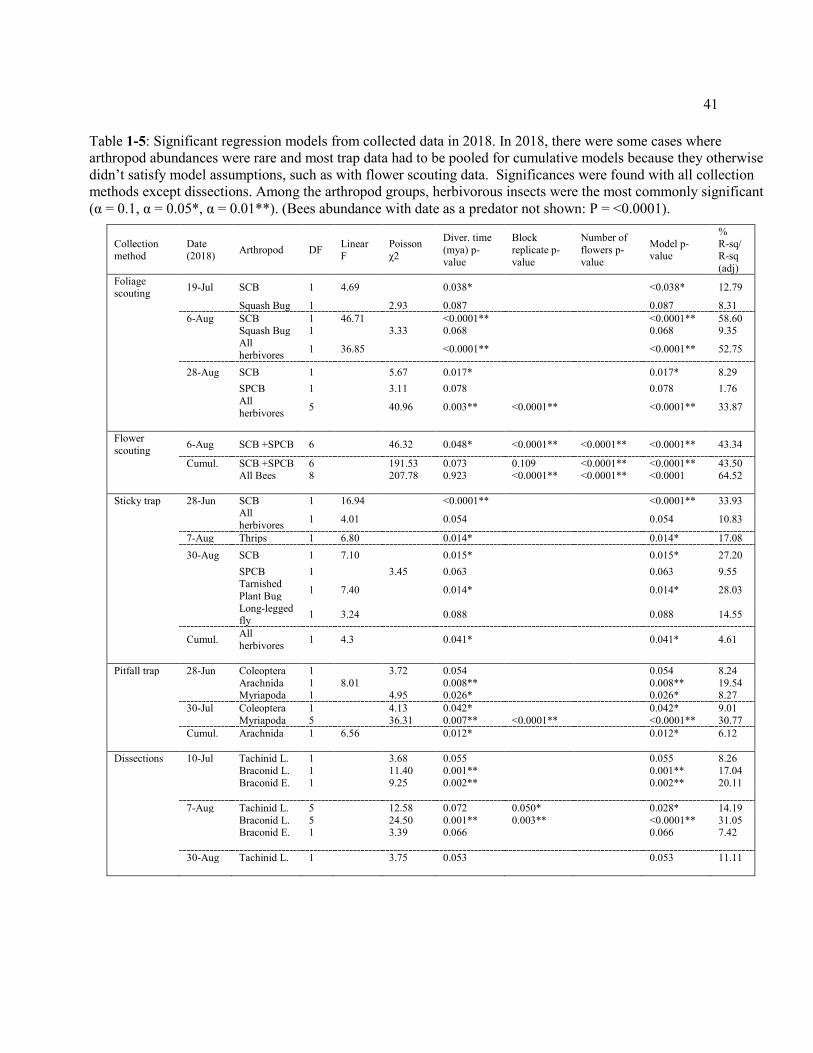
41
Table 1-5: Significant regression models from collected data in 2018. In 2018, there were some cases where arthropod abundances were rare and most trap data had to be pooled for cumulative models because they otherwise didn’t satisfy model assumptions, such as with flower scouting data. Significances were found with all collection methods except dissections. Among the arthropod groups, herbivorous insects were the most commonly significant (α = 0.1, α = 0.05*, α = 0.01**). (Bees abundance with date as a predator not shown: P = <0.0001).
Collection method
Date (2018) Arthropod DF Linear
F Poisson χ2
Diver. time (mya) p-value
Block replicate p-value
Number of flowers p-value
Model p-value
% R-sq/ R-sq (adj)
Foliage scouting 19-Jul SCB 1 4.69 0.038* <0.038* 12.79
Squash Bug 1 2.93 0.087 0.087 8.31 6-Aug SCB 1 46.71 <0.0001** <0.0001** 58.60 Squash Bug 1 3.33 0.068 0.068 9.35
All herbivores 1 36.85 <0.0001** <0.0001** 52.75
28-Aug SCB 1 5.67 0.017* 0.017* 8.29 SPCB 1 3.11 0.078 0.078 1.76
All herbivores 5 40.96 0.003** <0.0001** <0.0001** 33.87
Flower scouting 6-Aug SCB +SPCB 6 46.32 0.048* <0.0001** <0.0001** <0.0001** 43.34
Cumul. SCB +SPCB 6 191.53 0.073 0.109 <0.0001** <0.0001** 43.50 All Bees 8 207.78 0.923 <0.0001** <0.0001** <0.0001 64.52 Sticky trap 28-Jun SCB 1 16.94 <0.0001** <0.0001** 33.93
All herbivores 1 4.01 0.054 0.054 10.83
7-Aug Thrips 1 6.80 0.014* 0.014* 17.08 30-Aug SCB 1 7.10 0.015* 0.015* 27.20 SPCB 1 3.45 0.063 0.063 9.55
Tarnished Plant Bug 1 7.40 0.014* 0.014* 28.03
Long-legged fly 1 3.24 0.088 0.088 14.55
Cumul. All herbivores 1 4.3 0.041* 0.041* 4.61
Pitfall trap 28-Jun Coleoptera 1 3.72 0.054 0.054 8.24 Arachnida 1 8.01 0.008** 0.008** 19.54 Myriapoda 1 4.95 0.026* 0.026* 8.27 30-Jul Coleoptera 1 4.13 0.042* 0.042* 9.01 Myriapoda 5 36.31 0.007** <0.0001** <0.0001** 30.77 Cumul. Arachnida 1 6.56 0.012* 0.012* 6.12 Dissections 10-Jul Tachinid L. 1 3.68 0.055 0.055 8.26 Braconid L. 1 11.40 0.001** 0.001** 17.04 Braconid E. 1 9.25 0.002** 0.002** 20.11 7-Aug Tachinid L. 5 12.58 0.072 0.050* 0.028* 14.19 Braconid L. 5 24.50 0.001** 0.003** <0.0001** 31.05 Braconid E. 1 3.39 0.066 0.066 7.42 30-Aug Tachinid L. 1 3.75 0.053 0.053 11.11

42
Table 1-6: Basic statistics for bees and cucumber beetles counted in flowers for 2017. Abundances were very low. For each date and divergence time (million years ago) from butternut squash, the mean abundances of each bee (squash bee, bumble bee, honey bee) and cucumber beetle (striped cucumber beetle, spotted cucumber beetle) are provided, along with the mean abundances and their associated standard errors for all three bees pooled together, and then all cucumber beetles pooled together.
Bee means Cucumber beetle means
Date 2017
Divergence (mya)
Squash bee
Bumble bee
Honey bee All Bees
SE Mean bees
SCB SPCB All beetles
SE Mean beetles
9-Aug 0 0.750 4.50 0 5.25 1.11 4.50 2 6.5 2.47 32 0.20 2 0 2.20 102 1.4 0.200 1.600 0.748 147 0 0.333 0 0.333 0.333 0.67 0 0.667 0.667 214 0.333 1 0 1.333 0.782 1.444 0.111 1.556 0.973 238 0 0.875 0 0.875 0.875 1.250 1.250 2.50 1.45 376 0 0.833 0 0.833 0.543 1 0.500 1.500 0.957 blank 0 3.5 0 3.50 1.26 0.500 0.250 0.750 0.479 28-Aug 0 0 3 0 3.00 1.47 0 0.500 0.500 0.289 32 0.600 3 0 3.60 1.81 0.200 1 1.200 0.970 147 0 5 0 5.00 2.89 1 0.333 1.333 0.882 214 0.333 3.78 0 4.11 2.19 0.444 1.556 2 0.866 238 0 3 0 3.00 1.77 0.500 0.500 1 0.866 376 0 4 0 4.00 1.91 0 0.333 0.333 0.211 blank 0 1.5 0 1.5 0.866 0.750 1.25 2.0 1.68 20-Sep 0 0.250 0.750 0.500 1.500 0.289 0.250 0.500 0.750 0.479 32 0 0.200 0.600 0.800 0.374 0.800 0 0.800 0.374 147 0 1.667 0.333 2.00 1 1 0.333 1.33 1.33 214 0 0.222 0.333 0.556 0.242 0.111 0.333 0.444 0176 238 0 0.375 0.250 0.625 0.263 0.500 0.125 0.625 0.498 376 0 1.167 0.333 1.500 0.428 0 0.167 0.167 0.167 blank 0 0.500 0.500 1 0.408 0 0.500 0.500 0.289 Cumul. 0 0.333 2.75 0.167 3.250 0.730 1.583 1.00 2.58 3.92 32 0.267 1.733 0.200 2.200 0.718 0.800 0.400 1.20 1.568 147 0 2.33 0.111 2.44 1.12 0.89 0.222 1.11 1.537 214 0.222 1.667 0.111 2.00 0.808 0.667 0.667 1.333 2.287 238 0 1.417 0.083 1.500 0.673 0.750 0.625 1.375 2.871 376 0 2 0.111 2.111 0.718 0.333 0.333 0.667 1.455 blank 0 1.833 0.167 2.00 0.577 0.417 0.667 1.083 1.975

43
Table 1-7: Basic statistics for bees and cucumber beetles counted in flowers for 2018. Abundances were lowest for the 28-Aug sampling date. For each date and divergence time (million years ago) from butternut squash, the mean abundances of each bee (squash bee, bumble bee, honey bee) and cucumber beetle (striped cucumber beetle, spotted cucumber beetle, western corn rootworm) are provided, along with the mean abundances and their associated standard errors for all three bees pooled together, and then all cucumber beetles pooled together.
Bee means Beetle Means
Date 2018
Divergence (mya)
Squash bee
Bumble bee
Honey bee
All Bees
SE Mean bees
SCB SPCB WCR All beetles
SE Mean beetles
18-Jul 0 4.20 0.200 0.200 4.60 1.47 7.80 .600 0 8.40 1.78 32 1.250 0250 0 1.500 0.645 1025 0 0 10.25 2.43 147 3.60 0 0.400 4 1.45 16.80 0 0.200 17 3.89 238 5 0 0.111 5.11 1.12 9.89 0.222 0 10.11 1.98 376 3.70 0.100 0.300 4.10 1.18 16 0.100 0 16.10 2.42 blank 4.20 0.200 0 4.40 1.03 15 0 0 15 3.41 6-Aug 0 4.20 0 0.200 4.40 1.29 10.600 0 0.600 11.20 1.02 32 3.60 0 0.200 3.80 1.28 10 0.200 0.800 11 2.66 147 5.80 0 0.600 6.40 1.75 10.40 0.200 1.400 12 5.11 238 4.70 0.100 1.200 6 1.63 7090 0.100 0 8 1.56 376 4 0 0.800 4.80 0.646 8090 0.200 0 9.10 1.55 blank 7.40 0 1 8.80 2.27 10.40 0.400 0.400 11.20 2.82 28-Aug 0 0 0.667 0 0.667 0.333 9 1.33 0 10.33 2.19
32 0 0 0 0 0 4 0.500 0 4.50 1.50 238 0 0 0 0 0 1.444 0 0 1.444 0.377 376 0.250 0 0 0.200 0.200 3.400 0.200 0 3.60 1.03 blank 0.250 0.500 0 0.750 0.479 2 0 0 0.750 0.479 Cumul. 0 3.231 0.231 0.154 3.615 0.844 9.154 0.538 0.231 9.923 0.92 32 2.091 0.0909 0.090 2.273 0.752 9 0.182 0.364 9.55 1.60 147 4.70 0 0.500 5.20 1.14 13.60 0.100 0.800 14.50 3.14 238 3.0286 0.0357 0.464 3.926 0.852 6.46 0.107 0 6.57 1.08 376 3.250 0.040 0.440 3.600 0.630 10.64 0.160 0 10.80 1.49 blank 4.21 0.357 0.357 4.93 1.22 9.64 0.143 0.143 9.57 2.18
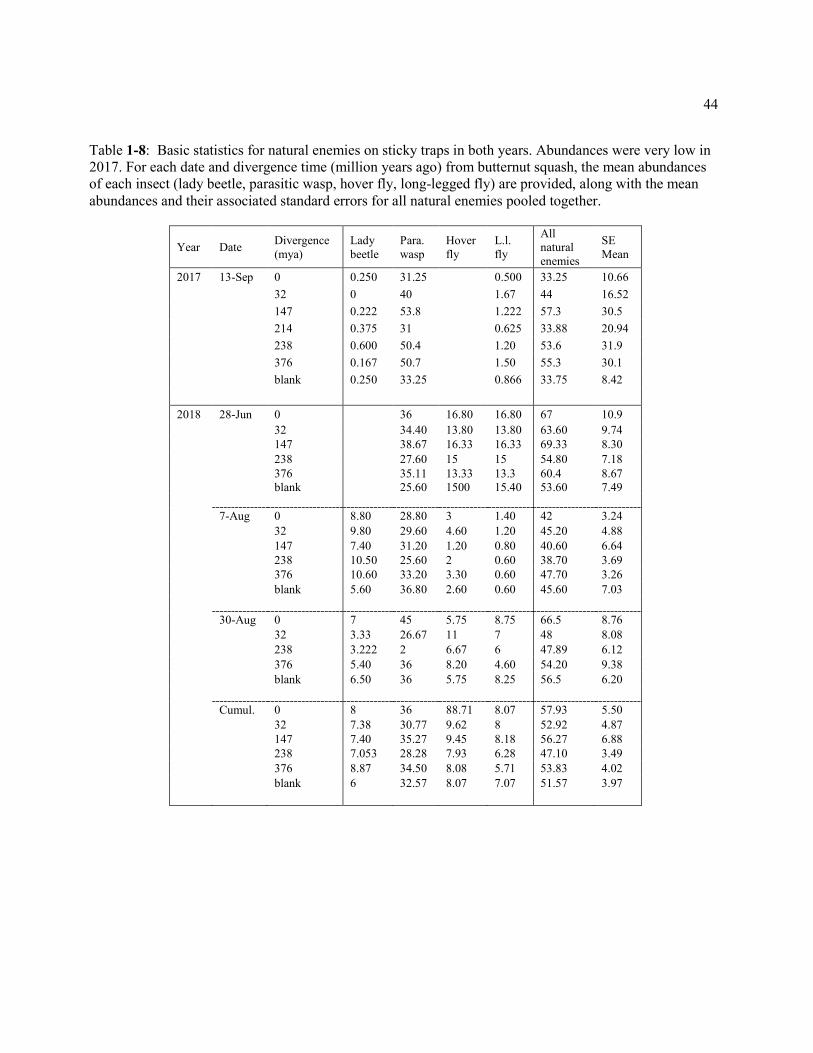
44
Table 1-8: Basic statistics for natural enemies on sticky traps in both years. Abundances were very low in 2017. For each date and divergence time (million years ago) from butternut squash, the mean abundances of each insect (lady beetle, parasitic wasp, hover fly, long-legged fly) are provided, along with the mean abundances and their associated standard errors for all natural enemies pooled together.
Year Date Divergence (mya)
Lady beetle
Para. wasp
Hover fly
L.l. fly
All natural enemies
SE Mean
2017 13-Sep 0 0.250 31.25 0.500 33.25 10.66 32 0 40 1.67 44 16.52 147 0.222 53.8 1.222 57.3 30.5 214 0.375 31 0.625 33.88 20.94 238 0.600 50.4 1.20 53.6 31.9 376 0.167 50.7 1.50 55.3 30.1 blank 0.250 33.25 0.866 33.75 8.42 2018 28-Jun 0 36 16.80 16.80 67 10.9 32 34.40 13.80 13.80 63.60 9.74 147 38.67 16.33 16.33 69.33 8.30 238 27.60 15 15 54.80 7.18 376 35.11 13.33 13.3 60.4 8.67 blank 25.60 1500 15.40 53.60 7.49 7-Aug 0 8.80 28.80 3 1.40 42 3.24 32 9.80 29.60 4.60 1.20 45.20 4.88 147 7.40 31.20 1.20 0.80 40.60 6.64 238 10.50 25.60 2 0.60 38.70 3.69 376 10.60 33.20 3.30 0.60 47.70 3.26 blank 5.60 36.80 2.60 0.60 45.60 7.03 30-Aug 0 7 45 5.75 8.75 66.5 8.76 32 3.33 26.67 11 7 48 8.08 238 3.222 2 6.67 6 47.89 6.12 376 5.40 36 8.20 4.60 54.20 9.38 blank 6.50 36 5.75 8.25 56.5 6.20 Cumul. 0 8 36 88.71 8.07 57.93 5.50 32 7.38 30.77 9.62 8 52.92 4.87 147 7.40 35.27 9.45 8.18 56.27 6.88 238 7.053 28.28 7.93 6.28 47.10 3.49 376 8.87 34.50 8.08 5.71 53.83 4.02 blank 6 32.57 8.07 7.07 51.57 3.97
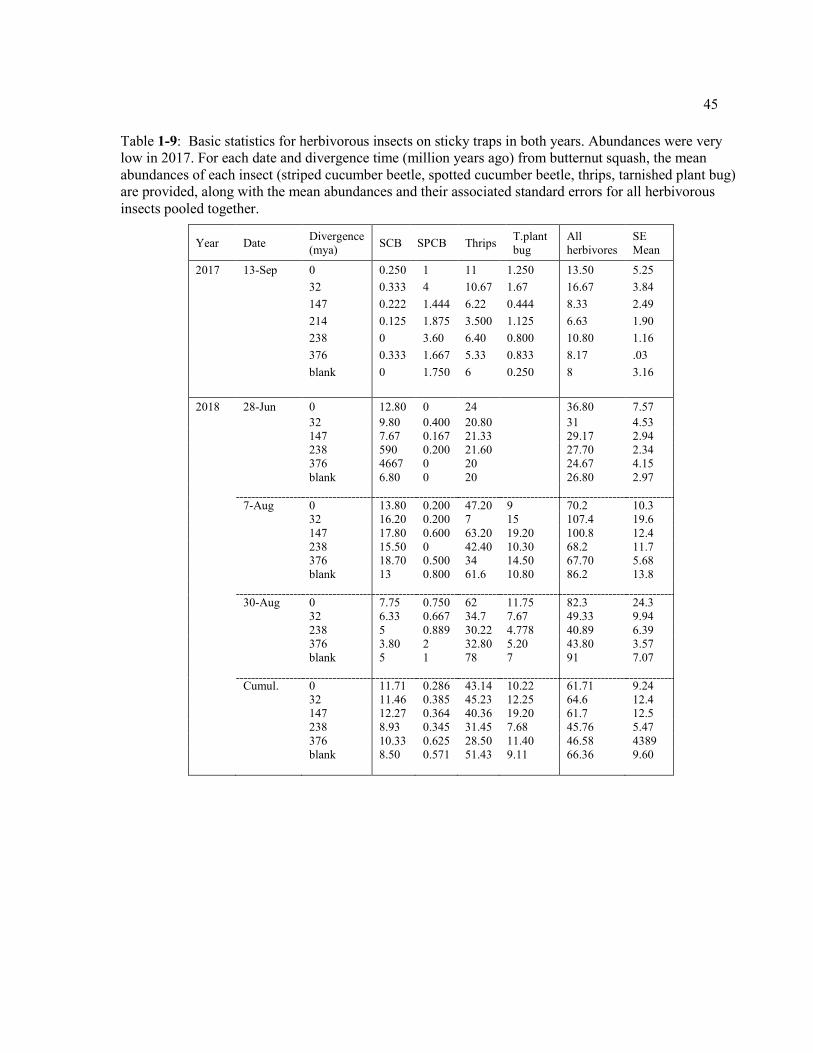
45
Table 1-9: Basic statistics for herbivorous insects on sticky traps in both years. Abundances were very low in 2017. For each date and divergence time (million years ago) from butternut squash, the mean abundances of each insect (striped cucumber beetle, spotted cucumber beetle, thrips, tarnished plant bug) are provided, along with the mean abundances and their associated standard errors for all herbivorous insects pooled together.
Year Date Divergence (mya) SCB SPCB Thrips T.plant
bug All herbivores
SE Mean
2017 13-Sep 0 0.250 1 11 1.250 13.50 5.25 32 0.333 4 10.67 1.67 16.67 3.84 147 0.222 1.444 6.22 0.444 8.33 2.49 214 0.125 1.875 3.500 1.125 6.63 1.90 238 0 3.60 6.40 0.800 10.80 1.16 376 0.333 1.667 5.33 0.833 8.17 .03 blank 0 1.750 6 0.250 8 3.16 2018 28-Jun 0 12.80 0 24 36.80 7.57 32 9.80 0.400 20.80 31 4.53 147 7.67 0.167 21.33 29.17 2.94 238 590 0.200 21.60 27.70 2.34 376 4667 0 20 24.67 4.15 blank 6.80 0 20 26.80 2.97 7-Aug 0 13.80 0.200 47.20 9 70.2 10.3 32 16.20 0.200 7 15 107.4 19.6 147 17.80 0.600 63.20 19.20 100.8 12.4 238 15.50 0 42.40 10.30 68.2 11.7 376 18.70 0.500 34 14.50 67.70 5.68 blank 13 0.800 61.6 10.80 86.2 13.8 30-Aug 0 7.75 0.750 62 11.75 82.3 24.3 32 6.33 0.667 34.7 7.67 49.33 9.94 238 5 0.889 30.22 4.778 40.89 6.39 376 3.80 2 32.80 5.20 43.80 3.57 blank 5 1 78 7 91 7.07 Cumul. 0 11.71 0.286 43.14 10.22 61.71 9.24 32 11.46 0.385 45.23 12.25 64.6 12.4 147 12.27 0.364 40.36 19.20 61.7 12.5 238 8.93 0.345 31.45 7.68 45.76 5.47 376 10.33 0.625 28.50 11.40 46.58 4389 blank 8.50 0.571 51.43 9.11 66.36 9.60
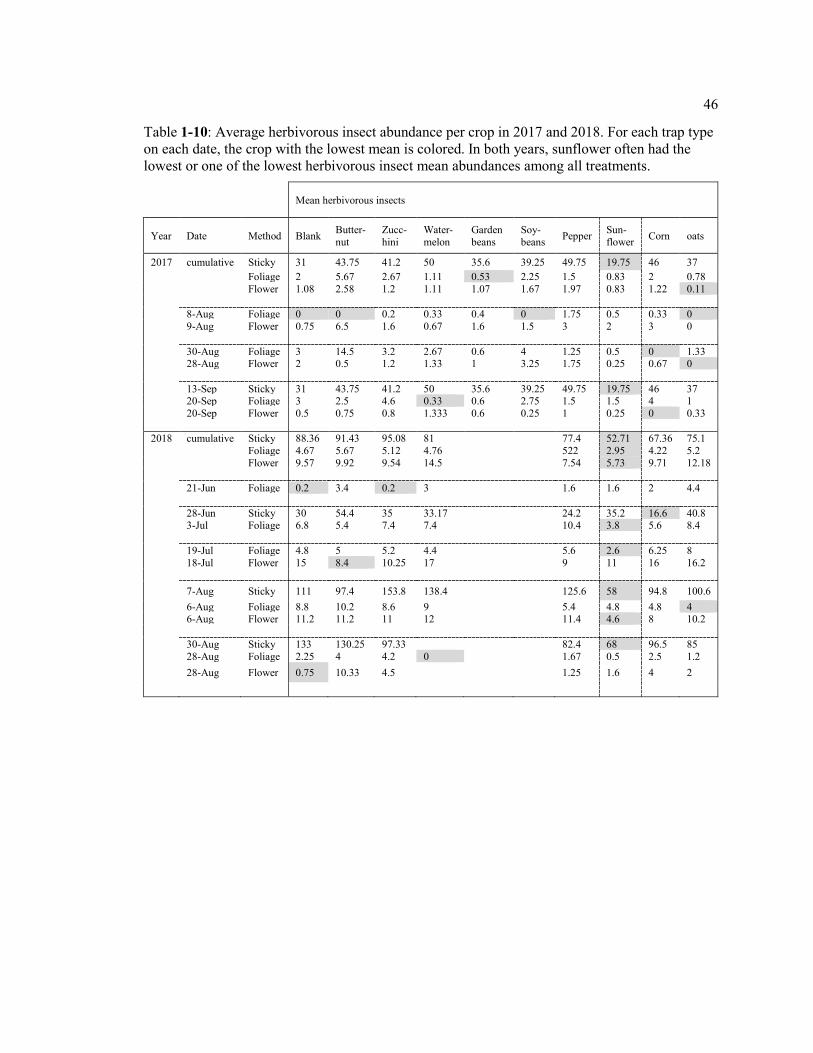
46
Table 1-10: Average herbivorous insect abundance per crop in 2017 and 2018. For each trap type on each date, the crop with the lowest mean is colored. In both years, sunflower often had the lowest or one of the lowest herbivorous insect mean abundances among all treatments.
Mean herbivorous insects
Year Date Method Blank Butter-nut
Zucc-hini
Water-melon
Garden beans
Soy-beans Pepper Sun-
flower Corn oats
2017 cumulative Sticky 31 43.75 41.2 50 35.6 39.25 49.75 19.75 46 37 Foliage 2 5.67 2.67 1.11 0.53 2.25 1.5 0.83 2 0.78 Flower 1.08 2.58 1.2 1.11 1.07 1.67 1.97 0.83 1.22 0.11 8-Aug Foliage 0 0 0.2 0.33 0.4 0 1.75 0.5 0.33 0 9-Aug Flower 0.75 6.5 1.6 0.67 1.6 1.5 3 2 3 0 30-Aug Foliage 3 14.5 3.2 2.67 0.6 4 1.25 0.5 0 1.33 28-Aug Flower 2 0.5 1.2 1.33 1 3.25 1.75 0.25 0.67 0 13-Sep Sticky 31 43.75 41.2 50 35.6 39.25 49.75 19.75 46 37 20-Sep Foliage 3 2.5 4.6 0.33 0.6 2.75 1.5 1.5 4 1 20-Sep Flower 0.5 0.75 0.8 1.333 0.6 0.25 1 0.25 0 0.33 2018 cumulative Sticky 88.36 91.43 95.08 81 77.4 52.71 67.36 75.1 Foliage 4.67 5.67 5.12 4.76 522 2.95 4.22 5.2 Flower 9.57 9.92 9.54 14.5 7.54 5.73 9.71 12.18 21-Jun Foliage 0.2 3.4 0.2 3 1.6 1.6 2 4.4 28-Jun Sticky 30 54.4 35 33.17 24.2 35.2 16.6 40.8 3-Jul Foliage 6.8 5.4 7.4 7.4 10.4 3.8 5.6 8.4 19-Jul Foliage 4.8 5 5.2 4.4 5.6 2.6 6.25 8 18-Jul Flower 15 8.4 10.25 17 9 11 16 16.2 7-Aug Sticky 111 97.4 153.8 138.4 125.6 58 94.8 100.6 6-Aug Foliage 8.8 10.2 8.6 9 5.4 4.8 4.8 4 6-Aug Flower 11.2 11.2 11 12 11.4 4.6 8 10.2 30-Aug Sticky 133 130.25 97.33 82.4 68 96.5 85 28-Aug Foliage 2.25 4 4.2 0 1.67 0.5 2.5 1.2 28-Aug Flower 0.75 10.33 4.5 1.25 1.6 4 2
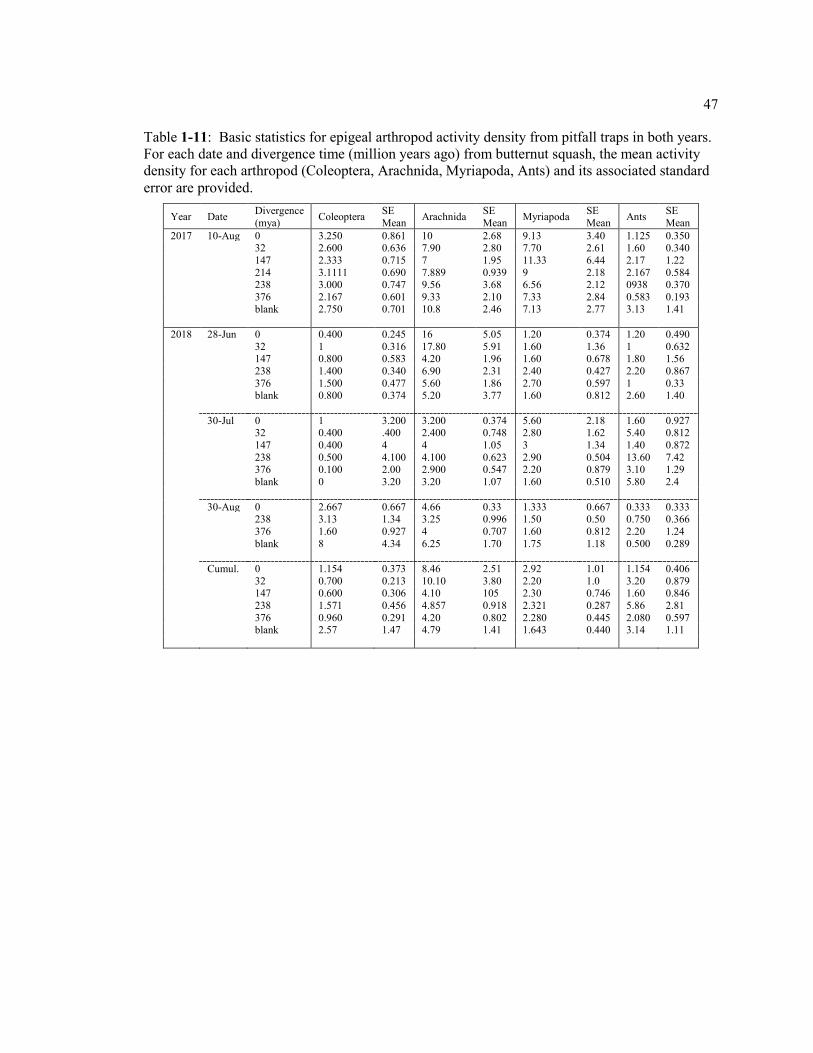
47
Table 1-11: Basic statistics for epigeal arthropod activity density from pitfall traps in both years. For each date and divergence time (million years ago) from butternut squash, the mean activity density for each arthropod (Coleoptera, Arachnida, Myriapoda, Ants) and its associated standard error are provided.
Year Date Divergence (mya) Coleoptera SE
Mean Arachnida SE Mean Myriapoda SE
Mean Ants SE Mean
2017 10-Aug 0 3.250 0.861 10 2.68 9.13 3.40 1.125 0.350 32 2.600 0.636 7.90 2.80 7.70 2.61 1.60 0.340 147 2.333 0.715 7 1.95 11.33 6.44 2.17 1.22 214 3.1111 0.690 7.889 0.939 9 2.18 2.167 0.584 238 3.000 0.747 9.56 3.68 6.56 2.12 0938 0.370 376 2.167 0.601 9.33 2.10 7.33 2.84 0.583 0.193 blank 2.750 0.701 10.8 2.46 7.13 2.77 3.13 1.41 2018 28-Jun 0 0.400 0.245 16 5.05 1.20 0.374 1.20 0.490 32 1 0.316 17.80 5.91 1.60 1.36 1 0.632 147 0.800 0.583 4.20 1.96 1.60 0.678 1.80 1.56 238 1.400 0.340 6.90 2.31 2.40 0.427 2.20 0.867 376 1.500 0.477 5.60 1.86 2.70 0.597 1 0.33 blank 0.800 0.374 5.20 3.77 1.60 0.812 2.60 1.40 30-Jul 0 1 3.200 3.200 0.374 5.60 2.18 1.60 0.927 32 0.400 .400 2.400 0.748 2.80 1.62 5.40 0.812 147 0.400 4 4 1.05 3 1.34 1.40 0.872 238 0.500 4.100 4.100 0.623 2.90 0.504 13.60 7.42 376 0.100 2.00 2.900 0.547 2.20 0.879 3.10 1.29 blank 0 3.20 3.20 1.07 1.60 0.510 5.80 2.4 30-Aug 0 2.667 0.667 4.66 0.33 1.333 0.667 0.333 0.333 238 3.13 1.34 3.25 0.996 1.50 0.50 0.750 0.366 376 1.60 0.927 4 0.707 1.60 0.812 2.20 1.24 blank 8 4.34 6.25 1.70 1.75 1.18 0.500 0.289 Cumul. 0 1.154 0.373 8.46 2.51 2.92 1.01 1.154 0.406 32 0.700 0.213 10.10 3.80 2.20 1.0 3.20 0.879 147 0.600 0.306 4.10 105 2.30 0.746 1.60 0.846 238 1.571 0.456 4.857 0.918 2.321 0.287 5.86 2.81 376 0.960 0.291 4.20 0.802 2.280 0.445 2.080 0.597 blank 2.57 1.47 4.79 1.41 1.643 0.440 3.14 1.11

48
Table 1-12: Basic statistics for parasitoid and parasite mean abundances from striped cucumber beetle dissections in both years. For each date and divergence time (million years ago) from butternut squash, the mean abundance for each parasitoid and parasite (tachinid larvae, braconid larvae and eggs, nematodes) and its associated standard error are provided.
Date 2018
Divergence (mya)
Tachinid larvae
SE Mean
Braconid Larvae
SE Mean
Braconid eggs
SE Mean Nematodes SE
Mean 10-Jul 0 1 0.632 2.60 0.510 1.80 0.374 2.40 0.510 32 2 0.837 1.40 0.510 1.40 0.510 1.60 0.600 147 1.80 0.860 1 0.775 1.20 0.583 1.40 0.678 238 1.30 0.367 1.60 0.806 1.50 0.307 1.90 0.233 376 1.30 .559 2.40 0.600 1.50 0.401 1.70 0.367 blank 1 0.316 2.40 0.812 2.20 0.583 2.40 0.245 7-Aug 0 0 0 0.250 0.250 0.250 0.250 2 0.707 32 0.333 0.333 0.333 0.333 0.667 0.667 1.333 0.882 147 0.200 0.20 0.200 0.200 0.400 0.245 1.20 0.583 238 .300 0.213 0.200 0.200 0.400 0.221 2.70 0.907 376 0.700 0.260 0.200 0.133 0.200 0.133 1.30 0.335 blank 0.600 0.400 0.220 0.200 0.400 0.245 2 0.316 30-Aug 0 1 1 1.75 1.18 1.75 1.18 3.50 0.957 32 0 0 2 5 238 0.750 0.750 0.750 0.250 0.625 0324 1.50 0.423 376 0.500 0.500 0.833 0.307 1.167 0.477 3.667 0.955 blank 0.250 0.250 1.50 0.645 1.250 0.479 2.50 1.50 Cumul. 0 0.692 0.286 .615 0.474 1.308 0.414 2.615 0.417 32 1.22 0.547 0.889 0.351 1.222 0.364 1.889 0.564 147 1 0.494 0.600 0.400 0.800 0.32 130 0.423 238 0.786 0.202 0.857 0.316 0.857 0.183 2.71 0.356 376 0.885 0.250 1.192 0.309 0.923 0.221 2 0.333 blank 0.643 0.199 1.357 0.414 1.286 0.322 2.286 0.412
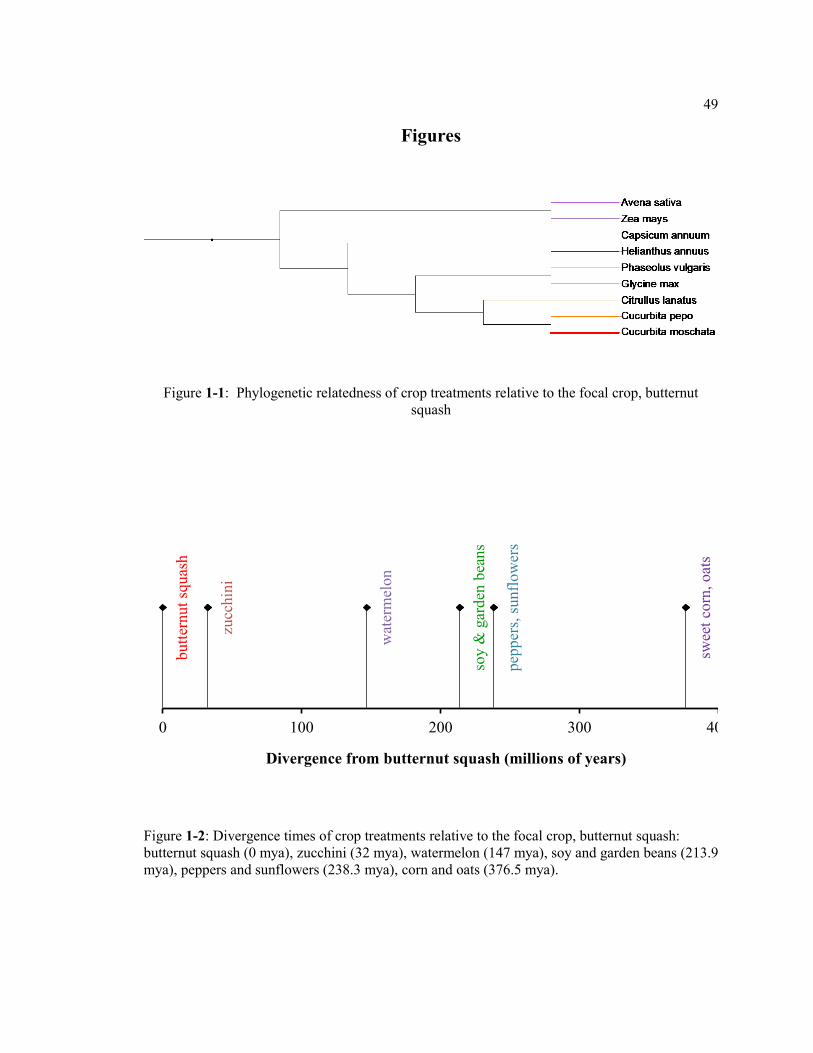
49
Figures
Figure 1-1: Phylogenetic relatedness of crop treatments relative to the focal crop, butternut squash
Figure 1-2: Divergence times of crop treatments relative to the focal crop, butternut squash: butternut squash (0 mya), zucchini (32 mya), watermelon (147 mya), soy and garden beans (213.9 mya), peppers and sunflowers (238.3 mya), corn and oats (376.5 mya).
butte
rnut
squa
sh
zucc
hini
wat
erm
elon
soy
& g
arde
n be
ans
pepp
ers,
sunf
low
ers
swee
t cor
n, o
ats
0 100 200 300 40
Divergence from butternut squash (millions of years)

50
Bl S O G P W Z P Bu So
G C So Bu Z W Bl S P O
P Bl G So Bu S Z O C W
So Bu Z Z P Bl G O C S
Z G P So C S Bu W Bl O
Figure 1-3: Visual schematic of 2017 field layout. Each plot was randomly assigned a treatment and treatments are marked in each plot. Replicate blocks were each 10 plots long. Colored plots were flooded for the entire season and not used for data collection or analysis. Crop treatments included blank (Bl), butternut squash (Bu), zucchini squash (Z), watermelon (W), garden beans (G), soy beans (So), pepper (P), sunflower (S), corn (C), and oats (O). (not to scale)
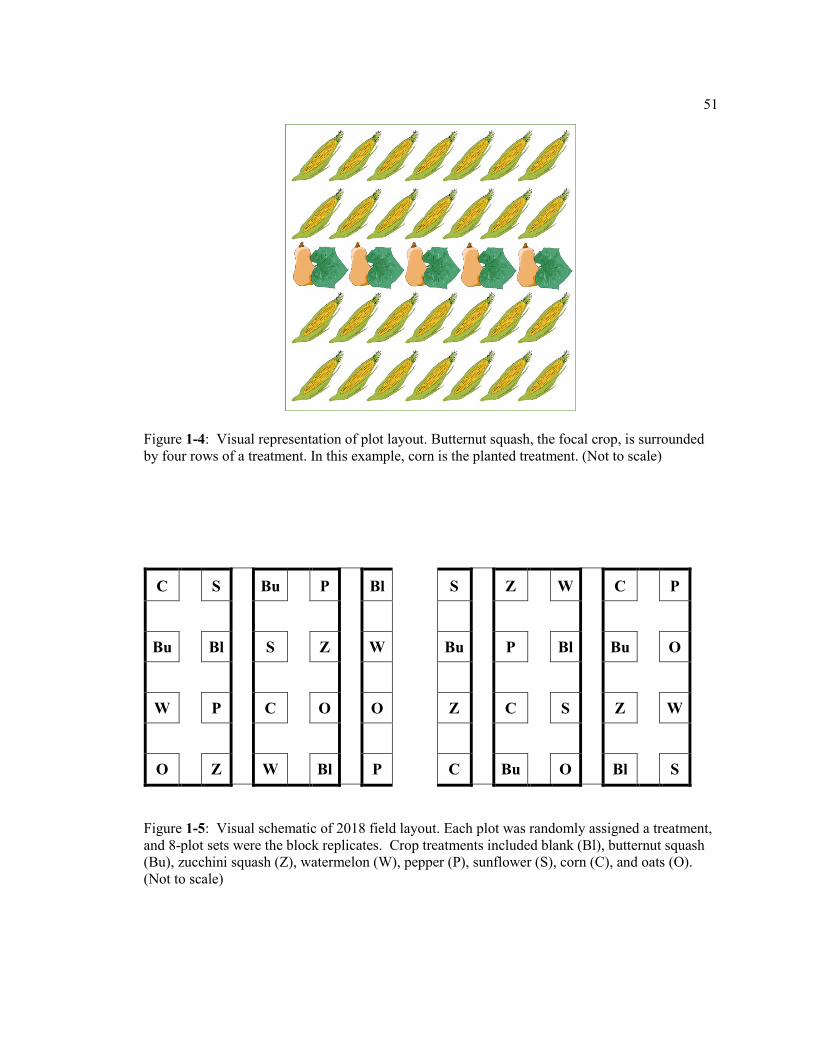
51
Figure 1-4: Visual representation of plot layout. Butternut squash, the focal crop, is surrounded by four rows of a treatment. In this example, corn is the planted treatment. (Not to scale)
C S Bu P Bl S Z W C P
Bu Bl S Z W Bu P Bl Bu O
W P C O O Z C S Z W
O Z W Bl P C Bu O Bl S
Figure 1-5: Visual schematic of 2018 field layout. Each plot was randomly assigned a treatment, and 8-plot sets were the block replicates. Crop treatments included blank (Bl), butternut squash (Bu), zucchini squash (Z), watermelon (W), pepper (P), sunflower (S), corn (C), and oats (O). (Not to scale)
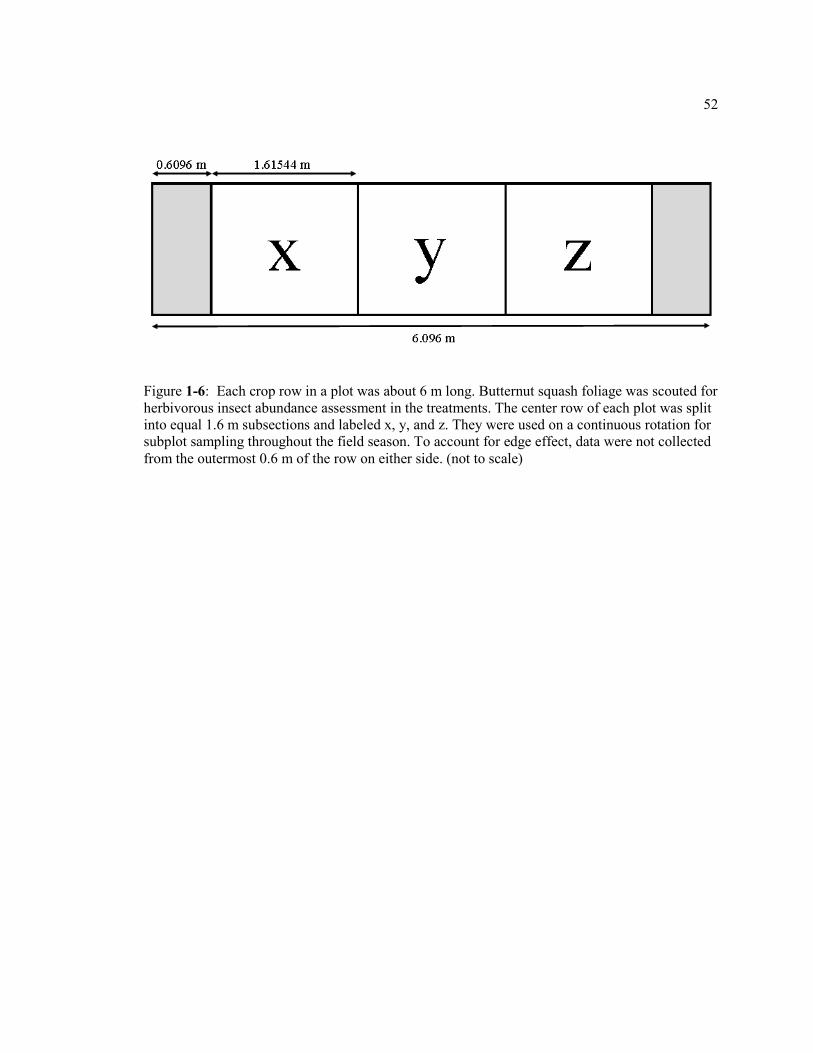
52
Figure 1-6: Each crop row in a plot was about 6 m long. Butternut squash foliage was scouted for herbivorous insect abundance assessment in the treatments. The center row of each plot was split into equal 1.6 m subsections and labeled x, y, and z. They were used on a continuous rotation for subplot sampling throughout the field season. To account for edge effect, data were not collected from the outermost 0.6 m of the row on either side. (not to scale)
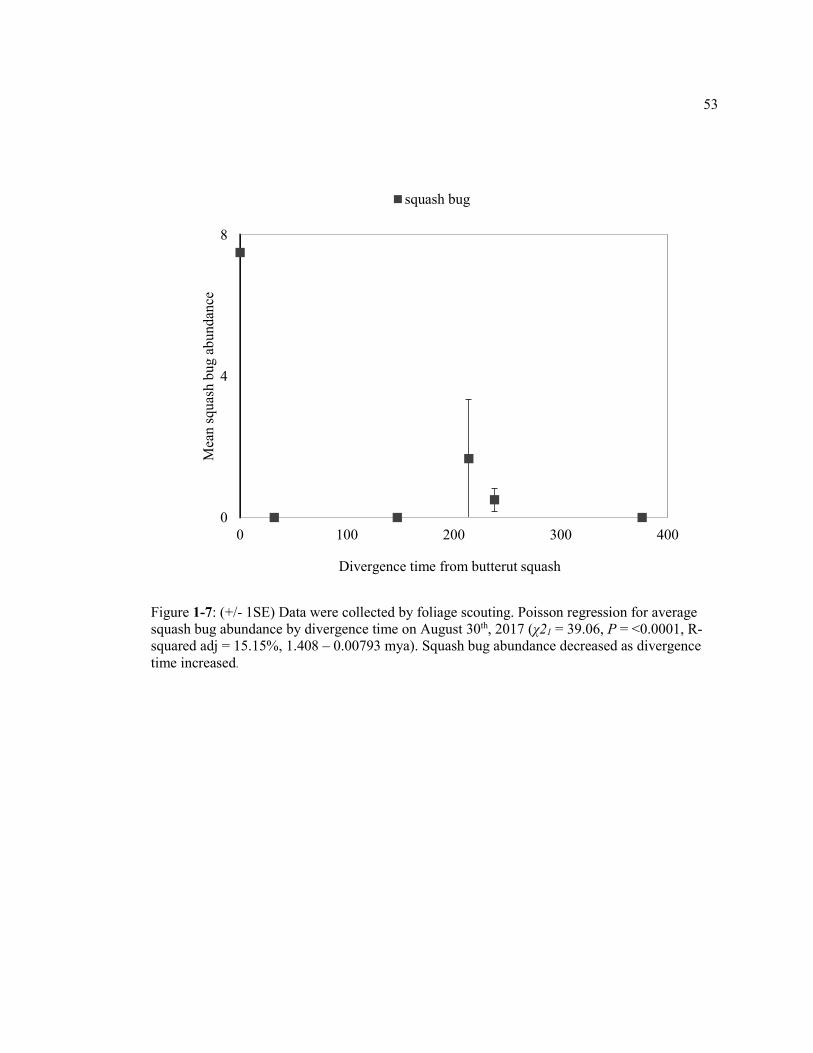
53
Figure 1-7: (+/- 1SE) Data were collected by foliage scouting. Poisson regression for average squash bug abundance by divergence time on August 30th, 2017 (χ21 = 39.06, P = <0.0001, R-squared adj = 15.15%, 1.408 – 0.00793 mya). Squash bug abundance decreased as divergence time increased.
0
4
8
0 100 200 300 400
Mea
n sq
uash
bug
abu
ndan
ce
Divergence time from butterut squash
squash bug
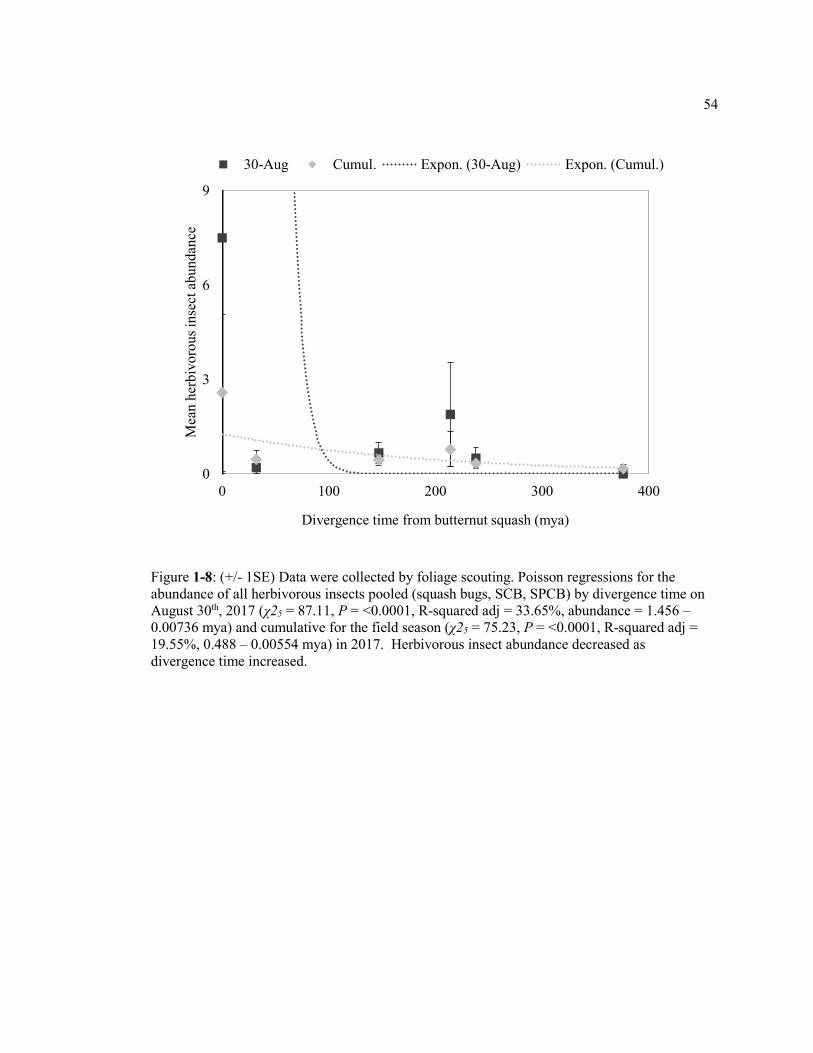
54
Figure 1-8: (+/- 1SE) Data were collected by foliage scouting. Poisson regressions for the abundance of all herbivorous insects pooled (squash bugs, SCB, SPCB) by divergence time on August 30th, 2017 (χ25 = 87.11, P = <0.0001, R-squared adj = 33.65%, abundance = 1.456 – 0.00736 mya) and cumulative for the field season (χ25 = 75.23, P = <0.0001, R-squared adj = 19.55%, 0.488 – 0.00554 mya) in 2017. Herbivorous insect abundance decreased as divergence time increased.
0
3
6
9
0 100 200 300 400
Mea
n he
rbiv
orou
s ins
ect a
bund
ance
Divergence time from butternut squash (mya)
30-Aug Cumul. Expon. (30-Aug) Expon. (Cumul.)

55
Figure 1-9: (+/- 1SE) Data were collected by foliage scouting. Regressions for the abundance of striped cucumber beetle (SCB) by divergence time on July 19th (F1 = 4.69, P = 0.038, R-squared = 12.79%, abundance = 2.831 + 0.00702 mya), August 6th (F1 = 46.71, P = <0.0001, R-squared = 58.60%, abundance = 6.992 – 0.01275 mya), and August 28th (χ21 = 5.67, P = 0.017, R-squared = 8.29%, abundance = 0.598 – 0.00303 mya) in 2018. SCB abundance increased as divergence time increased on July 19th. SCB abundance decreased as divergence time increased on August 6th and August 28th.
0
4
8
0 100 200 300 400
Mea
n SC
B a
bund
ance
Divergence time from butternut squash (mya)
19-Jul 6-Aug 28-AugLinear (19-Jul) Linear (6-Aug)
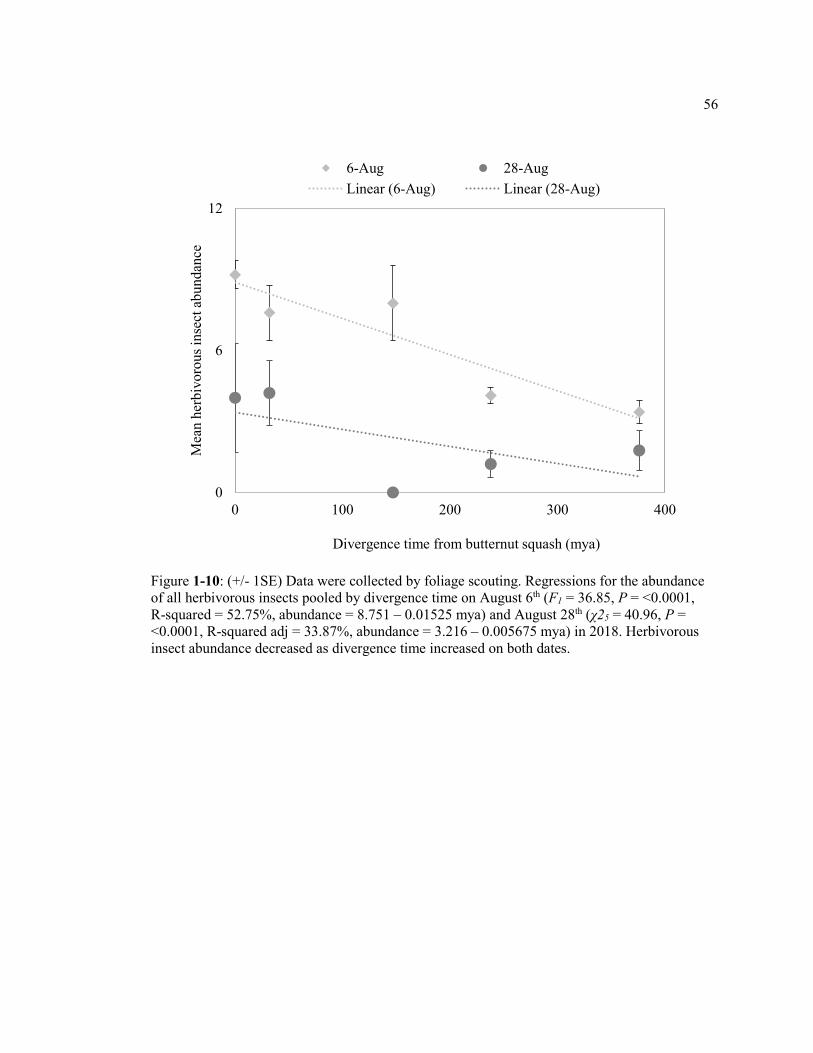
56
Figure 1-10: (+/- 1SE) Data were collected by foliage scouting. Regressions for the abundance of all herbivorous insects pooled by divergence time on August 6th (F1 = 36.85, P = <0.0001, R-squared = 52.75%, abundance = 8.751 – 0.01525 mya) and August 28th (χ25 = 40.96, P = <0.0001, R-squared adj = 33.87%, abundance = 3.216 – 0.005675 mya) in 2018. Herbivorous insect abundance decreased as divergence time increased on both dates.
0
6
12
0 100 200 300 400
Mea
n he
rbiv
orou
s ins
ect a
bund
ance
Divergence time from butternut squash (mya)
6-Aug 28-AugLinear (6-Aug) Linear (28-Aug)

57
Figure 1-11: (+/- 1SE) Data were collected by flower scouting. Poisson regression for the abundance of cucumber beetles (SCB, SPCB) by divergence time cumulative for the field season (χ22 = 19.32, P = <0.0001, R-squared adj = 5.14%) in 2017. Cucumber beetle abundance did not appear greatly change in response to divergence time despite significance and explained variance for effect of divergence time alone was very low (χ22 = 10.52, P = 0.001, R-squared adj = 3.12%, abundance = 0.683 – 0.002268 mya).
0
0.5
1
1.5
2
0 100 200 300 400
Mea
n cu
cum
ber b
eetle
abu
ndan
ce
Divergence time from butternut squash (mya)
cucumber beetles Expon. (cucumber beetles)

58
Figure 1-12: (+/- 1SE) Data were collected by flower scouting. Poisson regressions for the abundance of beetles (SCB, SPCB, WCR) by divergence time on August 6th (χ26 = 46.32, P = <0.0001, R-squared adj = 43.34%, abundance = 2.4222 – 0.000736 mya) and cumulative for the field season, but only when number of flowers per plot was included in the model (flowers included: χ26 = 191.53, P = <0.0001, R-squared adj = 43.50%; flowers not included: χ21= 0.10, P = 0.752, R-squared adj = 0.02%, abundance = 2.2753 – 0.000079 mya) in 2018. Beetle abundance decreased as divergence time increased on August 6th. Beetle abundance did not appear to change in response to divergence time for the season, and instead was mainly influenced by number of flowers per plot.
0
5
10
15
20
0 100 200 300 400
Mea
n be
etle
abu
ndan
ce
Divergence time from butternut squash (mya)
6-Aug cumulativeExpon. (6-Aug) Expon. (cumulative)
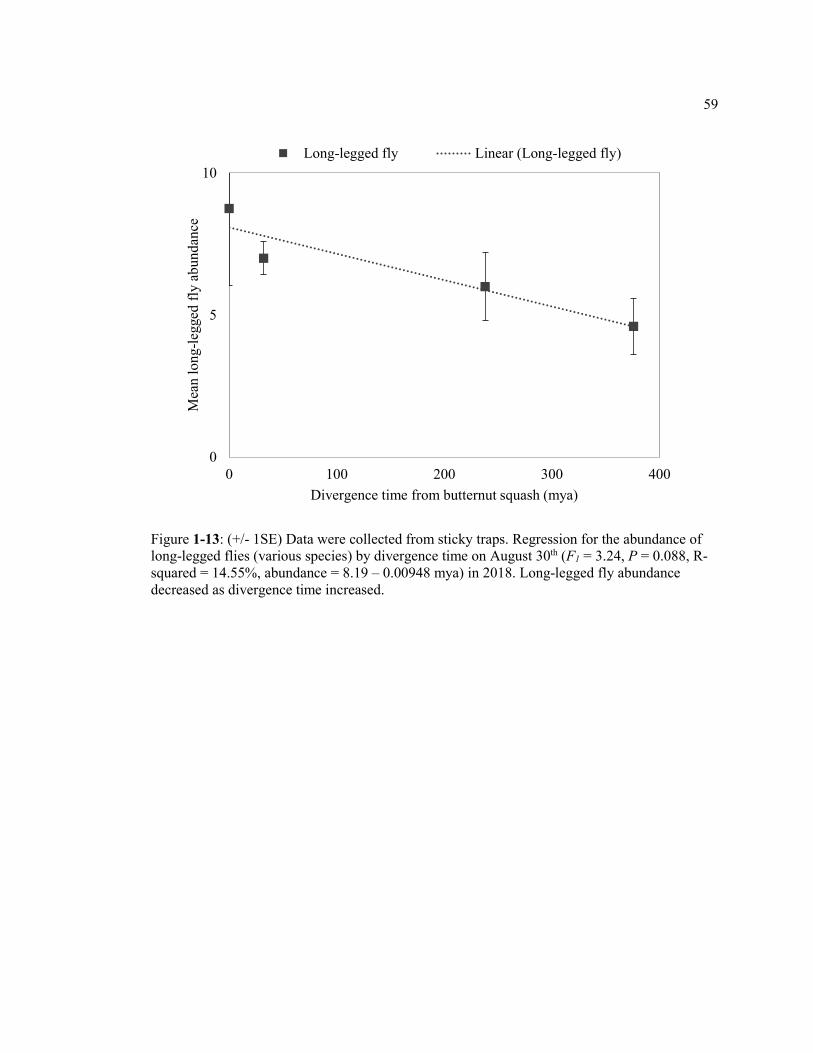
59
Figure 1-13: (+/- 1SE) Data were collected from sticky traps. Regression for the abundance of long-legged flies (various species) by divergence time on August 30th (F1 = 3.24, P = 0.088, R-squared = 14.55%, abundance = 8.19 – 0.00948 mya) in 2018. Long-legged fly abundance decreased as divergence time increased.
0
5
10
0 100 200 300 400
Mea
n lo
ng-le
gged
fly
abun
danc
e
Divergence time from butternut squash (mya)
Long-legged fly Linear (Long-legged fly)

60
Figure 1-14: (+/- 1SE) Data were collected from sticky traps. Regressions for the abundance of striped cucumber beetle by divergence time on June 28th (F1 = 16.94, P = <0.0001, R-squared = 33.93%, abundance = 11.14 – 0.01907 mya) and August 30th (F1 = 7.10, P = 0.015, R-squared = 27.20%, abundance = 7.280 – 0.00944 mya) in 2018. SCB abundance decreased as divergence time increased, and regression slope was larger on June 28th.
0
5
10
15
0 100 200 300 400
Mea
n SC
B a
bund
ance
Divergence time from butternut squash (mya)
28-Jun 30-Aug Linear (28-Jun) Linear (30-Aug)
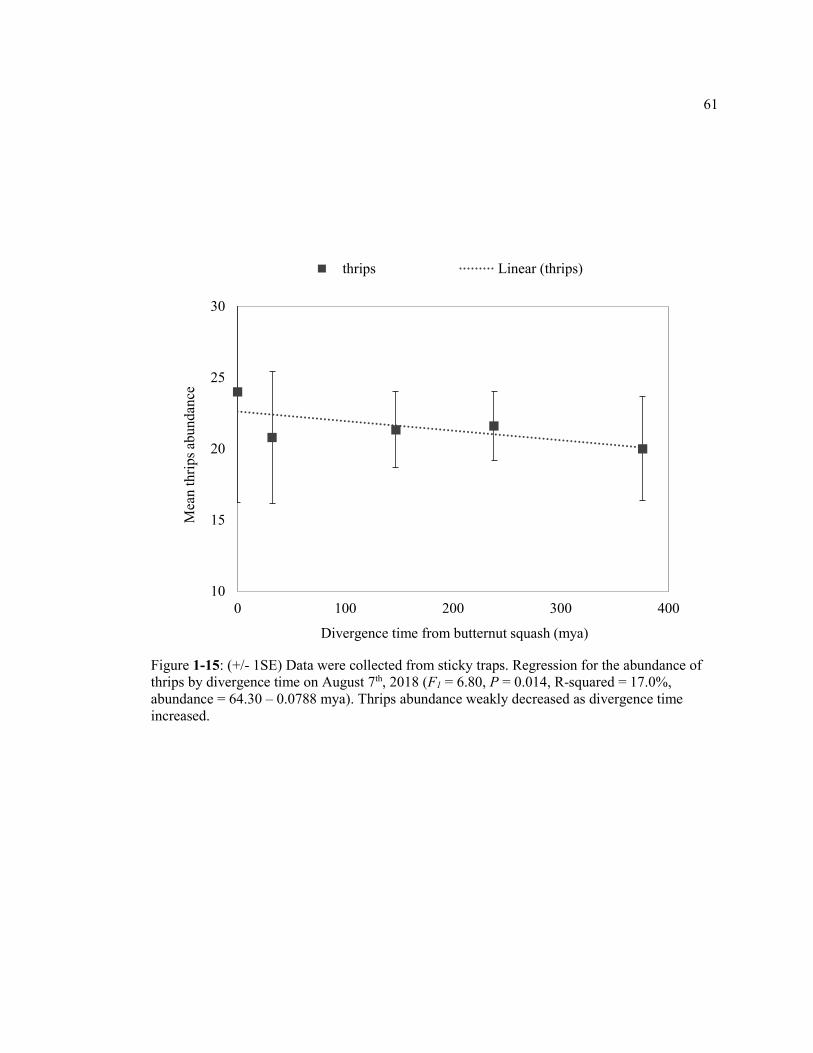
61
Figure 1-15: (+/- 1SE) Data were collected from sticky traps. Regression for the abundance of thrips by divergence time on August 7th, 2018 (F1 = 6.80, P = 0.014, R-squared = 17.0%, abundance = 64.30 – 0.0788 mya). Thrips abundance weakly decreased as divergence time increased.
10
15
20
25
30
0 100 200 300 400
Mea
n th
rips a
bund
ance
Divergence time from butternut squash (mya)
thrips Linear (thrips)
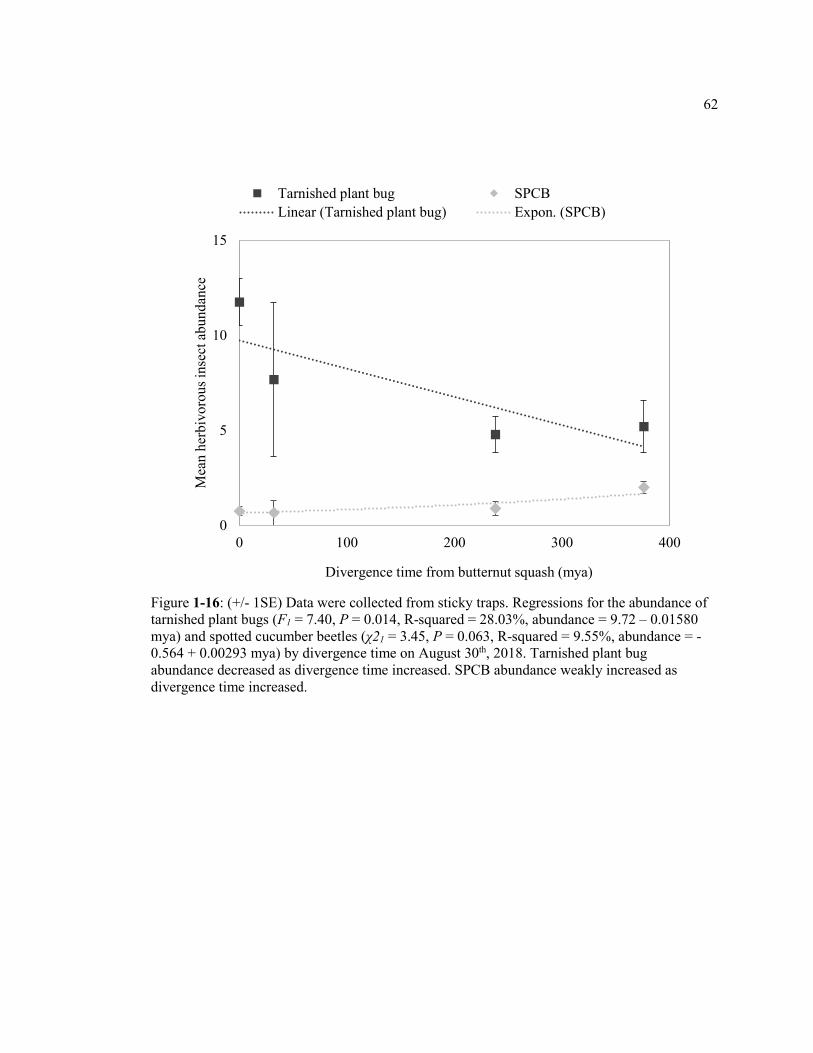
62
Figure 1-16: (+/- 1SE) Data were collected from sticky traps. Regressions for the abundance of tarnished plant bugs (F1 = 7.40, P = 0.014, R-squared = 28.03%, abundance = 9.72 – 0.01580 mya) and spotted cucumber beetles (χ21 = 3.45, P = 0.063, R-squared = 9.55%, abundance = -0.564 + 0.00293 mya) by divergence time on August 30th, 2018. Tarnished plant bug abundance decreased as divergence time increased. SPCB abundance weakly increased as divergence time increased.
0
5
10
15
0 100 200 300 400
Mea
n he
rbiv
orou
s ins
ect a
bund
ance
Divergence time from butternut squash (mya)
Tarnished plant bug SPCBLinear (Tarnished plant bug) Expon. (SPCB)
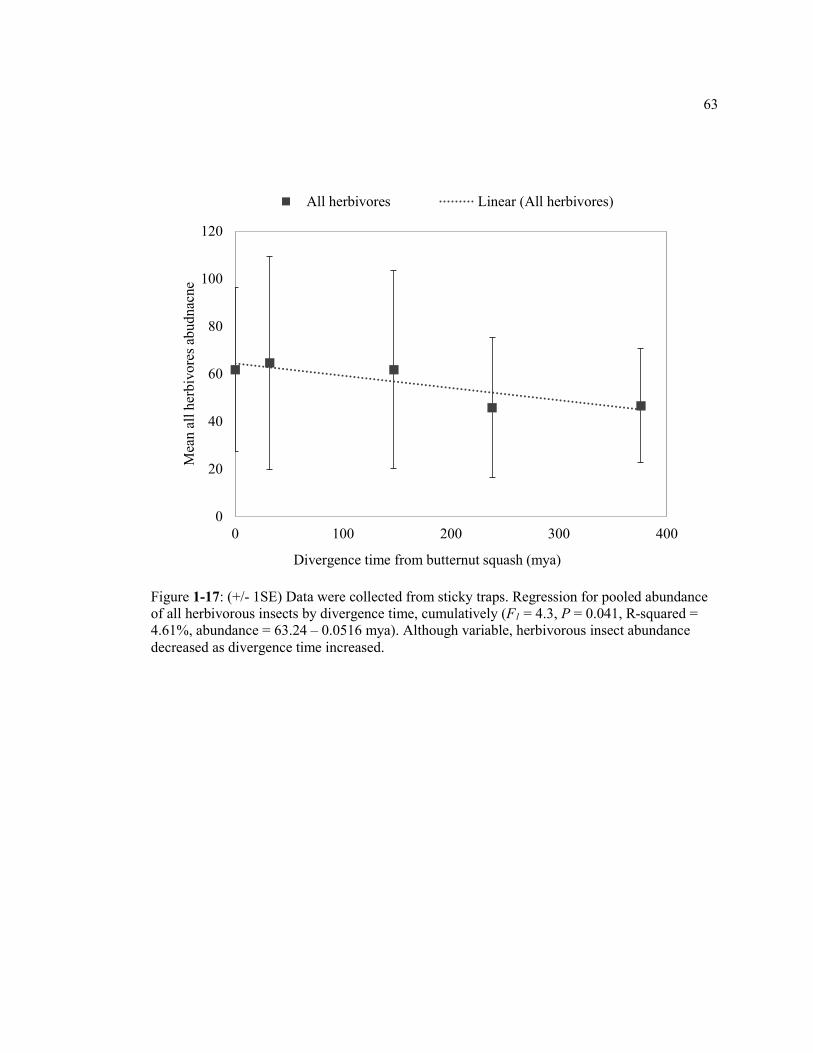
63
Figure 1-17: (+/- 1SE) Data were collected from sticky traps. Regression for pooled abundance of all herbivorous insects by divergence time, cumulatively (F1 = 4.3, P = 0.041, R-squared = 4.61%, abundance = 63.24 – 0.0516 mya). Although variable, herbivorous insect abundance decreased as divergence time increased.
0
20
40
60
80
100
120
0 100 200 300 400
Mea
n al
l her
bivo
res a
budn
acne
Divergence time from butternut squash (mya)
All herbivores Linear (All herbivores)
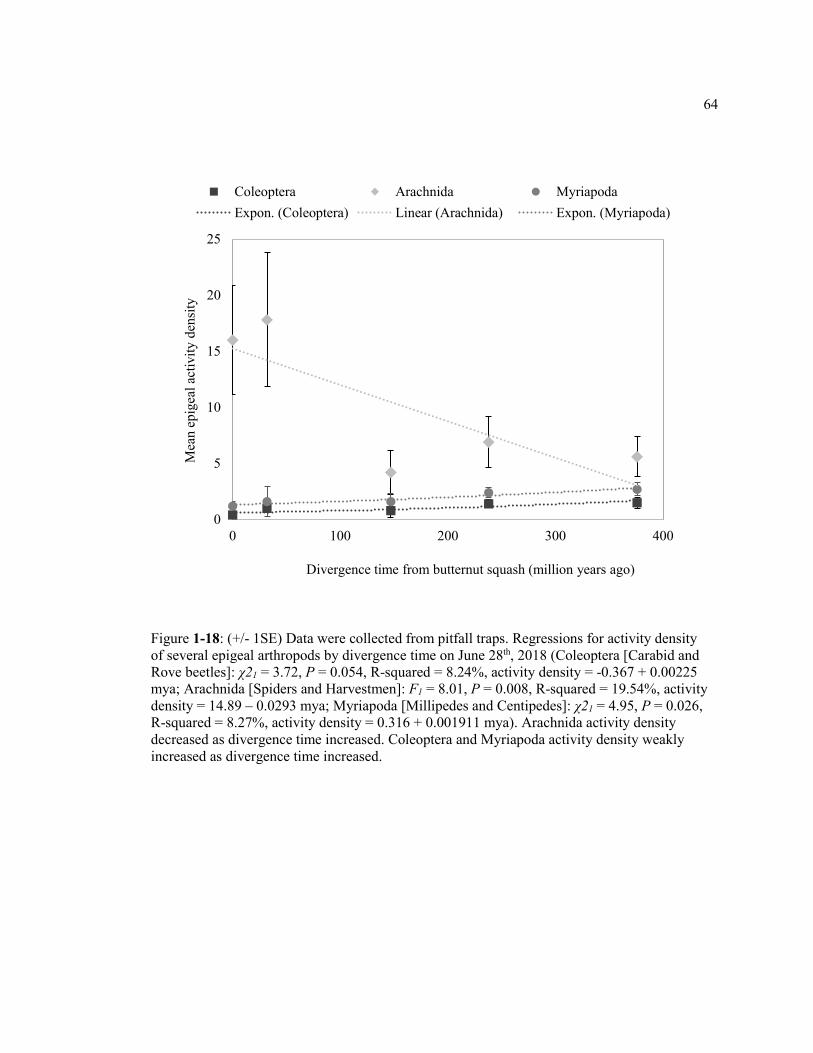
64
Figure 1-18: (+/- 1SE) Data were collected from pitfall traps. Regressions for activity density of several epigeal arthropods by divergence time on June 28th, 2018 (Coleoptera [Carabid and Rove beetles]: χ21 = 3.72, P = 0.054, R-squared = 8.24%, activity density = -0.367 + 0.00225 mya; Arachnida [Spiders and Harvestmen]: F1 = 8.01, P = 0.008, R-squared = 19.54%, activity density = 14.89 – 0.0293 mya; Myriapoda [Millipedes and Centipedes]: χ21 = 4.95, P = 0.026, R-squared = 8.27%, activity density = 0.316 + 0.001911 mya). Arachnida activity density decreased as divergence time increased. Coleoptera and Myriapoda activity density weakly increased as divergence time increased.
0
5
10
15
20
25
0 100 200 300 400
Mea
n ep
igea
l act
ivity
den
sity
Divergence time from butternut squash (million years ago)
Coleoptera Arachnida MyriapodaExpon. (Coleoptera) Linear (Arachnida) Expon. (Myriapoda)

65
Figure 1-19: (+/- 1SE) Data were collected from pitfall traps. Poisson regressions for activity density of Coleoptera (χ21 = 4.16, P = 0.042, R-squared = 9.01%, activity density = -0.213 – 0.00387 mya) and Myriapoda (χ25 = 36.31, P = 0.007, R-squared = 30.77%, activity density = 1.465 – 0.001851 mya) by divergence time on July 30th, 2018. Both Coleoptera ad Myriapoda activity density decreased as divergence time increased, although Coleoptera had a weaker response than Myriapoda.
0
3
6
0 100 200 300 400
Mea
n ep
igea
l act
ivity
den
sity
Divergence time from butternut squash (mya)
Coleoptera MyriapodaExpon. (Coleoptera) Expon. (Myriapoda)

66
Figure 1-20: (+/- 1SE) Data were collected from pitfall traps. Regression for activity density of Arachnida by divergence time, cumulatively (F1 = 6.56, P = 0.012, R-squared = 6.12%, activity density = 8.42 – 0.01295 mya). Although there was some variability, Arachnida activity density decreased as divergence time increased.
0
5
10
15
0 100 200 300 400
Mea
n A
rach
nida
act
ivity
den
sity
Divergence time from butternut squash (mya)
Arachnida Linear (Arachnida)

67
Figure 1-21: 2018 average herbivorous insect abundance per plot on sticky traps (top) and foliage (bottom). In crop treatments, sunflower had the lowest average activity density. Foliar abundances were counted on the center row of butternut squash, and sticky traps were placed in the approximate center of the focal crop center row (butternut squash).
0
50
100
150
200
28-Jun 7-Aug 30-Aug
Mea
n he
rbiv
ore
abun
danc
e: st
icky
trap
s butternut sqwatermelonzucchinipeppersunflowercornoats
0
4
8
12
21-Jun 3-Jul 19-Jul 6-Aug 28-Aug
Mea
n he
rbiv
ore
abun
danc
e: fo
laig
e

68
Chapter 2
An explorative survey on the parasites and parasitoids of striped
cucumber beetle (Acalymma vittatum) in Pennsylvania
Introduction
The striped cucumber beetle (SCB; Chrysomelidae (Diabroticina): Acalymma vittatum) is
a major pest of cucurbit crops in eastern North America. Early studies conservatively estimated
that SCB infestations reduce yield potential by as much as 50% (Balduf 1925). Despite its
economic importance, there is a poor understanding of the natural enemy species that help limit
adult SCB populations, which feed upon entire cucurbit plants and transmit the serious pathogen
Erwinia tracheiphila (Rojas et al. 2015). Although literature lacks details on the level of control
many natural enemies provide, predators from 35 families (12 orders) are known to attack
Diabroticina beetles (Balduf 1925, Toepfer et al. 2009). Some predators identified attacking SCB
include insectivorous birds, solider beetles (Cantharidae: Chauliognathus pensylvanicus), ambush
bugs (Reduviidae: Phymata pennsylvanica), ants, mites, spiders, and carabid beetles (Balduf
1925, Toepfer et al. 2009). In addition to predators, parasitic species, including protists,
nematodes, and insects, will also attack SCB, but our understanding of the ecology of its
parasitoids and parasites is limited. Gregarine protists (Apicomplexa: Eugregarinorida) can be
found in adults (Balduf 1925, Toepfer et al. 2009). Generally, gregarines are believed to be a low-
impact burden on their invertebrate hosts, which may experience reduced size, longevity,
mobility, and higher mortality under poor-nutrient conditions (Lange and Lord 2012, Schilder and
Stewart 2019); however, their effects specifically on SCB are unknown. At least four species of
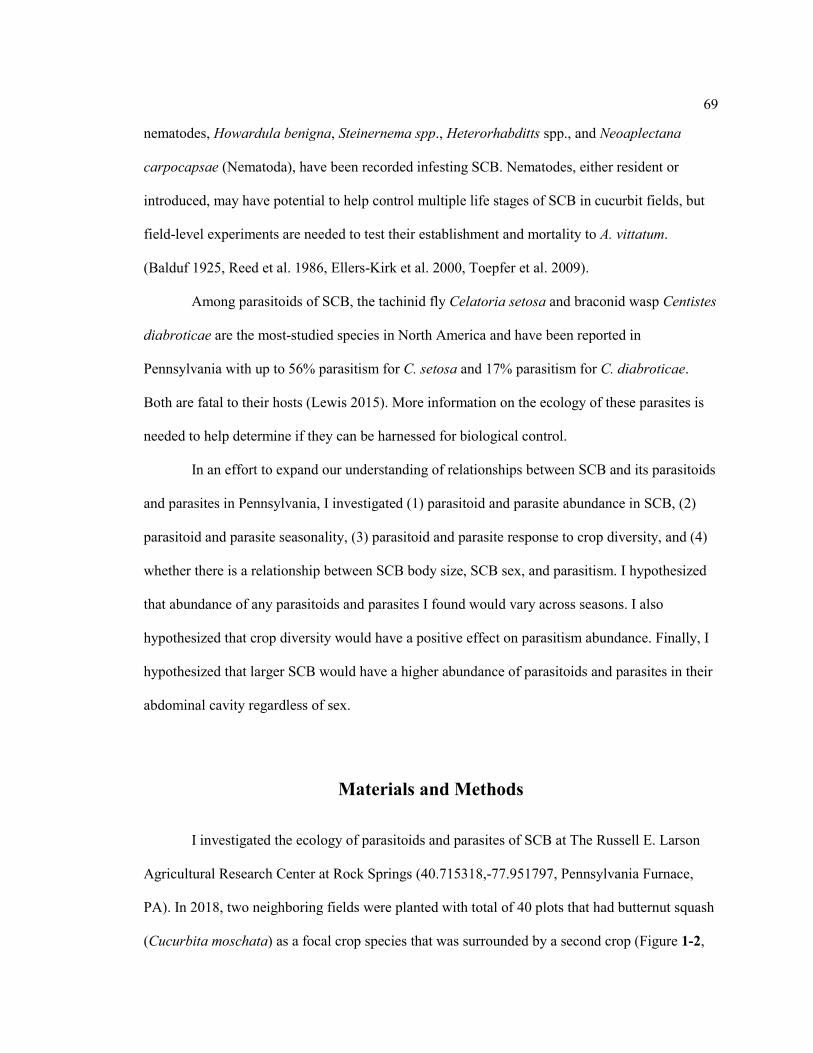
69
nematodes, Howardula benigna, Steinernema spp., Heterorhabditts spp., and Neoaplectana
carpocapsae (Nematoda), have been recorded infesting SCB. Nematodes, either resident or
introduced, may have potential to help control multiple life stages of SCB in cucurbit fields, but
field-level experiments are needed to test their establishment and mortality to A. vittatum.
(Balduf 1925, Reed et al. 1986, Ellers-Kirk et al. 2000, Toepfer et al. 2009).
Among parasitoids of SCB, the tachinid fly Celatoria setosa and braconid wasp Centistes
diabroticae are the most-studied species in North America and have been reported in
Pennsylvania with up to 56% parasitism for C. setosa and 17% parasitism for C. diabroticae.
Both are fatal to their hosts (Lewis 2015). More information on the ecology of these parasites is
needed to help determine if they can be harnessed for biological control.
In an effort to expand our understanding of relationships between SCB and its parasitoids
and parasites in Pennsylvania, I investigated (1) parasitoid and parasite abundance in SCB, (2)
parasitoid and parasite seasonality, (3) parasitoid and parasite response to crop diversity, and (4)
whether there is a relationship between SCB body size, SCB sex, and parasitism. I hypothesized
that abundance of any parasitoids and parasites I found would vary across seasons. I also
hypothesized that crop diversity would have a positive effect on parasitism abundance. Finally, I
hypothesized that larger SCB would have a higher abundance of parasitoids and parasites in their
abdominal cavity regardless of sex.
Materials and Methods
I investigated the ecology of parasitoids and parasites of SCB at The Russell E. Larson
Agricultural Research Center at Rock Springs (40.715318,-77.951797, Pennsylvania Furnace,
PA). In 2018, two neighboring fields were planted with total of 40 plots that had butternut squash
(Cucurbita moschata) as a focal crop species that was surrounded by a second crop (Figure 1-2,
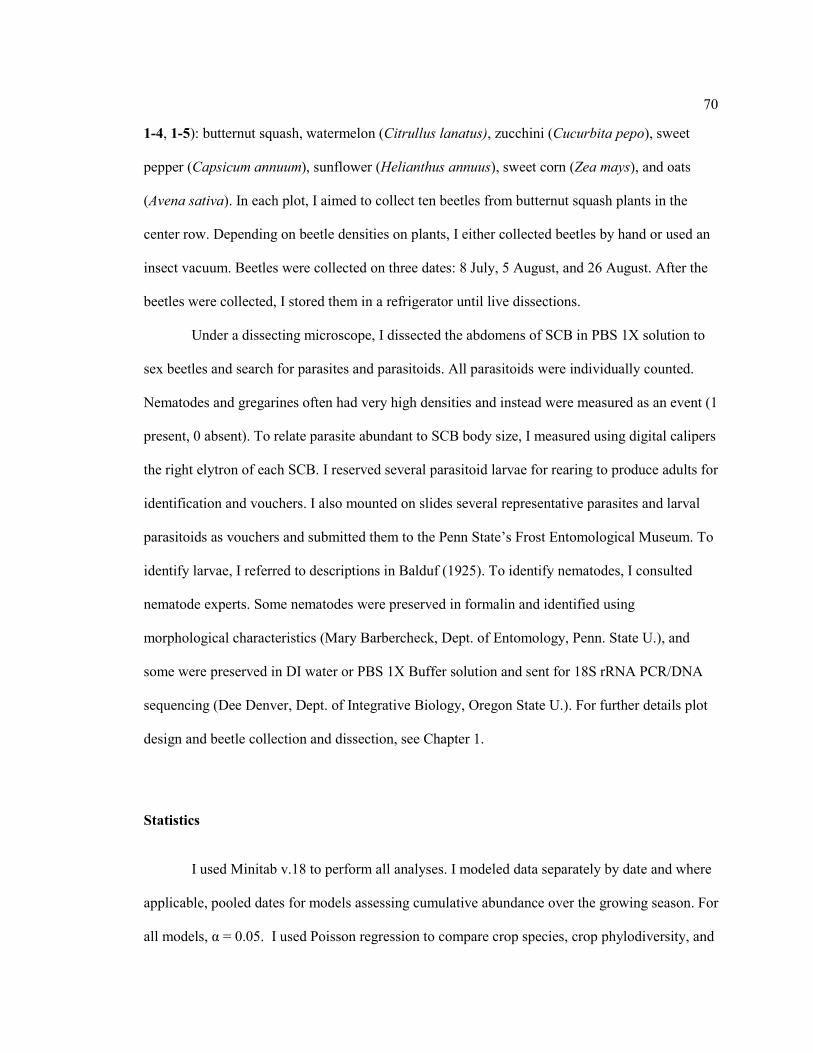
70
1-4, 1-5): butternut squash, watermelon (Citrullus lanatus), zucchini (Cucurbita pepo), sweet
pepper (Capsicum annuum), sunflower (Helianthus annuus), sweet corn (Zea mays), and oats
(Avena sativa). In each plot, I aimed to collect ten beetles from butternut squash plants in the
center row. Depending on beetle densities on plants, I either collected beetles by hand or used an
insect vacuum. Beetles were collected on three dates: 8 July, 5 August, and 26 August. After the
beetles were collected, I stored them in a refrigerator until live dissections.
Under a dissecting microscope, I dissected the abdomens of SCB in PBS 1X solution to
sex beetles and search for parasites and parasitoids. All parasitoids were individually counted.
Nematodes and gregarines often had very high densities and instead were measured as an event (1
present, 0 absent). To relate parasite abundant to SCB body size, I measured using digital calipers
the right elytron of each SCB. I reserved several parasitoid larvae for rearing to produce adults for
identification and vouchers. I also mounted on slides several representative parasites and larval
parasitoids as vouchers and submitted them to the Penn State’s Frost Entomological Museum. To
identify larvae, I referred to descriptions in Balduf (1925). To identify nematodes, I consulted
nematode experts. Some nematodes were preserved in formalin and identified using
morphological characteristics (Mary Barbercheck, Dept. of Entomology, Penn. State U.), and
some were preserved in DI water or PBS 1X Buffer solution and sent for 18S rRNA PCR/DNA
sequencing (Dee Denver, Dept. of Integrative Biology, Oregon State U.). For further details plot
design and beetle collection and dissection, see Chapter 1.
Statistics
I used Minitab v.18 to perform all analyses. I modeled data separately by date and where
applicable, pooled dates for models assessing cumulative abundance over the growing season. For
all models, α = 0.05. I used Poisson regression to compare crop species, crop phylodiversity, and

71
sampling dates for parasitoid and parasite abundance. Replicates and crops were designated as
categorical variables and divergence time and number of beetles dissected per plot were
designated as continuous variables. I used a two-sample t-test to compare the number of male and
female beetles collected, and to compare beetle sex to elytron length. I used binary logistic
regression to compare parasites and parasitoids with beetle sex. I used linear regression to
compare elytron length with the mean total number of parasitic organisms per beetle abdomen.
Because parasitism rates of newly-ecdysized SCB were much lower than mature adults, they were
excluded from analyses.
Results
I collected an average of 8.5 beetles per plot throughout the season for a total of 848
beetles collected. When I dissected SCB, I found that 348 were parasitized (41.0%; 124 females,
221 males, 3 unknown). Among the parasitized SCB, 103 had at least two different species in
their abdomens. I found nematodes (Figure 2-1), the most abundant parasites, in 208 beetles
(~25% and 60% of collected and infested beetles, respectfully), tachinid larvae (Figure 2-2) in 76
beetles (~9% and 22%), braconid larvae (Figure 2-3) in 84 beetles (~10% and 24%), and braconid
eggs (Figure 2-4) in 91 beetles (~11% and 26%). The maximum number of tachinid larvae in one
SCB was five, and the maximum number of braconid larvae in one SCB was seven. The number
of female and male beetles collected were different overall (H₀: μ₁ - µ₂ = 0; T-Value = -6.78, DF =
191, P-Value = <0.0001), with a total of 319 females and 526 males (Table 2-1, Figure 2-5). To
the best of my knowledge, Figure 2-4 contains the first published digital images of a C.
diabroticae egg.
Among the parasitized beetles, about ~36% were female and ~64% were male, and
parasitized females on average were larger than parasitized males (H₀: μ₁ - µ₂ = 0; T227= 5.37, P-

72
Value = <0.0001; Table 2-1, Figure 2-6). Although smaller than female beetles, male beetles had
more parasitic organisms per beetle than female beetles (χ21 = 4.53, P-value = 0.033; Y = 0.153 +
0.301 total parasitic organisms; Figure 2-7) and elytron length was not a significant predictor of
the number of parasitic organisms per beetle host (F1 = 2.15, P-Value = 0.144; Table 2-1).
Additional comparisons between each common parasitic organism and the beetle sex of hosts
revealed that tachinids had a preference for male beetles but braconids and nematodes had no
preference for either sex: tachinids: (χ21 = 3.94, P-value = 0.047; Y = 0.471 + 0.470 tachinids);
braconids: (χ21 = 02.42, P-value = 0.120); nematodes: (χ21 = 0.36, P-value = 0.551; Figure 2-7,
Table 2-1). I also found that elytron length was not a predictor of tachinid parasitism among
parasitized beetles (χ21 =0.030, P-value = 0.585). Tachinids and braconids responded to
phylodiversity, but nematodes did not (Figure 2-8, 2-9; see Chapter 1).
Collection date of SCB significantly influenced abundance of all common parasitoids and
parasites (F2 = 16.77, P-value = <0.0001; Figure 2-10). Only on 10 July did all plots have
parasitized beetles: (10 July: Max 100%, Min 28.57%, average 50.72%; 7 August: Max 50%,
Min 0%, average 23.07%; 30 August: Max 100%, Min 0%, average 57.08%). Seasonal
abundances of total parasites and parasitoids in SCB appeared to an inverse relationship with
seasonal abundances of SCB (see Chapter 1 for details on SCB data collection; Figure 2-10).
Both the phylogenetic relatedness of neighboring plants and species of crops did not
influence parasitism of SCB (Table 2-2). Overall, parasitism was highest in the butternut squash
monoculture (mean = 6.20) and lowest in the watermelon intercrop (mean = 3.84), and there was
a lot of variability (Table 2-2).
I was able to identify tachinid larvae (C. setosa) and braconid larvae (C. diabroticae)
using Balduf (1925). I identified braconid eggs by comparing their morphology with the other
known parasitoids of SCB and referred to limited descriptions (Smythe and Hoffman 2009). I
also identified gregarines and horsehair worm using online resources and articles (Rueckert 2008,
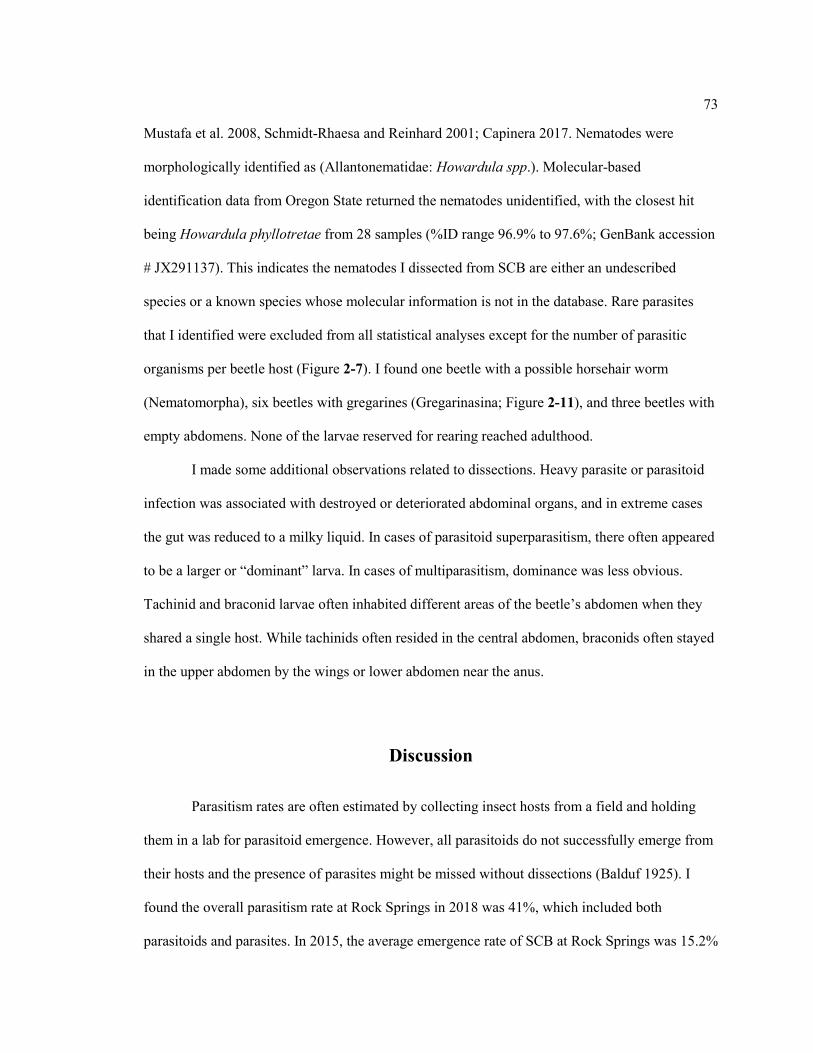
73
Mustafa et al. 2008, Schmidt-Rhaesa and Reinhard 2001; Capinera 2017. Nematodes were
morphologically identified as (Allantonematidae: Howardula spp.). Molecular-based
identification data from Oregon State returned the nematodes unidentified, with the closest hit
being Howardula phyllotretae from 28 samples (%ID range 96.9% to 97.6%; GenBank accession
# JX291137). This indicates the nematodes I dissected from SCB are either an undescribed
species or a known species whose molecular information is not in the database. Rare parasites
that I identified were excluded from all statistical analyses except for the number of parasitic
organisms per beetle host (Figure 2-7). I found one beetle with a possible horsehair worm
(Nematomorpha), six beetles with gregarines (Gregarinasina; Figure 2-11), and three beetles with
empty abdomens. None of the larvae reserved for rearing reached adulthood.
I made some additional observations related to dissections. Heavy parasite or parasitoid
infection was associated with destroyed or deteriorated abdominal organs, and in extreme cases
the gut was reduced to a milky liquid. In cases of parasitoid superparasitism, there often appeared
to be a larger or “dominant” larva. In cases of multiparasitism, dominance was less obvious.
Tachinid and braconid larvae often inhabited different areas of the beetle’s abdomen when they
shared a single host. While tachinids often resided in the central abdomen, braconids often stayed
in the upper abdomen by the wings or lower abdomen near the anus.
Discussion
Parasitism rates are often estimated by collecting insect hosts from a field and holding
them in a lab for parasitoid emergence. However, all parasitoids do not successfully emerge from
their hosts and the presence of parasites might be missed without dissections (Balduf 1925). I
found the overall parasitism rate at Rock Springs in 2018 was 41%, which included both
parasitoids and parasites. In 2015, the average emergence rate of SCB at Rock Springs was 15.2%

74
with C. setosa and C. diabroticae accounting for 6.5% and 8.3%, respectively (Lewis 2015). This
average parasitism rate determined by emergence was similar to my average parasitism rate by
dissections, which was about 19% overall (C. setosa: 9%; C. diabroticae: 10%). However, I also
found that nematodes accounted for more parasitism than tachinids and braconids combined.
Although C. setosa and C. diabroticae have been some-what studied for biocontrol of
beetles (Lewis 2015), I could not find any records of studies investigating entomopathogenic
nematodes attacking adults in the field except for Balduf (1925). Nematodes are already used to
control larvae (Ellers-Kirk 2000) and are known to cause mortality in beetles (Balduf 1925), so
using them to control multiple life stages of SCB seems plausible. I also found that SCB and its
parasitoids and parasites appear to be density-dependent. My observed parasite and parasitoid
abundances inversely correlated with SCB abundances throughout the season (Figure 2-10).
Understanding this relationship between natural enemies and their hosts may help growers to plan
when they can take advantage of natural enemies for pest control and when they might need to
use insecticides. Overall, using dissections as a method to study parasitism in insect hosts is likely
helpful for identifying novel natural enemies that can be used for biocontrol, and for
understanding the relationships between natural enemies and their hosts.
Elytron length of SCB was not a predictor of parasitism, but beetle sex was.
Although female beetles were larger than male beetles throughout the season, males on average
were more likely parasitized and had more total parasitoids and parasites than females. Because
this relationship is related to beetle gender but not beetle size, male SCB behavior or body
condition might make it more susceptible to parasitism. Sex-biased parasitism has been observed
in other insects such as damselflies (Córdoba-Aguilar 2013), whirligig beetles (Fairn et al. 2008),
and scarab beetles (Walker and Allen 2013). Although braconids and nematodes did not appear to
have a sex preference, tachinid larvae were significantly more abundant in male beetles, but did
not respond based on elytron length. Additionally, Tachinid flies might sense specific cues that

75
make male SCB more attractive as a host. Only male SCB are known to release aggregation
pheromones and attract conspecifics (Smyth and Hoffmann 2003), so testing whether C. setosa
responds to male SCB pheromones would help unveil why it parasitizes males over females.
Because gregarines are small and I didn’t initially know the frequency or level of
infection I would find, I suspect that my gregarine values might be erroneously low.
Conclusion
I found that the abundances of parasitoids and parasites of SCB vary across the season
and may be inversely correlated with SCB abundance. Within abdominal cavities of SCB, I
identified two parasitoids, the tachinid fly Celatoria setosa and the braconid wasp Centistes
diabroticae, and three parasites, nematodes (Howardula spp.), gregarines (Gregarinasina), and a
possible horsehair worm (Nematomorpha). Male SCB were smaller than females but more likely
parasitized and had more total parasitoids and parasites. Parasitoids were negatively associated
crop diversity. These findings provide an update to early studies (Badluf 1925) and introduce
some novel findings on the behavior and ecology of parasitoids and parasites of SCB that may be
useful for designing more ecologically minded control of SCB.
References
Balduf, W. V. 1925. The striped cucumber beetle (Diabrotica vittata)its biology; Bulletin of the Ohio
Agricultural experiment station no. 388.
Capinera, John L. 1999. Revised June 2017. Horsehair worms. https://entnemdept.ifas.ufl.edu/
creatures/misc/horsehair_worms.htm in Featured Creatures https://entnemdept.ifas.ufl.edu/creatures/
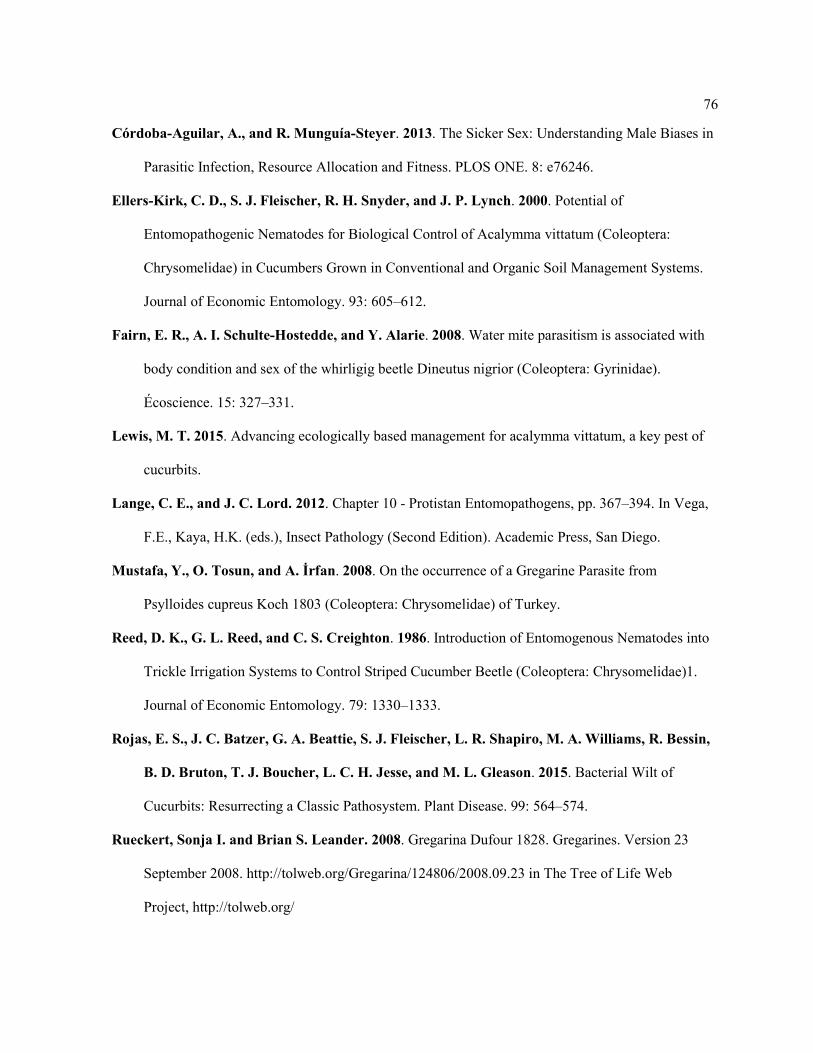
76
Córdoba-Aguilar, A., and R. Munguía-Steyer. 2013. The Sicker Sex: Understanding Male Biases in
Parasitic Infection, Resource Allocation and Fitness. PLOS ONE. 8: e76246.
Ellers-Kirk, C. D., S. J. Fleischer, R. H. Snyder, and J. P. Lynch. 2000. Potential of
Entomopathogenic Nematodes for Biological Control of Acalymma vittatum (Coleoptera:
Chrysomelidae) in Cucumbers Grown in Conventional and Organic Soil Management Systems.
Journal of Economic Entomology. 93: 605–612.
Fairn, E. R., A. I. Schulte-Hostedde, and Y. Alarie. 2008. Water mite parasitism is associated with
body condition and sex of the whirligig beetle Dineutus nigrior (Coleoptera: Gyrinidae).
Écoscience. 15: 327–331.
Lewis, M. T. 2015. Advancing ecologically based management for acalymma vittatum, a key pest of
cucurbits.
Lange, C. E., and J. C. Lord. 2012. Chapter 10 - Protistan Entomopathogens, pp. 367–394. In Vega,
F.E., Kaya, H.K. (eds.), Insect Pathology (Second Edition). Academic Press, San Diego.
Mustafa, Y., O. Tosun, and A. İrfan. 2008. On the occurrence of a Gregarine Parasite from
Psylloides cupreus Koch 1803 (Coleoptera: Chrysomelidae) of Turkey.
Reed, D. K., G. L. Reed, and C. S. Creighton. 1986. Introduction of Entomogenous Nematodes into
Trickle Irrigation Systems to Control Striped Cucumber Beetle (Coleoptera: Chrysomelidae)1.
Journal of Economic Entomology. 79: 1330–1333.
Rojas, E. S., J. C. Batzer, G. A. Beattie, S. J. Fleischer, L. R. Shapiro, M. A. Williams, R. Bessin,
B. D. Bruton, T. J. Boucher, L. C. H. Jesse, and M. L. Gleason. 2015. Bacterial Wilt of
Cucurbits: Resurrecting a Classic Pathosystem. Plant Disease. 99: 564–574.
Rueckert, Sonja I. and Brian S. Leander. 2008. Gregarina Dufour 1828. Gregarines. Version 23
September 2008. http://tolweb.org/Gregarina/124806/2008.09.23 in The Tree of Life Web
Project, http://tolweb.org/
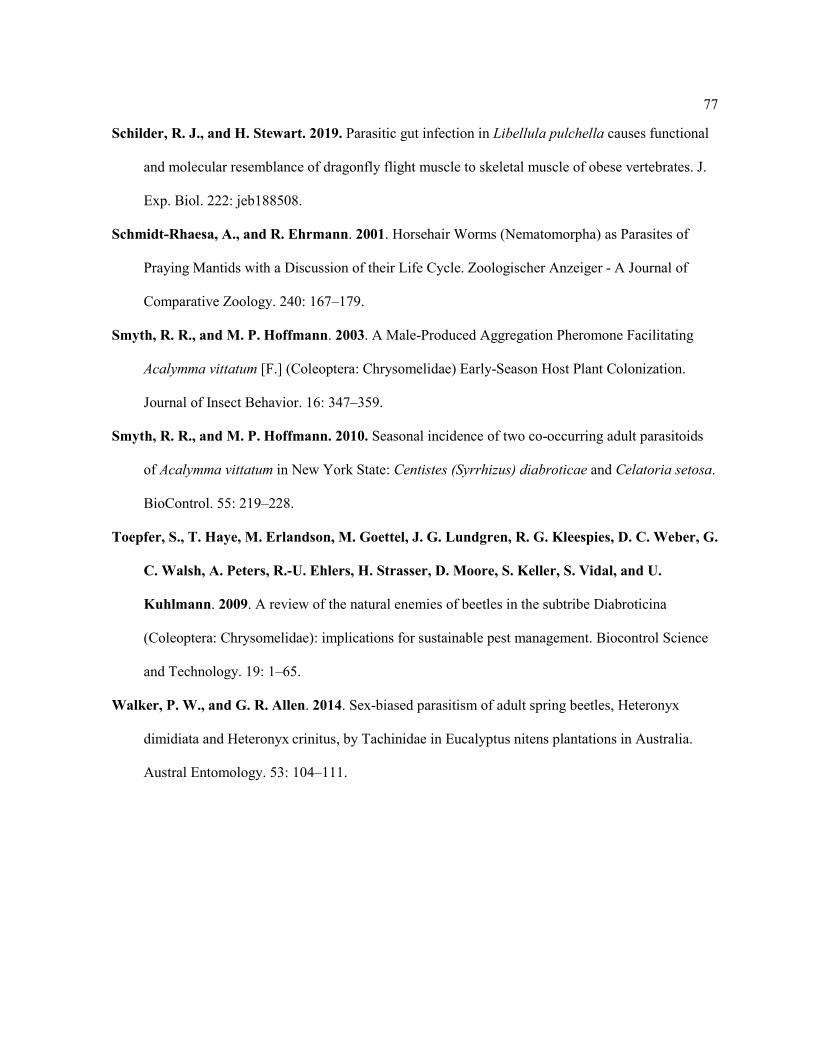
77
Schilder, R. J., and H. Stewart. 2019. Parasitic gut infection in Libellula pulchella causes functional
and molecular resemblance of dragonfly flight muscle to skeletal muscle of obese vertebrates. J.
Exp. Biol. 222: jeb188508.
Schmidt-Rhaesa, A., and R. Ehrmann. 2001. Horsehair Worms (Nematomorpha) as Parasites of
Praying Mantids with a Discussion of their Life Cycle. Zoologischer Anzeiger - A Journal of
Comparative Zoology. 240: 167–179.
Smyth, R. R., and M. P. Hoffmann. 2003. A Male-Produced Aggregation Pheromone Facilitating
Acalymma vittatum [F.] (Coleoptera: Chrysomelidae) Early-Season Host Plant Colonization.
Journal of Insect Behavior. 16: 347–359.
Smyth, R. R., and M. P. Hoffmann. 2010. Seasonal incidence of two co-occurring adult parasitoids
of Acalymma vittatum in New York State: Centistes (Syrrhizus) diabroticae and Celatoria setosa.
BioControl. 55: 219–228.
Toepfer, S., T. Haye, M. Erlandson, M. Goettel, J. G. Lundgren, R. G. Kleespies, D. C. Weber, G.
C. Walsh, A. Peters, R.-U. Ehlers, H. Strasser, D. Moore, S. Keller, S. Vidal, and U.
Kuhlmann. 2009. A review of the natural enemies of beetles in the subtribe Diabroticina
(Coleoptera: Chrysomelidae): implications for sustainable pest management. Biocontrol Science
and Technology. 19: 1–65.
Walker, P. W., and G. R. Allen. 2014. Sex-biased parasitism of adult spring beetles, Heteronyx
dimidiata and Heteronyx crinitus, by Tachinidae in Eucalyptus nitens plantations in Australia.
Austral Entomology. 53: 104–111.
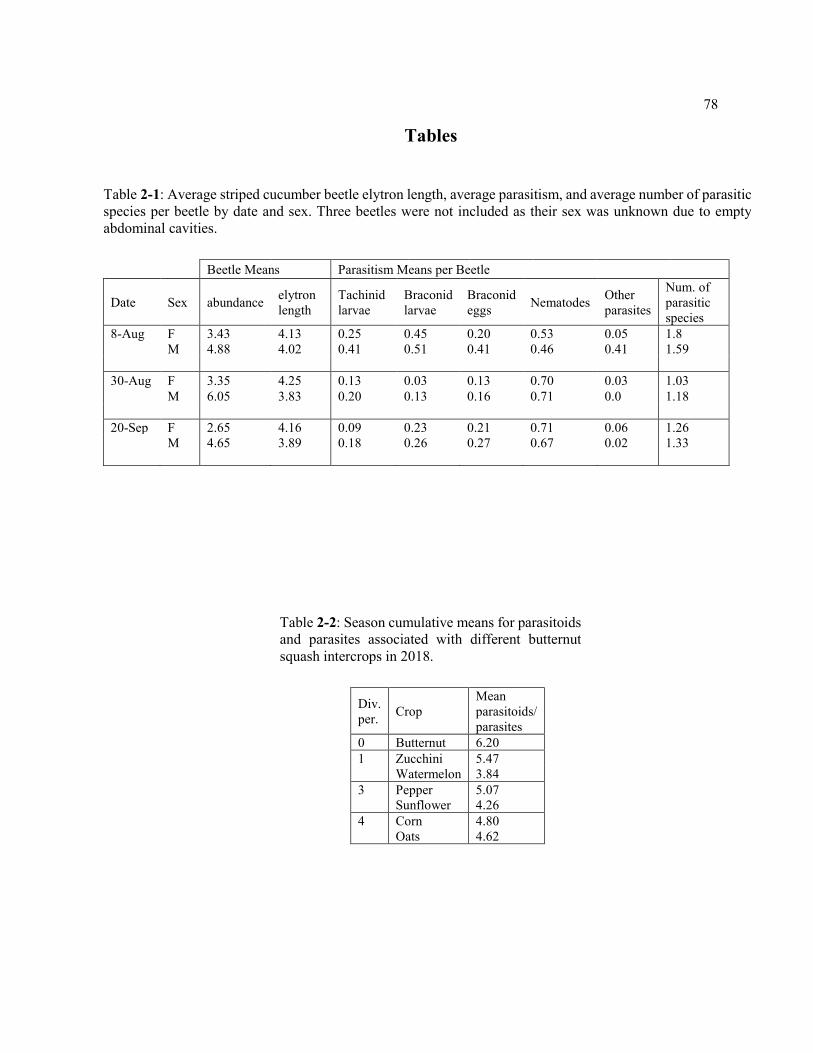
78
Tables
Table 2-1: Average striped cucumber beetle elytron length, average parasitism, and average number of parasitic species per beetle by date and sex. Three beetles were not included as their sex was unknown due to empty abdominal cavities.
Beetle Means Parasitism Means per Beetle
Date Sex abundance elytron length
Tachinid larvae
Braconid larvae
Braconid eggs Nematodes Other
parasites
Num. of parasitic species
8-Aug F 3.43 4.13 0.25 0.45 0.20 0.53 0.05 1.8 M 4.88 4.02 0.41 0.51 0.41 0.46 0.41 1.59 30-Aug F 3.35 4.25 0.13 0.03 0.13 0.70 0.03 1.03 M 6.05 3.83 0.20 0.13 0.16 0.71 0.0 1.18 20-Sep F 2.65 4.16 0.09 0.23 0.21 0.71 0.06 1.26 M 4.65 3.89 0.18 0.26 0.27 0.67 0.02 1.33
Table 2-2: Season cumulative means for parasitoids and parasites associated with different butternut squash intercrops in 2018.
Div. per. Crop
Mean parasitoids/ parasites
0 Butternut 6.20 1 Zucchini 5.47
Watermelon 3.84 3 Pepper 5.07
Sunflower 4.26 4 Corn 4.80
Oats 4.62
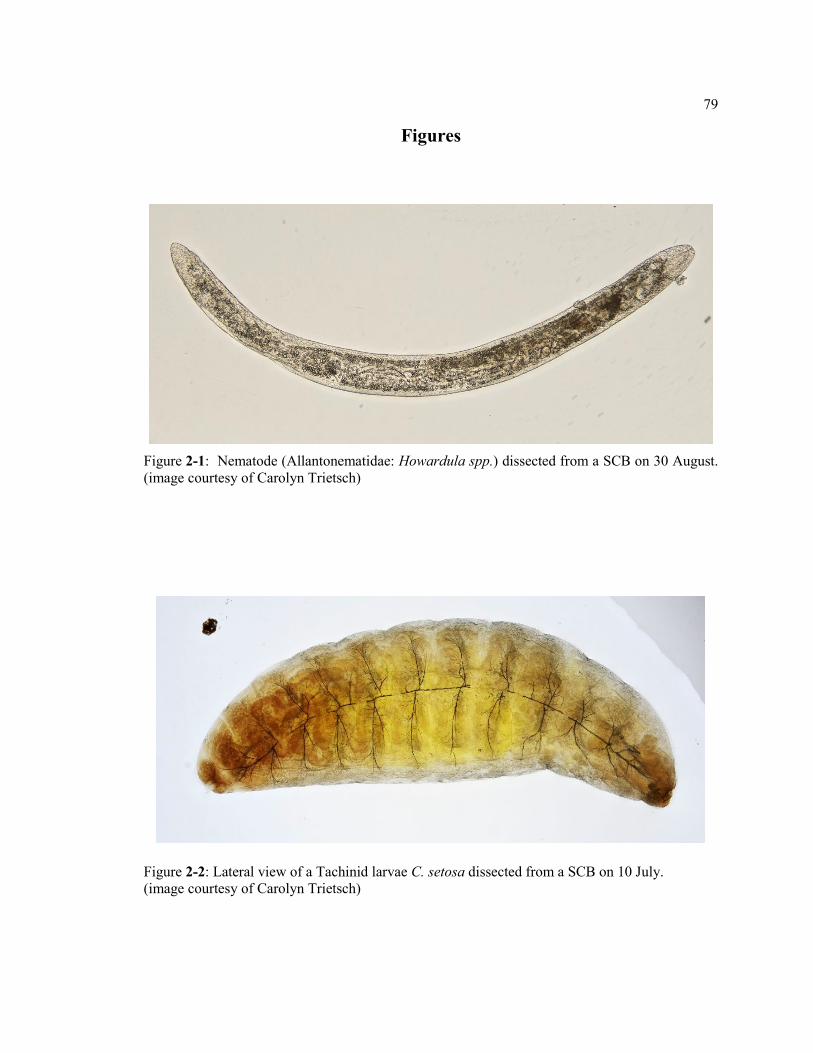
79
Figures
Figure 2-1: Nematode (Allantonematidae: Howardula spp.) dissected from a SCB on 30 August. (image courtesy of Carolyn Trietsch)
Figure 2-2: Lateral view of a Tachinid larvae C. setosa dissected from a SCB on 10 July. (image courtesy of Carolyn Trietsch)

80
Figure 2-3: Images of a Braconid larvae C. diabroticae dissected from a SCB on 10 July. Lateral view (top image) of a Braconid larvae body and dorsal view (bottom image) of a Braconid larvae head. (images courtesy of Carolyn Trietsch)

81
Figure 2-4: Braconid egg C. diabroticae dissected from a SCB on 30 August. Ventral view of egg (left image) and closeup ventral view of larval head (right image). To the best of my knowledge, these are the first published images of a C. diabroticae egg. (images courtesy of Carolyn Trietsch)

82
Figure 2-5: (+/- 1 SE; α = 0.05) Average number of female and male beetles per plot. In a Two-Sample T-Test comparing number of female and male beetles, the average number of male and female beetles per plot was significantly different (H₀: μ₁ - µ₂ = 0; T-Value = -6.78, DF = 191, P-Value = <0.0001).
0
3.5
7
10-Jul 7-Aug 30-Aug
Mea
n nu
mbe
r of b
eetle
s per
plo
t
FemaleMale
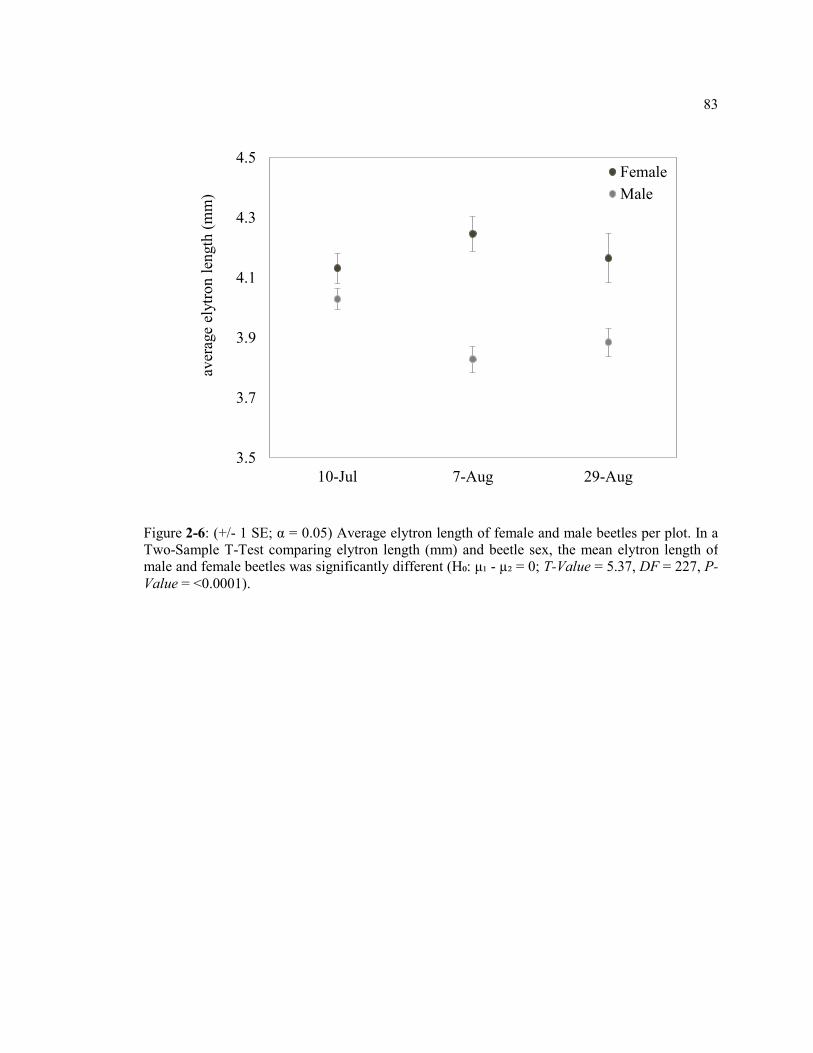
83
Figure 2-6: (+/- 1 SE; α = 0.05) Average elytron length of female and male beetles per plot. In a Two-Sample T-Test comparing elytron length (mm) and beetle sex, the mean elytron length of male and female beetles was significantly different (H₀: μ₁ - µ₂ = 0; T-Value = 5.37, DF = 227, P-Value = <0.0001).
3.5
3.7
3.9
4.1
4.3
4.5
10-Jul 7-Aug 29-Aug
aver
age
elyt
ron
leng
th (m
m)
FemaleMale
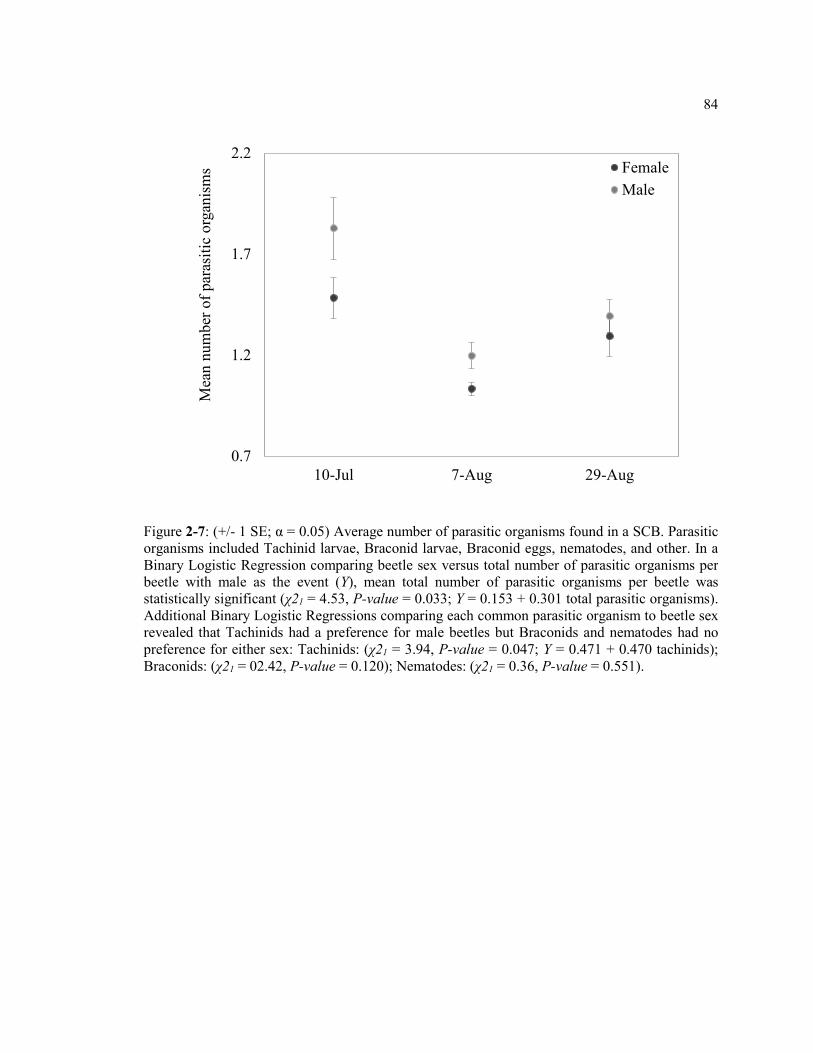
84
Figure 2-7: (+/- 1 SE; α = 0.05) Average number of parasitic organisms found in a SCB. Parasitic organisms included Tachinid larvae, Braconid larvae, Braconid eggs, nematodes, and other. In a Binary Logistic Regression comparing beetle sex versus total number of parasitic organisms per beetle with male as the event (Y), mean total number of parasitic organisms per beetle was statistically significant (χ21 = 4.53, P-value = 0.033; Y = 0.153 + 0.301 total parasitic organisms). Additional Binary Logistic Regressions comparing each common parasitic organism to beetle sex revealed that Tachinids had a preference for male beetles but Braconids and nematodes had no preference for either sex: Tachinids: (χ21 = 3.94, P-value = 0.047; Y = 0.471 + 0.470 tachinids); Braconids: (χ21 = 02.42, P-value = 0.120); Nematodes: (χ21 = 0.36, P-value = 0.551).
0.7
1.2
1.7
2.2
10-Jul 7-Aug 29-Aug
Mea
n nu
mbe
r of p
aras
itic
orga
nism
s FemaleMale
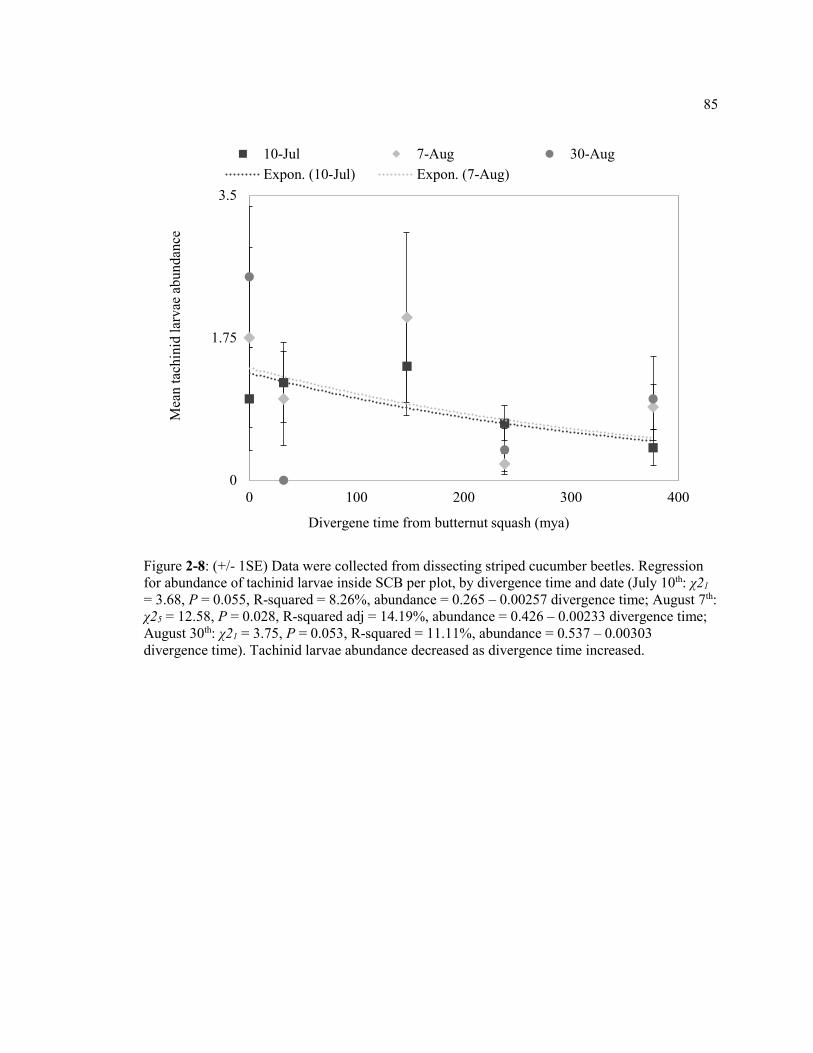
85
Figure 2-8: (+/- 1SE) Data were collected from dissecting striped cucumber beetles. Regression for abundance of tachinid larvae inside SCB per plot, by divergence time and date (July 10th: χ21 = 3.68, P = 0.055, R-squared = 8.26%, abundance = 0.265 – 0.00257 divergence time; August 7th: χ25 = 12.58, P = 0.028, R-squared adj = 14.19%, abundance = 0.426 – 0.00233 divergence time; August 30th: χ21 = 3.75, P = 0.053, R-squared = 11.11%, abundance = 0.537 – 0.00303 divergence time). Tachinid larvae abundance decreased as divergence time increased.
0
1.75
3.5
0 100 200 300 400
Mea
n ta
chin
id la
rvae
abu
ndan
ce
Divergene time from butternut squash (mya)
10-Jul 7-Aug 30-AugExpon. (10-Jul) Expon. (7-Aug)

86
Figure 2-9: (+/- 1SE) Data were collected from dissecting striped cucumber beetles. Poisson regression for abundance of braconid larvae and eggs inside SCB by divergence time and date. Braconid larvae and egg abundance decreased in response to divergence time on July 10th (larvae: χ21 = 11.40, P = 0.001, R-squared = 17.04%, abundance = 1.014 – 0.00333 divergence time; eggs: χ21 = 9.25, P = 0.002, R-squared = 20.11%, abundance = 0.741 – 0.00348 divergence time) and August 7th (larvae: χ25 = 24.50, P = <0.0001, R-squared = 31.05%, abundance = 0.531 – 0.00437 divergence time; eggs: χ21 = 3.39, P = 0.066, R-squared = 7.42%, abundance = 0.364 – 0.00256 divergence time)
0
2
4
0 100 200 300 400
Mea
n br
acon
id a
bund
ance
per
plo
t
Divergence time from butternut squash (mya)
10-Jul larvae 7-Aug larvae10-Jul eggs 7-Aug eggsExpon. (10-Jul larvae) Expon. (7-Aug larvae)Expon. (10-Jul eggs) Expon. (7-Aug eggs)
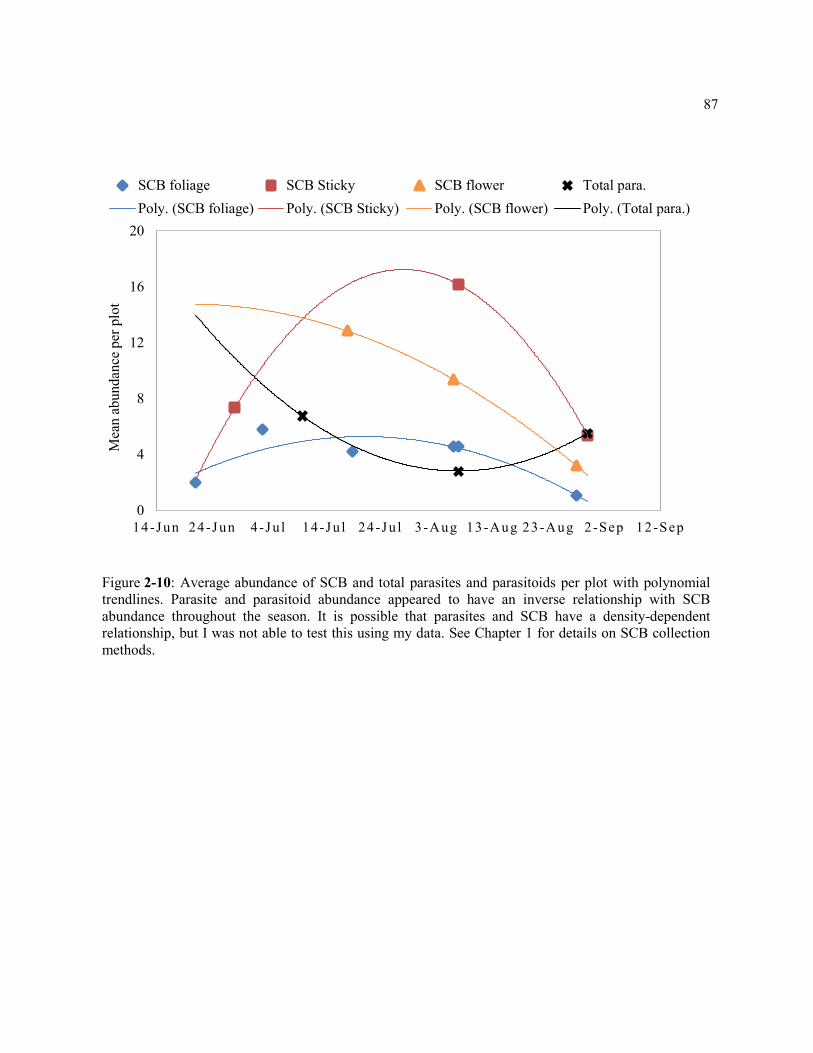
87
Figure 2-10: Average abundance of SCB and total parasites and parasitoids per plot with polynomial trendlines. Parasite and parasitoid abundance appeared to have an inverse relationship with SCB abundance throughout the season. It is possible that parasites and SCB have a density-dependent relationship, but I was not able to test this using my data. See Chapter 1 for details on SCB collection methods.
0
4
8
12
16
20
14-Jun 24-Jun 4-Ju l 14-Ju l 24-Ju l 3-Aug 13-Aug 23-Aug 2-Sep 12-Sep
Mea
n ab
unda
nce
per p
lot
SCB foliage SCB Sticky SCB flower Total para.Poly. (SCB foliage) Poly. (SCB Sticky) Poly. (SCB flower) Poly. (Total para.)

88
Figure 2-11: Gregarinasina dissected from SCB on 30 August. A gregarine (top image) and gregarine syzygy (bottom image). (images courtesy of Carolyn Trietsch)

89
APPENDIX
Figure A-1: Precipitation events and totals recorded at the Rock Springs NEWA Weather Station throughout the field season for 2017 and 2018. Excessive rains caused a delay and planting in both years. In 2017, about 20% of plots were flooded throughout the season. Because of this, I relocated to another area of the research farm in 2018.
0
1
2
3
4
2017
tota
l pre
cipi
tatio
n (in
ches
)
0
1
2
3
4
2018
tota
l pre
cipi
tatio
n (in
ches
)
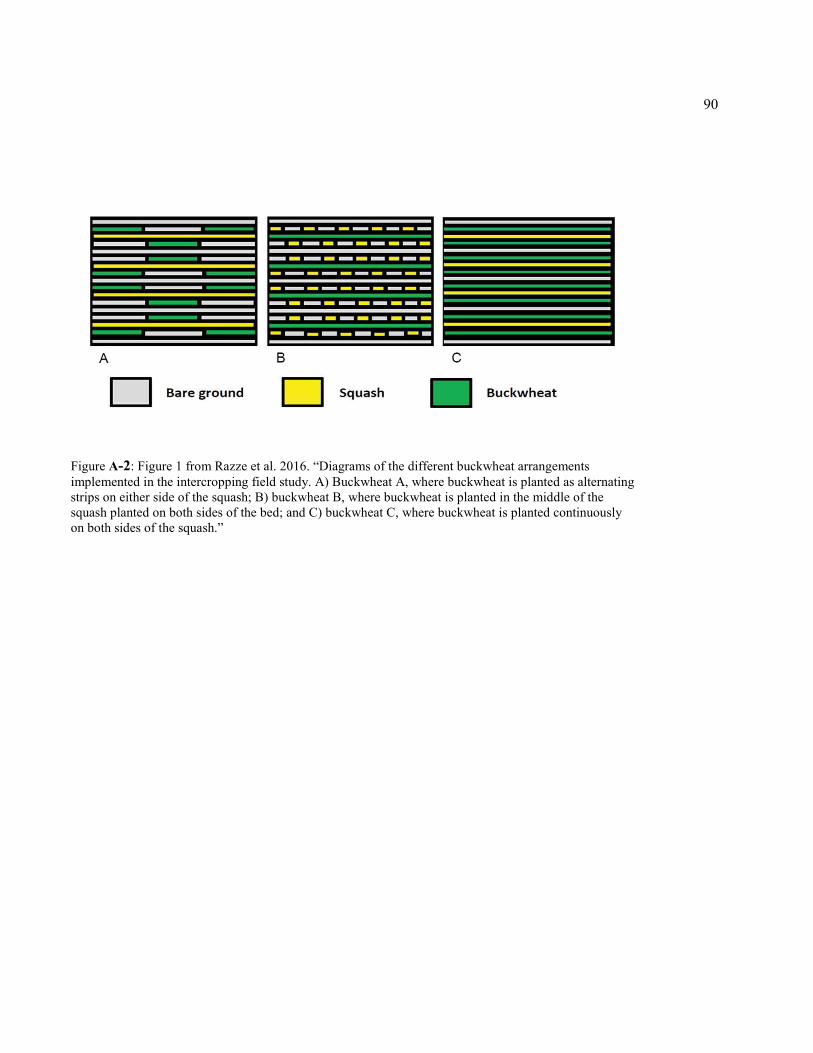
90
Figure A-2: Figure 1 from Razze et al. 2016. “Diagrams of the different buckwheat arrangements implemented in the intercropping field study. A) Buckwheat A, where buckwheat is planted as alternating strips on either side of the squash; B) buckwheat B, where buckwheat is planted in the middle of the squash planted on both sides of the bed; and C) buckwheat C, where buckwheat is planted continuously on both sides of the squash.”