the influence of citrate or peg coating on silver ... · influence of citrate or peg coating on...
TRANSCRIPT

Heriot-Watt University Research Gateway
Heriot-Watt University
The influence of Citrate or PEG coating on silver nanoparticle toxicity to a human keratinocytecell lineBastos, V.; Ferreira de Oliveira, J. M. P.; Brown, David McAllister; Johnston, Helinor Jane;Malheiro, E.; Daniel-da-Silva, A. L.; Duarte, I. F.; Santos, C.; Oliveira, H.Published in:Toxicology Letters
DOI:10.1016/j.toxlet.2016.03.005
Publication date:2016
Document VersionPeer reviewed version
Link to publication in Heriot-Watt University Research Portal
Citation for published version (APA):Bastos, V., Ferreira de Oliveira, J. M. P., Brown, D. M., Johnston, H. J., Malheiro, E., Daniel-da-Silva, A. L., ...Oliveira, H. (2016). The influence of Citrate or PEG coating on silver nanoparticle toxicity to a humankeratinocyte cell line. DOI: 10.1016/j.toxlet.2016.03.005
General rightsCopyright and moral rights for the publications made accessible in the public portal are retained by the authors and/or other copyright ownersand it is a condition of accessing publications that users recognise and abide by the legal requirements associated with these rights.
If you believe that this document breaches copyright please contact us providing details, and we will remove access to the work immediatelyand investigate your claim.

Download date: 22. Sep. 2018

Accepted Manuscript
Title: The influence of Citrate or PEG coating on silvernanoparticle toxicity to a human keratinocyte cell line
Author: V. Bastos J.M.P. Ferreira de Oliveira D. Brown H.Jonhston E. Malheiro A.L. Daniel-da-Silva I.F. Duarte C.Santos H. Oliveira
PII: S0378-4274(16)30041-8DOI: http://dx.doi.org/doi:10.1016/j.toxlet.2016.03.005Reference: TOXLET 9337
To appear in: Toxicology Letters
Received date: 5-1-2016Revised date: 3-3-2016Accepted date: 21-3-2016
Please cite this article as: Bastos, V., Ferreira de Oliveira, J.M.P., Brown, D., Jonhston,H., Malheiro, E., Daniel-da-Silva, A.L., Duarte, I.F., Santos, C., Oliveira, H., Theinfluence of Citrate or PEG coating on silver nanoparticle toxicity to a humankeratinocyte cell line.ToxicologyLetters http://dx.doi.org/10.1016/j.toxlet.2016.03.005
This is a PDF file of an unedited manuscript that has been accepted for publication.As a service to our customers we are providing this early version of the manuscript.The manuscript will undergo copyediting, typesetting, and review of the resulting proofbefore it is published in its final form. Please note that during the production processerrors may be discovered which could affect the content, and all legal disclaimers thatapply to the journal pertain.

Highlights of the manuscript Bastos et al (TOXLET-D-16-00023) “The
influence of Citrate or PEG coating on silver nanoparticle toxicity to a
human keratinocyte cell line”:
. PEG and citrate coatings strongly determine AgNPs toxicity
. AgNPs surface coating influences the mechanisms of cell death
. Citrate-coated AgNPs have more severe cytotoxic effects than PEG-coated AgNPs
*Highlights (for review)

The influence of Citrate or PEG coating on silver 1
nanoparticle toxicity to a human keratinocyte cell line 2
3
Bastos V.1, Ferreira de Oliveira J. M. P.
1, Brown D.
2Jonhston H.
2, Malheiro E.
3, Daniel-da-Silva A.L.
3, 4
Duarte I.F.3, Santos C.
1,4* and Oliveira H.
1 5
6 1CESAM & Laboratory of Biotechnology and Cytomics, Department of Biology, University of Aveiro, 3810-193 Aveiro, Portugal 7 2School of Life sciences, Heriot-Watt University, Riccarton, Edinburgh EH14 4AS, UK 8 3CICECO – Aveiro Institute of Materials, Department of Chemistry, University of Aveiro, Aveiro, Portugal 9 4Department of Biology, Faculty of Sciences, University of Porto, Rua do Campo Alegre, Porto, 10 11
12
*corresponding author: [email protected] 13
14
15
16
17
18
19
20
21
22
23
24
25
26
27
28
29
30
31
32
33
34
35
36
37
38
39
*Manuscript

40
Abstract 41
Surface coating of silver nanoparticles may influence their toxicity, in a way yet to decipher. In 42
this study, human keratinocytes (HaCaT cells) were exposed for 24 and 48h to well-43
characterized 30 nm AgNPs coated either with citrate (Cit30 AgNPs) or with poly(ethylene 44
glycol) (PEG30 AgNPs), and assessed for cell viability, reactive oxygen species (ROS), 45
cytokine release, apoptosis and cell cycle dynamics. The results showed that Cit30 AgNPs and 46
PEG30 AgNPs decreased cell proliferation and viability, the former being more cytotoxic. The 47
coating molecules per se were not cytotoxic. Moreover, Ag+ release and ROS production were 48
similar for both AgNP types. Cit30 AgNPs clearly induced apoptotic death, while cells exposed 49
to PEG30 AgNPs appeared to be at an earlier phase of apoptosis, supported by changes in BAX, 50
BCL2 and CASP-3 expressions. Concerning the impact on cell cycle dynamics, both Cit30 and 51
PEG30 AgNPs affected cell cycle regulation of HaCaT cells, but, again, citrate-coating induced 52
more drastic effects, showing earlier downregulation of cyclin B1 gene and cellular arrest at the 53
G2 phase. Overall, this study has shown that the surface coating of AgNPs influences their 54
toxicity by differently regulating cell-cycle and cell death mechanisms. 55
56
Keywords: Apoptosis, Cell cycle, Citrate-coating, Cytokines, Nanotoxicology, PEG-coating, 57
ROS, silver nanoparticles. 58
59
60
61
62
63
64
65
66
67
68
69
70
71
72
73
1. Introduction 74
Silver nanoparticles (AgNPs) have very efficient antimicrobial activity, which has encouraged 75
their widespread use in a range of applications, from medicine and industry to household and 76
personal care products (EPA 2010) or clothing (Abdelhalim and Jarrar 2011; Behra et al. 2013; 77
Benn and Westerhoff 2008; Eckhardt et al. 2013; Nowack et al. 2011). According to the 78
inventory of nanotechnology-based consumer products compiled by the Project on Emerging 79
Nanotechnologies (http://www.nanotechproject.org/cpi), ~24% of 1800 “nano” products that 80
were introduced in the market to date are nanosilver-containing products. In face of the rapid 81
increase in AgNP production and use, concerns about their possible impacts on the environment 82
and human health have also grown (Nowack and Bucheli 2007). There are many routes of 83
human exposure to AgNPs, including dermal absorption, ingestion, inhalation and injection 84
(Ahamed et al. 2010; Chen and Schluesener 2008) and several in vitro studies have reported 85
toxic effects of AgNPs towards different types of human cells (Asharani et al. 2012; 86
Chairuangkitti et al. 2013; Foldbjerg et al. 2012; Gliga et al. 2014; Grosse et al. 2013; Hsiao et 87
al. 2015; Jiang et al. 2013; Kang et al. 2012; Kim et al. 2009). However, the mechanisms of 88
AgNPs-induced toxicity are still not completely understood (Browning et al. 2013). In 89
particular, it is crucially important to determine how specific physicochemical properties, such 90
as particle size and surface chemistry, influence AgNPs uptake, cellular fate and toxicity 91
(Ahlberg et al. 2014; Comfort et al. 2014; Lu et al. 2010; Samberg et al. 2010). 92
Different properties such as NP formulation (Boonkaew et al. 2014) and size (Kim et al. 2012; 93
Park et al. 2011), the storage environment (Ahlberg et al. 2014) and the duration of exposure 94
(Comfort et al. 2014) have all been previously assessed in different cell types with regard to 95
AgNPs toxic potential. However, little attention has been paid so far to the coating-dependent 96
toxicity of AgNPs. AgNPs are frequently coated to promote stability and avoid aggregation, 97
citrate being the most commonly used reducing agent and stabilizer (Sharma et al. 2009). 98
Numerous polymers have also been used to coat AgNPs, such as polyvinyl pyrrolidone (PVP) 99
(Haberl et al. 2013; Nymark et al. 2013; Wang et al. 2014), and poly(ethylene glycol) (PEG) 100
(Fernández-López et al. 2009; Tao et al. 2007). Citrate renders NPs a negative surface charge 101
and provides colloidal stability through electrostatic repulsions, while low molecular weight 102
PEG can neutralize surface charge and stabilize NPs through steric hindrance. PEG coating has 103
been reported to reduce NP reactivity (Povoski et al. 2013) and to improve penetration through 104
the mucus layer, increasing the interest in the use of this polymer for nanomedicine purposes 105
(Suk et al. 2011; Thorley and Tetley 2013). 106
The few studies which have addressed the influence of coating on AgNPs toxicity provided 107
conflicting information. It has been reported that the charged citrate coating improved the 108
stability of AgNPs and decreased their toxicity (Zhang et al. 2014), while other studies found 109
that citrate-coated AgNPs could be highly cytotoxic to mammalian cells (Grosse et al. 2013; 110

Wang et al. 2014). On the other hand, Gliga et al. (2014) compared the cytoxicity of uncoated, 111
PVP- and citrate-coated AgNPs in bronchial BEAS-2B cells and found no coating-dependent 112
differences in cytotoxicity. Caballero-Díaz et al. (2013) reported that pegylation of AgNPs 113
reduced cellular uptake and reduced the toxicity in NIH/3T3 (mouse embryonic fibroblasts), 114
compared to AgNPs coated with other polymers. Using an in vivo system, England et al. (2013) 115
demonstrated that PEG coating could “mask” the NPs from the immune system, decreasing 116
their toxicity. However, α-methoxy-poly(ethylene glycol)-ω-mercapto (mPEG-SH)-coated 117
AgNPs decreased viability and affected cell cycle dynamics of human liver cells (HL-7702) 118
(Song et al. 2012). The differential effects of citrate and PEG coatings have been assessed for 119
gold nanoparticles (AuNPs) (Brandenberger et al. 2010) in human alveolar epithelial cells 120
(A549) cells. The authors found that the uptake of citrate-coated AuNPs by A549 cells was 121
significantly increased compared to that of the PEG-coated AuNPs, concluding that NP surface 122
coatings can modulate endocytic uptake pathways and cellular NP trafficking. 123
In this study, we aimed to compare the cytotoxic effects of AgNPs coated with citrate or PEG 124
on human keratinocytes. Given that skin is a major entry route of AgNPs into the body, HaCaT 125
(human keratinocyte) cells have been chosen as an in vitro model. Indeed, there has been 126
evidence that AgNPs with diameters in the 20-40 nm range can penetrate skin in vivo and be 127
detected in deeper layers (George et al. 2014; Larese et al. 2009). HaCaT cells were exposed to 128
citrate- and PEG-coated AgNPs of 30 nm (Cit30 and PEG30, respectively) and the effects on 129
cell viability, intracellular ROS production, cytokines expression, apoptosis induction and cell 130
cycle profile were assessed after 24 and 48 h. Putative toxicity of the coatings alone was also 131
investigated. 132
133
2. Material and methods 134
2.1. Chemicals 135
Sterile, purified and endotoxin-free silver nanoparticles (Biopure AgNPs 1.0 mg/mL in water), 136
with a diameter of 30 nm and a citrate or polyethyleneglycol (PEG) surface, designated as Cit30 137
and PEG30, respectively, were purchased from Nanocomposix Europe (Prague, Czech 138
Republic). Citric acid (C6H8O7.H2O) was purchased from Sigma Aldrich (St. Louis, Missouri, 139
USA); Poly(ethylene glycol) PEG (Mw 5 kDa) from Laysan Bio® (Arab, Alabama, USA) . 140
Dulbecco’s modified Eagle’s medium (DMEM), fetal bovine serum (FBS), antibiotics and 141
phosphate buffer saline (PBS, pH 7.4) were purchased from Life Technologies (Carlsbad, CA, 142
USA). 3-(4,5-dimethylthiazol-2-yl)-2,5-diphenyltetrazolium bromide (MTT), dimethyl 143
sulfoxide (DMSO), dichlorodihydrofluorescein diacetate (DCFH2-DA), propidium iodide (PI), 144
RNase and DNase I were obtained from Sigma-Aldrich (St. Louis, MO, USA). FITC Annexin 145
V Apoptosis Detection Kit (BD Pharmingen, San Diego, CA-USA); RNeasy Mini Kit columns 146
was from Qiagen, Hilden, Germany; Omniscript RT Kit from Qiagen, Hilden, Germany; and iQ 147

SYBR Green Supermix from BioRad, Hercules, CA-USA. 148
149
2.2. Physicochemical characterization of AgNPs 150
The morphology and size of AgNPs was assessed by scanning transmission electron microscopy 151
(STEM, Hitachi SU-70 (Hitachi High-Technologies Europe GmbH, Germany) operating at 30 152
kV. Samples for STEM analysis were prepared by evaporating dilute suspensions 153
(concentration) of the nanoparticles on a copper grid coated with an amorphous carbon film. 154
The hydrodynamic diameter and polydispersity index (PdI) of the nanoparticles were measured 155
by dynamic light scattering (DLS) and the zeta potential was assessed by electrophoretic 156
mobility, both measurements using a Zetasizer Nano ZS (Malvern Instruments, UK). 157
Silver quantification measurements were performed by inductively coupled plasma optical 158
emission spectrometry (ICP-OES) in an Activa M Radial spectrometer (Horiba Jobin Yvon, 159
France), employing a charge coupled device (CCD) array detector, with a wavelength range of 160
166–847 nm and radial plasma view. Samples were introduced into the ICP plasma using an HF 161
resistant sample introduction system including a Burgener nebulizer, a cyclonic spray chamber 162
and a quartz torch with aluminium injector. Samples for ICP-OES were prepared by addition of 163
10 µL AgNPs (1.0 mg/mL) to 990 µL of either ultrapure water or complete culture medium, 164
incubation for variable periods (0, 4, 24 or 48h), followed by centrifugation at 40000 rcf for 120 165
min at 4ºC (in accordance with the manufacturer’s recommendations) to deposit the 166
nanoparticles and separate the supernatant (with dissolved ionic silver). Acid digestion of the 167
supernatant was then performed by mixing 500 µL with 100 µL of acids (HCl:HNO3 2:1 v/v) 168
and 400 µL of ultrapure water. The % dissolution of AgNPs to ionic silver was calculated as 169
100×F×[Ag]/Ci, where F is the dilution factor, Ci the initial concentration of AgNPs (based on 170
the stock solution concentration, indicated by the manufacturer) and [Ag] the concentration of 171
silver determined by ICP-OES. 172
173
2.3. Cell Culture 174
The HaCaT cell line, a nontumorigenic immortalized human keratinocyte cell line (Boukamp et 175
al. 1988), was obtained from Cell Lines Services (Eppelheim, Germany). Cells were grown in 176
complete medium, (Dulbecco’s modified Eagle’s medium, supplemented with 10% fetal bovine 177
serum (FBS), 2 mM L-glutamine, 100 U/mL penicillin, 100 µg/mL streptomycin and 250 178
µg/mL fungizone) at 37 °C in 5% CO2 humidified atmosphere. For each experiment, cells were 179
seeded at a concentration 60000 cells/mL in 96 well plates, and allowed to adhere for 24 h and 180
then medium was replaced with fresh medium containing citrate- or PEG-coated AgNPs. 181
Depending on the experiment, the silver ion and the coating agent per se, dissolved in complete 182
medium, were used as controls. The effects were measured after 24 and 48 h. 183
184

2.4. Exposure and Viability assay 185
Cell viability was determined by the colorimetric 3-(4,5- dimethyl-2-thiazolyl)-2,5-diphenyl 186
tetrazolium bromide (MTT) assay (Twentyman and Luscombe 1987). Cells were seeded in 96-187
well plates and cultured as described above. Cell viability was assessed in cells exposed to free 188
citrate and PEG (same Mw as PEG in AgNPs coating) at concentrations below the maximum 189
quantity added at the time of NP synthesis (before wash process), which was 2 mM for citrate 190
(~378 µg/mL) and 200 µg/mL for PEG (information provided by the manufacturer 191
Nanocomposix). Cells were exposed to citrate or PEG dissolved in complete culture medium at 192
0, 50, 100, 200, 300, 350 and 400 µg citrate/mL, and 0, 6, 12.5, 25, 50, 100 and 200 µg 193
PEG/mL. Silver nitrate was dissolved in complete medium at concentrations of 0, 0.2, 0.5, 1, 194
2.5, 5, 7.5, 10 and 50 µg Ag+/mL. Cells were exposed to citrate- or PEG-coated AgNPs at 195
concentrations of 0, 0.5, 5, 10, 25, 50, 75 and 100 µg/mL. Cell viability was measured after 24 196
h, but in the case of Ag+ and coated AgNPs a 48h exposure was also assayed. Fifty microliters 197
of MTT (1 mg/mL) in phosphate buffered saline (PBS) was then added to each well, and 198
incubated for 4h at 37 °C, 5% CO2. Medium was then removed and 150 µL of DMSO were 199
added to each well to solubilize the formazan crystals. 200
The optical density of reduced MTT was measured at 570 nm in a microtiter plate reader 201
(Synergy HT Multi-Mode, BioTeK, Winooski, VT), and the relative cell metabolic activity 202
(MA) (calculated as a % with respect to control cells) was calculated as: MA = [(Sample Abs –203
DMSO Abs) / (Control Abs – DMSO Abs)]*100. Three independent assays were performed 204
with at least 2 technical replicates each and the results compared with the control (no exposure). 205
From the MTT results, the IC50 for citrate coated AgNPs (the most cytotoxic) was 40 µg/mL 206
and 37.4 µg/mL at 24 and 48 h respectively. Therefore, the concentrations of coated AgNPs 207
corresponding to IC50 and IC20 (40 µg/mL and 10 µg/mL, respectively) were selected for the 208
following assays, for the silver ion, the IC50 was 1.26 µg/mL and in that case a concentration 209
which didn’t cause significant cytotoxicity (0.8 µg/mL) was selected. This concentration was 210
higher than the Ag+ concentration released from citrate-coated AgNPs at time 0h (3.77% in 10 211
µg/mL of citrate- AgNPs, which corresponds to 0.377 µg/mL of Ag+), but was a dose that did 212
not cause significant cytotoxicity through MTT assay. 213
214
2.5. Uptake potential by flow cytometry 215
Uptake potential of Cit30 and PEG30 by HaCaT cells was assessed by flow cytometry (FCM) 216
as previously described by Suzuki et al (2007). Briefly, cells were seeded in 6-well plates and 217
after AgNPs exposure they were trypsinized, collected to FCM tubes and analyzed by FCM. 218
Both parameters, forward scatter (FS), which give information on the particle’s size, and side 219
scatter (SS), information on complexity of particles, were measured in a Coulter XL Flow 220
Cytometer (Beckman Coulter, Hialeah, FL-USA) equipped with an argon laser (15 mW, 488 221

nm). Acquisitions were made using SYSTEM II software v. 3.0 (Beckman Coulter, Hialeah, 222
FL). For each sample, 5000–20000 cells were analyzed at a flow rate of about 1000 cells/s. 223
224
2.6. Intracellular ROS Formation 225
Intracellular ROS production was assessed by flow cytometry (FCM) with the use of 226
dichlorodihydrofluorescein diacetate (DCFH2-DA) as a fluorescent probe. This probe enters the 227
cells and is deacetylated by cellular esterases producing non-fluorescent DCFH2 and diacetate. 228
In the cytosol DCFH2 is quickly oxidized to fluorescent DCF by intracellular ROS. Cells were 229
seeded in 6-well plates at a concentration of 60000 cells/mL and after AgNPs exposure for 24h, 230
medium was discarded and cells were incubated for 30 min, at 37ºC, in the dark with serum-free 231
DMEM containing 10 mM DCFH2-DA. Cells were washed with PBS, trypsinised and collected 232
for analysis. Acquisitions were made using a Coulter EPICS XL flow cytometer (Coulter 233
Electronics, Hialeah, Florida, USA) equipped with an argon laser (15 mW, 488 nm). 234
Acquisitions were made using SYSTEM II software v. 3.0 (Beckman Coulter, Hialeah, FL). 235
ROS formation was estimated from the median fluorescence intensity (MFI) of DCF using the 236
FlowJo software (Tree Star Inc., Ashland, OR-USA). For each sample, the number of events 237
reached at least 10000. 238
239
2.7. Cytokine estimation using cytometric bead array 240
Cytokine production was assessed using Bioplex kits. Briefly, the cell supernatants (removed, 241
centrifuged and frozen at -80ºC) were used to estimate the release of the following cytokines 242
from treated cells: interleukin-1 beta (IL-1β), IL-6, tumour necrosis factor-alpha (TNF-α), IL-10 243
and monocyte chemoattractant protein-1 (MCP-1). Lipopolysaccharide (LPS) was used as a 244
positive control. Bead array kits were obtained from Beckton Dickinson (Oxford, UK) and a 245
master mix prepared according to the manufacturer’s instructions. The master mix was 246
incubated with each of the test supernatants for 1 h, followed by the addition of detection beads 247
and incubated for a further 2 h at room temperature. The beads were then washed in wash buffer 248
and analyzed using a BDTM
FACS array flow cytometer which had previously been set up and 249
calibrated using standard beads for each cytokine under investigation. 250
251
2.8. Annexin V assay 252
Apoptosis and cell viability were measured by flow cytometry (FCM) in a Coulter XL Flow 253
Cytometer (Beckman Coulter, Hialeah, FL-USA), through the FITC Annexin V Apoptosis 254
Detection Kit, according to manufacturer. Briefly, cells were detached and washed with PBS, 255
and the cells resuspended in diluted binding buffer provided with the kit (1:10 in distilled water) 256
at 1×10⁶ cells/ml. To stain the cell suspension, 5µL of FITC-Annexin V and 5µL of PI were 257
added for 15 min at room temperature in the dark, after which each sample was diluted in 258

400μL binding buffer. For each sample, 10000 events were analyzed and the percentages were 259
calculated from the number of cells in each quadrant divided by the total number of cells. 260
261
2.9. Gene expression of apoptosis related genes 262
Total RNA of control and exposed cells was extracted using the TRIzol method. Organic phase 263
separation was achieved in Phase-Lock Gel Heavy tubes (5 Prime 3 Prime, Inc., Boulder, CO). 264
The aqueous phase was mixed with 1 vol 70% ethanol and RNA was purified using RNeasy 265
Mini Kit columns. Synthesis of cDNAs was performed by a reverse transcriptase (RT) reaction: 266
2 μg total RNA were pre-incubated with DNase I and reverse-transcribed with 1 μM Oligo 267
dT18, using the Omniscript RT Kit. The cDNA samples were prediluted in ultrapure MilliQ 268
water (1:20). The final individual qPCR reactions contained iQ SYBR Green Supermix, 150nM 269
each gene-specific primer and 1:4 (v/v) prediluted cDNA (1:20). Primers were designed using 270
the program Primer3 (Rozen and Skaletsky 2000) and confirmed for specificity by the UCSC 271
In-Silico PCR Genome Browser (http://genome.ucsc.edu/cgi-bin/hgPcr). The qPCR program 272
included 1 min denaturation at 95 °C, followed by 40 cycles at 94 °C for 5 s, 58 °C for 15 s, and 273
72 °C for 15 s. After qPCR, a melting temperature curve was performed. At least two technical 274
replicates per sample of qPCR were used from each of three independent biological replicates. 275
Average PCR and cycle thresholds were determined from the fluorescence data using the 276
algorithm Real-Time PCR Miner (Zhao and Fernald 2005). Gene expression of BAX, BCL2, 277
CASP3 were normalized with the GAPDH reference gene and expressed relative to control cells, 278
calculated from the average efficiencies and cycle thresholds using the Pfaffl method (Pfaffl 279
2001). 280
281
2.10. Cell cycle 282
Cell cycle was analyzed by flow cytometry according to the method previously described 283
(Oliveira et al. 2014). Briefly, cells were seeded in 6-well plates and after exposure they were 284
washed with PBS, harvested using Trypsin-EDTA and centrifuged twice at 300 xg for 5 min. 285
Cells were then fixed with 85% cold ethanol and kept at -20 ºC until analysis. At the time of 286
analysis cells were centrifuged at 300 g for 5 min, resuspended in PBS and filtered through a 287
35-µm nylon mesh to separate aggregates. Then, 50 μL RNase (1mg/mL) and 50 μL propidium 288
iodide (PI) (1mg/mL) were added to each sample which were then incubated for 20 min in 289
darkness at room temperature until analysis. The relative fluorescence intensity of the stained 290
nuclei was measured in a Coulter XL Flow Cytometer. For each sample, the number of nuclei 291
analyzed was approximately 5,000. The percentage of nuclei in each phase of the cell cycle 292
(G0/G1, S and G2 phases) was analyzed using the FlowJo software (Tree Star Inc., Ashland, 293
Oregon, USA). 294
295

2.11. Gene expression of cell cycle related genes 296
Total RNA extraction and cDNA synthesis were performed as described above. Gene 297
expression of cyclin B1 (CCNB1), cyclin E1 (CCNE1), cyclin-dependent kinase 1 (CDK1) and 298
cyclin-dependent kinase 2 (CDK2) were normalized with the GAPDH reference gene and 299
expressed relative to control cells, calculated from the average efficiencies and cycle thresholds 300
using the Pfaffl method (Pfaffl 2001). 301
302
2.12. Statistical analysis 303
The results are reported as mean ± standard deviation (SD) of 2 technical replicates in each of 304
the 3 independent experiments. For MTT assay, the statistical significance between control and 305
exposed cells was performed by one-way ANOVA, followed by Dunnet and Dunn’s method (as 306
parametric and non-parametric test, respectively), using Sigma Plot 12.5 software (Systat 307
Software Inc.). For the other assays, results were compared using two-way ANOVA, followed 308
by Holm-Sidak test using also Sigma Plot 12.5 software (Systat Software Inc.). The differences 309
were considered statistically significant for p < 0.05. Principal Component Analysis (PCA) was 310
used to perform multivariate analysis. All multivariate analyses in this paper were carried out 311
using the Canoco for Windows vs 4.5. 312
313
3. Results 314
3.1. Physicochemical characterization of AgNPs dispersed in water and in cell culture 315
medium 316
Scanning transmission electron microscopy (STEM) images (Figure 1) showed that AgNPs 317
were mainly spherical in shape with a mean diameter of 27.1 ± 3.0 nm and 27.7 ± 3.2 nm, for 318
citrate and PEG coated nanoparticles respectively, and with a narrow size distribution. The 319
hydrodynamic diameter (Z-average size) in water was above the primary particle size (Table 1), 320
especially in the case of PEG30 NPs, as expected based on the larger volume of PEG molecules 321
compared to citrate. The values of polydispersity indexes (PdI) were below 0.3, thus indicating 322
monodisperse distributions. As to the zeta potential, citrate-stabilized NPs carried a strong 323
negative surface charge (-42.7 ± 2.7 mV), while the surface of the PEG-stabilized NPs was 324
less negative (-12.1 ± 0.5 mV, Table 1). The amount of dissolved ionic silver in ultrapure 325
water suspensions of Cit30 and PEG30 AgNPs was 3.32 ± 0.04% and 0.63 ± 0.01%, 326
respectively. 327
Regarding the behavior of AgNPs in cell culture medium (DMEM with 10% FBS), Cit30 328
AgNPs increased their hydrodynamic diameter, as soon as they were suspended in the medium 329
and progressively over time up to 93.7 nm after 48h (Figure 2a), possibly reflecting the 330
formation of a protein corona. Additionally, the zeta potential (increased from -42.7 ± 2.7 in 331
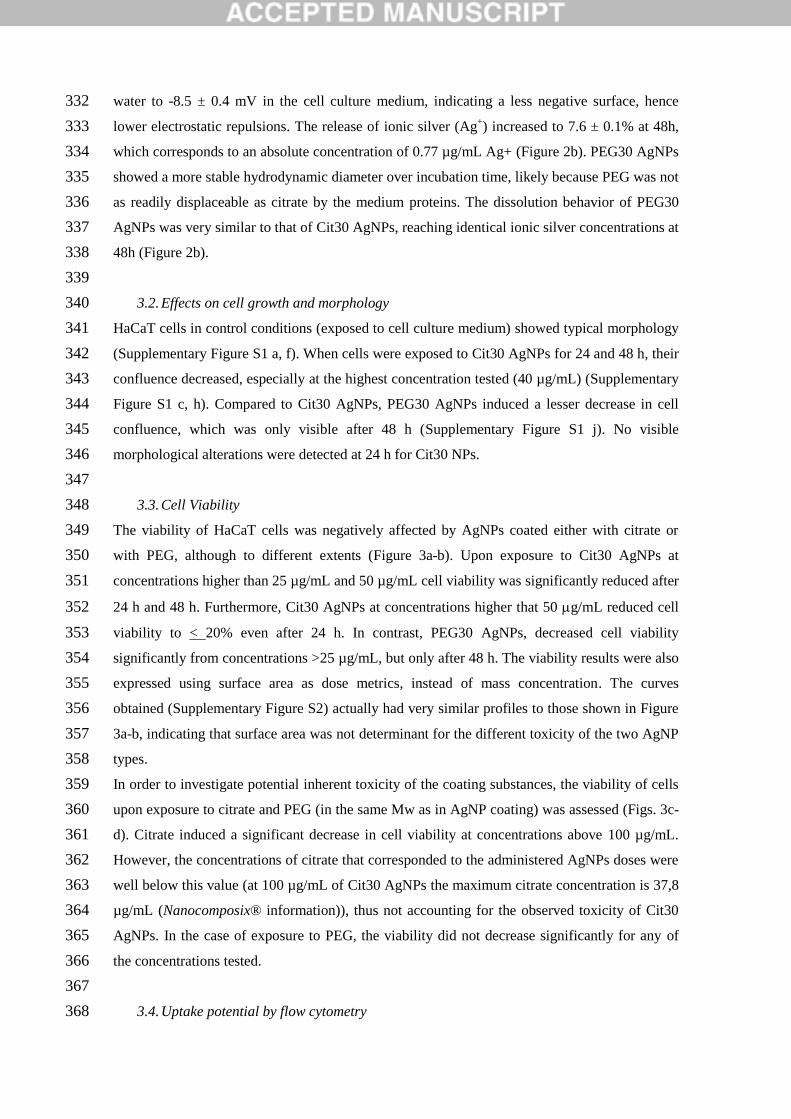
water to -8.5 ± 0.4 mV in the cell culture medium, indicating a less negative surface, hence 332
lower electrostatic repulsions. The release of ionic silver (Ag+) increased to 7.6 ± 0.1% at 48h, 333
which corresponds to an absolute concentration of 0.77 µg/mL Ag+ (Figure 2b). PEG30 AgNPs 334
showed a more stable hydrodynamic diameter over incubation time, likely because PEG was not 335
as readily displaceable as citrate by the medium proteins. The dissolution behavior of PEG30 336
AgNPs was very similar to that of Cit30 AgNPs, reaching identical ionic silver concentrations at 337
48h (Figure 2b). 338
339
3.2. Effects on cell growth and morphology 340
HaCaT cells in control conditions (exposed to cell culture medium) showed typical morphology 341
(Supplementary Figure S1 a, f). When cells were exposed to Cit30 AgNPs for 24 and 48 h, their 342
confluence decreased, especially at the highest concentration tested (40 µg/mL) (Supplementary 343
Figure S1 c, h). Compared to Cit30 AgNPs, PEG30 AgNPs induced a lesser decrease in cell 344
confluence, which was only visible after 48 h (Supplementary Figure S1 j). No visible 345
morphological alterations were detected at 24 h for Cit30 NPs. 346
347
3.3. Cell Viability 348
The viability of HaCaT cells was negatively affected by AgNPs coated either with citrate or 349
with PEG, although to different extents (Figure 3a-b). Upon exposure to Cit30 AgNPs at 350
concentrations higher than 25 µg/mL and 50 µg/mL cell viability was significantly reduced after 351
24 h and 48 h. Furthermore, Cit30 AgNPs at concentrations higher that 50 g/mL reduced cell 352
viability to < 20% even after 24 h. In contrast, PEG30 AgNPs, decreased cell viability 353
significantly from concentrations >25 µg/mL, but only after 48 h. The viability results were also 354
expressed using surface area as dose metrics, instead of mass concentration. The curves 355
obtained (Supplementary Figure S2) actually had very similar profiles to those shown in Figure 356
3a-b, indicating that surface area was not determinant for the different toxicity of the two AgNP 357
types. 358
In order to investigate potential inherent toxicity of the coating substances, the viability of cells 359
upon exposure to citrate and PEG (in the same Mw as in AgNP coating) was assessed (Figs. 3c-360
d). Citrate induced a significant decrease in cell viability at concentrations above 100 µg/mL. 361
However, the concentrations of citrate that corresponded to the administered AgNPs doses were 362
well below this value (at 100 µg/mL of Cit30 AgNPs the maximum citrate concentration is 37,8 363
µg/mL (Nanocomposix® information)), thus not accounting for the observed toxicity of Cit30 364
AgNPs. In the case of exposure to PEG, the viability did not decrease significantly for any of 365
the concentrations tested. 366
367
3.4. Uptake potential by flow cytometry 368

The uptake of both Cit30 and PEG30 AgNPs at 24h was determined by quantitative analysis of 369
the intracellular side scatter signal by flow cytometry (Figure 4). Both concentrations (10 and 40 370
µg/mL) induced an increase in the uptake potential of Cit30 AgNPs by HaCaT cells, while for 371
PEG30 an increase in the uptake potential was only observed for the highest concentration (40 372
µg/mL). Overall, the results suggest that PEG30 AgNPs are taken up by HaCaT cells to a lower 373
extent than Cit30 AgNPs. 374
375
3.5.Intracellular ROS Formation 376
The quantification of intracellular ROS in HaCaT cells exposed to AgNPs for 24h is presented 377
in Figure 5. Both Cit30 and PEG30 AgNPs induced the production of ROS reaching a 378
significant 1.2 fold increase at the highest dose tested (40 µg/mL), compared to control cells. 379
The ROS levels were similar for the two NP types. 380
381
3.6. Inflammatory Cytokine release 382
Significant differences in cytokine release upon AgNPs exposure were noted only for MCP-1, 383
while there was no effect on the other cytokines studied (IL-1β, IL-6, IL-10 and TNF-α) (data 384
not shown). The results regarding the release of MCP-1 by HaCaT cells treated with Cit30- and 385
PEG30 AgNPs are shown in Figure 6. While LPS, used as positive control, induced a 386
significant increase in MCP-1 release at 48h, both Cit30 and PEG30 AgNPs induced a 387
significant decrease compared to control cells. 388
389
3.7. Annexin V assay 390
The potential of AgNPs to induce apoptosis in HaCaT cells was assessed by the Annexin V-391
FITC/PI assay. As shown in Figure 7 a-b, Ci30 AgNPs decreased the percentage of intact cells 392
(not significantly for 48h exposure to the highest concentration of 40 µg/mL and increased the 393
percentage of dead cells, especially at 24h exposure to the high concentration. Concerning early 394
apoptosis, the results showed a significant increase after 48 h exposure to 40 µg/mL Cit30 395
AgNPs, while the percentage of cells at late apoptosis/necrosis was increased for all conditions 396
(not significantly for 48h exposure to the low concentration) In contrast, the exposure of HaCaT 397
cells to PEG30 AgNPs did not induce any significant changes in the apoptosis profile for neither 398
periods or NP concentrations (Figure 7 c-d). 399
400
3.8. Gene Expression of apoptosis related genes 401
Apoptosis was evaluated at transcriptional level by the analysis of the expression of apoptosis 402
related genes BAX, BCL2 and CASP3 (Figure 8). In cells exposed to Cit30 AgNPs, there was a 403
trend for BAX expression to be upregulated, reaching statistical significance at low 404

concentration (10 µg/mL) 24h exposure and at high concentration (40 µg/mL) 48 h exposure. 405
Moreover, BCL2 was found to be upregulated at 48h exposure to high concentration of Cit30 406
AgNPs. On the other hand, the three genes showed consistent upregulation in cells exposed to 407
PEG30 AgNPs. The statistical comparison between Cit30 and PEG30 AgNPs exposed cells 408
showed that for both times and concentrations the expression level of the three selected genes 409
was significant lower in cells exposed to Cit30 AgNPs. 410
411
3.9. Cell cycle and clastogenicity 412
Figure 8 shows the effect of Cit30 and PEG30 AgNPs on the cell cycle of HaCaT cells. Cit30 413
AgNPs in both doses induced a decrease in the percentage of cells in G0/G1 and an increase in 414
the percentage of cells in G2, this effect being visible for both periods, but more pronounced at 415
48 h (p < 0.01) (Figure 9a). As for PEG30 AgNPs, in addition to a decrease in the number of 416
cells in G0/G1 and a slight increase in cells at G2 there was a significant increase in the number 417
of cells in S phase An example of the histograms obtained after 40 µg/mL Cit30 and PEG30 418
AgNPs exposure during 48 h are shown in Supplementary Figure S3. 419
420
3.10. Expression of cell cycle related genes 421
Exposure to AgNPs significantly changed the expression levels of selected genes involved in 422
cell cycle regulation (Figure 10). Exposure to Cit30 AgNPs downregulated the expression of 423
cyclin B1 gene (CCNB1) for 40 µg/mL at both time points. For PEG30 AgNPs CCNB1, 424
expression was decreased for 40 µg/mL only at 48 h exposure. The expression of the CDK2 425
gene, for cells exposed to citrate- AgNPs was increased for 40 µg/mL at 24 h and decreased at 426
48 h for the same concentration. The expression of the other genes tested was not significantly 427
altered upon exposure to AgNPs. 428
429
4. Discussion 430
In this work, we have investigated the cellular effects of well-characterized AgNPs with 431
different coatings (citrate and PEG) but the same nominal diameter (30 nm), in order to address 432
the influence of NP surface coating on biological outcomes in keratinocytes, assessing, among 433
other endpoints, less commonly reported changes in cell cycle dynamics. Further motivation for 434
testing the toxicity of these NP types arose from the growing interest in using PEG-coated NPs 435
in nanomedicine applications (Jokerst et al. 2011) and the widespread use of citrate coating in 436
AgNPs synthesis (Zhang et al. 2011), thus making it timely and useful to report on the cytotoxic 437
effects of such particles. 438
The characterization results revealed that AgNPs exhibited different time-course behavior in 439
culture medium, depending on the coating surface. The hydrodynamic diameter of Cit30 AgNPs 440
increased immediately after suspension in culture medium, which is in agreement with previous 441
E
** **
** **

observations (Wang et al. 2014) and is likely to be due to the formation of a protein corona, as 442
reported for metal nanoparticles (Casals et al. 2010; Maiorano et al. 2010). Moreover, some 443
aggregation induced by the high ionic strength of the culture medium may also have occurred 444
(El Badawy et al. 2012; Li et al. 2012; Robert 2010). Conversely, the hydrodynamic diameter of 445
PEG30 AgNPs did not show significant variation in culture medium indicating high colloidal 446
stability, which is likely to derive from steric repulsions (Caballero-Díaz et al. 2013), and lower 447
propensity for the PEG coating molecules to be displaced by proteins (Michel et al. 2005). 448
In terms of cell viability, evaluated through the MTT mitochondrial activity assay, Cit30 AgNPs 449
were found to be more cytotoxic than PEG30 AgNPs. Although, to our knowledge, the direct 450
comparison between these two NP types hasn’t been previously reported, Wang et al. (2014) 451
found a significant decrease in the viability of bronchial BEAS-2B cells upon 24h exposure to 452
20 nm citrate-coated AgNPs at 6.25-50 µg/mL, while Song et al. (2012) showed PEG-coated 453
AgNPs to cause significant viability decreases in human liver cells (HL-7702) at concentrations 454
as low as 6.25 μg/mL. Differences in NP properties (e.g. size and surface area) as well as cell 455
type-dependent effects (e.g. uptake) may account for the discrepancy in relation to our results. 456
The coating substances per se were not responsible for the larger cytotoxicity hereby found for 457
Cit30 NPs compared to PEG30 NPs, as neither of them decreased cell viability at the 458
concentrations present when AgNPs were administered to cells. Also, Cit30 and PEG30 NPs 459
showed similar dissolution behavior in culture medium, thus extracellular Ag+ could not justify 460
the difference in the toxicity of the two NP types. Accordingly, Gliga and co-workers (Gliga et 461
al. 2014) have shown that AgNPs supernatants, containing ionic silver, did not affect cells. On 462
the other hand, the intracellular release of Ag+ following cellular uptake (sometimes called the 463
Trojan horse effect) has been proposed by several authors (Hsiao et al. 2015; Park et al. 2010) to 464
be greatly responsible for AgNPs toxicity. Thus, it is possible that the different coatings used in 465
our study influenced cytotoxicity indirectly, by modulating the interaction of NPs with cells, 466
namely the extent of NP uptake and intracellular release of Ag+. 467
To quantitatively evaluate the cellular uptake of AgNPs we have used flow cytometry and 468
related the increase in side scatter (SS) intensity with an increase in intracellular AgNPs, as 469
previously described (e.g. Greulich et al. 2011, Zucker et al. 2013). The obtained data suggested 470
that PEG30 AgNPs were taken up by cells to a lower extent than Cit30 AgNPs, which could 471
justify the lower cytotoxic potential of the former particles. Concordantly, Caballero-Díaz et al 472
(2013) showed that pegylation of polymer-coated AgNPs reduced cellular uptake and toxicity to 473
mouse embryonic fibroblasts (NIH/3T3 cells). Furthermore, it can be postulated that thiolated 474
PEG may complex Ag+ ions and lower their bioavailability and toxicity, as proposed for PVP-475
coated AgNPs (Wang et al. 2014). Also, when evaluating the uptake rates of gold NPs on 476
human alveolar epithelial cells (A549), Brandenberger et al (2010) observed that significantly 477
more plain NPs (i.e., stabilized with citrate buffer) could enter the cells than PEG-coated gold 478

NPs. 479
ROS can be generated either by a direct pro-oxidant effect of the NP or endogenously upon 480
interaction with cellular material. In our work, both NP types caused a similar increase in 481
intracellular ROS, supporting ROS-induced cytotoxicity, although not explaining the higher 482
toxicity of Cit30 compared to PEG30 AgNPs. Enhanced ROS production has been often 483
highlighted as a major cause for AgNP toxicity in several cell types (Kim and Ryu 2013), 484
although it has also been reported, in human liver and colon cells, that AgNPs could cause 485
cytotoxicity without oxidative stress (Sahu et al. 2014). Furthermore, Chairuangkittia et al. 2013 486
described that the toxicity of AgNPs to A549 was due both to ROS dependent and independent 487
pathways, the latter related with cell cycle arrest. Our results show that both AgNPs induce 488
arrest in cell cycle at 24h with more drastic effects for Cit30 at 48h. In fact, in previous studies 489
from our group (Carrola et al. 2016) the cell metabolic profile of HaCaT cells exposed to the 490
same Cit30 AgNPs was evaluated and an increase in GSH was detected, suggesting the 491
triggering of a protective mechanism against ROS-induced oxidative damage, which is 492
consistent with the strong antioxidant capacity of this cell line (Mukherjee et al 2012). 493
Therefore, from our results we can hypothesize that the induction of ROS is one of several 494
mechanisms of AgNP induced toxicity in HaCaT cells. Further studies are needed to clarify how 495
the different coatings modulate ROS dependent and independent pathways of AgNPs induced 496
toxicity. 497
Regarding cytokine release, the only significant effect was a decrease in MCP-1 production 498
compared to control cells, caused in similar extent by Cit30 and PEG30 NPs. Other cytokines, 499
namely IL-1β, IL-6, IL-10 and TNF-α did not vary upon AgNPs exposure. These results are 500
comparable to those reported by Orlowski et al. (2013), where AgNPs coated with tannic acid 501
led to a decrease of MCP-1 and non-relevant changes in the IL family. However, the same study 502
reported an increase of MCP-1 in murine monocytes and keratinocytes after exposure to 503
unmodified AgNPs, showing that coating can influence the inflammatory response to AgNPs. 504
Oppositely to our results, increases in cytokines release have also been reported by others 505
(Suliman Y et al. 2015; Yang et al. 2012); different cell types as well as different properties of 506
the AgNPs tested may account for the discrepancies observed. Also, adsorption of cytokine 507
proteins onto the NP surface may have occurred contributing to a decrease in protein function 508
(Brown et al. 2010). 509
Apoptosis and necrosis results showed that Cit30 AgNPs increased the number of necrotic cells, 510
as well as early and late apoptotic cells. A slight increase of apoptotic and necrotic A549 cells 511
after exposure to citrate-stabilized AgNPs has also been reported by Foldbjerg et al. (Foldbjerg 512
et al. 2012). On the other hand, PEG30 AgNPs did not significantly influence these populations, 513
although a trend to increase early-apoptotic cells was seen, in agreement with the results 514
reported by Zhang and co-workers (2015) for male somatic Leydig (TM3) and Sertoli (TM4) 515

cells. Interestingly, in the present work, the expression of apoptosis-related genes was also 516
found to differ between Cit30 and PEG30 NPs. In particular, PEG30 AgNPs increased the 517
expression of BAX (pro-apoptotic), BCL-2 (anti-apoptotic) and CASP-3 genes at both 518
concentrations and time points. Piao and co-workers (2011) observed that AgNPs induced a 519
mitochondria-dependent apoptotic pathway via modulation of BAX and BCL-2 expressions, 520
resulting in the disruption of mitochondrial membrane potential, followed by cytochrome c 521
release from the mitochondria and activation of caspases 9 and 3. Furthermore, Jeyaraj and co-522
workers (2015) found an upregulation of BAX, caspases-6 and -9 and downregulation of BCL-2. 523
In our study, both BCL-2 and BAX and of the effector CASP-3 were upregulated, particularly by 524
PEG30 AgNPs, supporting that these NPs were more prone to induce intrinsic apoptosis than 525
Cit30 NPs. This difference between the two NP types concerning the effects on 526
apoptotic/necrotic cells and on the transcripts of apoptotic-related genes strongly suggests that, 527
when exposed to PEG30 AgNPs, HaCaT cells may cope with the apoptotic cascade at the early 528
stage, promoting apoptotic and antiapoptotic expression and resulting in lower cytotoxicity. The 529
upregulation of BCL-2 by PEG30 AgNPs was particularly relevant. Belonging to the anti-530
apoptotic protein family, it performs its anti-death function by sequestering monomeric BAX 531
and BAK. It is known that certain cancer cells depend upon BCL-2 and other anti-apoptotic 532
proteins for survival (Brunelle and Letai 2009). In contrast, Cit30 AgNPs seemed to act mainly 533
at a necrotic level and, in the cells undergoing apoptosis, this will lead to cell death. Overall, our 534
data showed that Cit30 and PEG30 AgNPs differed in the way they induced apoptosis, with the 535
former leading to necrotic/late apoptotic processes, and the latter stimulating both apoptotic and 536
anti-apoptotic transcripts, which may modulate cells apoptotic response at the early stage. This 537
influence of NP coating on the apoptotic/necrotic mechanisms was also evidenced by the PCA 538
analyses (Figure 11). 539
Both Cit30 and PEG30 AgNPs were found to induce changes on the cell cycle dynamics of 540
HaCaT cells. In particular, Cit30 AgNPs induced a significant increase in the percentage of cells 541
in G2, indicating an arrest at this phase, visible for both concentrations and time periods, while 542
the PEG30 AgNPs induced an increase in the number of cells in S phase, more visible at 24 h, 543
pointing to an S phase delay. The cell cycle arrest in G2/M phase after exposure to NPs was 544
previously related to DNA damage repair (AshaRani et al. 2009). Indeed, in another report, we 545
have presented data showing that Cit30 AgNPs induced DNA damage and micronucleus (MNi) 546
formation, increased mononucleated cells, and decreased binucleated cells and the nuclear 547
division index, thus pointing to clear cytostatic effects even at a low dose (~IC20) and after a 548
short period of exposure (24 h) (Bastos et al, 2016, manuscript submitted). Cell cycle arrest at 549
G2 as a result of AgNP exposure was previously observed by others (AshaRani et al. 2009; 550
Kang et al. 2012; Lee et al. 2011; Wei et al. 2010). For instance, Song et al. (2012) found an 551
increase in the percentage of liver cells at the G2/M phase upon 24h exposure to 100 µg/mL 552

mPEG-SH coated AgNPs. Also, Foldbjerg et al. (2012) found that PVP-coated AgNPs 553
significantly increased the percentage of A549 cells in G2/M and S phases. S phase delay was 554
also observed by Liu et al. (2010) in HepG2 cells exposed to PVP-coated AgNPs. Furthermore, 555
an increase in the sub-G1 population of cells (which may indicate apoptosis) was reported by 556
Jiang et al. (2013) in CHO-K1 cells exposed to BSA-coated AgNPs and by Chairuangkitti et al. 557
(2013) in A549 cells exposed to 200 µg/mL AgNPs. Li et al. (2013) reported cell cycle arrest at 558
G0/G1 phase and a shortened S phase after only 8 h of AgNPs exposure, showing that AgNPs 559
may interfere in cell cycle regulation at different checkpoints. In the present work, we have also 560
assessed the expression of selected cell cycle regulator genes. Exposure to Cit30 AgNPs at 40 561
µg/mL for 24 and 48h induced downregulation of CCNB1, while for PEG30 AgNPs, the 562
expression of CCNB1 was only significantly decreased after exposure for 48 h. Cyclin B1, 563
encoded by the CCNB1 gene, is a regulatory protein which complexes with CDK1, both playing 564
a determinant role in G2/M phase transition of the cell cycle. In general, our results agree with 565
the study of Foldbjerg and co-workers (2012), where they found downregulation of CCNB1 and 566
CDK1 for the A549 cell line exposed to AgNPs during 24 and 48 h. Furthermore, we found a 567
statistically significant difference between the two NP types for the expression of CCNE1. 568
Cyclin E1, encoded by the CCNE1 gene, forms a complex with CDK2, which accumulates at 569
the G1-S phase and is degraded as cells progress through the S phase. CCNE1 expression was 570
generally lower upon exposure to PEG30 compared to Cit30 exposure, which agrees with the 571
increase in the percentage of cells in S phase observed for PEG30 AgNPs. AshaRani et al. 572
(2012) also reported downregulation of CCNB1 and CCNE1 genes in lung and brain cells 573
exposed to AgNPs. In summary, as corroborated by the PCA analysis (Figure 10), coating 574
influenced the way that AgNPs interfered with the cell cycle, with Cit30 AgNPs leading to an 575
impairment of the MPF (maturation promoting factor) complex and blocking cells in G2, and 576
PEG30 AgNPs leading to a delay in the S-phase. Impacts on cell cycle are not routinely 577
assessed for NPs, and we suggest that this response is tested for a wider range of NPs and cell 578
types in the future. 579
580
5. Conclusions 581
In summary, this study demonstrates that the widely used citrate-coated AgNPs decreased the 582
viability of HaCaT cells more severely than PEG-coated AgNPs. This difference was not due to 583
putative effects of the coating molecules per se (as they produced no cytotoxicity), neither to the 584
extent of extracellular release of ionic silver or the amount of ROS produced, as they were 585
similar for both NP types. The differently coated AgNPs produced, however, distinct effects 586
regarding the mode of cell death and cell cycle progression. While Cit30 AgNPs clearly induced 587
apoptotic/necrotic death, cells exposed to PEG30 AgNPs appeared to be at an earlier phase of 588
apoptosis mechanisms, as supported by gene expression analysis. With regard to the impact on 589

cell cycle progression, both Cit30 and PEG30 AgNPs affected cell cycle regulation of HaCaT 590
cells, but, again, citrate-coating induced more severe effects, showing earlier downregulation of 591
the cyclin B1 gene and blockage of cells at G2. Considering that AgNPs are present in a vast 592
number of consumer products, it is important to determine if or which NPs are more cytotoxic. 593
This study suggests that PEG-coating can be regarded as a good alternative to citrate 594
stabilization of AgNPs used in industrial and medical applications, where it is important to 595
reduce the toxicity towards human skin cells. The applicability of these findings to other cell 596
types needs to be investigated in future studies. 597
598
Acknowledgments 599
This work was developed in the scope of the projects CICECO-Aveiro Institute of Materials 600
(Ref. FCT UID/CTM/50011/2013) and CESAM (Ref. FCT UID/AMB/50017/2013), financed 601
by national funds through the FCT/MEC and when applicable co-financed by the European 602
Regional Development Fund (FEDER) under the PT2020 Partnership Agreement. Funding to 603
the project FCOMP-01-0124-FEDER-021456 (Ref. FCT PTDC/SAU-TOX/120953/2010) by 604
FEDER through COMPETE and by national funds through FCT, and the FCT-awarded grants 605
(SFRH/BD/81792/2011; SFRH/BPD/48853/2008; SFRH/BPD/74868/2010) are acknowledged. 606
I.F.D and A.L.D.S. acknowledge FCT/MCTES for the research contracts under the Program 607
‘Investigador FCT’ 2014. Authors acknowledge Tiago Pedrosa for the technical assistance in 608
MTT assay and ROS assessment. 609
610
611
References 612
Abdelhalim MAK, Jarrar BM. Renal tissue alterations were size-dependent with smaller ones 613 induced more effects and related with time exposure of gold nanoparticles. Lipids Health Dis. 614 2011; 10. 615
Ahamed M, Alsalhi M, Siddiqui M. Silver nanoparticle applications and human health. Clin 616 Chim Acta. 2010; 411.23: 1841-1848. 617
Ahlberg S, Meinke MC, Werner L, Epple M, Diendorf J, Blume-Peytavi U, Lademann J, Vogt A, 618 Rancan F. Comparison of silver nanoparticles stored under air or argon with respect to the 619 induction of intracellular free radicals and toxic effects toward keratinocytes. Eur J Pharm 620 Biopharm. 2014; 88.3: 651-657 621
AshaRani P, Low Kah Mun G, Hande M, Valiyaveettil S. Cytotoxicity and genotoxicity of silver 622 nanoparticles in human cells. ACS Nano. 2009; 3:279-290. 623
Asharani P, Sethu S, Lim H, Balaji G, Valiyaveettil S, Hande M. Differential regulation of 624 intracellular factors mediating cell cycle, DNA repair and inflammation following exposure to 625 silver nanoparticles in human cells. Genome Integr. 2012; 3.1: 2. 626
Behra R, Sigg L, Clift M, Herzog F, Minghetti M, Johnston B, Petri-Fink A, Rothen-Rutishauser 627 B. Bioavailability of silver nanoparticles and ions: from a chemical and biochemical 628 perspective. J R Soc, Interface. 2013; 10:20130396. 629

Benn T, Westerhoff P. Nanoparticle silver released into water from commercially available sock 630 fabrics. Environ Sci Technol. 2008; 42:4133-4139. 631
Boonkaew B, Kempf M, Kimble R, Cuttle L. Cytotoxicity testing of silver-containing burn 632 treatments using primary and immortal skin cells. Burns. 2014: 40.8: 1562-1569 633
Boukamp P, Petrussevska R, Breitkreutz D, Hornung J, Markham A, Fusenig N. Normal 634 keratinization in a spontaneously immortalized aneuploid human keratinocyte cell line. J Cell 635 Biol. 1988; 106:761-771. 636
Braakhuis HM, Cassee FR, Fokkens PH, de la Fonteyne LJ, Oomen AG, Krystek P, de Jong WH, 637 van Loveren H, Park MV. Identification of the appropriate dose metric for pulmonary 638 inflammation of silver nanoparticles in an inhalation toxicity study. Nanotoxicology. 2016 (in 639 press).Brandenberger C, Mühlfeld C, Ali Z, Lenz A-GG, Schmid O, Parak WJ, Gehr P, Rothen-640 Rutishauser B. Quantitative evaluation of cellular uptake and trafficking of plain and 641 polyethylene glycol-coated gold nanoparticles. Small. 2010; 6:1669-1678. 642
Brown DM, Dickson C, Duncan P, Al-Attili F, Stone V. Interaction between nanoparticles and 643 cytokine proteins: impact on protein and particle functionality. Nanotechnology. 2010; 644 21:215104. 645
Browning L, Lee K, Nallathamby P, Xu X-HN. Silver nanoparticles incite size- and dose-646 dependent developmental phenotypes and nanotoxicity in zebrafish embryos. Chem Res 647 Toxicol. 2013; 26:1503-1513. 648
Brunelle JK, Letai A. Control of mitochondrial apoptosis by the Bcl-2 family. J Cell Sci. 2009; 649 122:437-441. 650
Caballero-Díaz E, Pfeiffer C, Kastl L, Gil P, Simonet B, Valcárcel M, Lamana J, Laborda F, 651 Parak WJ. The toxicity of silver nanoparticles depends on their uptake by cells and thus on their 652 surface chemistry. Part Part Syst Char. 2013; 30:1079-1085. 653
Carrola J, Bastos V, Ferreira de Oliveira JM, Oliveira H, Santos C, Gil AM, Duarte IF. Insights 654 into the impact of silver nanoparticles on human keratinocytes metabolism through NMR 655 metabolomics. Arch Biochem Biophys. 2016; 589:53-61. 656
Casals E, Pfaller T, Duschl A, Oostingh GJ, Puntes V. Time evolution of the nanoparticle protein 657 corona. ACS Nano. 2010; 4:3623-3632. 658
Chairuangkitti P, Lawanprasert S, Roytrakul S, Aueviriyavit S, Phummiratch D, Kulthong K, 659 Chanvorachote P, Maniratanachote R. Silver nanoparticles induce toxicity in A549 cells via 660 ROS-dependent and ROS-independent pathways. Toxicol In Vitro. 2013; 27.1: 330-338. 661
Chen X, Schluesener H. Nanosilver: a nanoproduct in medical application. Toxicol Lett. 2008; 662 176:1-12. 663
Comfort KK, Maurer EI, Hussain SM. Slow release of ions from internalized silver nanoparticles 664 modifies the epidermal growth factor signaling response. Colloid Surface B. 2014; 123: 136-665 142 666
Eckhardt S, Brunetto P, Gagnon J, Priebe M, Giese B, Fromm K. Nanobio silver: its interactions 667 with peptides and bacteria, and its uses in medicine. Chem Rev. 2013; 113:4708-4754. 668
El Badawy AM, Scheckel KG, Suidan M, Tolaymat T. The impact of stabilization mechanism on 669 the aggregation kinetics of silver nanoparticles. Sci Total Environ. 2012; 429:325-331. 670
England C, Priest T, Zhang G, Sun X, Patel D, McNally L, van Berkel V, Gobin A, Frieboes H. 671 Enhanced penetration into 3D cell culture using two and three layered gold nanoparticles. Int J 672 Nanomed. 2013; 8:3603-3617. 673
EPA EPA. State of the Science Literature Review: Everything Nanosilver and More. Scientific, 674 Technical, Research, Engineering and Modeling Support Final Report. 2010. 675
Fernández-López C, Mateo-Mateo C, Alvarez-Puebla R, Pérez-Juste J, Pastoriza-Santos I, Liz-676

Marzán L. Highly controlled silica coating of PEG-capped metal nanoparticles and preparation 677 of SERS-encoded particles. Langmuir. 2009; 25:13894-13899. 678
Foldbjerg R, Irving E, Hayashi Y, Sutherland D, Thorsen K, Autrup H, Beer C. Global gene 679 expression profiling of human lung epithelial cells after exposure to nanosilver. Toxicol Sci. 680 2012; 130:145-157. 681
George R, Merten S, Wang TT, Kennedy P, Maitz P. In vivo analysis of dermal and systemic 682 absorption of silver nanoparticles through healthy human skin. Australas J Dermatol. 2014; 683 55:185-190. 684
Gliga A, Skoglund S, Odnevall Wallinder I, Fadeel B, Karlsson H. Size-dependent cytotoxicity of 685 silver nanoparticles in human lung cells: the role of cellular uptake, agglomeration and Ag 686 release. Part Fibre Toxicol. 2014; 11.11: 1-17. 687
Greulich C, Diendorf J, Simon T, Eggeler G, Epple M, Köller M. Uptake and intracellular 688 distribution of silver nanoparticles in human mesenchymal stem cells. Acta Biomater. 689 2011;7:347-54. 690
Grosse S, Evje L, Syversen T. Silver nanoparticle-induced cytotoxicity in rat brain endothelial 691 cell culture. Toxicol In Vitro. 2013; 27.1: 305-313. 692
Haberl N, Hirn S, Wenk A, Diendorf J, Epple M, Johnston B, Krombach F, Kreyling W, Schleh 693 C. Cytotoxic and proinflammatory effects of PVP-coated silver nanoparticles after intratracheal 694 instillation in rats. Beilstein J Nanotech. 2013; 4.1: 933-940. 695
Hsiao ILL, Hsieh Y-KK, Wang C-FF, Chen ICC, Huang Y-JJ. Trojan-horse mechanism in the 696 cellular uptake of silver nanoparticles verified by direct intra- and extracellular silver speciation 697 analysis. Environ Sci Technol. 2015; 49:3813-3821. 698
Jeyaraj M, Renganathan A, Sathishkumar G. Biogenic metal nanoformulations induce Bax/Bcl2 699 and caspase mediated mitochondrial dysfunction in human breast cancer cells (MCF 7). RSC 700 Adv. 2015; 5.3:2159-2166. 701
Jiang X, Foldbjerg R, Miclaus T, Wang L, Singh R, Hayashi Y, Sutherland D, Chen C, Autrup H, 702 Beer C. Multi-platform genotoxicity analysis of silver nanoparticles in the model cell line CHO-703 K1. Toxicol Lett. 2013; 222:55-63. 704
Jokerst JV, Lobovkina T, Zare RN, Gambhir SS. Nanoparticle PEGylation for imaging and 705 therapy. Nanomedicine (Lond). 2011; 6:715-728. 706
Kang S, Lee Y, Lee E-K, Kwak M-K. Silver nanoparticles-mediated G2/M cycle arrest of renal 707 epithelial cells is associated with NRF2-GSH signaling. Toxicol Lett. 2012; 211:334-341. 708
Kennedy AJ, Hull MS, Diamond S, Chappell M, Bednar AJ, Laird JG, Melby NL, Steevens JA. 709 Gaining a critical mass: a dose metric conversion case study using silver nanoparticles. Environ 710 Sci Technol. 2015; 49:12490-12499. 711
Kim S, Choi J, Choi J, Chung K-H, Park K, Yi J, Ryu D-Y. Oxidative stress-dependent toxicity 712 of silver nanoparticles in human hepatoma cells. Toxicol In Vitro. 2009; 23:1076-1084. 713
Kim S, Ryu D-Y. Silver nanoparticle-induced oxidative stress, genotoxicity and apoptosis in 714 cultured cells and animal tissues. J Appl Toxicol. 2013; 33:78-89. 715
Kim TH, Kim M, Park HS, Shin US, Gong MS, Kim HW. Size-dependent cellular toxicity of 716 silver nanoparticles. J Biomed Mater Res Part A. 2012; 100A:1033-1043. 717
Larese FF, D'Agostin F, Crosera M, Adami G, Renzi N, Bovenzi M, Maina G. Human skin 718 penetration of silver nanoparticles through intact and damaged skin. Toxicology. 2009, 255:33-719 37. 720
Lee Y, Kim D, Oh J, Yoon S, Choi M, Lee S, Kim J, Lee K, Song C-W. Silver nanoparticles 721 induce apoptosis and G2/M arrest via PKCζ-dependent signaling in A549 lung cells. Arch 722 Toxicol. 2011; 85:1529-1540. 723

Li X, Lenhart JJ, Walker HW. Aggregation kinetics and dissolution of coated silver nanoparticles. 724 Langmuir. 2012; 28:1095-1104. 725
Li X, Xu L, Shao A, Wu G, Hanagata N. Cytotoxic and genotoxic effects of silver nanoparticles 726 on primary Syrian hamster embryo (SHE) cells. J Nanosci Nanotechnol. 2013; 13:161-170. 727
Liu W, Wu Y, Wang C, Li H, Wang T, Liao C, Cui L, Zhou Q, Yan B, Jiang G. Impact of silver 728 nanoparticles on human cells: effect of particle size. Nanotoxicology. 2010; 4:319-330. 729
Lu W, Senapati D, Wang S, Tovmachenko O, Singh A, Yu H, Ray P. Effect of Surface Coating 730 on the Toxicity of Silver Nanomaterials on Human Skin Keratinocytes. Chem Phys Lett. 2010; 731 487. 732
Maiorano G, Sabella S, Sorce B, Brunetti V, Malvindi MA, Cingolani R, Pompa PP. Effects of 733 cell culture media on the dynamic formation of protein-nanoparticle complexes and influence on 734 the cellular response. ACS Nano. 2010; 4:7481-7491. 735
Michel R, Pasche S, Textor M, Castner DG. Influence of PEG architecture on protein adsorption 736 and conformation. Langmuir. 2005; 21:12327-12332. 737
Mukherjee SG, O'Claonadh N, Casey A, Chambers G.Comparative in vitro cytotoxicity study of 738 silver nanoparticle on two mammalian cell lines. Toxicol In Vitro. 2012;26:238-51. 739
Nowack B, Bucheli T. Occurrence, behavior and effects of nanoparticles in the environment. 740 Environ Pollut. 2007; 150:5-22. 741
Nowack B, Krug H, Height M. 120 years of nanosilver history: implications for policy makers. 742 Environ Sci Technol. 2011; 45:1177-1183. 743
Nymark P, Catalán J, Suhonen S, Järventaus H, Birkedal R, Clausen P, Jensen K, Vippola M, 744 Savolainen K, Norppa H. Genotoxicity of polyvinylpyrrolidone-coated silver nanoparticles in 745 BEAS 2B cells. Toxicology. 2013; 313:38-48. 746
Oliveira H, Monteiro C, Pinho F, Pinho S, Ferreira de Oliveira JM, Santos C. Cadmium-induced 747 genotoxicity in human osteoblast-like cells. Mutat Res Genet Toxicol Environ Mutagen. 2014; 748 775-776:38-47. 749
Orlowski P, Krzyzowska M, Zdanowski R, Winnicka A, Nowakowska J, Stankiewicz W, 750 Tomaszewska E, Celichowski G, Grobelny J. Assessment of in vitro cellular responses of 751 monocytes and keratinocytes to tannic acid modified silver nanoparticles. Toxicol In Vitro. 752 2013; 27:1798-1808. 753
Park E-JJ, Yi J, Kim Y, Choi K, Park K. Silver nanoparticles induce cytotoxicity by a Trojan-754 horse type mechanism. Toxicol In Vitro. 2010; 24:872-878. 755
Park J, Lim D-HH, Lim H-JJ, Kwon T, Choi J-sS, Jeong S, Choi I-HH, Cheon J. Size dependent 756 macrophage responses and toxicological effects of Ag nanoparticles. Chem Commun. 2011; 757 47.15: 4382-4384. 758
Pfaffl M. A new mathematical model for relative quantification in real-time RT-PCR. Nucleic 759 Acids Res. 2001; 29.9:e45-e45. 760
Piao MJ, Kang KA, Lee IK, Kim HS, Kim S, Choi JY, Choi J, Hyun JW. Silver nanoparticles 761 induce oxidative cell damage in human liver cells through inhibition of reduced glutathione and 762 induction of mitochondria-involved apoptosis. Toxicol Lett. 2011; 201:92-100. 763
Povoski SP, Davis PD, Colcher D, Martin EW. Single molecular weight discrete PEG 764 compounds: emerging roles in molecular diagnostics, imaging and therapeutics. Expert Rev Mol 765 Diagn. 2013; 13:315-319. 766
Robert, I.M. 2010. Colloidal stability of silver nanoparticles in biologically relevant conditions. 767 Journal of Nanoparticle Research. 768
Rozen S, Skaletsky H. Primer3 on the WWW for general users and for biologist programmers. 769
Methods Mol Biol. 2000; 132:365-386. 770
Sahu SC, Zheng J, Graham L, Chen L, Ihrie J, Yourick JJ, Sprando RL. Comparative cytotoxicity 771 of nanosilver in human liver HepG2 and colon Caco2 cells in culture. J Appl Toxicol. 2014; 772 34:1155-1166. 773
Samberg ME, Oldenburg SJ, Monteiro-Riviere NA. Evaluation of Silver Nanoparticle Toxicity in 774 Skin in Vivo and Keratinocytes in Vitro. Environ Health Perspect. 2010; 118:407-413. 775
Sharma V, Yngard R, Lin Y: Silver nanoparticles: green synthesis and their antimicrobial 776 activities. Adv Colloid Interfac. 2009; 145.1:83-96. 777
Song X-l, Li B, Xu K, Liu J, Ju W, Wang J, Liu X-d, Li J, Qi Y-f. Cytotoxicity of water-soluble 778 mPEG-SH-coated silver nanoparticles in HL-7702 cells. Cell Biol Toxicol. 2012; 28:225-237. 779
Suk JS, Lai SK, Boylan NJ, Dawson MR, Boyle MP, Hanes J. Rapid transport of muco-inert 780 nanoparticles in cystic fibrosis sputum treated with N-acetyl cysteine. Nanomedicine-UK. 2011; 781 6:365-375. 782
Suliman Y AO, Ali D, Alarifi S, Harrath AH, Mansour L, Alwasel SH. Evaluation of cytotoxic, 783 oxidative stress, proinflammatory and genotoxic effect of silver nanoparticles in human lung 784 epithelial cells. Environ Toxicol. 2015; 30:149-160. 785
Suzuki H, Toyooka T, Ibuki Y. Simple and easy method to evaluate uptake potential of 786 nanoparticles in mammalian cells using a flow cytometric light scatter analysis. Environ Sci 787 Technol. 2007; 41: 3018–3024 788
Tao X, Ning Z, Heather LN, Donglu S, Xuejun W. Modification of nanostructured materials for 789 biomedical applications. Mater Sci Eng: C. 2007; 27.3: 579-594. 790
Thorley AJ, Tetley TD. New perspectives in nanomedicine. Pharmacol Therapeut. 2013; 791 140:176-185. 792
Twentyman P, Luscombe M. A study of some variables in a tetrazolium dye (MTT) based assay 793 for cell growth and chemosensitivity. Brit J Cancer. 1987; 56:279-285. 794
Wang X, Ji Z, Chang CH, Zhang H, Wang M, Liao Y-PP, Lin S, Meng H, Li R, Sun B, et al. Use 795 of coated silver nanoparticles to understand the relationship of particle dissolution and 796 bioavailability to cell and lung toxicological potential. Small. 2014, 10:385-398. 797
Wei L, Tang J, Zhang Z, Chen Y, Zhou G, Xi T. Investigation of the cytotoxicity mechanism of 798 silver nanoparticles in vitro. Biomed Mater. 2010; 5:44103. 799
Yang E-JJ, Jang J, Lim D-HH, Choi I-HH. Enzyme-linked immunosorbent assay of IL-8 800 production in response to silver nanoparticles. Methods Mol Biol. 2012; 926:131-139. 801
Zhang T, Wang L, Chen Q, Chen C. Cytotoxic potential of silver nanoparticles. Yonsei Med J. 802 2014; 55:283-291. 803
Zhang W, Yao Y, Sullivan N, Chen Y. Modeling the primary size effects of citrate-coated silver 804 nanoparticles on their ion release kinetics. Environ Sci Technol. 2011; 45:4422-4428. 805
Zhang X-FF, Choi Y-JJ, Han JW, Kim E, Park JH, Gurunathan S, Kim J-HH. Differential 806 nanoreprotoxicity of silver nanoparticles in male somatic cells and spermatogonial stem cells. 807 Int J Nanomed. 2015; 10:1335-1357. 808
Zhao S, Fernald R. Comprehensive algorithm for quantitative real-time polymerase chain 809 reaction. J Comput Biol. 2005; 12:1047-1064. 810
Zucker RM, Daniel KM, Massaro EJ, Karafas SJ, Degn LL, Boyes WK. Detection of silver 811 nanoparticles in cells by flow cytometry using light scatter and far-red fluorescence. Cytometry 812 A. 2013;83(10):962-72. 813 814
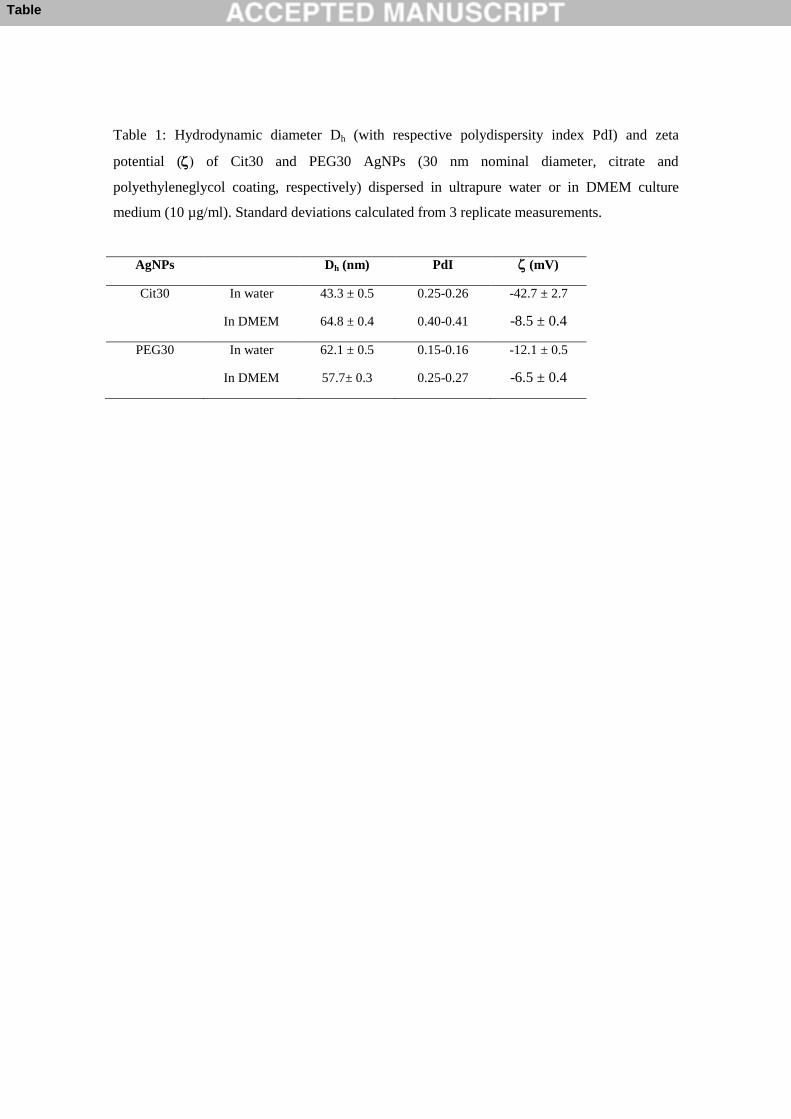
Table 1: Hydrodynamic diameter Dh (with respective polydispersity index PdI) and zeta
potential ( of Cit30 and PEG30 AgNPs (30 nm nominal diameter, citrate and
polyethyleneglycol coating, respectively) dispersed in ultrapure water or in DMEM culture
medium (10 µg/ml). Standard deviations calculated from 3 replicate measurements.
AgNPs Dh (nm) PdI (mV)
Cit30 In water 43.3 ± 0.5 0.25-0.26 -42.7 ± 2.7
In DMEM 64.8 ± 0.4 0.40-0.41 -8.5 ± 0.4
PEG30 In water 62.1 ± 0.5 0.15-0.16 -12.1 ± 0.5
In DMEM 57.7± 0.3 0.25-0.27 -6.5 ± 0.4
Table

Figure 1: STEM micrographs of Cit30 and PEG30 AgNPs (30 nm nominal diameter, citrate and
polyethyleneglycol coating, respectively) dispersed in deionized water (5 µg/ml).
Figure 2: a) Z-average size and b) % dissolution to Ag+ of Cit30 and PEG30 AgNPs (30 nm
nominal diameter, citrate and polyethyleneglycol coating, respectively) incubated in culture
medium (10 µg/mL) at 37ºC for 4, 24 and 48h. Error bars correspond to the standard deviations
of 3 replicate measurements.
Figure 3: Relative cell viability of HaCaT (%), measured by MTT assay, for 24 h and 48 h. a)
Cit30 AgNPs; b) PEG30 AgNPs; c) Citrate – for 24 h and d) PEG – for 24 h. Data expressed as
mean and standard deviation. * indicate significant differences between control at p < 0.05 for
24h and # indicate significant differences between control at p < 0.05 for 48h.
Figure 4: Uptake potential of AgNP by HaCaT cells assessed by the side scattered light by flow
cytometry. The results were expressed as the mean +/- SD versus control. ** indicate significant
differences between control at p < 0.01.
Figure 5: Characterization of intracellular ROS production of HaCaT after exposure to Cit30
and PEG30 AgNPs for 24h, using the DCFDA assay. The results were expressed as the mean
+/- SD versus control. ** indicate significant differences between control at p < 0.01 and * at p
< 0.05.
Figure 6: MCP-1 release by HaCaT cells after 24 and 48h exposure to Cit30 and PEG30
AgNPs. Lipopolysaccharide (LPS) was used as a positive control. Data represent the mean ±
SEM (n = 3) of the concentration (pg /ml) of MCP-1 cytokine released from the cells after NPs
treatment.
Figure 7: Cit30 and PEG30 AgNPs effects on HaCaT cells exposed to 10 and 40µg/mL during
24 and 48h, measured by annexin V assay. Intact cells are represented by “A-P-“, dead cells “A-
P+”, early apoptotic cells “A+P-“ and late apoptotic cells “A+P+”. Letter A refers to AnnexinV-
FITC and letter P refers to propidium iodide. The results were expressed as the mean +/- SD
versus control. ** indicate significant differences between control at p < 0.01.
Figure 8: HaCaT gene expression of apoptotic genes, after 24h (a) and 48h (b) exposure to
Cit30 and PEG30 AgNPs. The results were expressed as the mean relative to control cells
(normalized with the GAPDH reference gene) +/- SD versus control.
Figure

Figure 9: Effects of AgNPs on cell cycle dynamics, measured by flow cytometry, exposed to
Cit30 AgNPs for 24 h a) and 48 h b) and to PEG30coated AgNPs for 24h c) and 48h d). The
results were expressed as mean and standard deviation. ** indicate significant differences
between control at p < 0.01.
Figure 10: HaCaT gene expression of cell cycle genes, after exposure to Cit30 AgNPs for 24 h
a) and 48 h b) and to PEG30 AgNPs for 24h c) and 48h d). The results were expressed as mean
relative to control cells (normalized with the GAPDH reference gene) and standard deviation.
** indicate significant differences between control at p < 0.01.
Figure 11: Principal Component Analysis (PCA) scores scatter plot. The analysis was conducted
for the medium values of 48 h AgNPs exposure. “Peg10” and “Peg40” represents PEG- AgNPs
10 µg/mL and PEG- AgNPs 40 µg/mL, respectively; and “Cit10” and “Cit40” represents citrate-
AgNPs 10 µg/mL and citrate- AgNPs 40 µg/mL, respectively.

Figure 1

0
20
40
60
80
100
0 12 24 36 48
Dh
(n
m)
Time (hours)
Citrate- AgNPs PEG- AgNPs
0
5
10
0 12 24 36 48
% D
isso
luti
on
to
Ag
+
Time (hours)
Citrate- AgNPs PEG- AgNPs
Figure 2
a b

0
20
40
60
80
100
120
140
0 20 40 60 80 100
% V
iab
ilit
y
Citrate- AgNPs concentration (µg/mL)
24h
48h
0
20
40
60
80
100
120
0 50 100 150 200
% V
iab
ilit
y
PEG concentration (µg/mL)
0
20
40
60
80
100
120
0 100 200 300 400
% V
iab
ilit
y
Citrate concentration (µg/mL)
0
20
40
60
80
100
120
140
0 20 40 60 80 100
% V
iab
ilit
y
PEG- AgNPs concentration (µg/mL)
24h
48h
Figure 3
*
*#
*# *#
# # #
#
* * * * *
a b
c d

Figure 4
0.E+00
1.E+05
2.E+05
3.E+05
4.E+05
5.E+05
6.E+05
7.E+05
8.E+05
9.E+05
1.E+06
0 10 40
Mea
n S
ide
Sca
tter
Concentration (µg/mL)
Citrate- AgNPs
PEG- AgNPs
**
**
**
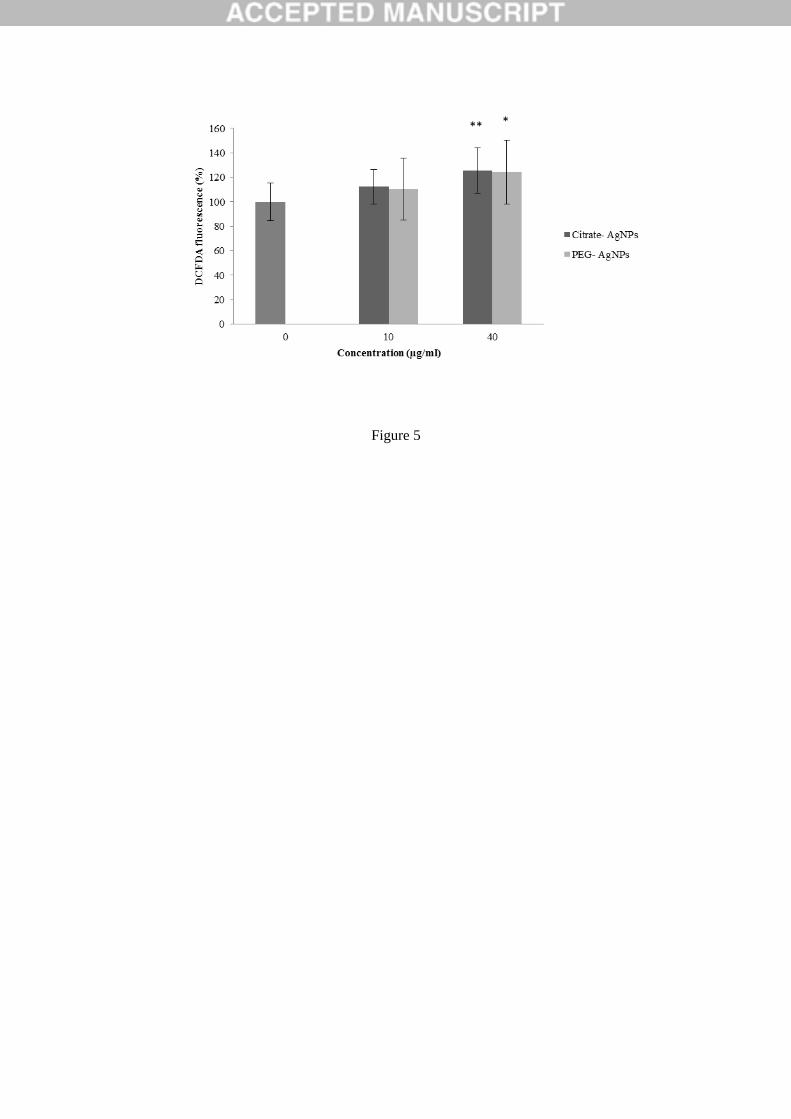
Figure 5
** *

0
200
400
600
800
1000
1200
1400
1600
0 Control + 10 40 10 40
MC
P-1
rele
ase
(p
g/m
L)
Citrate and PEG- AgNPs concentration (µg/mL)
24h
48h
Figure 6
Citrate- AgNPs PEG- AgNPs
**
**
**
**
**

0
20
40
60
80
100
Ctl 10 40
% o
f C
ell
s
Citrate- AgNPs concentration (µg/mL)
24h
A-P+
A+P+
A-P-
A+P- 0
20
40
60
80
100
C 10 40
% o
f C
ell
s
Citrate- AgNPs concentration (µg/mL)
48h
A-P+
A+P+
A-P-
A+P-
0
20
40
60
80
100
120
Control 10 40
% o
f C
ell
s
PEG- AgNPs concentration (µg/mL)
24h
A-P+
A+P+
A-P-
A+P- 0
20
40
60
80
100
120
Control 10 40
% o
f C
ell
s
PEG- AgNPs concentration (µg/mL)
48h
A-P+
A+P+
A-P-
A+P-
Figure 7
**
**
** **
**
**
**
**
a
Control Control
b
c d

0.0
5.0
10.0
15.0
20.0
25.0
30.0
0 10 40 0 10 40 0 10 40
Gen
e E
xp
ress
ion
Concentration (µg/mL)
a
Citrate- AgNPs
PEG- AgNPs
0.0
5.0
10.0
15.0
20.0
25.0
30.0
0 10 40 0 10 40 0 10 40
Gen
e E
xp
ress
ion
Concentration (µg/mL)
Citrate- AgNPs
PEG- AgNPs
Figure 8
BAX BCL2
CASP3
** ** *
** **
**
**
BAX BCL2
CASP3
** ** ** ** **
** **
b

Figure 9
**
**
** **
**
**
** **
**
** **
**
** ** ** ** ** **
**
**
a b
c d
a a
a a
**
**
**
** **
**
** **
** **
** **
**

Figure 10
CCNB1
CCNE1
CDK1
CDK2
CCNB1
CCNE1
CDK1 CDK2
a
CCNB1 CCNB1
CCNE1
CCNE1
CDK1 CDK1
CDK2
CDK2
**
**
** **
**
b
c d
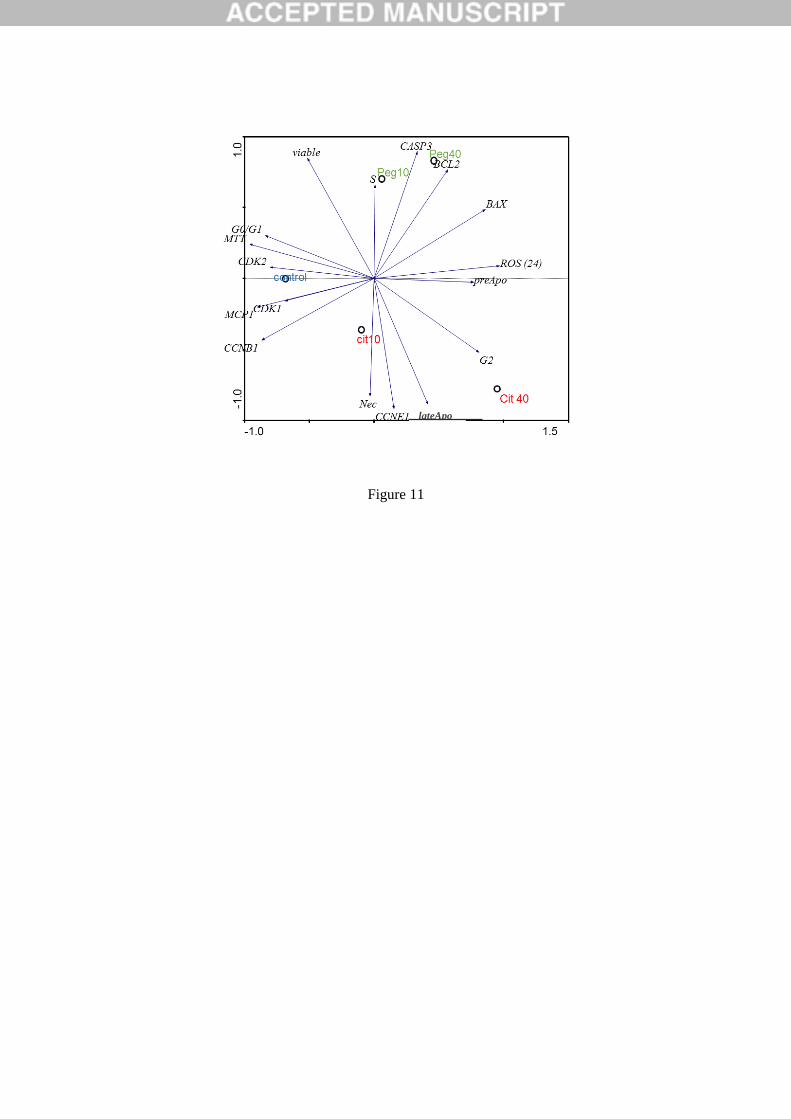
Figure 11
lateApo