the influence of charge stratification on the spectral ... · signature of partially premixed...
TRANSCRIPT

The influence of charge stratification on the spectralsignature of partially premixed combustion in a light-dutyoptical engineIzadi Najafabadi, M.; Egelmeers, L.B.A.; Somers, L.M.T.; Deen, N.G.; Johansson, B.H.; Dam,N.J.Published in:Applied Physics B: Lasers and Optics
DOI:10.1007/s00340-017-6688-9
Published: 25/03/2017
Document VersionPublisher’s PDF, also known as Version of Record (includes final page, issue and volume numbers)
Please check the document version of this publication:
• A submitted manuscript is the author's version of the article upon submission and before peer-review. There can be important differencesbetween the submitted version and the official published version of record. People interested in the research are advised to contact theauthor for the final version of the publication, or visit the DOI to the publisher's website.• The final author version and the galley proof are versions of the publication after peer review.• The final published version features the final layout of the paper including the volume, issue and page numbers.
Link to publication
General rightsCopyright and moral rights for the publications made accessible in the public portal are retained by the authors and/or other copyright ownersand it is a condition of accessing publications that users recognise and abide by the legal requirements associated with these rights.
• Users may download and print one copy of any publication from the public portal for the purpose of private study or research. • You may not further distribute the material or use it for any profit-making activity or commercial gain • You may freely distribute the URL identifying the publication in the public portal ?
Take down policyIf you believe that this document breaches copyright please contact us providing details, and we will remove access to the work immediatelyand investigate your claim.
Download date: 02. Sep. 2018

Vol.:(0123456789)1 3
Appl. Phys. B (2017) 123:108 DOI 10.1007/s00340-017-6688-9
The influence of charge stratification on the spectral signature of partially premixed combustion in a light-duty optical engine
M. Izadi Najafabadi1 · Luc Egelmeers1 · Bart Somers1 · Niels Deen1 · Bengt Johansson2 · Nico Dam1
Received: 29 August 2016 / Accepted: 28 February 2017 © The Author(s) 2017. This article is an open access publication
and the second during the late stage of combustion when soot particles are forming.
Keywords Spectroscopy · PPC · Chemiluminescence · Thermal radiation · IC Engine
AbbreviationsATDC After top dead centerCA50 Crank angle at 50% burnCAD Crank angle degreeCI Compression ignitionCMOS Complementary metal–oxide semiconductorfps Frames per secondHCCI Homogeneous charge compression ignitionIC Internal combustionID Ignition delayC2* Electronically excited dicarbonCH* Electronically excited methylidyneCH2O* Electronically excited formaldehydeCO2* Electronically excited carbon dioxideOH* Electronically excited hydroxylHCO* Electronically excited formylPPC Partially premixed combustionPRFnn Primary reference fuel, nn = the percentage of
iso-octane in iso-octane/n-heptane mixturerpm Revolutions per minuteSCCI Stratified charge compression ignitionSI Spark ignitionSOI Start of injection
1 Introduction
Partially premixed combustion (PPC), a combustion mode of compression-ignition (CI) internal combustion (IC)
Abstract The origin of light emission during low-tem-perature combustion in a light-duty IC engine is investi-gated by high-speed spectroscopy in both HCCI and PPC regimes. Chemiluminescence and thermal radiation are expected to be the dominant sources of light emission during combustion. A method has been developed to dis-tinguish chemiluminescence from thermal radiation, and different chemiluminescing species could be identified. Different combustion modes and global equivalence ratios are analyzed in this manner. The results indicate that the spectral signature (270–540 nm range) of the combustion is highly dependent on the stratification level. A significant broadband chemiluminescence signal is detected and super-imposed on all spectra. This broadband chemiluminescence signal can reach up to 100 percent of the total signal in HCCI combustion, while it drops to around 80 percent for stratified combustion (PPC). We show that this broadband signal can be used as a measure for the heat release rate. The broadband chemiluminescence did also correlate with the equivalence ratio quite well in both HCCI and PPC regimes, suggesting that the total emission in the spectral region of 330–400 nm can serve as a proxy of equivalence ratio and the rate of heat release. Regarding C2* chemilu-minescence, we see two different chemical mechanisms for formation of C2* in the PPC regime: first during the early stage of combustion by the breakup of bigger molecules
* M. Izadi Najafabadi [email protected]
1 Multiphase and Reactive Flows Group, Department of Mechanical Engineering, Eindhoven University of Technology, P.O. Box 513, 5600 MB Eindhoven, The Netherlands
2 Clean Combustion Research Center, King Abdullah University of Science and Technology, Thuwal, Saudi Arabia
M. I. Najafabadi et al.
1 3
108 Page 2 of 13
engines, relies on a relatively long ignition delay (ID) to achieve a partially premixed charge [1–6]. PPC is a promis-ing combustion concept allowing to reduce both NOx and soot emissions while providing high combustion efficiency. By and large, the low NOx emissions result from the low combustion temperature, whereas the low soot emission is a result of increased premixing (with respect to conven-tional CI engines) [2–6]. However, many details of the in-cylinder phenomena are still to be explained and evaluated.
By coupling a high-speed camera to a spectrograph, crank-angle- and cycle-resolved spectroscopic data, con-taining detailed information regarding the species forma-tion during the combustion, can be obtained. Chemilu-minescence and thermal radiation are expected to be the dominant sources of luminescence during the combustion [7]. Depending on the combustion mode, the intensity of these two contributions will vary. Thermal radiation is mainly composed of black-body radiation coming from soot particles that are heated to flame temperatures by the combustion process [8], while the term chemilumines-cence is used for the light emission of specific molecules, which are formed in an electronically excited state during combustion and spontaneously decay back to lower energy levels [8, 9]. Chemiluminescence occurs in specific wave-length bands that are characteristic of the emitting mol-ecules. The chemiluminescence yield due to specific mol-ecules varies for different combustion regimes, and this can provide information about the nature of the chemistry involved [9–11]. Because chemiluminescence is the direct product of exothermic chemical reactions, it marks the location of the initial combustion reactions, both tempo-rally and spatially [10], although reaction pathways lead-ing to chemiluminescent species are under debate [12]. In practical implementation, a drawback is that the collected light is integrated along the line of sight of the detector. By any means, chemiluminescence imaging is a useful tool for time- and space-resolved investigation of the reactions that occur during combustion [13].
Molecular spectroscopy has also been used to study HCCI combustion in IC engines. Hultqvist et al. [9] obtained chemiluminescence spectra during the low-temperature reactions and the main heat release period of HCCI combustion. They found that, depending on the fuel, low-temperature reactions may or may not exist and precede the main heat release. During the main heat release, a continuous, essentially structureless spectrum ranging from 250 to 550 nm was observed. Furthermore, a strong correlation between the light intensity and the rate of heat release was found. Dec et al. [13] showed that the emission spectrum of combustion in conventional CI engines includes distinct features due to thermal radia-tion and OH* chemiluminescence. Kim et al. [14] used spectroscopy to compare HCCI, SCCI and SI combustion
of PRF50. They analyzed spectra based on putative point measurements at the center of combustion chamber. In the SI combustion spectra, an OH* peak was observed during the combustion, while CH* and C2* peaks were only present during the early stage of combustion. The main heat release spectra of HCCI combustion were dominated by the CO2* continuum with superposed for-maldehyde bands, but peaks corresponding to OH*, CH* and C2* were not observed. They also reported broad-band chemiluminescence during the low-temperature heat release, be it 3–4 orders of magnitude less intense than the luminescence during the main heat release. Augusta et al. [15] investigated the spectral features of HCCI combustion of PRF87 under a wide variety of engine operating conditions. They observed several dis-tinct spectral peaks attributed to OH*, CHO*, CH* and CH2O*, although small, superimposed on top of a CO2* continuum. Their results were similar for all operating conditions, suggesting that the primary reaction pathways of the fuel remained unchanged in spite of factors that significantly affected HCCI combustion timing and heat release rate.
Many studies have used optical filters to investigate the combustion behavior and detect different species like OH* and CH* [7, 11, 16, 17]. The obvious advantage of spectral bandpass filters is that they allow spatial distri-bution mapping; the obvious disadvantage is that one can never exclude spectral interference by other emitters than those for which the filter is intended. OH* band-pass imaging is typically used as a measure for the rate of heat release in combustion. The equivalence ratio (in premixed laminar flames) is often estimated by means of the intensity ratio between OH* and CH* chemilu-minescence. The CH*/OH* chemiluminescence ratio is found to proportionally increase with equivalence ratio at atmospheric pressures [18, 19].
In this paper, we report on optical emission studies of PPC combustion in a light-duty optical CI engine. A method has been developed to distinguish between chemiluminescence by various species (OH*, C2* and CH*) and thermal radiation, based on spectroscopic measurements of the lion’s share of the combustion chamber. The effect of charge stratification on the spec-tral signature of PPC combustion has been investigated for the first time and is compared to homogeneous con-ditions. Furthermore, a study has been performed on the reliability of bandpass filters when they are used to inves-tigate the auto-ignited combustion in an IC engine. As the final part of this research, broadband chemilumines-cence and the CH*/OH* intensity ratio are investigated as a proxy for equivalence ratio of low-temperature com-bustion in an IC engine.

The influence of charge stratification on the spectral signature of partially premixed…
1 3
Page 3 of 13 108
2 Experimental setup
2.1 Optical engine
A VOLVO D5 light-duty DI engine is used in this study to obtain the measurement data. The engine is adapted for optical access according to a Bowditch design [20]. A sin-gle engine cylinder is equipped with a cylindrical quartz liner with a height of 25 mm while the other four cylinders are deactivated. A flat optical quartz piston is used to ana-lyze the luminescence from below. This flat piston geom-etry decreases the amount of premixing with respect to that of a piston bowl. Furthermore, with a flat piston geometry, fuel is more likely to end up in the crevice volume [21]. The advantage of a flat optical piston over a bowl is that the image is not affected by any distortion. To this end, this pis-ton configuration is used to link the research to the results of previous work [16].
Engine specifications are presented in Table 1. The engine is operated by using a dynamometer, and EGR is simulated by diluting the intake air with nitrogen.
The in-cylinder pressure is measured every 0.20 CAD using an AVL GU13P pressure transducer coupled to a KISTLER 5011 charge amplifier. The heat release analy-sis is based on the time history of the cylinder pressure and the corresponding volume, a single-zone description
of the cylinder contents with thermodynamic properties, Woschni’s heat-loss model and including a crevice model [22, 23]. A fifth-order Hann window function is applied to reduce the noise on the pressure and heat release trace.
2.2 Operating conditions
The engine is operated at 1200 rpm in skip-fire mode (once every 10 engine cycles) to lower the loads on the quartz liner. For each measurements point, 30 firing cycles are recorded. When investigating different combustion modes, CA50 is held constant for five different single injection timings (different ignition delays) using direct injection at an injection pressure of 600 bar. The set of parameters for each injection timing are presented in Table 2; for all cases, the amount of injected fuel is approximately 17 mg/cycle. The intake pressure and the cylinder wall temperature are kept constant at 1.2 bar and 363 K, respectively.
The pressure and heat release rate curves for different injection timings (cases A–E of Table 2) are presented in Fig. 1. In case A, homogeneous combustion is achieved by injecting early, well before TDC. Cases C, D and E all rep-resent partially premixed combustion with different injec-tion timings and therefore different charge stratification lev-els, whereas case B can be classified as a transition point from HCCI to PPC. Case E, having the latest injection tim-ing, causes the sharpest rate of heat release (ROHR) since higher local equivalence ratios (closer to stoichiometric) are formed for this case.
To allow for investigation of equivalence ratios, the injection duration is slightly varied for injection strategies A and C. The corresponding sets of parameters are pre-sented in Table 3. In order to maintain a constant airflow and a similar CA50, the intake pressure and temperature are slightly tuned. The global equivalence ratios for all experi-mental points are reported in Tables 2 and 3. However, for PPC operating points the local equivalence ratios are likely to be much different from the global ones. For that reason, we have used the injected fuel mass for labeling the results of PPC points in the next sections.
Table 1 Engine specifications
Displacement 480 cc/cylinder
Bore 81 mmStroke 93.2 mmConnecting rod length 147 mmCompression ratio 12.6:1Fuel PRF70Number of injector holes 7Injector umbrella angle 140°Injector diameter hole 140 μmInjection pressure 600 bar
Table 2 Single injection strategies
Total injected fuel is approximately 17 mg/cycle in all cases
Case Injection timing (CAD)
Injection duration (CAD)
CA50 (CAD) Intake tempera-ture (K)
Oxygen percent-age (vol-%)
Airflow (g/s) Global Equivalence ratio (–)
A −200 5.6 8 323 19.0 6.8 0.40B −50 5.4 9 348 19.0 6.8 0.39C −25 5.4 9 348 18.8 6.7 0.40D −20 5.4 10 343 19.0 6.8 0.39E −15 5.5 10 413 18.8 6.5 0.41

M. I. Najafabadi et al.
1 3
108 Page 4 of 13
2.3 Spectroscopy method
Crank-angle-resolved spectroscopic measurements are per-formed by coupling a high-speed intensified camera (Lam-bert HiCAM 5000) to a grating spectrograph (Acton SP-300i). Combustion luminescence is recorded through the quartz piston, via the 45° mirror (Fig. 2); under the oper-ating conditions selected here, window fouling was found to be negligible. The field of view (FOV) of the spectro-graph comprises a tangential section through the cylinder to always focus on multiple combustion clouds (red line in Fig. 1.). Specifications of the detection setup are presented in Table 4.
A mercury vapor lamp is used for calibration of the spectrograph. The spectrograph imaging system deforms the detected image. In Fig. 3a, this pincushion distortion is illustrated for one of the mercury vapor emission lines. All images are corrected for pincushion distortion as depicted
in Fig. 3b. Later, the calibration is performed by relating the camera pixels to corresponding wavelength by means of the mercury spectrum as shown in Fig. 3c. This linear cor-relation is based on the first six peak positions.
The quantum efficiency of the intensified camera changes over the wavelength range as illustrated in Fig. 3d (based on the manufacturer data sheet). The grating effi-ciency of the spectrograph is also affecting the acquired spectra. The grating used in our experiments has a groove frequency of 150 l/mm and is blazed at 500 nm. In Fig. 3d, the grating efficiency curve is included as well. These data are combined to scale the spectra to constant detec-tion efficiency. Since the transmission efficiency and col-lection angle of the other optics in the setup is constant over the whole wavelength range, no further correction was required.
3 Spectroscopy analysis
The spectroscopic measurements provide spectral and tem-poral information regarding the combustion [8, 9, 11]. The objective of these measurements is to correlate the chemilu-minescence intensities of five different components, includ-ing thermal radiation, broadband chemiluminescence, and relatively narrowband OH*, CH* and C2* emission, in the PPC combustion regime. To achieve the goal, the
Fig. 1 Pressure and heat release rate for different charge stratification levels (Table 2)
Table 3 Single injection strategies for varying equivalence ratio
Operating conditions correspond to Table 2
Case Intake pres-sure (bar)
Intake tem-perature (K)
Injected fuel mass (mg/cycle)
Global Equivalence ratio (–)
A 1.18 303 19.70 0.441.20 323 18.14 0.401.21 348 16.58 0.361.22 348 15.02 0.33
C 1.18 318 18.92 0.441.20 348 16.97 0.401.21 373 15.02 0.351.22 398 13.07 0.31
Fig. 2 Hybrid schematic of the optical engine and the spectroscopy setup

The influence of charge stratification on the spectral signature of partially premixed…
1 3
Page 5 of 13 108
spectral signature over a wavelength range of 270–540 nm is recorded simultaneously. Spectra are integrated over the entire FOV and scaled to constant detection efficiency, as explained above. The contribution of thermal (black body) radiation is estimated based on Planck’s law. The remain-ing broadband luminescence is attributed to chemilumines-cence of relatively large molecules, like HCO*, H2CO* and CO2*. The contributions of OH*, C2* and CH* are deter-mined based on their relatively narrowband emission in characteristic spectral ranges, as detailed below. Our desire to record a large spectral range simultaneously comes with a relatively low spectral resolution. Therefore, no attempt has been made to analyze spectral envelopes of the narrow-band contributions.
Initially, the thermal radiation intensity was separated from the total spectrum. This has been done by evaluating
the wavelength range of 500–540 nm and fitting Planck’s law to the data. This wavelength range (500–540 nm) is less than desirable but the maximum that could be achieved given the spectrometer and the fact that the entire OH* band (on the other end of the spectral range) was to be acquired simultaneously. Here, Planck’s law is described as
where c represents the speed of light [m/s], h and kb represent the Planck constant [m2kg/s] and the Boltz-mann constant [m2kg/(s2K)], respectively, λ is the wave-length [m], T represents the temperature [K] and A is a scaling factor. The unknown values for A and T are scaled such that Planck’s law fits the data best; see Fig. 4 for an example. It should be noted that the good fit found in this particular figure is not representative for all cases. In the example of Fig. 5, broadband chemiluminescence domi-nates the spectrum, and the restricted wavelength range available for Eq. (1) does not allow to distinguish a sepa-rate contribution due to thermal radiation. We used the threshold criterion of 0.8 for the coefficient of determi-nation (R2) for the correlation between Planck’s law and the experimental data. This threshold R2 value is based on visual inspection of a large number of spectra. When the criterion is met (R2 > 0.8), we consider thermal radia-tion to contribute perceptibly to the total spectrum. We realize that the choice of the value of 0.8 is arbitrary, but ascertained that the results do not vary significantly for cutoff values in the range 0.7–0.9. The net contribution of the thermal radiation is then defined by integrating Planck’s law over the full observed wavelength range. When the threshold criterion is not met, any contribu-tion of the thermal radiation is included in the broadband
(1)I(�) = A2hc2
�5
1
ehc∕(�kbT) − 1
,
Table 4 Specifications of the camera and spectrograph
Camera Lambert HiCAM 5000 (built-in intensifier)
Imaging sensor 8 bits CMOSResolution 512 × 512 pixelsFrame rate 3600 fpsExposure time 250 µsObjective lens UV Bernhard Halle Nachfl. 100 mm f/2Spectrograph Princeton Acton SP-300iGroove frequency 150 l/mmBlaze 500 nmWavelength range 270–540 nmLinear dispersion 10.5 nm/mm
Fig. 3 a Distorted image of the mercury vapor lamp spectrum. b Correction of the distorted image. c Calibration of spectrograph using mercury vapor lamp. d Spectrograph grating efficiency and camera quantum efficiency curves
Fig. 4 Planck’s law fitted to the obtained spectrum (case C, injected fuel mass: 16.97 mg/cycle, 23 CAD ATDC)
M. I. Najafabadi et al.
1 3
108 Page 6 of 13
chemiluminescence, discussed later in this section. In fitting Planck’s law, we limit temperature between 1000 and 2500 K. However, for R2 > 0.8 the best-fit tempera-ture is always between 2000 and 2400 K, and it decreases toward the end of combustion.
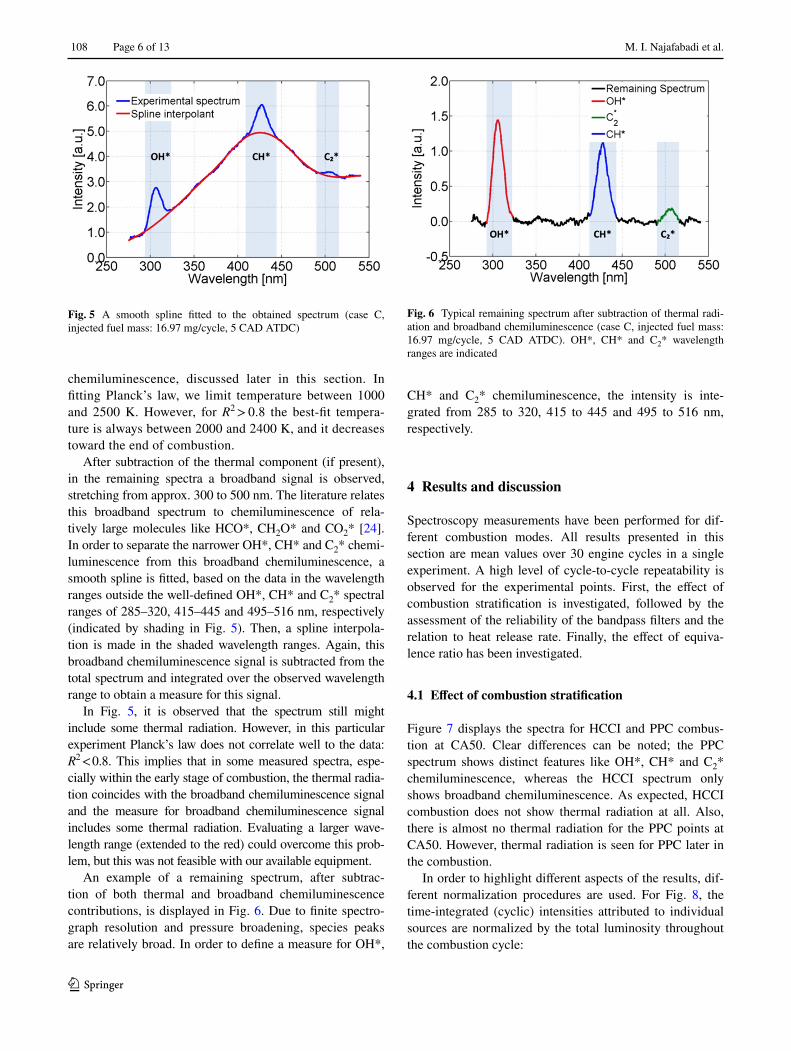
After subtraction of the thermal component (if present), in the remaining spectra a broadband signal is observed, stretching from approx. 300 to 500 nm. The literature relates this broadband spectrum to chemiluminescence of rela-tively large molecules like HCO*, CH2O* and CO2* [24]. In order to separate the narrower OH*, CH* and C2* chemi-luminescence from this broadband chemiluminescence, a smooth spline is fitted, based on the data in the wavelength ranges outside the well-defined OH*, CH* and C2* spectral ranges of 285–320, 415–445 and 495–516 nm, respectively (indicated by shading in Fig. 5). Then, a spline interpola-tion is made in the shaded wavelength ranges. Again, this broadband chemiluminescence signal is subtracted from the total spectrum and integrated over the observed wavelength range to obtain a measure for this signal.
In Fig. 5, it is observed that the spectrum still might include some thermal radiation. However, in this particular experiment Planck’s law does not correlate well to the data: R2 < 0.8. This implies that in some measured spectra, espe-cially within the early stage of combustion, the thermal radia-tion coincides with the broadband chemiluminescence signal and the measure for broadband chemiluminescence signal includes some thermal radiation. Evaluating a larger wave-length range (extended to the red) could overcome this prob-lem, but this was not feasible with our available equipment.
An example of a remaining spectrum, after subtrac-tion of both thermal and broadband chemiluminescence contributions, is displayed in Fig. 6. Due to finite spectro-graph resolution and pressure broadening, species peaks are relatively broad. In order to define a measure for OH*,
CH* and C2* chemiluminescence, the intensity is inte-grated from 285 to 320, 415 to 445 and 495 to 516 nm, respectively.
4 Results and discussion
Spectroscopy measurements have been performed for dif-ferent combustion modes. All results presented in this section are mean values over 30 engine cycles in a single experiment. A high level of cycle-to-cycle repeatability is observed for the experimental points. First, the effect of combustion stratification is investigated, followed by the assessment of the reliability of the bandpass filters and the relation to heat release rate. Finally, the effect of equiva-lence ratio has been investigated.
4.1 Effect of combustion stratification
Figure 7 displays the spectra for HCCI and PPC combus-tion at CA50. Clear differences can be noted; the PPC spectrum shows distinct features like OH*, CH* and C2* chemiluminescence, whereas the HCCI spectrum only shows broadband chemiluminescence. As expected, HCCI combustion does not show thermal radiation at all. Also, there is almost no thermal radiation for the PPC points at CA50. However, thermal radiation is seen for PPC later in the combustion.
In order to highlight different aspects of the results, dif-ferent normalization procedures are used. For Fig. 8, the time-integrated (cyclic) intensities attributed to individual sources are normalized by the total luminosity throughout the combustion cycle:
Fig. 5 A smooth spline fitted to the obtained spectrum (case C, injected fuel mass: 16.97 mg/cycle, 5 CAD ATDC)
Fig. 6 Typical remaining spectrum after subtraction of thermal radi-ation and broadband chemiluminescence (case C, injected fuel mass: 16.97 mg/cycle, 5 CAD ATDC). OH*, CH* and C2* wavelength ranges are indicated

The influence of charge stratification on the spectral signature of partially premixed…
1 3
Page 7 of 13 108
where sp indicates integration over a wavelength range characteristic for a particular species, � is wavelength [nm], CA is crank angle degree (CAD), I(�, CA) is the total recorded intensity as a function of wavelength and time, Isp(�, CA) is the contribution of either thermal radiation (Fig. 4), the spline interpolant for broadband chemilumi-nescence (Fig. 5), or the individual species intensity for OH*, CH* and C2* chemiluminescence (Fig. 6).
In Fig. 8, these normalized integrated intensities of differ-ent species (Icl(sp)) are presented as a function of SOI timing, to illustrate the effect of charge stratification on combustion behavior. For OH*, CH* and C2* chemiluminescence, inten-sities are multiplied by factors of 25, 50 and 50, respectively, for the sake of clarity. For homogeneous combustion points (early SOI, so long ignition delay), the predominant source
(2)Icl(sp) =∫ sp d𝜆 ∫ +180
−180Isp(𝜆, CA)dCA
∫ 540270
d𝜆 ∫ +180−180
I(𝜆, CA)dCA,
of combustion luminosity is broadband chemiluminescence. Hardly any thermal radiation is detected and narrowband chemiluminescence is all but absent as well. By moving from HCCI to PPC regime, the thermal contribution increases. Most likely, the latter is due to locally increased equivalence ratios (closer to stoichiometric) that give rise to enhanced for-mation of soot [3]. Furthermore, OH*, CH* and C2* chemi-luminescence intensities all increase upon increasing charge stratification (as a consequence of moving from HCCI to PPC). This increase can be related to the influence of combus-tion temperature; locally higher equivalence ratios result in higher combustion temperature, and this elevated temperature can be the cause of enhanced chemiluminescence. However, the exact chemical processes behind chemiluminescence are not sufficiently well known to provide definitive answers to the phenomena, particularly at elevated pressure [12, 25].
Time-resolved results for various species are presented in Fig. 9. In this figure, all curves are individually normal-ized such that their maximum values equal 1. This allows convenient comparison of peak timings of different lumi-nosity sources. In the top graph of Fig. 9, this is done for HCCI combustion; in the bottom graph, the behavior for PPC is illustrated. It is observed that HCCI combustion pro-ceeds very fast, all luminosity sources observed culminate simultaneously. Furthermore, the luminosity behavior cor-responds to that of the rate of heat release. Similar to Fig. 8, OH* chemiluminescence and thermal radiation are not detected in this combustion mode. This spectral signature is similar to what Kim et al. [14] reported for HCCI combus-tion of PRF50. However, we did not see any spectral emis-sion during the ignition delay and the low-temperature heat release, while Kim et al. reported a broadband emission with 3–4 orders of magnitude less intensity than the one during the main heat release. The absence of the spectral emission during the ignition delay of HCCI was also indicated by Augusta et al. [15], which is in agreement with our results.
For PPC combustion, however, it is observed that C2* and CH* chemiluminescence culminate first during the combus-tion. Subsequently, broadband and OH* chemiluminescence reach their peak simultaneously with the rate of heat release, whereas thermal radiation is typically dominant during the late phase of combustion, similar to conventional diffusion combustion. The early peak in C2* and CH* chemilumi-nescence is likely due to the breakup of big molecules dur-ing the early stage of combustion, seen in highly turbulent premixed flames as well [26]. Around +45 CAD, a second, broader maximum is observed for all species, which is pre-sumably caused by the burning of fuel escaping from crevice volumes [16]. The high piston clearance in our optical engine (1 mm) is the main cause of a significant amount of trapped fuel, which would not be expected for a metal engine.
In Fig. 14 in “Appendix”, the crank-angle-resolved results of different species for different injection timings
Fig. 7 Spectra of HCCI (case A) and PPC (cases C and E) combus-tion at CA50. See Table 2 for operating conditions
Fig. 8 Cyclic normalized intensity versus start of injection. Standard deviations over 30 measurement cycles are indicated

M. I. Najafabadi et al.
1 3
108 Page 8 of 13
are compared. By looking in more detail to Fig. 9b around +15 CAD, it can be seen that the C2* intensity increases a little bit where thermal radiation starts to be detectable. This behavior can also be seen for PPC points in Figs. 10 and 14, especially for higher equivalence ratios: where thermal radiation of soot particles is maximum a second peak is seen for C2*. This is in agreement with results of Merola et al. [27] for the late stage of conventional diesel combustion. It can be concluded that there are two differ-ent chemical mechanisms for formation of C2* in the PPC regime: first during the early stage of combustion by the breakup of larger molecules and the second during the late stage of combustion when soot particles are forming.
4.2 Adequacy of bandpass filters
Since the observation is made that broadband chemilumines-cence is dominant for both HCCI and PPC regimes, the ques-tion arises what is exactly investigated in studies that only apply optical bandpass filters to detect particular species in these combustion regimes. This is analyzed on the basis of our spectra for different levels of combustion stratification. Virtual OH*, CH* and C2* bandpass filters are applied to the recorded spectra to obtain integrated intensities in the wave-length regions of 285–320 nm (OH*), 415–445 nm (CH*)
and 495–516 nm (C2*); see shading in Fig. 5. Also, the actual contribution of each species in its bandpass region is calcu-lated by integrating the spectra after subtraction of all broad-band contributions; see Figs. 5 and 6 for an example. The ratio of each species contribution to the total intensity in the corresponding filter region results in the percentage of that species at a given CA. The results are presented in Fig. 11.
It is observed from Fig. 11 that the adequacy of an opti-cal filter to detect C2* and CH* chemiluminescence is almost void for all combustion modes, due to the broad-band chemiluminescence. For homogeneous condition cases (large ID), the percentage of OH* chemilumines-cence is even negligible. The increase in CH* and C2* chemiluminescence percentage around 30–60 CAD ATDC is due to trapped fuel that escapes the crevices and burns [16]. Concluding, even though the use of optical filters is indispensable for obtaining spatial information during com-bustion, the transmitted signal may largely be due to other chemical compounds than intended.
4.3 Chemiluminescence and rate of heat release
In previous publications [9, 16, 17], OH* chemilumines-cence intensity measured through bandpass filters has been used as a proxy for the local rate of heat release. Since Fig. 11 illustrates that the percentage of actual OH* signal observed through OH* bandpass filters is often negligible, one may wonder whether the luminosity recorded through OH* bandpass filters is still a measure for the heat release or not. To this end, the HCCI experiments with different equivalence ratios are analyzed (see Table 3, case A). Fig-ure 12a shows the scaled accumulated intensity obtained through a virtual OH* bandpass filter from CA10 to CA90 versus the scaled heat released in these experiments. The heat release period from CA10 to CA90 is chosen to focus only on the main heat release. Hence, the low-temperature heat release, which is not accompanied by any emission, and the afterburning of trapped fuel, which is far from homogeneous, are not considered in Fig. 12. A linear rela-tion is observed with a high coefficient of determination. The residual scatter of data points is probably due not so much to low signal-to-noise ratios but rather to the rela-tively large time step between recorded images (compared to the heat released data) and the limited FOV of the spec-trograph, which is merely a line, whereas the heat release is volumetric. Still, these results indicate that the inten-sity observed through OH* optical bandpass filters indeed can be used as a measure for the rate of heat release even though the signal is hardly a measure for OH* at all. This analysis has been repeated for the total range of broadband chemiluminescence in Fig. 12b. A similar linear relation results, which shows that the broadband chemilumines-cence can be taken as a measure for the heat release rate,
Fig. 9 Crank-angle-resolved behavior of different species for a HCCI combustion (case A) and b PPC combustion (case C), averaged over 30 cycles
The influence of charge stratification on the spectral signature of partially premixed…
1 3
Page 9 of 13 108
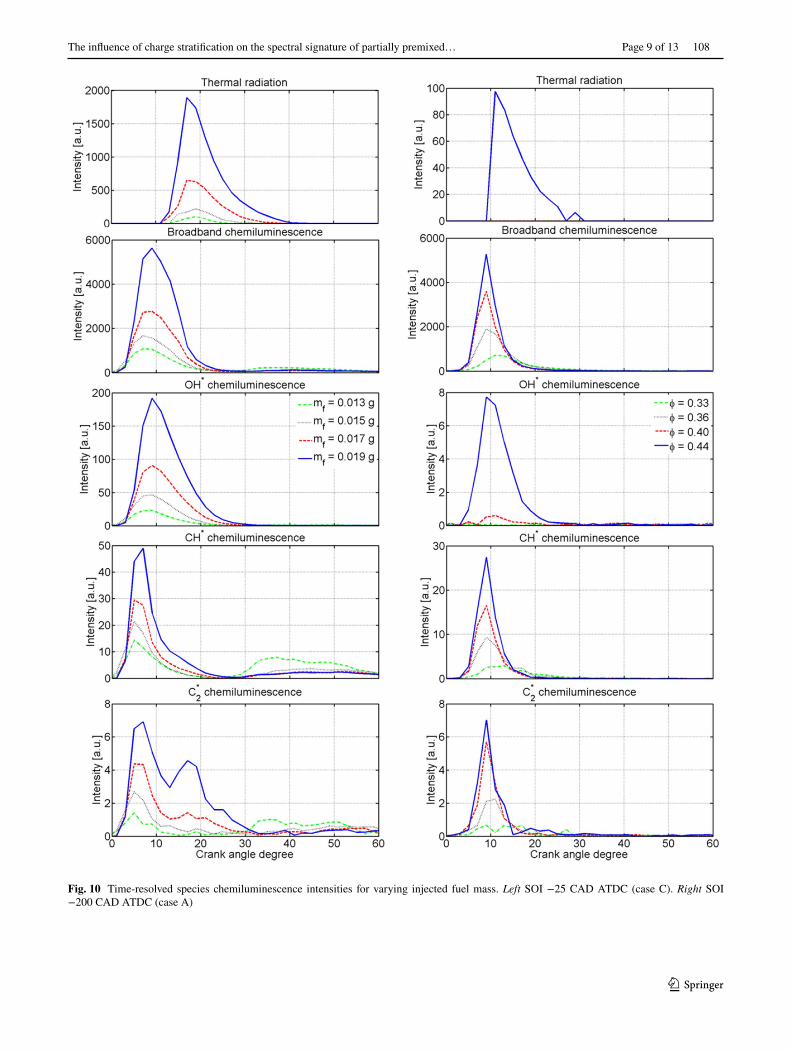
Fig. 10 Time-resolved species chemiluminescence intensities for varying injected fuel mass. Left SOI −25 CAD ATDC (case C). Right SOI −200 CAD ATDC (case A)

M. I. Najafabadi et al.
1 3
108 Page 10 of 13
in this combustion mode. The same relation can already be seen in Fig. 9a, where the rate of heat release corresponds to the broadband chemiluminescence signal. This analysis is only done for HCCI combustion, because the limited FOV of the spectrograph in the stratified combustion mode (PPC) is not sufficiently representative to be used for com-parison with the volumetric heat release.
4.4 A proxy for equivalence ratio
The effect of equivalence ratio on the spectral signature of combustion has been investigated for all operating conditions in Table 3. Figure 10 illustrates the wavelength-integrated signal intensities of different components. It is observed that increasing the injected fuel mass leads to an overall increase in luminescence, but otherwise nothing much happens.
Regarding HCCI points, it is shown that the thermal radia-tion and OH* chemiluminescence are absent for low equivalence ratios and significantly increase for the highest measured equivalence ratio (φ = 0.43). However, the signal intensity of OH* chemiluminescence is still three orders of magnitude less than the broadband chemiluminescence in this point, supporting the low adequacy of using OH* opti-cal filters for detecting the OH* signal discussed in Sect. 3.2.
Finally, the average OH*/CH* chemiluminescence ratio is investigated for PPC conditions (case C). This analysis has been done for various amounts of injected fuel, and the results are depicted as a function of CAD in Fig. 13a. This figure shows that the average OH*/CH* chemiluminescence ratio increases with increasing equivalence ratio. An opposite relation is observed in premixed laminar flames [28]. This dif-ference may be caused by the elevated in-cylinder pressure, turbulence, or flame stretch phenomena, as suggested by Nori et al. [28]. Similar observations are made by Nori et al. [28], who observed a monotonic decrease in the OH*/CH* inten-sity ratio upon increasing the equivalence ratio at atmospheric pressure for methane combustion. For elevated pressures, however, they observed a monotonic increase in the OH*/CH* intensity ratio upon increasing the equivalence ratio. Further-more, they concluded that the OH*/CH* ratio can be used for
Fig. 11 Adequacy of optical filters to detect OH* (a), CH* (b) and C2* (c) chemiluminescence. The ordinate represents the percentage of the signal observed through a bandpass filter that is actually due to the intended species
Fig. 12 Relation between virtual OH* bandpass filter intensity (a), broadband chemiluminescence (b) and the scaled heat released for several equivalence ratios in HCCI mode

The influence of charge stratification on the spectral signature of partially premixed…
1 3
Page 11 of 13 108
equivalence ratio sensing, but only at certain conditions. Since in-cylinder pressure varies dramatically over a stroke in an IC engine, it is impossible to consider the OH*/CH* ratio as rep-resentative of equivalence ratio. But there may be an alterna-tive. Figure 10 shows a strong correlation between equivalence ratio and broadband chemiluminescence intensity for both HCCI and PPC cases. We suggest using bandpass filters in the range of 330–400 nm to collect pure broadband chemilumi-nescence as a proxy of local equivalence ratio during combus-tion as shown in Fig. 13b. Note that this method demands pre-cise calibration and further investigations.
5 Conclusions
The objective of this study was to evaluate the spectral sig-nature of partially premixed combustion at different stratifi-cation levels. Spectroscopic measurements were performed in order to analyze the sources of combustion luminos-ity in a light-duty optical CI engine. A method has been described to distinguish between different sources of light. Based on this analysis, the following is concluded:
• Broadband chemiluminescence, a collective name for CO2*, HCO* and CH2O* chemiluminescence, domi-nates the spectrum for HCCI combustion. With increas-ing stratification, narrowband OH*, CH* and C2* chemiluminescence intensities increase.
• Whether the in-cylinder combustion can be analyzed by means of optical filters is questionable, since a signifi-cant broadband chemiluminescence signal is transmit-ted for both PPC and HCCI regimes.
• Broadband chemiluminescence can be used as a meas-ure for the heat release rate. This implies that, as broad-band emission and OH* chemiluminescence correlate strongly with local rate of heat release, an OH* bandpass filter can still be used since its signal will be proportional to the rate of heat release any way. However, further fun-damental investigation and validation is required when different combustion parameters are used.
• Results show that there are two different chemical mechanisms for formation of C2* in PPC regime: first during the early stage of combustion by the breakup of larger molecules and the second during the late stage of combustion when soot particles are forming.
• Atmospheric premixed laminar flames show that the OH*/CH* ratio monotonically decreases with equiva-lence ratio. However, at elevated pressures an inverse relation is observed [28, this work]. This implies that the OH*/CH* ratio can be used for equivalence ratio sensing, but only at certain pressures and temperatures. Thus, it is impossible to apply these relations in an IC engine with varying pressure. However, we indicated that the broadband chemiluminescence, particularly in the range of 330–400 nm, does correlate with equiva-lence ratio quite well in both HCCI and PPC regimes.
Acknowledgements The research leading to these results has received funding from the People Programme (Marie Curie Actions) of the European Union’s Seventh Framework Programme FP7/2007–2013/ under REA Grant Agreement No. 607214. The authors would like to acknowledge Shell Global Solutions for providing the Volvo D5 optical engine setup.
Open Access This article is distributed under the terms of the Crea-tive Commons Attribution 4.0 International License (http://crea-tivecommons.org/licenses/by/4.0/), which permits unrestricted use, distribution, and reproduction in any medium, provided you give appro-priate credit to the original author(s) and the source, provide a link to the Creative Commons license, and indicate if changes were made.
Appendix
See Fig. 14.
Fig. 13 Average OH*/CH* ratio for different amounts of injected fuel of case C (a) and 330–400 bandpass filter for different equiva-lence ratios of case A (b)

M. I. Najafabadi et al.
1 3
108 Page 12 of 13
Fig. 14 Species chemiluminescence intensities for different injection timings based on two different normalization methods; left column Normalized by the total intensity of the combustion cycle to see the overall species behavior within a cycle ( ∫ sp
Isp(�,CA)d�
∫ 540270
d� ∫ +180−180
I(�,CA)dCA). Right
column Normalized by the total intensity at a given CAD (dynamic normalization) to see the role of each species at each CAD indepen-dently (∫
spIsp(�,CA)d�
∫ 540270
I(�,CA)d�)

The influence of charge stratification on the spectral signature of partially premixed…
1 3
Page 13 of 13 108
References
1. L. Hildingsson, G. Kalghatgi, N. Tait, B. Johansson, A. Harri-son, SAE Technical Paper 2009-01-2648 (2009)
2. M. Musculus, P. Miles, L. Pickett, Prog. Energy Combust. Sci 39, 246 (2013)
3. C. Noehre, M. Andersson, B. Johansson, A. Hultqvist, SAE Technical Paper 2006-01-3412 (2006)
4. M. Lewander, K. Ekholm, B. Johansson, P. Tunestål, N. Milo-vanovic, N. Keeler, T. Harcombe, P. Bergstrand, SAE Int. J. Fuels Lubr 1, 1063 (2009)
5. J.E. Dec, Proc. Combust. Inst 32, 2727 (2009) 6. R.D. Reitz, Combust. Flame, 160, 1 (2013) 7. M. Jakob, T. Hülser, A. Janssen, P. Adomeit, S. Pischinger, G.
Grünefeld, Combust. Flame 159, 2516 (2012) 8. J. Dec, C. Espey, SAE Trans. 104, 853 (1995) 9. A. Hultqvist, M. Cristensen, B. Johansson, A. Franke, M. Rich-
ter, M. Aldén, SAE Technical Paper 1999-01-3680 (1999) 10. A. Gaydon, The Spectroscopy of Flames, (Springer, London,
1974) 11. J. Zhang, W. Jing, T. Fang, Fuel 99, 226 (2012) 12. T. Kathrotia, U. Riedel, A. Seipel, K. Moshammer, A. Brockh-
inke, Appl. Phys. B. 107, 571 (2012) 13. J. Dec, C. Espey, SAE Technical Paper 982685 (1998) 14. M. Kim, Y. Kaneko, T. Ikeda, Nakajima, Proc. Combust. Inst 29,
671 (2002)
15. R. Augusta, D. Foster, J. Ghandhi, J. Eng, P. Najt, SAE Technical Paper 2006-01-1520 (2006)
16. M. Izadi Najafabadi, N. Dam, B. Somers, B. Johansson, SAE Technical Paper 2016-01-0761 (2016)
17. S. Tanov, R. Collin, B. Johansson, M. Tuner, SAE Int. J. Engines 7, 1911 (2014)
18. J. Kojima, Y. Ikeda, T. Nakajima, Proc. Comb. Inst. 28, 1757 (2001)
19. Y. Hardalupas, M. Orain, Comb. Flame 139, 188 (2004) 20. F. Bowditch, SAE Technical Paper 610002 (1961) 21. K. Mollenhauer, H. Tschöke, Handbook of diesel engines
(Springer-Verlag, Berlin, 2010) 22. G. Woschni, J. Fieger, SAE Technical Paper 790834 (1979) 23. J.A. Gatowski, E.N. Balles, K.M. Chun, F.E. Nelson, J.A.
Ekchian, J.B. Heywood, SAE Technical Paper 841359, (1984) 24. M. Kopp, O. Mathieu, E. Petersen, Int. J. Chem. Kinet 47, 50
(2014) 25. V. Nori, J. Seitzmann, Proc. Comb. Inst 32, 895 (2009) 26. A. Yoshida, M. Narisawa, H. Tsuji, Symp. Int. Comb. 24, 519
(1992) 27. S. Merola, B. Vaglieco, F. Corcione, E. Mancaruso, SAE Techni-
cal Paper 2003-01-1112 (2003) 28. V. Nori, J. Seitzmann: AIAA 2008–953, (2008)