the inflation and productivity relationship in poland
TRANSCRIPT

© 2003 EAST-WEST University of THESSALY. ALL RIGHTS RESERVED
Journal of Economics and Business Vol. VI – 2003, No 2 (11 – 33)
The Inflation and Productivity Relationship in Poland
Evangelia Papapetrou1
University of Athens Abstract Poland belongs to the most advanced group of transition economies. Poland has succeeded in stabilizing its economy, yet inflation has proven resilient. This paper examines the causality issue, in a Granger-temporal causal sense, between price level and productivity in a bivariate and multivariate context in Poland over the period 1991:I-1998:IV. The empirical results suggest that a bivariate relationship between inflation and productivity is spurious. When we control for fluctuations of monetary policy on the bivariate relationship between price level and productivity the evidence suggests that Granger-causation must exist in at least one direction. Vector error-correction model estimation shows that productivity growth and inflation are econometrically
1 The author wishes to thank two anonymous referees for comments in a previous version of this paper. Address for correspondence: Evangelia Papapetrou, University of Athens, Department of Economics, Pesmazoglou 8, 105 59 Athens, Greece; Tel. +30 210 3246790; Fax : +30 210 3233025; [email protected]

EAST-WEST Journal of ECONOMICS AND BUSINESS
12
endogenous variables and bi-directional causality from inflation to productivity growth and vice versa may exist. KEYWORDS: Transition economies; inflation; productivity; time series analysis JEL classification: P20, E31, J24, C32 Introduction Poland, among other countries, belongs to the most advanced group of transition economies and is a candidate for European Union membership. Poland has succeeded in stabilizing its economy, yet inflation has proven resilient. Poland was the first country from the old socialist block to launch a stabilization program in 1990. Hyperinflation was overcome, but since then inflation has become stuck at moderate levels. Disinflation is expected to continue, albeit more gradually, provided that the stance of financial policy is tightened (OECD, 1998, 1999). It is recognized that inflation has adverse effects on macroeconomic variables, such as output and productivity growth. Economists argue that inflation reduces the information content of relative prices and consequently it affects the efficient allocation or resources. Inflation causes misperception of the relative price levels and leads to inefficient investment plans and therefore affects productivity inversely (Clark 1982). Savings are allocated away from productive capital formation and towards in hedges against inflation. Furthermore, inflation erodes tax reductions for depreciation and raises the rental price of capital which in turn causes a reduction in capital accumulation and therefore in labor productivity (Clark 1982, Jarrett and Selody 1982). Inflation disrupts investment plans by imposing a higher tax rate on corporate profits (Feldstein 1982) and through higher effective tax rates on corporate income it affects productivity (Gilson 1984). Various studies have considered the relationship between inflation and productivity in different countries. However, the empirical analysis usually provides contradictory results. Some studies provide evidence in favor of a negative relationship between inflation and productivity (Jarrett and Selody (1982) and Selody (1990) for Canada, Ram (1984) and Smyth (1995a, 1995b) for Germany and the United States, Cozier and Selody (1992) for a sample of twenty-two OECD countries. However recently, Sbordone and Kuttner (1994), Cameron et al. (1996), Freeman and Yerger (1997, 1998) and Hondroyiannis

Papapetrou, E., The Inflation and Productivity Relationship in Poland
13
and Papapetrou (1998) find statistical evidence not supporting the negative relationship between inflation and productivity. However, to resolve the issue of the direction of causality most studies have used data from countries with low inflation rates and considerably high productivity growth rates (Sbordone and Kuttner (1994), Smyth (1995a, 1995b), Cameron et al. (1996) and Freeman and Yerger (1997)). Although the inflationary effects on productivity growth have been studied extensively in these countries it is not clear whether the conclusions drawn from these countries can be applied to other moderate inflation countries, or to similar transition countries. Besides, in a bivariate context, most studies have used the standard Granger, Sims and the modified Sims tests, which ignore the long-run information embodied in the variables (Ram, 1984; Jarrett and Selody, 1982). In the present analysis, we address the causality issue between price level and productivity for a transition economy that has experienced moderate inflation rates and greater fluctuations in productivity, such a Poland, in a temporal causal framework with the aid of bivariate and multivariate cointegration and the application of vector error-correction modeling (VECM) over the period 1991-1998. The use of vector error-correction model (VECM) is used to capture the short-run dynamics and to establish the direction of causality in a Granger temporal sense. The remainder of the paper proceeds as follows. Section II presents a brief history of changes and economic developments in Poland. Section III notes the conceptual links between inflation and productivity and briefly surveys the relevant empirical studies for various economies. Section IV presents the methodological issues and the data used in the empirical analysis. Section V reports the empirical results, while the key findings are highlighted in the concluding section. A Brief History of Economic Developments in Poland2 In Poland inflation was an everyday phenomenon of the 1980s. By October 1989, CPI inflation had reached 55 per cent per month, and in early 1990 Poland was experiencing hyperinflation rates. State budget deficits were financed by nearly unlimited interest-free credits from the central bank. In
2A more detailed analysis can found in Pujol and Griffiths (1996), Krzak (1996) and OECD (1998, 1999).

EAST-WEST Journal of ECONOMICS AND BUSINESS
14
January 1990, a stabilization program was introduced. The major objective of the stabilization program was to stop the hyperinflation situation of the 1980s. The stabilization program made the use of fixed exchange rate and wage controls the two anchors to eliminate hyperinflation. The program was based on tight monetary policy, elimination of the budget deficit, indexation of wages in state firms and the exchange rate was pegged to the US dollar. Inflation was eliminated (in the first quarter of 1990 consumer prices rose by 132% while in the second quarter of 1990 consumer prices increased by 16.1%), but was not reduced to single digits as intended by the stabilization program. During the 1991-93 period monetary policy alone had to bear the burnt of the stabilization effort while government had been relatively unwilling to make unpopular decisions to reduce fiscal deficits (Wellisz, 1997). Wellisz notes that during that period although the monetization of the fiscal deficit acted as the ‘motor of inflation’ (p.165) the government borrowed from commercial banks, driving up interest rates thus constraining the monetary policy of the National Bank of Poland. Poland entered the moderate inflation region in 1992 when inflation increased by less than 40%. Inflation has continued to slow down in 1996-1997, although it remained high (consumer price inflation, end-year 18.5 per cent in 1996)3. In contrast with the overshooting observed in earlier years, consumer price inflation in 1997 barely exceed the 13 per cent end-year target. Continued disinflation would not have been possible without a substantial tightening of monetary policy. Reserve requirements and interest rates were progressively raised, both to very high levels. The pace of credit growth did cool down, but it remained very high. In February 1998, to support disinflation the monthly pace of exchange rate crawl was decided to be slowed down (from 1 per cent in 1996-1997 to 0.8 per cent) and at the same time the width of the exchange rate band was broadened from ±7 per cent to ±10 per cent. By early May 1998, the nominal exchange rate had appreciated considerably, standing at less than 2 per cent below the upper edge of the new band (OECD, 1998). Contrary, fiscal policy has remained relatively loose in 1996-97, with the general government deficit rising to well above 3 per cent of GDP.
3 In autumn of 1998 Poland’s Monetary Policy Council announced that it was adopting an inflation-targeting framework for the conduct of monetary policy. Cristoffersen and Wescott (1999) examine how inflation responds to changes in policy instruments and other economic forces.

Papapetrou, E., The Inflation and Productivity Relationship in Poland
15
Over the period 1993-1997 the Polish economy expanded at an annual rate of almost 6 percent as a result of a dynamic performance of private firms in manufacturing and services. Rapid output growth was accompanied by large productivity gains. The benefits of sustained growth were reflected in decreasing unemployment rates and increasing real wages. The rate of unemployment, which in 1994 reached its highest rate of 17 per cent, declined sharply to 10.5 per cent at the end of 1997. Despite the increase in domestic demand export growth slowed down and the current account shifted from a surplus to a deficit. Real GDP increased with a marked slowdown in 1998 (4.8 per cent for 1998) due to a sharp decline in exports. In short, Poland has succeeded in eliminating inflation. Output growth after a period of rapid expansion slowed down in 1998, reflecting high policy induced real interest rates and weak exports. Most macroeconomic fundamentals nevertheless, such as the financial system, foreign direct investment flows, were sound. The favourable results achieved as regards disinflation and output growth reward the continued adherence to prudent and gradual macroeconomic and structural reform policy. Inflation and Productivity: Theoretical and Empirical Aspects There are a number of reasons why inflation may affect negatively productivity growth. First, inflation may affect adversely productivity by causing an inefficient mix of input resources. Inflation causes misperception of the relative price levels and leads to inefficient investment plans and therefore affects productivity inversely (Clark 1982). The price mechanism plays an important role in allocating resources efficiently in a market economy. Inflation disrupts the proper functioning of this mechanism, resulting in distortions and misallocation of resources. Inflation distorts the decision making of agents as they confuse transitory and permanent price changes, which further impedes the efficient allocation of resources. Inefficiencies arise as the investment plans of the firms are affected by price changes. For worthy investment decisions, the firms must rely on the signals conveyed by relative price changes as these prices determine whether an investment plan will be profitable or not. For the relative price mechanism to function correctly firms should be in a position to distinguish between relative price adjustments and changes in the general price level. In the long run, even in periods of steady prices, the information signaling of the prices is reduced. Therefore, it is important for firms to rely with confidence to the signals that the relative prices are conveying. With imperfect signal extraction devices, business managers may make more errors and decide on sub-optimal resource output mix and inefficient allocation of resources. Furthermore, inflation results in inefficient use of resources, as it
EAST-WEST Journal of ECONOMICS AND BUSINESS
16
shortens the optimal contract length and increases contracting costs. Price stability eliminates the need for private agents to rely on indexation mechanisms and procedures. Second, because of the distortions intrinsic in the tax and welfare systems that affect economic behavior, inflation worsens the existing distortions. Even without inflation, the imposition of taxes distorts the efficient allocation of resources as it leads to increases in current consumption relative to saving and investment. In addition, inflation reduces after-tax profits and reduces capital accumulation, which in turn affects labor productivity. Third, inflation affects the labor supply decisions of the households. Aschauer and Greenwood (1983) have emphasized the effects of inflation on the effective price of goods and its consequences on labor supply decisions. With inflation uncertainty households have less incentive to supply labor. This will result in a reduction of the productivity of human and physical capital. Fourth, inflation affects capital accumulation, which in turn influences labor productivity. In an inflationary environment firms will reduce the amount of capital and hence investment as the result of an increase in the actual price of capital goods, as capital in addition to its market price includes the cost of holding money to acquire new capital. Increases in the price level may imply for the firm that excessive resources are being devoted to transactions and cash management instead of the production of goods (De Gregorio, 1993). Inflation distorts the investment plans not only of firms but of individuals as well. With inflation uncertainty it is likely to be excessive investment in hedges against inflation, such as property, and not in financial investment. Such a reaction from the household’s point of view may distort the emergence and the functioning of efficient financial markets. Different researchers have studied the nexus between inflation and productivity. However, the empirical analysis usually provides contradictory results. Some studies provide evidence in favor of a negative relationship between inflation and productivity. The list of papers that establish such a negative relationship include Jarrett and Selody (1982) and Selody (1990), Ram (1984) and Smyth (1995a, 1995b), Cozier and Selody (1992). The result is not unanimous, however. Recently, various researchers find statistical evidence not supporting the negative relationship between inflation and productivity (Sbordone and Kuttner (1994), Cameron et al. (1996), Freeman and Yerger (1997, 1998) and Hondroyiannis and Papapetrou (1998)). It is argued that that the negative correlation between inflation and productivity is spurious and due to cyclical

Papapetrou, E., The Inflation and Productivity Relationship in Poland
17
co-movements in the two variables. Besides, the observed inverse relationship among the variables is due to the inclusion in the sample of specific countries and moreover it is difficult to establish a negative relationship when inflation is relatively low. Methodological Issues and Data Testing for the existence of statistical relationship among the variables is done in three steps. Initially the order of integration of the variables is investigated since the causality tests are valid if the variables have the same order of integration. The degree of integration of the variables is examined employing standard tests for the presence of a unit root based on the work of Dickey and Fuller (1979, 1981), (ADF), Perron (1988), Phillips (1987), Phillips and Perron (1988), (PP) and Kwiatkowski et al. (1992), (KPSS). Then cointegration is tested using the Engle-Granger (1987), the error-correction method and the Phillips-Hansen (1990) for the bivariate model and the Johansen maximum likelihood approach (Johansen 1988, Johansen and Juselius 1990, 1992) for the multivariate model. The Engle-Granger (1987) method is a residual-based cointegration test, which has been criticized by Kremers et al. (1992) that has reduced power because it imposes the “common factor restriction”. For this reason an unrestricted error-correction model is employed to test directly for cointegration between two variables by checking the significance of the lagged level of the dependent variable, based on the critical t-values from Banerjee et al. (1998). Another method that overcomes the shortcomings of the Engle-Granger method is the Phillips-Hansen estimator (PH), which takes into account the correlations among the residuals and their lagged values in a semi-parametric manner. In the case of more than two variables the Johansen maximum likelihood approach is used (Johansen 1988, Johansen and Juselius 1990, 1992). The Johansen-Juselius estimation method is based on the error-correction representation of the VAR model with Gaussian errors. Finally, vector error-correction model estimation is applied and the exogeneity of variables is examined. Engle and Granger show that in the presence of cointegration, there always exists a corresponding error-correction representation which implies that changes in the dependent variable are a function of the level of disequilibrium in the cointegrating relationship, captured by the error-correction term (ECT), as well as changes in other explanatory variables (Granger, 1986, 1988). So, through ECT, the VECM modeling establishes an additional way to examine the Granger-causality

EAST-WEST Journal of ECONOMICS AND BUSINESS
18
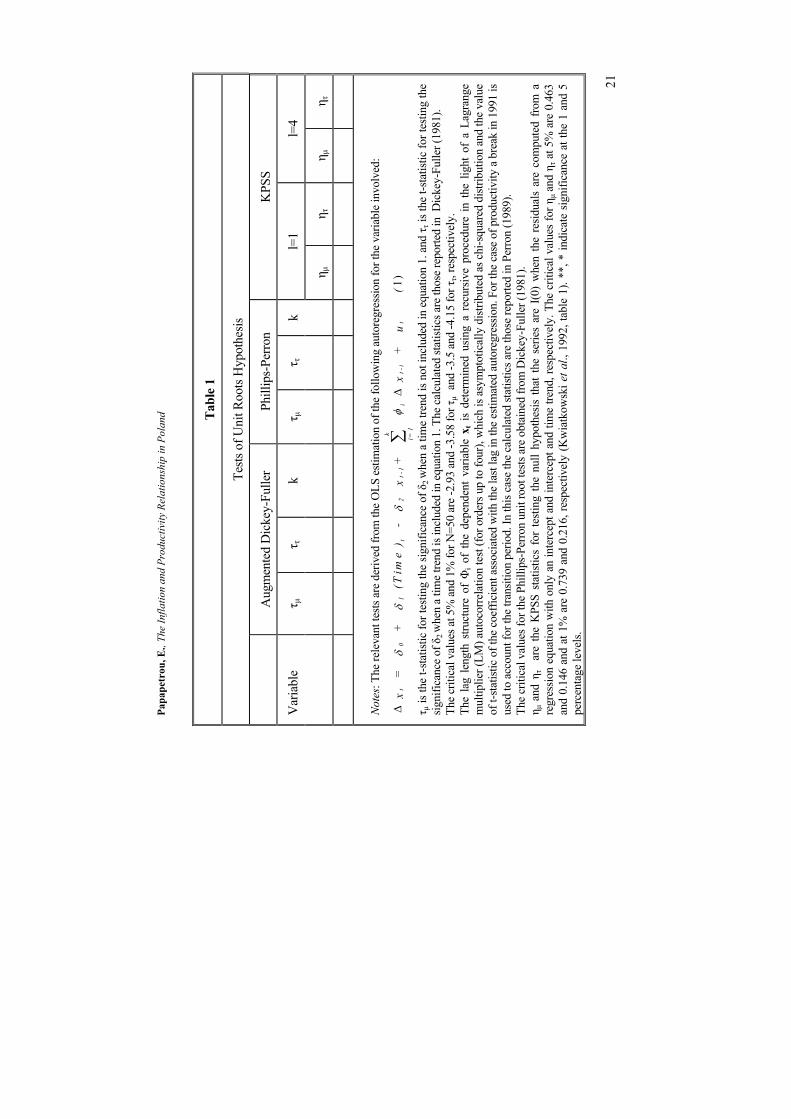
ignored initially from the Granger-Sims tests. The Wald-test applied to the joint significance of the sum of the lags of each explanatory variable and the t-test of the lagged error-correction term will imply statistically the Granger-exogeneity or endogeneity of the dependent variable. The non-significance of ECT is referred as long-run non-causality and shows that the variable is weakly exogenous with respect to long-run parameters. The absence of short-run causality (Granger-causality in the strict sense) is established from the non-significance of the sums of the lags of each explanatory variable. Finally, the non-significance of all the explanatory variables including the ECT term in the VECM indicates the econometric strong-exogeneity of the dependent variable that is the absence of Granger-causality4. The present empirical analysis has been carried out using quarterly data for price level (CPI), productivity (PROD) and interest rates (INTER) for the period 1991:I to 1998:IV for Poland. The price variable is the consumer price index, while the productivity variable is the output per employed person in manufacturing and are seasonally adjusted. Finally, interest rate is the discount rate. The quarterly data on price and productivity indices and interest rate were obtained from International Financial Statistics CD ROM and from the European Central Bank. The following notation is used; L denotes the logarithms of the variables used in the analysis and D denotes the changes in logarithms of the variables. Initially a two variable VAR model of prices and productivity is estimated. Then a three variable VAR model is introduced. In order, to account for potential influences of changes in monetary policy on the price level-productivity relationship the interest rate variable LINTER was added. Empirical Results Table 1 presents the ADF, PP and KPSS tests for the three variables, consumer price index, productivity and interest rate, used in the analysis in levels and first differences. The ADF statistic suggests that all variables are integrated of order one, I(1), whereas the first differences are integrated of order zero, I(0) and the hypothesis that the time series contain an autoregressive unit root is accepted in all cases. In addition, the Phillips-Perron test based on the 5 and 1 per cent critical values supports the hypothesis that all series contain a unit root. Thus, both tests are in favor of the unit root hypothesis in all time series.
4 For an application of this technique in related disciplines, see Hondroyiannis and Papapetrou (1998, 2000).

Papapetrou, E., The Inflation and Productivity Relationship in Poland
19
The KPSS test rejects the null hypothesis of level and trend stationarity for both lag truncation parameters5. The KPSS statistics does not reject the I(0) hypothesis for the first differences of the series at different levels of significance. Hence, the combined results from all the tests (ADF, PP, KPSS) suggest that all the series under consideration appear to be I(1) processes. In the next step the relationship between price level and productivity level is examined, having established that both the productivity level and the consumer price index are integrated of the same order. Table 2 summarizes the results of cointegration analysis using the Engle-Granger method. The results suggest that the hypothesis of no cointegration between the two variables, the price level and productivity, cannot be rejected. However, since this test is not very powerful, cointegration between the two variables using the Phillips-Hansen method and the error-correction model is applied. The use of the error-correction model directly tests for the significance of the coefficient of lagged level of the dependent variable using the critical values from Banerjee et al. (1997). The results presented in table 2 suggest that the hypothesis of no cointegration cannot be rejected. Thus, the combined results from all tests employed do not provide support to the proposition of a long-run relationship between the two variables.
5 The KPSS statistics test for lag-truncation parameters one and four (l=1 and l=4)5 since it is unknown how many lagged residuals should be used to construct a consistent estimator of the residual variance. The KPSS statistics are known to be sensitive to the choice of truncation parameter l and tend to decline monotonically as l increases.

EA
ST-W
EST
Jou
rnal
of E
CO
NO
MIC
S A
ND
BU
SIN
ESS
20
Tabl
e 1
Tests
of U
nit R
oots
Hyp
othe
sis
A
ugm
ente
d D
icke
y-Fu
ller
Phill
ips-
Perro
n K
PSS
Var
iabl
e τ µ
τ τ
k τ µ
τ τ
k l=
1 l=
4
η µ
η τ
η µ
η τ
LCPI
-2.9
2 -2
.80
3 -2
.29
-1.1
3 1
1.63
7**
0.41
4**
0.73
7**
0.20
3*
LPRO
D
-2
.00
-3.5
0 0
0.04
-2
.84
1 1.
653*
*0.
108
0.73
0**
0.09
8
LIN
TER
-2
.35
-1.8
6 3
-2.8
2 -2
.18
1 1.
290*
*0.
204*
0.
699*
0.
149*
DLC
PI
-3
.41*
-4
.40*
*3
-3.3
6*
-5.6
7**
1 1.
186*
*0.
025
0.72
1*
0.08
8
DLP
RO
D
-6
.63*
* -6
.92*
*0
-7.7
1**
7.57
**1
0.17
8 0.
165*
0.
162
0.14
3
DLI
NTE
R -5
.76*
* -5
.78*
*0
-4.4
4**
-4.3
8**
1 0.
356
0.14
0 0.
327
0.14
4
Papa
petr
ou, E
., Th
e In
flatio
n an
d Pr
oduc
tivity
Rel
atio
nshi
p in
Pol
and
21
Tabl
e 1
Tests
of U
nit R
oots
Hyp
othe
sis
A
ugm
ente
d D
icke
y-Fu
ller
Phill
ips-
Perro
n K
PSS
Var
iabl
e τ µ
τ τ
k τ µ
τ τ
k l=
1 l=
4
η µ
η τ
η µ
η τ
No
tes:
The
rele
vant
tests
are
der
ived
from
the
OLS
esti
mat
ion
of th
e fo
llow
ing
auto
regr
essio
n fo
r the
var
iabl
e in
volv
ed:
∆∆
t0
1t
2t-
1i=
1
k
it-
it
x =
+
(
Tim
e)
-
x+
x
+ u
(
δδ
δφ
∑1)
τ µ is
the
t-sta
tistic
for t
estin
g th
e sig
nific
ance
of δ
2 w
hen
a tim
e tre
nd is
not
incl
uded
in e
quat
ion
1. a
nd τ τ
is th
e t-s
tatis
tic fo
r tes
ting
the
signi
fican
ce o
f δ2 w
hen
a tim
e tre
nd is
incl
uded
in e
quat
ion
1. T
he c
alcu
late
d sta
tistic
s are
thos
e re
porte
d in
Dic
key-
Fulle
r (19
81).
The
criti
cal v
alue
s at 5
% a
nd 1
% fo
r N=5
0 ar
e -2
.93
and
-3.5
8 fo
r τµ
and
-3.5
and
-4.1
5 fo
r ττ,
resp
ectiv
ely.
Th
e la
g le
ngth
stru
ctur
e of
Φi o
f th
e de
pend
ent
varia
ble
x t i
s de
term
ined
usin
g a
recu
rsiv
e pr
oced
ure
in t
he l
ight
of
a La
gran
ge
mul
tiplie
r (LM
) aut
ocor
rela
tion
test
(for o
rder
s up
to fo
ur),
whi
ch is
asy
mpt
otic
ally
dist
ribut
ed a
s chi
-squ
ared
dist
ribut
ion
and
the
valu
e of
t-sta
tistic
of t
he c
oeffi
cien
t ass
ocia
ted
with
the
last
lag
in th
e es
timat
ed a
utor
egre
ssio
n. F
or th
e ca
se o
f pro
duct
ivity
a b
reak
in 1
991
is us
ed to
acc
ount
for t
he tr
ansit
ion
perio
d. In
this
case
the
calc
ulat
ed st
atist
ics a
re th
ose
repo
rted
in P
erro
n (1
989)
. Th
e cr
itica
l val
ues f
or th
e Ph
illip
s-Pe
rron
unit
root
tests
are
obt
aine
d fro
m D
icke
y-Fu
ller (
1981
). η µ
and
ητ
are
the
KPS
S sta
tistic
s fo
r te
sting
the
nul
l hy
poth
esis
that
the
ser
ies
are
I(0)
whe
n th
e re
sidua
ls ar
e co
mpu
ted
from
a
regr
essio
n eq
uatio
n w
ith o
nly
an in
terc
ept a
nd in
terc
ept a
nd ti
me
trend
, res
pect
ivel
y. T
he c
ritic
al v
alue
s fo
r ηµ
and η τ
at 5
% a
re 0
.463
an
d 0.
146
and
at 1
% a
re 0
.739
and
0.2
16, r
espe
ctiv
ely
(Kw
iatk
owsk
i et a
l., 1
992,
tabl
e 1)
. **,
* in
dica
te s
igni
fican
ce a
t the
1 a
nd 5
pe
rcen
tage
leve
ls.

EA
ST-W
EST
Jou
rnal
of E
CO
NO
MIC
S A
ND
BU
SIN
ESS
22
Tabl
e 2
Biva
riate
Coi
nteg
ratio
n Te
sts
M
etho
d D
epen
dent
Var
iabl
e Pr
oduc
tivity
Dep
ende
nt V
aria
ble
Pric
e le
vel
k t-t
est
K
t-tes
t
Engl
e-G
rang
er
1 -1
.85
1 -2
.45
Erro
r-Cor
rect
ion
Estim
ates
0
-3.0
1 0
-1.1
9 Ph
illip
s-H
anse
n
1 -1
.80
1 -2
.82
Not
es: T
he a
ugm
ente
d D
icke
y-Fu
ller t
est i
s bas
ed o
n th
e eq
uatio
n (1
) (se
e ta
ble
1) w
ith c
onsta
nt a
nd w
ithou
t tre
nd, w
here
xt is
the
estim
ated
resid
ual
from
the
long
-run
mod
el L
CPI t=α 0
+α1L
PRO
t. Th
e la
g le
ngth
k is
cho
sen
so th
e es
timat
ed re
sidua
ls of
equ
atio
n (1
) w
ill b
e w
ithou
t aut
ocor
rela
tion.
Th
e cr
itica
l val
ues f
or th
e re
ject
ion
of n
ull h
ypot
hesis
of n
o co
inte
grat
ion
betw
een
the
two
varia
bles
are
sele
cted
from
Eng
le a
nd Y
oo (1
987,
Tab
les
2 an
d 3,
pp.
157-
158)
. Th
e sin
gle-
equa
tion
erro
r co
rrect
ion
mod
el
is es
timat
ed
for
LPRO
D
and
LCPI
DY
YX
DY
DX
ut
tt
ik
it
ik
it
t=
++
++
+−
−=
−=
−∑
∑α
αα
βγ
01
12
11
11
1
The
repo
rted
valu
es a
re th
e t-t
ests
for t
he e
stim
ated
coe
ffici
ent α
1.The
crit
ical
val
ues f
or α
1 at 5
% a
nd 1
% f
or N
=50
are
-3.2
8 an
d 3.
94, r
espe
ctiv
ely
(Ban
erje
e et
al.
(199
8), t
able
1, p
.21)
. The
Phi
llips
and
Han
sen
estim
ates
are
bas
ed o
n th
e Pa
rzen
lag
win
dow
. The
resu
lts a
re fo
r len
gth
lag
win
dow
eq
ual t
o fo
ur. T
he re
sults
are
sim
ilar f
or le
ngth
lag
win
dow
equ
al to
3.

Papapetrou, E., The Inflation and Productivity Relationship in Poland
23
When only the two variables, price level and productivity level, are included in the analysis the combined results from both tests suggest that they are not cointegrated. To account for influences on the price-productivity relationship of changes in monetary policy, the interest rate (LINTER) variable was added to the VAR model6. Table 3 summarizes the results of cointegration analysis of the three variables using the Johansen maximum likelihood approach. To determine the lag length of the VAR four versions of systems were initially estimated: a two-lag version, a three-lag version, a four-lag version and a five lag version. Then, an Akaike Information criterion (AIC), a Schwarz Bayesian Criterion (SBC) and a likelihood ratio test (Sim’s test) were used to test that all three specifications are statistically equivalent. All tests reject the null hypothesis that all the specifications are equivalent. In particular, the tests suggest that VAR=3 should be used in the estimation procedure of cointegration to avoid over-parameterization of the estimated models. Next, each equation of the VAR system passes a series of diagnostic tests including serial correlation based on the inspection of the autocorrelation functions of the residuals as well as the reported Lagrange multiplier. In addition, it was tested whether the estimated regression equations were stable throughout the sample using the CUSUM and CUSUMSQ tests on structural stability of the estimated relations. The estimated statistics support the structural stability of the estimated regressions. The estimation procedure assumes unrestricted intercepts and unrestricted trends in the VAR estimation. The two test-statistics give almost similar results, (table 3). Both tests provide evidence to reject the null of zero cointegrating vectors in favor of one cointegrating vector at 5% level. On the basis of the results, we can support the proposition that a long-run relationship exists among productivity, price level and interest rate in Poland over the period under examination.
6 In accordance with prior results in research on inflation and labor productivity, the estimating equations are expanded to control for the influence of changes in monetary policy in the relationship between inflation and productivity (Sbordone and Kuttner, 1994; Freeman and Yerger, 1997 and 1998; Hondroyiannis and Papapetrou, 1998).

EA
ST-W
EST
Jou
rnal
of E
CO
NO
MIC
S A
ND
BU
SIN
ESS
24
Tab
le 3
Joha
nsen
and
Juse
lius C
oint
egra
tion
Tests
am
ong
Pro
duct
ivity
, Pric
e Le
vel,
and
Inte
rest
Rate
s.
VA
R=3
Max
imum
Eig
enva
lues
Nul
l
A
ltern
ativ
e
Eige
nval
ue
Crit
ical
va
lues
95
%
90%
r=
0 r>
=1
41.8
7**
24.3
5 22
.26
r<=1
r>
=2
12.7
8 18
.33
16.2
8 Tr
ace
Stat
istic
Nul
l
Alte
rnat
ive
Tr
ace
Crit
ical
va
lues
95
%
90%
r=
0 r>
=1
54.8
2**
58.9
3 36
.28
r<=1
r>
=2
12.9
5 39
.33
21.2
3 N
ote
: r
indi
cate
s th
e nu
mbe
r of
coi
nteg
ratin
g re
latio
nshi
ps.
Max
imum
eig
enva
lue
and
trace
tes
t st
atis
tics
are
com
pare
d w
ith t
he c
ritic
al v
alue
s fr
om J
ohan
sen
and
Juse
lius
(199
0).
** i
ndic
ates
re
ject
ion
of th
e nu
ll hy
poth
esis
at 9
5 pe
rcen
t crit
ical
val
ue.

Papapetrou, E., The Inflation and Productivity Relationship in Poland
25
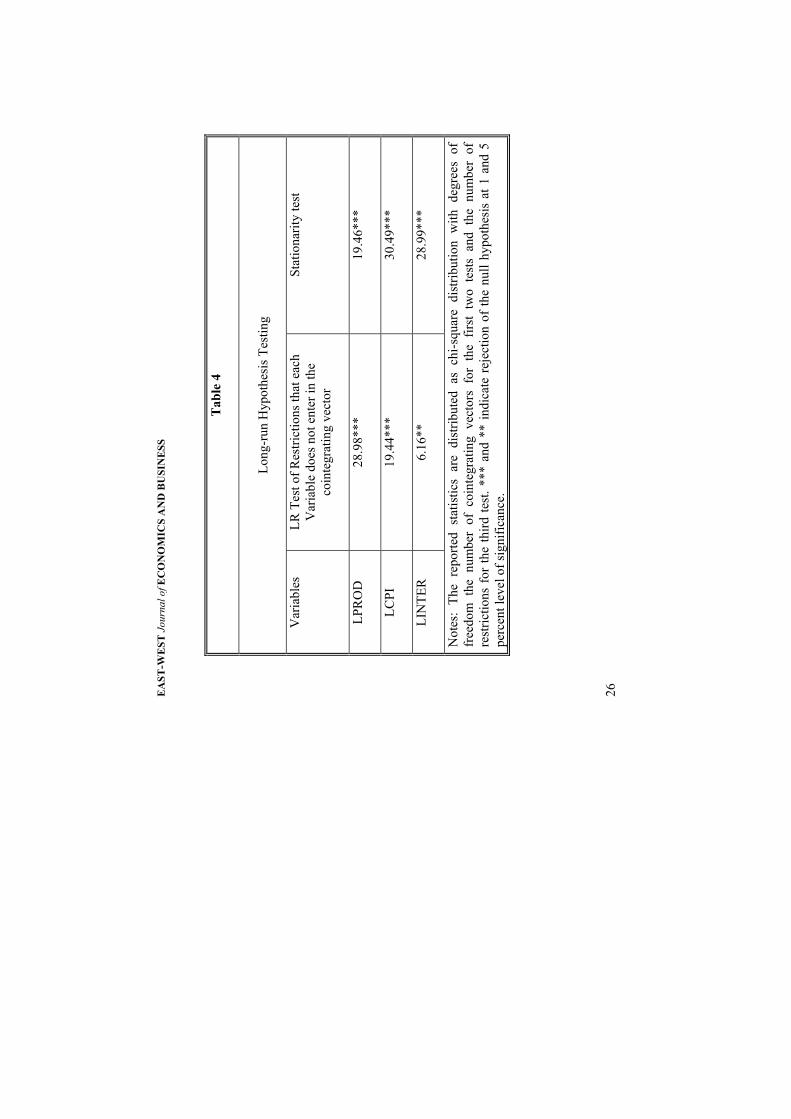
Subsequently, it is tested whether all the variables, productivity, price level and interest rate enter statistically significant in the cointegrating vectors. Table 4 reports the likelihood ratio tests as described in Johansen (1992) and Johansen and Juselius (1992). The results suggest that all variables enter statistically significant into the cointegrating vector. In addition, table 4 reports the statistics testing for the stationarity hypothesis of all variables. In particular, we investigate whether all variables except one, which takes the value one, are equal to zero. The tests, which follow chi-square distribution with three degrees of freedom, reject the stationarity hypothesis for all variables at 1% level of significance. These findings are in accordance with the rejection of the unit root hypothesis, from the three tests (ADF, PP, KPSS), implying that all variables employed in the analysis are not stationary. Although cointegration implies that the three variables are bound together by one long-run equilibrium relationship it cannot reveal information about the direction of causality between these variables. Table 5 reports the findings for causality, based on vector error-correction models containing one error-correction term measuring the long-run disequilibrium. Cointegration implies that the three variables are bound together by one long-run equilibrium relationship but it cannot reveal information about the direction of causality between these variables. Table 5 reports the findings for causality, based on vector error-correction models containing one error-correction term measuring the long-run disequilibrium.
EA
ST-W
EST
Jou
rnal
of E
CO
NO
MIC
S A
ND
BU
SIN
ESS
26
Tab
le 4
Long
-run
Hyp
othe
sis T
estin
g
V
aria
bles
LR
Tes
t of R
estri
ctio
ns th
at e
ach
Var
iabl
e do
es n
ot e
nter
in th
e co
inte
grat
ing
vect
or
Stat
iona
rity
test
LPR
OD
28.9
8***
19
.46*
**
LCPI
19.4
4***
30
.49*
**
LIN
TER
6.16
**
28.9
9***
Not
es:
The
repo
rted
stat
istic
s ar
e di
strib
uted
as
chi-s
quar
e di
strib
utio
n w
ith d
egre
es o
f fr
eedo
m t
he n
umbe
r of
coi
nteg
ratin
g ve
ctor
s fo
r th
e fir
st t
wo
test
s an
d th
e nu
mbe
r of
re
stric
tions
for
the
third
test
. ***
and
**
indi
cate
rej
ectio
n of
the
null
hypo
thes
is a
t 1 a
nd 5
pe
rcen
t lev
el o
f sig
nific
ance
.

Kol
eva,
P.,
Ente
rpri
se R
estr
uctu
ring
in T
rans
ition
Eco
nom
ies a
nd it
s Det
erm
inan
ts: T
he C
ase
of B
ulga
ria
27
Tabl
e 5
Sum
mar
y of
Tes
ts fo
r Wea
k an
d St
rong
Exo
gene
ity o
f Var
iabl
es B
ased
on
Vec
tor E
rror-C
orre
ctio
n M
odel
s
Te
st of
Res
trict
ions
Equa
tions
Sh
ort-r
un D
ynam
ics,
Coef
ficie
nts a
nd
Non
-Cau
salit
y (W
ald
Test)
Wea
k Ex
ogen
eity
, (E
CT
coef
ficie
nt )
Te
sts fo
r Gra
nger
Non
-Cau
salit
y, (J
oint
Sh
ort-r
un D
ynam
ics a
nd E
CT, W
ald-
test)
Te
sts fo
r St
rong
Ex
ogen
eity
D
LPRO
D
DLC
PI
DIN
TER
Z=0
DLP
ROD
an
d EC
T D
LCPI
an
d EC
T
DIN
TER
and
ECT
(Wal
d te
st)
DLP
ROD
(-0.3
)
2.27
(0.4
3)
4.62
-0.3
5**
11
.54*
**
24.0
2***
36.9
1***

EA
ST-W
EST
Jou
rnal
of E
CO
NO
MIC
S A
ND
BU
SIN
ESS
28D
LCPI
(-0
.21)
1.64
(0
.20)
4.84
0.41
***
30.5
1***
37.0
7***
32.3
5***
Note
: Th
e la
gged
ECT
is
deriv
ed b
y no
rmal
izin
g th
e co
inte
grat
ing
vect
or o
n pr
oduc
tivity
. Th
e va
lues
in
the
pare
nthe
sis in
the
shor
t-run
per
iod
are
the
sum
of t
he e
stim
ated
coe
ffici
ents.
The
stat
istic
s rep
orte
d ar
e di
strib
uted
as
chi-s
quar
e di
strib
utio
n w
ith d
egre
es o
f fre
edom
the
num
ber
of r
estri
ctio
ns.
In t
he s
hort-
run
dyna
mic
s as
teris
ks
indi
cate
rej
ectio
n of
the
Ho
that
the
re i
s sh
ort-r
un n
on-c
ausa
l re
latio
nshi
p be
twee
n th
e tw
o va
riabl
es.
Aste
risks
in
dica
te re
ject
ion
of th
e nu
ll hy
poth
esis
that
the
estim
ated
coe
ffici
ent i
s eq
ual t
o ze
ro (w
eak
exog
enei
ty).
Fina
lly, i
n th
e te
sts f
or G
rang
er-n
on c
ausa
lity
and
stron
g ex
ogen
eity
, as
teris
ks d
enot
e re
ject
ion
of t
he n
ull
hypo
thes
is of
G
rang
er-n
on c
ausa
lity
and
stron
g ex
ogen
eity
res
pect
ivel
y. *
** a
nd *
* in
dica
te s
igni
fican
ce a
t the
1 a
nd 5
per
cent
le
vels.

Koleva, P., Enterprise Restructuring in Transition Economies and its Determinants: The Case of Bulgaria
29
The restricted error-correction models pass a series of diagnostic tests including serial correlation based on the inspection of the autocorrelation functions of the residuals as well as the reported Lagrange multiplier, the ARCH (4), the normality and the heteroskedasticity tests7. Besides, it was tested whether the estimated regression equations were stable through out the sample using the CUSUM and CUSUMSQ tests on structural stability of the estimated relations. The estimated statistics support the structural stability of the estimated regressions. Estimates of the parameters show that the error-correction terms measuring the long-run disequilibrium have the appropriate signs and are significant for both the productivity growth and the inflation regression equations. This implies that both productivity growth and inflation have the tendency to restore equilibrium and take the brunt of shock to the system. The t-test for the error-correction terms indicates, at 1% level of significance, that both variables are not weakly exogenous. Employing the short-run dynamics for the productivity growth and inflation regressions the Wald-tests show that there is not a relationship between productivity growth and inflation. Hence, in general we can conclude that the model tends to suggest that there is not a significant feedback in the short-term from inflation to productivity growth and vice versa when we control for monetary policy (Granger-causality in the strict sense). As a final point, the significance levels associated with the Wald-test of joint significance of the sum of the lags of the explanatory variable and the error-correction term, provide more information on the causal direction as it exposes a further channel of Granger-causality. For both equations, the results imply the Granger-endogeneity of productivity growth and inflation rate and reject the hypothesis of strong exogeneity for both variables. The empirical results suggest that a bi-directional causality may exist between inflation and productivity growth and support the proposition of a negative relationship from inflation to productivity growth and vice versa.
7 The estimated LM(4) test statistic follows the F-distribution and is equal to 2.69 for the ∆LPRO equation, 2.24 for the ∆LCPI equation and 2.70 for the ∆LINTER equation. The ARCH(4) test statistic follows the F-distribution and is equal to 0.50 for the ∆LPRO equation, 0.56 for the ∆LCPI equation and 0.84 for the ∆LINTER equation. The test statistic for heteroskedasticity,which follows the F-distribution, is equal to 0.13 for the ∆LPRO equation, 0.85 or the ∆LCPI equation and 0.05 for the ∆LINTER equation. The RESET test statistic for functional form follows the F-distribution and is equal to 0.37 for the ∆LPRO equation, 0.85 for the ∆LCPI equation and 2.26 for the ∆LINTER equation. Finally, the Normality test, which follows chi-square distribution, is equal to 1.15 for the ∆LPRO equation, 1.76 for the ∆LCPI equation and 0.99 for the ∆LINTER equation.

EAST-WEST Journal of ECONOMICS AND BUSINESS
30
These results are comparable to Sbordone and Kuttner (1994), Cameron et al. (1996) and Freeman and Yerger (1997), Hondroyiannis and Papapetrou (1998) and contradict the findings of other studies. The reasons of this difference may be attributed first, to the different methodological approaches followed in this paper, second, to the introduction of an additional variable in the VAR model to account for the potential influences of the cyclical variations of the monetary policy on the bivariate relationship, and finally to the fact that these studies have examined low inflation countries. Conclusion Poland belongs to the most advanced group of transition economies and is a candidate for European Union membership. Poland has succeeded in stabilizing its economy, yet inflation has proven persistent. The purpose of this paper was to examine the causality issue in a Granger-causal framework between price level and productivity in a bivariate and multivariate context in a transition economy with moderate inflation rates. Various time-series techniques, such as unit-root testing, bivariate and multivariate cointegration and procedures in vector error-correction modeling, were used and analysed. The empirical evidence suggests that for a country that has experienced moderate inflation rates, like Poland, in a bivariate context, the observed relationship among inflation and productivity seems to be spurious. This implies that there is not a long-run relationship between price level and productivity. However, the inclusion of potential influences on the relationship, such as the monetary policy, reveals the existence of a long-run relationship among the three variables. When we control for potential influences of monetary policy on the bivariate relationship between price level and productivity, the empirical evidence of cointegration, within this multivariate cointegrated system, implies that Granger-causality exists in at least one direction. In such a framework, productivity growth and inflation seem to be the weakly endogenous variables. There are grounds for believing that inflation is harmful to productivity and vice versa in the long run. However, the statistical evidence tends to suggest that there is not a significant feedback in the short-term from inflation to productivity growth and vice versa when we control for monetary policy. In short, the results suggest that for a transition economy, that has experienced moderate inflation rates like Poland, the observed relationship among inflation and productivity appears to be sensitive to inclusion of potential affects of
Koleva, P., Enterprise Restructuring in Transition Economies and its Determinants: The Case of Bulgaria
31
other variables. These findings suggest that without a more concrete theoretical framework, one should be very careful when drawing strong conclusions and policy implications from such an observed relationship. References Aschauer, D.A. and J. Greenwood (1983), “A Further Exploration in the
Theory of Exchange Rate Regimes”, Journal of Political Economy, Vol. 91, pp. 868-875.
Barnerjee, A., J.J. Dolado, and R. Mestre (1998), “ ECM Tests for Cointegration in a Single Equation Framework”, Journal of Time Series Analysis, Vol. 19, No. 3 pp.267-284.
Cameron, N., D. Hum, and W. Simpson (1996), “Stylized Facts and Stylized Illusions: Inflation and Productivity Revisited”, Canadian Journal of Economics, Vol. 29, No. 1, pp.152-162.
Clark K. P. (May 1982), “Inflation and the Productivity Decline”, American Economic Review, Papers and Proceedings, Vol. 72, pp. 149-154.
Cozier, B., and J. Selody (1992), “Inflation and Macroeconomic Performance: Some Cross-Country Evidence”, Bank of Canada, Technical Report, Ottawa.
Christoffersen, P.F., and R.F. Wescott (1999), “Is Poland Ready for Inflation Targeting”, International Monetary Fund, wp/99/41, March.
De Gregorio, J. (1993), “Inflation, Taxation, and Long-run Growth”, Journal of Monetary Economics, Vol. 31, pp. 271-298.
Dickey, D.A., and W.A. Fuller (1979), “Distributions of the Estimators for Autoregressive Time Series with a Unit Root”, Journal of the American Statistical Association, Vol. 74, pp. 427-31.
Dickey, D.A., and W.A. Fuller (1981), “The Likelihood Ratio Statistics for Autoregressive Time Series with a Unit Root”, Econometrica, Vol. 49, pp. 1057-72.
Engle, R.F., and C.W.J. Granger (1987), “Cointegration and Error-Correction: Representation, Estimation and Testing”, Econometrica, Vol. 55, No. 2, pp. 251-276.
Engle, R.F., and B.S. Yoo (1987), “Forecasting and Testing in Cointegrated Systems”, Journal of Econometrics, Vol. 35, pp. 143-159.
Feldstein, M. (1982), “Inflation, Tax Rules and Investment”, Econometrica, Vol. 50, pp. 825-62.
Freeman, D. G. and D. Yerger (1997), “Inflation and Total Factor Productivity in Germany: A Response to Smyth”, Weltwirtschaftliches Archiv, Vol. 133, No. 1, pp. 158-163.

EAST-WEST Journal of ECONOMICS AND BUSINESS
32
Freeman, D. G. and D. Yerger (1998), “Inflation and Multifactor Productivity Growth: A Response to Smyth”, Applied Economics Letters, Vol. 5, pp. 271-274.
Gilson S.C. (1984), “The Inflation-Adjusted Rate of Return on Corporate Debt and Equity: 1966-1980”, No. 39, Bank of Canada, Ottawa.
Granger, C.W.J. (1986), 'Developments in the Study of Cointegrated Economics Variables', Oxford Bulletin of Economics and Statistics, Vol. 48, pp. 213-228.
Granger, C.W.J. (1988), 'Developments in a Concept of Causality', Journal of Econometrics, Vol. 39, pp. 199-211.
Hondroyiannis, G., and E. Papapetrou (1998), “Temporal Causality and the Inflation-Productivity Relationship: Evidence from Eight Low Inflation OECD Countries”, International Review of Economics and Finance, Vol.7, No.1, pp.117-135.
Hondroyiannis, G., and E. Papapetrou (2000), “Do Demographic Changes Affect Fiscal Developments”, Public Finance Review, Vol.28, No.5, pp. 468-488.
Jarrett J.P., and J.G. Selody (1982), “The Productivity-Inflation Nexus in Canada”, The Review of Economics and Statistics, Vol. 64, No. 3, pp. 361-367.
Johansen, S. (1988), “Statistical and Hypothesis Testing of Cointegration Vectors”, Journal of Economic Dynamics and Control, Vol. 12, pp. 231-254.
Johansen, S., and K. Juselius (1990), “Maximum Likelihood Estimation and Inference on Cointegration - with Applications to the Demand for Money”, Oxford Bulletin of Economics, Vol. 52, pp. 169-210.
Johansen, S. and K. Juselius (1992), “Testing Structural Hypotheses in a Multivariate Cointegration Analysis at the Purchasing Power Parity and the Uncovered Interest Parity for the UK”, Journal of Econometrics, Vol. 53, No. 1-3, pp. 211-244.
Kremers, J.J.M., N.R. Ericson, and J. J. Dolado (1992), “The Power of Cointegration Tests”, Oxford Bulletin of Economics and Statistics, Vol. 54, pp.325-348.
Krzak, M. (1996), “Persistent Moderate Inflation in Poland and Hungary”, Oesterreichische Nationalbank, Focus on Transition, Vol. 2, pp. 46-66.
Kwiatkowski, D., P. C. B. Phillips, P. Schmidt, and Y. Shin (1992), “Testing the Null Hypothesis of Stationarity Against the Alternative of a Unit Root”, Journal of Econometrics, Vol. 54, pp. 159-78.
OECD, 1998, Poland, OECD Economic Surveys, Paris. OECD, 1999, OECD Economic Outlook, June, pp.110-112.

Koleva, P., Enterprise Restructuring in Transition Economies and its Determinants: The Case of Bulgaria
33
Perron, P. (1988), “Trends and Random Walks in Macroeconomic Time: Series Further Evidence from a New Approach”, Journal of Dynamic and Control, Vol. 12, pp. 297-332.
Perron, P. (1989), “The Great Crash, the Oil Price Shock, and the Unit Root Hypothesis”, Econometrica, Vol. 57, pp. 1361-1401.
Phillips, P.C.B. (1987),”Time Series Regression with a Unit Root”, Econometrica, Vol. 55, pp. 277-346.
Phillips, P.C.B, and B.E. Hansen (1990), “Statistical Inference in Instrumental Variables Regression with I91) Processes”, Review of Economic Studies, Vol. 57, pp. 99-125.
Phillips, P.C.B., and P. Perron (1988), “Testing for a Unit Root in Time Series Regression”, Biometrica, Vol. 75, pp. 335-346.
Pujol, T., and M. Griffiths (1996), “Moderate Inflation in Poland: A Real Story”, International Monetary Fund, wp/96/57, June.
Ram R. (1984), “Causal Ordering Across Inflation and Productivity Growth in the Post-War United States”, The Review of Economics and Statistics, Vol. 64, No. 3, pp. 472-477.
Sbordone, A., and K. Kuttner (1994), “Does Inflation Reduce Productivity?”, Federal Reserve Bank of Chicago, Economic Perspectives, Vol. 18, No. 6, pp. 2-14.
Selody, J. (1990), “The Goal of Price Stability: A Review of the Issues”, Technical Report 54, Bank of Canada, Ottawa.
Smyth, D.J. (1995a), “Inflation and Total Factor Productivity in Germany”, Weltwirtschaftliches Archiv, Vol. 131, No. 2, pp. 403-405.
Smyth, D.J. (1995b), “Inflation and Total Factor Productivity in Germany”, Applied Economics Letters, Vol. 2, pp. 482-3.
Wellisz, S. (1997), “Inflation and Stabilization in Poland, 1990-95”, in Mario I. Blejer and Karko Skreb (eds.), Macroeconomic Stabilization in Transition Economies, Cambridge: Cambridge University Press.

EAST-WEST Journal of ECONOMICS AND BUSINESS
34