the infeasibility of quantifying the reliability of life-critical real-time software
Post on 21-Dec-2015
217 views
TRANSCRIPT

The Infeasibility of Quantifying the Reliability of Life-Critical Real-Time
Software

introduction
-The availability of enormous computing power at a low cost has led to expanded use of digital computers in current applications and their introduction into many new applications.
-Increased performance at a minimal hardware cost.
-Software systems which contain more errors.
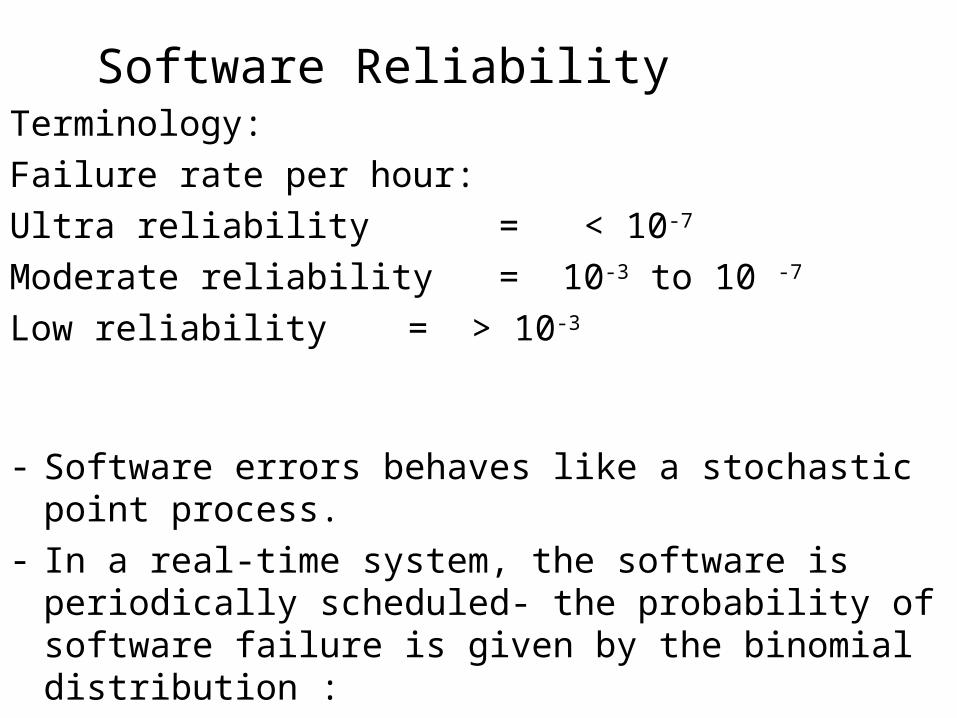
Terminology:
Failure rate per hour:
Ultra reliability = < 10-7
Moderate reliability = 10-3 to 10 -7
Low reliability = > 10-3
- Software errors behaves like a stochastic point process.- In a real-time system, the software is periodically scheduled-
the probability of software failure is given by the binomial distribution :
Software Reliability

p(Sn = k) = pk (1- p)n-k
P(sn > 0) = 1 – (1-p)n = 1 – (1 – p)kt
k – number of inputs per unit time.
To simplify:
P(Sn > n) = 1- e-ktp

Analyzing Software as a Black Box
• 1. Testing with replacement - Dt = y0* (r/n)
• 2. Testing without replacement - Dt = y0*
• Y0 - mean failure time of a test specimen.
• For probability of failure of 10–9 for a 10 hour mission: y0 = 10 / -ln(1- 10–9) 1010
r
j
jn1
1/1

1 1010 hours = 1141550 years
10 109 hours = 114155 years
100 108 hours = 11415 years
1000 106 hours = 114 years
(r = 1) No. of replicates (n) Expected Test Duration Dt

Reliability Growth Models- The software design involves a repetitive cycle of testing and
repairing a program. The result is a sequence of programs :
p1 , …. pn and a sequence of failure times , t1 ,…. tn..
- The goal is the predict the reliability of the pn..
Experiment performed by Nagel and Skrivan:
Program A1:
number of bugs Removed failure probability per input1 0.9803
2 0.1068
3 0.002602
4 0.002104
5 0.001176
6 0.0007659

10 1 .1 .01 .001 .0001 10-5
0 1 2 3 4 5 6 7 Number of bugs removed
Linear Fit To Program A1 Failure Data

Calculation the requirements per input :p = -ln(1- paye) / Kt
Paye = 10-9 for a 10 hour mission , k = 10/sec then:
P = 2.78 * 10-15
Extrapolation to predict when ultra reliability will be reached
1 10-10 10-20
0 5 10 15 20
Number of bugs removed
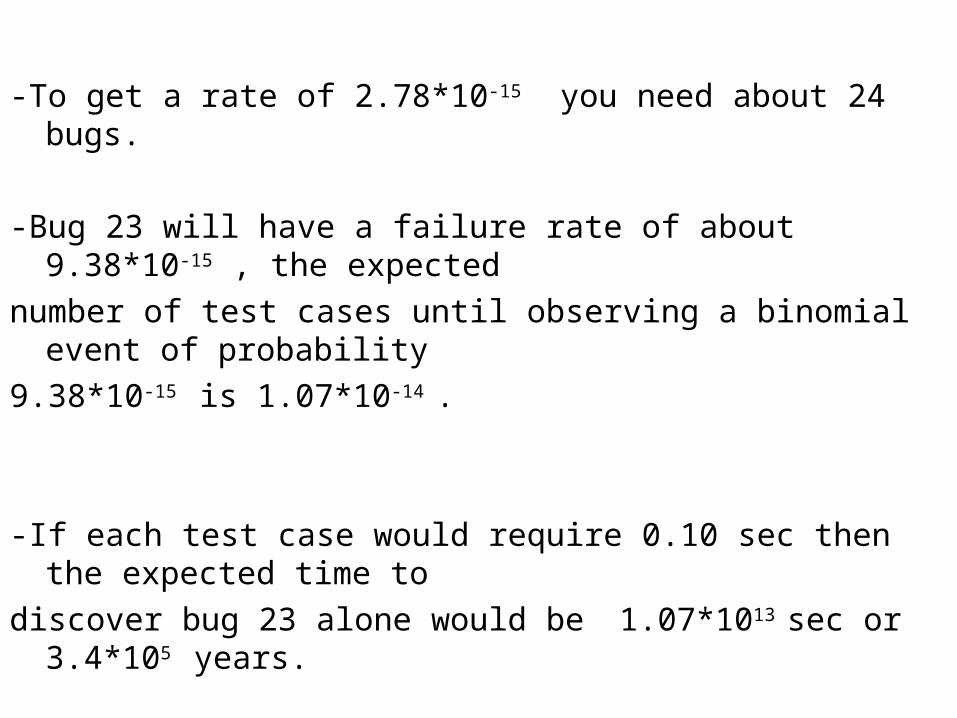
-To get a rate of 2.78*10-15 you need about 24 bugs.
-Bug 23 will have a failure rate of about 9.38*10-15 , the expected
number of test cases until observing a binomial event of probability
9.38*10-15 is 1.07*10-14 .
-If each test case would require 0.10 sec then the expected time to
discover bug 23 alone would be 1.07*1013 sec or 3.4*105 years.

Program slope Last bug Test time
A1 -1.145 23 3.4 *105 years
B1 -1.3358 25 3.3 *105 years
A2 -1.998 17 1.5 *105 years
B2 -3.628 9 4.5 *105 years
A3 -.54526 58 6.8 *105 years
b3 -1.3138 25 5.3 *105 years
Results for 5 different programs:

Low Sample Rate Systems and Accelerated Testing
R = test time per input
1/p = number of inputs until the next bug appearsDt = R/p
Therefore Dt = RKt / -ln(1 - paye).
K = number of inputs per unit time.

K (R = 0.1) Expected Test Time, Dt
10/sec 1.14*106 years
1/sec 1.14*105 years
1/minute 1.9*103 years
1/hour 31.7 years
1/day 1.32 years
1/month 16 days

Reliability Growth Models and Accelerated TestingIf the sample rate is 1 input per minute then the failure rate per input
must be less than 10-9/60 = 1.67*10-11
bug failure rate per input
-The removal of the last bug alone would take approximately 2.2*1010
test cases. Even if the testing process were 60/1000 sec testing would take 42 years
16 1.87*10-10
17 4.55*10-11
18 1.1*10-11

Summary for all the programs:
Test Time To Remove the Last Bug to Obtain Ultra reliability
Program Slope Last bug Test time
A1 -1.41 17 42 years
B1 -1.3358 19 66 years
A2 -1.998 13 31 years
B2 -3.623 7 19 years
A3 -.54526 42 66 years
B3 -1.3138 19 32 years

Models of Software Fault Tolerance
- independence assumption enables quantification in the ultra reliable region
- Quantification of fault-tolerant software reliability is unlikely without the independence assumption
- independence assumption cannot be experimentally justified for ultra reliable region

Ei,k = The event that the I version fails on its k execution.
Pi,k= The probability that version I fails during the k execution.
-The probability that two or more versions fail on the kth execution :
Paye ,k = P( (E1,k ^E2,k) or (E1,k ^E3,k)or (E2,k ^E3,k) or (E1,k ^ E2,k ^E3,k))
= P(E1,k ^E2,k) + P (E1,k ^E3,k)+ P(E2,k ^E3,k) - 2P(E1,k ^ E2,k ^E3,k).
= P(E1,k )P(E2,k ) + P(E1,k )P(E3,k ) + P(E2,k )P(E3,k ) –
2P(E1,k )P(E2,k )P(E3,k )
Paye ,k = 3p2 - 2 p3 3p2
Independence enables quantification of ultra
reliability

Paye (T) = 1- e(-3p^2*KT) 3p2KT
If T = 1 ,k = 3600 (1 execution per second) and P(E1,k ) = 10-6 then we get
Paye (T) = 1.08*10-8

Paye = P(E1 ^E2) + P (E1 ^E3)+ P(E2 ^E3) - 2P(E1 ^ E2 ^E3).
= P(E1 )P(E2 ) + P(E1 )P(E3 )+P(E2 )P(E3 )-2P(E1 )P(E2)P(E3)
+[P(E1 ^ E2 ) - P(E1 )P(E2 )]
+[P(E1 ^ E3 ) - P(E1 )P(E3 )]
+[P(E2 ^ E3 ) - P(E2 )P(E3 )]
-2[P(E1 ^ E2 ^ E3 ) - P(E1 ) P(E2 )P(E3 )]
- P(E1 ^ E2 ^ E3 ) < P(Ei ^ Ej ) therefore P(Ei ^ Ej ) < Paye
Ultra reliable Quantification Is Infeasible Without Independence

Example1:
E1 = E2 = E3 = 10-5
If independent then p(Ei^Ej) = 10-10
-If p(Ei^Ej) = 10-7/hour one could test for a 100 years and not seen even
one coincident error.
Example2:
E1 = E2 = E3 = 10-4
-If p(Ei^Ej) = 10-4 /hour one could test for a one years and not likely see
even one coincident error!!
Danger Of Extrapolation to the Ultra reliability Region
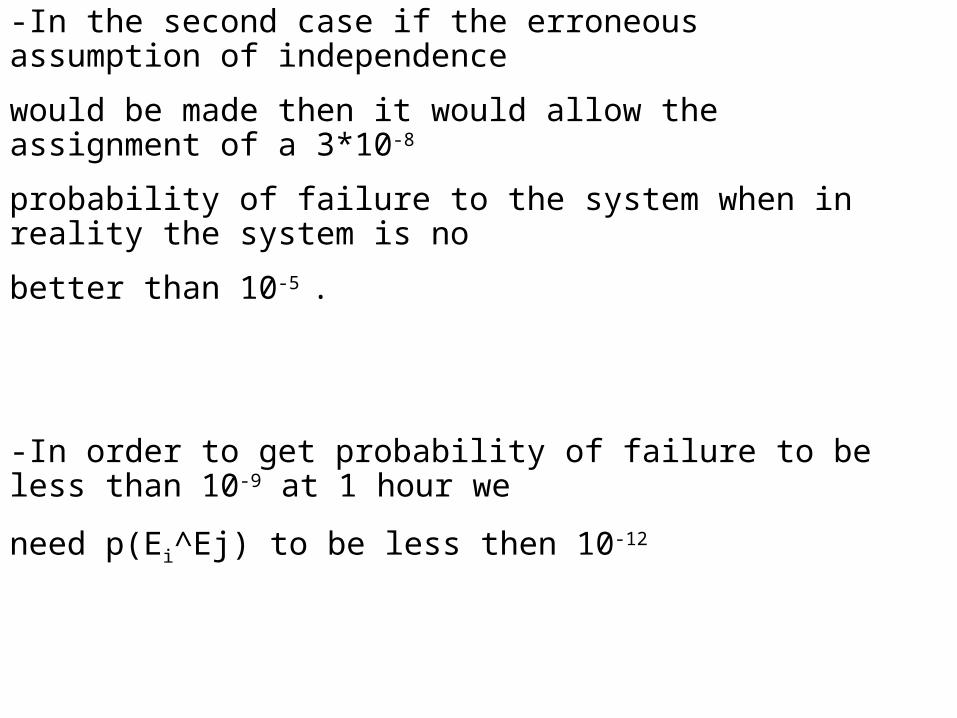
-In the second case if the erroneous assumption of independence
would be made then it would allow the assignment of a 3*10-8
probability of failure to the system when in reality the system is no
better than 10-5 .
-In order to get probability of failure to be less than 10-9 at 1 hour we
need p(Ei^Ej) to be less then 10-12

There are two kinds of models:
1. The model includes terms which cannot be measured within feasible amounts of time.
2. The model includes only parameters which can be measured within feasible amounts of time.
-A general model must provide a mechanism that makes the interaction
terms negligibly small.
- There is little hope of deriving the interaction terms from fundamental
Laws, since the error process occurs in the human mind.
Feasibility of a General Model For Coincident Errors

The Coincident-Error Experiments
Experiment that was performed by Knight and Leveson:
-27 versions of a program were produced and subjected to 1,000,000
input cases.
-The observed average failure rate per input was 0.0007.
-independence model was rejected.
-In order to observe the errors the error rate must be in the low to
moderate reliability region.
Future experiments will have one of the following results :

1. Demonstration that the independence assumption does not hold for the low reliability system
2. Demonstration that the independence assumption does hold from systems for the low reliability system.
3. No coincident errors were seen but the test time was insufficient to demonstrate independence for the potentially ultra reliable system.

Conclusions
• The potential performance advantages of using computers over their analog predecessors have created an atmosphere where serious safety concerns about digital hardware and software are not adequately addressed.
• Practical methods to prevent design errors have not been found.

•Life testing of ultra reliable software is infeasible .
(i.e. to quantify 10-8 /hour failure rate requires more than 108 hours o testing).
•The assumption of independence is not reasonable for software and can not be tested for software or for hardware in the ultra reliable region.
•It is possible that models which are inferior to other models in the moderate region are superior in the ultra reliable region – but this cannot be demonstrated.