the indodairy smallholder household survey from farm-to-fact · the four districts: bogor, cianjur,...
TRANSCRIPT

The Centre for Global Food and Resources
The IndoDairy Smallholder Household Survey
From Farm-to-Fact
Factsheet 7: Dairy Farming Costs, Revenue and Profitability
Background
This factsheet builds on the information summarised in Factsheets 3 and 4 of the IndoDairy Smallholder Household Survey (ISHS) ‘Farm-to-Fact’ series by assessing dairy-related costs, revenue and profitability across the four districts: Bogor, Cianjur, Bandung and Garut.
In addition, the 600 households are categorised into quartiles based on their profitability, which
allows us to identify characteristics of more versus less profitable dairy farmers.
Benchmarking
The benchmarking tool behind the categorisation and calculation of cost, revenue and profit is based on a model used in the Australian dairy industry, developed by the project collaborator, Subtropical Dairy.
Profitability is calculated using the following formula:
Profit/cow/year = Total milk revenue - (Variable costs + Overheads + Other business costs)
No. of lactating cows
Where:
Total milk revenue: fresh milk sales (net milk delivery costs), processed milk sales (e.g. yoghurt) and the value of milk consumed by household members and calves.
Variable costs: Forage costs, concentrate and supplement costs, feed delivery costs, health products and veterinary fees, artificial insemination costs and water costs.
Overheads: Employed labour costs, taxes, electricity costs, cooperative membership, recorder fees and other memberships.
Other business costs: Land rent and interest on loans.
Note: All revenue and costs were calculated per annum in IDR.
2
Financial comparison by district
Production costs
One of the key objectives of the ISHS is to improve the understanding of input costs and overheads related to dairy production.
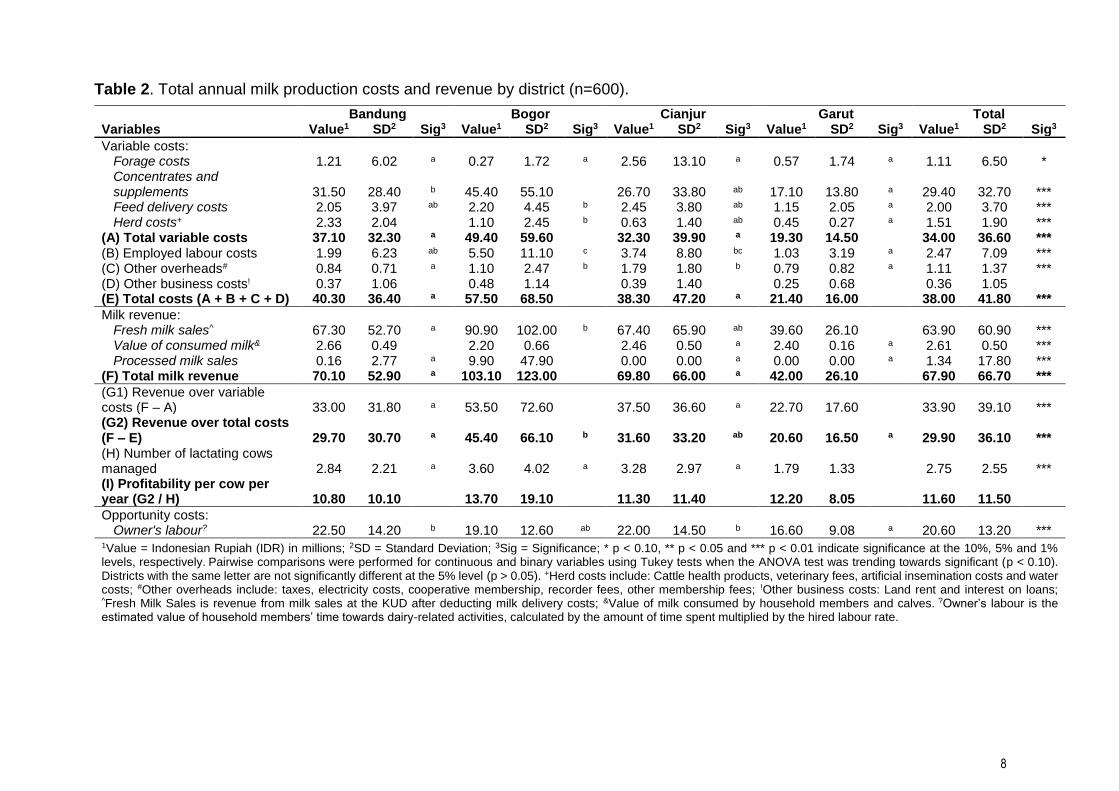
In order to identify the level of current outlay at which the farmers are operating we asked the farmers to identify operational expenses incurred on the farm for management of the dairy farm operation, maintaining herd health and nutrition. In addition, farmers were asked about a range of farm management costs, including taxes, interest on loans and hired labour. The results are shown in Table 2.
Annual production costs
The major variable costs for the dairy farmers relate to the purchase of forage, concentrates and supplements, feed delivery costs and herd costs (e.g. veterinary and herd health, water costs) related with maintaining the herd on the farm.
On average, across the four districts, total variable costs are 34 million IDR (USD $2,351) per annum and total farm cost is 38 million IDR (USD $2,628).
Concentrates and supplements account for the largest share of costs, making up approximately 75% of total costs. On average, these costs sum to 29.4 million IDR, (approx. USD $2,000) annually.
There is significant variation between the districts, with households in Bogor spending more than twice as much in concentrates as compared to households in Garut.
Multiple factors could be affecting this, such as farm size, which is higher in Bogor; and arrangements in place with the corresponding dairy cooperatives, which are a major source of inputs for farmers.
Other major costs related to dairy farming are hired labour (2.5 million IDR or USD $171 per annum), feed delivery costs (2 million IDR or USD $138 per annum), and herd costs (1.5 million IDR or USD $104 per annum).
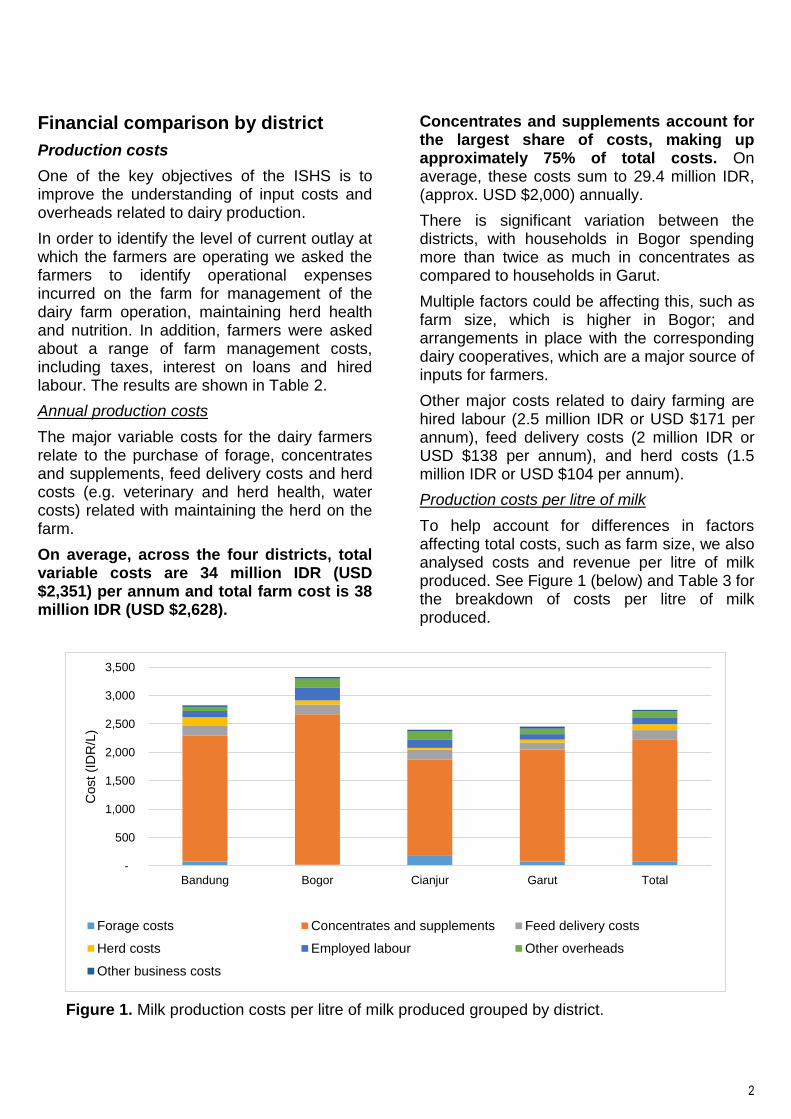
Production costs per litre of milk
To help account for differences in factors affecting total costs, such as farm size, we also analysed costs and revenue per litre of milk produced. See Figure 1 (below) and Table 3 for the breakdown of costs per litre of milk produced.
-
500
1,000
1,500
2,000
2,500
3,000
3,500
Bandung Bogor Cianjur Garut Total
Cost (I
DR
/L)
Forage costs Concentrates and supplements Feed delivery costs
Herd costs Employed labour Other overheads
Other business costs
Figure 1. Milk production costs per litre of milk produced grouped by district.

3
The overall high costs of concentrates and supplements (2,150 IDR/L, or USD $0.14/L) is also reflected in these figures. While farmers in Bogor pay the highest rate for concentrates, we see in the sections below, that these farmers are also receiving higher revenue from milk sales.
The total cost incurred by dairy farmers for producing a litre of milk is 2,750 IDR (USD $0.19/L).
Family labour
The time contributed to dairy-related activities by family members is a significant opportunity cost for the household and is estimated to be an additional in-kind 20.6 million IDR (USD $1,425) per annum (see Table 2).
Farmers in Bandung and Cianjur have the highest in-kind contribution in labour with 22.5 and 22 million IDR (USD $1,556 and $1,521) per annum, respectively.
The value of time contributed by family members to producing a litre of milk is shown in Table 3. On average, family labour equates to approximately to 2,160 IDR per litre (USD $0.15/L).
When compared to total cash costs, dairy household members’ contribute almost the same value as in-kind time. This is especially true in Bandung (as seen in Figure 2).
A later factsheet will look at specific details regarding both family and hired labour; however, a major activity is harvesting and
collecting grasses. This also explains the low cash cost of forages in Figure 1 (above).
Revenue from milk production
Annual revenue
The average revenue derived from the fresh milk sales (minus cost of delivering the milk) is 63.9 million IDR (USD $4,419) per annum (see Table 2).
The revenue derived from fresh milk sales is highest in Bogor district (90.90 million IDR or USD $6,287) as compared to the other districts. Farmers in the Garut district have the lowest revenue on average, with less than half that of Bogor farmers (42.0 million IDR or USD $2,905 per annum).
Other aspects of dairy operations considered while calculating the total farm revenue are the value of milk consumed and fed to calves (2.61 million IDR or USD $181) and sales from processed milk (1.34 million IDR or USD $93).
Bogor district farmers also have the highest revenue from processed milk sales (9.90 million IDR), which is negligible for the other three districts.
The average total revenue from milk production across the four districts is 67.90 million IDR (USD $4,695) per annum.
Revenue per litre of milk produced
Figure 3 shows value per litre based on the three categories of revenue across the districts. On average, the revenue derived from the sale
Figure 2. Cost of family labour, compared to total cash costs, per litre of milk produced.
-
500
1,000
1,500
2,000
2,500
3,000
3,500
Bandung Bogor Cianjur Garut Total
Cost (I
DR
/L)
Family labour Total costs
-
1,000
2,000
3,000
4,000
5,000
6,000
Bandung Bogor Cianjur Garut Total
Revenue (
IDR
/L)
Fresh milk Consumed milk Processed milk
Figure 3. Revenue per litre of milk produced.
4
of one litre of fresh milk (minus delivery costs) is 4,390 IDR (USD $0.30), as shown in Table 3.
When including the value of processed milk sales and consumed milk, the total revenue from a litre of milk produced is 4,760 IDR (USD $0.33).
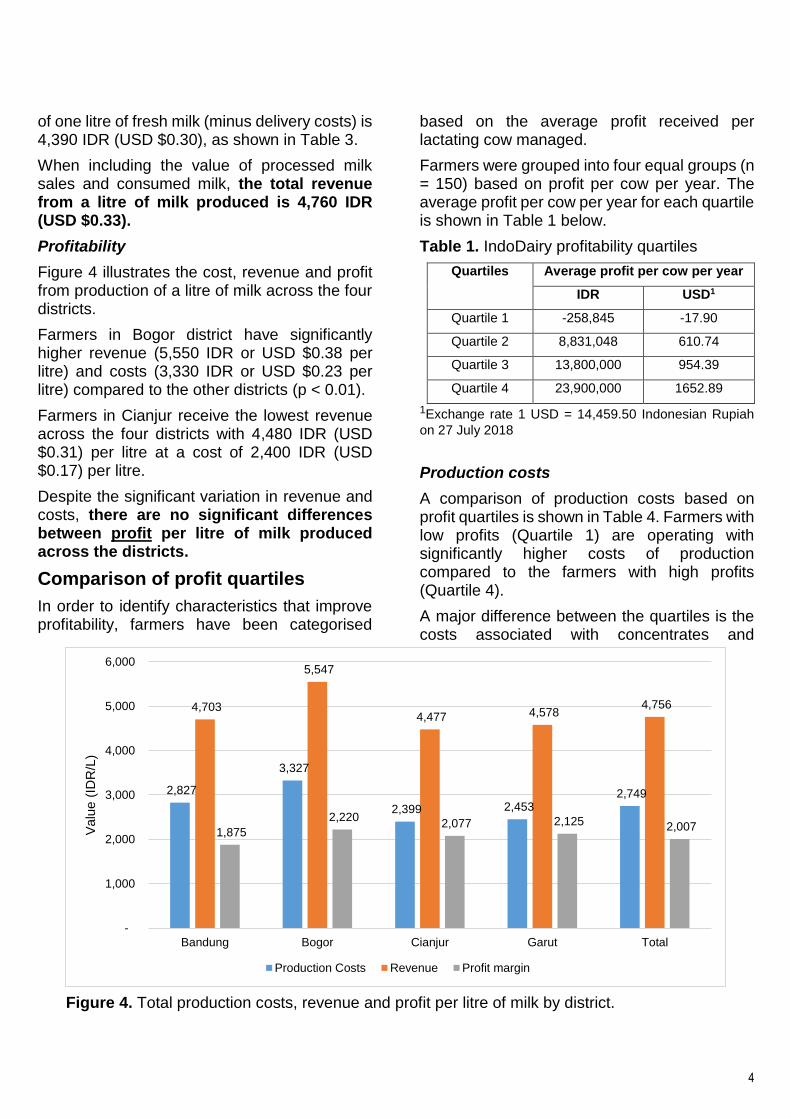
Profitability
Figure 4 illustrates the cost, revenue and profit from production of a litre of milk across the four districts.
Farmers in Bogor district have significantly higher revenue (5,550 IDR or USD $0.38 per litre) and costs (3,330 IDR or USD $0.23 per litre) compared to the other districts (p < 0.01).
Farmers in Cianjur receive the lowest revenue across the four districts with 4,480 IDR (USD $0.31) per litre at a cost of 2,400 IDR (USD $0.17) per litre.
Despite the significant variation in revenue and costs, there are no significant differences between profit per litre of milk produced across the districts.
Comparison of profit quartiles
In order to identify characteristics that improve profitability, farmers have been categorised
based on the average profit received per lactating cow managed.
Farmers were grouped into four equal groups (n = 150) based on profit per cow per year. The average profit per cow per year for each quartile is shown in Table 1 below.
Table 1. IndoDairy profitability quartiles
Quartiles Average profit per cow per year
IDR USD1
Quartile 1 -258,845 -17.90
Quartile 2 8,831,048 610.74
Quartile 3 13,800,000 954.39
Quartile 4 23,900,000 1652.89
1Exchange rate 1 USD = 14,459.50 Indonesian Rupiah
on 27 July 2018
Production costs
A comparison of production costs based on profit quartiles is shown in Table 4. Farmers with low profits (Quartile 1) are operating with significantly higher costs of production compared to the farmers with high profits (Quartile 4).
A major difference between the quartiles is the costs associated with concentrates and
Figure 4. Total production costs, revenue and profit per litre of milk by district.
2,827
3,327
2,399 2,453 2,749
4,703
5,547
4,477 4,578 4,756
1,875
2,220 2,077 2,125 2,007
-
1,000
2,000
3,000
4,000
5,000
6,000
Bandung Bogor Cianjur Garut Total
Valu
e (
IDR
/L)
Production Costs Revenue Profit margin

5
supplements with the Quartile 1 (Q1) farmers (38.60 million IDR or USD $2,670 per annum) spending, on average, twice as a much as farmers in Quartile 4 (Q4) (19.20 million IDR or USD $1,328 per annum).
A similar pattern is observed with other costs such as forages, employed labour, herd costs and other business costs (e.g. interest on loans and land rent) with farmers in Q1 spending more compared to farmers in Q4.
This is also reflected on the costs and expenses incurred by farmers on the production of milk per litre as shown in Table 5.
Dairy farmers in Q1 have significantly higher costs per litre of milk; three times more than Q4 farmers.
Revenue
The average annual revenue derived from dairy production per annum for each of the profit quartile is shown in Table 4.
The total revenue derived from milk production by Q1 was 54.80 million IDR (USD $3,790) per annum and 75.80 million IDR (USD $5,242) for Q4. This means, on average, Q4 generate 21
million IDR (USD $1,452) more than Q1 per annum, which is approximately 38% more.
When this data is observed on a per-litre-of-milk basis, as shown in Table 5, total revenue for Q1 is 4,740 IDR (USD $0.33) and Q4 is 4,980 IDR (USD $0.34) per litre.
Profit
While farmers in Q4 have significantly higher revenue compared to the other quartiles, the magnitude of difference is considerably smaller compared to the difference in production costs between quartiles. To illustrate this point, production costs and profit per litre of milk produced is presented by quartiles in Figure 5 below.
The area represented by the dark blue in Figure 5 is profit received per litre of milk produced. The total height of each column represents total revenue per litre of milk produced.
Total revenue received per litre of milk produced increases by 244.4 IDR (USD $0.01) between Q1 and Q4, while production costs drastically drop by 3,121 IDR (USD $0.22).
Figure 5. Comparison between profit quartiles of production costs, profits and family labour per litre of milk produced. The total height of each column represents total milk revenue, while the dark blue section represents profits. The black line represents the value of family labour.
-
1,000
2,000
3,000
4,000
5,000
6,000
Quartile 1 Quartile 2 Quartile 3 Quartile 4
Valu
e (
IDR
/L)
Forage costs Concentrates and supplements Feed delivery costs
Herd costs Employed labour Other overheads
Other business costs Profit Family labour

6
Family labour
The contribution of family labour is also represented in Figure 5 (shown by the black line) as an estimated cost per litre of milk.
Overall, Q4 are spending significantly less time and still gaining substantially higher returns for their efforts.
Profit distribution by district
A summary of districts by profit quartile is shown in Figure 6 and Table 6. There is significant differences between proportions of farmers in each quartile across the four districts.
In Bogor, we see a greater proportion of farmers in Q1 and Q4, while fewer in Q2 and Q3. This indicates that more farmers are towards the extreme ends of profitability, rather than middle range.
Garut has fewer farmers in Q1 (least profitable) and slightly more in Q2. Cianjur has slightly
fewer farmers in Q4 (most profitable) and more in Q2.
Conclusions
This factsheet illustrates that profitability is largely determined by reducing overall costs, not higher revenues. Therefore, categorising the farmers in these profit quartiles have allowed us to identify a set of farmers that are able to achieve higher profits with efficient management and control of costs.
In order to determine other drivers of profitability within the IndoDairy Smallholder Household Survey (ISHS), the subsequent factsheets will assess differences between quartiles of farming characteristics, including: socio-demographic, farm and cattle characteristics, management practices and technology adoption.
Figure 6. Distribution of profit quartiles by district.
26%
38%
25%
16%
25%
24%
11%
30%
32%
25%
27%
18%
25%
26%
25%
24%
34%
20%
26%
25%
0% 10% 20% 30% 40% 50% 60% 70% 80% 90% 100%
Bandung
Bogor
Cianjur
Garut
Total
Quartile 1 Quartile 2 Quartile 3 Quartile 4
7
Appendix to Factsheet 5
This appendix lists details milk production costs, revenue and profits as an annual and per litre value. These are disaggregated by districts (Table 2-3) and profit quartiles (Table 4-5).
Statistical significance between districts and profit quartiles were determined using ANOVA (for binary and continuous variables) and Pearson’s Chi-squared test (for categorical variables). For categorical variables with small observations (n < 5), Fisher’s exact test was used to confirm the Chi-squared test. ANOVA and Chi-squared tests results are shown in the right-hand column, under the Total. Pairwise comparisons were performed for continuous and binary variables using Tukey tests when the ANOVA test was trending towards significant (p < 0.10). Districts and profit quartiles with the same letter are not significantly different at the 5% level (p > 0.05).
8
Table 2. Total annual milk production costs and revenue by district (n=600).
Bandung Bogor Cianjur Garut Total Variables Value1 SD2 Sig3 Value1 SD2 Sig3 Value1 SD2 Sig3 Value1 SD2 Sig3 Value1 SD2 Sig3
Variable costs: Forage costs 1.21 6.02 a 0.27 1.72 a 2.56 13.10 a 0.57 1.74 a 1.11 6.50 * Concentrates and supplements 31.50 28.40 b 45.40 55.10 26.70 33.80 ab 17.10 13.80 a 29.40 32.70 *** Feed delivery costs 2.05 3.97 ab 2.20 4.45 b 2.45 3.80 ab 1.15 2.05 a 2.00 3.70 *** Herd costs+ 2.33 2.04 1.10 2.45 b 0.63 1.40 ab 0.45 0.27 a 1.51 1.90 ***
(A) Total variable costs 37.10 32.30 a 49.40 59.60 32.30 39.90 a 19.30 14.50 34.00 36.60 *** (B) Employed labour costs 1.99 6.23 ab 5.50 11.10 c 3.74 8.80 bc 1.03 3.19 a 2.47 7.09 *** (C) Other overheads# 0.84 0.71 a 1.10 2.47 b 1.79 1.80 b 0.79 0.82 a 1.11 1.37 *** (D) Other business costs! 0.37 1.06 0.48 1.14 0.39 1.40 0.25 0.68 0.36 1.05 (E) Total costs (A + B + C + D) 40.30 36.40 a 57.50 68.50 38.30 47.20 a 21.40 16.00 38.00 41.80 ***
Milk revenue: Fresh milk sales^ 67.30 52.70 a 90.90 102.00 b 67.40 65.90 ab 39.60 26.10 63.90 60.90 *** Value of consumed milk& 2.66 0.49 2.20 0.66 2.46 0.50 a 2.40 0.16 a 2.61 0.50 *** Processed milk sales 0.16 2.77 a 9.90 47.90 0.00 0.00 a 0.00 0.00 a 1.34 17.80 ***
(F) Total milk revenue 70.10 52.90 a 103.10 123.00 69.80 66.00 a 42.00 26.10 67.90 66.70 ***
(G1) Revenue over variable costs (F – A) 33.00 31.80 a 53.50 72.60 37.50 36.60 a 22.70 17.60 33.90 39.10 *** (G2) Revenue over total costs (F – E) 29.70 30.70 a 45.40 66.10 b 31.60 33.20 ab 20.60 16.50 a 29.90 36.10 *** (H) Number of lactating cows managed 2.84 2.21 a 3.60 4.02 a 3.28 2.97 a 1.79 1.33 2.75 2.55 *** (I) Profitability per cow per year (G2 / H) 10.80 10.10 13.70 19.10 11.30 11.40 12.20 8.05 11.60 11.50
Opportunity costs: Owner's labour? 22.50 14.20 b 19.10 12.60 ab 22.00 14.50 b 16.60 9.08 a 20.60 13.20 ***
1Value = Indonesian Rupiah (IDR) in millions; 2SD = Standard Deviation; 3Sig = Significance; * p < 0.10, ** p < 0.05 and *** p < 0.01 indicate significance at the 10%, 5% and 1% levels, respectively. Pairwise comparisons were performed for continuous and binary variables using Tukey tests when the ANOVA test was trending towards significant (p < 0.10). Districts with the same letter are not significantly different at the 5% level (p > 0.05). +Herd costs include: Cattle health products, veterinary fees, artificial insemination costs and water costs; #Other overheads include: taxes, electricity costs, cooperative membership, recorder fees, other membership fees; !Other business costs: Land rent and interest on loans; ^Fresh Milk Sales is revenue from milk sales at the KUD after deducting milk delivery costs; &Value of milk consumed by household members and calves. ?Owner’s labour is the estimated value of household members’ time towards dairy-related activities, calculated by the amount of time spent multiplied by the hired labour rate.

9
Table 3. Production costs and revenue per litre of milk produced by district (n = 600).
Bandung Bogor Cianjur Garut Total Variable Value1 SD2 Sig3 Value1 SD2 Sig3 Value1 SD2 Sig3 Value1 SD2 Sig3 Value1 SD2 Sig3
Variable costs:
Forage costs 0.08 0.39 0.02 0.11 0.18 0.76 0.08 0.27 0.08 0.42 Concentrates and supplements 2.22 1.56 bc 2.65 1.38 c 1.69 1.42 a 1.97 1.18 ab 2.15 1.46 ***
Feed delivery costs 0.17 0.32 0.17 0.20 0.18 0.24 0.13 0.23 0.16 0.28 Herd costs+ 0.15 0.06 0.07 0.09 0.03 0.04 a 0.05 0.02 a 0.10 0.08 ***
Total variable costs 2.62 1.64 bc 2.92 1.50 c 2.08 1.63 a 2.23 1.28 ab 2.50 1.56 ***
Employed labour costs 0.11 0.36 a 0.22 0.47 a 0.14 0.30 a 0.10 0.28 a 0.12 0.35 *
Other overheads# 0.07 0.07 a 0.16 0.18 b 0.16 0.16 b 0.10 0.10 a 0.10 0.12 ***
Other business costs! 0.02 0.06 0.03 0.06 0.02 0.05 0.03 0.10 0.03 0.07 Total costs 2.83 1.73 ab 3.33 1.63 b 2.40 1.70 a 2.45 1.35 a 2.75 1.65 ***
Milk revenue:
Fresh milk sales^ 4.43 0.29 4.75 0.58 4.18 0.59 a 4.24 0.25 a 4.39 0.42 ***
Value of consumed milk& 0.27 0.19 a 0.32 0.29 ab 0.30 0.39 ab 0.34 0.16 b 0.30 0.24 ** Processed milk sales 0.01 0.12 a 0.47 2.53 0.00 0.00 a 0.00 0.00 a 0.07 0.94 ***
Total milk revenue 4.70 0.32 a 5.55 2.55 4.48 0.69 a 4.58 0.30 a 4.76 1.05 ***
Revenue over variable costs 2.08 1.62 a 2.63 2.83 a 2.40 1.69 a 2.35 1.25 a 2.26 1.77 *
Revenue over total costs 1.88 1.71 2.22 2.93 2.08 1.77 2.13 1.31 2.01 1.85 Opportunity costs:
Owner's labour? 2.07 1.62 2.01 1.75 2.45 2.57 2.28 1.66 2.16 1.80 1Value = Indonesian Rupiah (IDR) in thousands; 2SD = Standard Deviation; 3Sig = Significance; * p < 0.10, ** p < 0.05 and *** p < 0.01 indicate significance at the 10%, 5% and 1% levels, respectively. Pairwise comparisons were performed for continuous and binary variables using Tukey tests when the ANOVA test was trending towards significant (p < 0.10). Districts with the same letter are not significantly different at the 5% level (p > 0.05). +Herd costs include: Cattle health products, veterinary fees, artificial insemination costs and water costs; #Other overheads include: taxes, electricity costs, cooperative membership, recorder fees, other membership fees; !Other business costs: Land rent and interest on loans; ^Fresh Milk Sales is revenue from milk sales at the KUD after deducting milk delivery costs; &Value of milk consumed by household members and calves. ?Owner’s labour is the estimated value of household members’ time towards dairy-related activities, calculated by the amount of time spent multiplied by the hired labour rate.

10
Table 4. Total annual farm milk production costs and revenue by profit quartile, where farmers in the Quartile 1 are the least
profitable per cow per year and farmers in Quartile 4 are the most profitable (n = 600).
Quartile 1 Quartile 2 Quartile 3 Quartile 4 Total Variables Value1 SD2 Sig3 Value1 SD2 Sig3 Value1 SD2 Sig3 Value1 SD2 Sig3 Value1 SD2 Sig3
Variable costs: Forage costs 2.07 8.20 0.69 3.00 0.58 2.98 1.11 9.14 1.11 6.50 Concentrates and supplements 38.60 31.10 b 34.70 41.70 b 24.90 31.30 a 19.20 19.50 a 29.40 32.70 *** Feed delivery costs 3.19 5.69 1.72 3.13 a 1.54 2.42 a 1.53 2.23 a 2.00 3.70 *** Herd costs+ 1.39 1.62 1.65 2.28 1.53 2.03 1.47 1.90 1.51 1.97
(A) Total variable costs 45.30 36.70 c 38.80 44.80 bc 28.60 34.40 ab 23.30 23.50 a 34.00 36.60 *** (B) Employed labour costs 4.54 9.37 b 2.71 7.62 ab 1.08 3.66 a 1.55 5.97 a 2.47 7.09 *** (C) Other overheads# 1.34 1.24 b 1.18 1.54 ab 0.86 0.88 a 1.05 1.66 ab 1.11 1.37 ** (D) Other business costs! 0.99 1.68 b 0.30 0.70 ab 0.31 0.86 ab 0.24 0.59 a 0.36 1.05 ** (E) Total costs (A + B + C + D) 51.80 43.60 b 43.00 51.00 b 30.90 36.70 a 26.20 28.00 a 38.00 41.80 ***
Milk revenue: Fresh milk sales^ 52.20 48.40 a 67.80 68.70 a 65.70 66.50 a 70.00 57.10 a 63.90 60.90 ** Value of consumed milk& 15.10 24.00 15.80 36.20 15.90 57.60 13.60 27.30 15.10 38.50 Processed milk sales 0.08 0.97 2.16 26.50 0.12 1.46 3.03 23.70 1.34 17.80
(F) Total milk revenue 54.80 48.50 a 72.50 83.40 ab 68.40 67.30 ab 75.80 61.70 b 67.90 66.70 **
(G1) Revenue over variable costs (F – A) 9.52 21.60 33.70 40.40 a 39.70 35.00 a 52.40 43.00 33.90 39.10 *** (G2) Revenue over total costs (F – E) 3.04 18.50 29.50 33.90 a 37.50 32.50 a 49.60 39.10 29.90 36.10 *** (H) Number of lactating cows managed 2.87 2.51 ab 3.29 3.39 b 2.71 2.25 ab 2.14 1.59 a 2.75 2.55 *** (I) Profitability per cow per year (G2 / H) -0.26 7.88 8.83 1.35 13.80 1.42 23.90 12.60 11.60 11.50
***
Opportunity costs: Owner's labour? 20.70 14.90 20.80 12.40 22.40 13.40 18.60 11.80 20.60 13.20
1Value = Indonesian Rupiah (IDR) in millions; 2SD = Standard Deviation; 3Sig = Significance; * p < 0.10, ** p < 0.05 and *** p < 0.01 indicate significance at the 10%, 5% and 1% levels, respectively. Pairwise comparisons were performed for continuous and binary variables using Tukey tests when the ANOVA test was trending towards significant (p < 0.10). Quartiles with the same letter are not significantly different at the 5% level (p > 0.05). +Herd costs include: Cattle health products, veterinary fees, artificial insemination costs and water costs; #Other overheads include: taxes, electricity costs, cooperative membership, recorder fees, other membership fees; !Other business costs: Land rent and interest on loans; ^Fresh Milk Sales is revenue from milk sales at the KUD after deducting milk delivery costs; &Value of milk consumed by household members and calves. ?Owner’s labour is the estimated value of household members’ time towards dairy-related activities, calculated by the amount of time spent multiplied by the hired labour rate.
11
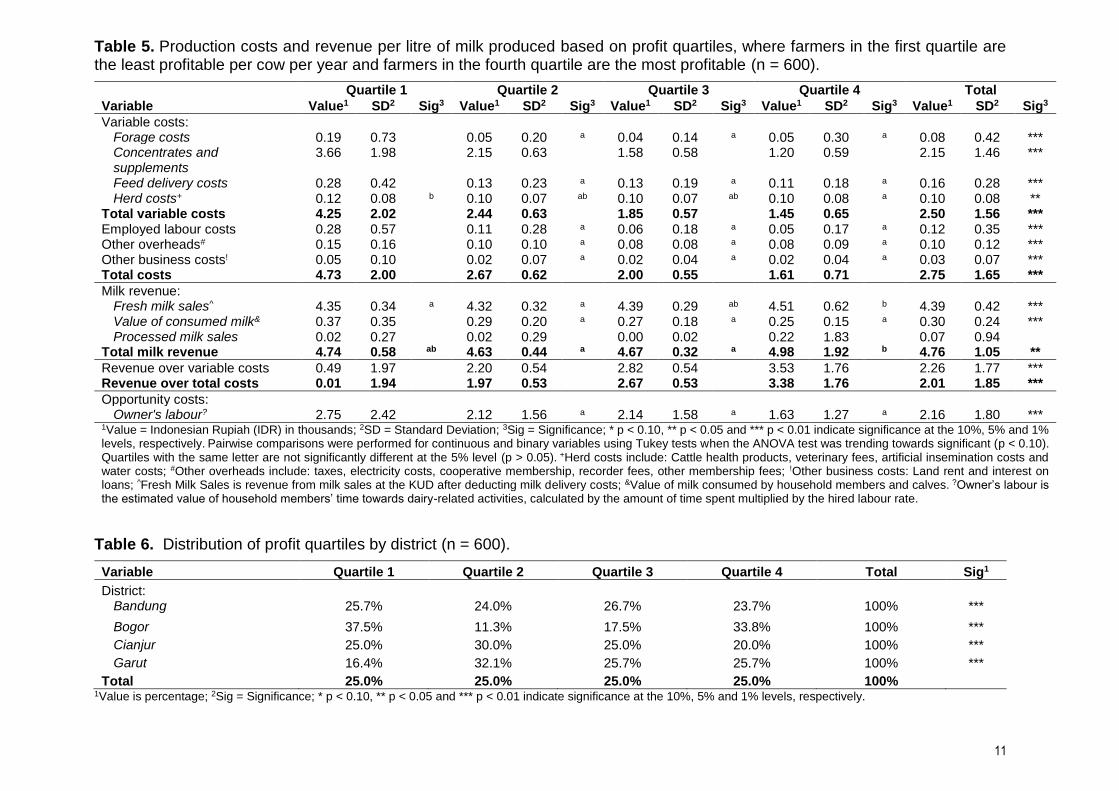
Table 5. Production costs and revenue per litre of milk produced based on profit quartiles, where farmers in the first quartile are the least profitable per cow per year and farmers in the fourth quartile are the most profitable (n = 600).
Quartile 1 Quartile 2 Quartile 3 Quartile 4 Total
Variable Value1 SD2 Sig3 Value1 SD2 Sig3 Value1 SD2 Sig3 Value1 SD2 Sig3 Value1 SD2 Sig3
Variable costs: Forage costs 0.19 0.73
0.05 0.20 a 0.04 0.14 a 0.05 0.30 a 0.08 0.42 *** Concentrates and supplements
3.66 1.98
2.15 0.63
1.58 0.58
1.20 0.59
2.15 1.46 ***
Feed delivery costs 0.28 0.42
0.13 0.23 a 0.13 0.19 a 0.11 0.18 a 0.16 0.28 *** Herd costs+ 0.12 0.08 b 0.10 0.07 ab 0.10 0.07 ab 0.10 0.08 a 0.10 0.08 **
Total variable costs 4.25 2.02 2.44 0.63 1.85 0.57 1.45 0.65 2.50 1.56 *** Employed labour costs 0.28 0.57
0.11 0.28 a 0.06 0.18 a 0.05 0.17 a 0.12 0.35 *** Other overheads# 0.15 0.16
0.10 0.10 a 0.08 0.08 a 0.08 0.09 a 0.10 0.12 *** Other business costs! 0.05 0.10
0.02 0.07 a 0.02 0.04 a 0.02 0.04 a 0.03 0.07 *** Total costs 4.73 2.00
2.67 0.62
2.00 0.55
1.61 0.71
2.75 1.65 ***
Milk revenue: Fresh milk sales^ 4.35 0.34 a 4.32 0.32 a 4.39 0.29 ab 4.51 0.62 b 4.39 0.42 *** Value of consumed milk& 0.37 0.35
0.29 0.20 a 0.27 0.18 a 0.25 0.15 a 0.30 0.24 *** Processed milk sales 0.02 0.27
0.02 0.29
0.00 0.02
0.22 1.83
0.07 0.94
Total milk revenue 4.74 0.58 ab 4.63 0.44 a 4.67 0.32 a 4.98 1.92 b 4.76 1.05 **
Revenue over variable costs 0.49 1.97
2.20 0.54
2.82 0.54
3.53 1.76
2.26 1.77 *** Revenue over total costs 0.01 1.94
1.97 0.53
2.67 0.53
3.38 1.76
2.01 1.85 ***
Opportunity costs: Owner's labour? 2.75 2.42 2.12 1.56 a 2.14 1.58 a 1.63 1.27 a 2.16 1.80 ***
1Value = Indonesian Rupiah (IDR) in thousands; 2SD = Standard Deviation; 3Sig = Significance; * p < 0.10, ** p < 0.05 and *** p < 0.01 indicate significance at the 10%, 5% and 1% levels, respectively. Pairwise comparisons were performed for continuous and binary variables using Tukey tests when the ANOVA test was trending towards significant (p < 0.10). Quartiles with the same letter are not significantly different at the 5% level (p > 0.05). +Herd costs include: Cattle health products, veterinary fees, artificial insemination costs and water costs; #Other overheads include: taxes, electricity costs, cooperative membership, recorder fees, other membership fees; !Other business costs: Land rent and interest on loans; ^Fresh Milk Sales is revenue from milk sales at the KUD after deducting milk delivery costs; &Value of milk consumed by household members and calves. ?Owner’s labour is the estimated value of household members’ time towards dairy-related activities, calculated by the amount of time spent multiplied by the hired labour rate.
Table 6. Distribution of profit quartiles by district (n = 600).
Variable Quartile 1 Quartile 2 Quartile 3 Quartile 4 Total Sig1
District: Bandung 25.7% 24.0% 26.7% 23.7% 100% ***
Bogor 37.5% 11.3% 17.5% 33.8% 100% ***
Cianjur 25.0% 30.0% 25.0% 20.0% 100% ***
Garut 16.4% 32.1% 25.7% 25.7% 100% ***
Total 25.0% 25.0% 25.0% 25.0% 100% 1Value is percentage; 2Sig = Significance; * p < 0.10, ** p < 0.05 and *** p < 0.01 indicate significance at the 10%, 5% and 1% levels, respectively.