the indiana prevention resource center by monitoring the future (mtf) (miech, ... and 113 did so....
TRANSCRIPT


THE INDIANA PREVENTION RESOURCE CENTER2016 PREVALENCE STATISTICS
MAIN FINDINGS
INDIANA YOUTH SURVEY(Formerly known as Alcohol, Tobacco and Other Drug Use by Indiana Children and Adolescents)
Survey Conducted January through April 2016Report Dated June 2016
Conducted and published by:Indiana Prevention Resource Center
Department of Applied Health ScienceSchool of Public Health-BloomingtonIndiana University
Contact:Indiana Prevention Resource Center501 North Morton Street Suite 110Bloomington, IN 47404
http://[email protected] Free: 1-800-346-3077 Fax: 812-855-4940
Funded, in part by a contract with theIndiana Family and Social Services AdministrationDivision of Mental Health and Addiction
Source Citation: Gassman, R., Jun, M., Samuel, S., Agley, J. D., King, R., Ables, E., Lee, J., & Wolf, J. (2016). Indiana Youth Survey – 2016. Bloomington, IN: Indiana Prevention Resource Center.


Table of Contents
I. Report ........................................................................................................................... 1 Introduction .................................................................................................................................................................................. 2
Results ............................................................................................................................................................................................ 6
Methodology ............................................................................................................................................................................... 35
How to Interpret the Results ................................................................................................................................................. 51
Statewide Random Sample ..................................................................................................................................................... 54
References .................................................................................................................................................................................... 77
II. Statewide Prevalence of Use .............................................................................. 81
Mean Age of First Time Use of Alcohol, Tobacco, and Other Drugs ........................................................................... 89
III. Prevalence of Use by Race/Ethnicity ............................................................. 91
IV. Prevalence of Use by Gender ........................................................................... 99
V. Prevalence of Use by Region ............................................................................ 105
VI. Trends and Prevalence Graphs ....................................................................... 113
VII. Frequency Tables ............................................................................................. 127 All: 6th grade ............................................................................................................................................................................ 128
Male: 6th grade ........................................................................................................................................................................ 135
Female: 6th grade .................................................................................................................................................................... 142
All: 7-12th grade ....................................................................................................................................................................... 149
Male: 7-12th grade ................................................................................................................................................................... 177
Female: 7-12th grade ............................................................................................................................................................... 205
Appendix: Instrument ............................................................................................ 233
Data tables and graphs can be downloaded from the IPRC website:
http://www.INYS.indiana.edu


1
Indiana Prevention Resource Center
I. REPORT
• Introduction ……………………………………………. 2
• Results …………………………………………………… 6
• Methodology ………………………………………….. 35
• How to Interpret the Results ………………………… 51
• Statewide Random Sample ………………….......... 54
• References ……………………………………….......... 77

Indiana Youth Survey 2016
2
INTRODUCTION
OverviewIn spring, 2016, the Indiana Prevention Resource Center (IPRC) conducted the 26th annual Indiana Youth Survey (formerly known as the Annual Survey of Alcohol, Tobacco, and Other Drug Use by Indiana Children and Adolescents). The IPRC has conducted the Indiana Youth Survey, and has managed and reported the resulting data, since 1991. This project is administered through a contract with the Division of Mental Health and Addiction (DMHA) of the Indiana Family and Social Services Administration (FSSA). The purpose of this project is to provide data for state and local planning with respect to the use of alcohol, tobacco, and other drugs (ATOD), gambling behaviors, and risk and protective factors.
In January through April, 2016, local school officials administered surveys to students in Grades 6 through 12 in 398 schools throughout Indiana. A total of 115,593 youth from both public and nonpublic schools completed either paper-and-pencil or online surveys that asked about their use of various drugs, their age of first use of various drugs, and risk and protective factors. This process resulted in 107,801 usable surveys, the primary source of the data reported here. The Methodology section describes this process in more detail. The instruments are located in the appendix.
This report summarizes the findings of the 2016 Indiana Youth Survey. These findings include statistics and other information about the prevalence of ATOD use, gambling behaviors, and risk and protective factors. National prevalence estimates, reported by Monitoring the Future (MTF) (Miech, Johnston, O’Malley, Bachman, & Schulenberg, 2016) and the United States (US) Centers for Disease Control and Prevention’s Youth Risk Behavior Survey (YRBS) (Frieden, Jaffe, Cono, Richards & Iademarco, 2016), are provided to facilitate comparison with the United States as a whole.
The Indiana Youth Survey uses convenience sampling to collect data, meaning that it is a state-based survey in which any school or school corporation can participate. As noted in prior years, there are substantial advantages to collecting data in this way. For example, any school or school corporation that participates has the opportunity to receive local-level data that directly address deficits and strengths in that specific community. Such tailored findings are not available from the larger national surveys (e.g., MTF and YRBS), as they use random sampling. The Indiana Youth Survey reports facilitate local needs assessment, planning, and evaluation of drug abuse prevention activities. The IPRC provides a report of local results to each

3
Report
participating school corporation free of charge.1
This year marks the beginning of a new, additional random sampling process – this method did not replace the prior procedure but rather was conducted simultaneously in order to strengthen the Indiana substance use prevention infrastructure. The advantage of collecting a random sample alongside the convenience sample is that it allows the state-level data to be interpreted with much greater confidence in all areas of the state, including those where participation rates are low. Schools were eligible to be randomly sampled if they were public or charter schools and had at least one grade level (6th, 8th, 10th, or 12th) with an enrollment of 15 or greater. In total, 1,100 schools were eligible to be sampled; of those, 254 randomly were invited to participate, and 113 did so. Details about the random sample are available in a new section, titled Random Sample, which explains the new methodology and highlights the findings from that component of the Indiana Youth Survey.
National Outcome Measures (NOMs)The Government Performance and Results Act of 2010 requires government agencies to report the results of their activities. In response, the US Department of Health and Human Services’ Substance Abuse and Mental Health Services Administration (SAMHSA) designated a set of measures, called the National Outcome Measures (NOMs), for substance abuse prevention (Substance Abuse and Mental Health Services Administration [SAMHSA], 2008). SAMHSA collects the NOMs through its National Survey on Drug Use and Health (NSDUH) for all states, and it reports these data for states and sub-state regions (SAMHSA, 2008). The Indiana Youth Survey collects data on the majority of the substance abuse prevention NOMs for youth, and the IPRC also reports those data for Indiana as a whole and for the sub-state regions.
Increasingly, federal and state agencies require the NOMs for needs assessments and evaluations of local prevention programs that they fund. In order to compete for grants and to measure outcomes, communities will need to be able to capture, track, and analyze the NOMs at the local level.
A unique benefit of participating in the Indiana Youth Survey is that participants receive NOMs data on their own schools and communities. The Indiana Youth Survey collects NOMs data on alcohol, tobacco, marijuana and a variety of other illicit drugs for the following measures:
• thirty day prevalence of use,• perceived risk of harm,• age of first use, and• perception of peer disapproval.
1 Data from an individual school corporation are the property of that corporation. Local data may neither be released nor obtained without the written permission of the corporation where the survey was conducted.

Indiana Youth Survey 2016
4
Communities That Care (CTC)Between 2005 and 2011, Indiana received funding through the Strategic Prevention Framework State Incentive Grant (SPF-SIG) to expand its prevention infrastructure and decrease substance use and related consequences. A total of 20 communities were sub-recipients of these funds. Prior to the end of the grant funding, the State adopted an evidence-based planning model, called Communities That Care (CTC), to facilitate further expansion of the Strategic Prevention Framework (SPF) across Indiana’s fourteen Defined Service Areas (DSAs). Although we no longer report data separated by DSA, the risk and protective factors established as part of the CTC model contribute to data-driven decision making and evaluation. Therefore, the Indiana Youth Survey includes the essential risk and protective factors from the CTC Survey.
Changes to the SurveyIn 2013, DMHA worked with the IPRC to form a Survey Enhancement Team to facilitate improvements to the Indiana Youth Survey based on the evolving needs of the state. The addition of the random sample to the 2016 Indiana Youth Survey was planned and coordinated by this team. The additional information provided by the sampling methodology will benefit the state in multiple ways, including increased perception of the data’s validity by funding agencies outside of the state. At the same time, retaining the convenience sample ensures that the Indiana Youth Survey continues to provide meaningful data to the State and to the participating schools and school corporations for preventing youth substance use, including the collection of risk and protective factor data using the Communities that Care survey items. As before, the survey will continue to provide data required by the Center for Substance Abuse Prevention for the National Outcomes Measures (NOMs), as well as data required for the federally-funded Drug-Free Communities grantees.
In 2016, few changes were made to the survey instrument itself. Those changes are itemized here.
• The introduction to the survey and initial instructions were modified in order to clarify the purpose of the survey and to emphasize the confidential and voluntary nature of the process. The revised content reads: “Thank you for participating in this survey. These questions ask about things concerning you and your family, friends, and community. The survey is taken by students across Indiana. The purpose is to help schools and communities and to support their students’ needs. This is not a test, so there are no right or wrong answers. All of your answers will be kept strictly confidential. This means your answers are secret and no teachers will find out what you answered. Your individual answers will never

5
Report
be reported to anyone. This survey is completely voluntary. You can skip any questions that you do not want to answer. If you do not want to participate in this survey, you may leave it blank.”
• The item asking about sources of alcoholic beverages was modified. The following response options were added:• A person under 21 years old gave it to me.• I got it at a party.
Regional ReportingThis report presents prevalence data broken out at the level of FSSA’s sub-state planning regions. These eight regions are aggregates of the state’s 92 counties, as indicated in Table 1. Prevalence data for sub-state planning regions provide more targeted information than statewide data. Regional results are detailed in the Results section.
Table 1. Indiana Family and Social Services Administration Planning Regions
Sub-state Regions Counties
Central Boone, Hamilton, Hancock, Hendricks, Johnson, Marion, Morgan, Shelby
East Blackford, Delaware, Fayette, Grant, Henry, Jay, Madison, Randolph, Rush, Union, Wayne
North Central Cass, Elkhart, Fulton, Howard, Kosciusko, La Porte, Marshall, Miami, St. Joseph, Tipton, Wabash
Northeast Adams, Allen, De Kalb, Huntington, LaGrange, Noble, Steuben, Wells, Whitley
Northwest Jasper, Lake, Newton, Porter, Pulaski, Starke
West Benton, Carroll, Clay, Clinton, Fountain, Monroe, Montgomery, Owen, Parke, Putnam, Sullivan, Tippecanoe, Vermillion, Vigo, Warren, White
SoutheastBrown, Bartholomew, Decatur, Franklin, Lawrence, Jackson, Jennings, Ripley, Dearborn, Orange, Washington, Scott, Jefferson, Ohio, Switzerland, Crawford, Clark, Harrison, Floyd
Southwest Greene, Knox, Daviess, Martin, Gibson, Pike, Dubois, Posey, Vanderburgh, Warrick, Spencer, Perry

Indiana Youth Survey 2016
6
RESULTS
This section of the monograph summarizes:
• statewide convenience sample prevalence rates for 2016,• regional findings,• important patterns relating risk and protective factors to substance use, and• consequences of use.
Alcohol, Tobacco, and Other Drugs
Statewide Prevalence RatesThe Survey Enhancement Team implemented changes to the survey and cleaning methodology in 2015 to increase the strength of the data. These changes altered how some data were calculated and made it difficult to compare prevalence rates reported before 2015 to those reported in 2015 and 2016. Thus, comparisons of data from this report are restricted to significant changes from 2015 to 2016. In addition, as always, this report contains non-statistical comparisons to national survey data.
Highlighted Findings
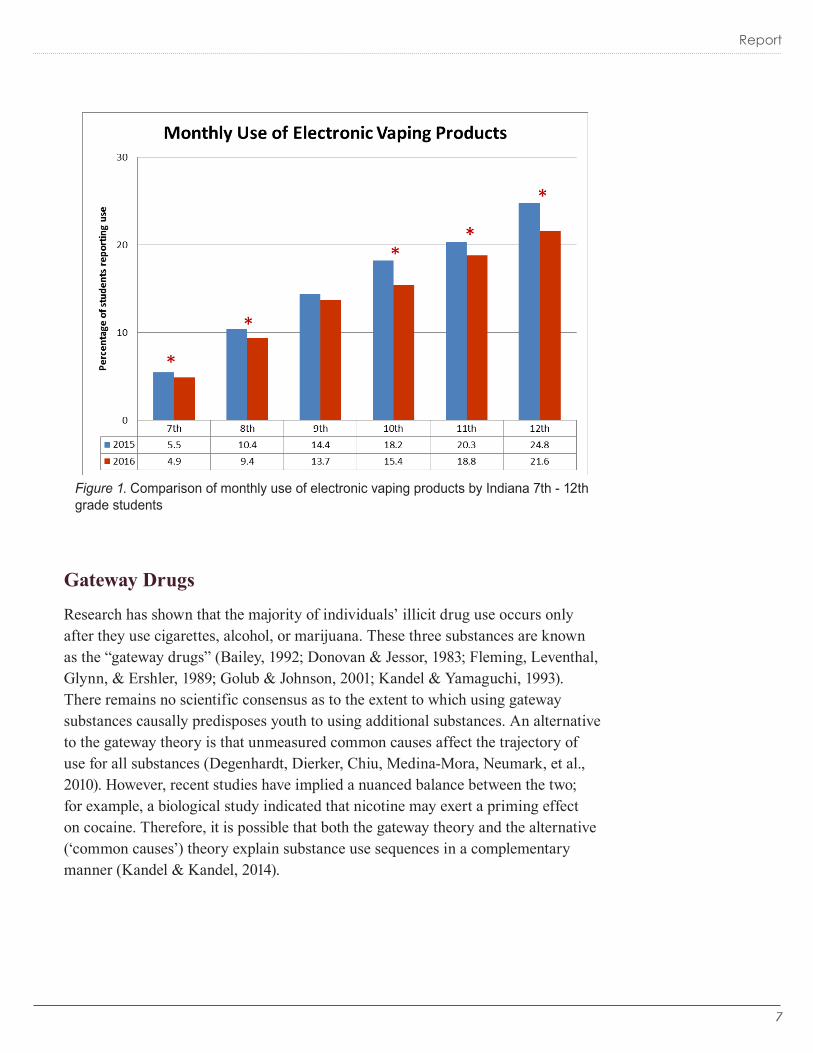
This year is the second year that the Indiana Youth Survey has asked about use of electronic vapor products, such as e-cigarettes. For historical perspective, in 2013, the Centers for Disease Control and Prevention (CDC) released a report based on the National Youth Tobacco Survey (NYTS) that found significant increases from 2011 to 2012 in e-cigarette use among both middle- and high-school students (CDC, 2013). In that report, monthly rates among middle school students had increased from 0.6% to 1.1%, and monthly rates among high school students had increased from 1.2% to 2.2%. In 2014, the Monitoring the Future (MTF) survey, which the Indiana Youth Survey uses as a source of national ATOD data, reported monthly use rates of 8.7% (8th grade), 16.2% (10th grade), and 17.1% (12th grade). In 2015, the Indiana Youth Survey reported rates for corresponding grades in Indiana that were higher than 2014 MTF rates. As sampling methodologies differ between MTF and the Indiana Youth Survey, a statistical comparison cannot be drawn.
However, for Indiana, past-month prevalence rates of electronic vaping product use significantly decreased from 2015 to 2016 (*) for students in all grades except 9th (see Figure 1).
7
Report
Figure 1. Comparison of monthly use of electronic vaping products by Indiana 7th - 12th grade students
Gateway Drugs
Research has shown that the majority of individuals’ illicit drug use occurs only after they use cigarettes, alcohol, or marijuana. These three substances are known as the “gateway drugs” (Bailey, 1992; Donovan & Jessor, 1983; Fleming, Leventhal, Glynn, & Ershler, 1989; Golub & Johnson, 2001; Kandel & Yamaguchi, 1993). There remains no scientific consensus as to the extent to which using gateway substances causally predisposes youth to using additional substances. An alternative to the gateway theory is that unmeasured common causes affect the trajectory of use for all substances (Degenhardt, Dierker, Chiu, Medina-Mora, Neumark, et al., 2010). However, recent studies have implied a nuanced balance between the two; for example, a biological study indicated that nicotine may exert a priming effect on cocaine. Therefore, it is possible that both the gateway theory and the alternative (‘common causes’) theory explain substance use sequences in a complementary manner (Kandel & Kandel, 2014).

Indiana Youth Survey 2016
8
Gateway Drug Use in Grades 6 to 8
Tobacco use in Grades 6 to 8
The survey for 6th-grade students asks about a single tobacco product: cigarettes. In 2016, 1.3% of 6th-grade students reported past-month use of cigarettes, but this rate was not significantly different than the 2015 rate. Students in 7th and 8th grades also were asked about smokeless tobacco, cigars, pipes, and electronic vapor products. For both grades, past-month prevalence rates for cigarettes, pipes, and electronic vapor products decreased from 2015 to 2016. Students in 8th grade also reported a lower past-month prevalence rate for cigars.
Alcohol use in Grades 6 to 8
The survey for 6th-grade students asks about past month alcohol use but not about binge drinking (consuming five or more drinks in a row in the past two weeks). There were no significant changes in prevalence rates for alcohol (6th, 7th, and 8th) or binge drinking (7th and 8th). In 2016, 3.6% of 6th-grade students reported using alcohol in the past month, as did 7.4% of 7th-grade students and 13.2% of 8th-grade students. In addition, 2.6% of 7th-grade students and 5.0% of 8th-grade students reported binge drinking.
Marijuana use in Grades 6 to 8
Past-month use of marijuana decreased significantly from 2015 to 2016 for students in all three grades (6th through 8th).
Gateway Drug Use in Grades 9 to 12
Tobacco use in Grades 9 to 12
For 10th-, 11th-, and 12th-grade students, past-month prevalence rates for cigarettes, smokeless tobacco, cigars, pipes, and electronic vaping products significantly decreased from 2015 to 2016. However, for 9th grade students, past-month rates were similar in 2015 and 2016 for all tobacco products except pipes, for which the prevalence rate decreased.
Alcohol use in Grades 9 to 12
Past-month use of alcohol significantly increased for students in 12th grade, but rates for both alcohol use and binge drinking remained relatively stable for all other grades (including binge drinking for 12th grade students).
Marijuana use in Grades 9 to 12

9
Report
Past-month use of marijuana significantly increased for students in 12th grade, but rates for marijuana use remained relatively stable for 9th-, 10th-, and 11th-grade students.
Other Drugs
Synthetic Marijuana Use in Grades 6 to 12
This is the fourth year that the Indiana Youth Survey has asked about synthetic marijuana. These substances have been categorized as herbal marijuana alternatives, which are composites of plant matter and “chemical grade synthetic cannabinoids” (Rosenbaum, Carreiro, & Babu, 2012). However, data on synthetic marijuana use are not available for 6th grade students after 2014, as those students began completing a separate instrument in 2015.
Comparisons of marijuana use and synthetic marijuana use indicate that monthly use of marijuana is more prevalent than use of synthetic marijuana at every grade level for which it was measured (Figure 2). These results are consistent with those from a global survey of synthetic marijuana users with a median age of 23, which found that the vast majority of users prefer natural marijuana to synthetic (Winstock & Barratt, 2013). Recent research suggests that synthetic marijuana likely will continue to be less popular than synthetic marijuana (Lauritsen & Rosenberg, 2016).
Figure 2. Monthly synthetic marijuana and marijuana use by Indiana 6th-12th grade students

Indiana Youth Survey 2016
10
Methamphetamine
Students in 8th and 9th grades reported past-month prevalence rates for methamphetamine that were lower than the 2015 rates; however, students in 12th grade reported a rate of past-month use that was higher than the 2015 rate. The 6th-grade survey no longer asks specifically about methamphetamine (students instead respond to a prompt for ‘other illegal drugs’).
Table 2. Monthly use of methamphetamine by youth in Grades 7 to 12 (percentages), 2015-2016
Grade 2015 2016 Nation2015
7 0.2 0.1
8 0.3 0.1* 0.3
9 0.4 0.2*
10 0.5 0.3 0.3
11 0.5 0.5
12 0.5 0.7* 0.4
Note. National data from the Monitoring the Future Survey, 2015. * Indicates a significant change from 2015 to 2016 (p < 0.05).
Other Drugs
Prescription drug abuse continues to be a serious health problem in the United States (Kirschner, Ginsburg, & Sulmasy, 2014; National Institute on Drug Abuse, 2015); the 2016 Indiana Youth Survey asks about all prescription drugs used without a personal prescription and includes examples of different classes of drugs, including pain relievers and sedatives. For the most part, past-month misuse of prescription drugs occurred at similar rates in 2015 and 2016, with the exception that 10th grade students reported a significantly lower prevalence rate in 2016 than in 2015.
Primarily referring to abuse of cough syrup (Vidourek, King, & Fehr, 2014), over-the-counter drug abuse (‘use to get high’) continues to be more prevalent than use of many illicit substances among Indiana youth. However, prevalence rates of past month use of over-the-counter drugs to get high remained relatively steady for all grades except 9th, which saw a statistically significant increase from 2015 to 2016 (6th-grade students were not asked to complete this question).
In 2015, hallucinogens and ecstasy were combined into a single item when assessing past month use of substances. No significant changes occurred in past-month prevalence rates for this group of substances. Likewise, cocaine and crack were combined into a single item, and prevalence rates of past month use did not significantly change for students in 7th, 10th, and 11th grades. However, students in 8th and 9th grades reported lower prevalence rates in 2016 than in 2015, and students
11
Report
in 12th grade reported a higher prevalence rate in 2016 than in 2015. Students in 6th grade were not asked specifically about either pair of substances.
Past month prevalence rates of heroin use were significantly lower for students in 7th and 9th grades, and remained steady for students in other grades (6th-grade students did not complete this item). Finally, past month prevalence rates of inhalant use were significantly lower for students in 8th grade, but remained steady for students in all other grades.
Race and EthnicityThis section reports monthly (past 30-day) prevalence rates for selected drugs for three race/ethnicity categories: Non-Hispanic White, Non-Hispanic Black or African-American, and Hispanic. We provide national data for comparison. Complete prevalence rates for each of these race/ethnicity categories by grade of respondent are reported in the Frequency Tables section of this monograph.
For this section of the report, we used the Youth Risk Behavior Survey (YRBS) for national comparison data. The national survey to which we usually compare prevalence measures, Monitoring the Future, was less appropriate for comparison since it provides only approximate weights for race/ethnicity subgroups; it reports data only for non-Hispanic Whites, non-Hispanic Blacks, and Hispanics, and it provides only two-year averages—rather than single-year estimates—for prevalence measures. The YRBS data are readily available, allowing for the calculation of the statistical significance of differences. The YRBS uses a race/ethnicity categorization similar to ours. Though YRBS questions are worded differently from ours, we chose to report in this section a concept (any use in the past 30 days) that is common to both instruments. Because the available YRBS data are from the 2015 survey, however, caution should be used when interpreting statistically significant differences between our data and the national data as they measure different years.
Table 3 shows the average prevalence of monthly (past 30-day) use for respondents in Grades 9 to 12 by race/ethnicity category. YRBS national prevalence rates are provided for comparison. Statistically significant differences between Indiana prevalence rates and national prevalence rates (p<.05) are denoted with an asterisk (*). The substances shown were those common to both surveys for past 30-day use.
This year, statistically significant differences were observed between the Indiana Youth Survey data and the YRBS data for every available substance and race/ethnicity pairing except cigarettes and smokeless tobacco for Hispanic students. All statistically significant differences illustrated lower prevalence rates for Indiana than for the U.S. Again, these results should be interpreted with great caution due to the time lapse between the two periods of data collection.

Indiana Youth Survey 2016
12
Table 3. Prevalence of past 30-day use of substances by race/ethnicity, students in Grades 9 to 12, 2016 Indiana Youth Survey and the 2015 Youth Risk Behavior Survey (percentages)
Substance IN US Substance IN US
Cigarettes* 10.1 10.8 Alcohol* 24.9 32.8White* 10.8 12.4 White* 24.7 35.2
Black* 4.2 6.5 Black* 20.7 23.8
Hispanic 9.5 9.2 Hispanic* 28.1 34.4
Smokeless tobacco* 5.2 7.3 Binge drinking#* 11.3 17.7
White* 5.9 9.3 White* 11.2 19.7
Black* 1.4 3.7 Black* 7.7 11.4
Hispanic 4.2 4.5 Hispanic* 14.1 17.7
Cigars* 5.2 10.3 Marijuana* 14.5 21.7
White* 5.6 10.4 White* 12.8 19.9
Black* 3.0 11.0 Black* 21.6 27.1
Hispanic* 4.8 9.5 Hispanic* 18.1 24.5
Notes.IN = 2016 Indiana Youth Survey (Gassman et al., 2016).US = 2015 Youth Risk Behavior Survey (YRBS) (Frieden et al., 2016).* p < .05# Binge drinking was measured during the past 2 weeks on the Indiana Youth Survey, while the
YRBS measured it during the past 30 days
GenderThis section presents an analysis of differences in substance use prevalence between males and females. For this analysis, we calculated the difference between male and female past-month (30-day) prevalence rates for each drug (see Table 4). We analyzed differences that were statistically significant (p<.05). An additional table (see Table 5) provides further prevalence data for alcohol.
For most drugs and across all grades surveyed, either the percentage of male users was higher than the percentage of female users, or there were no gender-based differences. However, five substances had higher percentages of female users in some combination of grades 8 through 10. These were: cigarettes, prescription drugs, over-the-counter drugs, marijuana, and alcohol (including binge drinking). Interestingly, these were the same cohorts for which female students reported higher rates in 2015 (last year, the differences were observed mainly for 7th through 9th grades). Higher percentages of male users generally were observed in high school (especially in 10th through 12th grades). The number of substances for which there was a higher percentage of male users tended to increase with grade level,

13
Report
culminating with 13 different substances (not including past-month alcohol use, though males reported more binge drinking).
Table 4. Significant differences (p<.05) between male and female prevalence rates for substance use in the past monthWhere females’ prevalence is higher, the cell is black with white text; where males’ prevalence is higher, the cell is white with black text. Differences of zero and non-significant differences between genders are indicated by a dash (-). Sixth grade students were not asked about all substances (indicated by an empty gray box).
Grade6 7 8 9 10 11 12
Cigarettes -- -- 1.0 -- -- -- -3.9
Over the counter drugs -- 0.5 0.8 -- -0.8 -1.9
Electronic vapor products -- -- -- -2.3 -4.4 -6.2
Prescription drugs -- -- -- 1.1 0.7 -- -1.5
Pipe -- -- -- -- -1.4 -1.6
Marijuana -0.3 -- -- 1.0 -- -1.9 -2.6
Inhalants -- -- -- -- -- -- -0.4
Synthetic marijuana -0.3 -- -- -- -- --
Cocaine/Crack -- -- -- -0.3 -0.4 -1.0
Methamphetamines -- -- -- -- -- -0.4
Heroin -- -- -- -- -0.2 -0.3
Hallucinogens/Ecstasy -- -- -- -0.5 -1.3 -1.9
Cigars -0.4 -1.0 -2.4 -3.6 -6.6 -10.4
Smokeless tobacco -1.3 -2.8 -4.6 -6.3 -9.0 -10.9
Table 5. Significant differences (p<.05) between male and female prevalence rates for alcohol useWhere females’ prevalence is higher, the cell is black with white text; where males’ prevalence is higher, the cell is white with black text. For each drug and each gender, the largest difference across grades is underlined. Differences of zero and non-significant differences between genders are indicated by a dash (-).Sixth grade students were not asked about binge drinking (indicated by an empty gray box).
Grade6 7 8 9 10 11 12
Past month alcohol use -1.0 -- 2.6 3.5 3.5 -- --
Past 2-week binge drinking -- 1.2 1.0 -- -1.7 -2.8
Regional Prevalence RatesThis section presents the Indiana Youth Survey results for Indiana’s Family and Social Service Administration’s sub-state planning regions (see Figure 3). Regional data provide more targeted information for local analyses. For the drugs studied, prevalence rates varied considerably among regions and between any given region

Indiana Youth Survey 2016
14
and the state. This summary does not attempt to capture the extent of this variation; however, a few examples are provided.
Compared to all respondents, statewide, in the…
• North Central Region, youth in 7th, 8th, and 10th grades were more likely to report use of alcohol and marijuana.
• Southeast Region, youth in all grades were more likely to report use of cigarettes and smokeless tobacco (with the exceptions of 6th grade students, who were not asked about smokeless tobacco, and 10th grade students, whose rate was only higher for smokeless tobacco).
• Central Region, youth in 7th through 12th grades variously reported lower rates of use for a number of different drugs (depending on grade level), including alcohol and tobacco products.
The reasons for the regional variation are not addressed in this report. Communities may gain a better understanding of their own youth drug use by comparing their prevalence rates (in their local report) to the regional rates presented in this report.
Figure 3. Indiana Family and Social Service Administration’s sub-state planning regions

15
Report
Risk and Protective FactorsAge of First UseResearch has shown that the younger a person is when she or he begins using alcohol, the more likely the person is to experience alcohol dependence and abuse (Grant, Stinson, & Harford, 2001; Warner & White, 2003). Compared to persons who began drinking at age 21 or older, those who began drinking before age 14 were more likely to experience alcohol dependence later in life (Hingson, Heeren, & Winter, 2006).
Reported initiation of gateway drugs exhibits a nearly consistent pattern across all grade levels: cigarettes first, then alcohol, followed by marijuana (see Table 6). In this section, data appear to indicate that the mean age of initiation increases with grade. However, this should be interpreted carefully. There are multiple factors that may cause the mean age of initiation to vary across grade levels, including historical events, memory errors for older individuals, and changing definitions of what might constitute ‘first use’ for a given student (Miech, Johnston, O’Malley, Bachman, & Schulenberg, 2015). Further, because grade levels have generally fixed sets of attending ages, mean age of initiation naturally rises with grade level (e.g., a 12-year-old cannot report a mean age of initiation of 14, setting a ‘soft cap’ on the ages of first use reported in 6th grade). Thus, it is most instructive to examine Tables 6 and 7 vertically (meaning within a grade) rather than horizontally (between grades). Examining these data within grades suggests the progression of substance use initiation: substances with lower mean ages of first-time use are likely used by students prior to substances with higher mean ages of first-time use.
Table 6. Mean age of first time use of gateway drugs
Grade6 7 8 9 10 11 12
Cigarettes 10.6 11.2 11.8 12.5 13.1 13.9 14.5
Alcohol 10.7 11.3 12.0 12.9 13.7 14.3 14.8
Marijuana 11.2 11.8 12.5 13.2 13.9 14.5 15.0

Indiana Youth Survey 2016
16
Table 7. Mean age of first time use of various substances
Grade6 7 8 9 10 11 12
Smokeless tobacco -- 11.4 12.1 12.9 13.6 14.1 14.8Cigars -- 11.5 12.2 13.0 13.8 14.5 15.4Pipe -- 11.7 12.5 13.3 14.0 14.7 15.4Electronic vapor products -- 12.0 12.8 13.7 14.5 15.3 15.9Synthetic marijuana -- 11.9 12.5 13.3 13.8 14.2 14.5Cocaine/Crack -- 10.9 12.6 13.0 14.0 14.6 15.6Inhalants 10.5 11.2 11.8 12.8 13.3 13.9 14.4Methamphetamines -- 11.0 12.4 12.7 14.0 14.7 15.5Heroin -- 11.4 12.7 11.9 13.5 13.8 15.1Hallucinogens/Ecstasy -- 12.0 12.8 13.6 14.6 15.2 16.0Prescription drugs 10.4 11.0 11.9 12.8 14.0 14.7 15.2Over the counter drugs 10.8 10.8 11.5 12.2 13.1 13.8 14.5Hallucinogens/Ecstasy -- 12.0 12.8 13.6 14.5 15.2 16.0Prescription drugs 10.5 11.0 12.1 12.9 14.0 14.6 15.2Over the counter drugs 10.9 10.9 11.5 12.3 13.0 13.7 14.2
Figure 4 also contains trends in reported age of first use for gateway substances. However, for reasons described previously, data from 2015 onward should not be compared to data collected prior to 2015. In Figure 4, we have illustrated this cut-point with a red line (comparisons should not be made across the line).
Figure 4. Trends in average reported age of first use of cigarettes, alcohol, and marijuana.

17
Report
Perceived Risk of Harm
Prior research has demonstrated that perceived risk of harm of using drugs negatively is related to prevalence of use (Millstein & Halpern-Felsher, 2002; Wild, Hinson, Cunningham, & Bacchiochi, 2001). To examine this relationship in the Indiana Youth Survey data, respondents’ perceived harm of using gateway drugs was correlated with reported monthly use of gateway drugs (see Table 8 for definitions of monthly use of gateway drugs). Perceived risk of harm was measured for the three gateway substances using this question: “How much do you think people risk harming themselves (physically or in other ways) if they… (a) smoke one or more packs of cigarettes per day, (b) smoke marijuana once or twice per week, (c) have five or more drinks of an alcoholic beverage (beer, wine, liquor) once or twice a week.”
Table 8. Glossary of prevalence of monthly gateway drug use for all correlation analyses
Monthly Use
Cigarettes How many times in the last month (30 days) have you used cigarettes?
Alcohol How many times in the last month (30 days) have you used alcohol (beer, wine, liquor, wine coolers)?
Marijuana How many times in the last month (30 days) have you used marijuana (pot, hash, weed, kush, Mary Jane)?
The results show that higher perceived risk of harm was associated with lower monthly use of cigarettes, marijuana, and alcohol (see Figure 5).
Figure 5. Line of best fit for the correlation of perceived risk of harm and monthly prevalence of gateway drug use.

Indiana Youth Survey 2016
18
Perceptions of Peer Disapproval
Research has demonstrated that when adolescents perceive that their peers do not approve of alcohol or substance use, it may exert an influence that lowers the likelihood of use (Butters, 2004; Chassin, Presson, & Sherman, 1984). To examine this relationship in the Indiana Youth Survey data, respondents’ perceptions of peer approval were correlated with reported use of gateway drugs (see Table 8 for a definition of monthly use of gateway drugs).
Perceived peer approval was measured for three gateway drugs with the survey items: “How wrong do your friends feel it would be for you to… (a) smoke tobacco; (b) smoke marijuana, (c) have one or two drinks of an alcoholic beverage (beer, wine, liquor) nearly every day.”
The results illustrate that when reported perception of peer approval for a particular behavior is stronger, the reported level of the behavior is higher (see Figure 6).
Figure 6. Line of best fit for the correlation of perceived peer approval and monthly prevalence of gateway drug use.
Perceptions of Parents' Approval
The Indiana Youth Survey data measured perceived parental approval for the use of three gateway drugs with the following items: “How wrong do your parents feel it would be for you to… (a) smoke cigarettes?; (b) smoke marijuana?; (c) drink beer, wine, or hard liquor (vodka, whiskey, or gin) regularly (at least once or twice a month)?” The results appear in the prevalence tables.

19
Report
Adolescents’ perceptions of parental approval of substance use are positively related to the frequency of adolescents’ use of alcohol, tobacco and marijuana (Briney, Brown, Hawkins, & Arthur, 2012; McMaster & Wintre, 1996; Lee et al., 2000; Jessor & Donovan, 1978; Barnes & Welte, 1986). To examine this relationship in the Indiana Youth Survey data, respondents’ perceptions of parents’ approval were correlated with reported use of gateway drugs in the previous month. Respondents tended to report engaging in these behaviors more often when they also reported stronger perceived parental approval for the behavior (see Figure 7). These findings are consistent with the research cited.
Figure 7. Line of best fit for the correlation of perceived parental approval and monthly prevalence of gateway drug use.
Perceived Availability of Drugs
Studies have shown that youth perceptions of available access to alcohol and other drugs puts them at risk for use of tobacco, alcohol, and marijuana (Kuntsche & Gmel, 2008; Gillespie, Neale, & Kendler, 2008; Lipperman-Kreda & Grube, 2009).
Perceived availability of drugs was measured by the following items: “How easy would it be for you to get… (a) Cigarettes, (b) Beer, wine or liquor (for example, vodka, whiskey or gin), (c) Marijuana, (d) A drug like cocaine, LSD or amphetamines.”
The results indicate that perceptions of ease of access were associated with higher monthly use of tobacco products, alcohol, and marijuana (see Figure 8). These findings support the value of prevention actions that take into account the social

Indiana Youth Survey 2016
20
acceptance of drinking and drug use and the physical availability of these substances in the community.
Figure 8. Line of best fit for the correlation of perceived availability of gateway drugs and monthly prevalence of gateway drug use.
Access to Alcohol
A public health strategy to reduce alcohol abuse by youth is to identify the primary sources of alcohol access and to target interventions to eliminate access at those points (Dent, Grube, & Biglan, 2005). Adults over the age of 21 are common sources of alcohol access for youth (Wagenaar & Toomey, 1996; Jones-Webb, Toomey, Miner, Wagenaar, Wolfson, et al., 1997). However, the sources tend to vary by age. Younger adolescents tend to get alcohol from their homes and families, while older adolescents tend to get alcohol from friends and commercial sources (Harrison, Fulkerson, & Park, 2000; Hearst, Fulkerson, Maldonado-Moline, Perry, & Komro, 2007).
The percentage of respondents who reported accessing alcohol from specific sources is shown for each grade in Table 9. This item was not included on the 6th-grade instrument. The results are consistent with the research cited in this section. This summary excludes the response ‘I got it some other way,’ which may include a wide variety of other methods.
Family members, including parents and guardians, were the primary source of alcohol for youth in 7th through 10th grades. Family members remained the third-most-frequent source for youth in 11th and 12th grades. At the same time, a response

21
Report
option added in this year, ‘I got it from a party,’ was the second- or third-most frequently reported means of obtaining alcohol for all grades except 11th, where it was the primary means of obtaining alcohol. Finally, people over the age of 21 were the primary source of alcohol for youth in 12th grade.
These results are consistent with research suggesting that youth drinking could be reduced if parents and family members better understood the risk of harm to youth that alcohol presents, as well as ways to prevent youth from accessing alcohol kept in the home (Small, Suzuki, & Maleku, 2014). In addition, the results suggest that persons age 21 and older may need to be informed of the laws (e.g. hosting, legal age) and penalties that apply to purchasing and/or otherwise supplying alcohol to minors.
Table 9. Usual sources of alcoholic beverages in the past month (percentages)
Grade7 8 9 10 11 12 Total
I did not drink alcohol 89.8 81.4 74.0 66.8 60.7 51.9 72.2
I bought it at a restaurant, bar, or club 0.3 0.3 0.4 0.6 1.1 2.3 0.8
I bought it at a public event 0.3 0.5 0.5 0.8 1.5 2.6 0.9
I gave someone else money to buy it for me 1.1 2.6 5.7 9.9 15.1 22.5 8.5
I bought it at a store 0.2 0.4 0.5 0.8 1.5 2.8 0.9
A person 21 years old or older gave it to me 4.1 7.7 10.8 14.7 19.5 27.2 13.1
A person under 21 years old gave it to me 1.9 4.2 7.0 10.0 12.8 15.4 8.0
I took it from a store 0.3 0.5 0.8 0.9 1.2 1.6 0.8
I got it at a party 2.8 6.5 10.9 16.0 20.5 26.1 12.8
I got it from a parent/guardian 4.3 6.6 7.6 8.3 9.6 12.2 7.8
I got it from some other family member 3.3 5.6 6.7 8.0 9.0 11.7 7.1
I got it some other way 3.9 7.1 9.2 9.4 9.8 10.4 8.2 Note: Multiple responses allowed; percentages do not add to 100%.
Access to Prescription Drugs
Table 10 shows the percentages of youth who report having obtained prescription drugs in specific ways during the past month. In total, 93.5% of respondents indicated that they did not use prescription drugs to get high during the past month. Among those who reported use of prescription drugs to get high the most frequently identified sources were “they were prescribed to me,” followed by “someone other than my parents gave then to me,” and “I bought them from someone.” These prevalence rates varied relatively little between grade levels with a few exceptions. Specifically, students in the later grade levels reported higher frequencies for three sources of prescription drugs, “someone other than my parents gave them to me,” “I bought them from someone,” and “they were prescribed to me,” at substantially

Indiana Youth Survey 2016
22
higher rates than students in the youngest grade levels.
Table 10. Usual sources of prescription drugs in the past month (percentages)
Grade7 8 9 10 11 12 Total
I did not use prescription drugs to get high 96.5 95.0 94.0 92.3 91.5 90.0 93.5
They were prescribed to me 2.9 2.4 2.5 3.0 3.1 3.5 2.9
My parents gave them to me 0.9 0.8 0.6 0.6 0.6 0.8 0.7
Someone other than my parents gave them to me 1.0 2.0 2.4 3.3 3.9 4.9 2.8
I took them from home 0.5 1.1 1.5 1.6 1.7 1.7 1.3
I bought them from someone 0.6 1.4 2.0 2.9 3.4 4.6 2.3
I bought them on the internet 0.1 0.2 0.2 0.3 0.3 0.3 0.2
I took them from someone else 0.4 0.7 0.7 0.8 0.9 1.1 0.7
I got them some other way 1.0 1.5 1.7 1.9 1.7 2.4 1.6 Note: Multiple responses allowed; percentages do not add to 100%.
Communities That Care Risk and Protective FactorsRisk factors are conditions that increase the chances that children will become involved in problem behaviors in adolescence and young adulthood (Hawkins & Catalano, 2005). Measures included in the Indiana Youth Survey from the Communities That Care (CTC) System can predict alcohol and other drug use, as well as delinquency, dropping out of school, teen pregnancy and violence. Students with elevated risk factor scores have a higher likelihood of substance use and problem behaviors compared to those with low risk factor scores.
CTC is based on the Social Development Strategy that has as its principal focus the strengthening of protective factors. Protective factors are conditions that have a positive influence and “protect” or “buffer” against the negative influences associated with risk factors. The research-based Social Development Model has shown that positive social development in youth is promoted by the following basic factors: 1) opportunities for developmentally appropriate involvement; 2) skills; 3) recognition for effort, improvement and achievement; 4) strong social bonds; and 5) clear consistent standards for behavior. Though closely related, protective factors are not the opposite of risk factors but rather reduce the effects of existing risk factors.
A national study determined optimal cut points used to define high and low risk and protective factor scores for students in Grades 6, 8, 10 and 12 (Arthur, Briney, Hawkins, Abbott, Brooke-Weiss, et al., 2007). In that study, a survey of risk and protective factors was sent to a large sample of students and the median score for each factor was identified; these scores were set as the cut points. Although not shown, those cut points were used in Table 11 and Table 12 to calculate the
23
Report
percentages of Indiana students with high and low risk and protective factor scores, respectively, by grade.
CTC categorizes risk and protective factors into four domains of socialization: Community, Family, School and Peer-Individual (see Table 11 and Table 12). Sixth grade students completing the shortened survey instrument were not asked to complete many of the CTC risk factor scales. In Table 11, those values are noted as being unavailable (--).
Fourteen risk factors were assessed on the 7th- to 12th-grade instrument, and five risk factors were assessed on the 6th-grade instrument. For six of the risk factor scales, the percentages of youth considered to be at high risk increased with each successive grade (e.g., perceived availability of drugs, for which 19.6% [8th], 26.2% [10th], and 36.2% [12th] of youth were at high risk). These scales are: perceived availability of drugs, parental attitudes favorable toward drug use, low school commitment, attitudes favorable towards antisocial behavior, attitudes favorable to drug use, and interaction with anti-social peers. For two of the risk factor scales, the percentages of youth at high risk exceeded 50.0% for at least one grade: low school commitment (12th) and perceived risk of drug use (6th, 8th, 10th, and 12th).

Indiana Youth Survey 2016
24
Table 11. Percentage of students with CTC risk factor scores at/below (low risk) or above (high risk) the national standard#
Grade6th 8th 10th 12th
Community Domain
Law and norms favorable to drug useLow risk -- 70.9 60.7 62.0
High risk -- 29.1 39.3 38.0
Perceived availability of drugsLow risk -- 80.4 73.8 63.8
High risk -- 19.6 26.2 36.2Family Domain
Poor family managementLow risk 76.7 76.9 79.5 74.5
High risk 23.3 23.1 20.5 25.5
Family conflictLow risk 58.5 50.0 57.4 58.5
High risk 41.5 50.0 42.6 41.5
Parental attitudes favorable towards drug use
Low risk 87.1 85.0 75.2 68.5High risk 12.9 15.0 24.8 31.5
Parental attitudes favorable towards anti-social behavior
Low risk -- 63.3 64.9 63.3High risk -- 36.7 35.1 36.7
School Domain
School academic failureLow risk 67.7 65.7 64.0 67.3
High risk 32.3 34.3 36.0 32.7
Low school commitmentLow risk -- 56.5 52.9 47.9
High risk -- 43.5 47.1 52.1Peer-Individual Domain
Early initiation of drug use†Low risk -- 84.9 85.3 81.9
High risk -- 15.1 14.7 18.1
Attitudes favorable towards antisocial behavior
Low risk -- 71.0 68.9 68.1High risk -- 29.0 31.1 31.9
Attitudes favorable towards drug useLow risk -- 77.1 67.6 61.8
High risk -- 22.9 32.4 38.2
Perceived risk of drug useLow risk 44.2 41.2 42.9 34.4
High risk 55.8 58.8 57.1 65.6
Interaction with anti-social peersLow risk -- 71.5 70.8 68.1
High risk -- 28.5 29.2 31.9
Rewards for antisocial involvementLow risk -- 58.5 60.0 51.0
High risk -- 41.5 40.0 49.0
Notes. # The national standards (cut-off points) are provided by the Social Development Research Group at the University of Washington.
† The scale is missing one item out of four items from the original CTC scale. -- Data are not available

25
Report
Figure 9. CTC risk factors
Six CTC protective factor scales were included on both the 6th-grade and 7th- to 12th-grade Indiana Youth Survey instruments. Levels of low protection exceeding 50.0% for at least one grade were observed for community rewards for prosocial involvement (6th, 8th, 10th, and 12th) and interaction with prosocial peers (12th). For three of the protection scales (community rewards for prosocial involvement, school rewards for prosocial involvement and interaction with prosocial peers), levels of protection appeared to decrease, though non-linearly, between 6th grade and 12th grade. For the remainder of the scales, levels of protection were relatively similar across grade levels, although students in 8th grade reported high levels of protection from family rewards for prosocial involvement.

Indiana Youth Survey 2016
26
Table 12. Percentage of students with CTC protective factor scores at/below (low protection) or above (high protection) the national standard#
Grade6th 8th 10th 12th
Community DomainCommunity rewards for prosocial involvement
Low protection 59.2 66.1 63.8 64.9High protection 40.8 33.9 36.2 35.1
Family DomainFamily opportunities for prosocial involvement
Low protection 34.7 32.2 35.7 36.4High protection 65.3 67.8 64.3 63.6
Family rewards for prosocial involvement
Low protection 39.0 31.9 37.1 38.5High protection 61.0 68.1 62.9 61.5
School DomainSchool opportunities for prosocial involvement
Low protection 31.3 28.5 31.0 29.6High protection 68.7 71.5 69.0 70.4
School rewards for prosocial involvement
Low protection 41.3 45.1 40.0 48.4High protection 58.7 54.9 60.0 51.6
Peer-Individual Domain
Interaction with prosocial peersLow protection 42.3 44.7 48.4 54.4High protection 57.7 55.3 51.6 45.6
Notes. # The national standards (cut-off points) are provided by the Social Development Research Group at the University of Washington.
Figure 10. CTC protective factors

27
Report
Consequences of UseResearch has shown that prevention and/or reduction of alcohol and drug use among student populations leads to a decrease in related problems (Hingson, et al., 1996; Wodarski, 1988). Communities are better positioned to address substance use if they understand the relationship of that use to its consequences; these include, for example, poor performance on tests or missing school.
The percentages of respondents who reported specific school-related consequences of alcohol or other drug use are shown for each grade in Table 13. The prevalence of having performed poorly on a test increased from 7th to 9th grade and then remained relatively level, except for a lower rate for 11th grade students. The prevalence of having missed class increased mostly linearly from 7th to 12th grade. These items were not included on the 6th-grade instrument.
Table 13. Consequences of ATOD use
Grade7 8 9 10 11 12
Performed poorly on a test or project
% 4.2 4.6 5.1 4.9 4.3 5.0
N 14,880 18,692 14,545 17,275 11,491 10,929
Missed class% 2.6 3.1 3.7 4.2 4.1 5.3
N 14,812 18,618 14,488 17,201 11,459 10,905
Substance Abuse Problems
About the CRAFFT Screening InstrumentThis is the fifth year the Indiana Youth Survey has included the items from the CRAFFT Screening Instrument (it previously was administered in 2009 through 2011 and temporarily removed due to issues with survey space). The CRAFFT may be used clinically to detect whether an individual is likely to have problem use or a substance use disorder (Knight, Shrier, Bravender, Farrell, Bilt, et al., 1999). The purpose of including the CRAFFT in the Indiana Youth Survey is to measure the prevalence of substance use-related problems among adolescents. This has been done previously with an adolescent population in Ontario, Canada (Adlaf & Paglia-Boak, 2007). When included in a statewide survey, the CRAFFT may provide a broad-spectrum assessment of likely risk level associated with adolescent substance use (Agley, Gassman, Jun, Nowicke, & Samuel, 2015).
Screening instruments, such as the CRAFFT, cost little to administer but do a good

Indiana Youth Survey 2016
28
job of identifying people who are at risk for having a disorder. If someone were to screen positive on the CRAFFT in a clinical setting, the clinician would likely refer the patient for a more resource-intensive assessment to diagnose substance use disorder. In the case of substance use disorder, the criteria for such an assessment are specified in the DSM-V.
While many validated substance use screening tools exist, such as the CAGE, AUDIT, and DAST, current evidence favors either the CRAFFT or the AUDIT with modified cut-points for adolescent populations (Mitchell, Gryczynski, O’Grady, & Schwartz, 2013; Harris, Louis-Jacques, & Knight, 2014). Given that the AUDIT only assesses alcohol use and the CRAFFT assesses alcohol and other substance use, this survey utilizes the CRAFFT.
The CRAFFT has six items; these are presented in Table 14. Response options for each are limited to “yes” and “no.” The items in the CRAFFT scale reflect consequences, patterns, and rationales of use. Affirmative responses to two or more CRAFFT items constitute a positive screen (Knight, Sherritt, Harris, Gates, & Chang, 2003). The CRAFFT was validated for use with people aged 14 to 19 (Knight, Sherritt, Shrier, Harris, & Chang, 2002).
What the CRAFFT measuresWe emphasize strongly that the CRAFFT does not diagnose a substance use disorder and that the data presented below are not estimates of the prevalence of substance use disorders in Indiana. However, the results do suggest problem use among those who screened positive. Understanding the prevalence of problem substance use among sub-populations of youth is critical for targeting effective prevention efforts.
ResultsThis analysis included the 67,952 responses from students who were 14 years of age or older for which any of six CRAFFT items were marked “Never used alcohol or drugs,” “Yes” or “No.” Of the responses, 62.7%, or 42,626 youth, had a CRAFFT score of zero; 19.0%, or 12,890 youth, had a CRAFFT score of one; and 18.3%, or 12,436 youth, had a CRAFFT score of two or more.
Table 14 presents the percentages of all respondents ages 14 and older who responded “yes” to each of the CRAFFT items. Results for individual CRAFFT items by grade of respondent are presented in the tables section of this report.

29
Report
Table 14. Percentage of respondents, aged 14 or older, indicating “yes” for each of the CRAFFT items (n = 67,952)
Item %
Have you ever ridden in a car driven by someone (including yourself) who was high or had been using alcohol or drugs? 32.1
Do you use alcohol or drugs to relax, feel better about yourself, or fit in? 13.7
Do you ever use alcohol or drugs while you are alone? 13.5
Do you ever forget things you did while using alcohol or drugs? 9.8
Do your family or friends ever tell you that you should cut down on your drinking or drug use? 4.3
Have you ever gotten into trouble while you were using alcohol or drugs? 6.7
Table 15 shows a breakout of CRAFFT scores by respondent’s age. A Pearson’s Chi-Square test indicates significant differences among age groups for the scores (p<.001). The prevalence of a score of two or greater was higher for older respondents.
Table 15. CRAFFT scores of respondents (percentages by age)
CRAFFT Score
Age of respondent (number (n) of respondents in each group)
14(n=16,669)
15(n=15,338)
16(n=16,003)
17(n=11,876)
18+(n=8,066)
0 72.0 65.8 61.7 54.9 51.2
1 18.0 18.8 18.7 19.9 20.5
2+ 10.0 15.4 19.6 25.2 28.3
Table 16 presents the CRAFFT results by race and ethnicity for respondents age 14 and older. Race and ethnicity data were collapsed into four categories to facilitate statistical tests of differences among categories. The construction of these categories is explained in the Data section of this monograph (see Tables 27 and 28).
A Pearson’s Chi-Square test of differences indicated significant differences among the four race/ethnicity categories (p<.001). Z-tests indicated that fewer Caucasian, African-American, and Other students scored a two or greater on the CRAFFT than Hispanic students (p<.05).
Further, the prevalence of a score of two or greater was lower for Caucasian and African-American students than for Hispanic and Other students (p<.001), and the prevalence of a score of two or greater was lower for African-American students than for White students (p<.001).

Indiana Youth Survey 2016
30
Table 16. CRAFFT scores of respondents, aged 14 or older (percentages by race and ethnic group)
CRAFFT Score
Race or ethnicity (number (n) of respondents in each group)
White or Caucasian(n=48,847)
Black orAfrican-
American(n=4,858)
Hispanic Ethnicity(any race)(n=8,299)
Other(n=5,876)
0 64.1 60.1 57.3 60.91 18.2 22.7 21.1 19.0
2+ 17.6 17.2 21.6 20.1
Table 17 shows the CRAFFT results by gender of respondent for respondents ages 14 and older. A Pearson’s Chi-Square test indicated significant differences between genders (p<.001). Female students were more likely than male students to score a two or greater on the CRAFFT.
Table 17. CRAFFT scores respondents, aged 14 or older (percentages by gender)
CRAFFT ScoreGender (number (n) of respondents)Male
(n=33,608)Female
(n=34,344)0 65.5 60.11 17.6 20.3
2+ 17.0 19.6
Mental HealthPrior research has demonstrated robust relationships between adolescent depression, suicidal behavior and substance abuse (Esposito-Smythers & Spirito, 2004; Hallfors, et al., 2004; Light, Grube, Madden & Gover, 2003). As a result, the State is trying to better understand the prevalence of mental health concerns among Indiana’s youth. Mental health was measured for the past year (12 months) with survey items that asked about “feeling sad or hopeless almost every day for two weeks or more in a row that you stopped doing some usual activities,” “serious consideration of attempting suicide,” and “making a plan about how you would attempt suicide.”
The percentages of respondents who reported mental health concerns are shown in Table 18. YRBS national prevalence rates for Grades 9 to 12 are provided for comparison. Statistically significant differences between Indiana prevalence rates and national prevalence rates (p<.05) are highlighted in yellow. Because data for national prevalence rates were collected one year prior to the Indiana Youth Survey data collection, caution should be used in interpreting any statistically significant differences in this section.

31
Report
The following statistically significant differences may be observed: the prevalence rate for feeling sad or hopeless two or more weeks in a row were higher for Indiana youth in 9th grade than for U.S. youth in the same grade. Prevalence rates for making a plan to attempt suicide were less prevalent for Indiana students in 10th through 12th grades than for U.S. students in those grades. National data are not available for students in 6th through 8th grades.
Table 18. Mental Health (percentages)
Grade6 7 8 9 10 11 12
Felt sad or hopeless for 2+ weeks in a row
IN 21.5 23.1 28.0 30.5 31.2 30.7 29.1
Nation -- -- -- 28.4 29.8 31.4 30.0
Considered attempting suicideIN 8.5 12.8 16.9 18.0 17.3 16.9 15.2
Nation -- -- -- 18.2 18.3 17.7 16.3
Made a plan about attempting suicide
IN 6.1 9.8 13.0 13.9 12.7 12.2 10.9
Nation -- -- -- 15.0 15.4 13.9 13.8
Note. National data from the 2015 YRBS.
Gambling
As gambling options and venues in the state expand, monitoring the prevalence of gambling activities among children and adolescents is increasingly important for planning prevention efforts. All gambling-related questions asked about behavior and experiences in the past year. The Indiana Youth Survey included questions about playing cards, betting on games, betting on sports, buying lottery tickets, gambling in a casino, and playing online for money.
Gambling BehaviorThe gambling section now contains a brief explanatory introduction, which reads: “Gambling is playing a game in an attempt to win money (any amount) or something of value (like a video game, bike, iPod). You could gamble on a game or an event. Gambling means you don’t know if you will win or lose.”
The first question asked: “During the past 12 months, how often have you bet/gambled for money or valuables in the following ways? Gambling can be done in a variety of settings, including with family and friends.” The forms of gambling that were referred to in the survey are indicated in Table 19. The prevalence of many types of gambling was higher in younger grades than in older grades, or was relatively flat across grade levels. For instance, the prevalence rates of personal

Indiana Youth Survey 2016
32
games of skill, sports, Bingo, online gambling, and personal challenges were either higher for younger grades (7th, 8th, 9th) compared to older grades (10th, 11th, 12th) or relatively uniform across grades. The prevalence of card games, however, was lower for 7th grade and higher for older grades. Further, the survey identified a sharp increase in lottery gambling among students in 12th grade, who are most likely to be legally able to purchase lottery tickets. The prevalence of personal games of skill, sports, bingo, online gambling, personal challenges, and bet/gambled in other ways was higher for students in 8th grade compared to students in all other grade levels.
Table 19. Gambling behavior by Indiana adolescents in the past year (percentages)
Grade7 8 9 10 11 12
Card games 13.1 15.2 15.6 14.8 15.7 16.7
Personal games of skill 22.9 23.9 21.7 20.2 18.8 19.6
Sports 17.8 19.3 17.8 17.9 16.5 17.7
Lottery 9.8 11.3 10.9 10.8 11.3 25.9
Bingo 10.8 9.9 8.0 7.1 5.8 7.1
Online gambling 4.0 5.2 4.7 4.7 4.4 4.5
Personal challenges 26.0 28.8 26.4 23.7 22.2 22.0
Gambled in other ways 10.9 14.1 12.9 12.6 12.9 13.6
Figure 11. Prevalence rates of any gambling behavior, grades 7 to 12, expressed as a percentage

33
Report
It is possible to determine the overall prevalence of gambling behavior using the responses to the first question. A student who reported having bet/gambled money in at least one way during the past 12 months was considered to have gambled. Prevalence rates of past-year gambling among 7th- to 12th-grade students ranged from a low of 37.8% (11th grade) to a high of 44.9% (12th grade).
Consequences of GamblingThe second question asked: “How often have you experienced the following consequences due to your gambling?” The types of consequences listed in the survey are indicated in Table 20.
The prevalence rates of all consequences for students in 8th through 12th grades were higher than those for students in 7th grade. The prevalence of all consequences of gambling markedly increased among students in the 12th grade.
Table 20. Consequences of gambling by Indiana adolescents in the past year (percentages)
Grade7 8 9 10 11 12
Academic problems 21.2 24.2 22.8 22.3 22.4 26.1
Issues with the legal system 21.0 24.0 22.6 22.4 22.2 26.1
Lost possessions or money 21.7 24.8 23.4 22.9 22.9 26.8
Felt bad about gambling 21.1 24.0 22.7 22.4 22.4 26.3
Poor health 21.3 24.3 22.9 22.4 22.3 26.3
Issues with friends and family 22.1 24.8 23.3 22.9 22.6 26.5
Parental Deployment and IncarcerationResearch has demonstrated that parental military deployment places youth at increased risk for substance abuse (Fitzsimons & Krause-Parello, 2009) and mental health issues (Reed, Bell & Edwards, 2011). In addition, parental incarceration increases youth and adolescent risk for substance abuse and mental health problems (Murray, Farrington, Sekol & Olsen, 2009). The Indiana Youth Survey measured parental deployment and parental incarceration. The percentage of respondents who reported parental deployment and incarceration are shown in Table 21.

Indiana Youth Survey 2016
34
Table 21. Parental deployment and incarceration
Grade6 7 8 9 10 11 12
Parents served in a war zone
% 12.9 12.2 11.3 10.7 9.1 8.1 7.8
N 16,751 14,933 18,735 14,551 17,370 11,690 11,119
Parents served time in jail% 21.6 20.8 24.4 22.7 22.4 20.3 19.0
N 16,385 14,685 18,405 14,271 17,125 11,533 10,970
The percentages of youth who reported that one or more of their parents served in the military and in a war zone were highest in Grades 6 and 7 and declined steadily to Grade 12.
The percentages of youth who reported that a parent served time in jail or prison at any time in their life ranged across grade levels from a high of 24.4% in 8th grade to a low of 19.0% in 12th grade. These relatively high rates of youth that experience parental incarceration reflect in part a 41% increase between 2000 and 2008 in the growth of Indiana’s prison population (Pew Report, 2010). Of persons in Indiana who entered prison in 2009, two thirds spent less than one year there (Indiana Department of Corrections, 2009).

35
Report
METHODOLOGY
The methodological history of the Indiana Youth Survey can be read in previous reports. All reports published since 1996 can be found at: www.INYS.indiana.edu.
Sample
The sampling frame of the Indiana Youth Survey is the universe of all Indiana school corporations and dioceses. The IPRC obtained from the Indiana Department of Education a list of names and addresses of principals and superintendents in all 1,421 public and nonpublic schools that serve 6th- through 12th-grade students in Indiana. In October 2015, invitation letters were sent to all school superintendents and principals. The invitation letters included information on:
• registration;• sample survey forms;• parental consent;• frequently asked questions;• administering a paper-and-pencil questionnaire or an online survey;• adding additional questions;
The corporations and dioceses had at least two months to register for the survey. In order to participate, a school or corporation was required to:
• identify a designated coordinator at each public school corporation or multiple coordinators if schools are scattered in several locations;
• describe its policy on parental consent;• identify its spring break period;• identify desired survey administration date(s) ;• identify whether the paper form or the online survey would be administered
and;• convey the number of students scheduled to participate in each grade level.
Schools were responsible for obtaining parental consent for students to participate in the Indiana Youth Survey. Information about whether a particular school or corporation by name has participated in any year may be released upon request from the community. However, school- or corporation-level results from the survey are released to third parties only with the explicit written permission of the school or corporation’s survey coordinator or other appropriate authority.

Indiana Youth Survey 2016
36
Participation
Since 1993, participation in the Indiana Youth Survey has been open to all Indiana school corporations, public and nonpublic. The number of usable surveys, shown in Table 22, has fluctuated from year to year. While it is not possible to explain all of the fluctuation, the causes are likely to include:
• The exclusion from participation of fifth-grade students since 1994;• The participation of some schools on biennial and triennial bases;• The arbitrary selection by some schools of the grade levels surveyed;• Variation in the interpretation of parental consent requirements and;• The growing length of the Indiana Youth Survey instrument.
Table 22. Number of usable surveys (1993-2016)
Year Usable Surveys Year Usable Surveys
1993 90,586 2005 136,782
1994 81,732 2006 120,914
1995 63,631 2007 158,632
1996 36,586 2008 152,732
1997 72,571 2009 182,496
1998 44,232 2010 169,059
1999 81,685 2011 152,678
2000 72,523 2012 127,061
2001 89,861 2013 117,554
2002 77,068 2014 119,147
2003 141,342 2015 111,5852004 91,577 2016 107,801
The rates of participation for school corporations, schools and students statewide, and for each FSSA Planning Region, are shown in Table 23. ‘Rate of participation’ is the proportion of corporations, schools and students scheduled to participate in the survey out of the entire student population. There is wide variation in rates of participation across regions. The South West Region had the highest rates of participation among corporations (75.0%), schools (61.7%), and students (44.0%). The North East Region had the lowest rates of participation among corporations (17.2%), schools (6.7%), and students (4.8%).

37
Report
Table 23. Participation rates for students, schools, and corporations by region
State NorthWest
NorthCentral
NorthEast West Central East South
WestSouth
East
Students
Participants 107,801 18,120 12,693 2,459 7,715 20,997 12,212 17,528 16,077
Total Population 556,525 65,497 79,937 51,344 51,337 177,835 29,649 39,844 61082
Participation Rate1 19.4 27.7 15.9 4.8 15.0 11.8 41.2 44.0 26.3
Schools
Participants 398 47 49 9 29 77 36 79 72
Total Population 1,421 150 212 134 145 348 133 128 171
Participation Rate2 28.0 31.3 23.1 6.7 20.0 22.1 27.1 61.7 42.1
Corporations
Participants 147 20 19 5 12 22 20 24 25
Total Population 370 46 50 29 41 86 45 32 44
Participation Rate3 39.7 43.5 38.0 17.2 29.3 25.6 44.4 75.0 56.8
1 The percentage of student participants out of the total population, Grades 6 to 12.2 The percentage of schools that participated out of the total population of schools.3 The percentage of school corporations that participated out of the total population of school corporations.
Administration of the Survey
Two weeks before the designated survey date, the IPRC mailed to participant schools using the paper questionnaires a packet containing:
• the machine-readable survey forms;• return shipping labels through the FedEx Package Return Program;• written instructions for administering the survey, and• a 6.44 minute survey administration training DVD produced by the IPRC.
Participant schools using the online questionnaires were e-mailed the written instructions for administering the survey and a link to the survey administration training DVD.
The training video describes and demonstrates for school personnel each step of administering the survey to a group of students. The video and the written instructions were provided to improve the consistency of cross-site survey administration. The video is also available for download at www.INYS.indiana.edu.
The written or video documentation included the following instructions for school

Indiana Youth Survey 2016
38
personnel who administered the survey:
1. Inform students that:
• their participation in the survey is completely voluntary,• the results are confidential, and• there are no penalties for deciding not to participate or for not responding to
specific items. 2. Students will need about 30 minutes to complete the survey.
3. Remain seated while students fill out the survey.
4. Instruct the students that, when they complete the paper survey, they should place their survey forms into the single envelope that the IPRC has provided and which is labeled with a school and classroom code.
5. For the online survey, set up the computer lab as if you were administering the ISTEP+ test.
6. For the online survey, write the following web address and special School Code and Passcode on the blackboard or another visible place.
Website: www.INYS.indiana.eduSchool Name School Code (8 digits) Passcode (4 digits)
School 05050001 8371School 05050002 8371School 05050003 8371School 05050005 8371
7. Make sure that all students have access to the survey website.
Indiana Youth Survey staff members are available to provide support and answer questions through a toll-free 800 telephone number from Monday through Friday. Schools had a ten-week window to administer the surveys between January 25 and April 1, 2016 and were asked to return the paper questionnaires immediately to the IPRC.
Survey Instrument
Origin and Relevance of the QuestionsYear-to-year changes in the Indiana Youth Survey instrument are documented in the reports corresponding to the years in which they occur. In general, survey items have been derived from a variety of sources for purposes of comparability with national and other state survey data. All items use multiple choice response options.

39
Report
The mental health items pertaining to feeling sad and hopeless and to suicidal behaviors have their origin in the YRBS (CDC, 2014). The items on parental service in the military and incarceration are modified from the Behavioral Risk Factor Surveillance System (CDC, 2011).
Alcohol and drug use prevalence items were based on those in the MTF (Johnston, Bachman, & O’Malley, 1989), conducted by the University of Michigan. The Indiana Youth Survey asked respondents in Grades 7 to 12 about their use of 15 different types of drugs or drug classifications and one fake drug, Vivoxiline, which was added to facilitate the error-check protocol (see the Indiana Youth Survey instrument in the appendix). Students in 6th grade were asked about their use of six different types of drugs or drug classifications and the fake drug Vivoxiline. In some instances, examples and/or slang descriptions appeared in parentheses next to the name of the drug or drug classification. The purpose of this was to elicit responses about the use of a single substance that might be a common ingredient in multiple products (i.e., alcohol in beer, wine, and liquor) or that might have multiple common names, some of them distributed geographically within the state. Other examples include “MDMA,” “Molly” and “X” for ecstasy, and “meth,” “crank,” and “crystal” for methamphetamine.
Prevalence of alcohol, tobacco, and a variety of other drug use is a primary focus of the Indiana Youth Survey. Prevalence refers to the rate of total cases of a condition in a population. For the Indiana Youth Survey, three types of prevalence data were collected for ATOD use. Definitions for the various prevalence-of-use measures used in this report are listed below.
Lifetime prevalence: the Indiana Youth Survey asked the question ‘At what age did you first use….’ for each of the fifteen (7th to 12th grade) or six (6th grade) substances in the survey. One response option for each substance was ‘Never Used.’ Lifetime prevalence for each substance can be calculated as binary data, with all individuals reporting any age of initiation effectively reporting lifetime use of that substance, and those reporting ‘Never Used’ effectively reporting no lifetime use.
Current use or monthly prevalence: the percentage of respondents who reported using a particular substance at least once in the 30 days prior to the administration of the survey.
Binge drinking prevalence: the percentage of respondents who reported drinking at least five alcoholic drinks in a row in the two weeks prior to administration of the survey.
The item set for age of first use is similar to that in the National Household Survey on Drug Abuse. However, in the Indiana Youth Survey, these items feature closed-ended response options. The ‘access to alcohol’ items have origins in the YRBS.

Indiana Youth Survey 2016
40
The ‘perceived risk of harm’ items have origins in both MTF and the National Survey on Drug Use and Health. They are performance measurement requirements for SAMHSA Drug-Free Communities (DFC) Support Program grantees, with some of them comprising a Communities that Care (CTC) risk factor scale. The ‘perceived parental disapproval’ and ‘perceived peer disapproval’ items also are required by DFC grantees. Some of the parental disapproval items make up two separate CTC risk factor scales.
Other items from the CTC Survey (SAMHSA, 2009) belong to one of four categories of influence: Family, Community, Peer-Individual, and School. An example of an item from the Family category is, “How wrong do your parents feel it would be for you to drink beer, wine or hard liquor (vodka, whiskey, or gin) regularly (at least once or twice each month)?” An item from the Community category is, “How easy is it to get cigarettes, smokeless tobacco, cigars, or other tobacco products?” An item from the Peer-Individual category is, “What are the chances you would be seen as cool if you smoked marijuana?” An example from the School category is, “How important do you think the things you learn in school are going to be for you later in life?”
The Indiana Youth Survey originally added gambling items in 2005. Those core items were taken from the Minnesota Student Survey (Stinchfield, Kushner, & Winters, 2005; Winters & Anderson, 2000). In 2015, the Indiana Problem Gambling Awareness Program provided updated questions that more specifically addressed the needs of problem gambling prevention in Indiana.
Data
The IPRC entered the Indiana Youth Survey data from the paper questionnaires in-house using Pearson optical scanner equipment. The data were cleaned using multiple criteria. A survey could be eliminated from the analysis for either eight (6th grade) or nine (7th through 12th grades) reasons, which are described on the subsequent pages. Tables 24 and 25 show the frequency and proportion of surveys eliminated for these reasons.

41
Report
Table 24. Reasons for excluding respondents from the analysis for 6th grade students
Paper Online TotalN % N % N %
Rejected questionnaires Blank surveys/Refused to participate 90 1.2 29 0.3 119 0.7
Not truthfully at all response 46 0.6 57 0.6 103 0.6 Indicated fictitious drug (vivo) use 39 0.5 34 0.3 73 0.4 Rejected by gender check 191 2.5 37 0.4 228 1.3 Rejected by grade check 96 1.2 90 0.9 186 1.0 Rejected by age and onset age check 4 0.1 14 0.1 18 0.1
Rejected by consistent use check 0 0.0 1 0.0 1 0.0 Rejected by dose check 0 0.0 1 0.0 1 0.0
Total number of usable questionnaires 7,249 94.0 10,083 97.5 17,332 96.0
Total 7,715 100.0 10,346 100.0 18,061 100.0
Table 25. Reasons for excluding respondents from the analysis for 7th - 12th grade students
Paper Online TotalN % N % N %
Rejected questionnaires Blank surveys/Refused to participate 2,370 5.3 116 .2 2,486 2.5
Not truthfully at all response 700 1.6 785 1.5 1,485 1.5 Indicated fictitious drug (vivo) use 645 1.4 592 1.1 1,237 1.3 Rejected by gender check 797 1.8 163 .3 960 1.0 Rejected by grade check 367 0.8 222 .4 589 0.6 Rejected by grade and age check 50 0.1 110 .2 160 0.2 Rejected by age and onset age check 38 0.1 51 .1 89 0.1
Rejected by consistent use check 0 0.0 1 .0 1 0.0 Rejected by dose check 26 0.1 30 .1 56 0.1
Total number of usable questionnaires 39,806 88.9 50,663 96.1 90,469 92.8
Total 44,799 100.0 52,733 100.0 97,532 100.0
The following criteria were used to clean the 2016 Indiana Youth Survey. As noted, eight conditions were used to clean the 6th grade data, and a ninth condition (Implausible Age and Grade Combination) was used to clean the 7th to 12th grade survey.
Condition 1: Blank Surveys

Indiana Youth Survey 2016
42
6th Grade Instrument: There were a total of 80 questions on the 6th grade instrument, including five questions that asked about students’ demographic information. Cases where students provided five or fewer responses out of 80 were eliminated from the data analyses.
7th to 12th Grade Instrument: There were a total of 161 questions on the 7th to 12th grade instrument, including five questions that ask about students’ demographic information. Cases where students provided five or fewer responses out of 161 were eliminated from the data analyses.
Condition 2: Truthfulness
The final item of both survey instruments asked students, “How truthfully have you answered these questions?” The response options for this question were, (a) Not truthfully at all; (b) Somewhat truthfully, and (c) Completely truthfully. Cases where students responded ‘Not truthfully at all’ were eliminated from the analyses. Additional details about the regional distribution of responses to this question are located in Table 26. Variation ranging from 0.8% to 1.7% was observed cross-regionally in terms of students who responded that they did not complete the instrument truthfully at all.
Table 26. Response to item on truthful completion of the Indiana Youth Survey by region
RegionNo Answer
Not Truthfully at all
Somewhat Truthfully
Completely Truthfully Total
N % N % N % N % NNorthwest 3,139 15.8 330 1.7% 2,327 11.7 14,112 70.9 19,908
North Central 1,856 13.7 180 1.3% 1,381 10.2 10,142 74.8 13,559
Northeast 260 10.2 26 1.0% 258 10.1 2,011 78.7 2,555
West 791 9.9 66 .8% 776 9.8 6,323 79.5 7,956
Central 4,373 19.1 311 1.4% 2,106 9.2 16,091 70.3 22,881
East 2,569 19.2 177 1.3% 1,162 8.7 9,440 70.7 13,348
Southwest 2,125 11.5 260 1.4% 1,715 9.2 14,442 77.9 18,542
Southeast 1,937 11.5 249 1.5% 1,761 10.5 12,897 76.6 16,844
Total 17,050 14.8 1,599 1.4% 11,486 9.9 85,458 73.9 115,593
Condition 3: Vivoxiline (Vivo) Use
There were two items on both survey instruments that asked about “Vivoxiline (Vivo) use”: during the past 30 days and age of first use. The drug is fictitious and was created to check the validity of students’ responses. Cases where students reported any use were eliminated from the data analyses.

43
Report
Condition 4: Missing Gender Information
Cases where students did not provide an answer to the gender question were eliminated from the data analyses.
Condition 5: Missing or Invalid Grade Information
6th Grade Instrument: Cases where students reported being in 5th, 7th, or 8th grade were eliminated from the data analyses, as were cases where students did not provide an answer to the grade question.
7th to 12th Grade Instrument: Cases where students reported being in 6th grade were eliminated from the data analyses, as were cases where students did not provide an answer to the grade question.
Condition 6: Implausible Age and Grade Combination
7th to 12th Grade Instrument (Only): Cases where a student’s combination of grade and age were implausible (e.g., a 10-year-old in the 12th grade) were eliminated. The following ranges were considered plausible:
• 7th grade: 11 through 15 years old;• 8th grade: 12 through 16 years old;• 9th grade: 13 through 17 years old;• 10th grade: 14 through 18 years old;• 11th grade: 15 years or older;• 12th grade: 16 years or older.
Condition 7: Implausible Age and Onset Age Combination
If a student indicated an age of first use for any substance that was higher than the student’s current age, that case was eliminated from the analyses.
Condition 8: Substance Use Inconsistencies
6th Grade Instrument: The consistency of responses between 30-day use and age of first use of substances was checked. There were six substances that were queried for both 30-day use and age of first use: cigarettes, alcohol, marijuana, inhalants, prescription drugs, and other illegal drugs. Responses were considered inconsistent if students answered “never” to age of first time use of a substance, but indicated use of the substance in the past month.
Surveys with four or more inconsistent responses were eliminated from the data analyses. Surveys with fewer than four inconsistencies were kept in the dataset but the inconsistent responses were set to missing.

Indiana Youth Survey 2016
44
7th to 12th Grade Instrument: The consistency of responses between 30-day use and age of first use of substances was checked. There were 15 substances that were queried for both 30-day use and age of first use: cigarettes, smokeless tobacco, cigars, pipe, electronic cigarettes, alcohol, marijuana, synthetic marijuana, cocaine/crack, inhalants, methamphetamine, heroin, hallucinogens, prescription drugs, and over-the-counter drugs. Responses were considered inconsistent if students answered “never” to age of first time use of a substance, but indicated use of the substance in the past month.
In addition, the consistency of responses among binge drinking, 30-day use, and age of first use of alcohol was checked. If a student reported binge drinking in the past two weeks, but reported “0 occasions” of 30-day alcohol use or responded “never” to age of first use of alcohol, the response was considered inconsistent.
Surveys with 12 or more inconsistent responses were eliminated from the data analysis. Surveys with fewer than 12 inconsistencies were kept in the dataset but the inconsistent responses were set to missing.
Condition 9: Pharmacological Implausibility
6th Grade Instrument: The over-reporting of substance use was examined through patterns of responses that are pharmacologically implausible. Past-month use of the following substances was examined: alcohol, marijuana, inhalants, prescription drugs, and other illegal drugs (cigarettes were not included). Cases where students reported using a substance “40 times or more” for three or more substances were eliminated from data analyses.
7th to 12th Grade Instrument: The over-reporting of substance use was examined through patterns of responses that are pharmacologically implausible. Past-month use of ten substances was examined (cigarettes, smokeless tobacco, cigars, pipe, and electronic cigarettes were not included). Cases where students reported using a substance “40 times or more” for five or more substances were eliminated from data analyses. Further, cases where the summed score from all ten substance use questions exceeded 28 were not included in the data analyses (where 0=never; 1=1-5 times; 2=6-19 times; 3=20-39 times; 4=40+ times).
DemographicsRespondent demographics are shown in Table 27 according to gender, race/ethnicity and grade level. Respondents were asked separate questions about race and Hispanic ethnicity. To facilitate statistical tests of differences among categories, we combined these results to create four categories: Non-Hispanic White or Caucasian, Non-Hispanic Black or African-American, Hispanic Ethnicity (any race), and Other.
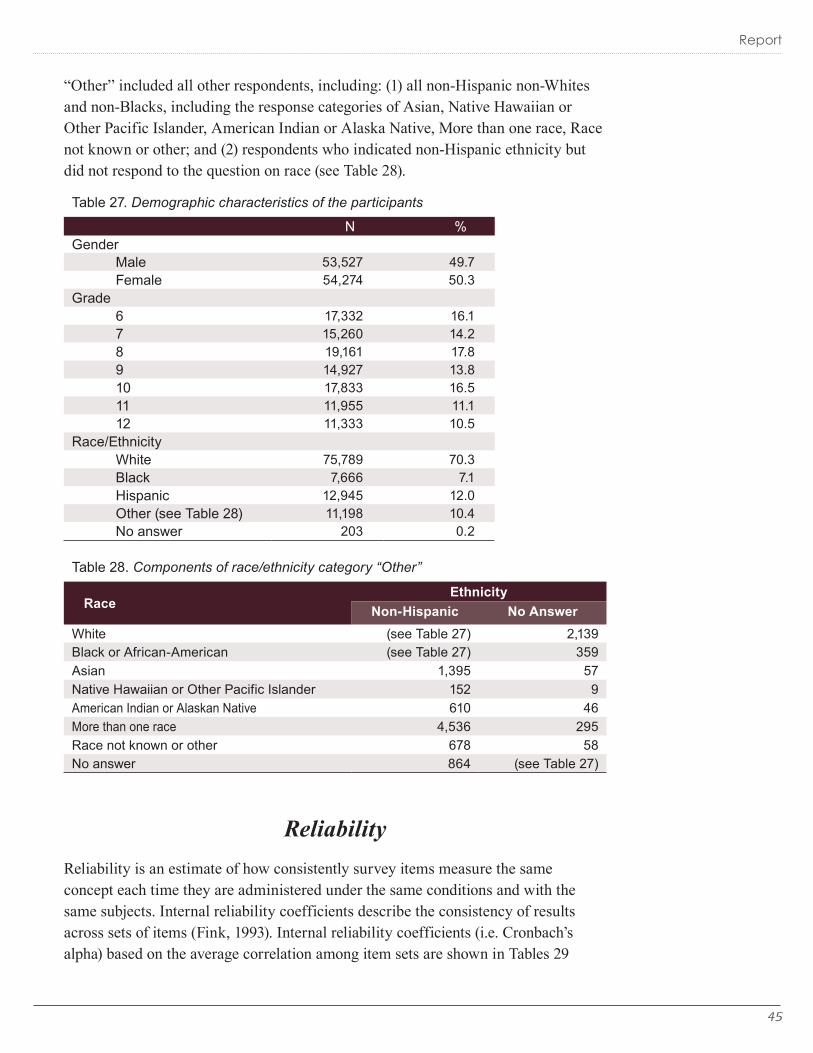
45
Report
“Other” included all other respondents, including: (1) all non-Hispanic non-Whites and non-Blacks, including the response categories of Asian, Native Hawaiian or Other Pacific Islander, American Indian or Alaska Native, More than one race, Race not known or other; and (2) respondents who indicated non-Hispanic ethnicity but did not respond to the question on race (see Table 28).
Table 27. Demographic characteristics of the participants
N %Gender
Male 53,527 49.7Female 54,274 50.3
Grade6 17,332 16.17 15,260 14.28 19,161 17.89 14,927 13.810 17,833 16.511 11,955 11.112 11,333 10.5
Race/EthnicityWhite 75,789 70.3Black 7,666 7.1Hispanic 12,945 12.0Other (see Table 28) 11,198 10.4No answer 203 0.2
Table 28. Components of race/ethnicity category “Other”
RaceEthnicity
Non-Hispanic No AnswerWhite (see Table 27) 2,139Black or African-American (see Table 27) 359Asian 1,395 57Native Hawaiian or Other Pacific Islander 152 9American Indian or Alaskan Native 610 46More than one race 4,536 295Race not known or other 678 58No answer 864 (see Table 27)
ReliabilityReliability is an estimate of how consistently survey items measure the same concept each time they are administered under the same conditions and with the same subjects. Internal reliability coefficients describe the consistency of results across sets of items (Fink, 1993). Internal reliability coefficients (i.e. Cronbach’s alpha) based on the average correlation among item sets are shown in Tables 29

Indiana Youth Survey 2016
46
and 30. Alpha coefficients range in value from 0 to 1. The higher the score is, the more reliable the item sets are. Nunnally (1978) has indicated 0.7 to be an acceptable reliability coefficient, and many researchers require at least 0.8 for a “good scale.” Based on these criteria, the internal reliability of the risk and protective factor item sets contained in the Indiana Youth Survey ranges from acceptable to excellent. The 6th grade survey had lower internal reliability than the 7th to 12th grade survey. Three scales on the 6th grade survey had slightly lower than acceptable internal reliability ratings, including family opportunities for prosocial involvement, school opportunities for prosocial involvement, and interaction with prosocial peers. However, all of those scales had Cronbach’s alpha ratings higher than .650. At the same time, only one scale on the 7th to 12th grade survey, low school commitment, had lower than acceptable internal reliability (i.e., .659). This indicates that the item sets are generally consistent measures of the risk and protective factor concepts in the Indiana Youth Survey.
Table 29. Internal reliability of item sets for the 6th grade survey
Item Set Example Question Wording Number of Items
Cronbach's Alpha
Perceived Peer Disapproval How do you think your close friends feel (or would feel) about you doing each of the following things? 4 .817
Poor Family Management The rules in my family are clear. 8 .752
Family Conflict We argue about the same things in my family over and over. 3 .787
Parental Attitudes Favorable to Drug Use How wrong do your parents feel it would be for you to… 3 .700
Perceived Risk of Drugs How much do you think people risk harming themselves (physically or in other ways) if they… 6 .898
Community Rewards for Proso-cial Involvement My neighbors notice when I am doing a good job and let me know. 3 .891
Family Opportunities for Proso-cial Involvement
My parents ask me what I think before most family decisions affecting me are made. 3 .650
Family Rewards for Prosocial Involvement Do you enjoy spending time with your mother? 4 .715
School Opportunities for Pro-social Involvement
In my school, students have lots of chances to help decide things like class activities and rules. 5 .699
School Rewards for Prosocial Involvement
My teacher(s) notices when I am doing a good job and lets me know about it. 4 .734
Interaction with Prosocial Peers
Think of your four best four friends (the friends you feel closest to). In the past year (12 months), how many of your best friends have … 5 .695
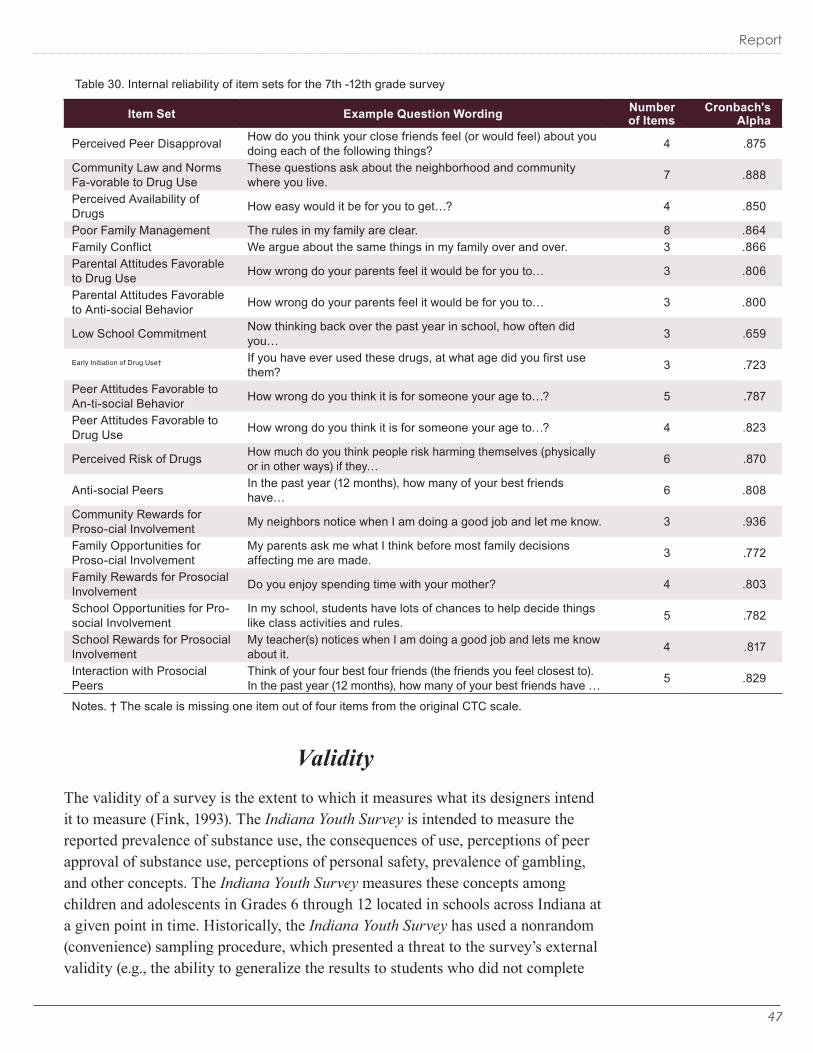
47
Report
Table 30. Internal reliability of item sets for the 7th -12th grade survey
Item Set Example Question Wording Number of Items
Cronbach's Alpha
Perceived Peer Disapproval How do you think your close friends feel (or would feel) about you doing each of the following things? 4 .875
Community Law and Norms Fa-vorable to Drug Use
These questions ask about the neighborhood and community where you live. 7 .888
Perceived Availability of Drugs How easy would it be for you to get…? 4 .850
Poor Family Management The rules in my family are clear. 8 .864Family Conflict We argue about the same things in my family over and over. 3 .866Parental Attitudes Favorable to Drug Use How wrong do your parents feel it would be for you to… 3 .806
Parental Attitudes Favorable to Anti-social Behavior How wrong do your parents feel it would be for you to… 3 .800
Low School Commitment Now thinking back over the past year in school, how often did you… 3 .659
Early Initiation of Drug Use† If you have ever used these drugs, at what age did you first use them? 3 .723
Peer Attitudes Favorable to An-ti-social Behavior How wrong do you think it is for someone your age to…? 5 .787
Peer Attitudes Favorable to Drug Use How wrong do you think it is for someone your age to…? 4 .823
Perceived Risk of Drugs How much do you think people risk harming themselves (physically or in other ways) if they… 6 .870
Anti-social Peers In the past year (12 months), how many of your best friends have… 6 .808
Community Rewards for Proso-cial Involvement My neighbors notice when I am doing a good job and let me know. 3 .936
Family Opportunities for Proso-cial Involvement
My parents ask me what I think before most family decisions affecting me are made. 3 .772
Family Rewards for Prosocial Involvement Do you enjoy spending time with your mother? 4 .803
School Opportunities for Pro-social Involvement
In my school, students have lots of chances to help decide things like class activities and rules. 5 .782
School Rewards for Prosocial Involvement
My teacher(s) notices when I am doing a good job and lets me know about it. 4 .817
Interaction with Prosocial Peers
Think of your four best four friends (the friends you feel closest to). In the past year (12 months), how many of your best friends have … 5 .829
Notes. † The scale is missing one item out of four items from the original CTC scale.
ValidityThe validity of a survey is the extent to which it measures what its designers intend it to measure (Fink, 1993). The Indiana Youth Survey is intended to measure the reported prevalence of substance use, the consequences of use, perceptions of peer approval of substance use, perceptions of personal safety, prevalence of gambling, and other concepts. The Indiana Youth Survey measures these concepts among children and adolescents in Grades 6 through 12 located in schools across Indiana at a given point in time. Historically, the Indiana Youth Survey has used a nonrandom (convenience) sampling procedure, which presented a threat to the survey’s external validity (e.g., the ability to generalize the results to students who did not complete

Indiana Youth Survey 2016
48
the survey). A nonrandom procedure was used because a longstanding priority of the Indiana Youth Survey has been to provide local level data to any and all schools or school corporations that request it. While the results reported in this section should be interpreted with this consideration in mind, this year, for the first time, the IPRC also administered the Indiana Youth Survey to a random sample of schools. Those results are reported in a subsequent section and provide data that more readily can be generalized to the entire state. The randomly-sampled data are reported separately because they are not appropriate for the type of trend analyses provided in this section of the monograph. Importantly, in 2016, there was a very high level of agreement between the results produced by the random sample and the nonrandom sample.
To the extent that school districts have obtained information from every student in a particular grade level, the local results represent those community populations. In this respect, participating school districts can examine their own student response rates and decide how representative their survey data are for their local youth population. Formula 1 shows how the student response rate may be calculated from data in the local report provided to each participating school or school district.
Formula 1 Response Rate = (Number of Respondents / Total Number of Students) x 100
Where “Number of Respondents” is the number of students who completed and turned the survey in, and where “Total Number of Students” is the number of students whom the school corporation intended to survey.
If the response rate is 90% or greater, then the district level results (not shown in this report) are likely to be representative of the local student population.
At the sub-state regional levels, the ability to generalize the data is much lower because many school districts, and therefore many children and adolescents in the regional populations, did not participate in the Indiana Youth Survey. As shown in Table 23, only 4.8 to 44.0 percent of students participated in the Indiana Youth Survey across regions. The best approach to address this limitation is to assess the extent to which the samples of student respondents compare to the entire population of students in each region. This comparison of regional respondents and the population is shown by gender, ethnicity, race, and grade level in Table 31. Although this comparison does not provide a basis for generalizing results at the regional level, it provides guidance on where the data do and do not coincide proportionally with demographic subgroups in the regional populations.
As shown in Table 31, the majority of samples either under or over-represent the proportions of students by gender, ethnicity, race, or grade level in a region. For

49
Report
example, in the North Central region, females are overrepresented in the Indiana Youth Survey sample and White students are underrepresented. This means that the sample from this region has proportionally more females and fewer White students than the North Central region as a whole, and these biases should be taken into consideration when interpreting the results of the Indiana Youth Survey data. Likewise, for example, the overall sample has proportionally fewer White students than in the Indiana population of 6th- through 12th-grade students.
Table 31. Regional comparison of samples and population by demographics
Indiana Northwest Northcentral Northeast West Pop. Sample Pop. Sample Pop. Sample Pop. Sample Pop. Sample
Gender Male 51.0 49.7 * 51.1 49.7 * 51.2 49.3 * 50.9 49.4 51.1 51.4Female 49.0 50.3 * 48.9 50.3 * 48.8 50.7 * 49.1 50.6 48.9 48.6
Race/Ethnicity#
White 71.2 70.4 * 55.8 50.5 * 69.7 66.6 * 73.4 82.7 * 81.8 75.8 *Black 12.0 7.1 * 20.1 17.1 * 9.1 4.6 * 9.3 0.9 * 3.6 2.3 *Hispanic 10.2 12.0 * 19.5 20.2 * 14.6 18.4 * 9.3 8.3 8.5 11.6 *Other 6.7 10.4 * 4.5 12.2 * 6.6 10.4 * 8.0 8.1 6.1 10.3 *
Grade6 14.1 16.1 * 14.1 14.2 14.2 14.6 13.9 16.8 * 14.1 16.9 *7 13.9 14.2 * 13.7 10.4 * 13.8 13.1 * 14.3 15.6 14.0 17.4 *8 14.2 17.8 * 14.2 16.3 * 14.0 20.9 * 14.5 22.3 * 14.5 19.0 *9 15.3 13.8 * 15.4 15.6 15.0 13.6 * 15.0 8.8 * 15.4 10.6 *10 14.6 16.5 * 14.7 19.1 * 14.6 17.3 * 14.2 10.7 * 14.4 16.7 *11 14.4 11.1 * 14.0 12.3 * 14.8 9.5 * 14.3 19.2 * 14.7 10.6 *12 13.5 10.5 * 13.9 12.2 * 13.6 11.0 * 13.8 6.6 * 12.9 8.8 *
Indiana Central East Southwest Southeast Pop. Sample Pop. Sample Pop. Sample Pop. Sample Pop. Sample
Gender Male 51.0 49.7 * 50.7 49.2 * 51.7 49.9 * 51.3 49.6 * 51.0 49.6 *Female 49.0 50.3 * 49.3 50.8 * 48.3 50.1 * 48.6 50.4 * 49.0 50.4 *
Race/Ethnicity#
White 71.2 70.4 * 62.8 65.8 * 85.4 71.1 * 85.1 83.4 * 87.2 82.9 *Black 12.0 7.1 * 19.3 11.0 * 5.3 8.1 * 5.3 1.4 * 3.1 1.5 *Hispanic 10.2 12.0 * 9.8 11.4 * 3.2 8.7 * 3.2 7.0 * 4.8 7.5 *Other 6.7 10.4 * 8.1 11.8 * 6.1 12.1 * 6.1 8.2 * 4.9 8.0 *
Grade6 14.1 16.1 * 14.2 18.8 * 14.3 16.1 * 14.3 17.9 * 13.7 13.37 13.9 14.2 * 13.9 13.0 * 13.7 14.6 * 14.3 18.0 * 13.7 14.4 *8 14.2 17.8 * 14.2 15.3 * 14.4 15.8 * 14.2 18.4 * 14.1 19.8 *9 15.3 13.8 * 15.3 14.6 * 15.5 15.3 15.4 13.7 * 15.5 12.4 *10 14.6 16.5 * 14.4 17.1 * 14.7 16.0 * 14.4 13.3 * 15.2 17.1 *11 14.4 11.1 * 14.5 11.9 * 14.1 12.3 * 14.1 9.6 * 14.4 9.7 *12 13.5 10.5 * 13.4 9.2 * 13.2 9.9 * 13.4 9.1 * 13.5 13.3
* The sample is significantly different from the population (p<.05).# Missing responses are not included in calculations of the percentages for the sample.

Indiana Youth Survey 2016
50
The strength of this section of the Indiana Youth Survey is that it collects and reports valid and reliable data for local school corporations. At the state level, the data has the same degree of reliability. However, according to sampling theory, the state-level data in this section are less valid (Levy & Lemeshow, 2003). This tradeoff reflects the state’s current priorities for serving the substance use prevention needs of local communities. At the same time, statewide results from the Indiana Youth Survey and the newly-collected random sample within the survey have a high degree of concurrence. Due to this level of agreement, it is reasonable to compare the statewide Indiana Youth Survey data with national survey results. Furthermore, the level of agreement between the convenience sample data and random sample data at the state level reinforces our confidence in the validity of Indiana Youth Survey data for this and previous years of administration.

51
Report
HOW TO INTERPRET THE RESULTS
Comparison of Regional DataFor the regional data tables, the symbols ▲ or ▼ are used to indicate statistically significant regional differences in prevalence of use compared to the entire state. The ▲ symbol indicates that the regional rate is higher than the state rate, and the ▼ symbol indicates that the regional rate is lower than the state rate.
Generalizing Local Indiana Youth Survey Data to Local Populations
The IPRC provides each participant school corporation with a local report of the Indiana Youth Survey results from its district. This section describes the method for estimating how well local data applies to local populations. The IPRC strongly encourages school corporations to share the results of this analysis with citizens and organizations engaged in local surveillance and planning.
The Response RateThe response rate estimates how well the local results of the Indiana Youth Survey describe all the youth in a grade or grades, in a school or schools, or in an entire school corporation.
If the response rate is 90 percent or greater, then the results are likely to be representative of the population defined. If the response rate is lower than 90 percent, the results should be interpreted cautiously. In this case, the results might not be representative of students who were absent the day the survey was administered or of those who did not turn in a survey.
In any case, results do not generalize to those whose responses the IPRC systematically excluded from tabulation (see the “Data” section, above, for details).
The IPRC is unable to calculate the response rate for individual localities because one of the components of the response rate depends on information not collected along with the survey. This information, the Total Number of Students, is explained below.
Two pieces of information are required to calculate the response rate: “the total number of students” and “the total number of respondents.”

Indiana Youth Survey 2016
52
The Total Number of Students
The total number of students can only be determined by each school district.
The total number of students is the number of students that the school district intended to survey. For instance, if the intention was to survey all 9th- and 10th-grade students in all schools then the total enrollment number in Grades 9 through 10 would constitute the total number of students.
Total Number of Respondents
Local reports of the Indiana Youth Survey issued to participating school corporations include a table similar to Table 32. The asterisk (*) in Table 32 illustrates where to locate the total number of respondents.
Table 32. Sample Table from Local Report
Frequency Percent
Rejected questionnaires Blank surveys/Refused to participate
Not truthfully at all response
Indicated fictitious drug (vivo) use
Rejected by gender check
Rejected by grade check
Rejected by grade and age check
Rejected by age and onset age check
Rejected by consistent use check
Rejected by dose check
Total Number of Usable Surveys
Total #,### * 100.0
Calculating the Response Rate
To determine the response rate for a locality, divide the Total Number of Respondents by the Total Number of Students and multiply the result by 100.
Response Rate = ( Number of
Respondents / Total Number of Students ) X 100
53
Report
Practical SignificanceThe local report contains a section titled Prevalence Rates for Alcohol, Tobacco and Other Drug Use. In this section the percentage of student participants who reported that they used specific drugs during the past month is presented. These rates are shown for the school district over a ten year period if such data are available.
Targeting prevention efforts at particular drugs might be appropriate even though local prevalence rates are not higher than those of the state. For instance, if sixth-grade students in a corporation had a prevalence rate similar to that of the state for a specific drug, but the rate itself was high, prevention or treatment programs might be needed for 6th-grade students.
Key points for interpreting prevalence rate results of the Indiana Youth Survey:
• Monthly prevalence is a general indicator of frequent or regular use of a drug.• “Prevalence” indicates any use of a drug within the specified time frame,
regardless of its severity or frequency within that time frame (for example, any use of marijuana in one’s lifetime could be one time or two hundred times). Use monthly prevalence rates in conjunction with detailed frequencies of use (for example, 1-5 times, 6-19 times, 20-40 times, more than 40 times) that are provided in tables in the Frequencies section at the back of a local report.
Indiana Youth Survey 2016
54
STATEWIDE RANDOM SAMPLE
This year, for the first time, the Indiana Youth Survey conducted a randomly-sampled survey alongside the annual survey. This methodology produces data that more confidently can be generalized to (e.g., assumed to be true for) the youth population of Indiana as a whole (Kelley, Clark, Brown, & Sitzia, 2003). This section explains how the data were collected for the random sample, and then highlights selected findings and the extent to which data from the random sample and the annual survey correspond.
Sampling MethodologyThere are a variety of ways in which random sampling can be accomplished. In this case, the sampling design was created based on recommendations from the Indiana University Center for Survey Research (CSR). These recommendations were developed based on standardized best practices in survey sampling, a comprehensive review of sample designs for 19 statewide substance use surveys conducted in the United States from 2002 to 2013, and extensive discussion and information sharing between CSR and the IPRC’s Survey Enhancement Team.
This section of the document addresses the target population, sampling frame, sampling method, and sample size determination.
Target Population: the target population is the group to which the survey is intended to be generalized. In other words, a randomly-sampled survey allows one to draw conclusions that are likely to be true about a group of individuals. The group that is selected is called the ‘target population.’ The following three bullet points outline the criterion for being part of the target population:
• The target population for the INYS probability sample was all currently-operating public schools in Indiana. It did not include private schools. It included charter schools but did not include other types of schools (e.g., vocational, corrections, special education). This is in line with the analytic objectives of the survey and practice in other statewide substance use surveys.
• Only students in 6th, 8th, 10th, and 12th grades were included in the target population. These grades were of primary interest in meeting the survey’s analytic goals.
• In line with common practice in school-based sampling, only schools with at least 15 students in at least one of the eligible grades (6th, 8th, 10th, and 12th) were included in the target population. Using 2014-15 data from the Indiana Department of Education (IDOE), we noted that there were few schools that
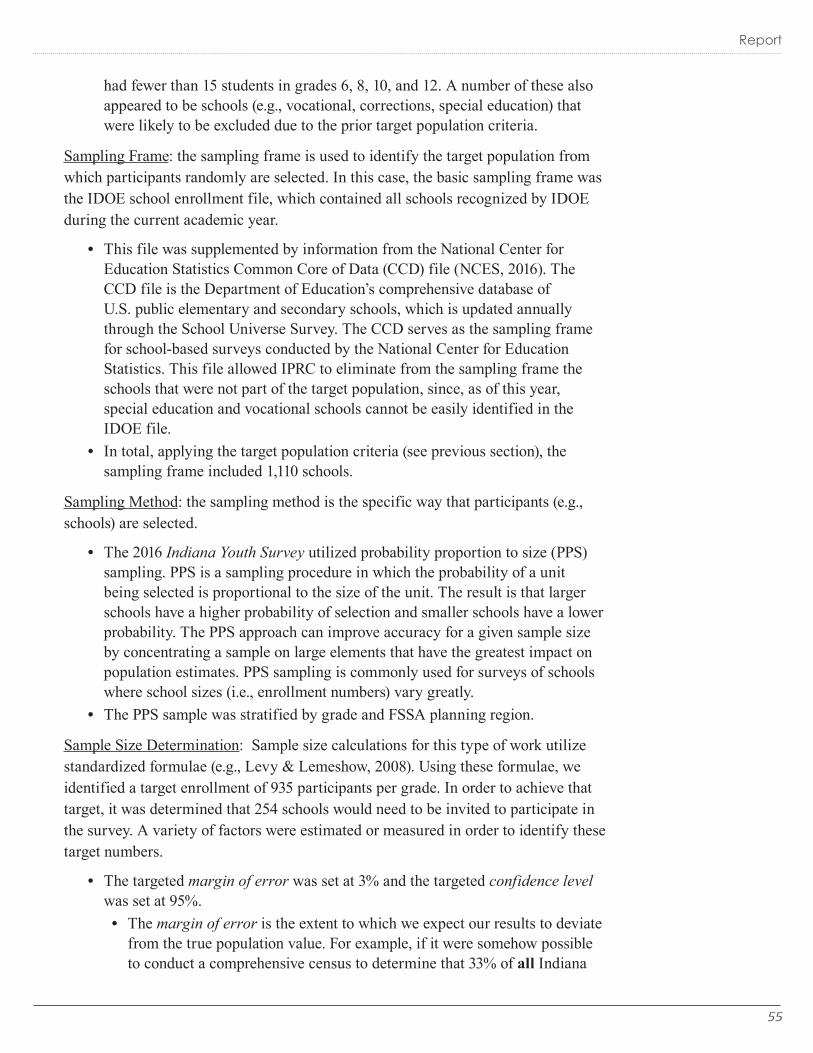
55
Report
had fewer than 15 students in grades 6, 8, 10, and 12. A number of these also appeared to be schools (e.g., vocational, corrections, special education) that were likely to be excluded due to the prior target population criteria.
Sampling Frame: the sampling frame is used to identify the target population from which participants randomly are selected. In this case, the basic sampling frame was the IDOE school enrollment file, which contained all schools recognized by IDOE during the current academic year.
• This file was supplemented by information from the National Center for Education Statistics Common Core of Data (CCD) file (NCES, 2016). The CCD file is the Department of Education’s comprehensive database of U.S. public elementary and secondary schools, which is updated annually through the School Universe Survey. The CCD serves as the sampling frame for school-based surveys conducted by the National Center for Education Statistics. This file allowed IPRC to eliminate from the sampling frame the schools that were not part of the target population, since, as of this year, special education and vocational schools cannot be easily identified in the IDOE file.
• In total, applying the target population criteria (see previous section), the sampling frame included 1,110 schools.
Sampling Method: the sampling method is the specific way that participants (e.g., schools) are selected.
• The 2016 Indiana Youth Survey utilized probability proportion to size (PPS) sampling. PPS is a sampling procedure in which the probability of a unit being selected is proportional to the size of the unit. The result is that larger schools have a higher probability of selection and smaller schools have a lower probability. The PPS approach can improve accuracy for a given sample size by concentrating a sample on large elements that have the greatest impact on population estimates. PPS sampling is commonly used for surveys of schools where school sizes (i.e., enrollment numbers) vary greatly.
• The PPS sample was stratified by grade and FSSA planning region.
Sample Size Determination: Sample size calculations for this type of work utilize standardized formulae (e.g., Levy & Lemeshow, 2008). Using these formulae, we identified a target enrollment of 935 participants per grade. In order to achieve that target, it was determined that 254 schools would need to be invited to participate in the survey. A variety of factors were estimated or measured in order to identify these target numbers.
• The targeted margin of error was set at 3% and the targeted confidence level was set at 95%. • The margin of error is the extent to which we expect our results to deviate
from the true population value. For example, if it were somehow possible to conduct a comprehensive census to determine that 33% of all Indiana

Indiana Youth Survey 2016
56
12th grade students drank alcohol in the past 30 days, and our randomly-sampled survey has a margin of error of 3%, then we would expect the survey to produce a result for that question between 30% and 36%, which is +/- 3% from the true value. Since it is not feasible to measure the total population, we never know the ‘true’ value. Instead, what we report is the value calculated by the survey, and the range (lower level and upper level) within which we are confident the true population value lies.
• The confidence level is the likelihood that the randomly-sampled survey will produce a range of values (the measured value +/- the margin of error) within which the true population value lies. A confidence level of 95% means that if we sample the same population 100 times, for 95 of those times the true value will be within the indicated margin of error.
• With a margin of error of 3% and a confidence level of 95%, we can conclude that there is a 95% chance that the true value of the entire population for any given question falls within 3 percentage points of the value reported by the randomly-sampled survey.
• Total number of students (state-wide) in the eligible grade (6th, 8th, 10th, or 12th) with the highest enrollment: 81,000.
• Estimate of interest: Past-30-day alcohol use (12th grade) was estimated to be 33.2% based on the results of the 2015 Indiana Youth Survey.
• Factor of sample size increase needed to account for design effect and loss due to weighting: 5 times.
• Percent of surveys failing to meet checks to be included in final survey dataset: 8%.
• Percent of students consenting and participating in survey at participating schools: 70%.
• Percent of sampled schools that would participate in survey: 40%.• Average number of students in all eligible grades per school: 284.• Given all of these assumptions and a total population of 1,110 schools, 254
schools were invited to participate, of which 113 did.

57
Report
Table 33. Target population according to region and eligible grades within the school (n=1,110)
NorthWest
NorthCentral
NorthEast West Central East South
WestSouth
East Total
6th only24 61 15 46 94 41 32 44 357
2.2% 5.5% 1.4% 4.1% 8.5% 3.7% 2.9% 4.0% 32.2%
6th or 8th38 52 34 33 90 28 32 38 345
3.4% 4.7% 3.1% 3.0% 8.1% 2.5% 2.9% 3.4% 31.1%
10th or 12th31 40 25 31 65 29 25 33 279
2.8% 3.6% 2.3% 2.8% 5.9% 2.6% 2.3% 3.0% 25.1%
6th or 8th & 10th or 12th16 17 9 18 21 16 14 18 129
1.4% 1.5% 0.8% 1.6% 1.9% 1.4% 1.3% 1.6% 11.6%
Total109 170 83 128 270 114 103 133 1110
9.8% 15.3% 7.5% 11.5% 24.3% 10.3% 9.3% 12.0% 100.0%
Table 34. Distribution of schools invited to participate in the 2016 Indiana Youth Survey random sample (n=254)
NorthWest
NorthCentral
NorthEast West Central East South
WestSouth
East Total
6th only5 14 3 9 22 9 7 10 79
2.0% 5.5% 1.2% 3.5% 8.7% 3.5% 2.8% 3.9% 31.1%
6th or 8th9 12 8 8 21 6 7 9 80
3.5% 4.7% 3.2% 3.2% 8.3% 2.4% 2.8% 3.5% 31.5%
10th or 12th7 9 6 7 15 7 6 8 65
2.8% 3.5% 2.4% 2.8% 5.9% 2.8% 2.4% 3.2% 25.6%
6th or 8th & 10th or 12th4 4 2 4 5 4 3 4 30
1.6% 1.6% 0.8% 1.6% 2.0% 1.6% 1.2% 1.6% 11.8%
Total25 39 19 28 63 26 23 31 254
9.8% 15.4% 7.5% 11.0% 24.8% 10.2% 9.1% 12.2% 100.0%
Data WeightingData weighting is a process whereby raw data are adjusted in such a way that they are better suited to generalization to the target population from which they are drawn. The specific data weighting processes utilized in the Indiana Youth Survey were based on methodologies developed by the United Nations (UN, 2005) and

Indiana Youth Survey 2016
58
Centers for Disease Control and Prevention (CDC, 2015). Unless otherwise noted, specific weighting formulae are drawn directly from the cited documents.
Response Rates: The primary sampling units (PSUs) for the INYS are schools.
School Response Rate = Number of Schools that ParticipatedX 100
Number of Eligible Schools Sampled
= 113X 100 = 44.5%
254
A total of 24,761 students were included in the data analyses.
Weighting Procedure: The weighting procedure began with generation of base weights. Schools were selected using probability proportional to size (PPS), with size defined as school enrollment size in the target grades. The school weight was based on the probability of selection for that school.
A base weight was calculated for each school as:
Base Weight for School = ∑ Measure of Size of All Schools in the Sampling FrameN*Measure of Size Assigned to School
Then, adjustments were made to the base weights to remove bias and reduce variability of the estimates. Three adjustments to the weights were made for the Indiana Youth Survey.
1. An adjustment to account for non-response by students in the sample.2. An adjustment to trim extremely large weights in order to limit the associated
variation in the weights.3. An adjustment to fine-tune the weighted sample estimates to known
population characteristics.
Each of these adjustments is summarized below.
The first adjustment was made at the student level and accounts for eligible students enrolled in sampled schools who did not turn in a usable survey for the following reasons:
• Students who did not receive parental consent.• Students who were absent on the day the survey was administered.• Students who refused to participate.• Students who failed the quality control (cleaning protocol) checks.
Weights of these non-responding students in sampled schools were given to responding students in the same grade in the same school. This non-response adjustment accounted for loss of sampled students in participating schools.

59
Report
Nonresponse Adjustmet = ∑ Eligible Sampled Students∑ Usable Surveys
The non-response weights were multiplied by the base weights.
The second adjustment was made to handle extremely large weights after adjusting for non-response weights. Although these extremely large weights affected only a small portion of sampled students, they would have caused a substantial increase in the variance of survey estimates. Therefore, we followed precedent outlined in similar data-weighting processes and trimmed extremely large weights to a maximum value. For the 2016 Indiana Youth Survey, the upper bound for the original weights was set at 20.0. Then, the entire set of weights for each stratum was re-scaled so that the sum of the trimmed weights was the same as that of the original weights.
The third adjustment was made to fine tune weighted sample proportions to known population proportions. Post-stratification was used to adjust the weights to two factors of population proportions: (1) race-ethnicity and (2) grade by gender. Population proportions were obtained from the Indiana Department of Education using school enrollment tabulations.
Before post-stratification was conducted, three strata with no participating schools were collapsed into the strata within the same region. As a result, Northeast region has only one stratum. In addition, one stratum in the Central region had too few participants. This stratum was divided and then merged into two other strata in the same region proportional to the population size by race-ethnicity and by grade levels.
The first stratification factor was race-ethnicity. Race-ethnicity was grouped into four categories based on the race-ethnicity distribution in the population: White, Black, Hispanic, and Other. The “Other” category included Asian, Native Hawaiian/Pacific Islander, American Indian/Alaskan Native, and students who reported more than one race or that their race was not known.
There were 84 students who did not provide responses to the race-ethnicity questions. These cases were imputed by replacing missing data with the largest race-ethnicity category for that stratum for the purpose of calculating the post-stratification weights only. These imputed values were not used for further data analyses. The race-ethnicity adjustment factor was computed as:
Race-ethnicity Adjustment = Proportion of White,Black,Hispanic,Other in Population
Proportion of White,Black,Hispanic,Other in Sample

Indiana Youth Survey 2016
60
The second post-stratification factor was grade and gender (combinations of males and females in each of grades 6, 8, 10, and 12 for each stratum). The gender by grade adjustment factor was computed as:
Grade-Gender Adjustment = Proportion 6th Male,6th Female,…,12th Male,12th Female in Population
Proportion of 6th Male,6th Female,…,12th Male,12th Female in Sample
The final weight for each eligible responding student was computed as:
Final Weight = Base Weight x Nonresponse Adjustment Factor x Race - Ethnicity Adjustment Factor x Grade - Gender Adjustment Factor
Variance Estimation: The STATA software package (version 14) was used specifically to compute estimates and variances for the Indiana Youth Survey. There was one stratum with only one primary sampling unit. For variance estimation, this stratum with one sampling unit was centered at the grand mean instead of the stratum mean.
Design Effect: The design effect, which is the ratio of the variance of a selected value using the sampling method specified in this section to the variance that would have been computed using simple random sampling, is presented for selected estimates in Table 35. Although lower design effects are generally better, effects under 3 can be considered good and higher effects are frequently reported (Shackman, 2001).
Table 35. Design Effects for Selected Drug Use during the Past Month
Estimate Design Effect Estimate Design
Effect
Cigarette use for 12th graders 1.51 Alcohol use for 10th
grade females 3.04
Alcohol use for 12th graders 1.56 Marijuana use for 10th
grade females 2.15
Cigarette use for 6th grade males 4.10 Cigarette use for all 6th,
8th, 10th, 12th combined 2.19
Marijuana use for 6th grade males 2.39 Alcohol use for all 6th,
8th, 10th, 12th combined 2.68
Selected ResultsThe random sample from the Indiana Youth Survey provides results that can be generalized to the entire state of Indiana with increased confidence relative to the convenience sample (the traditional data collection method). However, these data

61
Report
do not, nor are they intended to, provide information on local results or trends (e.g., at the school or school corporation level). The sampling design was specifically structured in order to provide the most accurate state-level data. While the data from the random sample could, in theory, be generalized to regions and even to schools, the confidence intervals would be extremely wide, as the statistical design was optimized for confidence in state-level results. Thus, for local-level results, please continue to utilize the results of the convenience sampling portion of the Indiana Youth Survey.
Interpretation of this Section
As noted in the Methodology component of this section, the randomly-sampled survey utilized a 95% confidence interval (abbreviated here as 95% CI). This confidence interval is a range of values extending lower and higher than the measured value within which we are 95% confident the true population value lies.
The margin of error is different for each question. The narrower the margin of error (e.g., the smaller the number), the more precise the survey result is. In Tables 36 through 39, the margin of error can be calculated by subtracting the 95% CI LL from the 95% CI UL and dividing by 2. So, for example, in Table 36, the margin of error for ‘cigarettes’ is [(9.0-4.9)/2)], which is 2.05%.
Tables 36 through 39 have four types of columns:
• Convenience Sample: this is the number reported in the prior sections of the monograph (e.g., the convenience sample) at the state level for the given grade and question.
• Random Sample: this is the number derived from the random sample at the state level for the same grade and question.• Random Sample, 95% CI LL: the lower limit of the 95% confidence
interval (the true population value is likely equal to or higher than this number).
• Random Sample, 95% CI UL: the upper limit of the 95% confidence interval (the true population value is likely equal to or lower than this number).
Differences between the Convenience and Random Samples
In cases where the value for the convenience sample falls between the random sample’s 95% CI LL and 95% CI UL, we are confident that the convenience sample data match the population-level data. It is important to note that a random sample value is a more accurate state-level estimate relative to a corresponding convenience sample value. However, given that the random sample only will be collected every other year, a high level of agreement between the random sample

Indiana Youth Survey 2016
62
and the convenience sample suggests that, in off-years, the convenience sample reasonably can be utilized to estimate state-level data.
Past-month Substance Use
The random sample and the convenience sample were in agreement across all students for all past-month prevalence rates for substance use in 6th, 8th, and 12th grades. However, for 10th grade students, the convenience sample produced prevalence rates for electronic vapor products, binge drinking, cocaine/crack, heroin, and hallucinogens/ecstasy that were outside (higher than) the 95% CI for the random sample (see Table 36). There are a variety of reasons why this discrepancy may have been observed. For example, it is possible that the particular group of 10th grade students who took the statewide (convenience sample) survey were, by chance, those who used those substances more frequently than other 10th grade students in the state who did not take the survey this year. It is also possible that this cluster represents statistical variation, as when large number of 95% CIs are calculated, it is more likely that some true values will not be within the CI (King, Rosopa, & Minium, 2010).
Table 36. Random and convenience sample comparison, percentage reporting monthly use of alcohol, tobacco, and other drugs, Indiana 10th grade students, 2016
Convenience Sample
Random SampleDRUG % 95% CI LL 95% CI UL
Cigarettes 8.4 7.0 4.9 9.0
Smokeless tobacco 4.6 5.3 2.8 7.9
Cigars 3.7 3.4 2.2 4.5
Pipe 4.0 3.8 2.8 4.7
Electronic vapor products 15.4 12.5 10.3 14.7
Alcohol 22.9 20.9 17.7 24.2
Binge drinking# 9.8 7.7 5.9 9.5
Marijuana 13.7 12.1 9.2 15.0
Synthetic marijuana 1.5 1.7 1.0 2.3
Cocaine/Crack 0.7 0.4 0.2 0.5
Inhalants 0.8 1.0 0.2 1.8
Methamphetamines 0.3 0.2 0.1 0.3
Heroin 0.3 0.1 0.0 0.2
Hallucinogens/Ecstasy 1.7 1.1 0.7 1.4
Prescription drugs 3.9 3.7 3.0 4.5
Over the counter drugs 3.2 3.0 2.3 3.7
Note: Yellow highlighting indicates that the convenience sample value exceeds the 95% CI UL.

63
Report
Gambling Behavior
The random sample and the convenience sample were similar across all types of gambling for 8th grade students; however, the convenience sample produced prevalence rates for sports gambling (12th), online gambling (10th), bingo (12th), and gambling in other ways (12th) that exceeded the 95% CI UL from the random sample (see Tables 37 and 38; 6th grade students did not complete these items). As with the previous section, it is not possible to determine the precise cause of these discrepancies.
Table 37. Random and convenience sample comparison, percentage reporting gambling behaviors, Indiana 10th grade students, 2016
Convenience Sample
Random Sample% 95% CI LL 95% CI UL
Card games 14.8 14.6 12.4 16.8
Personal games of skill 20.2 21.0 17.2 24.8
Sports 17.9 17.6 15.2 20.1
Lottery 10.8 9.8 8.5 11.0
Bingo 7.1 7.7 4.7 10.8
Online gambling 4.7 3.8 3.2 4.5
Personal challenges 23.7 23.4 19.3 27.5
Gambled in other ways 12.6 12.0 10.7 13.3
Note: Yellow highlighting indicates that the convenience sample value exceeds the 95% CI UL.
Table 38. Random and convenience sample comparison, percentage reporting gambling behaviors, Indiana 12th grade students, 2016
Convenience Sample
Random Sample% 95% CI LL 95% CI UL
Card games 16.7 15.4 13.2 17.6
Personal games of skill 19.6 17.5 15.3 19.7
Sports 17.7 15.2 13.2 17.2
Lottery 25.9 23.3 19.7 26.9
Bingo 7.1 5.7 4.4 6.9
Online gambling 4.5 4.0 3.0 4.9
Personal challenges 22.0 19.6 15.9 23.3
Gambled in other ways 13.6 11.0 8.8 13.2
Note: Yellow highlighting indicates that the convenience sample value exceeds the 95% CI UL.
Risk and Protective Factors
The random sample and the convenience sample were similar across all risk and

Indiana Youth Survey 2016
64
protective factors for all grade levels, with the exception of perceived risk of drug use for 8th grade students. The percentage of students at ‘high risk’ in the convenience sample was lower than the 95% CI LL from the random sample (see Table 39). As in previous cases, the cause of this discrepancy is unclear.
Table 39. Random and convenience sample comparison, percentage at high risk (risk factors scales), Indiana 8th grade students, 2016
Convenience Sample
Random Sample% 95% CI LL 95% CI UL
Law and norms favorable to drug use 29.1 28.2 23.2 33.1
Perceived availability of drugs 19.6 18.7 16.5 20.9
Poor family management 23.1 22.7 20.7 24.7
Family conflict 50.0 48.9 46.3 51.4
Parental attitudes favorable towards drug use 15.0 14.6 12.6 16.6
Parental attitudes favorable towards anti-social behavior 36.7 40.3 36.6 43.9
School academic failure 34.3 34.7 30.8 38.5
Low school commitment 43.5 43.4 40.2 46.6
Early initiation of drug use 15.1 14.6 11.9 17.2
Attitudes favorable towards antisocial behavior 29.0 31.1 28.6 33.6
Attitudes favorable towards drug use 22.9 22.6 20.8 24.5
Perceived risk of drug use 58.8 61.5 59.0 64.1
Interaction with anti-social peers 28.5 28.3 24.7 31.9
Rewards for antisocial involvement 41.5 42.8 39.8 45.9
Note: Blue highlighting indicates that the convenience sample value is lower than the 95% CI LL.
Other Selected Results
This section provides other results from the random sample, but does not compare results to data from the convenience sample.

65
Report
Perc
enta
ge R
epor
ting
Mon
thly
Use
of A
lcoh
ol, T
obac
co,
and
Oth
er D
rugs
by
Indi
ana
6th
Gra
de S
tude
nts:
2016
Perc
enta
ge R
epor
ting
Mon
thly
Use
of A
lcoh
ol, T
obac
co,
and
Oth
er D
rugs
by
Indi
ana
8th
Gra
de S
tude
nts:
2016
DRUG
%95
% C
I LL
95%
CI U
L
Ciga
rette
s1.
20.
71.
7
Alco
hol
3.7
2.5
4.9
Mar
ijuan
a1.
30.
61.
9
Inha
lant
s0.
30.
10.
5
Pres
crip
tion
drug
s1.
41.
01.
9
Oth
er ill
egal
dru
gs0.
20.
10.
4
DRUG
%95
% C
I LL
95%
CI U
L
Ciga
rette
s4.
33.
15.
5
Smok
eles
s to
bacc
o2.
31.
23.
3
Ciga
rs1.
30.
81.
8
Pipe
2.0
1.4
2.6
Elec
troni
c va
por p
rodu
cts
8.5
6.7
10.3
Alco
hol
12.7
10.4
14.9
B
inge
drin
king#
4.3
3.2
5.4
Mar
ijuan
a6.
34.
87.
7
Synt
hetic
mar
ijuan
a0.
90.
61.
2
Coca
ine/
Crac
k0.
40.
10.
6
Inha
lant
s0.
70.
40.
9
Met
ham
phet
amin
es0.
20.
00.
3
Hero
in0.
20.
00.
3
Hallu
cinog
ens/
Ecst
asy
0.6
0.3
0.9
Pres
crip
tion
drug
s1.
81.
42.
2
Ove
r the
cou
nter
dru
gs3.
42.
74.
1
Note
s. 9
5% C
I LL:
Low
er lim
it of
95%
con
fiden
ce in
terv
al
95
% C
I UL:
Upp
er lim
it of
95%
con
fiden
ce in
terv
al
Note
s. 9
5% C
I LL:
Low
er lim
it of
95%
con
fiden
ce in
terv
al
95
% C
I UL:
Upp
er lim
it of
95%
con
fiden
ce in
terv
al

Indiana Youth Survey 2016
66
Perc
enta
ge R
epor
ting
Mon
thly
Use
of A
lcoh
ol, T
obac
co,
and
Oth
er D
rugs
by
Indi
ana
10th
Gra
de S
tude
nts:
2016
Perc
enta
ge R
epor
ting
Mon
thly
Use
of A
lcoh
ol, T
obac
co,
and
Oth
er D
rugs
by
Indi
ana
12th
Gra
de S
tude
nts:
2016
DRUG
%95
% C
I LL
95%
CI U
L
Ciga
rette
s7.
04.
99.
0
Smok
eles
s to
bacc
o5.
32.
87.
9
Ciga
rs3.
42.
24.
5
Pipe
3.8
2.8
4.7
Elec
troni
c va
por p
rodu
cts
12.5
10.3
14.7
Alco
hol
20.9
17.7
24.2
B
inge
drin
king#
7.7
5.9
9.5
Mar
ijuan
a12
.19.
215
.0
Synt
hetic
mar
ijuan
a1.
71.
02.
3
Coca
ine/
Crac
k0.
40.
20.
5
Inha
lant
s1.
00.
21.
8
Met
ham
phet
amin
es0.
20.
10.
3
Hero
in0.
10.
00.
2
Hallu
cinog
ens/
Ecst
asy
1.1
0.7
1.4
Pres
crip
tion
drug
s3.
73.
04.
5
Ove
r the
cou
nter
dru
gs3.
02.
33.
7
DRUG
%95
% C
I LL
95%
CI U
L
Ciga
rette
s14
.111
.916
.3
Smok
eles
s to
bacc
o7.
35.
39.
3
Ciga
rs9.
77.
711
.7
Pipe
7.5
6.0
9.0
Elec
troni
c va
por p
rodu
cts
20.9
18.4
23.4
Alco
hol
33.4
29.4
37.5
B
inge
drin
king#
16.4
14.0
18.8
Mar
ijuan
a21
.117
.125
.0
Synt
hetic
mar
ijuan
a1.
51.
02.
1
Coca
ine/
Crac
k1.
50.
72.
4
Inha
lant
s1.
00.
71.
3
Met
ham
phet
amin
es0.
50.
20.
9
Hero
in0.
40.
20.
7
Hallu
cinog
ens/
Ecst
asy
3.5
2.6
4.4
Pres
crip
tion
drug
s5.
84.
37.
3
Ove
r the
cou
nter
dru
gs3.
32.
54.
1
Note
s. 9
5% C
I LL:
Low
er lim
it of
95%
con
fiden
ce in
terv
al
95
% C
I UL:
Upp
er lim
it of
95%
con
fiden
ce in
terv
alNo
tes.
95%
CI L
L: L
ower
limit
of 9
5% c
onfid
ence
inte
rval
95%
CI U
L: U
pper
limit
of 9
5% c
onfid
ence
inte
rval

67
Report
Perc
enta
ge R
epor
ting
Mon
thly
Use
of A
lcoh
ol, T
obac
co, a
nd O
ther
Dru
gs
by In
dian
a 6t
h G
rade
Stu
dent
s: 20
16
MAL
EFE
MAL
E
DRUG
%95
% C
I LL
95%
CI U
L%
95%
CI L
L95
% C
I UL
Ciga
rette
s1.
50.
72.
20.
90.
41.
4
Alco
hol
4.2
2.6
5.7
3.2
1.7
4.6
Mar
ijuan
a1.
30.
52.
01.
30.
22.
3
Inha
lant
s0.
20.
00.
30.
50.
10.
8
Pres
crip
tion
drug
s1.
40.
72.
11.
50.
92.
1
Oth
er ill
egal
dru
gs0.
30.
10.
40.
20.
00.
4
Note
s. 9
5% C
I LL:
Low
er lim
it of
95%
con
fiden
ce in
terv
al
95
% C
I UL:
Upp
er lim
it of
95%
con
fiden
ce in
terv
al

Indiana Youth Survey 2016
68
MAL
EFE
MAL
E
DRUG
%95
% C
I LL
95%
CI U
L%
95%
CI L
L95
% C
I UL
Ciga
rette
s3.
82.
45.
14.
93.
46.
3
Smok
eles
s to
bacc
o3.
11.
74.
61.
30.
52.
1
Ciga
rs1.
71.
02.
40.
90.
51.
3
Pipe
1.6
0.9
2.3
2.4
1.6
3.2
Elec
troni
c va
por p
rodu
cts
7.6
5.1
10.1
9.4
7.5
11.3
Alco
hol
11.4
8.6
14.3
13.9
11.7
16.1
B
inge
drin
king#
3.5
2.3
4.7
5.2
3.8
6.6
Mar
ijuan
a6.
54.
58.
56.
04.
77.
3
Synt
hetic
mar
ijuan
a0.
70.
41.
11.
00.
61.
4
Coca
ine/
Crac
k0.
30.
00.
50.
50.
10.
8
Inha
lant
s0.
30.
10.
51.
10.
71.
4
Met
ham
phet
amin
es0.
10.
00.
20.
20.
00.
4
Hero
in0.
20.
00.
40.
20.
00.
4
Hallu
cinog
ens/
Ecst
asy
0.5
0.1
0.8
0.7
0.4
1.1
Pres
crip
tion
drug
s1.
40.
92.
02.
21.
62.
8
Oth
er ill
egal
dru
gs2.
81.
93.
64.
03.
24.
8
Perc
enta
ge R
epor
ting
Mon
thly
Use
of A
lcoh
ol, T
obac
co, a
nd O
ther
Dru
gs
by In
dian
a 8t
h G
rade
Stu
dent
s: 20
16
Note
s. 9
5% C
I LL:
Low
er lim
it of
95%
con
fiden
ce in
terv
al
95
% C
I UL:
Upp
er lim
it of
95%
con
fiden
ce in
terv
al

69
Report
MAL
EFE
MAL
E
DRUG
%95
% C
I LL
95%
CI U
L%
95%
CI L
L95
% C
I UL
Ciga
rette
s7.
95.
210
.76.
03.
88.
3
Smok
eles
s to
bacc
o8.
94.
713
.01.
70.
82.
7
Ciga
rs4.
93.
06.
71.
91.
12.
6
Pipe
4.0
2.8
5.1
3.6
2.5
4.6
Elec
troni
c va
por p
rodu
cts
14.9
11.8
17.9
10.1
7.8
12.3
Alco
hol
21.4
16.2
26.7
20.4
17.5
23.2
B
inge
drin
king#
6.9
5.0
8.7
8.6
6.0
11.1
Mar
ijuan
a13
.19.
816
.411
.18.
114
.2
Synt
hetic
mar
ijuan
a2.
11.
03.
21.
20.
61.
9
Coca
ine/
Crac
k0.
50.
30.
80.
20.
10.
4
Inha
lant
s1.
50.
03.
10.
60.
30.
8
Met
ham
phet
amin
es0.
10.
00.
20.
20.
00.
4
Hero
in0.
10.
00.
30.
00.
00.
1
Hallu
cinog
ens/
Ecst
asy
1.2
0.6
1.8
0.9
0.4
1.3
Pres
crip
tion
drug
s4.
32.
26.
33.
22.
44.
0
Oth
er ill
egal
dru
gs3.
42.
44.
32.
71.
73.
6
Perc
enta
ge R
epor
ting
Mon
thly
Use
of A
lcoh
ol, T
obac
co, a
nd O
ther
Dru
gs
by In
dian
a 10
th G
rade
Stu
dent
s: 20
16
Note
s. 9
5% C
I LL:
Low
er lim
it of
95%
con
fiden
ce in
terv
al
95
% C
I UL:
Upp
er lim
it of
95%
con
fiden
ce in
terv
al

Indiana Youth Survey 2016
70
MAL
EFE
MAL
E
DRUG
%95
% C
I LL
95%
CI U
L%
95%
CI L
L95
% C
I UL
Ciga
rette
s16
.814
.019
.511
.59.
413
.6
Smok
eles
s to
bacc
o12
.79.
615
.82.
01.
22.
7
Ciga
rs14
.812
.017
.64.
73.
36.
0
Pipe
8.3
6.3
10.2
6.7
5.3
8.2
Elec
troni
c va
por p
rodu
cts
24.3
21.1
27.5
17.5
14.6
20.4
Alco
hol
32.6
28.1
37.2
34.2
30.1
38.4
B
inge
drin
king#
18.0
15.3
20.7
14.9
12.5
17.2
Mar
ijuan
a22
.318
.126
.519
.915
.923
.9
Synt
hetic
mar
ijuan
a1.
81.
02.
71.
20.
61.
9
Coca
ine/
Crac
k2.
00.
73.
21.
10.
41.
7
Inha
lant
s1.
20.
71.
70.
80.
21.
4
Met
ham
phet
amin
es0.
60.
21.
00.
50.
00.
9
Hero
in0.
50.
20.
90.
30.
00.
7
Hallu
cinog
ens/
Ecst
asy
4.5
2.9
6.1
2.5
1.7
3.4
Pres
crip
tion
drug
s6.
64.
58.
75.
13.
76.
4
Oth
er ill
egal
dru
gs4.
43.
25.
52.
21.
43.
1
Perc
enta
ge R
epor
ting
Mon
thly
Use
of A
lcoh
ol, T
obac
co, a
nd O
ther
Dru
gs
by In
dian
a 12
th G
rade
Stu
dent
s: 20
16
Note
s. 9
5% C
I LL:
Low
er lim
it of
95%
con
fiden
ce in
terv
al
95
% C
I UL:
Upp
er lim
it of
95%
con
fiden
ce in
terv
al

71
Report
Perc
enta
ge R
epor
ting
Gam
blin
g Be
havi
orby
Indi
ana
8th
Gra
de S
tude
nts:
2016
%95
% C
I LL
95%
CI U
L
Card
gam
es14
.011
.916
.2
Pers
onal
gam
es o
f skil
l23
.221
.025
.5
Spor
ts18
.916
.421
.3
Lotte
ry10
.48.
911
.9
Bing
o9.
17.
310
.9
Onl
ine
gam
blin
g4.
83.
66.
0
Pers
onal
cha
lleng
es28
.424
.831
.9
Gam
bled
in o
ther
way
s13
.611
.415
.9
Note
s. 9
5% C
I LL:
Low
er lim
it of
95%
con
fiden
ce in
terv
al
95
% C
I UL:
Upp
er lim
it of
95%
con
fiden
ce in
terv
al
Perc
enta
ge R
epor
ting
Gam
blin
g Be
havi
orby
Indi
ana
10th
Gra
de S
tude
nts:
2016
%95
% C
I LL
95%
CI U
L
Card
gam
es14
.612
.416
.8
Pers
onal
gam
es o
f skil
l21
.017
.224
.8
Spor
ts17
.615
.220
.1
Lotte
ry9.
88.
511
.0
Bing
o7.
74.
710
.8
Onl
ine
gam
blin
g3.
83.
24.
5
Pers
onal
cha
lleng
es23
.419
.327
.5
Gam
bled
in o
ther
way
s12
.010
.713
.3
Note
s. 9
5% C
I LL:
Low
er lim
it of
95%
con
fiden
ce in
terv
al
95
% C
I UL:
Upp
er lim
it of
95%
con
fiden
ce in
terv
al
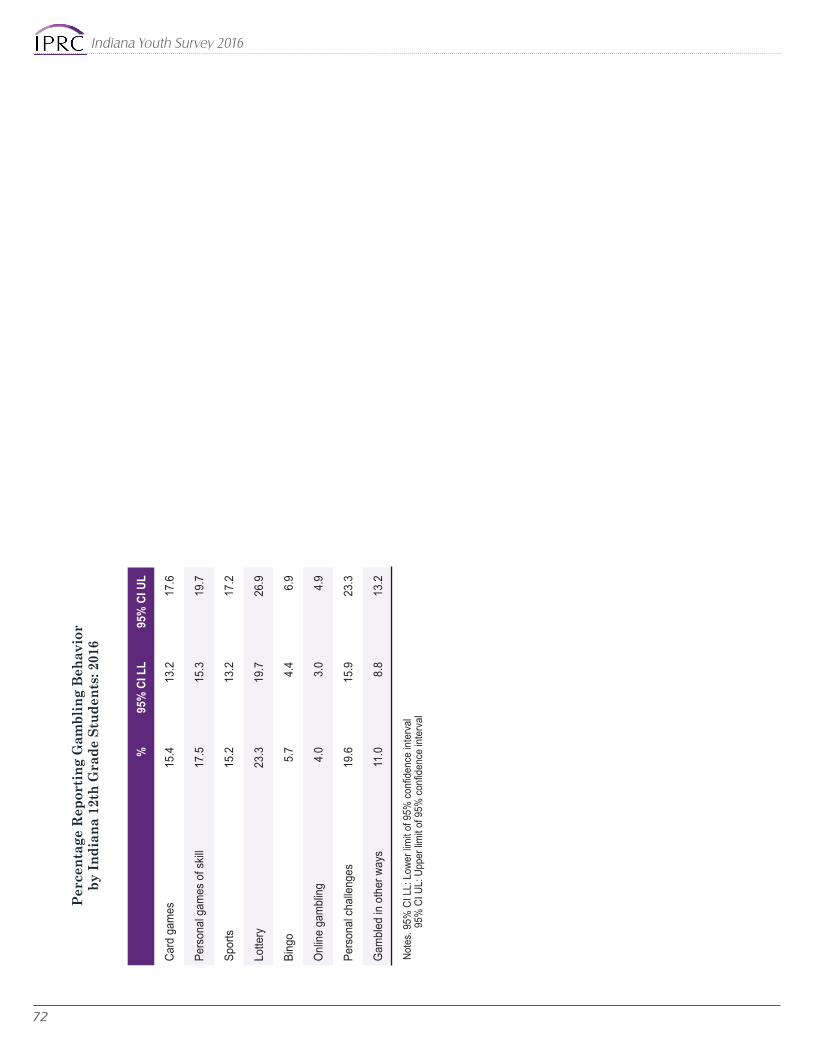
Indiana Youth Survey 2016
72
Perc
enta
ge R
epor
ting
Gam
blin
g Be
havi
orby
Indi
ana
12th
Gra
de S
tude
nts:
2016
%95
% C
I LL
95%
CI U
L
Card
gam
es15
.413
.217
.6
Pers
onal
gam
es o
f skil
l17
.515
.319
.7
Spor
ts15
.213
.217
.2
Lotte
ry23
.319
.726
.9
Bing
o5.
74.
46.
9
Onl
ine
gam
blin
g4.
03.
04.
9
Pers
onal
cha
lleng
es19
.615
.923
.3
Gam
bled
in o
ther
way
s11
.08.
813
.2
Note
s. 9
5% C
I LL:
Low
er lim
it of
95%
con
fiden
ce in
terv
al
95
% C
I UL:
Upp
er lim
it of
95%
con
fiden
ce in
terv
al
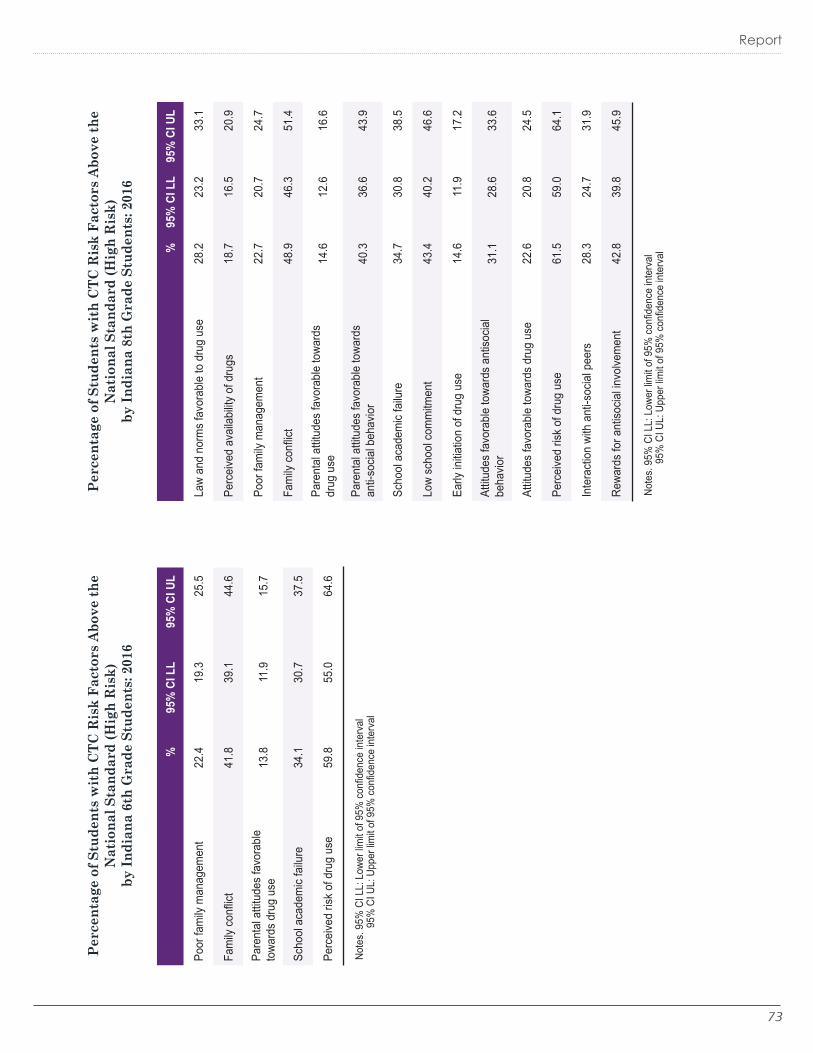
73
Report
Perc
enta
ge o
f Stu
dent
s w
ith
CTC
Ris
k Fa
ctor
s Ab
ove
the
Nat
iona
l Sta
ndar
d (H
igh
Ris
k)
by In
dian
a 6t
h G
rade
Stu
dent
s: 20
16
Perc
enta
ge o
f Stu
dent
s w
ith
CTC
Ris
k Fa
ctor
s Ab
ove
the
Nat
iona
l Sta
ndar
d (H
igh
Ris
k)
by In
dian
a 8t
h G
rade
Stu
dent
s: 20
16
%95
% C
I LL
95%
CI U
L
Poor
fam
ily m
anag
emen
t22
.419
.325
.5
Fam
ily c
onflic
t41
.839
.144
.6
Pare
ntal
atti
tude
s fa
vora
ble
towa
rds
drug
use
13.8
11.9
15.7
Scho
ol a
cade
mic
failu
re34
.130
.737
.5
Perc
eive
d ris
k of
dru
g us
e59
.855
.064
.6
%95
% C
I LL
95%
CI U
L
Law
and
norm
s fa
vora
ble
to d
rug
use
28.2
23.2
33.1
Perc
eive
d av
aila
bility
of d
rugs
18.7
16.5
20.9
Poor
fam
ily m
anag
emen
t22
.720
.724
.7
Fam
ily c
onflic
t48
.946
.351
.4
Pare
ntal
atti
tude
s fa
vora
ble
towa
rds
drug
use
14.6
12.6
16.6
Pare
ntal
atti
tude
s fa
vora
ble
towa
rds
anti-
socia
l beh
avio
r40
.336
.643
.9
Scho
ol a
cade
mic
failu
re34
.730
.838
.5
Low
scho
ol c
omm
itmen
t43
.440
.246
.6
Early
initia
tion
of d
rug
use
14.6
11.9
17.2
Attit
udes
favo
rabl
e to
ward
s an
tisoc
ial
beha
vior
31.1
28.6
33.6
Attit
udes
favo
rabl
e to
ward
s dr
ug u
se22
.620
.824
.5
Perc
eive
d ris
k of
dru
g us
e61
.559
.064
.1
Inte
ract
ion
with
ant
i-soc
ial p
eers
28.3
24.7
31.9
Rewa
rds
for a
ntiso
cial in
volve
men
t42
.839
.845
.9
Note
s. 9
5% C
I LL:
Low
er lim
it of
95%
con
fiden
ce in
terv
al
95
% C
I UL:
Upp
er lim
it of
95%
con
fiden
ce in
terv
al
Note
s. 9
5% C
I LL:
Low
er lim
it of
95%
con
fiden
ce in
terv
al
95
% C
I UL:
Upp
er lim
it of
95%
con
fiden
ce in
terv
al

Indiana Youth Survey 2016
74
Perc
enta
ge o
f Stu
dent
s w
ith
CTC
Ris
k Fa
ctor
s Ab
ove
the
Nat
iona
l Sta
ndar
d (H
igh
Ris
k)
by In
dian
a 10
th G
rade
Stu
dent
s: 20
16
Perc
enta
ge o
f Stu
dent
s w
ith
CTC
Ris
k Fa
ctor
s Ab
ove
the
Nat
iona
l Sta
ndar
d (H
igh
Ris
k)
by In
dian
a 12
th G
rade
Stu
dent
s: 20
16
Note
s. 9
5% C
I LL:
Low
er lim
it of
95%
con
fiden
ce in
terv
al
95
% C
I UL:
Upp
er lim
it of
95%
con
fiden
ce in
terv
alNo
tes.
95%
CI L
L: L
ower
limit
of 9
5% c
onfid
ence
inte
rval
95%
CI U
L: U
pper
limit
of 9
5% c
onfid
ence
inte
rval
%95
% C
I LL
95%
CI U
L
Law
and
norm
s fa
vora
ble
to d
rug
use
36.2
32.8
39.5
Perc
eive
d av
aila
bility
of d
rugs
36.5
33.7
39.3
Poor
fam
ily m
anag
emen
t22
.819
.825
.8
Fam
ily c
onflic
t42
.040
.543
.5
Pare
ntal
atti
tude
s fa
vora
ble
towa
rds
drug
use
31.0
28.2
33.8
Pare
ntal
atti
tude
s fa
vora
ble
towa
rds
anti-
socia
l beh
avio
r36
.033
.638
.3
Scho
ol a
cade
mic
failu
re33
.731
.635
.8
Low
scho
ol c
omm
itmen
t52
.648
.157
.2
Early
initia
tion
of d
rug
use
16.6
14.4
18.7
Attit
udes
favo
rabl
e to
ward
s an
tisoc
ial
beha
vior
31.3
28.8
33.9
Attit
udes
favo
rabl
e to
ward
s dr
ug u
se38
.435
.541
.3
Perc
eive
d ris
k of
dru
g us
e67
.665
.070
.2
Inte
ract
ion
with
ant
i-soc
ial p
eers
31.3
28.0
34.6
Rewa
rds
for a
ntiso
cial in
volve
men
t46
.844
.449
.2
%95
% C
I LL
95%
CI U
L
Law
and
norm
s fa
vora
ble
to d
rug
use
37.1
33.0
41.1
Perc
eive
d av
aila
bility
of d
rugs
24.4
22.4
26.3
Poor
fam
ily m
anag
emen
t20
.017
.922
.2
Fam
ily c
onflic
t41
.138
.343
.9
Pare
ntal
atti
tude
s fa
vora
ble
towa
rds
drug
use
22.8
20.4
25.1
Pare
ntal
atti
tude
s fa
vora
ble
towa
rds
anti-
socia
l beh
avio
r34
.932
.837
.1
Scho
ol a
cade
mic
failu
re37
.133
.940
.4
Low
scho
ol c
omm
itmen
t47
.243
.650
.8
Early
initia
tion
of d
rug
use
12.8
10.8
14.9
Attit
udes
favo
rabl
e to
ward
s an
tisoc
ial
beha
vior
32.2
29.7
34.7
Attit
udes
favo
rabl
e to
ward
s dr
ug u
se30
.927
.234
.5
Perc
eive
d ris
k of
dru
g us
e54
.950
.659
.2
Inte
ract
ion
with
ant
i-soc
ial p
eers
27.3
23.6
31.0
Rewa
rds
for a
ntiso
cial in
volve
men
t40
.037
.242
.8
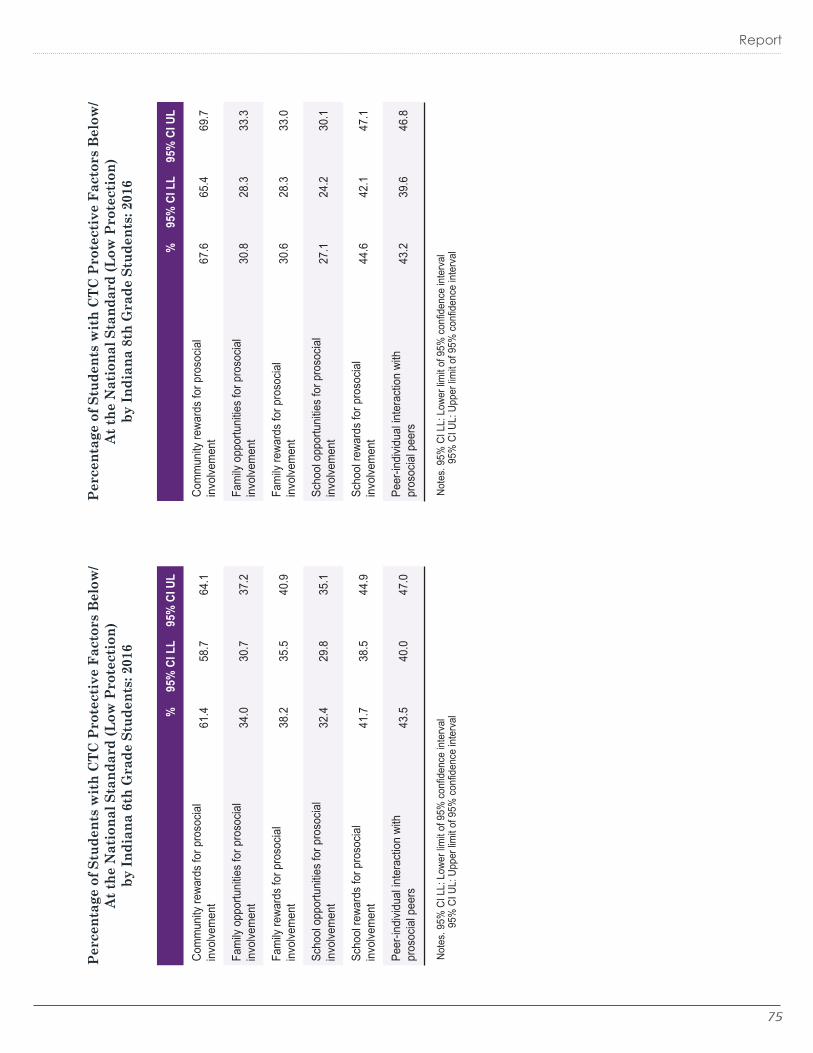
75
Report
Perc
enta
ge o
f Stu
dent
s w
ith
CTC
Prot
ecti
ve F
acto
rs B
elow
/At
the
Nat
iona
l Sta
ndar
d (L
ow P
rote
ctio
n)
by In
dian
a 6t
h G
rade
Stu
dent
s: 20
16
Perc
enta
ge o
f Stu
dent
s w
ith
CTC
Prot
ecti
ve F
acto
rs B
elow
/At
the
Nat
iona
l Sta
ndar
d (L
ow P
rote
ctio
n)
by In
dian
a 8t
h G
rade
Stu
dent
s: 20
16
%95
% C
I LL
95%
CI U
L
Com
mun
ity re
ward
s fo
r pro
socia
l in
volve
men
t67
.665
.469
.7
Fam
ily o
ppor
tuni
ties
for p
roso
cial
invo
lvem
ent
30.8
28.3
33.3
Fam
ily re
ward
s fo
r pro
socia
l in
volve
men
t30
.628
.333
.0
Scho
ol o
ppor
tuni
ties
for p
roso
cial
invo
lvem
ent
27.1
24.2
30.1
Scho
ol re
ward
s fo
r pro
socia
l in
volve
men
t44
.642
.147
.1
Peer
-indi
vidua
l inte
ract
ion
with
pr
osoc
ial p
eers
43.2
39.6
46.8
Note
s. 9
5% C
I LL:
Low
er lim
it of
95%
con
fiden
ce in
terv
al
95
% C
I UL:
Upp
er lim
it of
95%
con
fiden
ce in
terv
al
%95
% C
I LL
95%
CI U
L
Com
mun
ity re
ward
s fo
r pro
socia
l in
volve
men
t61
.458
.764
.1
Fam
ily o
ppor
tuni
ties
for p
roso
cial
invo
lvem
ent
34.0
30.7
37.2
Fam
ily re
ward
s fo
r pro
socia
l in
volve
men
t38
.235
.540
.9
Scho
ol o
ppor
tuni
ties
for p
roso
cial
invo
lvem
ent
32.4
29.8
35.1
Scho
ol re
ward
s fo
r pro
socia
l in
volve
men
t41
.738
.544
.9
Peer
-indi
vidua
l inte
ract
ion
with
pr
osoc
ial p
eers
43.5
40.0
47.0
Note
s. 9
5% C
I LL:
Low
er lim
it of
95%
con
fiden
ce in
terv
al
95
% C
I UL:
Upp
er lim
it of
95%
con
fiden
ce in
terv
al

Indiana Youth Survey 2016
76
Perc
enta
ge o
f Stu
dent
s w
ith
CTC
Prot
ecti
ve F
acto
rs B
elow
/At
the
Nat
iona
l Sta
ndar
d (L
ow P
rote
ctio
n)
by In
dian
a 10
th G
rade
Stu
dent
s: 20
16
Perc
enta
ge o
f Stu
dent
s w
ith
CTC
Prot
ecti
ve F
acto
rs B
elow
/At
the
Nat
iona
l Sta
ndar
d (L
ow P
rote
ctio
n)
by In
dian
a 12
th G
rade
Stu
dent
s: 20
16
Note
s. 9
5% C
I LL:
Low
er lim
it of
95%
con
fiden
ce in
terv
al
95
% C
I UL:
Upp
er lim
it of
95%
con
fiden
ce in
terv
alNo
tes.
95%
CI L
L: L
ower
limit
of 9
5% c
onfid
ence
inte
rval
95%
CI U
L: U
pper
limit
of 9
5% c
onfid
ence
inte
rval
%95
% C
I LL
95%
CI U
L
Com
mun
ity re
ward
s fo
r pro
socia
l in
volve
men
t66
.363
.469
.2
Fam
ily o
ppor
tuni
ties
for p
roso
cial
invo
lvem
ent
35.7
33.6
37.7
Fam
ily re
ward
s fo
r pro
socia
l in
volve
men
t38
.036
.339
.7
Scho
ol o
ppor
tuni
ties
for p
roso
cial
invo
lvem
ent
30.4
28.0
32.9
Scho
ol re
ward
s fo
r pro
socia
l in
volve
men
t48
.144
.951
.3
Peer
-indi
vidua
l inte
ract
ion
with
pr
osoc
ial p
eers
55.7
51.3
60.0
%95
% C
I LL
95%
CI U
L
Com
mun
ity re
ward
s fo
r pro
socia
l in
volve
men
t61
.857
.765
.9
Fam
ily o
ppor
tuni
ties
for p
roso
cial
invo
lvem
ent
34.7
32.0
37.3
Fam
ily re
ward
s fo
r pro
socia
l in
volve
men
t35
.932
.439
.4
Scho
ol o
ppor
tuni
ties
for p
roso
cial
invo
lvem
ent
29.2
24.2
34.3
Scho
ol re
ward
s fo
r pro
socia
l in
volve
men
t38
.234
.541
.9
Peer
-indi
vidua
l inte
ract
ion
with
pr
osoc
ial p
eers
46.8
41.6
51.9

77
Report
References
Agley, J., Gassman, R., Jun, M., Nowicke, C., & Samuel, S. (2015). Improving local alcohol, tobacco, and other drug (ATOD) data collection for usability: Statewide administration of the CRAFFT screening tool. Substance Abuse & Misuse, 50(13), 1668-1677.
Arthur, M. W., Briney, J. S., Hawkins, J. D., Abbott, R.D. Brooke-Weiss, B. L., & Catalano, R. F. (2007). Measuring risk and protection in communities using the Communities That Care Youth Survey. Evaluation and Program Planning, 20, 197-211.
Bailey, S. L. (1992). Adolescents’ multisubstance use patterns: The role of heavy alcohol and cigarette use. American Journal of Public Health, 82(9), 1220-1224.
Barnes, G. M., & Welte, J. W. (1986). Patterns and predictors of alcohol use among 7-12th grade students in New York state. Journal of Studies on Alcohol, 47(1), 53-62.
Boak, A., Hamilton, H.A., Adlaf, E.M., & Mann, R.E. (2013). Drug use among Ontario students, 1977-2013: Detailed OSDUHS findings (CAMH Research Document Series No. 36). Toronto, ON: Centre for Addiction and Mental Health.
Briney, J.S., Brown, E.C., Hawkins, J.D., & Arthur, M.W. (2012). Predictive validity of established cut points for risk and protective factor scales from the Communities that Care Youth Survey. The Journal of Primary Prevention, 33(5-6), 249-258.
Butters, J. E. (2004). The impact of peers and social disapproval on high-risk cannabis use: Gender differences and implications for drug education. Drugs Education Prevention Policy, 11(5), 381-390.
Centers for Disease Control and Prevention. (2011, January 27). Behavioral risk factor surveillance system questionnaire. Retrieved from http://www.cdc.gov/brfss/questionnaires/pdf-ques/2011brfss.pdf
Centers for Disease Control and Prevention. (2013a). Notes from the field: Electronic cigarette use among middle and high school students – United States, 2011-2012. Morbidity and Mortality Weekly Report, 62(35), 729-730.
Centers for Disease Control and Prevention. (2013b). Youth risk behavior surveillance [Data set]. Retrieved from http://www.cdc.gov/healthyyouth/data/yrbs/data.htm
Chassin, L., Presson, C. C., & Sherman, S. J. (1984). Cognitive and social influence factors in adolescent smoking cessation. Addictive Behaviors, 9(4), 383-390.
Council of State Governments Justice Center, Justice Reinvestment in Indiana: Summary Report and Policy Framework (New York: Council of State Governments Justice Center, 2010).
Degenhardt, L., Dierker, L., Chiu, W.T., Medina-Mora, M.E., Neumark, Y., Sampson, N., et al. (2010). Evaluating the drug use “gateway” theory using cross-national data: Consistency and associations of the order of initiation of drug use among participants in the WHO World Mental Health Surveys. Drug and Alcohol Dependence, 108(1-2), 84-97.
Dent, C. W., Grube, J. W., & Biglan, A. (2005). Community level alcohol availability and enforcement of possession laws as predictors of youth drinking, Preventive Medicine, 40(3), 355-362.
Dhalla, S., Zumbo, B.D., & Poole, G. (2011). A review of the psychometric properties of the CRAFFT instrument: 1999-2010. Current Drug Abuse Reviews, 4(1), 57-64.

Indiana Youth Survey 2016
78
Donovan, J. E., & Jessor, R. (1983). Problem drinking and the dimension of involvement with drugs: A Guttman scalogram analysis of adolescent drug use. American Journal of Public Health, 73(5), 543-552.
Esposito-Smythers, C., & Spirito, A. (2004). Adolescent substance use and suicidal behavior: A review with implications for treatment research. Alcoholism: Clinical and Experimental Research, 28 (5), 77S-88S.
Fink, A. (1993). Evaluation fundamentals. Newbury, CA: Sage Publication, Inc.
Fitzsimons, V.M. & Krause-Parello, C. A. ( 2009). Military children : When parents are deployed overseas. The Journal of School Nursing, 25(1), 40.
Fleming, R., Leventhal, H., Glynn, K., & Ershler, J. (1989). The role of cigarettes in the initiation and progression of early substance use. Addictive Behaviors, 14(3), 261-272.
Frieden, T.R., Jaffe, H.W., Cono, J., Richards, C.L., & Iademarco, M.F. (2014). Youth risk behavior surveillance – United States, 2013. Surveillance Summaries, June 13, 2014. MMWR 2014:63 (No. SS-4).
Gillespie, N. A., Neale, M. C., & Kendler, K. S. (2008). Pathways to cannabis abuse: A multi-stage model from cannabis availability, cannabis initiation and progress to abuse. Addiction, 104, 430-438.
Golub, A., & Johnson, B. D. (2001). Variation in youthful risks of progression from alcohol and tobacco to marijuana and to hard drugs across generations. American Journal of Public Health, 91(2), 225-232.
Grant, B. F., Stinson, F. S., & Harford, T. C. (2001). Age at onset of alcohol use and DSM-IV alcohol abuse and dependence: A 12-year follow-up. Journal of Substance Abuse, 13(4), 493-504.
Hallfors, D. D, Waller, M.W., Ford, C.A., Halpern, C. T., Brodish, P. H., & Iritani, B. (2004). Adolescent depression and suicide risk: Association with sex and drug behavior. American Journal of Preventive Medicine, 27(3), 224-230.
Harris, S.K., Louis-Jacques, J., & Knight, J.R. (2014). Screening and brief intervention for alcohol and other abuse. Adolescent Medicine: State of the Art Reviews, 25(1), 126-156.
Harrison, P. A., Fulkerson, J. A., & Park, E. (2000). The relative importance of social versus commercial sources in youth access to tobacco, alcohol, and other drugs. Preventive Medicine, 31(1), 39-48.
Hawkins, J. D., & Catalano, R. F. (2005). Investing in your community’s youth: An introduction to the Communities that Care System. Retrieved July 1, 2010 from http://download.ncadi.samhsa.gov/Prevline/pdfs/ctc/Investing%20in%20Your%20Community’s%20Youth.pdf.
Hearst, M. O., Fulkerson, J. A., Maldonado-Moline, M. M., Perry, C. L., & Komro, K. A. (2007). Who needs liquor stores when parents will do? The importance of social sources of alcohol among young urban teens. Preventive Medicine, 44, 471-476.
Hingson, R., McGovern, T., Howland, J., Heeren, T., Winter, M., & Zakocs, R. (1996). Reducing alcohol-impaired driving in Massachusetts: The saving lives program. American Journal of Public Health, 86(6), p791-791.
Hingson, R. W., Heeren, T., & Winter, M. R. (2006). Age at drinking onset and alcohol dependence: Age at onset, duration, and severity. Archives of Pediatrics & Adolescent Medicine, 160(7), 739-746.

79
Report
Indiana Department of Corrections. (2009). CY 2009 releases. Retrieved from http://www.in.gov/idoc/files/IDOC_2009_RELEASES.pdf
Johnston, L. D., Bachman, J. G., & O’Malley, P. M. (1989). Drug use, drinking, and smoking: National survey results from high school, college, and young adult populations, 1975-1989. Rockville, MD: National Institute on Drug Abuse.
Jones-Webb, R., Toomey, T., Miner, K., Wagenaar, AC., Wolfson, M., & Poon, R. (1997). Why and in what context adolescents obtain alcohol from adults: A pilot study. Substance Use and Misuse, 32(2), 219-228.
Jessor, R., Chase, J. A., & Donovan, J. E. (1980). Psychosocial correlates of marijuana use and problem drinking in a national sample of adolescents. American Journal of Public Health, 70(6), 604-613.
Kandel, D., & Yamaguchi, K. (1993). From beer to crack: Developmental patterns of drug involvement. American Journal of Public Health, 83(6), 851-855.
Kelley, K., Clark, B., Brown, V., & Sitzia, J. (2003). Good practice in the conduct and reporting of survey research. International Journal for Quality in Health Care, 15(3), 261-266.
Kirschner, N., Ginsburg, J., & Sulmasy, L.S. (2014). Prescription drug abuse: Executive summary of a policy position paper from the American College of Physicians. Annals of Internal Medicine, 160(3), 198-200.
Knight, J.R., Shrier, L.A., Bravender, T.D., Farrell, M., Bilt, J.V., & Shaffer, H.J. (1999). A new brief screen for adolescent substance abuse. Archives of Pediatrics & Adolescent Medicine, 153(6), 591-596.
Knight, J.R., Sherritt, L., Harris, S.K., Gates, E.C., & Chang, G. (2003). Validity of brief alcohol screening tests among adolescents: A comparison of the AUDIT, POSIT, CAGE, and CRAFFT. Alcoholism: Clinical and Experimental Research, 27(1), 67-73.
Knight, J.R., Sherritt, L., Shrier, L.A., Harris, S.K., & Chang, G. (2002). Validity of the CRAFFT substance abuse screening test among adolescent clinic patients. Archives of Pediatrics & Adolescent Medicine, 156(6), 607-614.
Kuntsche, E., Kuendig, H., & Gmel, G. (2008). Alcohol outlet density, perceived availability and adolescent alcohol use: A multilevel structural equation model. Journal of Epidemiology and Community Health, 62(9), 811-816.
Lee, C. Y., Eyre, S. L., & Millstein, S. G. (2000). Gender and ethnic differences in adolescent alcohol use: Problem behavior theory approach. Journal of Adolescent Health, 26(2), 143.
Levy, P. S., & Lemeshow, S. (2003). Sampling of populations: Methods and applications (3rd ed.). New York, NY: John Wiley & Sons.
Light, J.M., Grube, J.W., Madden, P.A., & Gover, J. (2003). Adolescent alcohol use and suicidal ideation A nonrecursive model. Addictive Behaviors, 28, 705-724.
Lipperman-Kreda S., & Grube, J. W. (2009). Students’ perception of community disapproval, perceived enforcement of school antismoking policies, personal beliefs, and their cigarette smoking behaviors: Results from a structural equation analysis. Nicotine and Tobacco Research, 11(5), 531-539.
McMaster, L. E., & Wintre, M. G. (1996). Relations between perceived parental reciprocity, perceived parental approval, and adolescent substance use. Journal of Adolescent Research, 11(4), 440-460.

Indiana Youth Survey 2016
80
Miech, R.A., Johnston, L. D., O’Malley, P. M., Bachman, J. G., & Schulenberg, J. E. (2016). Monitoring the Future national survey results on drug use, 1975-2014. Volume I: Secondary school students. Ann Arbor, MI: Institute for Social Research, The University of Michigan, 599 pp.
Millstein, S. G., & Halpern-Felsher, B. L. (2002). Perceptions of risk and vulnerability. The Journal of Adolescent Health, 31(S), 10-27.
Mitchell, S.G., Gryczynski, J., O’Grady, K.E., & Schwartz, R.P. (2013). SBIRT for adolescent drug and alcohol use: Current status and future directions. Journal of Substance Abuse Treatment, 44(5), 463-472.
Murray, J., Farrington, D.P., Sekol, I., & Olsen, R.F. (2009). Effects of parental imprisonment on child antisocial behavior and mental health: A systematic review. Campbell Systematic Reviews, 4, 1-105.
Nunnally, J. C. (1978). Psychometric theory (2nd ed.). New York, NY: McGraw Hill.
Reed, S.C., Bell, J.F., & Edwards, T.C. (2011). Adolescent well-being in Washington State military families. American Journal of Public Health, 101(9), 1676.
Rosenbaum, C.D., Carreiro, S.P., & Babu, K.M. (2012). Here today, gone tomorrow… and back again? A review of herbal marijuana alternatives (K2, spice), synthetic cathinones (bath salts), kratom, salvia divinorum, methoxetamine, and piperazines. Journal of Medical Toxicology, 8(1), 15-32.
Stinchfield, R., Kushner, M. G., & Winters, K. C. (2005). Alcohol use and prior substance abuse treatment in relation to gambling problem severity and gambling treatment outcome. Journal of Gambling Studies, 21(3), 273-297.
Substance Abuse and Mental Health Services Administration. (2008). National Outcome Measures. Retrieved July 17, 2008 from http://www.nationaloutcomemeasures.samhsa.gov/outcome/index_2007.asp.
Substance Abuse and Mental Health Services Administration. (2009). Communities That Care Youth Survey. Retrieved October 15, 2009 from http://download.ncadi.samhsa.gov/Prevline/pdfs/ctc/CTC_Youth_Survey_2006.pdf.
Vidourek, R.A., King, K.A., & Fehr, S.K. (2014). Hispanic youth involvement in over-the-counter drug use: Parent, peer, and school factors. Journal of Addictive Diseases, 33(4), 376-387.
Wagenaar, A. C., & Toomey, T. L. (1996). Sources of alcohol for underage drinkers. Journal; of Studies on Alcohol, 57(3), 325-333.
Warner, L. A., & White, H. R. (2003). Longitudinal effects of age at onset and first drinking situations on problem drinking. Substance Use & Misuse, 38(14), 1983-2016.
Wild, T. C., Hinson, R., Cunningham, J., & Bacchiochi, J. (2001). Perceived vulnerability to alcohol-related harm in young adults: Independent effects of risky alcohol use and drinking motives. Experimental and Clinical Psychopharmacology, 9(1), 117-125.
Winstock, A.R. & Barratt, M.J. (2013). Synthetic cannabis: A comparison of patterns of use and effect profile with natural cannabis in a large global sample. Drug and Alcohol Dependence, 131(1-2), 106-111.
Winters, K. C., & Anderson, N. (2000). Gambling involvement and drug use among adolescents. Journal Of Gambling Studies, 16(2-3), 175-198.
Wodarski, J. S. (1988). Teams-Games-Tournaments: Teaching adolescents about alcohol and driving. Journal of Alcohol and Drug Education, 33( 3), 46-57.

81
Indiana Prevention Resource Center
II. STATEWIDEPREVALENCE OF USE
Statewide Prevalence Rates by Grade: Monthly Use……...................……………………………… 82
Mean Age of First Time Use of Alcohol, Tobacco, and Other Drugs ………………………………………….. 89

Indiana Youth Survey 2016
82
Per
cent
age
Rep
orti
ng M
onth
ly U
se o
f Alc
ohol
, Tob
acco
, and
Oth
er D
rugs
by I
ndia
na 6
th G
rade
Stu
dent
s: 1
993-
2016
NO
TES:
--
Dat
a no
t ava
ilabl
e
* S
tatis
tical
ly s
igni
fican
t cha
nges
bet
wee
n 20
15 a
nd 2
016
prev
alen
ce ra
tes
(p <
.05)
.
DR
UG
1993
1994
1995
1996
1997
1998
1999
2000
2001
2002
2003
2004
2005
2006
2007
2008
2009
2010
2011
2012
2013
2014
2015
2016
Ciga
rette
s8.
510
.09.
39.
79.
58.
27.
05.
76.
04.
85.
15.
44.
23.
32.
82.
62.
33.
32.
62.
32.
01.
71.
51.
3
Alco
hol
13.6
13.7
11.4
10.7
11.5
9.5
9.9
9.2
9.5
9.5
9.9
9.8
8.1
7.6
6.9
6.3
5.6
6.2
5.3
4.7
4.4
3.8
3.5
3.6
Mar
ijuan
a1.
21.
71.
93.
02.
72.
22.
21.
82.
42.
22.
32.
51.
81.
41.
41.
31.
11.
51.
61.
31.
11.
31.
31.
0*
Inha
lant
s3.
84.
13.
63.
84.
93.
63.
42.
73.
12.
53.
23.
63.
12.
92.
32.
31.
81.
00.
90.
70.
50.
40.
60.
5
Pres
cripti
on dr
ugs
----
----
--0.
70.
50.
50.
60.
40.
40.
50.
40.
30.
40.
40.
30.
70.
60.
60.
70.
71.
51.
7
Oth
er ill
egal
dru
gs--
----
----
----
----
----
----
----
----
----
----
--0.
20.
3

83
Statewide Data
Per
cent
age
Rep
orti
ng M
onth
ly U
se o
f Alc
ohol
, Tob
acco
, and
Oth
er D
rugs
by I
ndia
na 7
th G
rade
Stu
dent
s: 1
993-
2016
DR
UG
1993
1994
1995
1996
1997
1998
1999
2000
2001
2002
2003
2004
2005
2006
2007
2008
2009
2010
2011
2012
2013
2014
2015
2016
Ciga
rette
s14
.516
.917
.719
.016
.314
.012
.311
.09.
99.
18.
18.
97.
56.
76.
25.
45.
66.
46.
05.
23.
63.
33.
52.
8*
Smok
eles
s to
bacc
o6.
77.
57.
16.
75.
23.
92.
72.
22.
12.
32.
12.
82.
22.
32.
02.
02.
32.
12.
21.
91.
61.
61.
31.
3
Ciga
rs--
----
----
6.9
5.8
5.3
6.0
4.6
3.7
4.5
3.7
3.2
3.6
3.3
3.4
1.9
1.6
1.4
1.0
0.9
0.9
0.7
Pipe
----
----
--2.
41.
82.
1--
1.5
1.5
1.6
1.2
1.2
1.5
1.3
1.4
1.6
1.5
1.2
1.1
1.5
1.5
1.0
*
Elec
tronic
vapo
r pro
ducts
----
----
----
----
----
----
----
----
----
----
----
5.5
4.9
*
Alco
hol
21.8
21.5
19.6
21.3
18.4
16.8
16.8
16.5
16.1
15.2
14.7
15.3
12.7
12.9
12.2
11.2
10.8
11.6
10.2
8.8
7.1
7.1
7.7
7.4
B
inge
drin
king#
12.7
13.0
12.3
13.5
12.0
12.3
12.4
12.4
9.7
10.0
8.0
8.9
6.8
7.0
8.3
7.5
7.7
7.7
7.9
7.6
6.0
6.3
2.7
2.6
Mar
ijuan
a2.
74.
85.
47.
95.
75.
55.
15.
25.
24.
74.
64.
54.
13.
63.
93.
23.
53.
84.
13.
22.
72.
93.
32.
8*
Synt
hetic
mar
ijuan
a--
----
----
----
----
----
----
----
----
----
--0.
90.
80.
70.
5*
Coca
ine/
Crac
k0.
10.
80.
71.
31.
00.
90.
70.
70.
60.
80.
90.
80.
70.
80.
70.
60.
60.
60.
60.
40.
30.
30.
20.
2
Inha
lant
s4.
76.
15.
67.
06.
64.
83.
73.
33.
13.
03.
74.
83.
73.
63.
13.
02.
71.
71.
41.
10.
70.
70.
70.
5
Met
ham
phet
amin
es--
----
----
----
----
----
--0.
60.
60.
50.
40.
50.
50.
50.
30.
30.
30.
20.
1
Hero
in0.
10.
80.
60.
90.
80.
50.
50.
50.
50.
60.
60.
60.
50.
50.
40.
50.
40.
40.
40.
30.
30.
20.
20.
1*
Hallu
cinog
ens/
Ecst
asy
----
----
----
----
--0.
80.
80.
80.
70.
50.
50.
40.
50.
40.
50.
30.
20.
30.
30.
3
Pres
crip
tion
drug
s--
----
----
1.4
1.0
1.2
0.8
0.8
0.9
0.8
0.8
0.8
1.0
0.8
0.8
1.5
1.4
1.1
1.2
1.2
1.4
1.6
Ove
r the
cou
nter
dru
gs--
----
----
----
----
----
----
--3.
43.
53.
01.
61.
61.
31.
21.
22.
42.
7
NO
TES:
--
Dat
a no
t ava
ilabl
e
# B
inge
drin
king
dur
ing
the
past
two
wee
ks.
*
Sta
tistic
ally
sig
nific
ant c
hang
es b
etw
een
2015
and
201
6 pr
eval
ence
rate
s (p
< .0
5).
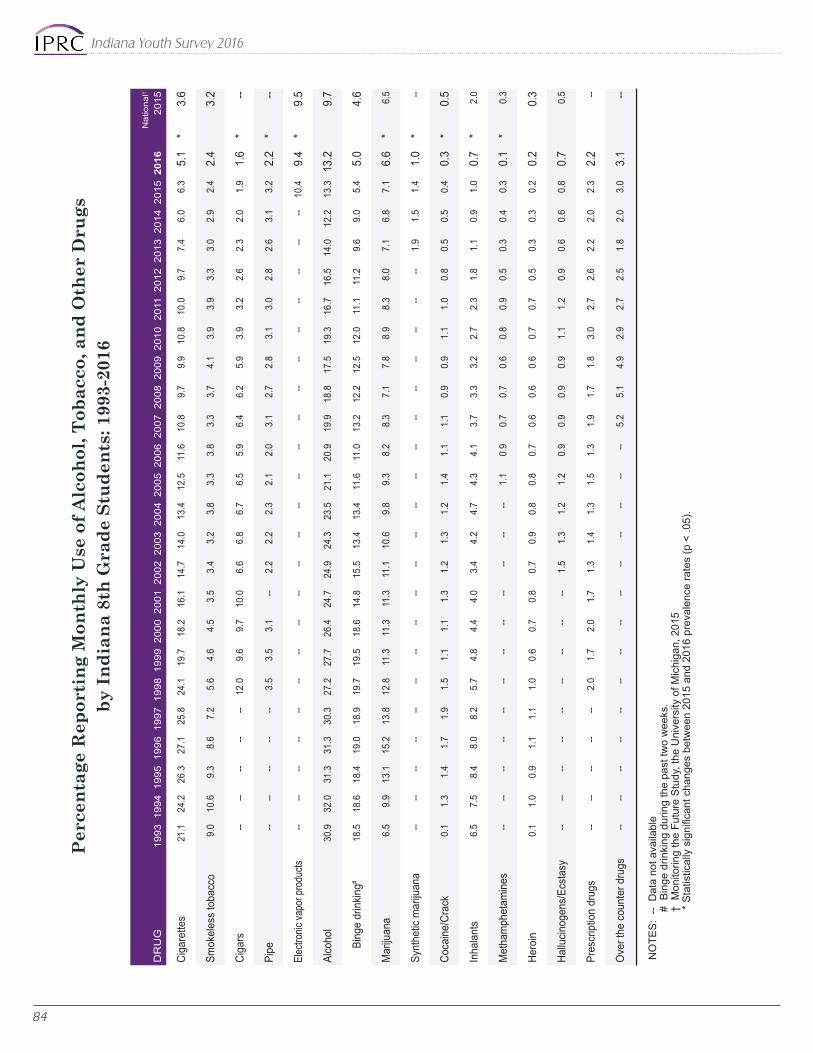
Indiana Youth Survey 2016
84
Per
cent
age
Rep
orti
ng M
onth
ly U
se o
f Alc
ohol
, Tob
acco
, and
Oth
er D
rugs
by I
ndia
na 8
th G
rade
Stu
dent
s: 1
993-
2016
NO
TES:
--
Dat
a no
t ava
ilabl
e
# B
inge
drin
king
dur
ing
the
past
two
wee
ks.
†
Mon
itorin
g th
e Fu
ture
Stu
dy, t
he U
nive
rsity
of M
ichi
gan,
201
5
* S
tatis
tical
ly s
igni
fican
t cha
nges
bet
wee
n 20
15 a
nd 2
016
prev
alen
ce ra
tes
(p <
.05)
.
DR
UG
1993
1994
1995
1996
1997
1998
1999
2000
2001
2002
2003
2004
2005
2006
2007
2008
2009
2010
2011
2012
2013
2014
2015
2016
Nat
iona
l†
2015
Ciga
rette
s21
.124
.226
.327
.125
.824
.119
.718
.216
.114
.714
.013
.412
.511
.610
.89.
79.
910
.810
.09.
77.
46.
06.
35.
1*
3.6
Smok
eles
s to
bacc
o9.
010
.69.
38.
67.
25.
64.
64.
53.
53.
43.
23.
83.
33.
83.
33.
74.
13.
93.
93.
33.
02.
92.
42.
43.
2
Ciga
rs--
----
----
12.0
9.6
9.7
10.0
6.6
6.8
6.7
6.5
5.9
6.4
6.2
5.9
3.9
3.2
2.6
2.3
2.0
1.9
1.6
*--
Pipe
----
----
--3.
53.
53.
1--
2.2
2.2
2.3
2.1
2.0
3.1
2.7
2.8
3.1
3.0
2.8
2.6
3.1
3.2
2.2
*--
Elec
tronic
vapo
r pro
ducts
----
----
----
----
----
----
----
----
----
----
----
10.4
9.4
*9.
5
Alco
hol
30.9
32.0
31.3
31.3
30.3
27.2
27.7
26.4
24.7
24.9
24.3
23.5
21.1
20.9
19.9
18.8
17.5
19.3
16.7
16.5
14.0
12.2
13.3
13.2
9.7
B
inge
drin
king#
18.5
18.6
18.4
19.0
18.9
19.7
19.5
18.6
14.8
15.5
13.4
13.4
11.6
11.0
13.2
12.2
12.5
12.0
11.1
11.2
9.6
9.0
5.4
5.0
4.6
Mar
ijuan
a6.
59.
913
.115
.213
.812
.811
.311
.311
.311
.110
.69.
89.
38.
28.
37.
17.
88.
98.
38.
07.
16.
87.
16.
6*
6.5
Synt
hetic
mar
ijuan
a--
----
----
----
----
----
----
----
----
----
--1.
91.
51.
41.
0*
--
Coca
ine/
Crac
k0.
11.
31.
41.
71.
91.
51.
11.
11.
31.
21.
31.
21.
41.
11.
10.
90.
91.
11.
00.
80.
50.
50.
40.
3*
0.5
Inha
lant
s6.
57.
58.
48.
08.
25.
74.
84.
44.
03.
44.
24.
74.
34.
13.
73.
33.
22.
72.
31.
81.
10.
91.
00.
7*
2.0
Met
ham
phet
amin
es--
----
----
----
----
----
--1.
10.
90.
70.
70.
60.
80.
90.
50.
30.
40.
30.
1*
0.3
Hero
in0.
11.
00.
91.
11.
11.
00.
60.
70.
80.
70.
90.
80.
80.
70.
60.
60.
60.
70.
70.
50.
30.
30.
20.
20.
3
Hallu
cinog
ens/
Ecst
asy
----
----
----
----
--1.
51.
31.
21.
20.
90.
90.
90.
91.
11.
20.
90.
60.
60.
80.
70.
5
Pres
crip
tion
drug
s--
----
----
2.0
1.7
2.0
1.7
1.3
1.4
1.3
1.5
1.3
1.9
1.7
1.8
3.0
2.7
2.6
2.2
2.0
2.3
2.2
--
Ove
r the
cou
nter
dru
gs--
----
----
----
----
----
----
--5.
25.
14.
92.
92.
72.
51.
82.
03.
03.
1--

85
Statewide Data
Per
cent
age
Rep
orti
ng M
onth
ly U
se o
f Alc
ohol
, Tob
acco
, and
Oth
er D
rugs
by I
ndia
na 9
th G
rade
Stu
dent
s: 1
993-
2016
DR
UG
1993
1994
1995
1996
1997
1998
1999
2000
2001
2002
2003
2004
2005
2006
2007
2008
2009
2010
2011
2012
2013
2014
2015
2016
Ciga
rette
s26
.229
.430
.834
.430
.528
.925
.424
.921
.819
.117
.918
.216
.416
.514
.714
.713
.815
.214
.412
.710
.49.
37.
77.
3
Smok
eles
s to
bacc
o12
.213
.313
.212
.59.
88.
36.
56.
55.
45.
24.
95.
65.
25.
75.
36.
05.
96.
66.
25.
65.
15.
04.
13.
8
Ciga
rs--
----
----
15.5
13.2
12.6
14.1
9.2
8.3
9.1
8.6
8.8
8.7
8.6
8.6
6.3
6.0
5.2
3.6
3.4
2.8
3.0
Pipe
----
----
--4.
54.
14.
2--
2.9
2.7
3.2
2.7
3.0
4.4
4.4
4.4
5.2
4.8
4.3
4.1
5.1
4.4
3.3
*
Elec
tronic
vapo
r pro
ducts
----
----
----
----
----
----
----
----
----
----
----
14.4
13.7
Alco
hol
38.2
39.6
38.5
40.8
36.0
36.7
36.2
35.3
33.2
30.5
30.8
29.4
26.6
28.5
24.8
24.5
22.1
24.4
23.8
22.4
18.7
17.1
17.7
18.2
B
inge
drin
king#
23.3
23.6
23.3
25.5
23.1
25.7
24.3
24.3
19.7
19.8
17.9
17.3
14.8
15.6
16.9
16.2
15.5
15.2
15.3
14.2
12.4
10.9
7.3
7.8
Mar
ijuan
a10
.615
.215
.922
.817
.218
.416
.215
.616
.114
.613
.912
.111
.511
.410
.310
.410
.512
.713
.011
.59.
79.
49.
910
.0
Synt
hetic
mar
ijuan
a--
----
----
----
----
----
----
----
----
----
--2.
72.
11.
71.
5
Coca
ine/
Crac
k0.
11.
61.
72.
42.
22.
41.
41.
61.
61.
61.
82.
01.
71.
71.
41.
41.
21.
41.
41.
00.
50.
80.
60.
4*
Inha
lant
s5.
27.
36.
97.
26.
15.
84.
44.
23.
73.
03.
03.
93.
63.
62.
93.
02.
62.
82.
21.
61.
21.
00.
80.
8
Met
ham
phet
amin
es--
----
----
----
----
----
--1.
51.
20.
80.
90.
80.
90.
90.
70.
50.
50.
40.
2*
Hero
in0.
11.
10.
91.
31.
00.
90.
60.
70.
80.
70.
90.
90.
90.
80.
70.
80.
80.
90.
80.
60.
40.
50.
30.
1*
Hallu
cinog
ens/
Ecst
asy
----
----
----
----
--2.
01.
51.
61.
41.
31.
11.
31.
11.
71.
51.
20.
80.
91.
21.
2
Pres
crip
tion
drug
s--
----
----
3.0
2.0
2.5
2.4
1.9
1.8
1.9
2.0
2.0
2.8
3.0
2.6
4.6
4.3
3.6
3.3
3.0
3.2
3.1
Ove
r the
cou
nter
dru
gs--
----
----
----
----
----
----
--5.
65.
75.
04.
03.
52.
92.
22.
12.
93.
3*
NO
TES:
--
Dat
a no
t ava
ilabl
e
# B
inge
drin
king
dur
ing
the
past
two
wee
ks.
*
Sta
tistic
ally
sig
nific
ant c
hang
es b
etw
een
2015
and
201
6 pr
eval
ence
rate
s (p
< .0
5).

Indiana Youth Survey 2016
86
Per
cent
age
Rep
orti
ng M
onth
ly U
se o
f Alc
ohol
, Tob
acco
, and
Oth
er D
rugs
by I
ndia
na 1
0th
Gra
de S
tude
nts:
199
3-20
16
NO
TES:
--
Dat
a no
t ava
ilabl
e
# B
inge
drin
king
dur
ing
the
past
two
wee
ks.
†
Mon
itorin
g th
e Fu
ture
Stu
dy, t
he U
nive
rsity
of M
ichi
gan,
201
5
* S
tatis
tical
ly s
igni
fican
t cha
nges
bet
wee
n 20
15 a
nd 2
016
prev
alen
ce ra
tes
(p <
.05)
.
DR
UG
1993
1994
1995
1996
1997
1998
1999
2000
2001
2002
2003
2004
2005
2006
2007
2008
2009
2010
2011
2012
2013
2014
2015
2016
Nat
iona
l†
2015
Ciga
rette
s30
.433
.034
.436
.737
.233
.931
.528
.927
.023
.822
.222
.120
.820
.619
.318
.718
.118
.617
.216
.312
.611
.910
.78.
4*
6.3
Smok
eles
s to
bacc
o13
.213
.613
.814
.612
.39.
58.
27.
46.
97.
16.
06.
47.
07.
87.
37.
57.
68.
17.
97.
16.
76.
15.
34.
6*
4.9
Ciga
rs--
----
----
19.0
16.5
14.6
17.8
11.9
11.5
12.4
11.8
11.6
12.3
11.8
11.8
9.3
8.7
7.5
5.8
5.2
4.8
3.7
*--
Pipe
----
----
--4.
84.
33.
6--
3.2
3.3
2.9
3.2
3.4
6.8
5.6
5.8
6.8
6.6
6.1
5.7
7.1
5.7
4.0
*--
Elec
tronic
vapo
r pro
ducts
----
----
----
----
----
----
----
----
----
----
----
18.2
15.4
*14
.0
Alco
hol
43.8
44.9
42.7
43.7
43.9
41.3
41.6
39.7
39.7
38.1
36.9
34.1
33.0
33.0
31.1
28.4
27.3
30.3
28.4
27.4
24.7
22.6
22.8
22.9
21.5
B
inge
drin
king#
27.3
26.8
26.1
27.3
27.8
29.0
28.8
27.1
24.2
24.9
21.8
20.2
19.3
19.9
21.7
19.5
19.2
18.7
18.1
18.0
16.0
14.4
10.1
9.8
10.9
Mar
ijuan
a14
.318
.921
.524
.923
.721
.821
.119
.021
.419
.218
.217
.216
.014
.614
.413
.514
.616
.816
.415
.413
.713
.614
.013
.714
.8
Synt
hetic
mar
ijuan
a--
----
----
----
----
----
----
----
----
----
--2.
82.
31.
91.
5*
6.8
Coca
ine/
Crac
k1.
41.
62.
22.
62.
62.
92.
31.
72.
42.
42.
32.
42.
22.
11.
91.
71.
41.
61.
61.
31.
00.
90.
70.
70.
8
Inha
lant
s5.
05.
65.
85.
15.
34.
93.
42.
93.
32.
92.
93.
33.
03.
02.
52.
62.
22.
52.
11.
71.
10.
90.
80.
81.
2
Met
ham
phet
amin
es--
----
----
----
----
----
--1.
61.
21.
01.
00.
91.
00.
90.
90.
70.
70.
50.
30.
3
Hero
in0.
10.
91.
01.
31.
01.
30.
90.
71.
00.
80.
90.
90.
90.
80.
81.
00.
80.
90.
90.
70.
50.
50.
30.
30.
2
Hallu
cinog
ens/
Ecst
asy
----
----
----
----
--2.
21.
71.
51.
41.
51.
21.
51.
12.
01.
91.
51.
21.
21.
81.
70.
9
Pres
crip
tion
drug
s--
----
----
2.5
2.1
2.4
2.6
2.2
2.1
2.0
2.1
2.2
3.7
3.5
3.3
5.9
5.2
5.0
4.3
3.9
4.4
3.9
*--
Ove
r the
cou
nter
dru
gs--
----
----
----
----
----
----
--5.
95.
95.
24.
13.
63.
22.
42.
43.
33.
2--

87
Statewide Data
Per
cent
age
Rep
orti
ng M
onth
ly U
se o
f Alc
ohol
, Tob
acco
, and
Oth
er D
rugs
by I
ndia
na 1
1th
Gra
de S
tude
nts:
199
3-20
16
NO
TES:
--
Dat
a no
t ava
ilabl
e
# B
inge
drin
king
dur
ing
the
past
two
wee
ks.
*
Sta
tistic
ally
sig
nific
ant c
hang
es b
etw
een
2015
and
201
6 pr
eval
ence
rate
s (p
< .0
5).
DR
UG
1993
1994
1995
1996
1997
1998
1999
2000
2001
2002
2003
2004
2005
2006
2007
2008
2009
2010
2011
2012
2013
2014
2015
2016
Ciga
rette
s33
.734
.439
.340
.139
.239
.837
.434
.130
.227
.125
.225
.123
.523
.822
.521
.321
.421
.920
.719
.016
.515
.013
.111
.4*
Smok
eles
s to
bacc
o14
.414
.615
.414
.212
.010
.28.
99.
77.
07.
57.
28.
17.
38.
08.
18.
28.
89.
28.
88.
48.
17.
86.
55.
8*
Ciga
rs--
----
----
21.0
18.6
16.8
19.8
13.4
13.1
13.9
13.0
12.8
13.8
13.6
13.9
11.8
11.1
9.9
8.6
7.5
6.7
5.8
*
Pipe
----
----
--4.
54.
33.
8--
3.2
3.2
3.2
3.0
3.5
7.4
7.0
7.5
8.4
8.3
7.2
7.2
8.7
6.4
5.1
*
Elec
tronic
vapo
r pro
ducts
----
----
----
----
----
----
----
----
----
----
----
20.3
18.8
*
Alco
hol
49.4
47.0
47.7
48.2
45.8
47.8
45.6
43.2
42.1
41.4
38.1
36.5
34.5
35.8
33.8
31.7
29.4
32.3
31.7
31.1
28.5
25.8
28.1
26.9
B
inge
drin
king#
30.6
28.9
29.6
30.1
29.8
32.3
31.3
30.0
25.7
26.5
24.0
23.3
21.2
21.8
23.2
22.5
21.4
20.9
20.8
20.5
18.9
16.8
12.7
12.2
Mar
ijuan
a16
.719
.621
.825
.722
.324
.622
.020
.521
.721
.218
.417
.215
.315
.714
.614
.615
.317
.918
.615
.815
.315
.816
.616
.2
Synt
hetic
mar
ijuan
a--
----
----
----
----
----
----
----
----
----
--3.
02.
52.
01.
5*
Coca
ine/
Crac
k1.
21.
62.
03.
02.
93.
32.
42.
22.
62.
72.
53.
12.
12.
72.
11.
81.
41.
91.
81.
41.
01.
00.
90.
9
Inha
lant
s3.
84.
24.
34.
33.
63.
92.
72.
82.
32.
12.
22.
72.
12.
32.
21.
91.
92.
11.
81.
51.
11.
00.
90.
8
Met
ham
phet
amin
es--
----
----
----
----
----
--1.
51.
51.
10.
90.
91.
21.
30.
80.
90.
70.
50.
5
Hero
in0.
10.
60.
80.
80.
81.
00.
70.
90.
70.
60.
81.
10.
81.
00.
90.
70.
81.
11.
10.
70.
70.
70.
30.
4
Hallu
cinog
ens/
Ecst
asy
----
----
----
----
--2.
11.
71.
71.
31.
61.
31.
41.
32.
12.
21.
61.
31.
42.
42.
0
Pres
crip
tion
drug
s--
----
----
2.4
1.9
2.2
2.0
2.0
1.8
1.6
1.8
2.0
3.2
3.4
3.4
6.2
5.6
5.5
5.1
4.4
5.2
4.9
Ove
r the
cou
nter
dru
gs--
----
----
----
----
----
----
--4.
74.
64.
43.
63.
33.
02.
32.
63.
33.
3

Indiana Youth Survey 2016
88
Per
cent
age
Rep
orti
ng M
onth
ly U
se o
f Alc
ohol
, Tob
acco
, and
Oth
er D
rugs
by I
ndia
na 1
2th
Gra
de S
tude
nts:
199
3-20
16
DR
UG
1993
1994
1995
1996
1997
1998
1999
2000
2001
2002
2003
2004
2005
2006
2007
2008
2009
2010
2011
2012
2013
2014
2015
2016
Nat
iona
l†
2015
Ciga
rette
s35
.637
.340
.639
.841
.641
.640
.538
.935
.130
.528
.827
.426
.526
.924
.324
.824
.424
.924
.622
.819
.517
.616
.214
.9*
11.4
Smok
eles
s to
bacc
o15
.415
.516
.514
.413
.512
.111
.211
.39.
48.
37.
98.
78.
69.
89.
19.
810
.510
.510
.710
.710
.29.
38.
37.
4*
6.1
Ciga
rs--
----
----
25.8
23.0
20.2
23.9
16.8
17.0
16.8
17.6
16.6
17.5
17.7
17.9
16.8
16.7
15.5
13.8
12.4
11.4
10.2
*--
Pipe
----
----
--4.
85.
24.
4--
3.3
3.3
3.4
3.7
4.6
9.3
10.1
10.3
13.0
12.5
11.4
11.5
12.5
9.4
7.5
*--
Elec
tronic
vapo
r pro
ducts
----
----
----
----
----
----
----
----
----
----
----
24.8
21.6
*16
.2
Alco
hol
53.2
53.7
51.2
52.5
50.1
52.0
51.7
50.1
49.9
48.1
46.1
42.2
41.8
42.2
39.7
38.4
35.7
39.4
37.8
37.6
34.9
33.9
33.2
34.6
*35
.3
B
inge
drin
king#
34.3
34.8
33.3
35.6
33.2
37.5
36.3
35.4
31.9
31.5
29.3
27.0
25.9
27.3
28.6
26.9
26.4
26.2
26.4
26.0
23.5
22.3
16.7
17.5
17.2
Mar
ijuan
a17
.821
.624
.025
.423
.524
.523
.522
.723
.520
.519
.818
.317
.817
.215
.816
.216
.719
.219
.817
.817
.617
.618
.820
.3*
21.3
Synt
hetic
mar
ijuan
a--
----
----
----
----
----
----
----
----
----
--3.
02.
22.
11.
6*
--
Coca
ine/
Crac
k1.
52.
02.
53.
03.
33.
52.
42.
72.
82.
92.
52.
92.
93.
12.
42.
01.
61.
92.
01.
61.
21.
31.
01.
4*
1.1
Inha
lant
s2.
93.
83.
83.
13.
33.
22.
62.
42.
01.
91.
71.
81.
92.
21.
51.
61.
41.
81.
71.
31.
11.
00.
80.
80.
7
Met
ham
phet
amin
es--
----
----
----
----
----
--1.
71.
51.
00.
90.
91.
01.
31.
10.
90.
70.
50.
7*
0.4
Hero
in0.
10.
70.
91.
11.
01.
10.
70.
90.
80.
60.
60.
80.
71.
00.
80.
80.
81.
11.
21.
00.
80.
70.
40.
5
0.3
Hallu
cinog
ens/
Ecst
asy
----
----
----
----
--1.
51.
51.
41.
21.
31.
11.
31.
22.
02.
41.
81.
61.
62.
93.
2
1.1
Pres
crip
tion
drug
s--
----
----
1.7
1.5
1.9
2.0
1.4
1.5
1.4
1.7
1.8
2.9
3.3
3.1
5.9
5.9
5.8
5.7
5.0
6.0
6.0
6.
4
Ove
r the
cou
nter
dru
gs--
----
----
----
----
----
----
--4.
34.
34.
03.
23.
22.
92.
62.
33.
13.
4--
NO
TES:
--
Dat
a no
t ava
ilabl
e
# B
inge
drin
king
dur
ing
the
past
two
wee
ks.
†
Mon
itorin
g th
e Fu
ture
Stu
dy, t
he U
nive
rsity
of M
ichi
gan,
201
5
* S
tatis
tical
ly s
igni
fican
t cha
nges
bet
wee
n 20
15 a
nd 2
016
prev
alen
ce ra
tes
(p <
.05)
.

89
Statewide Data
DR
UG
7th
8th
9th
10th
11th
12th
Ciga
rette
s11
.211
.812
.513
.113
.914
.5
Smok
eles
s to
bacc
o11
.412
.112
.913
.614
.114
.8
Ciga
rs11
.512
.213
.013
.814
.515
.4
Pipe
11.7
12.5
13.3
14.0
14.7
15.4
Elec
troni
c va
por p
rodu
cts
12.0
12.8
13.7
14.5
15.3
15.9
Alco
hol
11.3
12.0
12.9
13.7
14.3
14.8
Mar
ijuan
a11
.812
.513
.213
.914
.515
.0
Synt
hetic
mar
ijuan
a11
.912
.513
.313
.814
.214
.5
Coca
ine/
Crac
k10
.912
.613
.014
.014
.615
.6
Inha
lant
s11
.211
.812
.813
.313
.914
.4
Met
ham
phet
amin
es11
.012
.412
.714
.014
.715
.5
Hero
in11
.412
.711
.913
.513
.815
.1
Hallu
cinog
ens/
Ecst
asy
12.0
12.8
13.6
14.6
15.2
16.0
Pres
crip
tion
drug
s11
.011
.912
.814
.014
.715
.2
Ove
r the
cou
nter
dru
gs10
.811
.512
.213
.113
.814
.5
Mea
n A
ge o
f Fir
st T
ime
Use
of A
lcoh
ol, T
obac
co, a
nd O
ther
Dru
gs, 2
016
DR
UG
6th
Ciga
rette
s10
.6
Alco
hol
10.7
Mar
ijuan
a11
.2
Inha
lant
s10
.5
Pres
crip
tiong
dru
gs10
.4
Oth
er ill
egal
dru
gs10
.8


91
Indiana Prevention Resource Center
III. PREVALENCE OF USEBY RACE/ETHNICITY

Indiana Youth Survey 2016
92
Monthly Use of Alcohol, Tobacco, and Other Drugs, 2016(Values expressed as percentages)
6th Grade
DRUG White Black Hispanic Other Indiana
Cigarettes 1.2 1.4 1.3 1.6 1.3
Alcohol 3.2 5.4 * 4.3 3.9 3.6
Marijuana 0.6 * 2.8 * 1.2 1.3 1.0
Inhalants 0.5 0.8 0.4 0.6 0.5
Prescription drugs 1.6 1.4 1.0 * 2.8 * 1.7
Other illegal drugs 0.2 0.7 * 0.4 0.4 0.3
NOTES: * Statistically significant differences from the Indiana rates (p < .05).

93
NOTES: * Statistically significant differences from the Indiana rates (p < .05). # Binge drinking during the past two weeks.
Monthly Use of Alcohol, Tobacco, and Other Drugs, 2016(Values expressed as percentages)
7th Grade
DRUG White Black Hispanic Other Indiana
Cigarettes 2.7 1.3 * 4.2 * 3.2 2.8
Smokeless tobacco 1.3 0.7 1.3 1.5 1.3
Cigars 0.6 0.1 1.3 * 1.0 0.7
Pipe 0.6 * 2.0 * 2.4 * 1.2 1.0
Electonic vapor products 4.3 * 5.3 8.2 * 5.2 4.9
Alcohol 6.5 * 7.1 11.3 * 9.2 * 7.4
Binge drinking# 2.1 * 2.9 4.7 * 3.6 * 2.6
Marijuana 2.3 * 4.0 4.2 * 4.0 * 2.8
Synthetic marijuana 0.3 0.4 0.9 * 0.9 * 0.5
Cocaine/Crack 0.1 0.3 0.4 0.4 * 0.2
Inhalants 0.5 0.3 0.5 0.8 0.5
Methamphetamines 0.1 0.1 0.2 0.3 * 0.1
Heroin 0.0 0.0 0.4 * 0.3 * 0.1
Hallucinogens/Ecstasy 0.2 * 0.0 0.8 * 0.7 * 0.3
Prescription drugs 1.5 1.3 2.0 2.2 1.6
Over the counter drugs 2.6 2.8 3.8 * 2.8 2.7
Race/Ethnicity Data

Indiana Youth Survey 2016
94
NOTES: * Statistically significant differences from the Indiana rates (p < .05). # Binge drinking during the past two weeks.
Monthly Use of Alcohol, Tobacco, and Other Drugs, 2016(Values expressed as percentages)
8th Grade
DRUG White Black Hispanic Other Indiana
Cigarettes 5.0 2.7 * 6.6 * 5.3 5.1
Smokeless tobacco 2.7 0.7 * 2.3 2.1 2.4
Cigars 1.4 1.4 2.3 * 2.1 1.6
Pipe 1.7 * 2.6 3.9 * 3.2 * 2.2
Electonic vapor products 8.7 * 7.7 * 12.6 * 11.3 * 9.4
Alcohol 12.1 * 10.7 * 18.2 * 16.5 * 13.2
Binge drinking# 4.2 * 3.7 * 8.2 * 7.4 * 5.0
Marijuana 5.1 * 11.5 * 9.7 * 9.2 * 6.6
Synthetic marijuana 0.8 1.4 1.6 * 1.4 1.0
Cocaine/Crack 0.2 0.1 0.5 * 0.6 * 0.3
Inhalants 0.7 0.7 0.9 0.8 0.7
Methamphetamines 0.1 0.1 0.3 * 0.2 0.1
Heroin 0.2 0.1 0.3 0.4 0.2
Hallucinogens/Ecstasy 0.5 0.7 1.2 * 0.9 0.7
Prescription drugs 2.1 1.8 2.8 2.7 2.2
Over the counter drugs 2.7 * 4.0 4.2 * 4.3 * 3.1

95
NOTES: * Statistically significant differences from the Indiana rates (p < .05). # Binge drinking during the past two weeks.
Monthly Use of Alcohol, Tobacco, and Other Drugs, 2016(Values expressed as percentages)
9th Grade
DRUG White Black Hispanic Other Indiana
Cigarettes 7.7 3.5 * 7.4 6.8 7.3
Smokeless tobacco 4.3 * 1.4 * 2.3 * 3.0 3.8
Cigars 3.1 1.6 * 3.0 2.8 3.0
Pipe 2.8 * 4.4 5.7 * 4.0 3.3
Electonic vapor products 13.5 11.1 * 17.0 * 12.1 13.7
Alcohol 17.9 13.9 * 21.7 * 17.9 18.2
Binge drinking# 7.5 6.0 * 10.6 * 7.4 7.8
Marijuana 8.6 * 15.8 * 13.8 * 12.6 * 10.0
Synthetic marijuana 1.3 1.6 1.9 2.2 * 1.5
Cocaine/Crack 0.4 0.4 0.7 0.8 0.4
Inhalants 0.8 0.4 1.1 0.7 0.8
Methamphetamines 0.2 0.1 0.2 0.6 * 0.2
Heroin 0.1 0.0 0.1 0.4 * 0.1
Hallucinogens/Ecstasy 1.0 1.4 1.7 1.5 1.2
Prescription drugs 2.9 3.1 3.7 3.5 3.1
Over the counter drugs 3.0 4.7 * 4.2 * 3.6 3.3
Race/Ethnicity Data

Indiana Youth Survey 2016
96
NOTES: * Statistically significant differences from the Indiana rates (p < .05). # Binge drinking during the past two weeks.
Monthly Use of Alcohol, Tobacco, and Other Drugs, 2016(Values expressed as percentages)
10th Grade
DRUG White Black Hispanic Other Indiana
Cigarettes 9.0 3.8 * 8.2 8.0 8.4
Smokeless tobacco 5.1 * 1.1 * 3.9 4.3 4.6
Cigars 3.9 2.8 3.1 3.3 3.7
Pipe 3.5 * 3.8 6.4 * 5.2 * 4.0
Electonic vapor products 15.4 11.4 * 17.3 * 16.1 15.4
Alcohol 22.2 19.9 * 27.8 * 24.4 22.9
Binge drinking# 9.4 6.3 * 13.4 * 10.8 9.8
Marijuana 11.8 * 18.7 * 18.0 * 18.2 * 13.7
Synthetic marijuana 1.5 1.1 2.1 * 1.8 1.5
Cocaine/Crack 0.6 0.3 1.1 * 0.8 0.7
Inhalants 0.8 0.5 0.7 0.8 0.8
Methamphetamines 0.4 0.2 0.2 0.2 0.3
Heroin 0.3 0.1 0.2 0.4 0.3
Hallucinogens/Ecstasy 1.5 1.2 2.4 * 2.0 1.7
Prescription drugs 3.6 3.1 5.3 * 5.0 * 3.9
Over the counter drugs 2.5 * 4.6 * 4.9 * 4.6 * 3.2

97
NOTES: * Statistically significant differences from the Indiana rates (p < .05). # Binge drinking during the past two weeks.
Monthly Use of Alcohol, Tobacco, and Other Drugs, 2016(Values expressed as percentages)
11th Grade
DRUG White Black Hispanic Other Indiana
Cigarettes 12.1 4.5 * 10.1 13.0 11.4
Smokeless tobacco 6.6 * 1.2 * 4.5 * 4.9 5.8
Cigars 5.9 3.4 * 5.9 6.9 5.8
Pipe 4.6 6.2 7.1 * 6.6 5.1
Electonic vapor products 19.4 11.5 * 19.1 18.7 18.8
Alcohol 26.9 22.5 * 29.2 27.8 26.9
Binge drinking# 12.1 7.8 * 14.5 * 12.9 12.2
Marijuana 14.5 * 23.9 * 18.9 * 21.0 * 16.2
Synthetic marijuana 1.3 1.6 2.5 * 2.0 1.5
Cocaine/Crack 0.7 0.2 2.0 * 1.3 0.9
Inhalants 0.7 0.7 1.2 1.5 * 0.8
Methamphetamines 0.4 0.2 1.2 * 0.5 0.5
Heroin 0.3 0.0 0.9 * 0.6 0.4
Hallucinogens/Ecstasy 1.8 1.8 2.8 3.3 * 2.0
Prescription drugs 4.4 4.5 6.7 * 6.8 * 4.9
Over the counter drugs 2.5 * 5.7 * 4.4 * 6.8 * 3.3
Race/Ethnicity Data

Indiana Youth Survey 2016
98
NOTES: * Statistically significant differences from the Indiana rates (p < .05). # Binge drinking during the past two weeks.
Monthly Use of Alcohol, Tobacco, and Other Drugs, 2016(Values expressed as percentages)
12th Grade
DRUG White Black Hispanic Other Indiana
Cigarettes 16.2 * 5.2 * 13.5 14.8 14.9
Smokeless tobacco 8.4 * 1.9 * 6.7 4.6 * 7.4
Cigars 11.2 * 4.4 * 8.7 8.7 10.2
Pipe 7.1 7.4 9.0 8.8 7.5
Electonic vapor products 22.1 14.2 * 23.1 22.3 21.6
Alcohol 35.2 27.4 * 35.9 34.2 34.6
Binge drinking# 18.0 11.5 * 19.4 15.8 17.5
Marijuana 18.1 * 29.6 * 22.8 * 26.9 * 20.3
Synthetic marijuana 1.5 1.0 2.3 2.1 1.6
Cocaine/Crack 1.2 1.1 2.2 * 2.0 1.4
Inhalants 0.8 0.5 1.1 0.7 0.8
Methamphetamines 0.6 0.2 1.4 * 1.1 0.7
Heroin 0.4 0.4 0.8 0.4 0.5
Hallucinogens/Ecstasy 3.3 1.3 * 3.4 3.8 3.2
Prescription drugs 6.0 4.4 * 6.1 8.1 * 6.0
Over the counter drugs 2.9 * 6.1 * 3.7 5.1 * 3.4

99
Indiana Prevention Resource Center
IV. PREVALENCE OF USEBY GENDER

Indiana Youth Survey 2016
100
Mon
thly
Use
of A
lcoh
ol, T
obac
co, a
nd O
ther
Dru
gs, 2
016
(Val
ues e
xpre
ssed
as p
erce
ntag
es)
6th
Gra
de
Mon
thly
Use
of A
lcoh
ol, T
obac
co, a
nd O
ther
Dru
gs, 2
016
(Val
ues e
xpre
ssed
as p
erce
ntag
es)
7th
Gra
de
DRUG
Mal
eFe
mal
eIn
dian
a
Ciga
rette
s1.
41.
11.
3
Alco
hol*
4.1
3.1
3.6
Mar
ijuan
a*1.
10.
81.
0
Inha
lant
s0.
50.
60.
5
Pres
crip
tion
drug
s1.
71.
61.
7
Oth
er ill
egal
dru
gs0.
30.
20.
3
DRUG
Mal
eFe
mal
eIn
dian
a
Ciga
rette
s2.
73.
02.
8
Smok
eles
s to
bacc
o*1.
90.
61.
3
Ciga
rs*
0.9
0.5
0.7
Pipe
1.0
0.9
1.0
Elec
toni
c va
por p
rodu
cts
5.0
4.7
4.9
Alco
hol
7.7
7.1
7.4
B
inge
drin
king#
2.5
2.8
2.6
Mar
ijuan
a2.
92.
72.
8
Synt
hetic
mar
ijuan
a*0.
60.
30.
5
Coca
ine/
Crac
k0.
20.
20.
2
Inha
lant
s0.
40.
60.
5
Met
ham
phet
amin
es0.
10.
20.
1
Hero
in0.
10.
10.
1
Hallu
cinog
ens/
Ecst
asy
0.3
0.3
0.3
Pres
crip
tion
drug
s1.
51.
71.
6
Ove
r the
cou
nter
dru
gs2.
72.
82.
7
NOTE
S: *
Diff
eren
ces
betw
een
mal
es a
nd fe
mal
es a
re s
tatis
tical
ly sig
nific
ant (
p <
.05)
.
# B
inge
drin
king
durin
g th
e pa
st tw
o we
eks.
NOTE
S: *
Diff
eren
ces
betw
een
mal
es a
nd fe
mal
es a
re s
tatis
tical
ly sig
nific
ant (
p <
.05)
.

101
Gender Data
Mon
thly
Use
of A
lcoh
ol, T
obac
co, a
nd O
ther
Dru
gs, 2
016
(Val
ues e
xpre
ssed
as p
erce
ntag
es)
8th
Gra
de
Mon
thly
Use
of A
lcoh
ol, T
obac
co, a
nd O
ther
Dru
gs, 2
016
(Val
ues e
xpre
ssed
as p
erce
ntag
es)
9th
Gra
de
DRUG
Mal
eFe
mal
eIn
dian
a
Ciga
rette
s*4.
65.
65.
1
Smok
eles
s to
bacc
o*3.
81.
02.
4
Ciga
rs*
2.1
1.1
1.6
Pipe
2.1
2.3
2.2
Elec
toni
c va
por p
rodu
cts
9.2
9.6
9.4
Alco
hol*
11.9
14.5
13.2
B
inge
drin
king# *
4.4
5.6
5.0
Mar
ijuan
a6.
56.
76.
6
Synt
hetic
mar
ijuan
a1.
01.
11.
0
Coca
ine/
Crac
k0.
30.
30.
3
Inha
lant
s0.
60.
80.
7
Met
ham
phet
amin
es0.
10.
10.
1
Hero
in0.
20.
20.
2
Hallu
cinog
ens/
Ecst
asy
0.8
0.6
0.7
Pres
crip
tion
drug
s2.
02.
42.
2
Ove
r the
cou
nter
dru
gs*
2.9
3.4
3.1
DRUG
Mal
eFe
mal
eIn
dian
a
Ciga
rette
s7.
07.
77.
3
Smok
eles
s to
bacc
o*6.
11.
53.
8
Ciga
rs*
4.2
1.8
3.0
Pipe
3.3
3.4
3.3
Elec
toni
c va
por p
rodu
cts
13.9
13.5
13.7
Alco
hol*
16.4
19.9
18.2
B
inge
drin
king# *
7.3
8.3
7.8
Mar
ijuan
a*9.
510
.510
.0
Synt
hetic
mar
ijuan
a1.
71.
31.
5
Coca
ine/
Crac
k0.
50.
40.
4
Inha
lant
s0.
70.
90.
8
Met
ham
phet
amin
es0.
20.
20.
2
Hero
in0.
20.
10.
1
Hallu
cinog
ens/
Ecst
asy
1.2
1.2
1.2
Pres
crip
tion
drug
s*2.
53.
63.
1
Ove
r the
cou
nter
dru
gs*
2.9
3.7
3.3
NOTE
S: *
Diff
eren
ces
betw
een
mal
es a
nd fe
mal
es a
re s
tatis
tical
ly sig
nific
ant (
p <
.05)
.
# B
inge
drin
king
durin
g th
e pa
st tw
o we
eks.
NOTE
S: *
Diff
eren
ces
betw
een
mal
es a
nd fe
mal
es a
re s
tatis
tical
ly sig
nific
ant (
p <
.05)
.
# B
inge
drin
king
durin
g th
e pa
st tw
o we
eks.

Indiana Youth Survey 2016
102
Mon
thly
Use
of A
lcoh
ol, T
obac
co, a
nd O
ther
Dru
gs, 2
016
(Val
ues e
xpre
ssed
as p
erce
ntag
es)
10th
Gra
de
Mon
thly
Use
of A
lcoh
ol, T
obac
co, a
nd O
ther
Dru
gs, 2
016
(Val
ues e
xpre
ssed
as p
erce
ntag
es)
11th
Gra
de
DRUG
Mal
eFe
mal
eIn
dian
a
Ciga
rette
s8.
68.
38.
4
Smok
eles
s to
bacc
o*7.
81.
54.
6
Ciga
rs*
5.5
1.9
3.7
Pipe
4.1
4.0
4.0
Elec
toni
c va
por p
rodu
cts*
16.6
14.3
15.4
Alco
hol*
21.1
24.6
22.9
B
inge
drin
king#
9.4
10.2
9.8
Mar
ijuan
a13
.813
.513
.7
Synt
hetic
mar
ijuan
a1.
61.
51.
5
Coca
ine/
Crac
k*0.
80.
50.
7
Inha
lant
s0.
80.
70.
8
Met
ham
phet
amin
es0.
40.
30.
3
Hero
in0.
30.
20.
3
Hallu
cinog
ens/
Ecst
asy*
1.9
1.4
1.7
Pres
crip
tion
drug
s*3.
54.
23.
9
Ove
r the
cou
nter
dru
gs3.
23.
23.
2
DRUG
Mal
eFe
mal
eIn
dian
a
Ciga
rette
s12
.010
.911
.4
Smok
eles
s to
bacc
o*10
.51.
55.
8
Ciga
rs*
9.2
2.6
5.8
Pipe
*5.
94.
55.
1
Elec
toni
c va
por p
rodu
cts*
21.1
16.7
18.8
Alco
hol
26.6
27.2
26.9
B
inge
drin
king# *
13.0
11.3
12.2
Mar
ijuan
a*17
.215
.316
.2
Synt
hetic
mar
ijuan
a1.
51.
51.
5
Coca
ine/
Crac
k*1.
10.
70.
9
Inha
lant
s0.
80.
80.
8
Met
ham
phet
amin
es0.
60.
40.
5
Hero
in*
0.5
0.3
0.4
Hallu
cinog
ens/
Ecst
asy*
2.7
1.4
2.0
Pres
crip
tion
drug
s5.
04.
74.
9
Ove
r the
cou
nter
dru
gs*
3.7
2.9
3.3
NOTE
S: *
Diff
eren
ces
betw
een
mal
es a
nd fe
mal
es a
re s
tatis
tical
ly sig
nific
ant (
p <
.05)
.
# B
inge
drin
king
durin
g th
e pa
st tw
o we
eks.
NOTE
S: *
Diff
eren
ces
betw
een
mal
es a
nd fe
mal
es a
re s
tatis
tical
ly sig
nific
ant (
p <
.05)
.
# B
inge
drin
king
durin
g th
e pa
st tw
o we
eks.

103
Gender Data
Mon
thly
Use
of A
lcoh
ol, T
obac
co, a
nd O
ther
Dru
gs, 2
016
(Val
ues e
xpre
ssed
as p
erce
ntag
es)
12th
Gra
de
DRUG
Mal
eFe
mal
eIn
dian
a
Ciga
rette
s*16
.913
.014
.9
Smok
eles
s to
bacc
o*13
.02.
17.
4
Ciga
rs*
15.5
5.1
10.2
Pipe
*8.
36.
77.
5
Elec
toni
c va
por p
rodu
cts*
24.8
18.6
21.6
Alco
hol
34.1
35.1
34.6
B
inge
drin
king# *
18.9
16.1
17.5
Mar
ijuan
a*21
.619
.020
.3
Synt
hetic
mar
ijuan
a1.
81.
51.
6
Coca
ine/
Crac
k*1.
90.
91.
4
Inha
lant
s*1.
00.
60.
8
Met
ham
phet
amin
es*
0.9
0.5
0.7
Hero
in*
0.6
0.3
0.5
Hallu
cinog
ens/
Ecst
asy*
4.2
2.3
3.2
Pres
crip
tion
drug
s*6.
85.
36.
0
Ove
r the
cou
nter
dru
gs*
4.4
2.5
3.4
NOTE
S: *
Diff
eren
ces
betw
een
mal
es a
nd fe
mal
es a
re s
tatis
tical
ly sig
nific
ant (
p <
.05)
.
# B
inge
drin
king
durin
g th
e pa
st tw
o we
eks.


105
Indiana Prevention Resource Center
V. PREVALENCE OF USEBY REGION

Indiana Youth Survey 2016
106
Per
cent
age
Rep
orti
ng M
onth
ly U
se o
f Alc
ohol
, Tob
acco
, and
Oth
er D
rugs
by I
ndia
na 6
th G
rade
Stu
dent
s: 2
016
DR
UG
Indi
ana
Nor
thw
est
Nor
th
Cen
tral
Nor
thea
stW
est
Cen
tral
Eas
tS
outh
wes
tS
outh
east
Ciga
rette
s1.
31.
01.
9▲
0.7
0.6
▼0.
92.
1▲
0.9
2.1
▲
Alco
hol
3.6
4.1
3.
7
4.7
1.
8▼
3.3
4.0
3.1
4.6
▲
Mar
ijuan
a1.
00.
9
1.0
1.2
0.2
▼1.
5▲
1.3
0.5
▼0.
8
Inha
lant
s0.
50.
80.
60.
20.
20.
30.
50.
80.
5
Pres
crip
tion
drug
s1.
72.
01.
40.
51.
91.
41.
21.
62.
4▲
Oth
er ill
egal
dru
gs0.
30.
30.
30.
00.
20.
40.
10.
20.
4
NO
TES:
▲
indi
cate
s th
at lo
cal p
reva
lenc
e ra
tes
are
sign
ifica
ntly
hig
her t
han
stat
e ra
tes
(p<.
05).
▼
indi
cate
s th
at lo
cal p
reva
lenc
e ra
tes
are
sign
ifica
ntly
low
er th
an s
tate
rate
s (p
<.05
).

NO
TES:
#
Bin
ge d
rinki
ng d
urin
g th
e pa
st tw
o w
eeks
.
▲indicatesthatlocalprevalenceratesaresignificantlyhigherthanstaterates(p<.05).
▼indicatesthatlocalprevalenceratesaresignificantlylowerthanstaterates(p<.05).
107
Regional Data
Per
cent
age
Rep
orti
ng M
onth
ly U
se o
f Alc
ohol
, Tob
acco
, and
Oth
er D
rugs
by I
ndia
na 7
th G
rade
Stu
dent
s: 2
016
DR
UG
Indi
ana
Nor
thw
est
Nor
th
Cen
tral
Nor
thea
stW
est
Cen
tral
Eas
tS
outh
wes
tS
outh
east
Ciga
rette
s2.
81.
9▼
4.2
▲3.
42.
4
2.4
3.8
▲2.
1▼
3.6
▲
Smok
eles
s to
bacc
o1.
30.
7▲
1.6
1.3
1.2
0.9
0.6
▼1.
32.
4▲
Ciga
rs0.
70.
80.
91.
30.
70.
50.
90.
40.
8
Pipe
1.0
2.0
▲1.
6▲
0.5
0.4
0.
61.
00.
70.
9
Elec
toni
c va
por p
rodu
cts
4.9
5.9
6.3
▲3.
42.
9▼
4.2
5.9
4.0
▼5.
6
Alco
hol
7.4
9.5
▲10
.2▲
5.8
5.6
▼5.
5▼
7.4
6.5
8.
5
B
inge
drin
king#
2.6
3.7
▲4.
3▲
2.6
0.9
▼2.
12.
42.
22.
9
Mar
ijuan
a2.
83.
14.
4▲
3.7
1.5
▼1.
9▼
5.3
▲2.
0▼
2.4
Synt
hetic
mar
ijuan
a0.
50.
20.
80.
80.
20.
30.
70.
40.
6
Coca
ine/
Crac
k0.
20.
20.
4▲
0.0
0.2
0.2
0.0
0.1
0.3
Inha
lant
s0.
50.
70.
50.
80.
70.
2▼
0.5
0.7
0.5
Met
ham
phet
amin
es0.
10.
20.
2
0.0
0.0
0.1
0.1
0.1
0.1
Hero
in0.
10.
20.
3▲
0.3
0.0
0.1
0.0
0.1
0.0
Hallu
cinog
ens/
Ecst
asy
0.3
0.3
0.6
▲1.
0
0.2
0.3
0.2
0.2
0.2
Pres
crip
tion
drug
s1.
61.
62.
0
1.8
0.7
▼1.
91.
91.
61.
4
Ove
r the
cou
nter
dru
gs2.
73.
8▲
3.1
2.
92.
3
2.3
3.0
2.5
2.4

NO
TES:
#
Bin
ge d
rinki
ng d
urin
g th
e pa
st tw
o w
eeks
.
▲indicatesthatlocalprevalenceratesaresignificantlyhigherthanstaterates(p<.05).
▼indicatesthatlocalprevalenceratesaresignificantlylowerthanstaterates(p<.05).
Indiana Youth Survey 2016
108
Per
cent
age
Rep
orti
ng M
onth
ly U
se o
f Alc
ohol
, Tob
acco
, and
Oth
er D
rugs
by I
ndia
na 8
th G
rade
Stu
dent
s: 2
016
DR
UG
Indi
ana
Nor
thw
est
Nor
th
Cen
tral
Nor
thea
stW
est
Cen
tral
Eas
tS
outh
wes
tS
outh
east
Ciga
rette
s5.
14.
35.
05.
73.
9
4.8
5.6
4.
56.
8▲
Smok
eles
s to
bacc
o2.
41.
5▼
1.7
▼2.
62.
52.
61.
1▼
2.8
4.0
▲
Ciga
rs1.
61.
61.
62.
20.
7▼
1.4
1.9
1.2
2.2
▲
Pipe
2.2
3.8
▲2.
71.
51.
2▼
2.0
1.9
1.2
▼2.
3
Elec
toni
c va
por p
rodu
cts
9.4
11.1
▲10
.57.
45.
8▼
9.9
8.9
9.0
9.0
Alco
hol
13.2
15.2
▲14
.8▲
10.7
11.2
▼11
.3▼
14.0
12.6
13.6
B
inge
drin
king#
5.0
5.8
6.4
▲4.
63.
6▼
4.5
4.7
4.7
5.0
Mar
ijuan
a6.
68.
4▲
8.5
▲4.
63.
5▼
7.7
▲8.
9▲
3.8
▼5.
4▼
Synt
hetic
mar
ijuan
a1.
01.
11.
01.
30.
61.
31.
40.
71.
0
Coca
ine/
Crac
k0.
30.
30.
40.
40.
30.
30.
20.
20.
3
Inha
lant
s0.
70.
80.
61.
5▲
0.5
0.7
0.6
0.6
0.9
Met
ham
phet
amin
es0.
10.
20.
10.
00.
20.
20.
30.
10.
1
Hero
in0.
20.
20.
20.
7
0.2
0.2
0.1
0.2
0.2
Hallu
cinog
ens/
Ecst
asy
0.7
1.2
▲0.
90.
90.
1
0.6
0.8
0.4
0.4
Pres
crip
tion
drug
s2.
23.
0▲
2.2
3.1
2.5
2.1
2.5
1.7
1.5
▼
Ove
r the
cou
nter
dru
gs3.
13.
83.
73.
33.
82.
93.
22.
62.
6

NO
TES:
#
Bin
ge d
rinki
ng d
urin
g th
e pa
st tw
o w
eeks
.
▲indicatesthatlocalprevalenceratesaresignificantlyhigherthanstaterates(p<.05).
▼indicatesthatlocalprevalenceratesaresignificantlylowerthanstaterates(p<.05).
109
Regional Data
Per
cent
age
Rep
orti
ng M
onth
ly U
se o
f Alc
ohol
, Tob
acco
, and
Oth
er D
rugs
by I
ndia
na 9
th G
rade
Stu
dent
s: 2
016
DR
UG
Indi
ana
Nor
thw
est
Nor
th
Cen
tral
Nor
thea
stW
est
Cen
tral
Eas
tS
outh
wes
tS
outh
east
Ciga
rette
s7.
36.
76.
47.
46.
95.
1▼
9.0
▲8.
110
.1▲
Smok
eles
s to
bacc
o3.
82.
4▼
2.3
▼1.
44.
7
3.1
3.7
5.3
▲6.
2▲
Ciga
rs3.
02.
62.
22.
83.
02.
64.
7▲
2.6
3.6
Pipe
3.3
5.1
▲2.
8
3.2
2.6
2.7
3.6
2.6
3.2
Elec
toni
c va
por p
rodu
cts
13.7
14.7
13.1
13.9
11.4
11.9
▼14
.515
.9▲
13.0
Alco
hol
18.2
19.4
17.6
18
.615
.8
15.3
▼18
.621
.2▲
18.1
B
inge
drin
king#
7.8
8.3
7.8
6.1
5.9
▼6.
5▼
7.0
9.3
▲9.
1▲
Mar
ijuan
a10
.011
.8▲
9.8
5.5
▼6.
8▼
9.3
13.8
▲8.
5▼
8.5
▼
Synt
hetic
mar
ijuan
a1.
51.
31.
60.
90.
91.
52.
5▲
1.3
1.3
Coca
ine/
Crac
k0.
40.
50.
50.
00.
20.
40.
70.
30.
4
Inha
lant
s0.
80.
60.
80.
91.
10.
80.
60.
81.
1
Met
ham
phet
amin
es0.
20.
30.
10.
00.
10.
40.
30.
20.
2
Hero
in0.
10.
30.
00.
00.
00.
30.
10.
10.
1
Hallu
cinog
ens/
Ecst
asy
1.2
1.4
1.5
0.9
0.5
1.1
1.5
1.0
1.0
Pres
crip
tion
drug
s3.
13.
63.
32.
82.
62.
8
3.4
3.0
2.5
Ove
r the
cou
nter
dru
gs3.
33.
73.
13.
73.
02.
94.
22.
83.
4
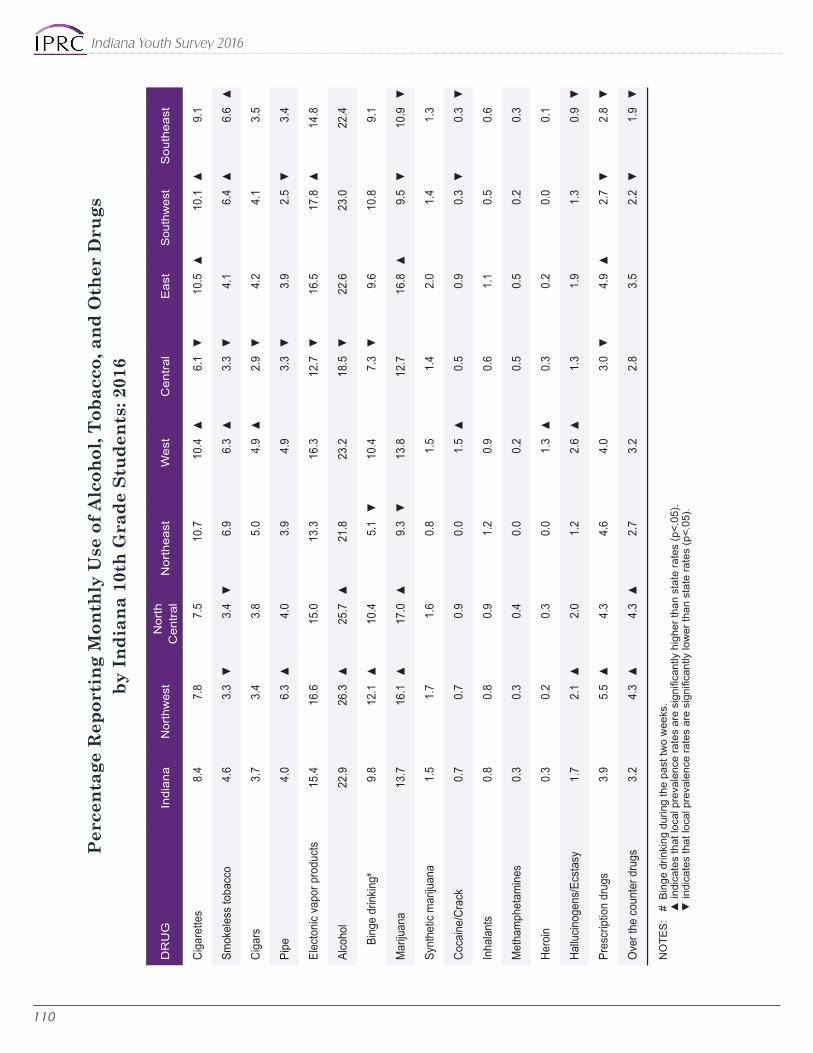
NO
TES:
#
Bin
ge d
rinki
ng d
urin
g th
e pa
st tw
o w
eeks
.
▲indicatesthatlocalprevalenceratesaresignificantlyhigherthanstaterates(p<.05).
▼indicatesthatlocalprevalenceratesaresignificantlylowerthanstaterates(p<.05).
Indiana Youth Survey 2016
110
Per
cent
age
Rep
orti
ng M
onth
ly U
se o
f Alc
ohol
, Tob
acco
, and
Oth
er D
rugs
by I
ndia
na 1
0th
Gra
de S
tude
nts:
201
6
DR
UG
Indi
ana
Nor
thw
est
Nor
th
Cen
tral
Nor
thea
stW
est
Cen
tral
Eas
tS
outh
wes
tS
outh
east
Ciga
rette
s8.
47.
87.
510
.710
.4▲
6.1
▼10
.5▲
10.1
▲9.
1
Smok
eles
s to
bacc
o4.
63.
3▼
3.4
▼6.
96.
3▲
3.3
▼4.
16.
4▲
6.6
▲
Ciga
rs3.
73.
43.
85.
04.
9▲
2.9
▼4.
24.
13.
5
Pipe
4.0
6.3
▲4.
03.
94.
9
3.3
▼3.
92.
5▼
3.4
Elec
toni
c va
por p
rodu
cts
15.4
16.6
15.0
13.3
16.3
12.7
▼16
.517
.8▲
14.8
Alco
hol
22.9
26.3
▲25
.7▲
21.8
23.2
18.5
▼22
.623
.022
.4
B
inge
drin
king#
9.8
12.1
▲10
.45.
1▼
10.4
7.3
▼9.
610
.89.
1
Mar
ijuan
a13
.716
.1▲
17.0
▲9.
3▼
13.8
12.7
16.8
▲9.
5▼
10.9
▼
Synt
hetic
mar
ijuan
a1.
51.
71.
60.
81.
51.
42.
01.
41.
3
Coca
ine/
Crac
k0.
70.
70.
9
0.0
1.5
▲0.
50.
90.
3▼
0.3
▼
Inha
lant
s0.
80.
80.
91.
20.
90.
61.
10.
50.
6
Met
ham
phet
amin
es0.
30.
30.
40.
00.
20.
50.
50.
20.
3
Hero
in0.
30.
20.
30.
01.
3▲
0.3
0.2
0.0
0.
1
Hallu
cinog
ens/
Ecst
asy
1.7
2.1
▲2.
0
1.2
2.6
▲1.
31.
91.
3
0.9
▼
Pres
crip
tion
drug
s3.
95.
5▲
4.3
4.6
4.0
3.0
▼4.
9▲
2.7
▼2.
8▼
Ove
r the
cou
nter
dru
gs3.
24.
3▲
4.3
▲2.
73.
2
2.8
3.5
2.2
▼1.
9▼

NO
TES:
#
Bin
ge d
rinki
ng d
urin
g th
e pa
st tw
o w
eeks
.
▲indicatesthatlocalprevalenceratesaresignificantlyhigherthanstaterates(p<.05).
▼indicatesthatlocalprevalenceratesaresignificantlylowerthanstaterates(p<.05).
111
Regional Data
Per
cent
age
Rep
orti
ng M
onth
ly U
se o
f Alc
ohol
, Tob
acco
, and
Oth
er D
rugs
by I
ndia
na 1
1th
Gra
de S
tude
nts:
201
6
DR
UG
Indi
ana
Nor
thw
est
Nor
th
Cen
tral
Nor
thea
stW
est
Cen
tral
Eas
tS
outh
wes
tS
outh
east
Ciga
rette
s11
.410
.811
.411
.310
.68.
6▼
12.0
13.7
▲14
.1▲
Smok
eles
s to
bacc
o5.
84.
2▼
6.0
5.5
6.2
4.7
5.3
6.6
9.
3▲
Ciga
rs5.
85.
36.
97.
37.
05.
46.
24.
95.
7
Pipe
5.1
6.9
▲4.
84.
95.
94.
44.
94.
0▼
5.2
Elec
toni
c va
por p
rodu
cts
18.8
18.9
15
.0▼
16.4
17.5
19.2
18.3
21.3
▲20
.1
Alco
hol
26.9
30.0
▲24
.722
.8
27.0
27.6
23.5
▼27
.027
.8
B
inge
drin
king#
12.2
13.6
10.6
7.8
▼11
.911
.89.
6▼
14.1
▲13
.7
Mar
ijuan
a16
.220
.8▲
16.5
13.4
13.3
▼16
.317
.913
.8▼
12.5
▼
Synt
hetic
mar
ijuan
a1.
51.
91.
61.
51.
01.
41.
30.
9▼
1.8
Coca
ine/
Crac
k0.
91.
6▲
0.9
0.9
0.5
1.0
1.0
0.4
▼0.
4▼
Inha
lant
s0.
81.
20.
80.
20.
60.
70.
80.
51.
4▲
Met
ham
phet
amin
es0.
50.
70.
50.
40.
20.
50.
50.
40.
4
Hero
in0.
40.
50.
50.
20.
10.
60.
30.
30.
3
Hallu
cinog
ens/
Ecst
asy
2.0
2.5
2.6
1.9
1.2
2.2
2.3
1.5
1.6
Pres
crip
tion
drug
s4.
96.
6▲
6.6
▲4.
34.
84.
44.
63.
7▼
3.7
▼
Ove
r the
cou
nter
dru
gs3.
35.
5▲
3.4
1.9
2.1
3.
03.
2
1.7
▼3.
0

NO
TES:
#
Bin
ge d
rinki
ng d
urin
g th
e pa
st tw
o w
eeks
.
▲indicatesthatlocalprevalenceratesaresignificantlyhigherthanstaterates(p<.05).
▼indicatesthatlocalprevalenceratesaresignificantlylowerthanstaterates(p<.05).
Indiana Youth Survey 2016
112
Per
cent
age
Rep
orti
ng M
onth
ly U
se o
f Alc
ohol
, Tob
acco
, and
Oth
er D
rugs
by I
ndia
na 1
2th
Gra
de S
tude
nts:
201
6
DR
UG
Indi
ana
Nor
thw
est
Nor
th
Cen
tral
Nor
thea
stW
est
Cen
tral
Eas
tS
outh
wes
tS
outh
east
Ciga
rette
s14
.913
.5
13.6
21
.4▲
14.5
12.2
▼15
.9
16.6
17.5
▲
Smok
eles
s to
bacc
o7.
45.
4▼
6.5
8.3
9.8
▲5.
6▼
8.1
8.9
▲9.
3▲
Ciga
rs10
.28.
4▼
11.6
17.3
▲11
.99.
5
11.9
9.4
10.2
Pipe
7.5
9.9
▲6.
87.
87.
76.
97.
14.
3▼
8.6
Elec
toni
c va
por p
rodu
cts
21.6
21.1
19.3
20.8
20.7
20.7
22.2
22
.223
.9▲
Alco
hol
34.6
36.2
34.1
31.1
37.1
30.2
▼30
.0▼
35.7
38.5
▲
B
inge
drin
king#
17.5
18.7
16.7
13.2
19.0
15.0
▼13
.7▼
19.1
19.5
▲
Mar
ijuan
a20
.324
.5▲
21.5
15.9
21.6
19.9
21.9
14
.3▼
18.8
Synt
hetic
mar
ijuan
a1.
61.
6
1.6
0.
0▼
2.2
1.5
2.
8▲
1.3
1.
2
Coca
ine/
Crac
k1.
41.
4▼
2.5
▼0.
0
1.5
1.4
2.
1▲
0.6
▼0.
7▼
Inha
lant
s0.
80.
91.
00.
01.
20.
81.
10.
70.
6
Met
ham
phet
amin
es0.
70.
5
0.7
0.
00.
7
0.5
2.
2▲
0.6
0.
6
Hero
in0.
50.
5
0.7
0.
00.
6
0.4
1.
1▲
0.3
0.
1
Hallu
cinog
ens/
Ecst
asy
3.2
3.7
3.0
0.
6
3.6
3.0
4.
2
2.5
2.
9
Pres
crip
tion
drug
s6.
07.
07.
02.
6
7.0
6.1
6.6
4.
7▼
4.9
▼
Ove
r the
cou
nter
dru
gs3.
44.
03.
61.
93.
13.
74.
02.
4▼
3.2

113
Indiana Prevention Resource Center
VI. TRENDS AND PREVALENCE GRAPHS

Indiana Youth Survey 2016
114

115
Trends & Prevalence Graphs

Indiana Youth Survey 2016
116

117
Trends & Prevalence Graphs

Indiana Youth Survey 2016
118

119
Trends & Prevalence Graphs

Indiana Youth Survey 2016
120
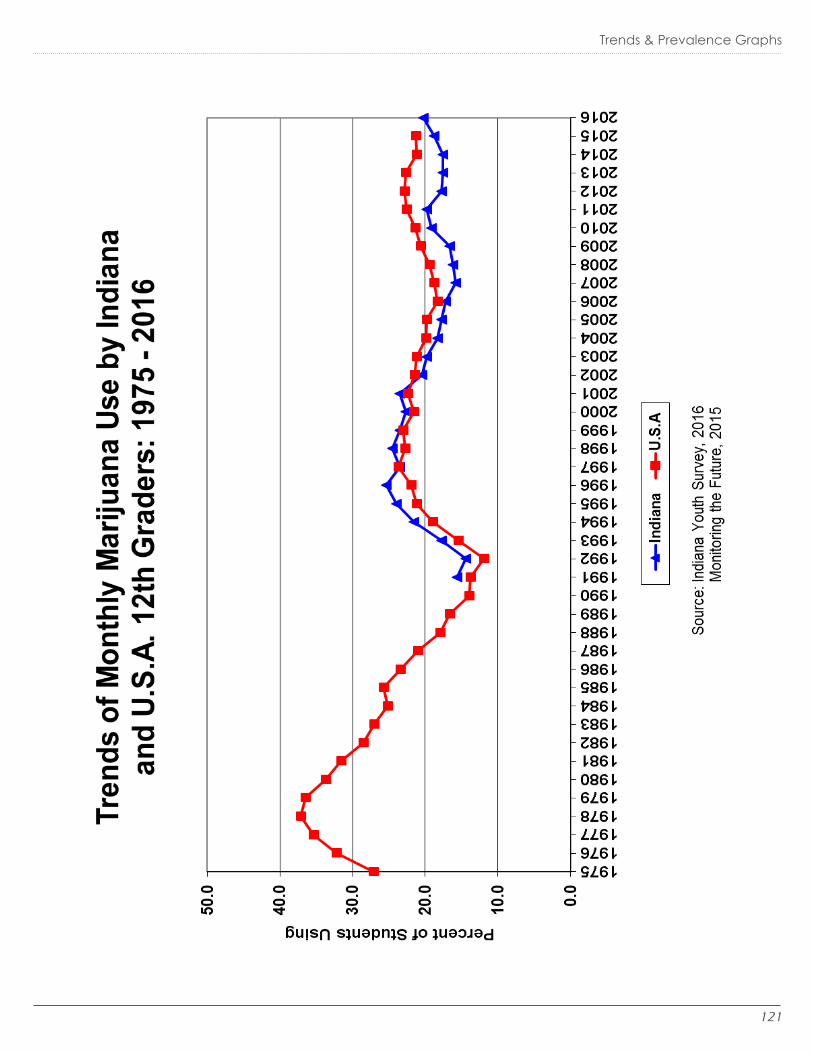
121
Trends & Prevalence Graphs

Indiana Youth Survey 2016
122

123
Trends & Prevalence Graphs

Indiana Youth Survey 2016
124

125
Trends & Prevalence Graphs
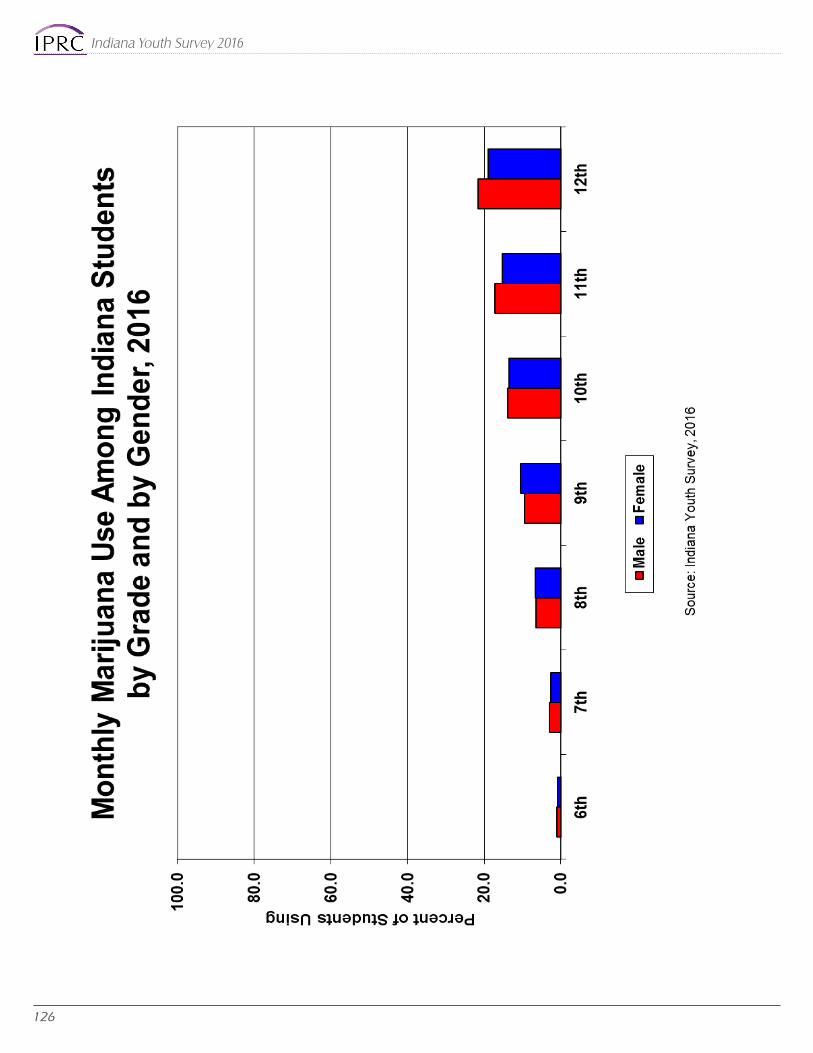
Indiana Youth Survey 2016
126

127
Indiana Prevention Resource Center
VII. FREQUENCY TABLES
All: 6th grade …...…..…………………………… 128
Male: 6th grade …...……….…………………………… 135
Female: 6th grade ……..….…………………………… 142
All: 7-12th grade ….....….....…………………… 149
Male: 7-12th grade ….....……………………………… 177
Female: 7-12th grade ....……………………………… 205

Indiana Youth Survey 2016
128
Personal and Family InformationIndiana 6th Grade Students, 2016
(Values expressed as percentages, valid cases only)
Grade6th
Q1 Gender Male 50.6
Female 49.4
Q2 Hispanic/Latino Non-Hispanic 87.8
Hispanic 12.2
Q3 Race White 75.4
Black/African American 9.1
Asian 1.3
Native Hawaiian/Pacific Islander .2
American Indian/Alaskan Native 1.0
Race not known or other 3.8
More than one race 9.2
Q5 Age 10 years or younger .2
11 years 32.5
12 years 60.1
13 years or older 7.2
Q6 Parents served in a war zone
No 72.6
Yes 12.9
Not sure 14.5
Q7 Parents served time in jail
No 66.1
Yes 21.6
Not sure 12.3
How many times in the last month (30 days) have you used...?
Grade6th
Q8 Cigarettes Never 98.7
1-5 times 1.0
6-19 times .2
20-39 times .0
40+ times .0
Q8 Alcohol Never 96.4
1-5 times 3.2
6-19 times .3
20-39 times .0
40+ times .1
Q8 Marijuana Never 99.0
1-5 times .7
6-19 times .2
20-39 times .0
40+ times .1
Q8 Inhalants Never 99.5
1-5 times .4
6-19 times .1
20-39 times .0
40+ times .0
Q8 Prescription drugs
Never 98.3
1-5 times 1.0
6-19 times .2
20-39 times .3
40+ times .2
Q8 Other illegal drugs
Never 99.7
1-5 times .2
6-19 times .0
20-39 times .0
40+ times .0
Past Month Use of Alcohol, Tobacco, and Other Drugs
Indiana 6th Grade Students, 2016(Values expressed as percentages, valid cases only)

129
Frequency Tables
Age Distribution of First Time Alcohol, Tobacco, and Other Drug Use
Indiana 6th Grade Students, 2016(Values expressed as percentages, valid cases only)
At what age did you first use...?Grade
6th
Q9 Cigarettes Never used 97.3
10 years or younger 1.6
11 years .6
12 years .4
13 years or older .1
Q9 Alcohol Never used 93.2
10 years or younger 3.8
11 years 1.8
12 years 1.1
13 years or older .2
Q9 Marijuana Never used 98.5
10 years or younger .4
11 years .5
12 years .4
13 years or older .2
Q9 Inhalants Never used 99.3
10 years or younger .4
11 years .2
12 years .1
13 years or older .0
Q9 Prescription drugs
Never used 97.7
10 years or younger 1.6
11 years .4
12 years .2
13 years or older .0
Q9 Other illegal drugs
Never used 99.6
10 years or younger .2
11 years .1
12 years .1
13 years or older .0
How much do you think people risk harming themselves if they...?
Grade6th
Q10 Smoke 1+ pack cigarettes per day
No risk 10.5
Slight risk 10.7
Moderate risk 26.6
Great risk 52.3
Q10 Try marijuana once or twice No risk 16.2
Slight risk 29.6
Moderate risk 26.1
Great risk 28.1
Q10 Smoke marijuana once or twice per week
No risk 13.9
Slight risk 15.1
Moderate risk 29.1
Great risk 41.9
Q10 Have 1-2 alcoholic drinks every day
No risk 16.8
Slight risk 27.4
Moderate risk 28.1
Great risk 27.7
Q10 Binge drink once or twice a week
No risk 13.1
Slight risk 14.9
Moderate risk 30.8
Great risk 41.2
Q10 Misuse prescription drugs No risk 11.4
Slight risk 6.4
Moderate risk 16.7
Great risk 65.5
Perceived Risks of Drug UseIndiana 6th Grade Students, 2016
(Values expressed as percentages, valid cases only)

Indiana Youth Survey 2016
130
Perceived Peer Approval of Drug UseIndiana 6th Grade Students, 2016
(Values expressed as percentages, valid cases only)
How wrong do your friends feel it would be for you to...?
Grade6th
Q11 Smoke tobacco Very wrong 82.0
Wrong 13.2
A little bit wrong 3.4
Not at all wrong 1.3
Q11 Smoke marijuana Very wrong 87.9
Wrong 7.2
A little bit wrong 2.8
Not at all wrong 2.1
Q11 Have 1-2 alcoholic drinks every day
Very wrong 79.0
Wrong 13.5
A little bit wrong 5.5
Not at all wrong 2.0
Q11 Misuse prescription drugs
Very wrong 87.5
Wrong 8.7
A little bit wrong 2.3
Not at all wrong 1.5
How wrong do your parents feel it would be for you to...?
Grade6th
Q12 Have 1-2 alcoholic drinks every day
Very wrong 92.7
Wrong 5.1
A little bit wrong 1.6
Not at all wrong .6
Q12 Drink alcohol regularly (at least once or twice a month)
Very wrong 90.2
Wrong 5.8
A little bit wrong 2.5
Not at all wrong 1.5
Q12 Smoke cigarettes Very wrong 93.7
Wrong 4.8
A little bit wrong 1.0
Not at all wrong .5
Q12 Smoke marijuana Very wrong 96.1
Wrong 2.5
A little bit wrong .7
Not at all wrong .6
Q12 Use prescription drugs not prescribed to you
Very wrong 94.6
Wrong 3.8
A little bit wrong .9
Not at all wrong .7
Parental Attitudes Favorable Toward Drug UseIndiana 6th Grade Students, 2016
(Values expressed as percentages, valid cases only)

131
Frequency Tables
Parental Attitudes Favorable Toward Antisocial Behavior
Indiana 6th Grade Students, 2016(Values expressed as percentages, valid cases only)
How wrong do your parents feel it would be for you to...?
Grade6th
Q12 Steal something worth more than $5
Very wrong 85.7
Wrong 12.0
A little bit wrong 1.7
Not at all wrong .5
Q12 Draw graffiti Very wrong 86.7
Wrong 10.4
A little bit wrong 1.9
Not at all wrong 1.0
Q12 Pick a fight with someone Very wrong 64.0
Wrong 25.2
A little bit wrong 8.5
Not at all wrong 2.3
Grade6th
Q14 Rules in my family are clear YES! 65.4
yes 30.7
no 2.9
NO! 1.0
Q14 Parents ask about homework
YES! 69.5
yes 24.6
no 4.5
NO! 1.5
Q14 Parents know where I am and who I am with
YES! 81.4
yes 14.3
no 2.7
NO! 1.6
Q14 Family has clear rules about alcohol and drug use
YES! 87.2
yes 9.0
no 2.5
NO! 1.3
Q18 Parents know if you come home late
YES! 71.9
yes 21.1
no 5.2
NO! 1.8
Q18 Parents would catch you drinking
YES! 78.5
yes 13.6
no 4.7
NO! 3.2
Q18 Parents would catch you if you carried a gun
YES! 84.5
yes 10.4
no 2.9
NO! 2.1
Q18 Parents would catch you if you skipped school
YES! 84.5
yes 11.1
no 2.9
NO! 1.5
Poor Family ManagementIndiana 6th Grade Students, 2016
(Values expressed as percentages, valid cases only)
During the past 12 months, did you...?Grade
6th
Q13 Feel sad or hopeless for 2+ weeks
No 78.5
Yes 21.5
Q13 Consider attempting suicide No 91.5
Yes 8.5
Q13 Make a plan about attempting suicide
No 93.9
Yes 6.1
Mental Health in the Past Twelve MonthsIndiana 6th Grade Students, 2016
(Values expressed as percentages, valid cases only)

Indiana Youth Survey 2016
132
Family ConflictIndiana 6th Grade Students, 2016
(Values expressed as percentages, valid cases only)
Grade6th
Q14 Family argues over and over about same thing
YES! 16.4
yes 22.5
no 35.6
NO! 25.4
Q14 Family has serious arguments
YES! 14.7
yes 16.2
no 32.5
NO! 36.5
Q14 Family menbers often insult each other
YES! 14.1
yes 17.8
no 28.4
NO! 39.7
Grade6th
Q16 Students have chances to help decide activities and rules
YES! 24.6
yes 42.7
no 23.5
NO! 9.2
Q16 Teachers ask me to work on special class projects
YES! 22.9
yes 38.1
no 28.8
NO! 10.1
Q16 Students have chances to get involved in activities outside of class
YES! 70.4
yes 23.1
no 4.4
NO! 2.1
Q16 Students have chances to talk with teacher one-on-one
YES! 51.5
yes 34.8
no 10.5
NO! 3.1
Q16 Students have chances to be a part of class discussions or activities
YES! 50.5
yes 37.5
no 9.0
NO! 3.0
School Opportunities for Prosocial InvolvementIndiana 6th Grade Students, 2016
(Values expressed as percentages, valid cases only)

133
Frequency Tables
School Rewards for Prosocial InvolvementIndiana 6th Grade Students, 2016
(Values expressed as percentages, valid cases only)
Grade6th
Q16 Teachers notice when doing a good job and let me know
YES! 36.0
yes 43.7
no 15.3
NO! 5.0
Q16 I feel safe at school YES! 57.8
yes 30.8
no 7.0
NO! 4.4
Q16 School lets parents know when I do well
YES! 25.8
yes 34.1
no 27.1
NO! 12.9
Q16 Teachers praise me when l work hard in school
YES! 25.8
yes 39.5
no 24.5
NO! 10.2
Grade6th
Q14 Parents ask me before most family decisions made
YES! 37.4
yes 36.9
no 15.4
NO! 10.3
Q14 I can ask parents for help if I have problem
YES! 69.4
yes 20.2
no 5.8
NO! 4.6
Q14 Parents give me chances for fun with them
YES! 62.4
yes 26.4
no 7.7
NO! 3.5
Family Opportunities for Prosocial InvolvementIndiana 6th Grade Students, 2016
(Values expressed as percentages, valid cases only)
Grade6th
Q17 What were your grades like last year?
Mostly A's 49.3
Mostly B's 34.5
Mostly C's 11.8
Mostly D's 3.0
Mostly F's 1.5
Q16 My grades are better than most students
YES! 28.3
yes 43.6
no 21.5
NO! 6.6
Academic FailureIndiana 6th Grade Students, 2016
(Values expressed as percentages, valid cases only)

Indiana Youth Survey 2016
134
In the past year (12 months), how many of your best friends have...?
Grade6th
Q19 Participated in school activities
None of my friends 12.2
1 of my friends 11.5
2 of my friends 18.5
3 of my friends 18.6
4 of my friends 39.2
Q19 Made a commitment to stay drug-free
None of my friends 13.3
1 of my friends 4.6
2 of my friends 4.7
3 of my friends 6.6
4 of my friends 70.7
Q19 Liked school None of my friends 23.6
1 of my friends 11.4
2 of my friends 17.3
3 of my friends 18.4
4 of my friends 29.3
Q19 Regularly attended religious activities
None of my friends 20.3
1 of my friends 15.6
2 of my friends 19.4
3 of my friends 18.5
4 of my friends 26.2
Q19 Tried to do well in school None of my friends 3.2
1 of my friends 3.8
2 of my friends 5.6
3 of my friends 12.7
4 of my friends 74.9
Interaction with Prosocial PeersIndiana 6th Grade Students, 2016
(Values expressed as percentages, valid cases only)
Grade6th
Q18 Neighbors notice good job and let me know
YES! 12.7
yes 20.2
no 28.7
NO! 38.4
Q18 There are people in my neighborhood who are proud of me
YES! 17.9
yes 25.0
no 24.6
NO! 32.4
Q18 There are people in my neighborhood who encourage me to do my best
YES! 25.8
yes 24.7
no 20.0
NO! 29.5
Community Rewards for Prosocial InvolvementIndiana 6th Grade Students, 2016
(Values expressed as percentages, valid cases only)
Family Rewards for Prosocial InvolvementIndiana 6th Grade Students, 2016
(Values expressed as percentages, valid cases only)
Grade6th
Q18 I enjoy spending time with mom
YES! 79.7
yes 15.5
no 2.6
NO! 2.1
Q18 I enjoy spending time with dad
YES! 74.1
yes 16.2
no 4.3
NO! 5.5
Q15 Parents notice when I am doing a good job
All the time 46.1
Often 34.0
Sometimes 16.3
Never 3.7
Q15 Parents tell me they are proud of me
All the time 47.9
Often 31.3
Sometimes 16.3
Never 4.5
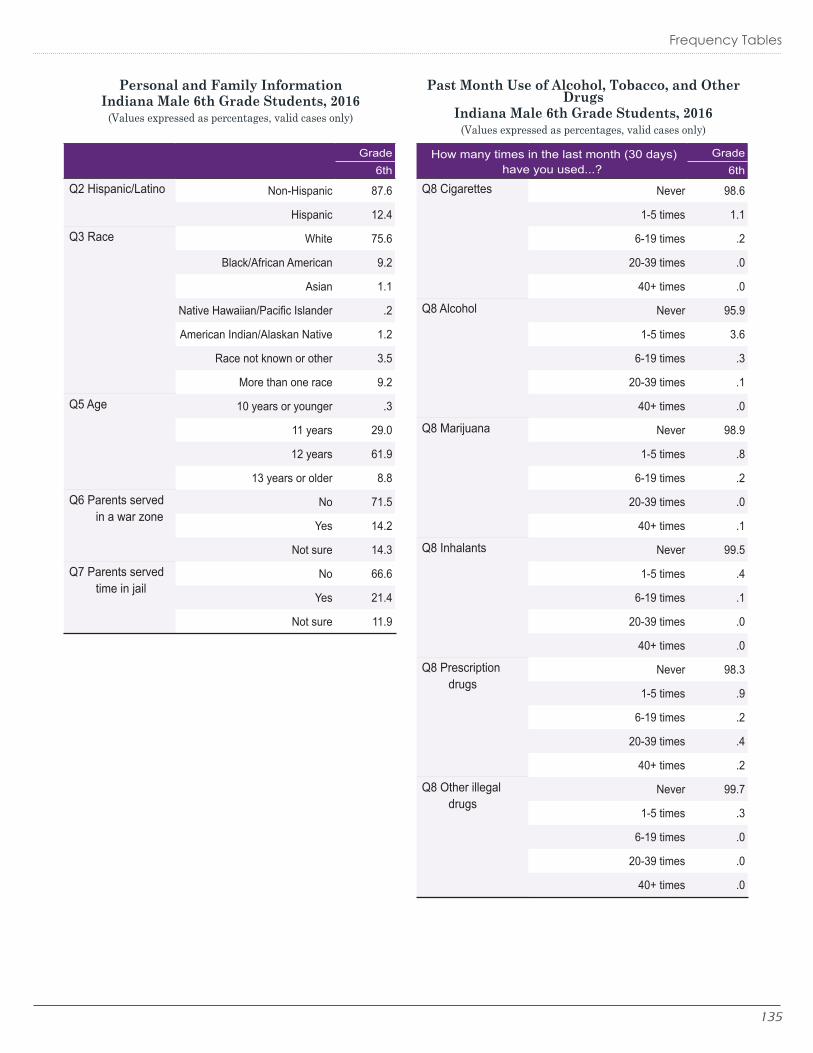
135
Frequency Tables
Personal and Family InformationIndiana Male 6th Grade Students, 2016
(Values expressed as percentages, valid cases only)
Grade6th
Q2 Hispanic/Latino Non-Hispanic 87.6
Hispanic 12.4
Q3 Race White 75.6
Black/African American 9.2
Asian 1.1
Native Hawaiian/Pacific Islander .2
American Indian/Alaskan Native 1.2
Race not known or other 3.5
More than one race 9.2
Q5 Age 10 years or younger .3
11 years 29.0
12 years 61.9
13 years or older 8.8
Q6 Parents served in a war zone
No 71.5
Yes 14.2
Not sure 14.3
Q7 Parents served time in jail
No 66.6
Yes 21.4
Not sure 11.9
How many times in the last month (30 days) have you used...?
Grade6th
Q8 Cigarettes Never 98.6
1-5 times 1.1
6-19 times .2
20-39 times .0
40+ times .0
Q8 Alcohol Never 95.9
1-5 times 3.6
6-19 times .3
20-39 times .1
40+ times .0
Q8 Marijuana Never 98.9
1-5 times .8
6-19 times .2
20-39 times .0
40+ times .1
Q8 Inhalants Never 99.5
1-5 times .4
6-19 times .1
20-39 times .0
40+ times .0
Q8 Prescription drugs
Never 98.3
1-5 times .9
6-19 times .2
20-39 times .4
40+ times .2
Q8 Other illegal drugs
Never 99.7
1-5 times .3
6-19 times .0
20-39 times .0
40+ times .0
Past Month Use of Alcohol, Tobacco, and Other Drugs
Indiana Male 6th Grade Students, 2016(Values expressed as percentages, valid cases only)

Indiana Youth Survey 2016
136
Age Distribution of First Time Alcohol, Tobacco, and Other Drug Use
Indiana Male 6th Grade Students, 2016(Values expressed as percentages, valid cases only)
How much do you think people risk harming themselves if they...?
Grade6th
Q10 Smoke 1+ pack cigarettes per day
No risk 11.9
Slight risk 10.2
Moderate risk 27.0
Great risk 50.9
Q10 Try marijuana once or twice No risk 18.5
Slight risk 28.7
Moderate risk 24.8
Great risk 28.0
Q10 Smoke marijuana once or twice per week
No risk 16.0
Slight risk 15.1
Moderate risk 27.9
Great risk 40.9
Q10 Have 1-2 alcoholic drinks every day
No risk 18.9
Slight risk 28.2
Moderate risk 26.9
Great risk 26.1
Q10 Binge drink once or twice a week
No risk 14.9
Slight risk 16.0
Moderate risk 30.4
Great risk 38.8
Q10 Misuse prescription drugs No risk 13.1
Slight risk 6.2
Moderate risk 16.3
Great risk 64.4
Perceived Risks of Drug UseIndiana Male 6th Grade Students, 2016
(Values expressed as percentages, valid cases only)
At what age did you first use...?Grade
6th
Q9 Cigarettes Never used 97.0
10 years or younger 1.7
11 years .7
12 years .5
13 years or older .1
Q9 Alcohol Never used 92.0
10 years or younger 4.6
11 years 1.9
12 years 1.2
13 years or older .3
Q9 Marijuana Never used 98.2
10 years or younger .6
11 years .6
12 years .4
13 years or older .2
Q9 Inhalants Never used 99.3
10 years or younger .4
11 years .2
12 years .1
13 years or older .0
Q9 Prescription drugs
Never used 97.5
10 years or younger 1.8
11 years .4
12 years .2
13 years or older .0
Q9 Other illegal drugs
Never used 99.5
10 years or younger .3
11 years .1
12 years .1
13 years or older .0

137
Frequency Tables
Perceived Peer Approval of Drug UseIndiana Male 6th Grade Students, 2016
(Values expressed as percentages, valid cases only)
How wrong do your friends feel it would be for you to...?
Grade6th
Q11 Smoke tobacco Very wrong 78.9
Wrong 15.6
A little bit wrong 3.8
Not at all wrong 1.6
Q11 Smoke marijuana Very wrong 85.2
Wrong 8.6
A little bit wrong 3.5
Not at all wrong 2.7
Q11 Have 1-2 alcoholic drinks every day
Very wrong 76.1
Wrong 14.9
A little bit wrong 6.4
Not at all wrong 2.6
Q11 Misuse prescription drugs
Very wrong 86.6
Wrong 9.1
A little bit wrong 2.5
Not at all wrong 1.8
How wrong do your parents feel it would be for you to...?
Grade6th
Q12 Have 1-2 alcoholic drinks every day
Very wrong 91.5
Wrong 5.7
A little bit wrong 1.9
Not at all wrong .9
Q12 Drink alcohol regularly (at least once or twice a month)
Very wrong 89.1
Wrong 6.2
A little bit wrong 2.8
Not at all wrong 1.9
Q12 Smoke cigarettes Very wrong 93.1
Wrong 5.2
A little bit wrong 1.1
Not at all wrong .6
Q12 Smoke marijuana Very wrong 95.4
Wrong 2.9
A little bit wrong .9
Not at all wrong .8
Q12 Use prescription drugs not prescribed to you
Very wrong 94.5
Wrong 3.8
A little bit wrong .9
Not at all wrong .8
Parental Attitudes Favorable Toward Drug UseIndiana Male 6th Grade Students, 2016
(Values expressed as percentages, valid cases only)

Indiana Youth Survey 2016
138
Parental Attitudes Favorable Toward Antisocial Behavior
Indiana Male 6th Grade Students, 2016(Values expressed as percentages, valid cases only)
How wrong do your parents feel it would be for you to...?
Grade6th
Q12 Steal something worth more than $5
Very wrong 84.5
Wrong 12.6
A little bit wrong 2.1
Not at all wrong .7
Q12 Draw graffiti Very wrong 87.1
Wrong 9.8
A little bit wrong 1.9
Not at all wrong 1.2
Q12 Pick a fight with someone Very wrong 63.3
Wrong 24.9
A little bit wrong 9.2
Not at all wrong 2.6
Grade6th
Q14 Rules in my family are clear YES! 67.0
yes 29.7
no 2.4
NO! .9
Q14 Parents ask about homework
YES! 70.2
yes 24.8
no 3.7
NO! 1.3
Q14 Parents know where I am and who I am with
YES! 77.6
yes 17.2
no 3.3
NO! 1.9
Q14 Family has clear rules about alcohol and drug use
YES! 87.2
yes 8.9
no 2.3
NO! 1.6
Q18 Parents know if you come home late
YES! 70.1
yes 22.4
no 5.4
NO! 2.1
Q18 Parents would catch you drinking
YES! 76.6
yes 15.1
no 4.6
NO! 3.7
Q18 Parents would catch you if you carried a gun
YES! 82.3
yes 11.7
no 3.4
NO! 2.6
Q18 Parents would catch you if you skipped school
YES! 84.0
yes 11.5
no 2.7
NO! 1.7
Poor Family ManagementIndiana Male 6th Grade Students, 2016
(Values expressed as percentages, valid cases only)
During the past 12 months, did you...?Grade
6th
Q13 Feel sad or hopeless for 2+ weeks
No 82.0
Yes 18.0
Q13 Consider attempting suicide No 94.0
Yes 6.0
Q13 Make a plan about attempting suicide
No 95.6
Yes 4.4
Mental Health in the Past Twelve MonthsIndiana Male 6th Grade Students, 2016
(Values expressed as percentages, valid cases only)

139
Frequency Tables
Family ConflictIndiana Male 6th Grade Students, 2016
(Values expressed as percentages, valid cases only)
Grade6th
Q14 Family argues over and over about same thing
YES! 16.1
yes 22.4
no 35.4
NO! 26.1
Q14 Family has serious arguments
YES! 15.1
yes 17.5
no 34.3
NO! 33.2
Q14 Family menbers often insult each other
YES! 14.2
yes 17.7
no 29.7
NO! 38.4
Grade6th
Q16 Students have chances to help decide activities and rules
YES! 25.1
yes 41.3
no 23.4
NO! 10.3
Q16 Teachers ask me to work on special class projects
YES! 23.4
yes 38.6
no 27.8
NO! 10.3
Q16 Students have chances to get involved in activities outside of class
YES! 68.7
yes 24.4
no 4.4
NO! 2.5
Q16 Students have chances to talk with teacher one-on-one
YES! 51.3
yes 34.9
no 10.2
NO! 3.5
Q16 Students have chances to be a part of class discussions or activities
YES! 48.6
yes 38.6
no 9.3
NO! 3.6
School Opportunities for Prosocial InvolvementIndiana Male 6th Grade Students, 2016
(Values expressed as percentages, valid cases only)
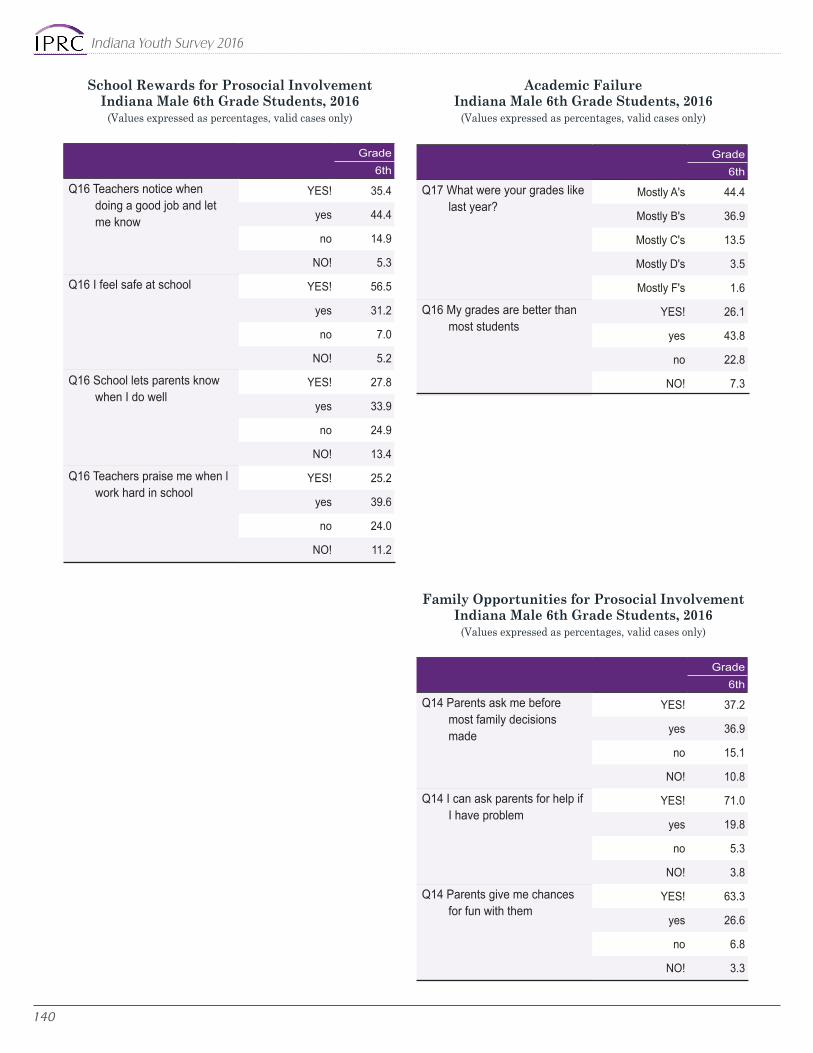
Indiana Youth Survey 2016
140
School Rewards for Prosocial InvolvementIndiana Male 6th Grade Students, 2016
(Values expressed as percentages, valid cases only)
Grade6th
Q16 Teachers notice when doing a good job and let me know
YES! 35.4
yes 44.4
no 14.9
NO! 5.3
Q16 I feel safe at school YES! 56.5
yes 31.2
no 7.0
NO! 5.2
Q16 School lets parents know when I do well
YES! 27.8
yes 33.9
no 24.9
NO! 13.4
Q16 Teachers praise me when l work hard in school
YES! 25.2
yes 39.6
no 24.0
NO! 11.2
Grade6th
Q14 Parents ask me before most family decisions made
YES! 37.2
yes 36.9
no 15.1
NO! 10.8
Q14 I can ask parents for help if I have problem
YES! 71.0
yes 19.8
no 5.3
NO! 3.8
Q14 Parents give me chances for fun with them
YES! 63.3
yes 26.6
no 6.8
NO! 3.3
Family Opportunities for Prosocial InvolvementIndiana Male 6th Grade Students, 2016
(Values expressed as percentages, valid cases only)
Grade6th
Q17 What were your grades like last year?
Mostly A's 44.4
Mostly B's 36.9
Mostly C's 13.5
Mostly D's 3.5
Mostly F's 1.6
Q16 My grades are better than most students
YES! 26.1
yes 43.8
no 22.8
NO! 7.3
Academic FailureIndiana Male 6th Grade Students, 2016
(Values expressed as percentages, valid cases only)

141
Frequency Tables
In the past year (12 months), how many of your best friends have...?
Grade6th
Q19 Participated in school activities
None of my friends 14.6
1 of my friends 11.5
2 of my friends 17.9
3 of my friends 17.7
4 of my friends 38.2
Q19 Made a commitment to stay drug-free
None of my friends 15.6
1 of my friends 4.7
2 of my friends 5.1
3 of my friends 7.0
4 of my friends 67.7
Q19 Liked school None of my friends 27.0
1 of my friends 11.9
2 of my friends 17.6
3 of my friends 16.7
4 of my friends 26.9
Q19 Regularly attended religious activities
None of my friends 21.6
1 of my friends 15.1
2 of my friends 18.8
3 of my friends 18.2
4 of my friends 26.4
Q19 Tried to do well in school None of my friends 4.2
1 of my friends 3.9
2 of my friends 6.0
3 of my friends 13.6
4 of my friends 72.3
Interaction with Prosocial PeersIndiana Male 6th Grade Students, 2016
(Values expressed as percentages, valid cases only)
Grade6th
Q18 Neighbors notice good job and let me know
YES! 13.3
yes 20.6
no 28.2
NO! 38.0
Q18 There are people in my neighborhood who are proud of me
YES! 18.0
yes 25.0
no 24.5
NO! 32.5
Q18 There are people in my neighborhood who encourage me to do my best
YES! 26.3
yes 24.4
no 19.7
NO! 29.6
Community Rewards for Prosocial InvolvementIndiana Male 6th Grade Students, 2016
(Values expressed as percentages, valid cases only)
Family Rewards for Prosocial InvolvementIndiana Male 6th Grade Students, 2016
(Values expressed as percentages, valid cases only)
Grade6th
Q18 I enjoy spending time with mom
YES! 79.6
yes 15.9
no 2.4
NO! 2.0
Q18 I enjoy spending time with dad
YES! 76.2
yes 15.5
no 3.5
NO! 4.8
Q15 Parents notice when I am doing a good job
All the time 45.5
Often 36.3
Sometimes 14.9
Never 3.3
Q15 Parents tell me they are proud of me
All the time 47.3
Often 33.5
Sometimes 15.2
Never 4.0

Indiana Youth Survey 2016
142
Personal and Family InformationIndiana Female 6th Grade Students, 2016
(Values expressed as percentages, valid cases only)
Grade6th
Q2 Hispanic/Latino Non-Hispanic 88.0
Hispanic 12.0
Q3 Race White 75.2
Black/African American 9.1
Asian 1.4
Native Hawaiian/Pacific Islander .1
American Indian/Alaskan Native .8
Race not known or other 4.1
More than one race 9.2
Q5 Age 10 years or younger .1
11 years 36.0
12 years 58.3
13 years or older 5.6
Q6 Parents served in a war zone
No 73.7
Yes 11.6
Not sure 14.7
Q7 Parents served time in jail
No 65.6
Yes 21.7
Not sure 12.7
How many times in the last month (30 days) have you used...?
Grade6th
Q8 Cigarettes Never 98.9
1-5 times 1.0
6-19 times .1
20-39 times .0
40+ times .1
Q8 Alcohol Never 96.9
1-5 times 2.8
6-19 times .2
20-39 times .0
40+ times .1
Q8 Marijuana Never 99.2
1-5 times .6
6-19 times .1
20-39 times .0
40+ times 99.4
Q8 Inhalants Never .4
1-5 times .1
6-19 times .0
20-39 times .0
40+ times 98.4
Q8 Prescription drugs
Never 1.0
1-5 times .3
6-19 times .2
20-39 times .1
40+ times 99.8
Q8 Other illegal drugs
Never .1
1-5 times .0
6-19 times .0
20-39 times .0
40+ times .0
Past Month Use of Alcohol, Tobacco, and Other Drugs
Indiana Female 6th Grade Students, 2016(Values expressed as percentages, valid cases only)

143
Frequency Tables
Age Distribution of First Time Alcohol, Tobacco, and Other Drug Use
Indiana Female 6th Grade Students, 2016(Values expressed as percentages, valid cases only)
How much do you think people risk harming themselves if they...?
Grade6th
Q10 Smoke 1+ pack cigarettes per day
No risk 9.1
Slight risk 11.2
Moderate risk 26.2
Great risk 53.6
Q10 Try marijuana once or twice No risk 13.9
Slight risk 30.5
Moderate risk 27.5
Great risk 28.1
Q10 Smoke marijuana once or twice per week
No risk 11.6
Slight risk 15.2
Moderate risk 30.3
Great risk 42.9
Q10 Have 1-2 alcoholic drinks every day
No risk 14.7
Slight risk 26.7
Moderate risk 29.3
Great risk 29.3
Q10 Binge drink once or twice a week
No risk 11.3
Slight risk 13.8
Moderate risk 31.3
Great risk 43.6
Q10 Misuse prescription drugs No risk 9.8
Slight risk 6.6
Moderate risk 17.1
Great risk 66.5
Perceived Risks of Drug UseIndiana Female 6th Grade Students, 2016
(Values expressed as percentages, valid cases only)
At what age did you first use...?Grade
6th
Q9 Cigarettes Never used 97.6
10 years or younger 1.4
11 years .6
12 years .4
13 years or older .0
Q9 Alcohol Never used 94.4
10 years or younger 2.9
11 years 1.6
12 years .9
13 years or older .1
Q9 Marijuana Never used 98.8
10 years or younger .3
11 years .5
12 years .4
13 years or older .1
Q9 Inhalants Never used 99.3
10 years or younger .5
11 years .2
12 years .1
13 years or older 97.9
Q9 Prescription drugs
Never used 1.4
10 years or younger .5
11 years .2
12 years .0
13 years or older 99.7
Q9 Other illegal drugs
Never used .1
10 years or younger .1
11 years .1
12 years .0
13 years or older .0

Indiana Youth Survey 2016
144
Perceived Peer Approval of Drug UseIndiana Female 6th Grade Students, 2016
(Values expressed as percentages, valid cases only)
How wrong do your friends feel it would be for you to...?
Grade6th
Q11 Smoke tobacco Very wrong 85.2
Wrong 10.8
A little bit wrong 3.0
Not at all wrong .9
Q11 Smoke marijuana Very wrong 90.7
Wrong 5.8
A little bit wrong 2.0
Not at all wrong 1.4
Q11 Have 1-2 alcoholic drinks every day
Very wrong 81.8
Wrong 12.1
A little bit wrong 4.6
Not at all wrong 1.4
Q11 Misuse prescription drugs
Very wrong 88.5
Wrong 8.2
A little bit wrong 2.1
Not at all wrong 1.2
How wrong do your parents feel it would be for you to...?
Grade6th
Q12 Have 1-2 alcoholic drinks every day
Very wrong 93.9
Wrong 4.5
A little bit wrong 1.2
Not at all wrong .3
Q12 Drink alcohol regularly (at least once or twice a month)
Very wrong 91.2
Wrong 5.5
A little bit wrong 2.3
Not at all wrong 1.0
Q12 Smoke cigarettes Very wrong 94.2
Wrong 4.5
A little bit wrong 1.0
Not at all wrong .4
Q12 Smoke marijuana Very wrong 96.9
Wrong 2.1
A little bit wrong .6
Not at all wrong .4
Q12 Use prescription drugs not prescribed to you
Very wrong 94.7
Wrong 3.8
A little bit wrong .9
Not at all wrong .6
Parental Attitudes Favorable Toward Drug UseIndiana Female 6th Grade Students, 2016
(Values expressed as percentages, valid cases only)

145
Frequency Tables
Parental Attitudes Favorable Toward Antisocial Behavior
Indiana Female 6th Grade Students, 2016(Values expressed as percentages, valid cases only)
How wrong do your parents feel it would be for you to...?
Grade6th
Q12 Steal something worth more than $5
Very wrong 86.9
Wrong 11.4
A little bit wrong 1.3
Not at all wrong .4
Q12 Draw graffiti Very wrong 86.3
Wrong 11.0
A little bit wrong 1.9
Not at all wrong .8
Q12 Pick a fight with someone Very wrong 64.7
Wrong 25.6
A little bit wrong 7.8
Not at all wrong 1.9
Grade6th
Q14 Rules in my family are clear YES! 63.8
yes 31.8
no 3.4
NO! 1.1
Q14 Parents ask about homework
YES! 68.8
yes 24.3
no 5.2
NO! 1.7
Q14 Parents know where I am and who I am with
YES! 85.2
yes 11.4
no 2.2
NO! 1.3
Q14 Family has clear rules about alcohol and drug use
YES! 87.2
yes 9.1
no 2.8
NO! 1.0
Q18 Parents know if you come home late
YES! 73.7
yes 19.9
no 5.0
NO! 1.5
Q18 Parents would catch you drinking
YES! 80.5
yes 12.1
no 4.7
NO! 2.7
Q18 Parents would catch you if you carried a gun
YES! 86.8
yes 9.1
no 2.4
NO! 1.7
Q18 Parents would catch you if you skipped school
YES! 85.0
yes 10.7
no 3.0
NO! 1.3
Poor Family ManagementIndiana Female 6th Grade Students, 2016
(Values expressed as percentages, valid cases only)
During the past 12 months, did you...?Grade
6th
Q13 Feel sad or hopeless for 2+ weeks
No 75.0
Yes 25.0
Q13 Consider attempting suicide No 89.0
Yes 11.0
Q13 Make a plan about attempting suicide
No 92.2
Yes 7.8
Mental Health in the Past Twelve MonthsIndiana Female 6th Grade Students, 2016
(Values expressed as percentages, valid cases only)

Indiana Youth Survey 2016
146
Family ConflictIndiana Female 6th Grade Students, 2016
(Values expressed as percentages, valid cases only)
Grade6th
Q14 Family argues over and over about same thing
YES! 16.8
yes 22.6
no 35.8
NO! 24.7
Q14 Family has serious arguments
YES! 14.4
yes 15.0
no 30.8
NO! 39.9
Q14 Family menbers often insult each other
YES! 14.0
yes 17.8
no 27.2
NO! 41.0
Grade6th
Q16 Students have chances to help decide activities and rules
YES! 24.2
yes 44.1
no 23.6
NO! 8.0
Q16 Teachers ask me to work on special class projects
YES! 22.5
yes 37.6
no 29.9
NO! 10.0
Q16 Students have chances to get involved in activities outside of class
YES! 72.1
yes 21.7
no 4.4
NO! 1.7
Q16 Students have chances to talk with teacher one-on-one
YES! 51.7
yes 34.7
no 10.8
NO! 2.7
Q16 Students have chances to be a part of class discussions or activities
YES! 52.4
yes 36.4
no 8.7
NO! 2.5
School Opportunities for Prosocial InvolvementIndiana Female 6th Grade Students, 2016
(Values expressed as percentages, valid cases only)

147
Frequency Tables
School Rewards for Prosocial InvolvementIndiana Female 6th Grade Students, 2016
(Values expressed as percentages, valid cases only)
Grade6th
Q16 Teachers notice when doing a good job and let me know
YES! 36.6
yes 43.0
no 15.8
NO! 4.6
Q16 I feel safe at school YES! 59.0
yes 30.4
no 7.0
NO! 3.6
Q16 School lets parents know when I do well
YES! 23.8
yes 34.4
no 29.3
NO! 12.5
Q16 Teachers praise me when l work hard in school
YES! 26.4
yes 39.4
no 25.0
NO! 9.2
Grade6th
Q14 Parents ask me before most family decisions made
YES! 37.6
yes 36.9
no 15.7
NO! 9.8
Q14 I can ask parents for help if I have problem
YES! 67.7
yes 20.6
no 6.3
NO! 5.5
Q14 Parents give me chances for fun with them
YES! 61.6
yes 26.1
no 8.5
NO! 3.8
Family Opportunities for Prosocial InvolvementIndiana Female 6th Grade Students, 2016
(Values expressed as percentages, valid cases only)
Grade6th
Q17 What were your grades like last year?
Mostly A's 54.1
Mostly B's 32.0
Mostly C's 10.0
Mostly D's 2.4
Mostly F's 1.4
Q16 My grades are better than most students
YES! 30.5
yes 43.5
no 20.2
NO! 5.9
Academic FailureIndiana Female 6th Grade Students, 2016
(Values expressed as percentages, valid cases only)

Indiana Youth Survey 2016
148
In the past year (12 months), how many of your best friends have...?
Grade6th
Q19 Participated in school activities
None of my friends 9.7
1 of my friends 11.4
2 of my friends 19.2
3 of my friends 19.6
4 of my friends 40.1
Q19 Made a commitment to stay drug-free
None of my friends 11.0
1 of my friends 4.5
2 of my friends 4.4
3 of my friends 6.3
4 of my friends 73.8
Q19 Liked school None of my friends 20.2
1 of my friends 10.8
2 of my friends 17.0
3 of my friends 20.2
4 of my friends 31.7
Q19 Regularly attended religious activities
None of my friends 18.9
1 of my friends 16.2
2 of my friends 20.1
3 of my friends 18.9
4 of my friends 26.0
Q19 Tried to do well in school None of my friends 2.1
1 of my friends 3.6
2 of my friends 5.1
3 of my friends 11.7
4 of my friends 77.5
Interaction with Prosocial PeersIndiana Female 6th Grade Students, 2016
(Values expressed as percentages, valid cases only)
Grade6th
Q18 Neighbors notice good job and let me know
YES! 12.1
yes 19.8
no 29.3
NO! 38.8
Q18 There are people in my neighborhood who are proud of me
YES! 17.9
yes 25.0
no 24.7
NO! 32.3
Q18 There are people in my neighborhood who encourage me to do my best
YES! 25.3
yes 25.1
no 20.3
NO! 29.3
Community Rewards for Prosocial InvolvementIndiana Female 6th Grade Students, 2016
(Values expressed as percentages, valid cases only)
Family Rewards for Prosocial InvolvementIndiana Female 6th Grade Students, 2016
(Values expressed as percentages, valid cases only)
Grade6th
Q18 I enjoy spending time with mom
YES! 79.8
yes 15.1
no 2.8
NO! 2.3
Q18 I enjoy spending time with dad
YES! 72.0
yes 16.8
no 5.1
NO! 6.1
Q15 Parents notice when I am doing a good job
All the time 46.7
Often 31.6
Sometimes 17.6
Never 4.1
Q15 Parents tell me they are proud of me
All the time 48.5
Often 29.1
Sometimes 17.4
Never 5.0

149
Frequency Tables
Personal and Family InformationIndiana 7th - 12th Grade Students, 2016
(Values expressed as percentages, valid cases only)
Grade7th 8th 9th 10th 11th 12th
Q1 Gender Male 50.3 50.1 50.0 48.8 48.2 48.9
Female 49.7 49.9 50.0 51.2 51.8 51.1
Q2 Hispanic/Latino Non-Hispanic 88.4 86.8 87.8 87.2 88.0 87.7
Hispanic 11.6 13.2 12.2 12.8 12.0 12.3
Q3 Race White 79.3 76.6 81.1 79.5 82.3 81.1
Black/African American 5.7 8.1 7.2 9.2 8.0 9.3
Asian 2.1 1.8 1.2 1.3 1.5 1.3
Native Hawaiian/Pacific Islander .2 .3 .2 .3 .2 .3
American Indian/Alaskan Native 1.1 .8 .7 .6 .6 .6
Race not known or other 3.3 3.2 2.2 1.9 1.7 1.8
More than one race 8.5 9.1 7.5 7.3 5.6 5.5
Q5 Age 11 years .2 0.0 0.0 0.0 0.0 0.0
12 years 30.4 .1 0.0 0.0 0.0 0.0
13 years 62.5 30.5 .2 0.0 0.0 0.0
14 years 6.7 61.6 28.6 .1 0.0 0.0
15 years .3 7.5 63.0 27.6 .4 0.0
16 years 0.0 .3 7.9 65.3 30.6 .6
17 years 0.0 0.0 .3 6.7 63.7 31.1
18 years or older 0.0 0.0 0.0 .3 5.3 68.2
Q6 Parents served in a war zone
No 77.6 80.5 83.0 86.2 88.2 89.3
Yes 12.2 11.3 10.7 9.1 8.1 7.8
Not sure 10.2 8.2 6.3 4.7 3.7 2.9
Q7 Parents served time in jail
No 68.9 65.7 68.8 70.5 74.2 75.9
Yes 20.8 24.4 22.7 22.4 20.3 19.0
Not sure 10.3 9.9 8.5 7.1 5.5 5.1

Indiana Youth Survey 2016
150
How many times in the last month (30 days) have you used...?
Grade7th 8th 9th 10th 11th 12th
Q8 Cigarettes Never 97.2 94.9 92.7 91.6 88.6 85.1
1-5 times 2.2 3.5 4.3 4.6 5.7 6.8
6-19 times .3 .6 1.2 1.2 1.8 2.5
20-39 times .1 .3 .7 .9 1.1 1.4
40+ times .2 .6 1.2 1.7 2.8 4.1
Q8 Smokeless tobacco Never 98.7 97.6 96.2 95.4 94.2 92.6
1-5 times .9 1.5 2.1 2.4 2.6 3.1
6-19 times .2 .3 .7 .6 .7 1.1
20-39 times .1 .2 .3 .4 .7 .7
40+ times .1 .4 .7 1.2 1.8 2.5
Q8 Cigars Never 99.3 98.4 97.0 96.3 94.2 89.8
1-5 times .5 1.2 2.2 2.7 4.0 7.4
6-19 times .1 .2 .4 .5 .9 1.5
20-39 times .0 .0 .2 .3 .3 .6
40+ times .0 .1 .2 .2 .5 .6
Q8 Pipe Never 99.0 97.8 96.7 96.0 94.9 92.5
1-5 times .7 1.4 2.1 2.3 3.1 4.6
6-19 times .2 .4 .6 .8 1.0 1.4
20-39 times .0 .2 .3 .4 .4 .5
40+ times .1 .2 .3 .5 .6 .9
Q8 Electronic vapor products
Never 95.1 90.6 86.3 84.6 81.2 78.4
1-5 times 3.5 6.0 8.2 8.9 10.4 11.2
6-19 times .7 1.7 2.6 2.8 3.6 4.0
20-39 times .3 .7 1.1 1.3 1.5 2.2
40+ times .3 .9 1.8 2.5 3.3 4.1
Q8 Alcohol Never 92.6 86.8 81.8 77.1 73.1 65.4
1-5 times 6.0 10.5 13.4 16.2 18.1 22.6
6-19 times 1.0 1.8 3.0 4.0 5.3 7.2
20-39 times .2 .4 1.0 1.4 1.7 2.0
40+ times .2 .5 .8 1.3 1.9 2.7
Q8 Marijuana Never 97.2 93.4 90.0 86.3 83.8 79.7
1-5 times 1.8 3.9 5.1 6.7 7.3 9.2
6-19 times .6 1.1 1.9 2.5 3.1 3.7
20-39 times .2 .6 1.0 1.3 1.7 2.1
40+ times .3 .9 2.0 3.0 4.0 5.2
Past Month Use of Alcohol, Tobacco, and Other DrugsIndiana 7th - 12th Grade Students, 2016
(Values expressed as percentages, valid cases only)

151
Frequency Tables
How many times in the last month (30 days) have you used...?
Grade7th 8th 9th 10th 11th 12th
Q8 Synthetic marijuana Never 99.5 99.0 98.5 98.5 98.5 98.41-5 times .3 .7 .9 1.0 .9 1.0
6-19 times .1 .1 .3 .3 .2 .320-39 times .0 .1 .2 .1 .1 .2
40+ times .0 .1 .2 .1 .2 .2Q8 Cocaine/Crack Never 99.8 99.7 99.6 99.3 99.1 98.6
1-5 times .1 .2 .3 .5 .6 1.06-19 times .0 .1 .1 .1 .1 .2
20-39 times .0 .0 .0 .0 .1 .140+ times .0 0.0 .0 .0 .1 .1
Q8 Inhalants Never 99.5 99.3 99.2 99.2 99.2 99.21-5 times .5 .5 .6 .6 .6 .7
6-19 times .0 .1 .1 .1 .1 .120-39 times .0 .0 .0 .0 .0 .1
40+ times .0 .0 .0 .0 .1 .0Q8 Methamphetamines Never 99.9 99.9 99.8 99.7 99.5 99.3
1-5 times .1 .1 .1 .2 .4 .46-19 times .0 .0 .0 .1 .1 .2
20-39 times .0 .0 .0 .0 .0 .040+ times 0.0 .0 .0 .0 .1 .1
Q8 Heroin Never 99.9 99.8 99.9 99.7 99.6 99.51-5 times .1 .1 .1 .2 .2 .2
6-19 times .0 .0 .0 .0 .1 .120-39 times .0 .0 0.0 .0 0.0 .0
40+ times 0.0 .0 .0 .0 .1 .1Q8 Hallucinogens/
EcstasyNever 99.7 99.3 98.8 98.3 98.0 96.8
1-5 times .2 .5 .9 1.2 1.6 2.66-19 times .0 .1 .2 .3 .3 .4
20-39 times 0.0 .0 .1 .0 .1 .140+ times .0 .0 .0 .1 .0 .1
Q8 Prescription drugs not prescribed to you
Never 98.4 97.8 96.9 96.1 95.1 94.01-5 times 1.1 1.5 2.0 2.5 2.9 3.9
6-19 times .3 .4 .6 .8 1.3 1.320-39 times .2 .1 .3 .3 .4 .4
40+ times .2 .2 .2 .2 .3 .4Q8 Over the counter
drugs to get highNever 97.3 96.9 96.7 96.8 96.7 96.6
1-5 times 2.0 2.1 2.3 2.2 2.3 2.46-19 times .5 .6 .6 .6 .6 .6
20-39 times .1 .2 .2 .2 .2 .240+ times .1 .3 .2 .2 .2 .2
Past Month Use of Alcohol, Tobacco, and Other DrugsIndiana 7th - 12th Grade Students, 2016
(Values expressed as percentages, valid cases only)
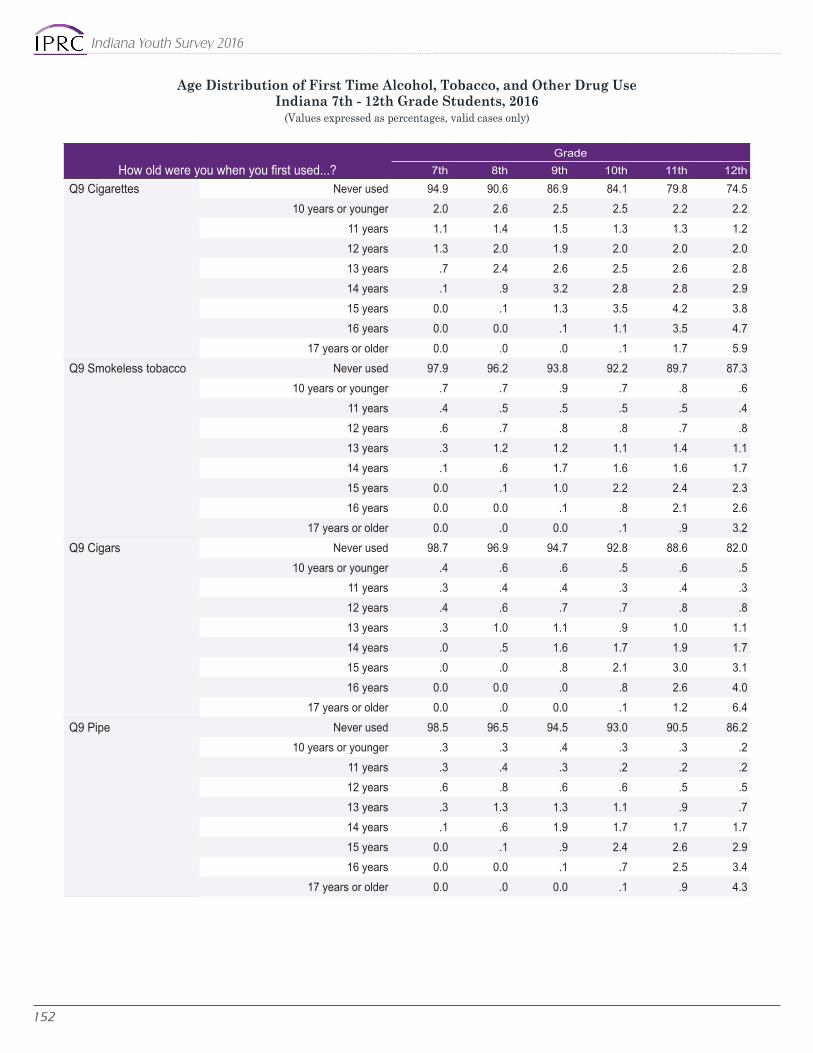
Indiana Youth Survey 2016
152
Age Distribution of First Time Alcohol, Tobacco, and Other Drug UseIndiana 7th - 12th Grade Students, 2016
(Values expressed as percentages, valid cases only)
How old were you when you first used...?
Grade7th 8th 9th 10th 11th 12th
Q9 Cigarettes Never used 94.9 90.6 86.9 84.1 79.8 74.510 years or younger 2.0 2.6 2.5 2.5 2.2 2.2
11 years 1.1 1.4 1.5 1.3 1.3 1.212 years 1.3 2.0 1.9 2.0 2.0 2.013 years .7 2.4 2.6 2.5 2.6 2.814 years .1 .9 3.2 2.8 2.8 2.915 years 0.0 .1 1.3 3.5 4.2 3.816 years 0.0 0.0 .1 1.1 3.5 4.7
17 years or older 0.0 .0 .0 .1 1.7 5.9Q9 Smokeless tobacco Never used 97.9 96.2 93.8 92.2 89.7 87.3
10 years or younger .7 .7 .9 .7 .8 .611 years .4 .5 .5 .5 .5 .412 years .6 .7 .8 .8 .7 .813 years .3 1.2 1.2 1.1 1.4 1.114 years .1 .6 1.7 1.6 1.6 1.715 years 0.0 .1 1.0 2.2 2.4 2.316 years 0.0 0.0 .1 .8 2.1 2.6
17 years or older 0.0 .0 0.0 .1 .9 3.2Q9 Cigars Never used 98.7 96.9 94.7 92.8 88.6 82.0
10 years or younger .4 .6 .6 .5 .6 .511 years .3 .4 .4 .3 .4 .312 years .4 .6 .7 .7 .8 .813 years .3 1.0 1.1 .9 1.0 1.114 years .0 .5 1.6 1.7 1.9 1.715 years .0 .0 .8 2.1 3.0 3.116 years 0.0 0.0 .0 .8 2.6 4.0
17 years or older 0.0 .0 0.0 .1 1.2 6.4Q9 Pipe Never used 98.5 96.5 94.5 93.0 90.5 86.2
10 years or younger .3 .3 .4 .3 .3 .211 years .3 .4 .3 .2 .2 .212 years .6 .8 .6 .6 .5 .513 years .3 1.3 1.3 1.1 .9 .714 years .1 .6 1.9 1.7 1.7 1.715 years 0.0 .1 .9 2.4 2.6 2.916 years 0.0 0.0 .1 .7 2.5 3.4
17 years or older 0.0 .0 0.0 .1 .9 4.3

153
Frequency Tables
Age Distribution of First Time Alcohol, Tobacco, and Other Drug UseIndiana 7th - 12th Grade Students, 2016
(Values expressed as percentages, valid cases only)
How old were you when you first used...?
Grade7th 8th 9th 10th 11th 12th
Q9 Electronic vapor products
Never used 93.6 87.1 81.2 77.2 72.3 67.810 years or younger .6 .6 .6 .3 .3 .2
11 years 1.1 .9 .6 .3 .2 .112 years 2.7 2.5 1.4 .8 .5 .313 years 1.7 5.5 4.2 2.2 1.2 .814 years .2 3.1 8.0 5.9 3.7 2.115 years 0.0 .4 3.8 9.5 8.6 5.416 years 0.0 0.0 .3 3.4 9.2 10.2
17 years or older 0.0 .0 .0 .3 3.9 13.1Q9 Alcohol Never used 88.8 79.8 73.1 64.7 58.4 49.2
10 years or younger 4.1 5.1 4.1 3.6 3.1 2.911 years 2.1 2.3 1.8 1.6 1.3 1.112 years 3.0 3.6 3.3 3.1 2.7 2.713 years 1.8 6.0 5.3 5.1 4.7 4.414 years .2 2.7 8.0 7.5 6.8 6.715 years .0 .3 4.0 10.4 10.2 10.116 years 0.0 .0 .3 3.7 9.4 11.5
17 years or older 0.0 0.0 0.0 .3 3.5 11.3Q9 Marijuana Never used 96.2 91.1 85.9 79.2 74.5 67.8
10 years or younger .6 1.0 1.1 .9 .9 .811 years .8 1.0 1.0 1.0 .8 .612 years 1.3 1.9 1.9 2.0 1.7 1.613 years .9 3.3 3.0 3.3 2.9 3.114 years .2 1.5 4.9 4.8 4.3 4.515 years 0.0 .2 2.0 6.6 6.8 6.416 years 0.0 0.0 .2 2.0 6.0 7.4
17 years or older 0.0 .0 0.0 .1 2.1 7.6Q9 Synthetic marijuana Never used 99.4 98.4 97.3 96.9 96.3 95.1
10 years or younger .1 .2 .2 .1 .1 .111 years .1 .2 .2 .1 .2 .112 years .2 .3 .4 .3 .3 .413 years .1 .5 .6 .6 .6 .814 years .1 .3 .8 .7 .7 1.015 years 0.0 .1 .5 1.0 .9 .916 years 0.0 0.0 .1 .2 .7 .9
17 years or older 0.0 .0 0.0 .0 .2 .8

Indiana Youth Survey 2016
154
How old were you when you first used...?
Grade7th 8th 9th 10th 11th 12th
Q9 Cocaine/Crack Never used 99.8 99.6 99.3 99.0 98.5 97.610 years or younger .1 .1 .1 .1 .2 .1
11 years .1 .0 .0 .0 .0 .112 years .1 .1 .1 .0 .1 .113 years .0 .2 .1 .1 .1 .114 years .0 .1 .2 .1 .2 .215 years 0.0 .0 .2 .4 .3 .216 years 0.0 0.0 .0 .2 .4 .6
17 years or older 0.0 0.0 0.0 .0 .2 1.1Q9 Inhalants Never used 99.3 99.0 98.7 98.7 98.4 98.1
10 years or younger .3 .3 .3 .1 .2 .111 years .2 .2 .1 .1 .1 .112 years .1 .2 .2 .2 .2 .113 years .1 .3 .3 .2 .2 .314 years .0 .1 .3 .2 .3 .315 years 0.0 .0 .2 .3 .3 .316 years 0.0 0.0 .0 .1 .3 .3
17 years or older 0.0 .0 0.0 .0 .1 .3Q9 Methamphetamines Never used 99.8 99.8 99.7 99.5 99.2 98.9
10 years or younger .1 .0 .1 .0 .1 .111 years .0 .0 .0 .0 .0 .012 years .0 .0 .0 .0 .0 .013 years .0 .1 .0 .1 .0 .014 years 0.0 .0 .1 .1 .1 .115 years 0.0 .0 .0 .2 .2 .116 years 0.0 .0 .0 .0 .2 .3
17 years or older 0.0 0.0 0.0 .0 .1 .4Q9 Heroin Never used 99.9 99.8 99.7 99.6 99.4 99.2
10 years or younger .0 .0 .1 .1 .1 .011 years .0 .0 .0 .0 .1 .012 years .0 .0 .1 .0 .0 .013 years .0 .1 .0 .0 .0 .014 years 0.0 .1 .0 .0 .1 .115 years 0.0 .0 .0 .1 .1 .216 years 0.0 0.0 0.0 .0 .1 .2
17 years or older 0.0 .0 0.0 .0 .1 .2
Age Distribution of First Time Alcohol, Tobacco, and Other Drug UseIndiana 7th - 12th Grade Students, 2016
(Values expressed as percentages, valid cases only)

155
Frequency Tables
How old were you when you first used...?
Grade7th 8th 9th 10th 11th 12th
Q9 Hallucinogens/Ecstasy
Never used 99.7 99.2 98.4 97.8 96.7 95.010 years or younger .0 .1 .1 .0 .1 .0
11 years .1 .0 .1 .0 .1 .012 years .1 .1 .1 .1 .1 .113 years .1 .3 .3 .2 .2 .114 years .0 .2 .5 .4 .4 .315 years .0 .0 .5 1.0 .7 .516 years 0.0 .0 .0 .4 1.2 1.4
17 years or older 0.0 0.0 0.0 .0 .6 2.5Q9 Prescription drugs
not prescribed to you
Never used 97.7 96.9 95.7 94.3 92.6 90.510 years or younger 1.2 1.0 .8 .5 .4 .4
11 years .3 .4 .3 .2 .2 .212 years .4 .4 .4 .3 .4 .413 years .3 .7 .8 .7 .7 .614 years .0 .5 1.3 1.2 1.1 1.215 years 0.0 .1 .6 2.0 1.7 1.816 years 0.0 0.0 .1 .7 2.0 2.4
17 years or older 0.0 .0 0.0 .1 .9 2.7Q9 Over the counter
drugs to get highNever used 96.5 95.9 95.6 95.3 94.9 93.9
10 years or younger 2.3 2.0 1.6 1.2 1.0 1.011 years .3 .3 .2 .2 .2 .112 years .5 .4 .4 .2 .3 .313 years .4 .7 .6 .5 .5 .414 years .0 .6 1.0 .8 .6 .615 years 0.0 .1 .6 1.4 1.0 1.016 years 0.0 0.0 .0 .4 1.1 1.2
17 years or older 0.0 .0 0.0 .0 .5 1.6
Age Distribution of First Time Alcohol, Tobacco, and Other Drug UseIndiana 7th - 12th Grade Students, 2016
(Values expressed as percentages, valid cases only)

Indiana Youth Survey 2016
156
Binge Drinking in the Last Two WeeksIndiana 7th - 12th Grade Students, 2016
(Values expressed as percentages)
Think back over the last 2 weeks...Grade
7th 8th 9th 10th 11th 12th
Q10 Binge drinking None 97.4 95.0 92.2 90.2 87.8 82.5
Once 1.1 2.1 3.5 4.1 4.9 6.8
Twice .6 1.2 1.6 2.2 2.7 3.9
3-5 times .7 1.1 1.6 2.0 2.7 4.2
6-9 times .1 .3 .6 .8 .8 1.4
10+ times .1 .3 .5 .7 .9 1.2
How easy would it be for you to get...?Grade
7th 8th 9th 10th 11th 12th
Q11 Cigarettes Very hard 68.5 56.2 46.3 39.1 30.4 16.9
Sort of hard 12.1 14.5 15.7 15.3 13.5 6.6
Sort of easy 10.1 14.4 17.5 19.2 19.4 12.8
Very easy 9.3 14.9 20.5 26.5 36.6 63.7
Q11 Alcohol Very hard 56.8 43.7 33.5 26.9 22.5 17.7
Sort of hard 16.9 17.1 16.5 14.7 13.2 12.6
Sort of easy 13.4 18.4 22.7 24.6 23.6 26.8
Very easy 12.9 20.8 27.3 33.8 40.6 42.9
Q11 Marijuana Very hard 86.5 72.7 58.5 45.8 37.3 29.4
Sort of hard 5.4 9.7 11.8 13.4 13.6 13.5
Sort of easy 3.9 8.1 12.9 16.3 17.9 19.6
Very easy 4.2 9.5 16.8 24.6 31.2 37.5
Q11 Drugs like cocaine, LSD or amphetamines
Very hard 93.6 88.6 79.3 71.7 64.1 56.0
Sort of hard 3.5 6.2 11.0 14.3 17.1 20.8
Sort of easy 1.3 2.5 4.7 7.0 9.1 11.5
Very easy 1.7 2.7 4.9 7.0 9.7 11.7
Perceived Availability of DrugsIndiana 7th - 12th Grade Students, 2016
(Values expressed as percentages)

157
Frequency Tables
Usual Sources of Alcoholic Beverages in the Past YearIndiana 7th - 12th Grade Students, 2016
(Values expressed as percentages)
During the past year, how did you get your alcohol? Grade
7th 8th 9th 10th 11th 12th
Source Q12 I did not drink alcohol 89.8 81.4 74.0 66.8 60.7 51.9Q12 I bought it at a restaurant, bar, or
club .3 .3 .4 .6 1.1 2.3
Q12 I bought it at a public event .3 .5 .5 .8 1.5 2.6Q12 I gave someone else money to
buy it for me 1.1 2.6 5.7 9.9 15.1 22.5
Q12 I bought it at a store .2 .4 .5 .8 1.5 2.8Q12 A person 21 years old or older
gave it to me 4.1 7.7 10.8 14.7 19.5 27.2
Q12 A person under 21 years old gave it to me 1.9 4.2 7.0 10.0 12.8 15.4
Q12 I took it from a store .3 .5 .8 .9 1.2 1.6
Q12 I got it at a party 2.8 6.5 10.9 16.0 20.5 26.1
Q12 I got it from a parent/guardian 4.3 6.6 7.6 8.3 9.6 12.2Q12 I got it from some other family
member 3.3 5.6 6.7 8.0 9.0 11.7
Q12 I got it some other way 3.9 7.1 9.2 9.4 9.8 10.4
During the past year, how did you get your prescription drugs that were used to get high?
Grade7th 8th 9th 10th 11th 12th
Source Q13 I did not use prescription drugs to get high 96.5 95.0 94.0 92.3 91.5 90.0
Q13 They were prescribed to me 2.9 2.4 2.5 3.0 3.1 3.5
Q13 My parents gave them to me .9 .8 .6 .6 .6 .8Q13 Someone other than my parents
gave them to me 1.0 2.0 2.4 3.3 3.9 4.9
Q13 I took them from home .5 1.1 1.5 1.6 1.7 1.7
Q13 I bought them from someone .6 1.4 2.0 2.9 3.4 4.6
Q13 I bought them on the internet .1 .2 .2 .3 .3 .3
Q13 I took them from someone else .4 .7 .7 .8 .9 1.1
Q13 I got them some other way 1.0 1.5 1.7 1.9 1.7 2.4
Usual Sources of Prescription Drugs in the Past YearIndiana 7th - 12th Grade Students, 2016
(Values expressed as percentages)
Note: Multiple responses allowed; percentages do not add to 100%.
Note: Multiple responses allowed; percentages do not add to 100%.

Indiana Youth Survey 2016
158
CRAFFT Substance Abuse ScreeningIndiana 14 Years or Older Students, 2016
(Values expressed as percentages)
Grade
14 years 15 years 16 years 17 years18 years or older
Q34 Have you ever ridden in a car driven by someone (including yourself) who was high or had been using alcohol or drugs?
No 75.2 70.8 67.5 61.5 57.2
Yes 24.8 29.2 32.5 38.5 42.8
Q14 Do you ever use alcohol or drugs to relax, feel better about yourself, or fit in?
Never used 77.2 69.0 61.1 53.9 47.6
No 15.6 19.2 24.3 27.2 31.0
Yes 7.2 11.8 14.6 18.9 21.4
Q14 Do you ever use alcohol or drugs while you are by yourself, or alone?
Never used 77.3 69.1 61.5 54.1 47.9
No 14.7 19.0 23.9 28.0 32.8
Yes 8.0 11.9 14.6 17.9 19.3
Q14 Do you ever forget things you did while using alcohol or drugs?
Never used 77.9 69.8 62.0 54.7 48.7
No 17.9 22.4 27.2 31.2 34.4
Yes 4.2 7.7 10.8 14.2 16.9
Q14 Do your family or friends ever tell you that you should cut down on your drinking or drug use?
Never used 78.4 70.3 62.5 55.1 48.9
No 19.0 26.0 32.8 39.2 45.3
Yes 2.6 3.7 4.7 5.6 5.8
Q14 Have you ever gotten into trouble while you were using alcohol or drugs?
Never used 77.5 69.3 61.3 54.2 48.1
No 18.4 24.6 31.5 36.9 42.9
Yes 4.0 6.1 7.1 8.9 9.0
How many times have you experienced the following due to your drinking or drug use...?
Grade7th 8th 9th 10th 11th 12th
Q15 Performed poorly on test or project
Never 95.8 95.4 94.9 95.1 95.7 95.0
Once 1.3 1.6 1.4 1.5 1.3 1.4
Twice .9 .9 1.2 1.1 .9 1.1
3-5 times 1.0 1.1 1.3 1.2 1.1 1.3
6-10 times .3 .3 .4 .4 .4 .4
11+ times .6 .6 .8 .7 .6 .6
Q15 Missed class Never 97.4 96.9 96.3 95.8 95.9 94.7
Once .9 1.0 1.3 1.3 1.2 1.5
Twice .6 .6 .7 .8 .8 .9
3-5 times .5 .8 .8 1.0 1.1 1.4
6-10 times .2 .2 .3 .3 .3 .7
11+ times .4 .5 .6 .7 .7 .9
Consequences of Alcohol, Tobacco, and Other Drug UseIndiana 7th - 12th Grade Students, 2016
(Values expressed as percentages)

159
Frequency Tables
Perceived Risks of Drug UseIndiana 7th - 12th Grade Students, 2016
(Values expressed as percentages)
How much do you think people risk harming themselves if they...?
Grade7th 8th 9th 10th 11th 12th
Q16 Smoke 1+ pack cigarettes per day
No risk 7.4 7.7 7.8 7.5 8.5 8.3
Slight risk 9.5 8.9 8.3 7.4 7.1 6.9
Moderate risk 25.2 24.6 23.9 21.0 21.2 21.1
Great risk 57.8 58.8 60.0 64.1 63.2 63.7
Q16 Try marijuana once or twice
No risk 15.7 22.7 30.9 37.7 44.3 47.9
Slight risk 28.9 31.5 29.3 29.1 26.0 26.4
Moderate risk 24.5 21.3 18.7 15.3 13.4 11.6
Great risk 31.0 24.5 21.1 17.9 16.3 14.1
Q16 Smoke marijuana once or twice per week
No risk 11.7 15.8 21.2 25.0 29.9 32.5
Slight risk 15.3 19.2 20.5 23.6 23.7 26.0
Moderate risk 28.5 28.3 26.9 24.5 22.5 21.3
Great risk 44.4 36.6 31.4 26.8 23.9 20.3
Q16 Have 1-2 alcoholic drinks every day
No risk 11.9 12.1 12.9 12.7 14.6 15.3
Slight risk 24.3 24.6 25.5 25.5 26.3 27.5
Moderate risk 29.5 30.7 30.2 30.9 30.0 30.7
Great risk 34.3 32.6 31.4 30.9 29.1 26.5
Q16 Binge drink once or twice a week
No risk 8.2 8.2 8.4 8.1 9.5 9.5
Slight risk 12.6 13.1 13.2 13.5 14.6 15.6
Moderate risk 30.1 30.8 32.0 31.1 31.5 33.3
Great risk 49.1 47.9 46.3 47.2 44.4 41.6
Q16 Misuse prescription drugs
No risk 6.8 6.6 6.8 6.3 6.9 6.6
Slight risk 5.0 5.9 6.5 6.6 6.3 6.8
Moderate risk 17.1 19.3 20.6 20.4 20.6 21.2
Great risk 71.2 68.2 66.2 66.7 66.2 65.3

Indiana Youth Survey 2016
160
Favorable Attitudes Toward Antisocial BehaviorIndiana 7th - 12th Grade Students, 2016
(Values expressed as percentages)
How wrong do you think it is for someone your age to...?Grade
7th 8th 9th 10th 11th 12th
Q17 Take a gun to school
Very wrong 91.8 89.9 88.7 89.9 89.2 88.0
Wrong 6.1 7.2 7.9 7.1 7.3 7.7
A little bit wrong 1.5 1.9 2.1 1.9 2.0 2.8
Not at all wrong .5 .9 1.3 1.1 1.5 1.5
Q17 Steal something more than $5
Very wrong 50.6 46.5 46.2 49.6 52.5 54.0
Wrong 38.5 39.7 39.3 37.4 35.2 34.6
A little bit wrong 9.8 12.3 12.6 11.4 10.6 9.9
Not at all wrong 1.1 1.5 1.9 1.6 1.7 1.4
Q17 Attack someone Very wrong 79.8 74.0 71.1 72.9 74.4 74.5
Wrong 14.9 19.2 20.8 19.7 18.5 19.0
A little bit wrong 4.1 5.1 6.1 5.5 5.2 4.9
Not at all wrong 1.3 1.6 2.0 1.9 1.9 1.7
Q17 Pick a fight Very wrong 42.3 38.5 38.8 42.4 44.6 46.0
Wrong 40.5 40.3 39.2 37.9 37.4 37.0
A little bit wrong 14.5 17.8 18.3 16.4 15.0 14.3
Not at all wrong 2.7 3.4 3.7 3.3 3.0 2.6
Q17 Skip school Very wrong 68.1 60.1 53.1 51.2 49.0 44.7
Wrong 25.8 30.1 33.6 34.4 33.9 34.6
A little bit wrong 5.1 8.4 11.2 12.2 14.5 17.6
Not at all wrong 1.0 1.4 2.1 2.2 2.7 3.2

161
Frequency Tables
Favorable Attitudes Toward Drug UseIndiana 7th - 12th Grade Students, 2016
(Values expressed as percentages)
How wrong do you think it is for someone your age to...?Grade
7th 8th 9th 10th 11th 12th
Q17 Drink alcohol regularly
Very wrong 79.4 67.3 54.7 48.2 43.6 36.7
Wrong 13.9 19.8 24.4 25.2 23.5 22.8
A little bit wrong 5.2 9.6 15.4 19.0 22.3 26.0
Not at all wrong 1.6 3.3 5.5 7.6 10.5 14.5
Q17 Smoke cigarettes Very wrong 81.9 73.6 63.8 60.8 54.9 44.9
Wrong 13.3 18.4 23.7 24.6 25.6 25.2
A little bit wrong 3.7 6.1 9.4 10.7 13.8 18.4
Not at all wrong 1.0 1.9 3.1 3.9 5.7 11.5
Q17 Smoke marijuana Very wrong 85.2 72.4 59.1 50.6 45.5 37.5
Wrong 8.0 13.6 18.2 19.8 20.0 19.8
A little bit wrong 4.1 8.1 12.3 15.9 17.1 21.6
Not at all wrong 2.6 5.9 10.4 13.7 17.4 21.2
Q17 Use illegal drugs Very wrong 95.1 91.8 86.7 84.7 82.2 78.9
Wrong 3.7 6.0 9.5 10.7 11.6 13.2
A little bit wrong .7 1.3 2.5 3.0 3.9 5.2
Not at all wrong .5 .9 1.4 1.6 2.3 2.6
How wrong do your friends feel it would be for you to...?
Grade7th 8th 9th 10th 11th 12th
Q18 Smoke tobacco Very wrong 84.2 74.9 66.1 61.6 55.0 48.5
Wrong 10.2 14.9 18.0 19.8 19.8 19.2
A little bit wrong 3.6 6.1 9.3 10.6 13.1 15.6
Not at all wrong 2.0 4.0 6.5 8.1 12.0 16.6
Q18 Smoke marijuana Very wrong 84.4 71.1 58.7 49.8 44.6 38.3
Wrong 7.8 12.2 14.4 15.7 15.2 15.0
A little bit wrong 4.0 8.1 12.1 15.0 15.8 17.3
Not at all wrong 3.8 8.6 14.8 19.6 24.5 29.5
Q18 Have 1-2 alcoholic drinks every day
Very wrong 81.9 70.9 60.0 52.9 47.6 41.8
Wrong 10.8 15.8 18.2 20.7 21.1 21.4
A little bit wrong 4.6 7.8 12.6 14.6 16.5 18.1
Not at all wrong 2.7 5.4 9.2 11.7 14.8 18.6
Q18 Misuse prescription drugs
Very wrong 89.5 83.5 77.0 73.2 70.1 67.2
Wrong 7.2 10.8 14.0 16.2 17.0 17.9
A little bit wrong 1.9 3.3 5.2 6.2 7.4 8.5
Not at all wrong 1.3 2.4 3.7 4.4 5.5 6.3
Perceived Peer Approval of Drug UseIndiana 7th - 12th Grade Students, 2016
(Values expressed as percentages)
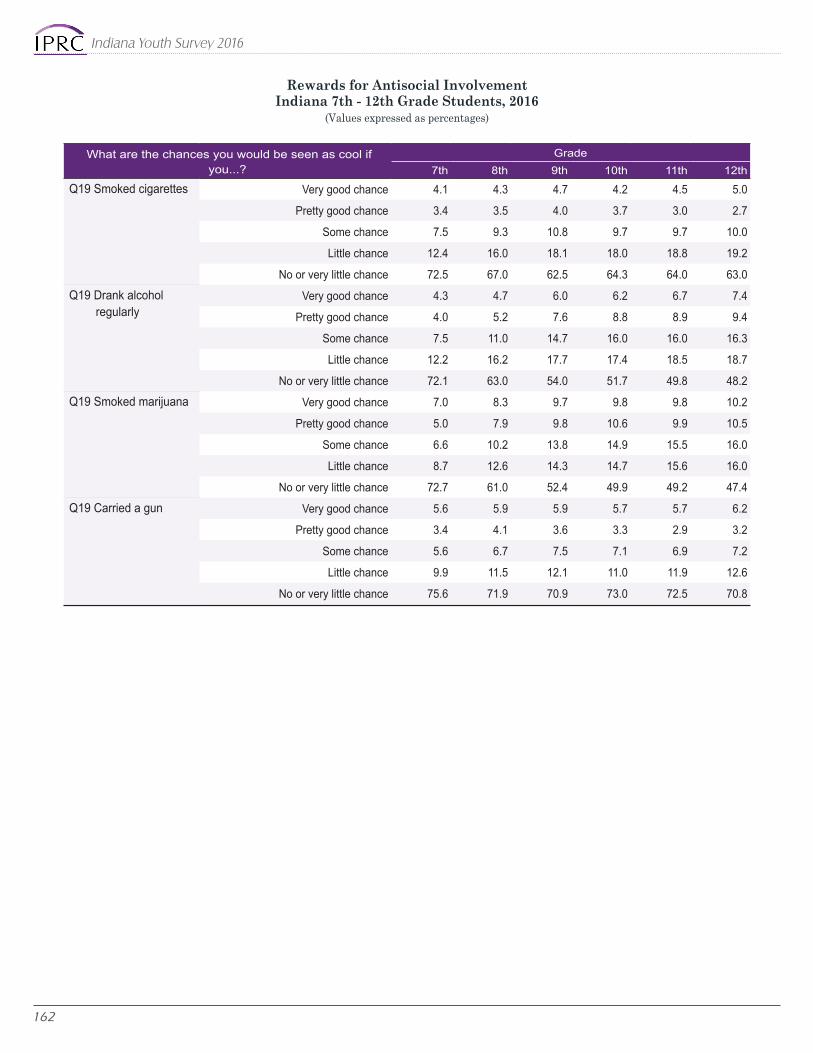
Indiana Youth Survey 2016
162
Rewards for Antisocial InvolvementIndiana 7th - 12th Grade Students, 2016
(Values expressed as percentages)
What are the chances you would be seen as cool if you...?
Grade7th 8th 9th 10th 11th 12th
Q19 Smoked cigarettes Very good chance 4.1 4.3 4.7 4.2 4.5 5.0
Pretty good chance 3.4 3.5 4.0 3.7 3.0 2.7
Some chance 7.5 9.3 10.8 9.7 9.7 10.0
Little chance 12.4 16.0 18.1 18.0 18.8 19.2
No or very little chance 72.5 67.0 62.5 64.3 64.0 63.0
Q19 Drank alcohol regularly
Very good chance 4.3 4.7 6.0 6.2 6.7 7.4
Pretty good chance 4.0 5.2 7.6 8.8 8.9 9.4
Some chance 7.5 11.0 14.7 16.0 16.0 16.3
Little chance 12.2 16.2 17.7 17.4 18.5 18.7
No or very little chance 72.1 63.0 54.0 51.7 49.8 48.2
Q19 Smoked marijuana Very good chance 7.0 8.3 9.7 9.8 9.8 10.2
Pretty good chance 5.0 7.9 9.8 10.6 9.9 10.5
Some chance 6.6 10.2 13.8 14.9 15.5 16.0
Little chance 8.7 12.6 14.3 14.7 15.6 16.0
No or very little chance 72.7 61.0 52.4 49.9 49.2 47.4
Q19 Carried a gun Very good chance 5.6 5.9 5.9 5.7 5.7 6.2
Pretty good chance 3.4 4.1 3.6 3.3 2.9 3.2
Some chance 5.6 6.7 7.5 7.1 6.9 7.2
Little chance 9.9 11.5 12.1 11.0 11.9 12.6
No or very little chance 75.6 71.9 70.9 73.0 72.5 70.8

163
Frequency Tables
Parental Attitudes Favorable Toward Drug UseIndiana 7th - 12th Grade Students, 2016
(Values expressed as percentages)
How wrong do your parents feel it would be for you to...?Grade
7th 8th 9th 10th 11th 12th
Q20 Have 1-2 alcoholic drinks every day Very wrong 94.1 92.5 89.4 88.1 84.7 79.5
Wrong 3.8 4.8 6.6 7.8 9.9 13.2
A little bit wrong 1.0 1.4 2.3 2.5 3.3 4.7
Not at all wrong 1.2 1.3 1.8 1.5 2.0 2.5
Q20 Drink alcohol regularly (at least once or twice a month)
Very wrong 92.3 89.7 85.4 82.3 77.1 69.0
Wrong 4.5 5.9 8.3 9.9 12.0 14.7
A little bit wrong 1.6 2.5 3.9 5.1 6.9 10.0
Not at all wrong 1.6 1.8 2.5 2.7 4.0 6.3
Q20 Smoke cigarettes Very wrong 94.6 93.0 90.7 89.3 85.5 78.2
Wrong 3.6 4.5 5.6 6.6 8.8 12.1
A little bit wrong .7 1.3 2.0 2.4 3.1 5.4
Not at all wrong 1.1 1.2 1.7 1.6 2.5 4.3
Q20 Smoke marijuana Very wrong 94.4 90.8 86.7 83.2 80.7 74.9
Wrong 2.8 4.8 6.4 8.2 9.2 11.9
A little bit wrong 1.2 2.3 3.7 5.0 5.5 7.7
Not at all wrong 1.5 2.1 3.2 3.6 4.6 5.5
Q20 Use prescription drugs not prescribed to you
Very wrong 95.6 94.4 92.9 92.4 90.9 89.1
Wrong 2.6 3.6 4.5 5.0 6.1 7.1
A little bit wrong .7 .9 1.2 1.3 1.4 1.9
Not at all wrong 1.1 1.1 1.4 1.3 1.6 1.9

Indiana Youth Survey 2016
164
Parental Attitudes Favorable Toward Antisocial BehaviorIndiana 7th - 12th Grade Students, 2016
(Values expressed as percentages)
During the past 12 months, did you...?Grade
7th 8th 9th 10th 11th 12th
Q21 Feel sad or hopeless
No 76.9 72.0 69.5 68.8 69.3 70.9
Yes 23.1 28.0 30.5 31.2 30.7 29.1
Q21 Consider attempting suicide
No 87.2 83.1 82.0 82.7 83.1 84.8
Yes 12.8 16.9 18.0 17.3 16.9 15.2
Q21 Make a plan about attempting suicide
No 90.2 87.0 86.1 87.3 87.8 89.1
Yes 9.8 13.0 13.9 12.7 12.2 10.9
Mental Health in the Past Twelve MonthsIndiana 7th - 12th Grade Students, 2016
(Values expressed as percentages)
How wrong do your parents feel it would be for you to...?Grade
7th 8th 9th 10th 11th 12th
Q20 Steal something worth more than $5
Very wrong 84.1 83.4 82.8 84.3 83.8 82.9
Wrong 12.4 12.6 12.7 11.8 12.1 12.9
A little bit wrong 2.3 2.7 2.9 2.6 2.6 2.6
Not at all wrong 1.2 1.4 1.6 1.4 1.5 1.6
Q20 Draw graffiti Very wrong 86.8 84.3 82.9 82.9 82.1 80.9
Wrong 9.2 10.8 11.5 11.5 12.0 13.5
A little bit wrong 2.4 3.2 3.5 3.8 3.8 3.6
Not at all wrong 1.6 1.7 2.0 1.8 2.1 2.0
Q20 Pick a fight with someone
Very wrong 69.2 67.1 67.8 68.5 67.7 66.4
Wrong 21.0 21.2 20.1 20.0 20.5 21.7
A little bit wrong 7.0 8.9 9.2 8.8 9.1 9.2
Not at all wrong 2.7 2.9 2.9 2.7 2.8 2.7
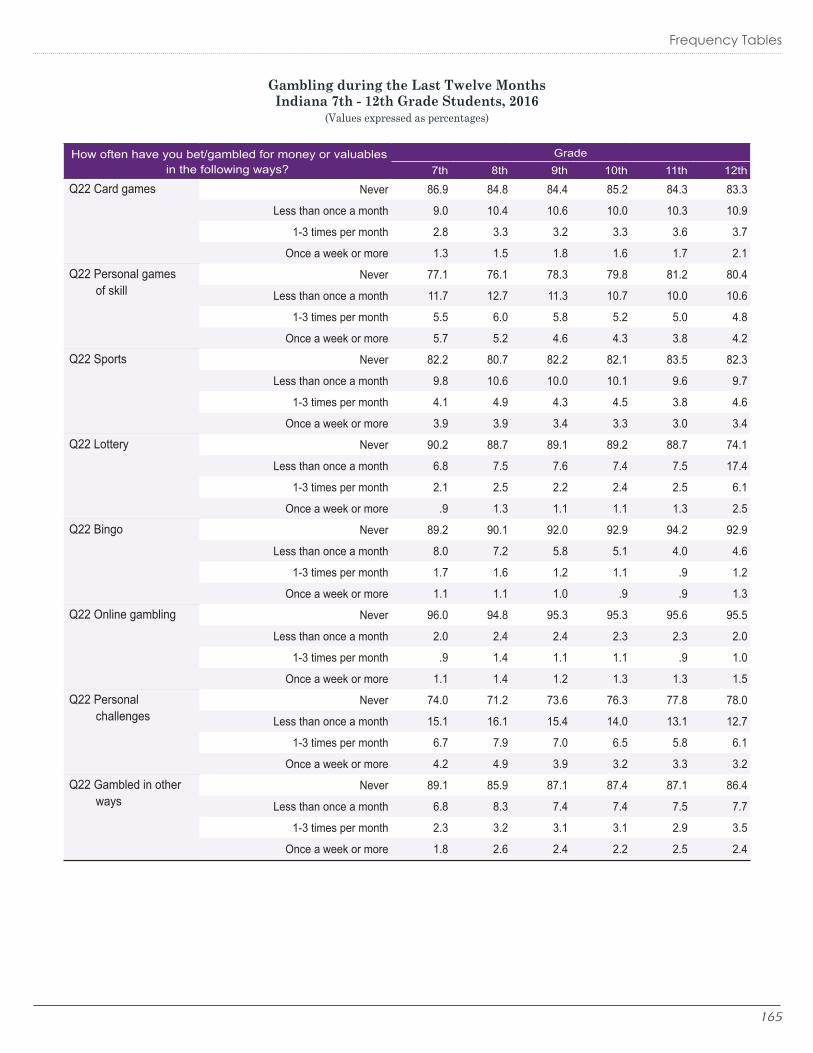
165
Frequency Tables
Gambling during the Last Twelve MonthsIndiana 7th - 12th Grade Students, 2016
(Values expressed as percentages)
How often have you bet/gambled for money or valuables in the following ways?
Grade7th 8th 9th 10th 11th 12th
Q22 Card games Never 86.9 84.8 84.4 85.2 84.3 83.3
Less than once a month 9.0 10.4 10.6 10.0 10.3 10.9
1-3 times per month 2.8 3.3 3.2 3.3 3.6 3.7
Once a week or more 1.3 1.5 1.8 1.6 1.7 2.1
Q22 Personal games of skill
Never 77.1 76.1 78.3 79.8 81.2 80.4
Less than once a month 11.7 12.7 11.3 10.7 10.0 10.6
1-3 times per month 5.5 6.0 5.8 5.2 5.0 4.8
Once a week or more 5.7 5.2 4.6 4.3 3.8 4.2
Q22 Sports Never 82.2 80.7 82.2 82.1 83.5 82.3
Less than once a month 9.8 10.6 10.0 10.1 9.6 9.7
1-3 times per month 4.1 4.9 4.3 4.5 3.8 4.6
Once a week or more 3.9 3.9 3.4 3.3 3.0 3.4
Q22 Lottery Never 90.2 88.7 89.1 89.2 88.7 74.1
Less than once a month 6.8 7.5 7.6 7.4 7.5 17.4
1-3 times per month 2.1 2.5 2.2 2.4 2.5 6.1
Once a week or more .9 1.3 1.1 1.1 1.3 2.5
Q22 Bingo Never 89.2 90.1 92.0 92.9 94.2 92.9
Less than once a month 8.0 7.2 5.8 5.1 4.0 4.6
1-3 times per month 1.7 1.6 1.2 1.1 .9 1.2
Once a week or more 1.1 1.1 1.0 .9 .9 1.3
Q22 Online gambling Never 96.0 94.8 95.3 95.3 95.6 95.5
Less than once a month 2.0 2.4 2.4 2.3 2.3 2.0
1-3 times per month .9 1.4 1.1 1.1 .9 1.0
Once a week or more 1.1 1.4 1.2 1.3 1.3 1.5
Q22 Personal challenges
Never 74.0 71.2 73.6 76.3 77.8 78.0
Less than once a month 15.1 16.1 15.4 14.0 13.1 12.7
1-3 times per month 6.7 7.9 7.0 6.5 5.8 6.1
Once a week or more 4.2 4.9 3.9 3.2 3.3 3.2
Q22 Gambled in other ways
Never 89.1 85.9 87.1 87.4 87.1 86.4
Less than once a month 6.8 8.3 7.4 7.4 7.5 7.7
1-3 times per month 2.3 3.2 3.1 3.1 2.9 3.5
Once a week or more 1.8 2.6 2.4 2.2 2.5 2.4

Indiana Youth Survey 2016
166
Consequences of GamblingIndiana 7th - 12th Grade Students, 2016
(Values expressed as percentages)
How often have you experienced the following consequences due to your gambling?
Grade7th 8th 9th 10th 11th 12th
Q23 Academic problems I do not gamble 78.8 75.8 77.2 77.7 77.6 73.9
Never 19.8 22.9 21.6 21.4 21.3 25.1
Occasionally 1.1 1.1 .9 .7 .7 .7
Frequently .3 .3 .3 .2 .3 .3
Q23 Issues with the legal system
I do not gamble 79.0 76.0 77.4 77.6 77.8 73.9
Never 20.5 23.2 21.9 21.7 21.5 25.4
Occasionally .4 .5 .4 .4 .4 .4
Frequently .2 .2 .3 .2 .3 .3
Q23 Lost possessions or money
I do not gamble 78.3 75.2 76.6 77.1 77.1 73.2
Never 14.9 16.3 15.4 14.9 15.1 17.6
Occasionally 6.4 8.0 7.5 7.5 7.1 8.5
Frequently .4 .4 .5 .4 .6 .7
Q23 Felt bad about gambling
I do not gamble 78.9 76.0 77.3 77.6 77.6 73.7
Never 18.4 21.2 20.7 20.5 20.4 24.1
Occasionally 2.3 2.5 1.7 1.6 1.6 1.7
Frequently .4 .4 .3 .3 .4 .4
Q23 Poor health I do not gamble 78.7 75.7 77.1 77.6 77.7 73.7
Never 19.9 23.0 21.7 21.5 21.4 25.3
Occasionally 1.0 .9 .8 .6 .5 .6
Frequently .4 .4 .4 .3 .4 .4
Q23 Issues with friends and family
I do not gamble 77.9 75.2 76.7 77.1 77.4 73.5
Never 18.5 21.3 20.4 20.4 20.3 24.5
Occasionally 2.9 2.9 2.4 2.0 1.7 1.5
Frequently .7 .7 .5 .4 .5 .5

167
Frequency Tables
School Opportunities for Prosocial InvolvementIndiana 7th - 12th Grade Students, 2016
(Values expressed as percentages)
Grade7th 8th 9th 10th 11th 12th
Q24 Students have chances to help decide class activities and rules
YES! 20.8 20.5 24.2 22.9 22.5 21.6
yes 40.9 39.6 40.6 37.9 38.2 38.0
no 27.1 27.4 25.2 27.2 26.7 26.9
NO! 11.2 12.5 9.9 12.0 12.5 13.5
Q24 Teachers ask me to work on special class projects
YES! 17.1 15.8 14.3 13.8 14.7 15.2
yes 36.5 36.4 34.8 34.5 35.5 36.5
no 33.4 35.6 38.3 39.1 37.5 36.5
NO! 12.9 12.2 12.6 12.6 12.4 11.9
Q24 Students have chances to get involved in activities outside of class
YES! 72.1 65.3 64.3 60.7 58.2 56.3
yes 21.9 27.4 28.4 30.6 32.4 34.0
no 3.9 4.6 4.6 5.5 5.9 6.1
NO! 2.1 2.7 2.7 3.1 3.5 3.7
Q24 Students have chances to talk with teacher one-on-one
YES! 47.9 42.5 39.7 36.9 36.9 38.0
yes 34.6 37.4 39.6 41.2 43.3 43.1
no 12.5 14.7 15.1 15.9 14.2 13.5
NO! 4.9 5.4 5.7 6.0 5.6 5.4
Q24 Students have chances to be a part of class discussions or activities
YES! 46.1 40.2 33.8 31.1 30.6 31.2
yes 39.9 44.2 48.7 50.5 52.3 52.1
no 10.3 11.4 12.8 13.4 12.4 11.9
NO! 3.7 4.3 4.7 5.0 4.7 4.7

Indiana Youth Survey 2016
168
School Rewards for Prosocial InvolvementIndiana 7th - 12th Grade Students, 2016
(Values expressed as percentages)
Grade7th 8th 9th 10th 11th 12th
Q28 What were your grades like last year?
Mostly A's 47.6 43.2 39.6 38.3 37.2 38.8
Mostly B's 34.1 34.7 35.9 36.5 38.6 38.7
Mostly C's 13.2 15.9 17.7 18.3 18.4 18.0
Mostly D's 3.1 4.0 4.4 5.0 4.3 3.7
Mostly F's 2.0 2.2 2.4 2.0 1.5 .9
Q24 My grades are better than most students
YES! 28.8 30.3 29.3 28.5 30.0 30.8
yes 42.8 41.2 41.3 42.4 42.5 42.4
no 20.6 20.6 21.2 20.9 20.2 20.3
NO! 7.8 8.0 8.2 8.2 7.4 6.4
Academic FailureIndiana 7th - 12th Grade Students, 2016
(Values expressed as percentages)
Grade7th 8th 9th 10th 11th 12th
Q24 Teachers notice when doing a good job and let me know
YES! 33.3 27.7 23.9 21.5 21.3 21.4
yes 40.2 41.2 41.0 40.9 42.4 43.4
no 18.6 21.9 24.9 27.0 25.6 25.8
NO! 7.9 9.2 10.2 10.6 10.8 9.4
Q24 I feel safe at school YES! 47.3 38.1 31.8 30.2 31.4 33.2
yes 37.1 41.3 45.6 47.3 48.0 48.0
no 9.7 12.6 14.5 14.3 13.3 12.0
NO! 5.9 8.0 8.0 8.1 7.3 6.8
Q24 School lets parents know when I do well
YES! 22.0 18.3 15.8 14.3 14.7 14.3
yes 28.8 26.9 24.6 24.2 24.0 24.5
no 30.8 33.5 35.3 35.6 35.4 35.9
NO! 18.4 21.3 24.4 25.9 26.0 25.3
Q24 Teachers praise me when l work hard in school
YES! 21.2 18.6 16.7 15.8 15.8 16.4
yes 35.5 33.6 32.9 32.2 34.2 35.5
no 28.5 31.6 33.0 33.8 33.0 33.0
NO! 14.9 16.2 17.4 18.1 17.0 15.1

169
Frequency Tables
Low Commitment to SchoolIndiana 7th - 12th Grade Students, 2016
(Values expressed as percentages)
Grade7th 8th 9th 10th 11th 12th
Q26 Days of school skipped during last month
None 87.5 84.8 83.4 81.6 78.9 71.1
1 day 5.7 7.0 7.5 8.0 9.4 11.6
2 days 2.8 3.4 4.0 4.2 4.9 6.5
3 days 1.5 1.9 2.3 2.5 2.8 4.2
4-5 days 1.4 1.6 1.4 1.9 2.1 3.5
6-10 days .5 .7 .7 .9 1.0 1.7
11 or more days .6 .6 .8 .8 .9 1.5
Q27 How interesting are courses Very interesting 10.4 8.1 7.9 7.7 8.2 8.2
Quite interesting 23.3 21.1 20.9 20.9 21.7 20.3
Fairly interesting 32.8 35.0 37.7 38.0 37.9 37.1
Slightly boring 21.3 21.7 20.3 20.1 19.6 19.7
Very boring 12.2 14.2 13.1 13.3 12.7 14.7
Q29 Feel schoolwork is meaningful Almost always 23.4 16.8 12.5 10.0 9.3 7.9
Often 28.7 27.4 24.7 20.9 19.8 19.1
Sometimes 29.2 31.7 33.2 34.6 34.1 34.7
Seldom 12.1 15.3 18.9 22.8 24.5 25.7
Never 6.5 8.7 10.8 11.7 12.2 12.6
Q30 Importance of school to later life Very important 32.3 24.8 17.6 14.4 12.6 12.0
Quite important 25.5 24.3 21.6 18.2 17.6 17.1
Fairly important 21.7 24.0 26.8 27.5 27.9 27.9
Slightly important 15.9 19.7 24.0 28.1 29.5 30.5
Not at all important 4.6 7.2 10.1 11.9 12.5 12.6
Q25 Enjoy being in school Never 10.4 12.1 13.4 14.4 15.3 15.1
Seldom 10.3 12.8 15.0 16.9 18.3 19.0
Sometimes 32.2 33.7 34.3 35.3 34.1 34.1
Often 28.5 27.2 25.8 24.0 23.3 23.4
A lot 18.6 14.2 11.4 9.5 9.1 8.4
Q25 Hate being in school Never 13.3 9.3 8.0 7.0 7.0 6.7
Seldom 23.1 21.3 19.5 18.0 16.9 16.8
Sometimes 31.8 32.6 33.2 32.3 32.4 33.1
Often 16.0 18.2 20.1 21.7 21.7 22.4
A lot 15.7 18.6 19.2 21.0 22.0 21.1
Q25 Try to do your best work in school Never 1.5 1.9 2.5 2.4 2.7 2.9
Seldom 2.3 3.2 4.0 4.3 4.6 5.6
Sometimes 10.7 13.6 16.3 17.5 19.7 21.2
Often 25.2 29.7 31.5 32.7 32.9 33.6
A lot 60.4 51.6 45.7 43.1 40.1 36.7

Indiana Youth Survey 2016
170
Poor Family ManagementIndiana 7th - 12th Grade Students, 2016
(Values expressed as percentages)
Grade7th 8th 9th 10th 11th 12th
Q31 Rules in my family are clear YES! 66.7 61.8 60.5 58.6 57.7 54.8
yes 28.5 31.9 32.4 34.3 34.7 37.0
no 3.9 5.0 5.7 5.5 5.8 6.2
NO! .9 1.3 1.4 1.5 1.8 1.9
Q31 Parents ask about homework YES! 68.2 58.7 53.5 47.2 41.7 35.4
yes 23.4 28.0 30.3 32.3 33.5 32.3
no 6.3 9.8 12.0 15.0 18.0 22.4
NO! 2.1 3.5 4.2 5.5 6.8 9.8
Q31 Parents know where I am and who I am with
YES! 77.9 71.7 67.3 64.6 59.8 52.1
yes 17.9 22.6 26.4 28.9 31.7 36.0
no 3.0 4.2 4.7 4.9 6.5 8.8
NO! 1.2 1.5 1.6 1.6 2.0 3.1
Q31 Family has clear rules about alcohol and drug use
YES! 82.3 75.4 69.5 65.1 61.0 54.3
yes 12.3 17.2 21.4 25.3 27.8 31.8
no 3.8 5.6 7.2 7.7 9.1 11.0
NO! 1.6 1.8 2.0 1.9 2.1 2.9
Q32 Parents know if you come home late
YES! 68.3 61.9 58.0 55.4 52.6 47.5
yes 23.4 27.7 30.3 32.4 34.1 35.2
no 6.2 7.9 9.1 9.5 10.4 13.1
NO! 2.0 2.4 2.6 2.7 3.0 4.3
Q32 Parents would catch you drinking YES! 69.1 55.2 46.0 38.3 32.9 27.0
yes 17.5 22.3 24.7 25.3 25.0 23.9
no 9.0 16.1 22.0 27.4 31.6 35.7
NO! 4.5 6.3 7.3 9.0 10.5 13.5
Q32 Parents would catch you if you carried a gun
YES! 81.3 72.8 68.6 63.6 58.1 51.0
yes 12.8 17.8 20.5 22.7 25.3 27.7
no 3.6 6.2 7.6 9.7 12.1 15.4
NO! 2.4 3.2 3.3 4.1 4.5 6.0
Q32 Parents would catch you if you skipped school
YES! 79.7 71.6 66.4 61.3 55.8 48.4
yes 14.4 19.8 23.7 26.9 29.9 32.5
no 4.0 6.0 7.4 8.8 10.7 14.0
NO! 1.9 2.6 2.5 3.0 3.6 5.1

171
Frequency Tables
Family ConflictIndiana 7th - 12th Grade Students, 2016
(Values expressed as percentages)
Grade7th 8th 9th 10th 11th 12th
Q31 Family argues over and over about same thing
YES! 18.5 21.5 24.1 23.8 23.8 23.1
yes 23.3 25.2 27.3 27.7 27.2 27.6
no 37.8 37.2 35.1 35.5 35.3 35.9
NO! 20.4 16.1 13.5 13.0 13.6 13.4
Q31 Family has serious arguments YES! 14.7 17.2 19.3 19.3 18.5 18.0
yes 16.1 18.3 21.0 20.9 20.4 21.0
no 34.7 36.7 35.7 36.9 37.2 38.1
NO! 34.5 27.8 23.9 22.8 23.8 23.0
Q31 Family members often insult each other
YES! 14.5 17.3 19.5 18.8 18.1 17.9
yes 16.8 19.0 20.7 21.1 20.5 20.4
no 31.7 32.7 33.0 34.1 34.4 35.3
NO! 37.0 31.0 26.9 26.0 27.0 26.5
Grade7th 8th 9th 10th 11th 12th
Q31 Parents ask me before most family decisions made
YES! 34.0 29.5 28.8 26.2 26.2 24.6
yes 37.7 37.7 37.6 38.5 38.3 38.8
no 17.4 20.6 22.0 22.9 22.7 24.5
NO! 10.9 12.2 11.6 12.5 12.7 12.1
Q32 I can ask parents for help if I have problem
YES! 62.5 53.9 51.3 48.6 48.7 48.2
yes 24.9 28.9 31.2 33.1 33.5 35.0
no 7.8 10.8 11.4 12.1 11.7 10.9
NO! 4.8 6.4 6.1 6.2 6.1 5.9
Q32 Parents give me chances for fun with them
YES! 53.4 46.1 42.9 39.5 39.2 37.4
yes 30.5 33.7 35.7 37.0 36.7 37.4
no 12.2 15.0 16.3 17.7 17.6 18.7
NO! 3.8 5.1 5.2 5.7 6.4 6.6
Family Opportunities for Prosocial InvolvementIndiana 7th - 12th Grade Students, 2016
(Values expressed as percentages)
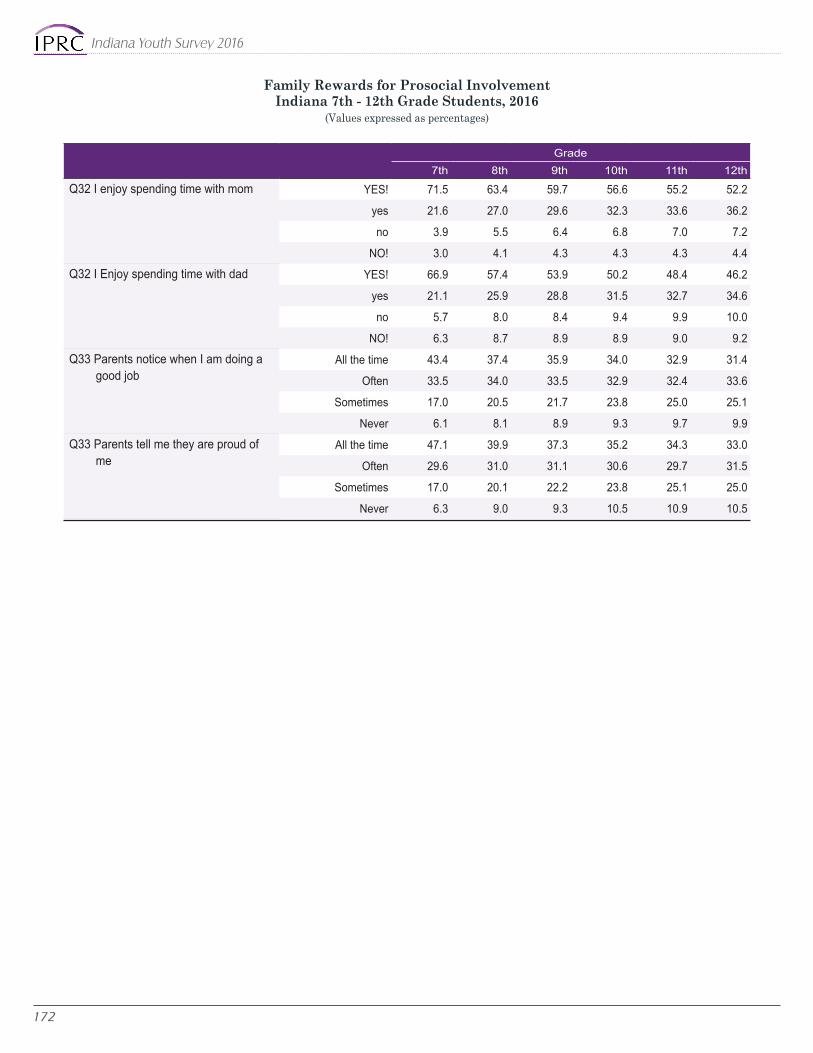
Indiana Youth Survey 2016
172
Family Rewards for Prosocial InvolvementIndiana 7th - 12th Grade Students, 2016
(Values expressed as percentages)
Grade7th 8th 9th 10th 11th 12th
Q32 I enjoy spending time with mom YES! 71.5 63.4 59.7 56.6 55.2 52.2
yes 21.6 27.0 29.6 32.3 33.6 36.2
no 3.9 5.5 6.4 6.8 7.0 7.2
NO! 3.0 4.1 4.3 4.3 4.3 4.4
Q32 I Enjoy spending time with dad YES! 66.9 57.4 53.9 50.2 48.4 46.2
yes 21.1 25.9 28.8 31.5 32.7 34.6
no 5.7 8.0 8.4 9.4 9.9 10.0
NO! 6.3 8.7 8.9 8.9 9.0 9.2
Q33 Parents notice when I am doing a good job
All the time 43.4 37.4 35.9 34.0 32.9 31.4
Often 33.5 34.0 33.5 32.9 32.4 33.6
Sometimes 17.0 20.5 21.7 23.8 25.0 25.1
Never 6.1 8.1 8.9 9.3 9.7 9.9
Q33 Parents tell me they are proud of me
All the time 47.1 39.9 37.3 35.2 34.3 33.0
Often 29.6 31.0 31.1 30.6 29.7 31.5
Sometimes 17.0 20.1 22.2 23.8 25.1 25.0
Never 6.3 9.0 9.3 10.5 10.9 10.5
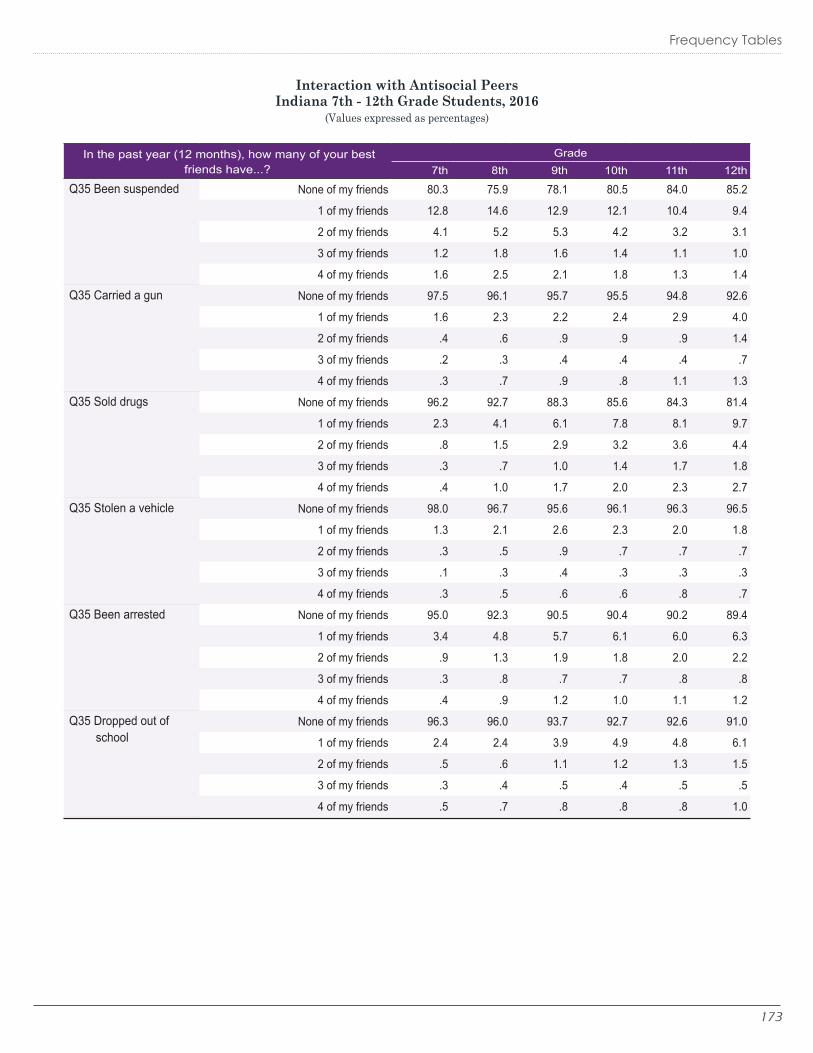
173
Frequency Tables
Interaction with Antisocial PeersIndiana 7th - 12th Grade Students, 2016
(Values expressed as percentages)
In the past year (12 months), how many of your best friends have...?
Grade7th 8th 9th 10th 11th 12th
Q35 Been suspended None of my friends 80.3 75.9 78.1 80.5 84.0 85.2
1 of my friends 12.8 14.6 12.9 12.1 10.4 9.4
2 of my friends 4.1 5.2 5.3 4.2 3.2 3.1
3 of my friends 1.2 1.8 1.6 1.4 1.1 1.0
4 of my friends 1.6 2.5 2.1 1.8 1.3 1.4
Q35 Carried a gun None of my friends 97.5 96.1 95.7 95.5 94.8 92.6
1 of my friends 1.6 2.3 2.2 2.4 2.9 4.0
2 of my friends .4 .6 .9 .9 .9 1.4
3 of my friends .2 .3 .4 .4 .4 .7
4 of my friends .3 .7 .9 .8 1.1 1.3
Q35 Sold drugs None of my friends 96.2 92.7 88.3 85.6 84.3 81.4
1 of my friends 2.3 4.1 6.1 7.8 8.1 9.7
2 of my friends .8 1.5 2.9 3.2 3.6 4.4
3 of my friends .3 .7 1.0 1.4 1.7 1.8
4 of my friends .4 1.0 1.7 2.0 2.3 2.7
Q35 Stolen a vehicle None of my friends 98.0 96.7 95.6 96.1 96.3 96.5
1 of my friends 1.3 2.1 2.6 2.3 2.0 1.8
2 of my friends .3 .5 .9 .7 .7 .7
3 of my friends .1 .3 .4 .3 .3 .3
4 of my friends .3 .5 .6 .6 .8 .7
Q35 Been arrested None of my friends 95.0 92.3 90.5 90.4 90.2 89.4
1 of my friends 3.4 4.8 5.7 6.1 6.0 6.3
2 of my friends .9 1.3 1.9 1.8 2.0 2.2
3 of my friends .3 .8 .7 .7 .8 .8
4 of my friends .4 .9 1.2 1.0 1.1 1.2
Q35 Dropped out of school
None of my friends 96.3 96.0 93.7 92.7 92.6 91.0
1 of my friends 2.4 2.4 3.9 4.9 4.8 6.1
2 of my friends .5 .6 1.1 1.2 1.3 1.5
3 of my friends .3 .4 .5 .4 .5 .5
4 of my friends .5 .7 .8 .8 .8 1.0

Indiana Youth Survey 2016
174
Interaction with Prosocial PeersIndiana 7th - 12th Grade Students, 2016
(Values expressed as percentages)
In the past year (12 months), how many of your best friends have...?
Grade7th 8th 9th 10th 11th 12th
Q35 Participated in school activities
None of my friends 20.8 22.2 24.2 24.7 25.7 26.4
1 of my friends 9.0 9.6 8.2 8.1 7.7 8.3
2 of my friends 14.1 13.8 13.3 12.3 12.4 11.5
3 of my friends 15.0 14.2 14.0 13.1 12.0 11.9
4 of my friends 41.2 40.1 40.3 41.8 42.3 41.9
Q35 Made a commitment to stay drug-free
None of my friends 25.1 29.3 33.6 38.1 42.0 46.6
1 of my friends 5.2 7.1 8.6 9.8 10.4 10.8
2 of my friends 5.0 7.0 8.6 9.3 9.4 9.4
3 of my friends 6.7 8.4 9.6 9.8 9.2 8.7
4 of my friends 58.1 48.2 39.5 33.0 29.0 24.4
Q35 Liked school None of my friends 24.5 30.4 34.2 37.5 39.2 41.1
1 of my friends 12.2 12.6 13.0 12.7 12.2 12.1
2 of my friends 17.5 17.5 17.7 17.9 17.0 16.9
3 of my friends 16.7 15.0 13.4 12.7 12.4 12.0
4 of my friends 29.1 24.5 21.8 19.3 19.1 17.9
Q35 Regularly attended religious activities
None of my friends 23.7 29.3 32.7 36.1 37.8 41.1
1 of my friends 15.9 18.0 18.0 18.7 18.8 19.3
2 of my friends 20.4 19.4 19.0 18.6 17.7 16.9
3 of my friends 16.5 14.3 12.7 11.7 10.8 10.2
4 of my friends 23.6 19.0 17.6 14.9 14.8 12.5
Q35 Tried to do well in school
None of my friends 7.7 9.7 13.3 13.7 15.1 16.3
1 of my friends 4.4 5.4 5.9 5.9 6.1 6.7
2 of my friends 7.7 9.3 10.3 11.2 11.2 12.0
3 of my friends 14.9 16.8 16.8 18.0 17.4 17.7
4 of my friends 65.3 58.8 53.7 51.3 50.1 47.3

175
Frequency Tables
Community Laws and Norms Favorable to Drug UseIndiana 7th - 12th Grade Students, 2016
(Values expressed as percentages)
Grade7th 8th 9th 10th 11th 12th
Q36 If a kid drank alcohol in your neighborhood, would he or she be caught by police?
YES! 30.4 21.7 17.8 13.8 12.9 10.9
yes 30.3 25.8 21.3 19.3 16.1 15.2
no 28.1 36.4 41.8 44.7 45.9 46.9
NO! 11.2 16.0 19.1 22.3 25.1 27.0
Q36 If a kid smoked marijuana in your neighborhood, would he or she be caught by police?
YES! 38.0 25.7 19.8 15.0 13.7 11.5
yes 29.4 27.3 23.7 20.7 17.7 16.7
no 22.3 31.9 37.8 42.2 43.6 45.0
NO! 10.2 15.0 18.7 22.1 25.0 26.8
Q36 If a kid carried a handgun in your neighborhood, would he or she be caught by police?
YES! 44.7 34.3 28.9 24.4 22.1 19.1
yes 29.4 31.1 30.4 30.3 30.0 29.0
no 17.6 23.7 27.6 30.0 31.1 33.1
NO! 8.3 10.9 13.1 15.4 16.8 18.8
Q36 If a kid smoked a cigarette in your neighborhood, would he or she be caught by police?
YES! 28.2 20.2 16.4 12.9 12.2 10.0
yes 25.6 22.2 18.5 16.1 13.7 12.5
no 31.5 37.5 41.4 43.5 43.5 44.3
NO! 14.7 20.2 23.6 27.5 30.6 33.3
Q38 Adults in your neighborhood think about youth marijuana use
Very wrong 82.5 70.1 59.3 51.9 47.1 40.8
Wrong 11.0 18.0 23.5 26.5 28.3 30.6
A little bit wrong 4.5 8.3 11.5 14.7 16.6 18.7
Not at all wrong 2.0 3.7 5.8 6.8 8.0 10.0
Q38 Adults in your neighborhood think about youth alcohol use
Very wrong 75.4 63.9 52.6 46.1 39.3 32.7
Wrong 15.2 21.5 26.5 28.8 30.3 30.7
A little bit wrong 6.7 10.2 14.8 17.8 21.8 25.3
Not at all wrong 2.8 4.4 6.0 7.3 8.6 11.3
Q38 Adults in your neighborhood think about youth cigarettes use
Very wrong 76.6 67.0 57.8 52.5 45.6 35.5
Wrong 14.8 20.4 25.3 27.6 30.2 30.9
A little bit wrong 5.9 8.7 11.7 13.6 16.3 20.8
Not at all wrong 2.7 3.9 5.3 6.3 7.9 12.8
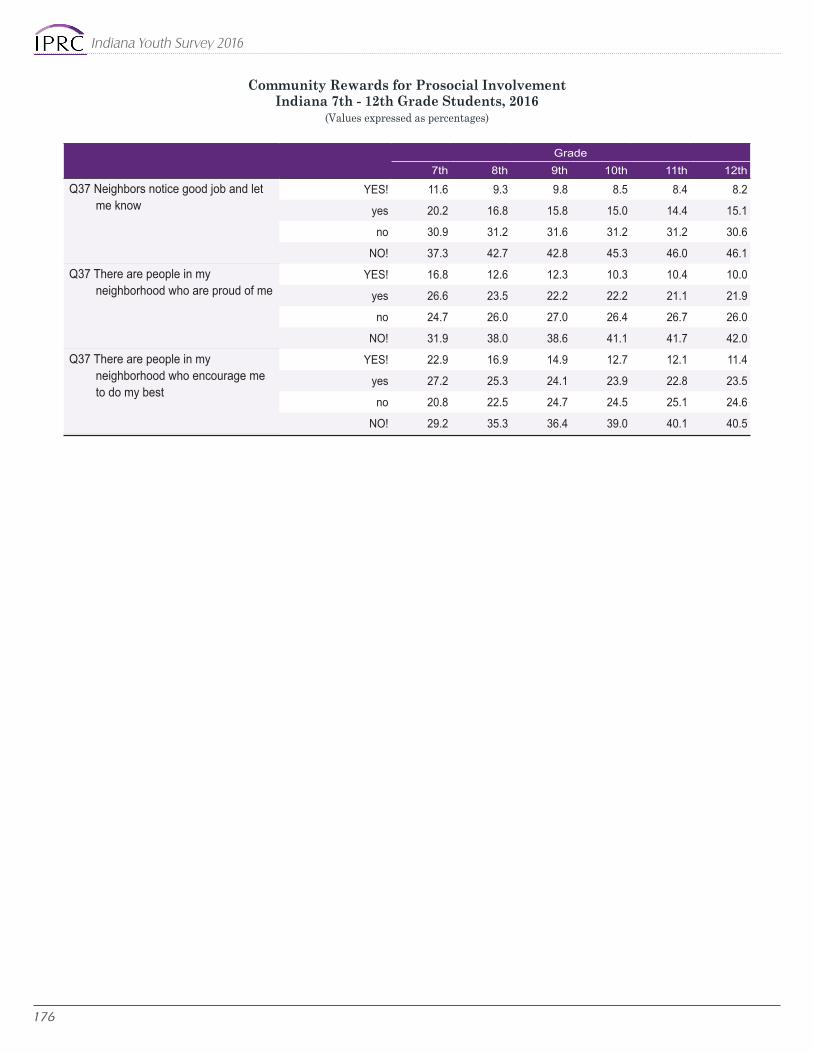
Indiana Youth Survey 2016
176
Community Rewards for Prosocial InvolvementIndiana 7th - 12th Grade Students, 2016
(Values expressed as percentages)
Grade7th 8th 9th 10th 11th 12th
Q37 Neighbors notice good job and let me know
YES! 11.6 9.3 9.8 8.5 8.4 8.2
yes 20.2 16.8 15.8 15.0 14.4 15.1
no 30.9 31.2 31.6 31.2 31.2 30.6
NO! 37.3 42.7 42.8 45.3 46.0 46.1
Q37 There are people in my neighborhood who are proud of me
YES! 16.8 12.6 12.3 10.3 10.4 10.0
yes 26.6 23.5 22.2 22.2 21.1 21.9
no 24.7 26.0 27.0 26.4 26.7 26.0
NO! 31.9 38.0 38.6 41.1 41.7 42.0
Q37 There are people in my neighborhood who encourage me to do my best
YES! 22.9 16.9 14.9 12.7 12.1 11.4
yes 27.2 25.3 24.1 23.9 22.8 23.5
no 20.8 22.5 24.7 24.5 25.1 24.6
NO! 29.2 35.3 36.4 39.0 40.1 40.5

177
Frequency Tables
Personal and Family InformationIndiana Male 7th - 12th Grade Students, 2016
(Values expressed as percentages, valid cases only)
Grade7th 8th 9th 10th 11th 12th
Q2 Hispanic/Latino Non-Hispanic 87.8 86.5 87.3 86.3 86.6 86.8
Hispanic 12.2 13.5 12.7 13.7 13.4 13.2
Q3 Race White 79.4 77.0 81.4 79.1 82.7 81.4
Black/African American 5.8 8.0 7.1 9.7 8.4 8.6
Asian 1.7 1.7 1.2 1.1 1.2 1.3
Native Hawaiian/Pacific Islander .2 .3 .1 .3 .2 .3
American Indian/Alaskan Native 1.1 1.0 .9 .7 .6 .7
Race not known or other 3.2 3.2 2.4 2.0 1.6 2.0
More than one race 8.5 8.8 6.9 7.1 5.4 5.6
Q5 Age 11 years .2 0.0 0.0 0.0 0.0 0.0
12 years 27.0 .1 0.0 0.0 0.0 0.0
13 years 64.2 26.7 .2 0.0 0.0 0.0
14 years 8.3 63.9 25.2 .2 0.0 0.0
15 years .4 9.0 64.7 23.7 .3 0.0
16 years 0.0 .3 9.5 67.1 26.8 .5
17 years 0.0 0.0 .4 8.6 66.7 27.4
18 years or older 0.0 0.0 0.0 .4 6.2 72.1
Q6 Parents served in a war zone
No 76.5 79.4 82.4 85.4 87.6 88.8
Yes 13.3 12.1 11.0 9.5 8.4 7.9
Not sure 10.2 8.5 6.6 5.1 4.0 3.3
Q7 Parents served time in jail
No 69.2 66.4 70.1 71.7 74.0 76.8
Yes 20.5 23.4 21.4 20.8 19.8 17.8
Not sure 10.3 10.2 8.5 7.5 6.2 5.5

Indiana Youth Survey 2016
178
How many times in the last month (30 days) have you used...?
Grade7th 8th 9th 10th 11th 12th
Q8 Cigarettes Never 97.3 95.4 93.0 91.4 88.0 83.1
1-5 times 1.9 3.0 4.1 4.6 5.6 7.4
6-19 times .4 .6 1.1 1.2 2.0 3.1
20-39 times .1 .3 .5 1.0 1.1 1.6
40+ times .2 .6 1.3 1.9 3.2 4.9
Q8 Smokeless tobacco Never 98.1 96.2 93.9 92.2 89.5 87.0
1-5 times 1.2 2.3 3.0 3.7 4.3 4.6
6-19 times .4 .6 1.2 1.0 1.4 2.0
20-39 times .1 .3 .5 .8 1.2 1.3
40+ times .1 .6 1.4 2.3 3.7 5.1
Q8 Cigars Never 99.1 97.9 95.8 94.5 90.8 84.5
1-5 times .7 1.6 3.0 4.0 6.5 11.1
6-19 times .2 .3 .6 .8 1.3 2.4
20-39 times .0 .0 .2 .4 .6 1.0
40+ times .0 .2 .3 .3 .8 1.1
Q8 Pipe Never 99.0 97.9 96.7 95.9 94.1 91.7
1-5 times .8 1.3 2.0 2.3 3.3 4.8
6-19 times .2 .4 .5 .8 1.2 1.6
20-39 times .0 .2 .3 .4 .5 .6
40+ times .0 .2 .5 .5 .9 1.3
Q8 Electronic vapor products
Never 95.0 90.8 86.1 83.4 78.9 75.2
1-5 times 3.3 5.4 7.5 8.4 10.3 10.9
6-19 times .9 1.8 2.6 3.0 3.9 4.6
20-39 times .4 .8 1.1 1.6 1.7 2.8
40+ times .4 1.3 2.6 3.6 5.1 6.5
Q8 Alcohol Never 92.3 88.1 83.6 78.9 73.4 65.9
1-5 times 6.4 9.1 11.2 13.9 16.5 20.4
6-19 times .9 1.8 3.3 4.1 5.8 7.8
20-39 times .2 .4 .9 1.3 2.0 2.0
40+ times .2 .7 1.0 1.7 2.3 3.9
Q8 Marijuana Never 97.1 93.5 90.5 86.2 82.8 78.4
1-5 times 1.7 3.6 4.4 6.1 7.0 8.6
6-19 times .6 1.3 1.8 2.5 3.1 3.7
20-39 times .3 .6 1.0 1.4 1.8 2.5
40+ times .3 1.1 2.3 3.9 5.2 6.9
Past Month Use of Alcohol, Tobacco, and Other DrugsIndiana Male 7th - 12th Grade Students, 2016
(Values expressed as percentages, valid cases only)

179
Frequency Tables
How many times in the last month (30 days) have you used...?
Grade7th 8th 9th 10th 11th 12th
Q8 Synthetic marijuana Never 99.4 99.0 98.3 98.4 98.5 98.21-5 times .4 .7 1.0 1.0 .8 1.1
6-19 times .1 .1 .3 .2 .3 .320-39 times .0 .1 .2 .2 .1 .1
40+ times .0 .1 .3 .1 .3 .2Q8 Cocaine/Crack Never 99.8 99.7 99.5 99.2 98.9 98.1
1-5 times .1 .2 .3 .6 .8 1.26-19 times .0 .1 .1 .2 .1 .4
20-39 times .0 .0 .1 .0 .1 .140+ times .0 0.0 .1 .0 .2 .1
Q8 Inhalants Never 99.6 99.4 99.3 99.2 99.2 99.01-5 times .4 .5 .5 .6 .6 .8
6-19 times .0 .1 .1 .1 .1 .120-39 times .0 .0 .0 .0 .1 .1
40+ times .0 .0 .0 .1 .1 .0Q8 Methamphetamines Never 99.9 99.9 99.8 99.6 99.4 99.1
1-5 times .1 .1 .1 .2 .3 .56-19 times .0 .0 .1 .1 .1 .2
20-39 times 0.0 .0 .0 .0 .1 .140+ times 0.0 .0 .0 .1 .1 .1
Q8 Heroin Never 99.9 99.8 99.8 99.7 99.5 99.41-5 times .1 .1 .1 .3 .3 .4
6-19 times 0.0 .1 .0 .0 .1 .120-39 times 0.0 .0 0.0 0.0 0.0 .1
40+ times 0.0 .0 .1 .0 .1 .1Q8 Hallucinogens/
EcstasyNever 99.7 99.2 98.8 98.1 97.3 95.8
1-5 times .3 .5 .8 1.2 2.0 3.16-19 times .1 .2 .2 .5 .5 .7
20-39 times 0.0 .0 .1 .0 .2 .240+ times 0.0 .1 .0 .1 .1 .1
Q8 Prescription drugs not prescribed to you
Never 98.5 98.0 97.5 96.5 95.0 93.21-5 times .9 1.2 1.6 2.0 3.0 4.1
6-19 times .2 .4 .5 .8 1.5 1.620-39 times .2 .2 .3 .3 .3 .5
40+ times .2 .2 .2 .3 .3 .6Q8 Over the counter
drugs to get highNever 97.3 97.1 97.1 96.8 96.3 95.6
1-5 times 1.9 1.8 2.0 2.1 2.6 3.16-19 times .5 .5 .5 .6 .6 .7
20-39 times .1 .2 .2 .2 .3 .340+ times .2 .3 .2 .2 .2 .3
Past Month Use of Alcohol, Tobacco, and Other DrugsIndiana Male 7th - 12th Grade Students, 2016
(Values expressed as percentages, valid cases only)

Indiana Youth Survey 2016
180
Age Distribution of First Time Alcohol, Tobacco, and Other Drug UseIndiana Male 7th - 12th Grade Students, 2016
(Values expressed as percentages, valid cases only)
How old were you when you first used...?
Grade7th 8th 9th 10th 11th 12th
Q9 Cigarettes Never used 95.0 91.5 87.8 84.0 79.2 72.610 years or younger 2.1 2.6 2.8 2.9 2.6 2.4
11 years 1.1 1.3 1.4 1.4 1.3 1.312 years 1.1 1.7 1.8 2.2 2.1 2.513 years .6 1.9 2.2 2.2 2.5 2.914 years .1 1.0 2.6 2.8 3.1 3.115 years 0.0 .1 1.3 3.2 3.8 3.916 years 0.0 0.0 .1 1.2 3.6 4.7
17 years or older 0.0 0.0 .0 .2 1.8 6.5Q9 Smokeless tobacco Never used 97.0 94.2 90.9 87.7 83.2 79.1
10 years or younger 1.0 1.0 1.4 1.2 1.4 1.111 years .5 .8 .7 .7 .9 .712 years .9 1.1 1.3 1.4 1.4 1.313 years .5 1.8 1.6 1.8 2.3 2.014 years .1 .9 2.5 2.5 2.7 2.815 years 0.0 .1 1.5 3.4 3.5 3.716 years 0.0 0.0 .1 1.2 3.1 3.9
17 years or older 0.0 0.0 0.0 .1 1.4 5.3Q9 Cigars Never used 98.3 96.1 93.1 89.5 83.1 73.8
10 years or younger .5 .7 .8 .9 .9 .811 years .3 .6 .6 .5 .8 .512 years .4 .8 .9 1.2 1.2 1.313 years .3 1.1 1.4 1.3 1.4 1.814 years .1 .6 2.0 2.4 2.7 2.515 years .0 .1 1.1 2.9 4.0 4.316 years 0.0 0.0 .1 1.2 3.8 5.4
17 years or older 0.0 0.0 0.0 .1 2.1 9.6Q9 Pipe Never used 98.4 96.7 94.7 92.7 88.9 84.4
10 years or younger .3 .4 .6 .4 .5 .411 years .3 .4 .4 .3 .3 .212 years .7 .9 .7 .7 .6 .713 years .2 1.0 1.1 1.2 1.0 .814 years .1 .5 1.7 1.7 2.2 1.815 years 0.0 .1 .8 2.2 2.8 3.316 years 0.0 0.0 .1 .7 2.6 3.6
17 years or older 0.0 .0 0.0 .1 1.0 4.8
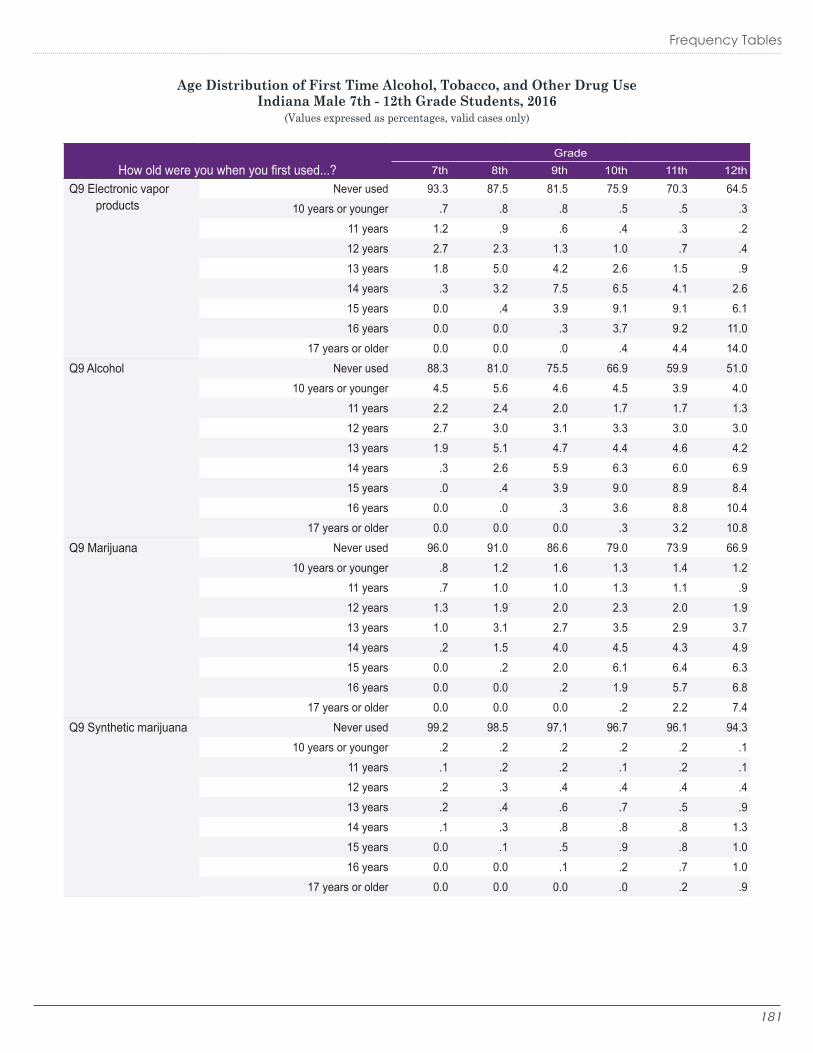
181
Frequency Tables
Age Distribution of First Time Alcohol, Tobacco, and Other Drug UseIndiana Male 7th - 12th Grade Students, 2016
(Values expressed as percentages, valid cases only)
How old were you when you first used...?
Grade7th 8th 9th 10th 11th 12th
Q9 Electronic vapor products
Never used 93.3 87.5 81.5 75.9 70.3 64.510 years or younger .7 .8 .8 .5 .5 .3
11 years 1.2 .9 .6 .4 .3 .212 years 2.7 2.3 1.3 1.0 .7 .413 years 1.8 5.0 4.2 2.6 1.5 .914 years .3 3.2 7.5 6.5 4.1 2.615 years 0.0 .4 3.9 9.1 9.1 6.116 years 0.0 0.0 .3 3.7 9.2 11.0
17 years or older 0.0 0.0 .0 .4 4.4 14.0Q9 Alcohol Never used 88.3 81.0 75.5 66.9 59.9 51.0
10 years or younger 4.5 5.6 4.6 4.5 3.9 4.011 years 2.2 2.4 2.0 1.7 1.7 1.312 years 2.7 3.0 3.1 3.3 3.0 3.013 years 1.9 5.1 4.7 4.4 4.6 4.214 years .3 2.6 5.9 6.3 6.0 6.915 years .0 .4 3.9 9.0 8.9 8.416 years 0.0 .0 .3 3.6 8.8 10.4
17 years or older 0.0 0.0 0.0 .3 3.2 10.8Q9 Marijuana Never used 96.0 91.0 86.6 79.0 73.9 66.9
10 years or younger .8 1.2 1.6 1.3 1.4 1.211 years .7 1.0 1.0 1.3 1.1 .912 years 1.3 1.9 2.0 2.3 2.0 1.913 years 1.0 3.1 2.7 3.5 2.9 3.714 years .2 1.5 4.0 4.5 4.3 4.915 years 0.0 .2 2.0 6.1 6.4 6.316 years 0.0 0.0 .2 1.9 5.7 6.8
17 years or older 0.0 0.0 0.0 .2 2.2 7.4Q9 Synthetic marijuana Never used 99.2 98.5 97.1 96.7 96.1 94.3
10 years or younger .2 .2 .2 .2 .2 .111 years .1 .2 .2 .1 .2 .112 years .2 .3 .4 .4 .4 .413 years .2 .4 .6 .7 .5 .914 years .1 .3 .8 .8 .8 1.315 years 0.0 .1 .5 .9 .8 1.016 years 0.0 0.0 .1 .2 .7 1.0
17 years or older 0.0 0.0 0.0 .0 .2 .9
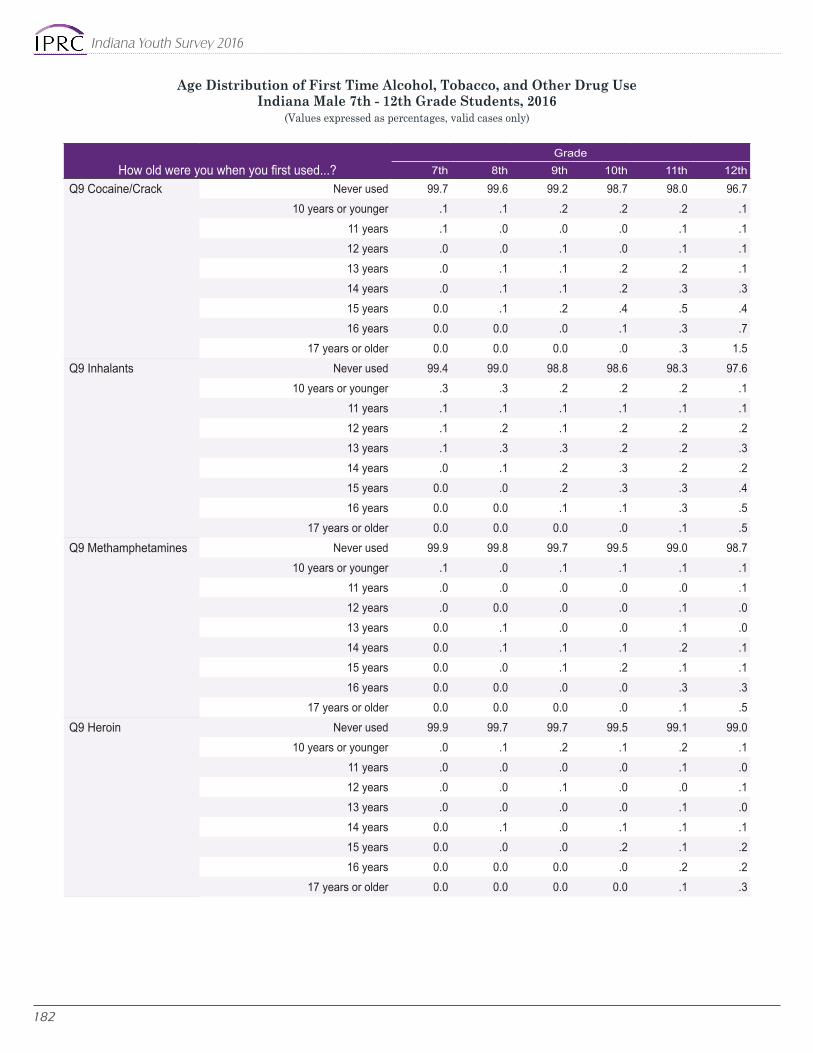
Indiana Youth Survey 2016
182
How old were you when you first used...?
Grade7th 8th 9th 10th 11th 12th
Q9 Cocaine/Crack Never used 99.7 99.6 99.2 98.7 98.0 96.710 years or younger .1 .1 .2 .2 .2 .1
11 years .1 .0 .0 .0 .1 .112 years .0 .0 .1 .0 .1 .113 years .0 .1 .1 .2 .2 .114 years .0 .1 .1 .2 .3 .315 years 0.0 .1 .2 .4 .5 .416 years 0.0 0.0 .0 .1 .3 .7
17 years or older 0.0 0.0 0.0 .0 .3 1.5Q9 Inhalants Never used 99.4 99.0 98.8 98.6 98.3 97.6
10 years or younger .3 .3 .2 .2 .2 .111 years .1 .1 .1 .1 .1 .112 years .1 .2 .1 .2 .2 .213 years .1 .3 .3 .2 .2 .314 years .0 .1 .2 .3 .2 .215 years 0.0 .0 .2 .3 .3 .416 years 0.0 0.0 .1 .1 .3 .5
17 years or older 0.0 0.0 0.0 .0 .1 .5Q9 Methamphetamines Never used 99.9 99.8 99.7 99.5 99.0 98.7
10 years or younger .1 .0 .1 .1 .1 .111 years .0 .0 .0 .0 .0 .112 years .0 0.0 .0 .0 .1 .013 years 0.0 .1 .0 .0 .1 .014 years 0.0 .1 .1 .1 .2 .115 years 0.0 .0 .1 .2 .1 .116 years 0.0 0.0 .0 .0 .3 .3
17 years or older 0.0 0.0 0.0 .0 .1 .5Q9 Heroin Never used 99.9 99.7 99.7 99.5 99.1 99.0
10 years or younger .0 .1 .2 .1 .2 .111 years .0 .0 .0 .0 .1 .012 years .0 .0 .1 .0 .0 .113 years .0 .0 .0 .0 .1 .014 years 0.0 .1 .0 .1 .1 .115 years 0.0 .0 .0 .2 .1 .216 years 0.0 0.0 0.0 .0 .2 .2
17 years or older 0.0 0.0 0.0 0.0 .1 .3
Age Distribution of First Time Alcohol, Tobacco, and Other Drug UseIndiana Male 7th - 12th Grade Students, 2016
(Values expressed as percentages, valid cases only)
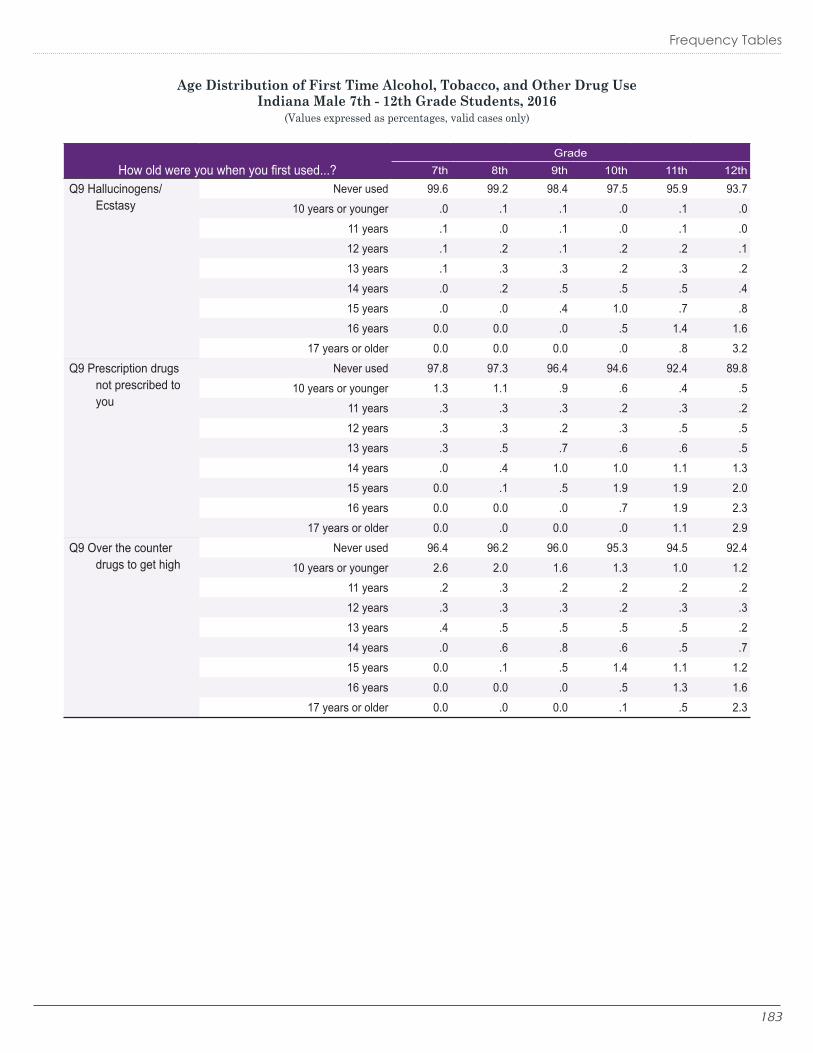
183
Frequency Tables
How old were you when you first used...?
Grade7th 8th 9th 10th 11th 12th
Q9 Hallucinogens/Ecstasy
Never used 99.6 99.2 98.4 97.5 95.9 93.710 years or younger .0 .1 .1 .0 .1 .0
11 years .1 .0 .1 .0 .1 .012 years .1 .2 .1 .2 .2 .113 years .1 .3 .3 .2 .3 .214 years .0 .2 .5 .5 .5 .415 years .0 .0 .4 1.0 .7 .816 years 0.0 0.0 .0 .5 1.4 1.6
17 years or older 0.0 0.0 0.0 .0 .8 3.2Q9 Prescription drugs
not prescribed to you
Never used 97.8 97.3 96.4 94.6 92.4 89.810 years or younger 1.3 1.1 .9 .6 .4 .5
11 years .3 .3 .3 .2 .3 .212 years .3 .3 .2 .3 .5 .513 years .3 .5 .7 .6 .6 .514 years .0 .4 1.0 1.0 1.1 1.315 years 0.0 .1 .5 1.9 1.9 2.016 years 0.0 0.0 .0 .7 1.9 2.3
17 years or older 0.0 .0 0.0 .0 1.1 2.9Q9 Over the counter
drugs to get highNever used 96.4 96.2 96.0 95.3 94.5 92.4
10 years or younger 2.6 2.0 1.6 1.3 1.0 1.211 years .2 .3 .2 .2 .2 .212 years .3 .3 .3 .2 .3 .313 years .4 .5 .5 .5 .5 .214 years .0 .6 .8 .6 .5 .715 years 0.0 .1 .5 1.4 1.1 1.216 years 0.0 0.0 .0 .5 1.3 1.6
17 years or older 0.0 .0 0.0 .1 .5 2.3
Age Distribution of First Time Alcohol, Tobacco, and Other Drug UseIndiana Male 7th - 12th Grade Students, 2016
(Values expressed as percentages, valid cases only)

Indiana Youth Survey 2016
184
Binge Drinking in the Last Two WeeksIndiana Male 7th - 12th Grade Students, 2016
(Values expressed as percentages)
Think back over the last 2 weeks...Grade
7th 8th 9th 10th 11th 12th
Q10 Binge drinking None 97.5 95.6 92.7 90.6 87.0 81.1
Once .9 1.7 3.2 3.9 4.8 6.7
Twice .7 1.1 1.5 2.1 3.0 3.9
3-5 times .6 1.0 1.5 1.9 2.9 4.9
6-9 times .1 .3 .5 .8 1.1 1.8
10+ times .2 .4 .6 .8 1.2 1.6
How easy would it be for you to get...?Grade
7th 8th 9th 10th 11th 12th
Q11 Cigarettes Very hard 67.6 56.7 46.9 38.6 29.1 14.7
Sort of hard 12.4 14.4 15.5 14.9 12.5 6.2
Sort of easy 10.2 14.2 17.1 18.9 18.8 11.7
Very easy 9.8 14.7 20.5 27.7 39.6 67.4
Q11 Alcohol Very hard 55.5 45.2 35.2 28.5 23.1 17.9
Sort of hard 16.6 16.6 16.4 14.5 12.7 13.2
Sort of easy 13.6 17.4 21.6 23.2 23.5 26.6
Very easy 14.2 20.8 26.8 33.7 40.7 42.3
Q11 Marijuana Very hard 85.6 72.4 58.3 44.5 35.3 27.3
Sort of hard 5.7 9.6 11.9 13.2 13.9 13.9
Sort of easy 4.0 8.0 12.6 16.3 17.0 19.6
Very easy 4.6 10.0 17.3 26.1 33.8 39.1
Q11 Drugs like cocaine, LSD or amphetamines
Very hard 93.3 88.3 79.1 70.4 61.3 53.4
Sort of hard 3.5 6.2 10.6 14.4 18.4 21.5
Sort of easy 1.3 2.4 4.2 7.1 8.9 11.8
Very easy 1.9 3.2 6.1 8.1 11.4 13.2
Perceived Availability of DrugsIndiana Male 7th - 12th Grade Students, 2016
(Values expressed as percentages)
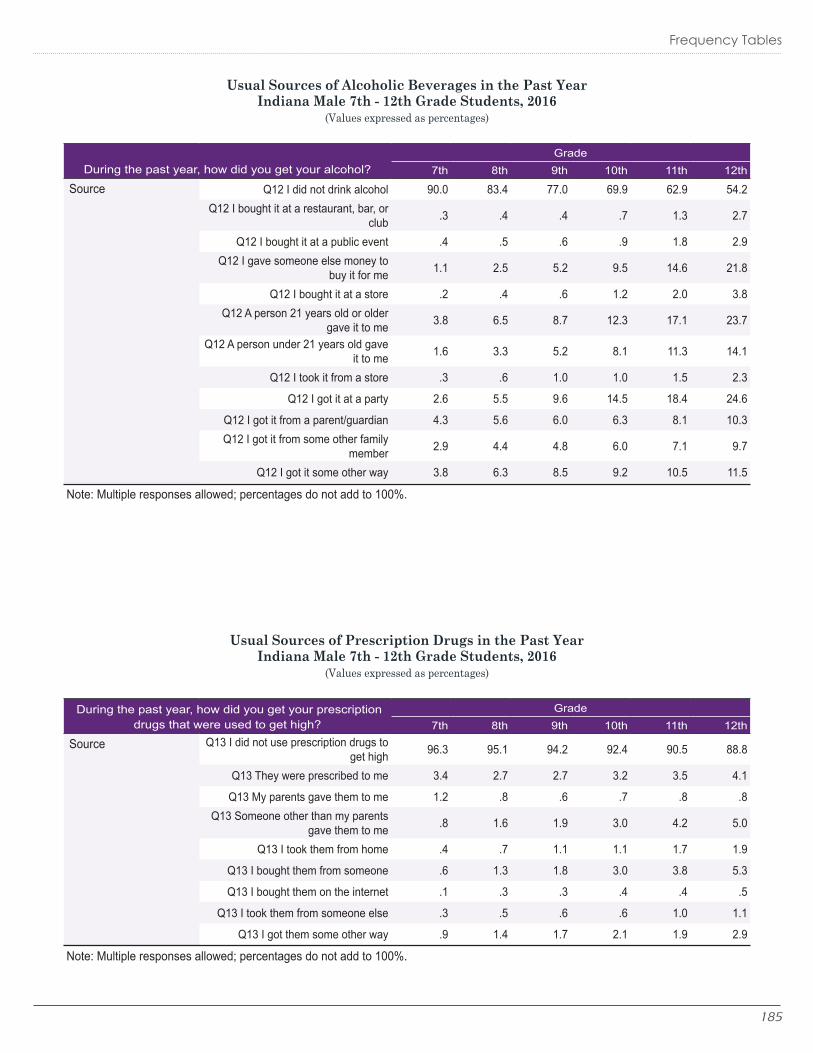
185
Frequency Tables
Usual Sources of Alcoholic Beverages in the Past YearIndiana Male 7th - 12th Grade Students, 2016
(Values expressed as percentages)
During the past year, how did you get your prescription drugs that were used to get high?
Grade7th 8th 9th 10th 11th 12th
Source Q13 I did not use prescription drugs to get high 96.3 95.1 94.2 92.4 90.5 88.8
Q13 They were prescribed to me 3.4 2.7 2.7 3.2 3.5 4.1
Q13 My parents gave them to me 1.2 .8 .6 .7 .8 .8Q13 Someone other than my parents
gave them to me .8 1.6 1.9 3.0 4.2 5.0
Q13 I took them from home .4 .7 1.1 1.1 1.7 1.9
Q13 I bought them from someone .6 1.3 1.8 3.0 3.8 5.3
Q13 I bought them on the internet .1 .3 .3 .4 .4 .5
Q13 I took them from someone else .3 .5 .6 .6 1.0 1.1
Q13 I got them some other way .9 1.4 1.7 2.1 1.9 2.9
Usual Sources of Prescription Drugs in the Past YearIndiana Male 7th - 12th Grade Students, 2016
(Values expressed as percentages)
Note: Multiple responses allowed; percentages do not add to 100%.
During the past year, how did you get your alcohol? Grade
7th 8th 9th 10th 11th 12th
Source Q12 I did not drink alcohol 90.0 83.4 77.0 69.9 62.9 54.2Q12 I bought it at a restaurant, bar, or
club .3 .4 .4 .7 1.3 2.7
Q12 I bought it at a public event .4 .5 .6 .9 1.8 2.9Q12 I gave someone else money to
buy it for me 1.1 2.5 5.2 9.5 14.6 21.8
Q12 I bought it at a store .2 .4 .6 1.2 2.0 3.8Q12 A person 21 years old or older
gave it to me 3.8 6.5 8.7 12.3 17.1 23.7
Q12 A person under 21 years old gave it to me 1.6 3.3 5.2 8.1 11.3 14.1
Q12 I took it from a store .3 .6 1.0 1.0 1.5 2.3
Q12 I got it at a party 2.6 5.5 9.6 14.5 18.4 24.6
Q12 I got it from a parent/guardian 4.3 5.6 6.0 6.3 8.1 10.3Q12 I got it from some other family
member 2.9 4.4 4.8 6.0 7.1 9.7
Q12 I got it some other way 3.8 6.3 8.5 9.2 10.5 11.5
Note: Multiple responses allowed; percentages do not add to 100%.

Indiana Youth Survey 2016
186
CRAFFT Substance Abuse ScreeningIndiana Male 14 Years or Older Students, 2016
(Values expressed as percentages)
How many times have you experienced the following due to your drinking or drug use...?
Grade7th 8th 9th 10th 11th 12th
Q15 Performed poorly on test or project
Never 95.3 94.9 94.8 95.0 95.1 94.4
Once 1.4 1.8 1.5 1.6 1.6 1.5
Twice 1.1 1.0 1.3 1.1 .9 1.2
3-5 times 1.1 1.2 1.2 1.2 1.2 1.5
6-10 times .4 .3 .4 .4 .4 .6
11+ times .7 .7 .9 .8 .8 .8
Q15 Missed class Never 97.0 96.7 96.3 95.8 95.7 94.0
Once 1.0 1.0 1.4 1.4 1.3 1.8
Twice .8 .7 .7 .8 .7 1.0
3-5 times .6 .8 .7 .9 1.2 1.4
6-10 times .3 .2 .3 .3 .3 .7
11+ times .4 .6 .6 .8 .8 1.1
Consequences of Alcohol, Tobacco, and Other Drug UseIndiana Male 7th - 12th Grade Students, 2016
(Values expressed as percentages)
Grade
14 years 15 years 16 years 17 years18 years or older
Q34 Have you ever ridden in a car driven by someone (including yourself) who was high or had been using alcohol or drugs?
No 78.5 74.0 70.0 63.0 58.0
Yes 21.5 26.0 30.0 37.0 42.0
Q14 Do you ever use alcohol or drugs to relax, feel better about yourself, or fit in?
Never used 79.7 71.0 63.4 55.6 48.8
No 14.8 19.1 24.4 26.8 30.4
Yes 5.6 9.9 12.2 17.5 20.8
Q14 Do you ever use alcohol or drugs while you are by yourself, or alone?
Never used 79.6 71.3 63.6 55.7 49.0
No 13.3 17.3 22.1 25.3 30.2
Yes 7.2 11.4 14.2 19.0 20.9
Q14 Do you ever forget things you did while using alcohol or drugs?
Never used 80.2 71.9 64.1 56.4 49.8
No 16.6 22.1 26.8 31.0 33.1
Yes 3.2 6.1 9.1 12.6 17.1
Q14 Do your family or friends ever tell you that you should cut down on your drinking or drug use?
Never used 80.7 72.4 64.7 56.9 50.1
No 16.9 23.6 30.2 36.5 42.9
Yes 2.4 4.1 5.0 6.6 7.0
Q14 Have you ever gotten into trouble while you were using alcohol or drugs?
Never used 79.8 71.4 63.5 55.7 49.4
No 16.4 22.6 29.3 34.9 40.3
Yes 3.8 6.0 7.2 9.4 10.3
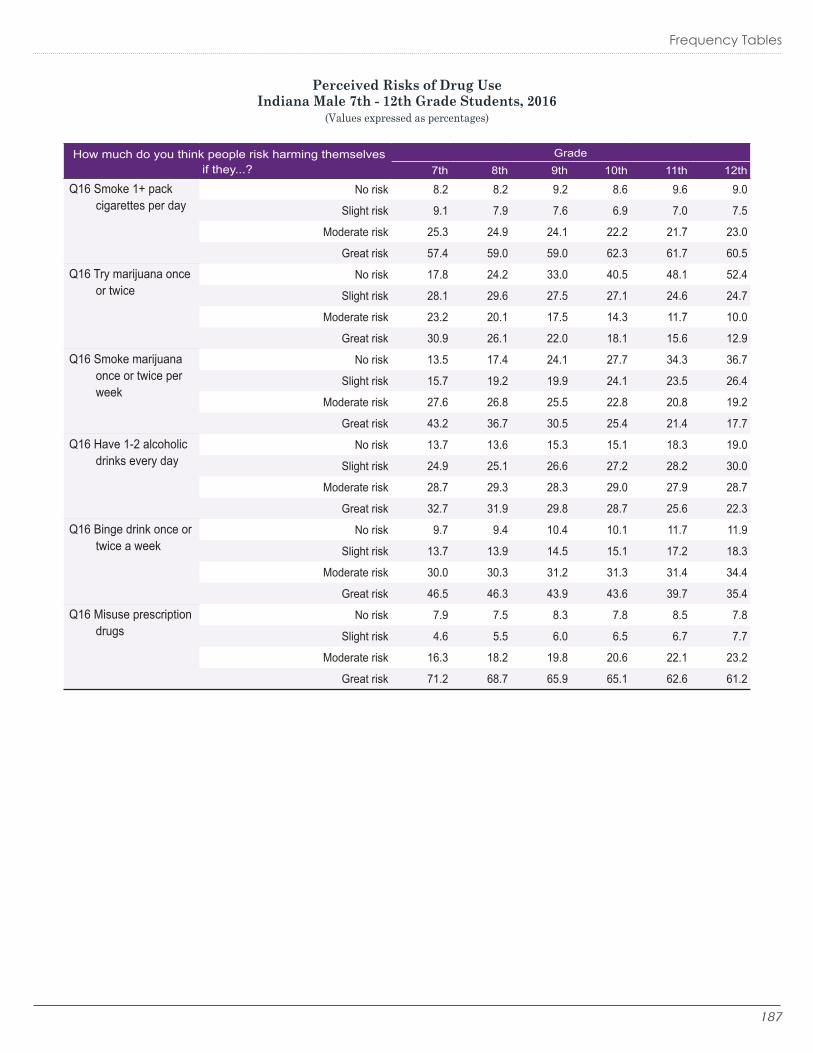
187
Frequency Tables
Perceived Risks of Drug UseIndiana Male 7th - 12th Grade Students, 2016
(Values expressed as percentages)
How much do you think people risk harming themselves if they...?
Grade7th 8th 9th 10th 11th 12th
Q16 Smoke 1+ pack cigarettes per day
No risk 8.2 8.2 9.2 8.6 9.6 9.0
Slight risk 9.1 7.9 7.6 6.9 7.0 7.5
Moderate risk 25.3 24.9 24.1 22.2 21.7 23.0
Great risk 57.4 59.0 59.0 62.3 61.7 60.5
Q16 Try marijuana once or twice
No risk 17.8 24.2 33.0 40.5 48.1 52.4
Slight risk 28.1 29.6 27.5 27.1 24.6 24.7
Moderate risk 23.2 20.1 17.5 14.3 11.7 10.0
Great risk 30.9 26.1 22.0 18.1 15.6 12.9
Q16 Smoke marijuana once or twice per week
No risk 13.5 17.4 24.1 27.7 34.3 36.7
Slight risk 15.7 19.2 19.9 24.1 23.5 26.4
Moderate risk 27.6 26.8 25.5 22.8 20.8 19.2
Great risk 43.2 36.7 30.5 25.4 21.4 17.7
Q16 Have 1-2 alcoholic drinks every day
No risk 13.7 13.6 15.3 15.1 18.3 19.0
Slight risk 24.9 25.1 26.6 27.2 28.2 30.0
Moderate risk 28.7 29.3 28.3 29.0 27.9 28.7
Great risk 32.7 31.9 29.8 28.7 25.6 22.3
Q16 Binge drink once or twice a week
No risk 9.7 9.4 10.4 10.1 11.7 11.9
Slight risk 13.7 13.9 14.5 15.1 17.2 18.3
Moderate risk 30.0 30.3 31.2 31.3 31.4 34.4
Great risk 46.5 46.3 43.9 43.6 39.7 35.4
Q16 Misuse prescription drugs
No risk 7.9 7.5 8.3 7.8 8.5 7.8
Slight risk 4.6 5.5 6.0 6.5 6.7 7.7
Moderate risk 16.3 18.2 19.8 20.6 22.1 23.2
Great risk 71.2 68.7 65.9 65.1 62.6 61.2

Indiana Youth Survey 2016
188
Favorable Attitudes Toward Antisocial BehaviorIndiana Male 7th - 12th Grade Students, 2016
(Values expressed as percentages)
How wrong do you think it is for someone your age to...?Grade
7th 8th 9th 10th 11th 12th
Q17 Take a gun to school
Very wrong 92.0 89.2 87.4 87.7 85.8 84.3
Wrong 5.5 7.1 8.2 8.0 8.8 9.4
A little bit wrong 1.7 2.3 2.5 2.6 3.0 3.9
Not at all wrong .8 1.4 1.9 1.7 2.5 2.4
Q17 Steal something more than $5
Very wrong 47.8 44.1 44.6 46.4 48.5 49.8
Wrong 39.6 40.1 38.7 38.0 37.0 36.4
A little bit wrong 11.2 13.9 14.2 13.2 12.1 11.8
Not at all wrong 1.4 2.0 2.5 2.4 2.4 2.0
Q17 Attack someone Very wrong 77.0 70.7 67.0 67.2 67.0 66.2
Wrong 16.6 21.4 23.1 23.1 22.6 24.2
A little bit wrong 4.7 5.9 7.3 7.0 7.5 7.1
Not at all wrong 1.7 2.0 2.6 2.7 2.9 2.5
Q17 Pick a fight Very wrong 42.4 39.2 39.6 41.3 41.6 42.3
Wrong 39.3 38.6 36.4 35.8 36.3 36.4
A little bit wrong 15.1 18.1 19.1 18.0 17.3 17.2
Not at all wrong 3.2 4.1 4.9 4.8 4.7 4.0
Q17 Skip school Very wrong 69.4 61.0 55.6 52.0 48.5 43.0
Wrong 24.3 29.6 31.7 33.3 34.1 34.9
A little bit wrong 5.1 7.8 10.3 12.0 14.0 18.0
Not at all wrong 1.2 1.6 2.4 2.7 3.4 4.1

189
Frequency Tables
Favorable Attitudes Toward Drug UseIndiana Male 7th - 12th Grade Students, 2016
(Values expressed as percentages)
How wrong do you think it is for someone your age to...?Grade
7th 8th 9th 10th 11th 12th
Q17 Drink alcohol regularly
Very wrong 79.7 67.8 56.0 48.7 42.6 35.7
Wrong 13.5 20.1 23.8 25.0 22.5 21.6
A little bit wrong 5.0 8.9 14.2 17.9 22.3 25.3
Not at all wrong 1.9 3.2 6.0 8.4 12.6 17.4
Q17 Smoke cigarettes Very wrong 82.3 75.5 65.7 61.4 54.7 43.3
Wrong 13.2 17.7 22.7 24.3 25.4 24.6
A little bit wrong 3.5 5.1 8.4 10.1 12.9 18.7
Not at all wrong 1.1 1.8 3.2 4.2 7.0 13.4
Q17 Smoke marijuana Very wrong 84.3 72.4 59.0 49.9 43.6 34.6
Wrong 8.1 13.7 18.2 19.4 19.5 19.2
A little bit wrong 4.6 7.8 11.5 15.5 16.6 21.4
Not at all wrong 3.0 6.1 11.3 15.2 20.3 24.9
Q17 Use illegal drugs Very wrong 94.8 92.0 86.4 83.6 79.0 75.1
Wrong 3.7 5.9 9.8 11.1 13.0 14.8
A little bit wrong .8 1.2 2.3 3.3 4.5 6.5
Not at all wrong .7 .8 1.5 2.0 3.4 3.7
How wrong do your friends feel it would be for you to...?
Grade7th 8th 9th 10th 11th 12th
Q18 Smoke tobacco Very wrong 82.1 73.0 63.6 57.4 49.5 41.3
Wrong 11.7 16.2 18.7 20.8 20.5 19.6
A little bit wrong 3.9 6.2 10.0 12.1 14.5 18.0
Not at all wrong 2.3 4.6 7.6 9.7 15.5 21.2
Q18 Smoke marijuana Very wrong 82.3 69.5 57.2 47.1 41.1 33.7
Wrong 8.9 13.2 15.2 16.1 15.5 14.8
A little bit wrong 4.4 8.2 11.8 15.5 16.2 17.8
Not at all wrong 4.4 9.1 15.7 21.4 27.2 33.7
Q18 Have 1-2 alcoholic drinks every day
Very wrong 80.2 69.0 57.7 49.3 42.6 35.7
Wrong 11.9 16.9 18.7 21.3 21.3 21.5
A little bit wrong 4.9 8.0 12.9 15.5 17.7 19.6
Not at all wrong 3.0 6.1 10.8 13.9 18.4 23.2
Q18 Misuse prescription drugs
Very wrong 88.7 82.7 75.7 70.2 65.8 62.1
Wrong 8.0 11.6 14.4 17.4 19.1 20.1
A little bit wrong 1.8 3.1 5.5 6.9 8.4 10.0
Not at all wrong 1.5 2.6 4.4 5.4 6.7 7.8
Perceived Peer Approval of Drug UseIndiana Male 7th - 12th Grade Students, 2016
(Values expressed as percentages)

Indiana Youth Survey 2016
190
Rewards for Antisocial InvolvementIndiana Male 7th - 12th Grade Students, 2016
(Values expressed as percentages)
What are the chances you would be seen as cool if you...?
Grade7th 8th 9th 10th 11th 12th
Q19 Smoked cigarettes Very good chance 4.7 4.4 4.9 5.0 5.6 6.2
Pretty good chance 2.8 2.9 3.6 3.3 2.8 2.5
Some chance 6.8 8.4 10.4 9.4 9.2 10.0
Little chance 12.3 15.6 18.0 18.0 18.9 20.1
No or very little chance 73.4 68.7 63.1 64.3 63.6 61.3
Q19 Drank alcohol regularly
Very good chance 4.7 4.7 5.8 6.4 6.8 7.6
Pretty good chance 3.4 4.1 6.6 7.4 7.5 8.5
Some chance 7.3 10.1 13.6 14.8 16.2 16.6
Little chance 11.8 16.0 18.0 18.2 19.1 19.8
No or very little chance 72.8 65.2 56.0 53.2 50.4 47.5
Q19 Smoked marijuana Very good chance 7.1 7.5 8.8 9.9 9.6 10.2
Pretty good chance 4.5 7.2 9.0 9.8 8.7 9.5
Some chance 6.5 9.8 13.7 14.5 15.3 16.7
Little chance 8.5 12.7 15.0 15.2 17.0 17.1
No or very little chance 73.4 62.7 53.4 50.6 49.4 46.4
Q19 Carried a gun Very good chance 6.6 7.0 6.9 7.0 7.7 8.2
Pretty good chance 3.7 4.3 4.0 3.7 3.4 3.9
Some chance 5.8 7.2 8.6 8.4 8.1 8.8
Little chance 10.4 12.3 13.1 11.9 13.9 14.1
No or very little chance 73.5 69.2 67.3 69.1 67.0 65.0

191
Frequency Tables
Parental Attitudes Favorable Toward Drug UseIndiana Male 7th - 12th Grade Students, 2016
(Values expressed as percentages)
How wrong do your parents feel it would be for you to...?Grade
7th 8th 9th 10th 11th 12th
Q20 Have 1-2 alcoholic drinks every day Very wrong 93.4 91.9 88.0 86.5 81.9 75.2
Wrong 4.1 5.1 7.2 8.8 11.6 15.5
A little bit wrong 1.1 1.5 2.5 2.9 3.9 5.7
Not at all wrong 1.4 1.5 2.2 1.8 2.6 3.6
Q20 Drink alcohol regularly (at least once or twice a month)
Very wrong 91.9 89.8 84.5 81.9 76.0 66.0
Wrong 4.6 5.9 8.5 9.9 12.6 15.9
A little bit wrong 1.7 2.3 4.0 5.4 6.8 10.9
Not at all wrong 1.8 2.0 3.1 2.8 4.7 7.2
Q20 Smoke cigarettes Very wrong 94.7 93.2 90.5 88.7 83.8 75.0
Wrong 3.6 4.2 5.6 7.0 9.8 13.7
A little bit wrong .5 1.1 2.0 2.4 3.3 6.4
Not at all wrong 1.2 1.4 1.9 2.0 3.1 4.9
Q20 Smoke marijuana Very wrong 94.0 90.9 86.4 82.8 79.4 72.0
Wrong 3.2 4.9 6.6 8.2 10.1 13.6
A little bit wrong 1.2 2.0 3.5 5.0 5.6 8.3
Not at all wrong 1.6 2.3 3.5 4.0 4.9 6.1
Q20 Use prescription drugs not prescribed to you
Very wrong 95.7 94.6 92.5 91.8 90.0 87.7
Wrong 2.6 3.4 4.6 5.4 6.6 8.2
A little bit wrong .5 .7 1.1 1.2 1.4 1.8
Not at all wrong 1.2 1.3 1.8 1.6 2.0 2.3
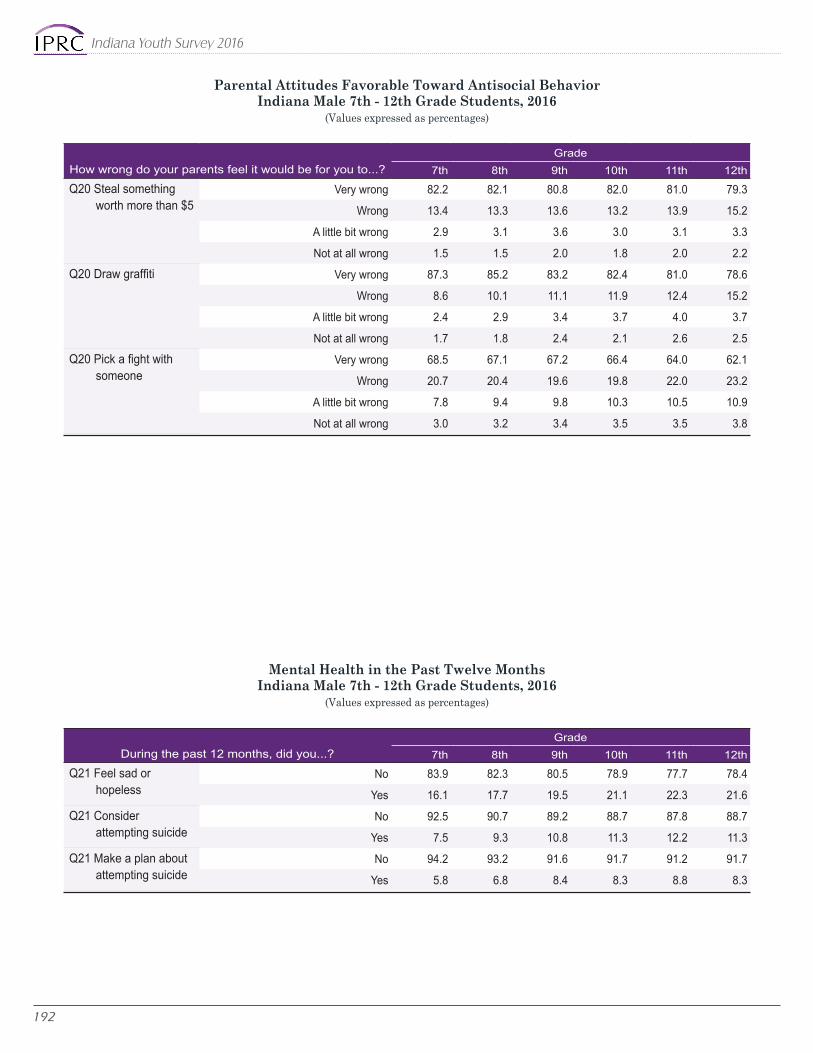
Indiana Youth Survey 2016
192
Parental Attitudes Favorable Toward Antisocial BehaviorIndiana Male 7th - 12th Grade Students, 2016
(Values expressed as percentages)
During the past 12 months, did you...?Grade
7th 8th 9th 10th 11th 12th
Q21 Feel sad or hopeless
No 83.9 82.3 80.5 78.9 77.7 78.4
Yes 16.1 17.7 19.5 21.1 22.3 21.6
Q21 Consider attempting suicide
No 92.5 90.7 89.2 88.7 87.8 88.7
Yes 7.5 9.3 10.8 11.3 12.2 11.3
Q21 Make a plan about attempting suicide
No 94.2 93.2 91.6 91.7 91.2 91.7
Yes 5.8 6.8 8.4 8.3 8.8 8.3
Mental Health in the Past Twelve MonthsIndiana Male 7th - 12th Grade Students, 2016
(Values expressed as percentages)
How wrong do your parents feel it would be for you to...?Grade
7th 8th 9th 10th 11th 12th
Q20 Steal something worth more than $5
Very wrong 82.2 82.1 80.8 82.0 81.0 79.3
Wrong 13.4 13.3 13.6 13.2 13.9 15.2
A little bit wrong 2.9 3.1 3.6 3.0 3.1 3.3
Not at all wrong 1.5 1.5 2.0 1.8 2.0 2.2
Q20 Draw graffiti Very wrong 87.3 85.2 83.2 82.4 81.0 78.6
Wrong 8.6 10.1 11.1 11.9 12.4 15.2
A little bit wrong 2.4 2.9 3.4 3.7 4.0 3.7
Not at all wrong 1.7 1.8 2.4 2.1 2.6 2.5
Q20 Pick a fight with someone
Very wrong 68.5 67.1 67.2 66.4 64.0 62.1
Wrong 20.7 20.4 19.6 19.8 22.0 23.2
A little bit wrong 7.8 9.4 9.8 10.3 10.5 10.9
Not at all wrong 3.0 3.2 3.4 3.5 3.5 3.8

193
Frequency Tables
Gambling during the Last Twelve MonthsIndiana Male 7th - 12th Grade Students, 2016
(Values expressed as percentages)
How often have you bet/gambled for money or valuables in the following ways?
Grade7th 8th 9th 10th 11th 12th
Q22 Card games Never 83.3 80.6 78.9 79.6 76.8 75.9
Less than once a month 10.8 12.7 13.7 12.9 14.2 15.1
1-3 times per month 3.9 4.5 4.5 5.0 6.0 5.4
Once a week or more 2.0 2.2 2.9 2.5 3.0 3.6
Q22 Personal games of skill
Never 70.0 67.7 69.7 70.2 70.4 69.8
Less than once a month 14.2 16.0 14.5 14.5 15.0 15.6
1-3 times per month 7.0 8.1 8.3 8.1 8.1 7.5
Once a week or more 8.8 8.2 7.5 7.2 6.5 7.1
Q22 Sports Never 75.8 73.7 74.5 72.2 73.8 72.3
Less than once a month 12.8 13.1 13.1 14.5 14.3 14.3
1-3 times per month 5.6 7.1 6.6 7.5 6.4 7.6
Once a week or more 5.8 6.0 5.8 5.8 5.4 5.9
Q22 Lottery Never 88.6 87.3 87.1 87.2 85.9 68.9
Less than once a month 7.7 8.1 8.5 8.1 9.1 19.4
1-3 times per month 2.4 3.0 2.6 3.1 3.0 8.1
Once a week or more 1.3 1.7 1.8 1.7 2.0 3.7
Q22 Bingo Never 88.8 90.4 91.7 92.2 93.5 92.3
Less than once a month 7.9 6.6 5.6 5.2 4.1 4.4
1-3 times per month 2.0 1.6 1.4 1.3 1.0 1.4
Once a week or more 1.4 1.4 1.4 1.3 1.4 1.9
Q22 Online gambling Never 94.4 92.4 92.6 92.2 92.5 92.6
Less than once a month 2.7 3.3 3.6 3.6 3.6 3.3
1-3 times per month 1.3 2.0 1.7 1.9 1.6 1.6
Once a week or more 1.7 2.3 2.1 2.3 2.3 2.5
Q22 Personal challenges
Never 71.3 68.2 69.3 71.5 71.9 71.9
Less than once a month 15.6 16.7 16.6 15.4 15.2 15.1
1-3 times per month 7.6 8.7 8.7 8.3 7.6 8.2
Once a week or more 5.5 6.4 5.4 4.8 5.3 4.8
Q22 Gambled in other ways
Never 85.7 81.3 81.8 82.1 80.0 80.0
Less than once a month 8.3 10.4 9.9 9.6 11.1 10.7
1-3 times per month 3.2 4.5 4.4 4.7 4.7 5.4
Once a week or more 2.7 3.9 3.8 3.6 4.2 3.9

Indiana Youth Survey 2016
194
Consequences of GamblingIndiana Male 7th - 12th Grade Students, 2016
(Values expressed as percentages)
How often have you experienced the following consequences due to your gambling?
Grade7th 8th 9th 10th 11th 12th
Q23 Academic problems I do not gamble 72.5 68.2 68.8 68.2 66.3 63.7
Never 25.7 30.1 29.6 30.5 32.2 34.7
Occasionally 1.4 1.3 1.1 1.0 1.0 1.1
Frequently .4 .4 .5 .3 .6 .5
Q23 Issues with the legal system
I do not gamble 72.7 68.4 69.0 68.1 66.4 63.5
Never 26.5 30.5 29.9 31.0 32.3 35.3
Occasionally .5 .8 .7 .6 .7 .7
Frequently .3 .3 .4 .4 .6 .5
Q23 Lost possessions or money
I do not gamble 71.8 67.5 67.9 67.3 65.6 62.7
Never 18.6 20.4 20.3 20.4 21.9 23.3
Occasionally 8.9 11.5 11.1 11.6 11.4 12.7
Frequently .6 .7 .7 .6 1.1 1.2
Q23 Felt bad about gambling
I do not gamble 72.5 68.3 68.9 68.0 66.2 63.3
Never 23.9 27.9 28.3 28.9 30.8 33.5
Occasionally 3.0 3.3 2.4 2.6 2.4 2.4
Frequently .6 .5 .5 .5 .7 .7
Q23 Poor health I do not gamble 72.4 68.2 68.9 68.0 66.3 63.2
Never 26.1 30.5 29.8 30.8 32.4 35.4
Occasionally 1.1 .9 .9 .8 .7 .9
Frequently .5 .4 .4 .4 .5 .5
Q23 Issues with friends and family
I do not gamble 71.8 67.8 68.6 67.5 66.1 63.2
Never 24.6 28.4 28.2 29.4 30.9 34.1
Occasionally 2.9 3.1 2.6 2.5 2.3 2.0
Frequently .7 .7 .6 .6 .7 .7

195
Frequency Tables
School Opportunities for Prosocial InvolvementIndiana Male 7th - 12th Grade Students, 2016
(Values expressed as percentages)
Grade7th 8th 9th 10th 11th 12th
Q24 Students have chances to help decide class activities and rules
YES! 22.7 22.6 27.1 25.5 24.6 22.3
yes 39.1 38.4 39.2 37.5 37.2 38.2
no 25.8 25.8 23.1 24.9 24.4 25.5
NO! 12.4 13.3 10.6 12.1 13.8 13.9
Q24 Teachers ask me to work on special class projects
YES! 18.1 16.3 15.9 15.4 15.5 15.8
yes 36.9 37.1 35.9 35.4 36.3 37.2
no 31.5 34.4 35.8 36.6 35.8 35.5
NO! 13.5 12.2 12.4 12.5 12.4 11.5
Q24 Students have chances to get involved in activities outside of class
YES! 71.5 65.9 63.9 60.4 56.2 53.8
yes 22.1 26.8 28.3 30.4 33.9 36.2
no 3.8 4.1 4.6 5.6 5.8 6.1
NO! 2.6 3.3 3.2 3.5 4.0 3.8
Q24 Students have chances to talk with teacher one-on-one
YES! 48.8 44.7 41.7 40.4 37.9 38.6
yes 34.4 37.0 39.9 39.9 43.4 43.9
no 11.8 12.8 12.9 13.5 12.8 12.3
NO! 5.0 5.5 5.5 6.1 5.9 5.1
Q24 Students have chances to be a part of class discussions or activities
YES! 45.0 40.1 34.5 32.5 30.3 30.3
yes 40.7 44.0 48.5 49.5 52.4 52.7
no 10.0 10.9 12.0 12.5 11.9 12.0
NO! 4.3 5.0 5.1 5.5 5.3 5.1

Indiana Youth Survey 2016
196
School Rewards for Prosocial InvolvementIndiana Male 7th - 12th Grade Students, 2016
(Values expressed as percentages)
Grade7th 8th 9th 10th 11th 12th
Q28 What were your grades like last year?
Mostly A's 41.8 36.6 31.9 30.7 29.0 30.8
Mostly B's 36.8 37.6 38.7 38.2 40.1 40.6
Mostly C's 15.2 18.6 21.1 22.3 23.5 22.4
Mostly D's 3.7 4.7 5.4 6.3 5.6 4.9
Mostly F's 2.5 2.5 2.9 2.5 1.7 1.3
Q24 My grades are better than most students
YES! 27.2 28.2 27.7 26.9 27.4 27.2
yes 42.3 41.4 41.1 41.4 41.7 41.9
no 21.9 21.6 22.5 22.5 22.3 23.5
NO! 8.6 8.8 8.6 9.3 8.6 7.4
Academic FailureIndiana Male 7th - 12th Grade Students, 2016
(Values expressed as percentages)
Grade7th 8th 9th 10th 11th 12th
Q24 Teachers notice when doing a good job and let me know
YES! 33.2 28.7 26.2 23.7 21.9 21.4
yes 40.5 41.6 41.4 42.1 43.9 45.1
no 17.8 20.0 22.8 24.3 23.4 24.4
NO! 8.5 9.8 9.6 9.9 10.8 9.1
Q24 I feel safe at school YES! 47.7 40.4 34.1 33.0 32.7 34.4
yes 36.5 40.0 44.4 44.9 46.2 46.2
no 9.3 11.4 13.3 13.5 13.0 12.0
NO! 6.5 8.2 8.2 8.5 8.1 7.3
Q24 School lets parents know when I do well
YES! 24.2 21.0 19.0 17.2 16.6 16.2
yes 29.3 27.8 26.1 26.2 26.0 26.3
no 28.0 31.2 32.8 33.4 33.3 34.1
NO! 18.4 20.0 22.1 23.2 24.1 23.4
Q24 Teachers praise me when l work hard in school
YES! 21.7 20.2 18.7 18.8 17.5 17.7
yes 35.2 34.1 34.8 33.9 36.0 36.0
no 27.6 29.5 30.8 30.8 29.8 32.1
NO! 15.5 16.2 15.7 16.5 16.6 14.1

197
Frequency Tables
Low Commitment to SchoolIndiana Male 7th - 12th Grade Students, 2016
(Values expressed as percentages)
Grade7th 8th 9th 10th 11th 12th
Q26 Days of school skipped during last month
None 87.5 85.4 84.7 83.4 79.7 72.8
1 day 5.9 6.9 6.8 7.3 9.1 10.7
2 days 2.6 3.2 3.5 3.8 4.4 6.3
3 days 1.5 1.8 2.3 2.3 2.5 3.8
4-5 days 1.4 1.3 1.3 1.6 2.0 3.3
6-10 days .5 .7 .6 .8 1.0 1.5
11 or more days .7 .6 .8 .8 1.3 1.7
Q27 How interesting are courses Very interesting 11.0 9.2 9.1 9.3 9.4 8.9
Quite interesting 24.1 22.1 21.4 21.2 21.3 20.0
Fairly interesting 32.0 33.4 37.0 36.0 35.2 34.8
Slightly boring 19.7 21.0 18.9 18.9 19.6 20.3
Very boring 13.2 14.4 13.6 14.5 14.5 16.0
Q29 Feel schoolwork is meaningful Almost always 22.9 16.5 12.1 10.3 9.1 7.4
Often 29.7 28.4 25.7 21.0 19.1 17.9
Sometimes 27.6 30.0 30.8 31.9 32.7 32.9
Seldom 12.5 15.4 19.4 23.5 25.3 26.8
Never 7.3 9.6 12.0 13.3 13.7 14.9
Q30 Importance of school to later life Very important 33.6 26.3 18.5 15.5 12.7 11.9
Quite important 25.6 24.6 23.0 18.5 17.1 17.4
Fairly important 20.9 23.1 25.3 26.3 27.9 27.0
Slightly important 14.7 18.5 22.6 27.1 28.2 29.4
Not at all important 5.1 7.5 10.6 12.6 14.2 14.2
Q25 Enjoy being in school Never 13.0 13.8 14.9 15.7 16.9 16.3
Seldom 10.9 12.7 14.4 16.1 17.2 18.6
Sometimes 31.8 33.1 33.3 34.2 33.8 33.3
Often 27.9 27.0 26.2 23.9 22.7 23.0
A lot 16.4 13.4 11.2 10.0 9.4 8.7
Q25 Hate being in school Never 13.6 10.2 9.3 8.7 8.6 8.4
Seldom 22.5 21.6 20.3 19.4 18.6 17.1
Sometimes 30.8 32.0 33.6 31.4 31.6 32.8
Often 15.7 17.3 18.6 20.1 20.4 21.7
A lot 17.4 18.9 18.2 20.4 20.8 20.0
Q25 Try to do your best work in school Never 2.2 2.6 3.5 3.5 4.1 4.1
Seldom 2.6 3.9 5.1 5.4 6.7 7.7
Sometimes 12.0 15.6 19.5 21.0 24.8 26.6
Often 28.2 32.2 32.8 34.4 33.5 33.9
A lot 55.1 45.8 39.1 35.7 30.9 27.7

Indiana Youth Survey 2016
198
Poor Family ManagementIndiana Male 7th - 12th Grade Students, 2016
(Values expressed as percentages)
Grade7th 8th 9th 10th 11th 12th
Q31 Rules in my family are clear YES! 68.5 63.3 62.0 59.8 58.5 53.6
yes 27.5 31.2 31.8 34.0 34.8 38.6
no 3.1 4.2 4.8 4.7 5.0 5.9
NO! .9 1.3 1.4 1.5 1.7 1.9
Q31 Parents ask about homework YES! 69.2 60.4 55.3 48.7 42.6 35.7
yes 23.9 28.6 30.9 33.9 35.9 35.1
no 5.3 8.2 10.3 13.0 16.0 20.8
NO! 1.6 2.8 3.5 4.4 5.5 8.4
Q31 Parents know where I am and who I am with
YES! 74.9 68.1 63.8 61.2 55.2 46.8
yes 20.6 25.6 29.3 31.9 35.3 40.0
no 3.2 4.6 5.2 5.1 7.4 10.2
NO! 1.3 1.7 1.7 1.8 2.1 3.0
Q31 Family has clear rules about alcohol and drug use
YES! 82.8 76.4 70.7 66.7 61.6 53.5
yes 12.4 17.3 21.2 24.9 29.0 33.8
no 3.3 4.5 6.0 6.5 7.5 10.1
NO! 1.5 1.8 2.1 1.9 2.0 2.6
Q32 Parents know if you come home late
YES! 66.4 60.2 56.7 52.9 49.4 42.9
yes 25.2 29.9 31.8 34.8 37.4 40.0
no 6.4 7.5 8.8 9.5 10.6 13.2
NO! 2.0 2.5 2.6 2.8 2.7 3.8
Q32 Parents would catch you drinking YES! 66.7 54.3 45.1 38.5 32.4 25.2
yes 19.4 23.7 26.4 26.4 26.3 25.7
no 9.1 15.3 21.2 26.2 31.2 35.8
NO! 4.9 6.8 7.2 8.9 10.2 13.3
Q32 Parents would catch you if you carried a gun
YES! 78.2 69.1 64.0 58.7 51.3 43.5
yes 14.5 19.3 22.9 24.4 27.6 30.5
no 4.3 7.6 9.0 11.3 15.3 18.5
NO! 3.0 4.0 4.1 5.6 5.7 7.5
Q32 Parents would catch you if you skipped school
YES! 78.4 70.4 64.9 59.5 52.9 45.7
yes 15.6 21.2 25.1 28.4 32.8 35.5
no 4.0 5.6 7.3 8.9 10.5 14.2
NO! 2.0 2.8 2.7 3.2 3.8 4.7

199
Frequency Tables
Family ConflictIndiana Male 7th - 12th Grade Students, 2016
(Values expressed as percentages)
Grade7th 8th 9th 10th 11th 12th
Q31 Family argues over and over about same thing
YES! 18.5 20.7 23.0 22.8 22.7 21.1
yes 21.9 24.4 27.0 26.8 27.0 28.3
no 39.6 38.0 35.5 36.4 35.7 37.1
NO! 20.0 16.9 14.6 14.0 14.5 13.4
Q31 Family has serious arguments YES! 14.8 16.5 19.2 19.0 18.2 17.1
yes 16.5 17.9 20.9 21.0 21.0 21.8
no 37.1 38.7 36.9 38.4 38.1 39.4
NO! 31.6 26.9 23.0 21.6 22.7 21.7
Q31 Family members often insult each other
YES! 14.3 16.1 18.6 18.7 17.5 16.7
yes 17.1 18.4 19.8 20.9 20.1 20.4
no 32.7 33.9 34.6 35.1 36.0 37.5
NO! 36.0 31.6 27.0 25.4 26.5 25.4
Grade7th 8th 9th 10th 11th 12th
Q31 Parents ask me before most family decisions made
YES! 34.9 30.3 30.9 28.2 27.9 25.5
yes 39.0 39.4 38.9 40.2 40.2 40.5
no 16.3 19.4 19.9 20.9 20.9 23.8
NO! 9.8 10.9 10.2 10.7 11.1 10.3
Q32 I can ask parents for help if I have problem
YES! 66.6 58.6 55.3 52.1 49.7 49.1
yes 23.4 28.1 30.7 32.9 34.3 35.8
no 6.2 8.4 9.3 10.0 10.8 10.1
NO! 3.7 4.9 4.7 5.0 5.2 5.0
Q32 Parents give me chances for fun with them
YES! 55.0 48.6 45.5 41.1 40.0 36.9
yes 31.0 33.9 36.1 39.0 39.2 39.6
no 11.0 13.3 14.2 15.0 15.4 18.0
NO! 3.0 4.2 4.2 4.8 5.4 5.5
Family Opportunities for Prosocial InvolvementIndiana Male 7th - 12th Grade Students, 2016
(Values expressed as percentages)

Indiana Youth Survey 2016
200
Family Rewards for Prosocial InvolvementIndiana Male 7th - 12th Grade Students, 2016
(Values expressed as percentages)
Grade7th 8th 9th 10th 11th 12th
Q32 I enjoy spending time with mom YES! 72.0 63.3 59.5 55.9 52.7 48.3
yes 21.8 28.2 30.2 33.1 36.0 40.0
no 3.7 4.9 6.2 6.9 7.3 7.7
NO! 2.5 3.6 4.1 4.1 3.9 4.1
Q32 I Enjoy spending time with dad YES! 70.4 61.3 57.7 52.6 49.5 45.8
yes 20.4 25.5 28.9 32.3 34.5 37.1
no 4.4 6.3 6.6 7.8 8.6 9.4
NO! 4.8 7.0 6.9 7.2 7.4 7.7
Q33 Parents notice when I am doing a good job
All the time 44.7 39.3 37.7 35.7 33.6 32.4
Often 34.7 35.7 35.3 34.8 34.6 34.6
Sometimes 15.7 18.1 19.7 21.8 23.2 24.6
Never 4.8 6.9 7.3 7.7 8.6 8.5
Q33 Parents tell me they are proud of me
All the time 48.6 42.1 40.1 37.5 35.5 33.6
Often 30.6 32.7 32.4 32.5 31.9 33.1
Sometimes 15.5 17.7 20.0 21.0 22.9 24.4
Never 5.2 7.5 7.5 9.0 9.7 8.9
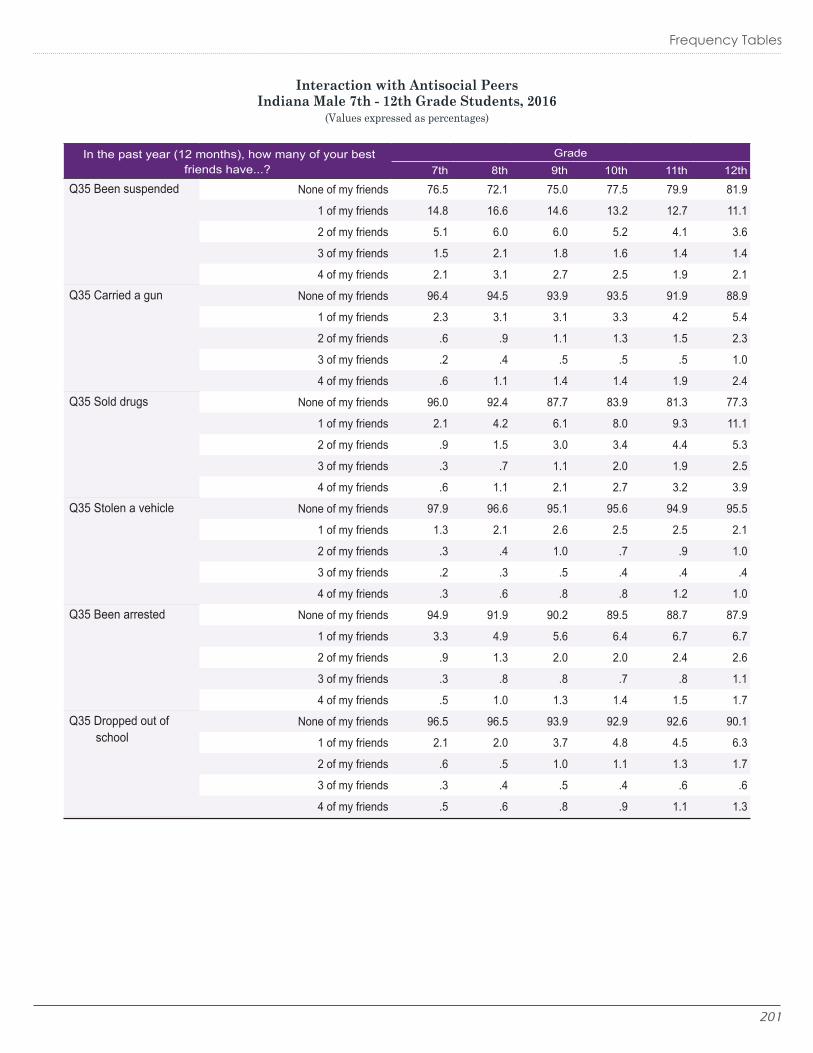
201
Frequency Tables
Interaction with Antisocial PeersIndiana Male 7th - 12th Grade Students, 2016
(Values expressed as percentages)
In the past year (12 months), how many of your best friends have...?
Grade7th 8th 9th 10th 11th 12th
Q35 Been suspended None of my friends 76.5 72.1 75.0 77.5 79.9 81.9
1 of my friends 14.8 16.6 14.6 13.2 12.7 11.1
2 of my friends 5.1 6.0 6.0 5.2 4.1 3.6
3 of my friends 1.5 2.1 1.8 1.6 1.4 1.4
4 of my friends 2.1 3.1 2.7 2.5 1.9 2.1
Q35 Carried a gun None of my friends 96.4 94.5 93.9 93.5 91.9 88.9
1 of my friends 2.3 3.1 3.1 3.3 4.2 5.4
2 of my friends .6 .9 1.1 1.3 1.5 2.3
3 of my friends .2 .4 .5 .5 .5 1.0
4 of my friends .6 1.1 1.4 1.4 1.9 2.4
Q35 Sold drugs None of my friends 96.0 92.4 87.7 83.9 81.3 77.3
1 of my friends 2.1 4.2 6.1 8.0 9.3 11.1
2 of my friends .9 1.5 3.0 3.4 4.4 5.3
3 of my friends .3 .7 1.1 2.0 1.9 2.5
4 of my friends .6 1.1 2.1 2.7 3.2 3.9
Q35 Stolen a vehicle None of my friends 97.9 96.6 95.1 95.6 94.9 95.5
1 of my friends 1.3 2.1 2.6 2.5 2.5 2.1
2 of my friends .3 .4 1.0 .7 .9 1.0
3 of my friends .2 .3 .5 .4 .4 .4
4 of my friends .3 .6 .8 .8 1.2 1.0
Q35 Been arrested None of my friends 94.9 91.9 90.2 89.5 88.7 87.9
1 of my friends 3.3 4.9 5.6 6.4 6.7 6.7
2 of my friends .9 1.3 2.0 2.0 2.4 2.6
3 of my friends .3 .8 .8 .7 .8 1.1
4 of my friends .5 1.0 1.3 1.4 1.5 1.7
Q35 Dropped out of school
None of my friends 96.5 96.5 93.9 92.9 92.6 90.1
1 of my friends 2.1 2.0 3.7 4.8 4.5 6.3
2 of my friends .6 .5 1.0 1.1 1.3 1.7
3 of my friends .3 .4 .5 .4 .6 .6
4 of my friends .5 .6 .8 .9 1.1 1.3

Indiana Youth Survey 2016
202
Interaction with Prosocial PeersIndiana Male 7th - 12th Grade Students, 2016
(Values expressed as percentages)
In the past year (12 months), how many of your best friends have...?
Grade7th 8th 9th 10th 11th 12th
Q35 Participated in school activities
None of my friends 24.6 26.1 29.0 29.9 30.0 31.5
1 of my friends 8.9 9.1 8.3 7.7 7.0 7.8
2 of my friends 13.6 13.1 12.6 11.6 12.4 11.8
3 of my friends 14.2 13.4 13.3 12.1 11.8 12.0
4 of my friends 38.6 38.4 36.9 38.7 38.8 37.0
Q35 Made a commitment to stay drug-free
None of my friends 28.2 32.8 37.9 43.1 47.3 52.7
1 of my friends 6.0 6.9 8.3 9.3 9.5 10.4
2 of my friends 4.9 6.7 8.2 8.9 9.1 8.4
3 of my friends 6.6 7.9 9.5 9.0 8.4 7.3
4 of my friends 54.2 45.6 36.0 29.7 25.7 21.3
Q35 Liked school None of my friends 29.7 34.1 38.3 41.6 43.8 46.2
1 of my friends 12.0 12.3 12.2 11.8 11.3 11.2
2 of my friends 17.0 17.2 17.1 17.0 16.3 15.9
3 of my friends 15.6 14.1 12.7 11.6 11.4 10.3
4 of my friends 25.7 22.2 19.7 18.0 17.2 16.5
Q35 Regularly attended religious activities
None of my friends 26.2 32.0 36.6 40.1 41.2 45.3
1 of my friends 15.5 17.4 16.9 16.9 17.4 18.0
2 of my friends 19.9 18.8 18.2 18.4 17.0 16.2
3 of my friends 16.0 13.7 11.5 10.6 10.1 9.1
4 of my friends 22.4 18.1 16.7 14.1 14.3 11.4
Q35 Tried to do well in school
None of my friends 10.2 12.5 17.5 17.7 19.3 21.0
1 of my friends 4.6 5.5 6.1 6.1 6.4 7.4
2 of my friends 8.7 10.0 11.0 12.0 12.4 13.1
3 of my friends 15.0 17.8 17.4 18.6 18.2 18.4
4 of my friends 61.4 54.4 48.1 45.5 43.7 40.1

203
Frequency Tables
Community Laws and Norms Favorable to Drug UseIndiana Male 7th - 12th Grade Students, 2016
(Values expressed as percentages)
Grade7th 8th 9th 10th 11th 12th
Q36 If a kid drank alcohol in your neighborhood, would he or she be caught by police?
YES! 30.8 23.2 19.8 15.6 13.5 11.5
yes 30.5 26.3 21.2 19.4 16.1 15.5
no 26.6 34.1 39.9 43.1 44.9 45.8
NO! 12.1 16.5 19.1 22.0 25.5 27.2
Q36 If a kid smoked marijuana in your neighborhood, would he or she be caught by police?
YES! 38.3 26.7 21.6 16.8 14.5 11.9
yes 29.3 27.5 23.7 20.4 17.2 17.0
no 21.4 30.5 36.0 40.7 42.3 44.2
NO! 10.9 15.3 18.7 22.1 26.0 26.9
Q36 If a kid carried a handgun in your neighborhood, would he or she be caught by police?
YES! 45.0 35.0 30.1 24.7 21.6 18.3
yes 28.4 29.8 29.2 29.3 28.4 27.5
no 17.5 23.2 26.7 29.6 31.2 34.0
NO! 9.1 12.0 14.0 16.5 18.8 20.1
Q36 If a kid smoked a cigarette in your neighborhood, would he or she be caught by police?
YES! 28.8 21.7 18.5 14.8 12.9 10.4
yes 26.3 23.2 19.4 16.9 13.6 13.1
no 30.1 35.5 39.6 41.3 42.3 43.2
NO! 14.8 19.6 22.5 27.0 31.1 33.3
Q38 Adults in your neighborhood think about youth marijuana use
Very wrong 82.6 70.3 59.3 51.4 45.3 38.6
Wrong 10.6 17.4 22.9 26.3 28.6 31.7
A little bit wrong 4.4 8.2 11.5 14.7 17.5 18.8
Not at all wrong 2.3 4.1 6.3 7.6 8.5 10.9
Q38 Adults in your neighborhood think about youth alcohol use
Very wrong 74.7 64.1 53.1 46.3 37.9 31.3
Wrong 15.1 21.0 25.5 28.3 30.1 30.3
A little bit wrong 6.9 9.9 14.8 17.3 22.4 25.9
Not at all wrong 3.3 5.0 6.6 8.1 9.5 12.5
Q38 Adults in your neighborhood think about youth cigarettes use
Very wrong 77.5 68.1 59.2 53.4 44.9 34.6
Wrong 13.8 19.6 24.5 26.9 30.4 30.2
A little bit wrong 5.7 8.0 10.9 13.1 16.2 21.2
Not at all wrong 3.0 4.2 5.4 6.6 8.5 14.0

Indiana Youth Survey 2016
204
Community Rewards for Prosocial InvolvementIndiana Male 7th - 12th Grade Students, 2016
(Values expressed as percentages)
Grade7th 8th 9th 10th 11th 12th
Q37 Neighbors notice good job and let me know
YES! 12.9 11.1 12.3 10.5 10.1 9.5
yes 20.9 17.7 17.2 17.4 16.1 17.1
no 30.9 31.6 32.3 32.0 32.1 31.5
NO! 35.3 39.6 38.3 40.1 41.7 41.8
Q37 There are people in my neighborhood who are proud of me
YES! 17.0 13.6 14.3 11.9 11.6 11.0
yes 27.5 24.2 23.1 24.2 21.7 23.1
no 25.0 26.8 28.2 27.6 28.7 27.5
NO! 30.6 35.3 34.4 36.4 38.0 38.4
Q37 There are people in my neighborhood who encourage me to do my best
YES! 23.1 18.2 16.9 14.7 13.1 12.3
yes 27.9 25.8 25.1 25.2 24.0 25.1
no 21.1 23.1 25.5 25.7 26.6 26.0
NO! 27.9 32.9 32.5 34.4 36.2 36.6
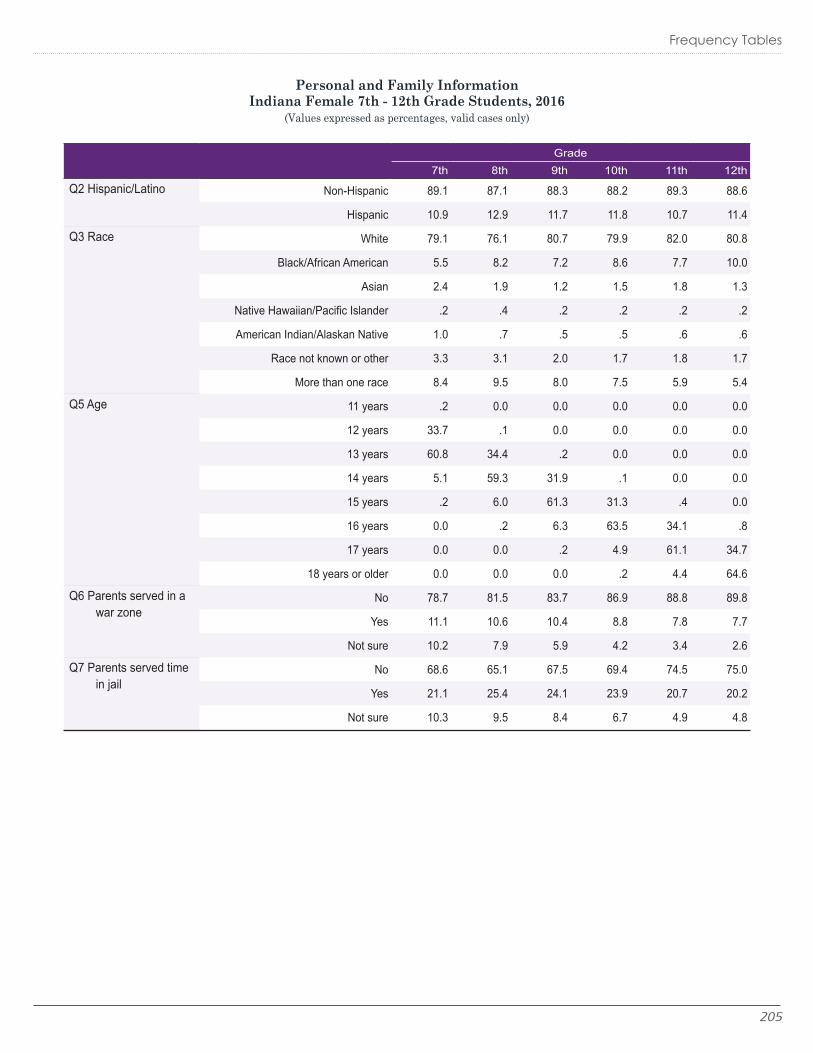
205
Frequency Tables
Personal and Family InformationIndiana Female 7th - 12th Grade Students, 2016
(Values expressed as percentages, valid cases only)
Grade7th 8th 9th 10th 11th 12th
Q2 Hispanic/Latino Non-Hispanic 89.1 87.1 88.3 88.2 89.3 88.6
Hispanic 10.9 12.9 11.7 11.8 10.7 11.4
Q3 Race White 79.1 76.1 80.7 79.9 82.0 80.8
Black/African American 5.5 8.2 7.2 8.6 7.7 10.0
Asian 2.4 1.9 1.2 1.5 1.8 1.3
Native Hawaiian/Pacific Islander .2 .4 .2 .2 .2 .2
American Indian/Alaskan Native 1.0 .7 .5 .5 .6 .6
Race not known or other 3.3 3.1 2.0 1.7 1.8 1.7
More than one race 8.4 9.5 8.0 7.5 5.9 5.4
Q5 Age 11 years .2 0.0 0.0 0.0 0.0 0.0
12 years 33.7 .1 0.0 0.0 0.0 0.0
13 years 60.8 34.4 .2 0.0 0.0 0.0
14 years 5.1 59.3 31.9 .1 0.0 0.0
15 years .2 6.0 61.3 31.3 .4 0.0
16 years 0.0 .2 6.3 63.5 34.1 .8
17 years 0.0 0.0 .2 4.9 61.1 34.7
18 years or older 0.0 0.0 0.0 .2 4.4 64.6
Q6 Parents served in a war zone
No 78.7 81.5 83.7 86.9 88.8 89.8
Yes 11.1 10.6 10.4 8.8 7.8 7.7
Not sure 10.2 7.9 5.9 4.2 3.4 2.6
Q7 Parents served time in jail
No 68.6 65.1 67.5 69.4 74.5 75.0
Yes 21.1 25.4 24.1 23.9 20.7 20.2
Not sure 10.3 9.5 8.4 6.7 4.9 4.8
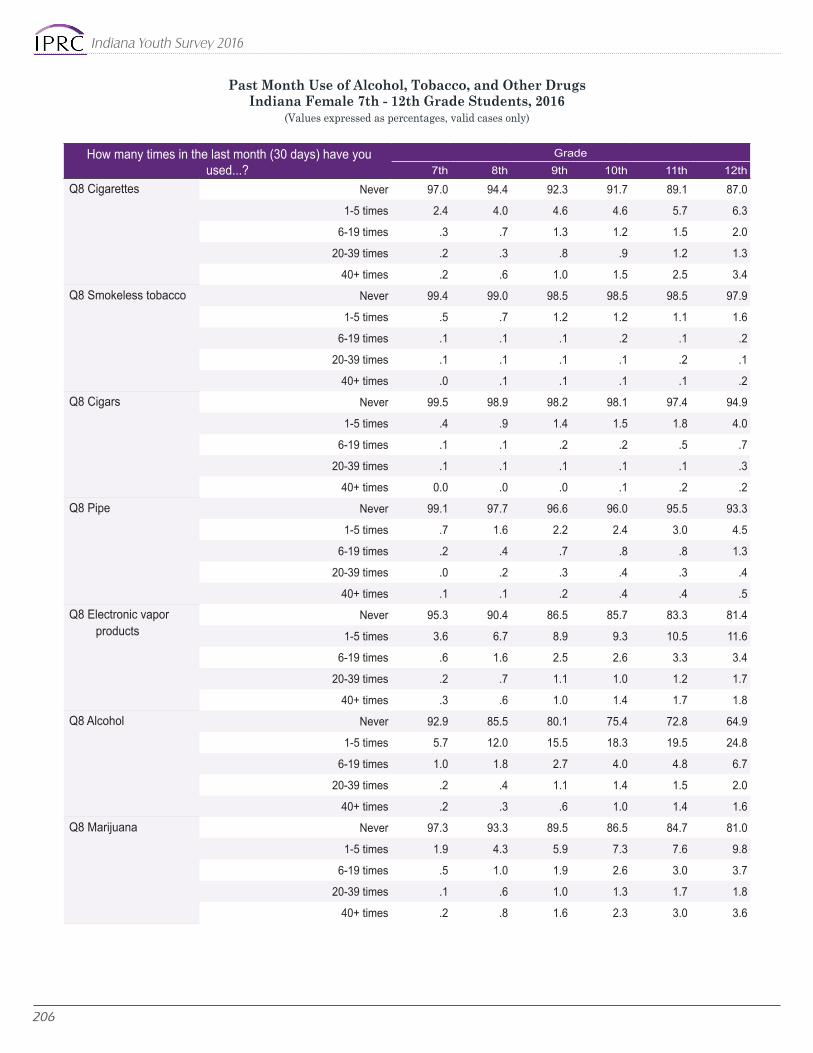
Indiana Youth Survey 2016
206
How many times in the last month (30 days) have you used...?
Grade7th 8th 9th 10th 11th 12th
Q8 Cigarettes Never 97.0 94.4 92.3 91.7 89.1 87.0
1-5 times 2.4 4.0 4.6 4.6 5.7 6.3
6-19 times .3 .7 1.3 1.2 1.5 2.0
20-39 times .2 .3 .8 .9 1.2 1.3
40+ times .2 .6 1.0 1.5 2.5 3.4
Q8 Smokeless tobacco Never 99.4 99.0 98.5 98.5 98.5 97.9
1-5 times .5 .7 1.2 1.2 1.1 1.6
6-19 times .1 .1 .1 .2 .1 .2
20-39 times .1 .1 .1 .1 .2 .1
40+ times .0 .1 .1 .1 .1 .2
Q8 Cigars Never 99.5 98.9 98.2 98.1 97.4 94.9
1-5 times .4 .9 1.4 1.5 1.8 4.0
6-19 times .1 .1 .2 .2 .5 .7
20-39 times .1 .1 .1 .1 .1 .3
40+ times 0.0 .0 .0 .1 .2 .2
Q8 Pipe Never 99.1 97.7 96.6 96.0 95.5 93.3
1-5 times .7 1.6 2.2 2.4 3.0 4.5
6-19 times .2 .4 .7 .8 .8 1.3
20-39 times .0 .2 .3 .4 .3 .4
40+ times .1 .1 .2 .4 .4 .5
Q8 Electronic vapor products
Never 95.3 90.4 86.5 85.7 83.3 81.4
1-5 times 3.6 6.7 8.9 9.3 10.5 11.6
6-19 times .6 1.6 2.5 2.6 3.3 3.4
20-39 times .2 .7 1.1 1.0 1.2 1.7
40+ times .3 .6 1.0 1.4 1.7 1.8
Q8 Alcohol Never 92.9 85.5 80.1 75.4 72.8 64.9
1-5 times 5.7 12.0 15.5 18.3 19.5 24.8
6-19 times 1.0 1.8 2.7 4.0 4.8 6.7
20-39 times .2 .4 1.1 1.4 1.5 2.0
40+ times .2 .3 .6 1.0 1.4 1.6
Q8 Marijuana Never 97.3 93.3 89.5 86.5 84.7 81.0
1-5 times 1.9 4.3 5.9 7.3 7.6 9.8
6-19 times .5 1.0 1.9 2.6 3.0 3.7
20-39 times .1 .6 1.0 1.3 1.7 1.8
40+ times .2 .8 1.6 2.3 3.0 3.6
Past Month Use of Alcohol, Tobacco, and Other DrugsIndiana Female 7th - 12th Grade Students, 2016
(Values expressed as percentages, valid cases only)

207
Frequency Tables
How many times in the last month (30 days) have you used...?
Grade7th 8th 9th 10th 11th 12th
Q8 Synthetic marijuana Never 99.7 98.9 98.7 98.5 98.5 98.51-5 times .2 .8 .9 .9 1.0 .9
6-19 times .1 .1 .2 .4 .2 .220-39 times 0.0 .1 .1 .1 .1 .2
40+ times .0 .1 .1 .1 .2 .1Q8 Cocaine/Crack Never 99.8 99.7 99.6 99.5 99.3 99.1
1-5 times .1 .2 .3 .3 .5 .76-19 times .0 .0 .1 .1 .1 .1
20-39 times 0.0 .0 .0 .0 .0 .140+ times 0.0 0.0 0.0 .0 .1 .0
Q8 Inhalants Never 99.4 99.2 99.1 99.3 99.2 99.41-5 times .5 .6 .8 .6 .7 .5
6-19 times .1 .1 .1 .1 .1 .020-39 times .0 .0 0.0 .0 .0 .0
40+ times .0 .0 .0 .0 .0 .1Q8 Methamphetamines Never 99.8 99.9 99.8 99.7 99.6 99.5
1-5 times .1 .1 .2 .2 .4 .46-19 times .0 .0 .0 .1 .0 .1
20-39 times .0 0.0 .0 .0 0.0 .040+ times 0.0 .0 0.0 .0 0.0 .0
Q8 Heroin Never 99.9 99.8 99.9 99.8 99.7 99.71-5 times .1 .1 .1 .2 .1 .1
6-19 times .0 .0 .0 .0 .0 .220-39 times .0 .0 0.0 .0 0.0 .0
40+ times 0.0 .0 0.0 .0 .1 .0Q8 Hallucinogens/
EcstasyNever 99.7 99.4 98.8 98.6 98.6 97.7
1-5 times .2 .5 1.0 1.1 1.2 2.16-19 times .0 .1 .1 .2 .1 .1
20-39 times 0.0 .0 .1 .0 .1 .040+ times .0 0.0 .0 .0 .0 0.0
Q8 Prescription drugs not prescribed to you
Never 98.3 97.6 96.4 95.8 95.3 94.71-5 times 1.2 1.7 2.5 2.9 2.9 3.7
6-19 times .3 .3 .7 .8 1.1 1.020-39 times .1 .1 .3 .3 .5 .4
40+ times .1 .2 .1 .2 .3 .1Q8 Over the counter
drugs to get highNever 97.2 96.6 96.3 96.8 97.1 97.5
1-5 times 2.1 2.4 2.5 2.2 2.0 1.86-19 times .4 .6 .7 .6 .5 .4
20-39 times .1 .2 .3 .2 .1 .140+ times .1 .2 .2 .2 .2 .2
Past Month Use of Alcohol, Tobacco, and Other DrugsIndiana Female 7th - 12th Grade Students, 2016
(Values expressed as percentages, valid cases only)

Indiana Youth Survey 2016
208
Age Distribution of First Time Alcohol, Tobacco, and Other Drug UseIndiana Female 7th - 12th Grade Students, 2016
(Values expressed as percentages, valid cases only)
How old were you when you first used...?
Grade7th 8th 9th 10th 11th 12th
Q9 Cigarettes Never used 94.8 89.8 86.0 84.1 80.4 76.210 years or younger 1.8 2.6 2.2 2.2 1.8 2.0
11 years 1.2 1.6 1.6 1.3 1.2 1.012 years 1.4 2.3 2.0 1.8 1.9 1.513 years .7 2.8 2.9 2.9 2.7 2.814 years .1 .8 3.7 2.8 2.5 2.715 years 0.0 .2 1.3 3.8 4.5 3.816 years 0.0 0.0 .2 1.0 3.4 4.7
17 years or older 0.0 .0 .0 .1 1.6 5.3Q9 Smokeless tobacco Never used 98.9 98.1 96.8 96.5 95.6 95.1
10 years or younger .4 .4 .5 .3 .2 .211 years .3 .3 .2 .2 .2 .112 years .3 .4 .3 .3 .1 .313 years .1 .5 .8 .4 .5 .314 years .0 .2 .9 .9 .7 .615 years 0.0 .1 .4 1.1 1.4 .916 years 0.0 0.0 .0 .4 1.1 1.3
17 years or older 0.0 .0 0.0 .0 .3 1.2Q9 Cigars Never used 99.1 97.6 96.3 95.9 93.6 89.7
10 years or younger .2 .4 .3 .2 .3 .311 years .2 .3 .2 .1 .1 .212 years .3 .5 .6 .3 .4 .313 years .2 .9 .9 .6 .6 .514 years .0 .3 1.2 1.0 1.1 .915 years 0.0 .0 .4 1.4 2.1 2.016 years 0.0 0.0 .0 .4 1.5 2.8
17 years or older 0.0 .0 0.0 .0 .4 3.5Q9 Pipe Never used 98.6 96.3 94.4 93.2 91.9 87.9
10 years or younger .2 .2 .2 .2 .1 .111 years .2 .4 .2 .2 .1 .112 years .5 .8 .5 .4 .4 .313 years .3 1.5 1.5 .9 .8 .514 years .1 .7 2.2 1.7 1.3 1.515 years 0.0 .1 1.0 2.6 2.3 2.516 years 0.0 0.0 .1 .6 2.3 3.2
17 years or older 0.0 .0 0.0 .1 .7 3.8

209
Frequency Tables
Age Distribution of First Time Alcohol, Tobacco, and Other Drug UseIndiana Female 7th - 12th Grade Students, 2016
(Values expressed as percentages, valid cases only)
How old were you when you first used...?
Grade7th 8th 9th 10th 11th 12th
Q9 Electronic vapor products
Never used 93.8 86.7 80.9 78.4 74.1 71.010 years or younger .6 .4 .4 .2 .2 .1
11 years 1.0 .9 .5 .3 .2 .112 years 2.7 2.7 1.6 .7 .4 .213 years 1.7 6.0 4.1 1.9 1.0 .614 years .2 2.9 8.5 5.3 3.3 1.715 years 0.0 .4 3.8 10.0 8.1 4.716 years 0.0 0.0 .3 3.2 9.2 9.4
17 years or older 0.0 .0 0.0 .2 3.5 12.2Q9 Alcohol Never used 89.3 78.7 70.8 62.6 57.0 47.6
10 years or younger 3.7 4.7 3.5 2.8 2.3 1.911 years 1.9 2.3 1.7 1.5 1.0 .812 years 3.2 4.2 3.6 2.9 2.4 2.413 years 1.7 6.9 5.9 5.7 4.7 4.714 years .2 2.9 10.1 8.7 7.6 6.615 years 0.0 .3 4.1 11.7 11.3 11.616 years 0.0 0.0 .3 3.9 9.9 12.6
17 years or older 0.0 0.0 0.0 .3 3.8 11.8Q9 Marijuana Never used 96.5 91.2 85.3 79.4 75.1 68.7
10 years or younger .5 .8 .7 .5 .4 .411 years .8 1.0 1.0 .8 .5 .412 years 1.3 1.8 1.8 1.7 1.4 1.313 years .9 3.4 3.3 3.2 3.0 2.614 years .1 1.6 5.7 5.1 4.3 4.215 years 0.0 .3 2.0 7.0 7.1 6.516 years 0.0 0.0 .2 2.1 6.2 8.0
17 years or older 0.0 .0 0.0 .1 2.0 7.8Q9 Synthetic marijuana Never used 99.6 98.4 97.6 97.2 96.5 95.8
10 years or younger .1 .2 .2 .0 .1 .111 years .1 .2 .1 .1 .1 .012 years .2 .3 .3 .3 .2 .413 years .1 .6 .6 .5 .6 .614 years .0 .3 .9 .6 .6 .715 years 0.0 .0 .4 1.0 1.0 .816 years 0.0 0.0 .1 .2 .7 .8
17 years or older 0.0 .0 0.0 .0 .2 .7

Indiana Youth Survey 2016
210
How old were you when you first used...?
Grade7th 8th 9th 10th 11th 12th
Q9 Cocaine/Crack Never used 99.8 99.6 99.4 99.2 98.8 98.510 years or younger .1 .0 .0 .0 .1 .1
11 years .0 .0 .0 .0 .0 .012 years .1 .1 .0 .0 .0 .013 years .0 .2 .1 .1 .0 .114 years 0.0 .1 .2 .1 .1 .115 years 0.0 .0 .1 .4 .2 .116 years 0.0 0.0 .0 .2 .5 .4
17 years or older 0.0 0.0 0.0 .0 .1 .7Q9 Inhalants Never used 99.2 98.9 98.5 98.8 98.4 98.5
10 years or younger .3 .2 .3 .1 .1 .111 years .2 .2 .1 .1 .1 .112 years .2 .2 .2 .2 .2 .113 years .2 .3 .3 .2 .3 .314 years 0.0 .1 .4 .2 .3 .315 years 0.0 .0 .2 .3 .4 .216 years 0.0 0.0 0.0 .1 .2 .2
17 years or older 0.0 .0 0.0 .0 .1 .2Q9 Methamphetamines Never used 99.8 99.7 99.7 99.5 99.4 99.2
10 years or younger .1 .0 .1 .0 .0 0.011 years .0 .0 0.0 .0 .0 .012 years .1 .1 .0 .0 .0 .013 years .0 .1 .1 .1 .0 .014 years 0.0 .0 .1 .1 .1 .115 years 0.0 .0 .0 .2 .2 .116 years 0.0 .0 .0 .0 .2 .2
17 years or older 0.0 0.0 0.0 .0 .1 .4Q9 Heroin Never used 99.9 99.8 99.8 99.7 99.6 99.4
10 years or younger .0 .0 .0 .0 .0 0.011 years .0 .0 .0 .0 .0 0.012 years .0 .0 .1 .0 .0 .013 years .0 .1 .0 .1 .0 .014 years 0.0 .0 .1 .0 .0 .115 years 0.0 .0 .0 .1 .1 .116 years 0.0 0.0 0.0 .0 .1 .2
17 years or older 0.0 .0 0.0 .0 .1 .1
Age Distribution of First Time Alcohol, Tobacco, and Other Drug UseIndiana Female 7th - 12th Grade Students, 2016
(Values expressed as percentages, valid cases only)

211
Frequency Tables
How old were you when you first used...?
Grade7th 8th 9th 10th 11th 12th
Q9 Hallucinogens/Ecstasy
Never used 99.7 99.3 98.4 98.0 97.5 96.110 years or younger .0 .0 .1 .1 .0 .0
11 years .1 .1 .1 .0 .0 .012 years .1 .1 .1 .1 .1 .113 years .1 .3 .3 .2 .0 .114 years .0 .2 .6 .3 .3 .315 years 0.0 .0 .5 1.0 .7 .416 years 0.0 .0 .1 .4 1.0 1.2
17 years or older 0.0 0.0 0.0 .0 .4 1.8Q9 Prescription drugs
not prescribed to you
Never used 97.7 96.6 95.0 93.9 92.9 91.210 years or younger 1.1 .8 .8 .4 .4 .2
11 years .4 .4 .3 .2 .1 .112 years .6 .5 .6 .4 .4 .413 years .3 1.0 1.0 .7 .7 .614 years .0 .6 1.6 1.5 1.1 1.115 years 0.0 .1 .7 2.1 1.5 1.616 years 0.0 0.0 .1 .7 2.2 2.4
17 years or older 0.0 .0 0.0 .1 .7 2.4Q9 Over the counter
drugs to get highNever used 96.6 95.5 95.3 95.3 95.3 95.3
10 years or younger 2.0 2.0 1.6 1.1 .9 .811 years .4 .4 .3 .3 .2 .112 years .6 .4 .4 .3 .4 .313 years .4 .9 .7 .4 .4 .514 years .1 .6 1.1 .9 .6 .415 years 0.0 .1 .6 1.3 .9 .816 years 0.0 0.0 .0 .3 .8 .9
17 years or older 0.0 .0 0.0 .0 .5 .9
Age Distribution of First Time Alcohol, Tobacco, and Other Drug UseIndiana Female 7th - 12th Grade Students, 2016
(Values expressed as percentages, valid cases only)
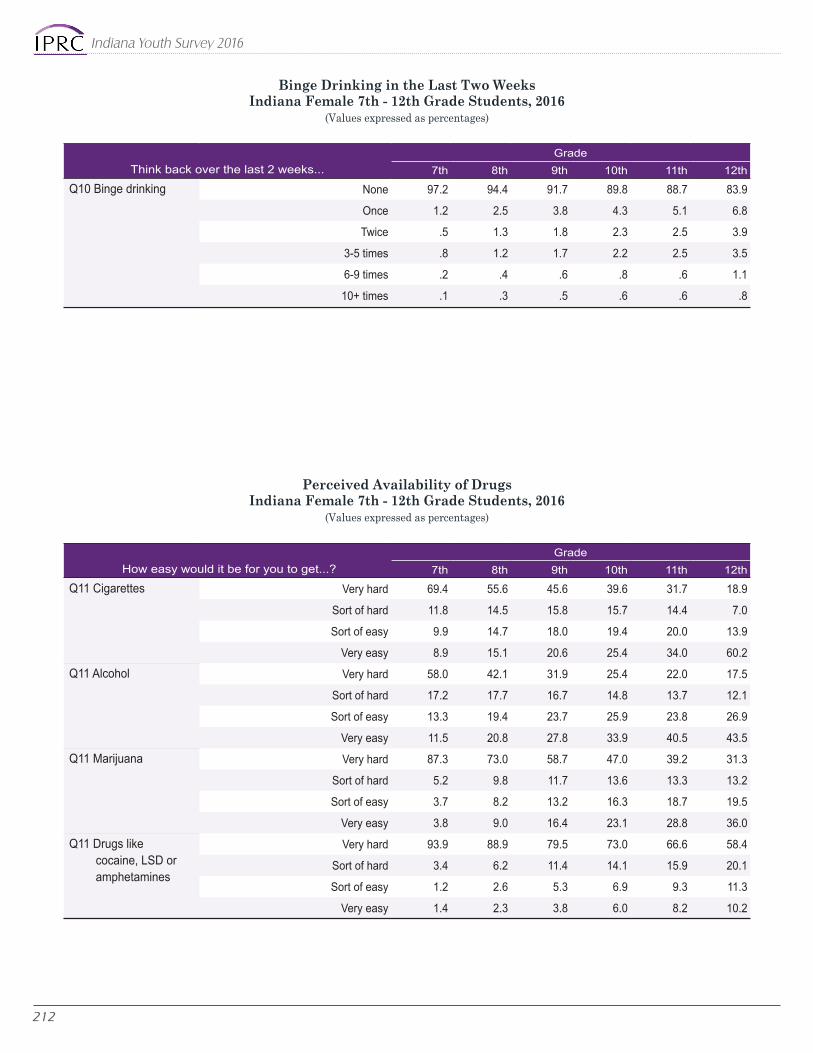
Indiana Youth Survey 2016
212
Binge Drinking in the Last Two WeeksIndiana Female 7th - 12th Grade Students, 2016
(Values expressed as percentages)
Think back over the last 2 weeks...Grade
7th 8th 9th 10th 11th 12th
Q10 Binge drinking None 97.2 94.4 91.7 89.8 88.7 83.9
Once 1.2 2.5 3.8 4.3 5.1 6.8
Twice .5 1.3 1.8 2.3 2.5 3.9
3-5 times .8 1.2 1.7 2.2 2.5 3.5
6-9 times .2 .4 .6 .8 .6 1.1
10+ times .1 .3 .5 .6 .6 .8
How easy would it be for you to get...?Grade
7th 8th 9th 10th 11th 12th
Q11 Cigarettes Very hard 69.4 55.6 45.6 39.6 31.7 18.9
Sort of hard 11.8 14.5 15.8 15.7 14.4 7.0
Sort of easy 9.9 14.7 18.0 19.4 20.0 13.9
Very easy 8.9 15.1 20.6 25.4 34.0 60.2
Q11 Alcohol Very hard 58.0 42.1 31.9 25.4 22.0 17.5
Sort of hard 17.2 17.7 16.7 14.8 13.7 12.1
Sort of easy 13.3 19.4 23.7 25.9 23.8 26.9
Very easy 11.5 20.8 27.8 33.9 40.5 43.5
Q11 Marijuana Very hard 87.3 73.0 58.7 47.0 39.2 31.3
Sort of hard 5.2 9.8 11.7 13.6 13.3 13.2
Sort of easy 3.7 8.2 13.2 16.3 18.7 19.5
Very easy 3.8 9.0 16.4 23.1 28.8 36.0
Q11 Drugs like cocaine, LSD or amphetamines
Very hard 93.9 88.9 79.5 73.0 66.6 58.4
Sort of hard 3.4 6.2 11.4 14.1 15.9 20.1
Sort of easy 1.2 2.6 5.3 6.9 9.3 11.3
Very easy 1.4 2.3 3.8 6.0 8.2 10.2
Perceived Availability of DrugsIndiana Female 7th - 12th Grade Students, 2016
(Values expressed as percentages)

213
Frequency Tables
Usual Sources of Alcoholic Beverages in the Past YearIndiana Female 7th - 12th Grade Students, 2016
(Values expressed as percentages)
During the past year, how did you get your prescription drugs that were used to get high?
Grade7th 8th 9th 10th 11th 12th
Source Q13 I did not use prescription drugs to get high 96.7 94.9 93.9 92.3 92.3 91.1
Q13 They were prescribed to me 2.5 2.2 2.4 2.9 2.8 2.9
Q13 My parents gave them to me .7 .8 .7 .5 .5 .8Q13 Someone other than my parents
gave them to me 1.1 2.4 2.9 3.6 3.7 4.7
Q13 I took them from home .7 1.4 1.9 2.1 1.7 1.6
Q13 I bought them from someone .6 1.5 2.1 2.8 3.1 3.9
Q13 I bought them on the internet .1 .2 .2 .1 .2 .1
Q13 I took them from someone else .4 .8 .9 .9 .9 1.0
Q13 I got them some other way 1.0 1.5 1.6 1.7 1.5 1.8
Usual Sources of Prescription Drugs in the Past YearIndiana Female 7th - 12th Grade Students, 2016
(Values expressed as percentages)
Note: Multiple responses allowed; percentages do not add to 100%.
During the past year, how did you get your alcohol? Grade
7th 8th 9th 10th 11th 12th
Source Q12 I did not drink alcohol 89.6 79.5 71.1 64.1 58.7 49.9Q12 I bought it at a restaurant, bar, or
club .2 .3 .3 .5 1.0 2.0
Q12 I bought it at a public event .3 .5 .5 .6 1.2 2.3Q12 I gave someone else money to
buy it for me 1.0 2.7 6.1 10.3 15.5 23.2
Q12 I bought it at a store .2 .3 .4 .4 1.0 2.0Q12 A person 21 years old or older
gave it to me 4.3 8.8 12.8 17.0 21.8 30.5
Q12 A person under 21 years old gave it to me 2.1 5.1 8.7 11.8 14.2 16.6
Q12 I took it from a store .3 .5 .7 .8 .9 1.1
Q12 I got it at a party 3.0 7.5 12.2 17.3 22.4 27.5
Q12 I got it from a parent/guardian 4.3 7.7 9.1 10.2 11.0 13.9Q12 I got it from some other family
member 3.8 6.8 8.5 9.9 10.7 13.6
Q12 I got it some other way 3.9 7.8 9.9 9.7 9.1 9.5
Note: Multiple responses allowed; percentages do not add to 100%.

Indiana Youth Survey 2016
214
CRAFFT Substance Abuse ScreeningIndiana Female 14 Years or Older Students, 2016
(Values expressed as percentages)
How many times have you experienced the following due to your drinking or drug use...?
Grade7th 8th 9th 10th 11th 12th
Q15 Performed poorly on test or project
Never 96.3 95.8 95.1 95.2 96.3 95.7
Once 1.1 1.4 1.3 1.4 .9 1.3
Twice .8 .8 1.1 1.2 .8 1.1
3-5 times .9 1.1 1.4 1.2 1.0 1.2
6-10 times .3 .4 .3 .3 .4 .2
11+ times .5 .5 .7 .6 .5 .5
Q15 Missed class Never 97.8 97.0 96.3 95.8 96.1 95.3
Once .9 .9 1.3 1.3 1.1 1.2
Twice .5 .6 .6 .8 .9 .9
3-5 times .4 .9 .8 1.1 .9 1.4
6-10 times .1 .2 .4 .4 .4 .6
11+ times .3 .4 .5 .6 .6 .6
Consequences of Alcohol, Tobacco, and Other Drug UseIndiana Female 7th - 12th Grade Students, 2016
(Values expressed as percentages)
Grade
14 years 15 years 16 years 17 years18 years or older
Q34 Have you ever ridden in a car driven by someone (including yourself) who was high or had been using alcohol or drugs?
No 72.0 67.8 65.3 60.2 56.4
Yes 28.0 32.2 34.7 39.8 43.6
Q14 Do you ever use alcohol or drugs to relax, feel better about yourself, or fit in?
Never used 74.8 67.1 59.0 52.3 46.3
No 16.4 19.4 24.1 27.5 31.8
Yes 8.8 13.6 16.9 20.3 21.9
Q14 Do you ever use alcohol or drugs while you are by yourself, or alone?
Never used 75.0 67.0 59.5 52.6 46.8
No 16.1 20.7 25.6 30.6 35.6
Yes 8.9 12.3 14.9 16.8 17.6
Q14 Do you ever forget things you did while using alcohol or drugs?
Never used 75.6 67.9 60.0 53.1 47.5
No 19.2 22.7 27.6 31.3 35.8
Yes 5.2 9.4 12.3 15.6 16.7
Q14 Do your family or friends ever tell you that you should cut down on your drinking or drug use?
Never used 76.1 68.3 60.3 53.5 47.7
No 21.1 28.4 35.2 41.8 47.9
Yes 2.8 3.3 4.5 4.7 4.4
Q14 Have you ever gotten into trouble while you were using alcohol or drugs?
Never used 75.3 67.2 59.4 52.7 46.7
No 20.5 26.6 33.6 38.9 45.6
Yes 4.3 6.2 7.1 8.4 7.7

215
Frequency Tables
Perceived Risks of Drug UseIndiana Female 7th - 12th Grade Students, 2016
(Values expressed as percentages)
How much do you think people risk harming themselves if they...?
Grade7th 8th 9th 10th 11th 12th
Q16 Smoke 1+ pack cigarettes per day
No risk 6.7 7.2 6.3 6.5 7.5 7.6
Slight risk 9.9 9.9 9.0 7.9 7.1 6.4
Moderate risk 25.1 24.4 23.8 19.8 20.8 19.2
Great risk 58.2 58.6 60.9 65.8 64.6 66.7
Q16 Try marijuana once or twice
No risk 13.6 21.2 28.7 35.0 40.9 43.7
Slight risk 29.6 33.3 31.1 31.0 27.2 28.0
Moderate risk 25.8 22.5 19.9 16.3 15.0 13.1
Great risk 31.0 23.0 20.2 17.7 16.9 15.2
Q16 Smoke marijuana once or twice per week
No risk 10.0 14.3 18.2 22.5 25.9 28.5
Slight risk 14.9 19.3 21.2 23.1 23.9 25.6
Moderate risk 29.5 29.8 28.3 26.2 24.1 23.2
Great risk 45.6 36.6 32.3 28.2 26.1 22.7
Q16 Have 1-2 alcoholic drinks every day
No risk 10.0 10.7 10.5 10.3 11.3 11.8
Slight risk 23.7 24.1 24.4 23.9 24.5 25.1
Moderate risk 30.4 32.0 32.1 32.7 31.8 32.6
Great risk 35.9 33.2 33.0 33.1 32.3 30.4
Q16 Binge drink once or twice a week
No risk 6.7 7.0 6.5 6.3 7.4 7.3
Slight risk 11.5 12.2 11.9 12.0 12.2 13.1
Moderate risk 30.1 31.3 32.8 31.0 31.6 32.3
Great risk 51.6 49.5 48.7 50.7 48.8 47.4
Q16 Misuse prescription drugs
No risk 5.7 5.7 5.3 4.9 5.5 5.5
Slight risk 5.3 6.2 7.0 6.7 6.0 6.1
Moderate risk 17.8 20.3 21.4 20.2 19.1 19.3
Great risk 71.2 67.7 66.4 68.2 69.4 69.2

Indiana Youth Survey 2016
216
Favorable Attitudes Toward Antisocial BehaviorIndiana Female 7th - 12th Grade Students, 2016
(Values expressed as percentages)
How wrong do you think it is for someone your age to...?Grade
7th 8th 9th 10th 11th 12th
Q17 Take a gun to school
Very wrong 91.7 90.6 90.0 92.0 92.3 91.5
Wrong 6.8 7.4 7.6 6.2 5.9 6.1
A little bit wrong 1.3 1.6 1.8 1.2 1.1 1.8
Not at all wrong .3 .5 .7 .6 .6 .7
Q17 Steal something more than $5
Very wrong 53.5 48.8 47.8 52.6 56.1 58.0
Wrong 37.4 39.3 40.0 36.8 33.7 33.0
A little bit wrong 8.4 10.8 11.0 9.7 9.3 8.1
Not at all wrong .7 1.1 1.2 .9 1.0 .8
Q17 Attack someone Very wrong 82.5 77.3 75.1 78.2 81.2 82.2
Wrong 13.2 17.0 18.6 16.5 14.7 14.0
A little bit wrong 3.4 4.4 4.9 4.1 3.0 2.8
Not at all wrong .9 1.3 1.4 1.2 1.0 .9
Q17 Pick a fight Very wrong 42.2 37.8 38.0 43.3 47.3 49.5
Wrong 41.7 42.0 41.9 39.9 38.3 37.6
A little bit wrong 13.9 17.4 17.6 14.9 12.8 11.6
Not at all wrong 2.3 2.8 2.5 1.8 1.5 1.4
Q17 Skip school Very wrong 66.9 59.2 50.6 50.4 49.3 46.2
Wrong 27.2 30.5 35.5 35.4 33.7 34.3
A little bit wrong 5.0 9.0 12.1 12.5 15.0 17.2
Not at all wrong .9 1.3 1.8 1.7 2.0 2.3

217
Frequency Tables
Favorable Attitudes Toward Drug UseIndiana Female 7th - 12th Grade Students, 2016
(Values expressed as percentages)
How wrong do you think it is for someone your age to...?Grade
7th 8th 9th 10th 11th 12th
Q17 Drink alcohol regularly
Very wrong 79.1 66.8 53.3 47.8 44.6 37.6
Wrong 14.3 19.6 25.0 25.4 24.4 23.9
A little bit wrong 5.3 10.3 16.6 20.0 22.4 26.7
Not at all wrong 1.3 3.3 5.1 6.8 8.6 11.8
Q17 Smoke cigarettes Very wrong 81.6 71.7 62.0 60.3 55.0 46.3
Wrong 13.4 19.2 24.7 24.9 25.8 25.7
A little bit wrong 4.0 7.1 10.4 11.2 14.6 18.2
Not at all wrong 1.0 2.0 2.9 3.5 4.5 9.7
Q17 Smoke marijuana Very wrong 86.2 72.5 59.1 51.2 47.2 40.2
Wrong 8.0 13.5 18.3 20.1 20.5 20.3
A little bit wrong 3.6 8.4 13.1 16.3 17.6 21.8
Not at all wrong 2.2 5.7 9.6 12.4 14.8 17.8
Q17 Use illegal drugs Very wrong 95.3 91.6 86.9 85.7 85.2 82.6
Wrong 3.7 6.1 9.1 10.3 10.3 11.8
A little bit wrong .7 1.3 2.7 2.8 3.3 4.1
Not at all wrong .3 .9 1.3 1.2 1.3 1.6
How wrong do your friends feel it would be for you to...?
Grade7th 8th 9th 10th 11th 12th
Q18 Smoke tobacco Very wrong 86.2 76.9 68.6 65.6 60.0 55.3
Wrong 8.7 13.7 17.4 18.8 19.3 18.9
A little bit wrong 3.3 6.0 8.6 9.1 11.9 13.4
Not at all wrong 1.7 3.4 5.4 6.6 8.9 12.4
Q18 Smoke marijuana Very wrong 86.4 72.8 60.1 52.4 47.7 42.5
Wrong 6.6 11.1 13.6 15.3 14.8 15.2
A little bit wrong 3.7 8.0 12.5 14.4 15.4 16.7
Not at all wrong 3.3 8.1 13.9 17.9 22.1 25.6
Q18 Have 1-2 alcoholic drinks every day
Very wrong 83.7 72.8 62.2 56.3 52.2 47.6
Wrong 9.7 14.8 17.7 20.2 21.0 21.4
A little bit wrong 4.3 7.7 12.4 13.9 15.3 16.7
Not at all wrong 2.4 4.8 7.7 9.7 11.5 14.3
Q18 Misuse prescription drugs
Very wrong 90.3 84.2 78.3 76.0 74.1 72.1
Wrong 6.4 10.1 13.6 15.0 15.0 15.9
A little bit wrong 2.1 3.5 5.0 5.6 6.5 7.2
Not at all wrong 1.2 2.1 3.1 3.4 4.3 4.9
Perceived Peer Approval of Drug UseIndiana Female 7th - 12th Grade Students, 2016
(Values expressed as percentages)

Indiana Youth Survey 2016
218
Rewards for Antisocial InvolvementIndiana Female 7th - 12th Grade Students, 2016
(Values expressed as percentages)
What are the chances you would be seen as cool if you...?
Grade7th 8th 9th 10th 11th 12th
Q19 Smoked cigarettes Very good chance 3.5 4.1 4.5 3.5 3.5 4.0
Pretty good chance 4.1 4.1 4.3 4.0 3.3 3.0
Some chance 8.2 10.2 11.1 10.1 10.3 10.1
Little chance 12.5 16.3 18.1 18.1 18.7 18.4
No or very little chance 71.7 65.3 62.0 64.4 64.3 64.5
Q19 Drank alcohol regularly
Very good chance 3.8 4.7 6.2 6.0 6.7 7.3
Pretty good chance 4.7 6.2 8.6 10.1 10.2 10.2
Some chance 7.7 11.9 15.7 17.0 15.9 15.9
Little chance 12.5 16.4 17.5 16.7 18.0 17.7
No or very little chance 71.3 60.8 52.1 50.3 49.2 48.8
Q19 Smoked marijuana Very good chance 6.9 9.1 10.6 9.8 10.0 10.1
Pretty good chance 5.5 8.6 10.6 11.4 11.0 11.4
Some chance 6.7 10.5 13.8 15.2 15.7 15.4
Little chance 8.9 12.5 13.5 14.3 14.3 14.9
No or very little chance 72.0 59.3 51.4 49.2 49.0 48.2
Q19 Carried a gun Very good chance 4.5 4.9 4.9 4.5 4.0 4.3
Pretty good chance 3.2 3.8 3.1 2.9 2.5 2.7
Some chance 5.3 6.1 6.4 5.9 5.9 5.6
Little chance 9.4 10.7 11.1 10.1 10.2 11.2
No or very little chance 77.6 74.5 74.5 76.6 77.5 76.2

219
Frequency Tables
Parental Attitudes Favorable Toward Drug UseIndiana Female 7th - 12th Grade Students, 2016
(Values expressed as percentages)
How wrong do your parents feel it would be for you to...?Grade
7th 8th 9th 10th 11th 12th
Q20 Have 1-2 alcoholic drinks every day Very wrong 94.8 93.1 90.7 89.6 87.3 83.4
Wrong 3.4 4.5 5.9 6.9 8.5 11.2
A little bit wrong .9 1.3 2.0 2.2 2.7 3.8
Not at all wrong .9 1.1 1.3 1.2 1.5 1.6
Q20 Drink alcohol regularly (at least once or twice a month)
Very wrong 92.8 89.7 86.3 82.8 78.2 71.7
Wrong 4.4 6.0 8.0 9.8 11.4 13.6
A little bit wrong 1.5 2.7 3.7 4.8 6.9 9.3
Not at all wrong 1.4 1.6 2.0 2.6 3.5 5.4
Q20 Smoke cigarettes Very wrong 94.5 92.8 91.0 89.9 87.1 81.2
Wrong 3.7 4.7 5.7 6.3 7.9 10.6
A little bit wrong 1.0 1.4 1.9 2.5 2.9 4.5
Not at all wrong .9 1.0 1.4 1.3 2.0 3.7
Q20 Smoke marijuana Very wrong 94.8 90.8 87.0 83.6 81.8 77.7
Wrong 2.5 4.7 6.2 8.3 8.3 10.3
A little bit wrong 1.2 2.6 4.0 5.0 5.5 7.1
Not at all wrong 1.5 1.9 2.8 3.1 4.4 4.9
Q20 Use prescription drugs not prescribed to you
Very wrong 95.5 94.1 93.2 92.9 91.7 90.5
Wrong 2.6 3.8 4.4 4.7 5.6 6.1
A little bit wrong .9 1.1 1.4 1.4 1.4 1.9
Not at all wrong 1.0 1.0 1.0 1.1 1.3 1.4

Indiana Youth Survey 2016
220
Parental Attitudes Favorable Toward Antisocial BehaviorIndiana Female 7th - 12th Grade Students, 2016
(Values expressed as percentages)
During the past 12 months, did you...?Grade
7th 8th 9th 10th 11th 12th
Q21 Feel sad or hopeless
No 69.8 61.9 58.8 59.4 61.7 63.9
Yes 30.2 38.1 41.2 40.6 38.3 36.1
Q21 Consider attempting suicide
No 81.9 75.6 75.0 77.0 78.9 81.1
Yes 18.1 24.4 25.0 23.0 21.1 18.9
Q21 Make a plan about attempting suicide
No 86.2 80.9 80.7 83.1 84.7 86.8
Yes 13.8 19.1 19.3 16.9 15.3 13.2
Mental Health in the Past Twelve MonthsIndiana Female 7th - 12th Grade Students, 2016
(Values expressed as percentages)
How wrong do your parents feel it would be for you to...?Grade
7th 8th 9th 10th 11th 12th
Q20 Steal something worth more than $5
Very wrong 86.0 84.7 84.8 86.4 86.4 86.3
Wrong 11.4 11.8 11.8 10.5 10.4 10.7
A little bit wrong 1.7 2.3 2.3 2.2 2.2 1.8
Not at all wrong 1.0 1.2 1.2 1.0 1.0 1.1
Q20 Draw graffiti Very wrong 86.4 83.5 82.7 83.5 83.1 83.1
Wrong 9.8 11.4 12.0 11.2 11.7 12.0
A little bit wrong 2.4 3.5 3.7 3.8 3.6 3.5
Not at all wrong 1.5 1.6 1.6 1.4 1.7 1.5
Q20 Pick a fight with someone
Very wrong 70.0 67.1 68.4 70.4 71.1 70.4
Wrong 21.3 22.1 20.6 20.3 19.1 20.2
A little bit wrong 6.2 8.3 8.6 7.3 7.7 7.6
Not at all wrong 2.5 2.6 2.4 2.0 2.1 1.8

221
Frequency Tables
Gambling during the Last Twelve MonthsIndiana Female 7th - 12th Grade Students, 2016
(Values expressed as percentages)
How often have you bet/gambled for money or valuables in the following ways?
Grade7th 8th 9th 10th 11th 12th
Q22 Card games Never 90.5 89.0 89.8 90.4 91.1 90.1
Less than once a month 7.2 8.1 7.6 7.2 6.8 7.0
1-3 times per month 1.7 2.2 1.8 1.7 1.5 2.1
Once a week or more .6 .7 .8 .7 .6 .7
Q22 Personal games of skill
Never 84.1 84.3 86.9 88.9 91.1 90.4
Less than once a month 9.2 9.4 8.0 7.1 5.6 5.9
1-3 times per month 3.9 4.0 3.3 2.5 2.1 2.3
Once a week or more 2.7 2.3 1.8 1.6 1.3 1.4
Q22 Sports Never 88.6 87.6 89.9 91.4 92.3 91.7
Less than once a month 6.8 8.0 7.0 6.0 5.3 5.5
1-3 times per month 2.5 2.7 2.0 1.6 1.4 1.8
Once a week or more 2.0 1.7 1.1 1.0 .9 1.0
Q22 Lottery Never 91.7 90.2 91.0 91.1 91.2 78.9
Less than once a month 5.9 7.0 6.7 6.7 6.1 15.5
1-3 times per month 1.8 2.0 1.9 1.7 2.0 4.2
Once a week or more .6 .8 .4 .5 .7 1.4
Q22 Bingo Never 89.6 89.8 92.4 93.5 94.8 93.4
Less than once a month 8.1 7.7 6.0 5.1 4.0 4.9
1-3 times per month 1.5 1.6 1.1 1.0 .8 1.0
Once a week or more .7 .8 .5 .5 .5 .7
Q22 Online gambling Never 97.5 97.1 97.9 98.1 98.4 98.2
Less than once a month 1.4 1.6 1.2 1.1 1.1 .8
1-3 times per month .5 .7 .5 .4 .3 .4
Once a week or more .6 .6 .4 .4 .3 .5
Q22 Personal challenges
Never 76.8 74.1 77.9 80.7 83.2 83.7
Less than once a month 14.7 15.5 14.2 12.7 11.2 10.4
1-3 times per month 5.8 7.0 5.4 4.9 4.2 4.1
Once a week or more 2.8 3.4 2.5 1.7 1.5 1.8
Q22 Gambled in other ways
Never 92.4 90.5 92.3 92.3 93.5 92.4
Less than once a month 5.3 6.2 4.9 5.3 4.2 5.0
1-3 times per month 1.4 1.9 1.9 1.5 1.3 1.7
Once a week or more .9 1.4 .9 .8 .9 .9

Indiana Youth Survey 2016
222
Consequences of GamblingIndiana Female 7th - 12th Grade Students, 2016
(Values expressed as percentages)
How often have you experienced the following consequences due to your gambling?
Grade7th 8th 9th 10th 11th 12th
Q23 Academic problems I do not gamble 85.1 83.3 85.4 86.5 87.9 83.5
Never 14.0 15.7 13.7 12.8 11.5 16.0
Occasionally .8 .8 .8 .5 .4 .3
Frequently .1 .2 .2 .2 .2 .1
Q23 Issues with the legal system
I do not gamble 85.3 83.6 85.7 86.6 88.2 83.5
Never 14.4 16.1 14.0 13.1 11.6 16.2
Occasionally .2 .3 .2 .2 .1 .2
Frequently .0 .1 .1 .1 .1 .2
Q23 Lost possessions or money
I do not gamble 84.7 82.9 85.2 86.3 87.6 82.9
Never 11.2 12.3 10.5 9.8 9.0 12.3
Occasionally 4.0 4.6 4.0 3.7 3.2 4.6
Frequently .2 .2 .3 .2 .2 .2
Q23 Felt bad about gambling
I do not gamble 85.3 83.5 85.7 86.5 87.9 83.4
Never 12.9 14.5 13.2 12.6 11.0 15.4
Occasionally 1.5 1.7 1.0 .7 .8 1.0
Frequently .2 .3 .2 .2 .2 .2
Q23 Poor health I do not gamble 85.0 83.2 85.3 86.5 88.0 83.4
Never 13.7 15.6 13.6 12.8 11.5 16.0
Occasionally 1.0 .9 .7 .4 .3 .4
Frequently .3 .4 .3 .2 .2 .2
Q23 Issues with friends and family
I do not gamble 84.1 82.4 84.7 86.1 87.7 83.1
Never 12.3 14.3 12.6 12.1 10.7 15.6
Occasionally 2.9 2.7 2.2 1.5 1.3 1.1
Frequently .7 .6 .4 .3 .3 .3

223
Frequency Tables
School Opportunities for Prosocial InvolvementIndiana Female 7th - 12th Grade Students, 2016
(Values expressed as percentages)
Grade7th 8th 9th 10th 11th 12th
Q24 Students have chances to help decide class activities and rules
YES! 18.9 18.4 21.4 20.5 20.7 20.9
yes 42.7 40.8 41.9 38.2 39.1 37.8
no 28.4 29.0 27.3 29.3 28.8 28.2
NO! 10.0 11.8 9.3 12.0 11.4 13.1
Q24 Teachers ask me to work on special class projects
YES! 16.2 15.4 12.8 12.4 13.9 14.6
yes 36.1 35.6 33.7 33.6 34.7 35.8
no 35.3 36.8 40.7 41.4 38.9 37.4
NO! 12.4 12.2 12.8 12.6 12.4 12.2
Q24 Students have chances to get involved in activities outside of class
YES! 72.8 64.8 64.6 61.0 60.0 58.5
yes 21.7 28.1 28.6 30.8 31.0 31.9
no 3.9 5.0 4.7 5.5 5.9 6.1
NO! 1.6 2.1 2.1 2.6 3.0 3.5
Q24 Students have chances to talk with teacher one-on-one
YES! 47.1 40.3 37.6 33.6 36.0 37.4
yes 34.9 37.8 39.2 42.5 43.2 42.4
no 13.3 16.6 17.3 18.1 15.5 14.6
NO! 4.8 5.3 5.8 5.8 5.4 5.7
Q24 Students have chances to be a part of class discussions or activities
YES! 47.2 40.3 33.2 29.9 30.8 32.0
yes 39.1 44.3 48.9 51.4 52.2 51.6
no 10.6 11.8 13.7 14.3 12.8 11.9
NO! 3.1 3.6 4.3 4.5 4.1 4.4

Indiana Youth Survey 2016
224
School Rewards for Prosocial InvolvementIndiana Female 7th - 12th Grade Students, 2016
(Values expressed as percentages)
Grade7th 8th 9th 10th 11th 12th
Q28 What were your grades like last year?
Mostly A's 53.3 49.6 47.1 45.4 44.6 46.1
Mostly B's 31.5 31.8 33.3 34.9 37.3 36.9
Mostly C's 11.2 13.3 14.4 14.6 13.9 14.0
Mostly D's 2.6 3.4 3.5 3.7 3.0 2.5
Mostly F's 1.4 1.9 1.8 1.5 1.2 .4
Q24 My grades are better than most students
YES! 30.5 32.3 30.9 30.0 32.3 34.2
yes 43.3 40.9 41.5 43.3 43.2 42.8
no 19.3 19.7 19.9 19.5 18.3 17.4
NO! 7.0 7.2 7.7 7.2 6.2 5.5
Academic FailureIndiana Female 7th - 12th Grade Students, 2016
(Values expressed as percentages)
Grade7th 8th 9th 10th 11th 12th
Q24 Teachers notice when doing a good job and let me know
YES! 33.5 26.7 21.8 19.4 20.6 21.4
yes 39.8 40.9 40.6 39.8 41.0 41.8
no 19.4 23.8 27.0 29.6 27.7 27.1
NO! 7.3 8.7 10.7 11.2 10.7 9.7
Q24 I feel safe at school YES! 47.0 35.7 29.6 27.6 30.3 32.0
yes 37.6 42.6 46.9 49.6 49.6 49.7
no 10.1 13.9 15.8 15.0 13.7 12.0
NO! 5.4 7.8 7.8 7.8 6.5 6.3
Q24 School lets parents know when I do well
YES! 19.8 15.6 12.7 11.6 13.0 12.5
yes 28.3 26.0 23.1 22.3 22.2 22.9
no 33.5 35.7 37.7 37.6 37.2 37.6
NO! 18.4 22.6 26.6 28.4 27.6 27.0
Q24 Teachers praise me when l work hard in school
YES! 20.7 17.0 14.7 13.1 14.2 15.1
yes 35.7 33.2 31.1 30.6 32.6 35.1
no 29.4 33.6 35.2 36.7 35.9 33.8
NO! 14.2 16.3 19.0 19.6 17.3 16.0

225
Frequency Tables
Low Commitment to SchoolIndiana Female 7th - 12th Grade Students, 2016
(Values expressed as percentages)
Grade7th 8th 9th 10th 11th 12th
Q26 Days of school skipped during last month
None 87.6 84.2 82.1 79.9 78.1 69.5
1 day 5.5 7.1 8.1 8.7 9.6 12.4
2 days 2.9 3.5 4.4 4.5 5.3 6.6
3 days 1.5 2.0 2.4 2.8 3.0 4.5
4-5 days 1.4 2.0 1.5 2.3 2.3 3.7
6-10 days .6 .7 .8 1.0 1.0 1.9
11 or more days .5 .6 .7 .8 .6 1.4
Q27 How interesting are courses Very interesting 9.8 7.0 6.7 6.2 7.0 7.5
Quite interesting 22.5 20.1 20.5 20.6 22.1 20.6
Fairly interesting 33.6 36.6 38.5 39.9 40.2 39.2
Slightly boring 23.0 22.3 21.8 21.2 19.6 19.2
Very boring 11.2 14.0 12.5 12.1 11.1 13.5
Q29 Feel schoolwork is meaningful Almost always 24.0 17.1 12.8 9.6 9.6 8.4
Often 27.8 26.5 23.8 20.8 20.4 20.1
Sometimes 30.8 33.4 35.4 37.1 35.4 36.3
Seldom 11.7 15.2 18.4 22.2 23.8 24.8
Never 5.7 7.9 9.6 10.2 10.9 10.4
Q30 Importance of school to later life Very important 31.1 23.3 16.6 13.3 12.5 12.0
Quite important 25.3 23.9 20.2 17.9 18.0 16.8
Fairly important 22.4 25.0 28.2 28.5 27.9 28.7
Slightly important 17.0 20.9 25.2 29.0 30.6 31.4
Not at all important 4.2 6.8 9.7 11.4 11.0 11.1
Q25 Enjoy being in school Never 7.9 10.4 11.9 13.2 13.8 14.1
Seldom 9.8 12.9 15.6 17.5 19.3 19.3
Sometimes 32.5 34.3 35.4 36.3 34.3 34.8
Often 29.1 27.4 25.5 24.0 23.8 23.7
A lot 20.8 15.0 11.6 8.9 8.8 8.1
Q25 Hate being in school Never 13.0 8.4 6.7 5.5 5.5 5.1
Seldom 23.7 21.0 18.7 16.8 15.4 16.5
Sometimes 32.9 33.2 32.8 33.1 33.1 33.3
Often 16.4 19.1 21.6 23.1 22.9 23.1
A lot 14.0 18.3 20.3 21.5 23.1 22.1
Q25 Try to do your best work in school Never .8 1.2 1.5 1.3 1.5 1.7
Seldom 2.0 2.5 2.9 3.3 2.7 3.7
Sometimes 9.3 11.7 13.2 14.2 15.1 16.2
Often 22.2 27.3 30.3 31.1 32.4 33.4
A lot 65.7 57.3 52.1 50.0 48.3 45.0

Indiana Youth Survey 2016
226
Poor Family ManagementIndiana Female 7th - 12th Grade Students, 2016
(Values expressed as percentages)
Grade7th 8th 9th 10th 11th 12th
Q31 Rules in my family are clear YES! 64.9 60.2 59.0 57.4 57.0 56.0
yes 29.4 32.6 32.9 34.7 34.6 35.6
no 4.8 5.8 6.6 6.3 6.5 6.5
NO! 1.0 1.4 1.5 1.6 1.9 2.0
Q31 Parents ask about homework YES! 67.3 57.0 51.8 45.8 41.0 35.1
yes 22.9 27.5 29.6 30.9 31.3 29.8
no 7.3 11.4 13.7 16.9 19.8 24.0
NO! 2.5 4.1 4.9 6.5 8.0 11.1
Q31 Parents know where I am and who I am with
YES! 80.8 75.2 70.7 67.8 64.0 56.9
yes 15.2 19.6 23.6 26.2 28.4 32.3
no 2.8 3.8 4.2 4.7 5.8 7.6
NO! 1.2 1.4 1.5 1.3 1.8 3.2
Q31 Family has clear rules about alcohol and drug use
YES! 81.9 74.4 68.3 63.7 60.5 55.0
yes 12.2 17.1 21.6 25.6 26.8 30.0
no 4.2 6.7 8.3 8.8 10.5 11.8
NO! 1.7 1.8 1.9 1.9 2.1 3.1
Q32 Parents know if you come home late
YES! 70.2 63.5 59.2 57.7 55.5 51.7
yes 21.7 25.7 28.9 30.3 31.1 30.7
no 6.0 8.4 9.4 9.5 10.2 12.9
NO! 2.0 2.4 2.5 2.6 3.2 4.6
Q32 Parents would catch you drinking YES! 71.4 56.1 46.8 38.1 33.3 28.6
yes 15.6 21.0 23.1 24.4 23.9 22.3
no 8.9 17.0 22.7 28.5 32.0 35.6
NO! 4.1 5.9 7.4 9.1 10.8 13.6
Q32 Parents would catch you if you carried a gun
YES! 84.3 76.5 73.0 68.0 64.1 57.8
yes 11.1 16.2 18.1 21.1 23.2 25.1
no 2.8 4.9 6.3 8.2 9.2 12.5
NO! 1.8 2.4 2.5 2.7 3.4 4.6
Q32 Parents would catch you if you skipped school
YES! 80.9 72.8 67.8 62.9 58.3 50.8
yes 13.3 18.5 22.3 25.5 27.4 29.9
no 4.0 6.3 7.4 8.8 10.9 13.8
NO! 1.8 2.4 2.4 2.8 3.4 5.5

227
Frequency Tables
Family ConflictIndiana Female 7th - 12th Grade Students, 2016
(Values expressed as percentages)
Grade7th 8th 9th 10th 11th 12th
Q31 Parents ask me before most family decisions made
YES! 33.1 28.6 26.8 24.2 24.8 23.8
yes 36.5 36.1 36.4 36.9 36.7 37.3
no 18.4 21.8 24.0 24.7 24.3 25.2
NO! 12.0 13.4 12.9 14.1 14.1 13.7
Q32 I can ask parents for help if I have problem
YES! 58.4 49.4 47.4 45.4 47.8 47.3
yes 26.3 29.7 31.7 33.3 32.8 34.2
no 9.4 13.1 13.5 14.1 12.4 11.7
NO! 5.9 7.8 7.5 7.3 7.0 6.8
Q32 Parents give me chances for fun with them
YES! 51.9 43.7 40.3 38.0 38.6 37.9
yes 30.1 33.6 35.2 35.2 34.6 35.3
no 13.4 16.8 18.3 20.2 19.6 19.3
NO! 4.5 6.0 6.2 6.6 7.3 7.6
Family Opportunities for Prosocial InvolvementIndiana Female 7th - 12th Grade Students, 2016
(Values expressed as percentages)
Grade7th 8th 9th 10th 11th 12th
Q31 Family argues over and over about same thing
YES! 18.5 22.2 25.1 24.7 24.8 25.0
yes 24.7 26.0 27.7 28.5 27.4 27.0
no 36.0 36.5 34.8 34.7 35.0 34.7
NO! 20.8 15.3 12.4 12.1 12.8 13.3
Q31 Family has serious arguments YES! 14.6 17.8 19.4 19.6 18.8 18.8
yes 15.7 18.8 21.1 20.8 19.9 20.2
no 32.3 34.8 34.6 35.6 36.5 36.8
NO! 37.4 28.6 24.9 23.9 24.9 24.2
Q31 Family members often insult each other
YES! 14.8 18.5 20.3 19.0 18.8 18.9
yes 16.5 19.6 21.5 21.3 20.8 20.3
no 30.7 31.5 31.3 33.1 32.9 33.3
NO! 38.0 30.3 26.9 26.5 27.5 27.5

Indiana Youth Survey 2016
228
Family Rewards for Prosocial InvolvementIndiana Female 7th - 12th Grade Students, 2016
(Values expressed as percentages)
Grade7th 8th 9th 10th 11th 12th
Q32 I enjoy spending time with mom YES! 71.1 63.5 59.8 57.3 57.4 55.7
yes 21.4 25.8 29.0 31.5 31.4 32.8
no 4.1 6.2 6.6 6.6 6.6 6.8
NO! 3.4 4.6 4.6 4.5 4.6 4.7
Q32 I Enjoy spending time with dad YES! 63.4 53.6 50.2 47.9 47.5 46.6
yes 21.7 26.3 28.8 30.9 31.0 32.3
no 7.1 9.6 10.1 10.8 11.1 10.5
NO! 7.8 10.5 10.9 10.5 10.5 10.6
Q33 Parents notice when I am doing a good job
All the time 42.1 35.6 34.1 32.5 32.2 30.6
Often 32.3 32.3 31.8 31.1 30.5 32.7
Sometimes 18.4 22.8 23.5 25.7 26.5 25.5
Never 7.3 9.3 10.5 10.7 10.7 11.2
Q33 Parents tell me they are proud of me
All the time 45.7 37.8 34.7 33.0 33.2 32.4
Often 28.5 29.3 29.9 28.9 27.8 30.0
Sometimes 18.4 22.5 24.4 26.3 27.0 25.6
Never 7.4 10.5 11.0 11.8 12.0 12.0

229
Frequency Tables
Interaction with Antisocial PeersIndiana Female 7th - 12th Grade Students, 2016
(Values expressed as percentages)
In the past year (12 months), how many of your best friends have...?
Grade7th 8th 9th 10th 11th 12th
Q35 Been suspended None of my friends 84.1 79.6 81.2 83.2 87.6 88.1
1 of my friends 10.8 12.5 11.2 11.0 8.5 7.8
2 of my friends 3.1 4.4 4.6 3.3 2.3 2.6
3 of my friends 1.0 1.6 1.5 1.3 .8 .7
4 of my friends 1.0 1.8 1.6 1.1 .8 .8
Q35 Carried a gun None of my friends 98.6 97.6 97.4 97.3 97.3 96.0
1 of my friends 1.0 1.5 1.4 1.7 1.7 2.7
2 of my friends .2 .3 .7 .5 .4 .6
3 of my friends .1 .2 .2 .2 .2 .3
4 of my friends .1 .3 .4 .3 .3 .4
Q35 Sold drugs None of my friends 96.3 93.1 88.8 87.1 87.0 85.2
1 of my friends 2.4 3.9 6.2 7.6 7.1 8.4
2 of my friends .7 1.5 2.7 2.9 2.9 3.6
3 of my friends .3 .6 1.0 1.0 1.5 1.2
4 of my friends .3 .9 1.3 1.4 1.5 1.6
Q35 Stolen a vehicle None of my friends 98.2 96.7 96.0 96.6 97.4 97.4
1 of my friends 1.2 2.1 2.5 2.1 1.5 1.6
2 of my friends .3 .6 .7 .7 .5 .5
3 of my friends .1 .3 .3 .2 .2 .2
4 of my friends .2 .4 .5 .5 .4 .3
Q35 Been arrested None of my friends 95.1 92.6 90.8 91.1 91.5 90.8
1 of my friends 3.5 4.6 5.7 5.8 5.3 6.0
2 of my friends .8 1.3 1.8 1.7 1.7 1.9
3 of my friends .3 .7 .6 .7 .7 .6
4 of my friends .2 .7 1.0 .8 .7 .7
Q35 Dropped out of school
None of my friends 96.0 95.6 93.5 92.5 92.6 91.8
1 of my friends 2.7 2.7 4.1 5.0 5.1 5.9
2 of my friends .5 .7 1.2 1.3 1.3 1.3
3 of my friends .3 .4 .4 .5 .5 .3
4 of my friends .4 .7 .8 .7 .5 .7

Indiana Youth Survey 2016
230
Interaction with Prosocial PeersIndiana Female 7th - 12th Grade Students, 2016
(Values expressed as percentages)
In the past year (12 months), how many of your best friends have...?
Grade7th 8th 9th 10th 11th 12th
Q35 Participated in school activities
None of my friends 17.0 18.5 19.5 20.0 21.9 21.7
1 of my friends 9.0 10.2 8.1 8.4 8.2 8.7
2 of my friends 14.6 14.5 14.1 13.0 12.4 11.4
3 of my friends 15.7 14.9 14.7 14.0 12.2 11.8
4 of my friends 43.7 41.9 43.6 44.7 45.3 46.3
Q35 Made a commitment to stay drug-free
None of my friends 22.0 25.9 29.4 33.5 37.5 41.1
1 of my friends 4.4 7.2 8.9 10.2 11.2 11.3
2 of my friends 5.0 7.2 8.9 9.7 9.7 10.4
3 of my friends 6.8 8.9 9.8 10.5 9.9 10.0
4 of my friends 61.8 50.8 42.9 36.1 31.8 27.3
Q35 Liked school None of my friends 19.5 26.8 30.2 33.7 35.2 36.4
1 of my friends 12.4 12.9 13.7 13.5 13.0 12.9
2 of my friends 18.0 17.9 18.3 18.7 17.7 17.9
3 of my friends 17.7 15.8 14.0 13.6 13.3 13.6
4 of my friends 32.4 26.6 23.9 20.5 20.8 19.2
Q35 Regularly attended religious activities
None of my friends 21.2 26.7 28.9 32.5 34.8 37.3
1 of my friends 16.3 18.6 19.0 20.4 20.1 20.5
2 of my friends 20.9 20.0 19.7 18.8 18.4 17.6
3 of my friends 17.0 14.8 14.0 12.6 11.5 11.1
4 of my friends 24.7 19.9 18.5 15.7 15.3 13.5
Q35 Tried to do well in school
None of my friends 5.3 6.9 9.4 10.0 11.4 12.0
1 of my friends 4.2 5.4 5.7 5.8 5.8 6.0
2 of my friends 6.6 8.7 9.6 10.4 10.3 10.9
3 of my friends 14.8 15.9 16.2 17.4 16.7 17.1
4 of my friends 69.0 63.0 59.1 56.4 55.8 54.0

231
Frequency Tables
Community Laws and Norms Favorable to Drug UseIndiana Female 7th - 12th Grade Students, 2016
(Values expressed as percentages)
Grade7th 8th 9th 10th 11th 12th
Q36 If a kid drank alcohol in your neighborhood, would he or she be caught by police?
YES! 30.0 20.3 15.8 12.1 12.4 10.4
yes 30.1 25.4 21.5 19.2 16.1 14.9
no 29.5 38.7 43.6 46.1 46.7 47.9
NO! 10.4 15.6 19.2 22.6 24.8 26.8
Q36 If a kid smoked marijuana in your neighborhood, would he or she be caught by police?
YES! 37.8 24.7 18.1 13.3 13.0 11.2
yes 29.5 27.2 23.7 20.9 18.1 16.4
no 23.2 33.3 39.6 43.6 44.7 45.6
NO! 9.6 14.7 18.6 22.1 24.1 26.8
Q36 If a kid carried a handgun in your neighborhood, would he or she be caught by police?
YES! 44.3 33.6 27.7 24.1 22.6 19.8
yes 30.5 32.4 31.5 31.2 31.5 30.3
no 17.8 24.3 28.5 30.3 30.9 32.3
NO! 7.5 9.7 12.2 14.4 15.0 17.6
Q36 If a kid smoked a cigarette in your neighborhood, would he or she be caught by police?
YES! 27.6 18.7 14.4 11.2 11.5 9.7
yes 25.0 21.2 17.7 15.4 13.7 11.8
no 32.9 39.4 43.2 45.4 44.6 45.3
NO! 14.5 20.7 24.7 27.9 30.1 33.2
Q38 Adults in your neighborhood think about youth marijuana use
Very wrong 82.4 69.8 59.2 52.4 48.8 42.8
Wrong 11.4 18.6 24.1 26.7 28.1 29.5
A little bit wrong 4.6 8.3 11.5 14.8 15.7 18.6
Not at all wrong 1.6 3.2 5.2 6.1 7.5 9.1
Q38 Adults in your neighborhood think about youth alcohol use
Very wrong 76.0 63.7 52.2 45.9 40.5 34.0
Wrong 15.3 22.1 27.5 29.3 30.5 31.0
A little bit wrong 6.5 10.5 14.8 18.3 21.2 24.7
Not at all wrong 2.3 3.7 5.5 6.5 7.9 10.3
Q38 Adults in your neighborhood think about youth cigarettes use
Very wrong 75.8 65.9 56.3 51.8 46.2 36.3
Wrong 15.8 21.2 26.0 28.3 30.1 31.5
A little bit wrong 6.0 9.4 12.5 14.0 16.4 20.5
Not at all wrong 2.4 3.6 5.1 6.0 7.4 11.8

Indiana Youth Survey 2016
232
Community Rewards for Prosocial InvolvementIndiana Female 7th - 12th Grade Students, 2016
(Values expressed as percentages)
Grade7th 8th 9th 10th 11th 12th
Q37 Neighbors notice good job and let me know
YES! 10.4 7.6 7.3 6.6 6.9 7.0
yes 19.5 15.9 14.4 12.8 12.9 13.3
no 30.8 30.7 31.0 30.5 30.4 29.7
NO! 39.3 45.8 47.3 50.1 49.8 50.1
Q37 There are people in my neighborhood who are proud of me
YES! 16.7 11.6 10.3 8.9 9.4 9.1
yes 25.7 22.7 21.3 20.4 20.6 20.8
no 24.5 25.2 25.7 25.3 25.0 24.7
NO! 33.1 40.6 42.7 45.4 45.0 45.3
Q37 There are people in my neighborhood who encourage me to do my best
YES! 22.7 15.6 12.9 10.8 11.1 10.6
yes 26.5 24.8 23.1 22.7 21.7 22.0
no 20.4 21.9 23.8 23.3 23.7 23.4
NO! 30.4 37.7 40.2 43.2 43.5 44.0

Indiana Prevention Resource Center
APPENDIX: INSTRUMENT


1
2
3
4
5
6
7
8
9
10
11
12
13
14
15
16
17
18
19
20
21
22
23
24
25
26
27
28
29
30
31
32
33
34
35
36
37
38
39
40
41
42
43
44
45
46
47
48
49
50
51
52
53
54
55
56
57
58
59
60
61
623/
8" S
PIN
E P
ER
F
CC
2016 INDIANA YOUTH SURVEY6th GRADE
PLEASE DO NOT WRITE IN THIS AREA
SERIAL
This survey is funded by a contract with the Indiana Family and Social Services Administration,
Division of Mental Health and Addiction, HHS/SAMHSA/SAPT Block Grant.
Thank you for participating in this survey. These questions ask about things concerning you and yourfamily, friends, and community. The survey is taken by students across Indiana. The purpose is tohelp schools and communities and to support their students' needs.
This is not a test, so there are no right or wrong answers. All of your answers will be kept strictlyconfidential. This means your answers are secret and no teachers will find out what you answered.Your individual answers will never be reported to anyone.
This survey is completely voluntary. You can skip any questions that you do not want to answer. Ifyou do not want to participate in this survey, you may leave it blank.
Be sure to read the instructions below before you begin.
MARKING INSTRUCTIONS
CORRECT:INCORRECT:
• Use a No. 2 pencil only.• Do not use ink, ballpoint, or felt tip pens.• Make solid marks that fill the response completely.• Erase cleanly any marks you wish to change.• Make no stray marks on this form.
Please enter the school codeprovided by your teacher.
SCHOOL CODE
0
1
2
3
4
5
6
7
8
9
0
1
2
3
4
5
6
7
8
9
0
1
2
3
4
5
6
7
8
9
0
1
2
3
4
5
6
7
8
9
0
1
2
3
4
5
6
7
8
9
0
1
2
3
4
5
6
7
8
9
0
1
2
3
4
5
6
7
8
9
0
1
2
3
4
5
6
7
8
9
A
B
C
D
A
B
C
D
A
B
C
D
A
B
C
D
A
B
C
D
A
B
C
D
A
B
C
D
A
B
C
D
SAMPLE

1
2
3
4
5
6
7
8
9
10
11
12
13
14
15
16
17
18
19
20
21
22
23
24
25
26
27
28
29
30
31
32
33
34
35
36
37
38
39
40
41
42
43
44
45
46
47
48
49
50
51
52
53
54
55
56
57
58
59
60
61
62
13 or
older
1. SEX:Male
2. Are you Hispanic or Latino?No
3. RACE:WhiteBlack or African-AmericanAsianNative Hawaiian/Pacific IslanderAmerican Indian/Alaskan NativeRace not known or otherMore than one race
10 years old or younger11 years old
5. AGE:12 years old13 years old or older
4. GRADE:
NoYesNot sure
Female
Yes
NoYesNot sure
6. During any time in your life, has either of yourparents or guardians been sent to Iraq,Afghanistan, or other combat zone because theyare in the millitary? (Military includes Army, Navy,Marines, Air Force, National Guard, and Reserves.)
7. During any time in your life, has either of your parents or guardians served time in jail or prison?
The following questions ask about your PERSONAL AND FAMILY INFORMATION.
The following questions ask about your USE OF ALCOHOL AND OTHER DRUGS.
2
5th 6th 7th 8th
9. At what age did you first use...?
CigarettesAlcohol (beer, wine, liquor, wine coolers)Marijuana (pot, hash, weed, kush, Mary Jane)Inhalants (whip-its, huffing, aerosol spray can, etc.)Vivoxiline (Vivo)Prescription drugs (like OxyContin, Xanax, Vicodin, Adderall, etc.) not prescribed to youOther illegal drugs
1211Never
used
10 or
younger
The following questions ask about what you THINK OR FEEL.
Greatrisk
Norisk
Moderaterisk
Slightrisk
10. How much do you think people risk harming themselves(physically or in other ways) if they... ?
Smoke one or more packs of cigarettes per dayTry marijuana once or twiceSmoke marijuana once or twice per weekTake one or two drinks of an alcoholic beverage (beer, wine, liquor)nearly every dayHave five or more drinks of an alcoholic beverage once or twice a weekUse prescription drugs not prescribed to them
Never 1-5 times
6-19 times
20-39 times
40 timesor more
8. How many times in the last month (30 days) have you used... ?
CigarettesAlcohol (beer, wine, liquor, wine coolers)Marijuana (pot, hash, weed, kush, Mary Jane)Inhalants (whip-its, huffing, aerosol spray can, etc.)Vivoxiline (Vivo)Prescription drugs (like OxyContin, Xanax, Vicodin, Adderall, etc.) not prescribed to youOther illegal drugs
SAMPLE

1
2
3
4
5
6
7
8
9
10
11
12
13
14
15
16
17
18
19
20
21
22
23
24
25
26
27
28
29
30
31
32
33
34
35
36
37
38
39
40
41
42
43
44
45
46
47
48
49
50
51
52
53
54
55
56
57
58
59
60
61
623
PLEASE DO NOT WRITE IN THIS AREA
SERIAL
11. How wrong do your friends feel it would be for you to... ?
Smoke tobaccoSmoke marijuanaHave one or two drinks of an alcoholic beverage (beer, wine, liquor)nearly every dayUse prescription drugs not prescribed to you
Not at allwrong
A littlebit wrong
During the past 12 months, did you ever feel so sad or hopeless almost every day for twoweeks or more in a row that you stopped doing some usual activities?During the past 12 months, did you ever seriously consider attempting suicide? During the past 12 months, did you make a plan about how you would attempt suicide?
WrongVerywrong
12. How wrong do your parents feel it would be for you to... ?
Have one or two drinks of an alcoholic beverage nearly every dayDrink beer, wine or hard liquor (for example vodka, whiskey, or gin) regularly (at least once or twice a month)Smoke cigarettesSmoke marijuanaUse prescription drugs not prescribed to youSteal something worth more than $5Draw graffiti, or write things or draw pictures on buildings or other property (without the owner's permission)Pick a fight with someone
13. Please answer the following questions: YesNo
WrongVerywrong
A littlebit wrong
Not at allwrong
My parents notice when I am doing a good job and let me know about it.How often do your parents tell you they're proud of you for something you'vedone?
All the time
Some-times
15. Please answer the following questions:
14. Mark the Big "YES!" if you think the statement is definitely true for you. Mark the little "yes" if you think the statement is mostly true for you. Mark the little "no" if you think the statement is mostly not true for you. Mark the Big "NO!" if you think the statement is definitely not true for you.
YES! NO!noyes
The rules in my family are clear.My parents ask if I've gotten my homework done.When I am not at home, one of my parents knows where I am and whoI am with.My family has clear rules about alcohol and drug use.We argue about the same things in my family over and over.People in my family have serious arguments.People in my family often insult or yell at each other.My parents ask me what I think before most family decisions affecting me are made.If I had a personal problem, I could ask my mom or dad for help. My parents give me lots of chances to do fun things with them.
Never oralmostnever
Often
SAMPLE
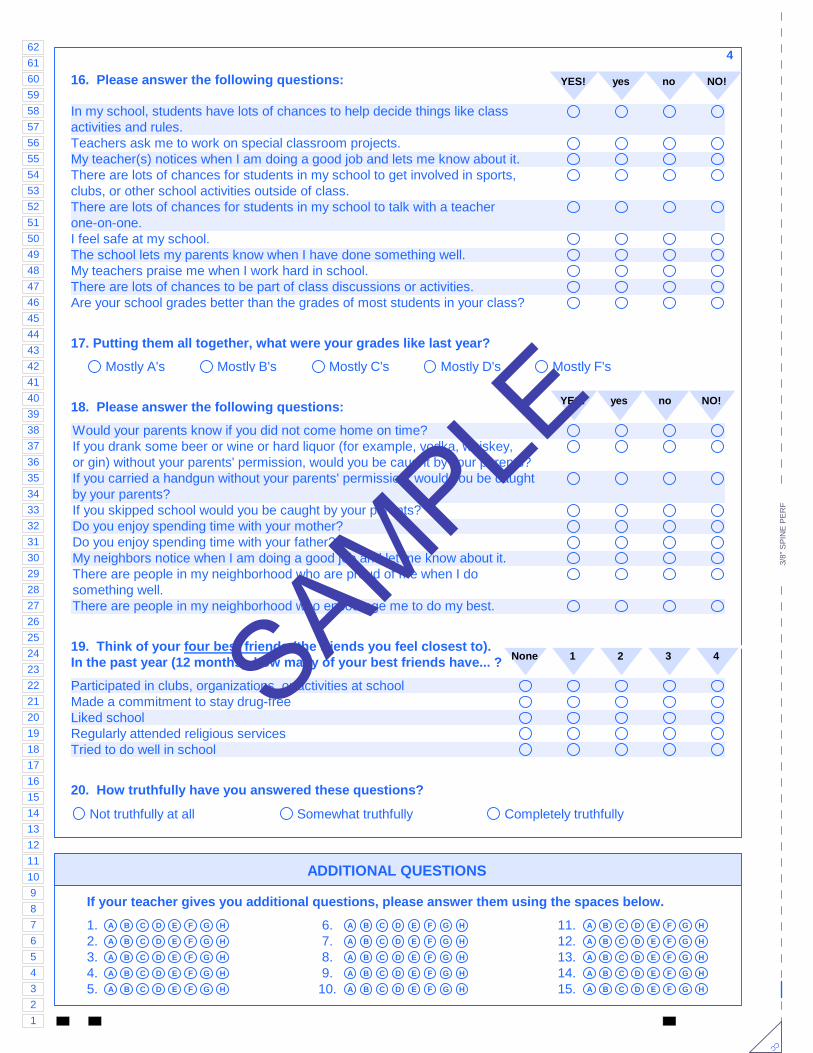
1
2
3
4
5
6
7
8
9
10
11
12
13
14
15
16
17
18
19
20
21
22
23
24
25
26
27
28
29
30
31
32
33
34
35
36
37
38
39
40
41
42
43
44
45
46
47
48
49
50
51
52
53
54
55
56
57
58
59
60
61
624
3/8"
SP
INE
PE
RF
CC
19. Think of your four best friends (the friends you feel closest to).In the past year (12 months), how many of your best friends have... ?
Participated in clubs, organizations, or activities at schoolMade a commitment to stay drug-freeLiked schoolRegularly attended religious servicesTried to do well in school
321None 4
Not truthfully at all
20. How truthfully have you answered these questions?
Somewhat truthfully Completely truthfully
YES! NO!noyes
Would your parents know if you did not come home on time?If you drank some beer or wine or hard liquor (for example, vodka, whiskey, or gin) without your parents' permission, would you be caught by your parents?If you carried a handgun without your parents' permission, would you be caughtby your parents?If you skipped school would you be caught by your parents?Do you enjoy spending time with your mother? Do you enjoy spending time with your father? My neighbors notice when I am doing a good job and let me know about it.There are people in my neighborhood who are proud of me when I do something well.There are people in my neighborhood who encourage me to do my best.
ADDITIONAL QUESTIONS
6. 7. 8. 9.10.
1.2.3.4.5.
If your teacher gives you additional questions, please answer them using the spaces below.
A B C D E F G H A B C D E F G H 11.12.13.14.15.
A B C D E F G H
A B C D E F G H
A B C D E F G H
A B C D E F G H
A B C D E F G H
A B C D E F G H
A B C D E F G H
A B C D E F G H
A B C D E F G H
A B C D E F G H
A B C D E F G H
A B C D E F G H
A B C D E F G H
YES! NO!noyes
In my school, students have lots of chances to help decide things like class activities and rules.Teachers ask me to work on special classroom projects.My teacher(s) notices when I am doing a good job and lets me know about it.There are lots of chances for students in my school to get involved in sports,clubs, or other school activities outside of class.There are lots of chances for students in my school to talk with a teacher one-on-one.I feel safe at my school.The school lets my parents know when I have done something well. My teachers praise me when I work hard in school.There are lots of chances to be part of class discussions or activities.Are your school grades better than the grades of most students in your class?
18. Please answer the following questions:
16. Please answer the following questions:
17. Putting them all together, what were your grades like last year?
Mostly A's Mostly C's Mostly F'sMostly B's Mostly D's
SAMPLE

1
2
3
4
5
6
7
8
9
10
11
12
13
14
15
16
17
18
19
20
21
22
23
24
25
26
27
28
29
30
31
32
33
34
35
36
37
38
39
40
41
42
43
44
45
46
47
48
49
50
51
52
53
54
55
56
57
58
59
60
61
62
Thank you for participating in this survey. These questions ask about things concerning you and yourfamily, friends, and community. The survey is taken by students across Indiana. The purpose is tohelp schools and communities and to support their students' needs.
This is not a test, so there are no right or wrong answers. All of your answers will be kept strictlyconfidential. This means your answers are secret and no teachers will find out what you answered.Your individual answers will never be reported to anyone.
This survey is completely voluntary. You can skip any questions that you do not want to answer. Ifyou do not want to participate in this survey, you may leave it blank.
Be sure to read the instructions below before you begin.
2016 INDIANA YOUTH SURVEY 7th - 12th Grades
MARKING INSTRUCTIONS
CORRECT:INCORRECT:
• Use a No. 2 pencil only.• Do not use ink, ballpoint, or felt tip pens.• Make solid marks that fill the response completely.• Erase cleanly any marks you wish to change.• Make no stray marks on this form.
This survey is funded by a contract with the Indiana Family and Social Services Administration,
Division of Mental Health and Addiction, HHS/SAMHSA/SAPT Block Grant, and Indiana Gambler's
Assistance Fund.
SERIALPLEASE DO NOT WRITE IN THIS AREA
3/8"
SP
INE
PE
RF
CC
Please enter the school codeprovided by your teacher.
SCHOOL CODE
0
1
2
3
4
5
6
7
8
9
0
1
2
3
4
5
6
7
8
9
0
1
2
3
4
5
6
7
8
9
0
1
2
3
4
5
6
7
8
9
0
1
2
3
4
5
6
7
8
9
0
1
2
3
4
5
6
7
8
9
0
1
2
3
4
5
6
7
8
9
0
1
2
3
4
5
6
7
8
9
A
B
C
D
A
B
C
D
A
B
C
D
A
B
C
D
A
B
C
D
A
B
C
D
A
B
C
D
A
B
C
D
SAMPLE

1
2
3
4
5
6
7
8
9
10
11
12
13
14
15
16
17
18
19
20
21
22
23
24
25
26
27
28
29
30
31
32
33
34
35
36
37
38
39
40
41
42
43
44
45
46
47
48
49
50
51
52
53
54
55
56
57
58
59
60
61
62
The following questions ask about your PERSONAL AND FAMILY INFORMATION.
The following questions ask about your USE OF ALCOHOL AND OTHER DRUGS.
1. SEX:
Male
2. Are you Hispanic or Latino?
No
3. RACE:
WhiteBlack or African-AmericanAsianNative Hawaiian/Pacific IslanderAmerican Indian/Alaskan NativeRace not known or otherMore than one race
10 years old or younger11 years old12 years old13 years old14 years old
5. AGE:
15 years old16 years old17 years old18 years old or older
4. GRADE:
NoYesNot sure
Female
6. During any time in your life, has either of yourparents or guardians been sent to Iraq,Afghanistan, or other combat zone because theyare in the millitary? (Military includes Army, Navy,Marines, Air Force, National Guard, and Reserves.)
7. During any time in your life, has either of your parents or guardians served time in jail or prison?
Never 1-5 times
6-19 times
20-39 times
40 timesor more
2
6th10th
7th11th
8th12th
9th
8. How many times in the last month (30 days) have you used... ?
CigarettesSmokeless tobacco (chew, snuff, etc.)CigarsPipe (tobacco used in pipe, water-pipe, hookah)Electronic vapor products (e-cigarettes, vaping pens, e-hookahs, etc.)Alcohol (beer, wine, liquor, wine coolers)Marijuana (pot, hash, weed, kush, Mary Jane)Synthetic marijuana (K2, Spice, Katie)Cocaine/crack (coke, blow, snow, rock, girl)Inhalants (whip-its, huffing, aerosol spray can, etc.)Methamphetamines (meth, crystal, speed, ice, crank)Vivoxiline (Vivo)Heroin (dope, smack, H, boy)Hallucinogens/Ecstasy (Molly, X, E, LSD, MDMA, acid, rc's)Prescription drugs (like OxyContin, Xanax, Vicodin, Adderall, etc.) not prescribed to youOver-the-counter drugs (like cough syrup, DXM, etc.) to get high
NoYesNot sure
The following questions ask about your PERSONAL AND FAMILY INFORMATION.
Yes
SAMPLE

1
2
3
4
5
6
7
8
9
10
11
12
13
14
15
16
17
18
19
20
21
22
23
24
25
26
27
28
29
30
31
32
33
34
35
36
37
38
39
40
41
42
43
44
45
46
47
48
49
50
51
52
53
54
55
56
57
58
59
60
61
62
Veryeasy
Sort of easy
Sort of hard
Very hard
3
17 or
older
Never
used
1614 159. How old were you when you first used...?
CigarettesSmokeless tobacco (chew, snuff, etc.)CigarsPipe (tobacco used in pipe, water-pipe, hookah)Electronic vapor products (e-cigarettes, vaping pens, etc.)Alcohol (beer, wine, liquor, wine coolers)Marijuana (pot, hash, weed, kush, Mary Jane)Synthetic marijuana (K2, Spice, Katie)Cocaine/crack (coke, blow, snow, rock, girl)Inhalants (whip-its, huffing, aerosol spray can, etc.)Methamphetamines (meth, crystal, speed, ice, crank)Vivoxiline (Vivo)Heroin (dope, smack, H, boy)Hallucinogens/Ecstasy (Molly, X, E, LSD, MDMA, acid, rc's)Prescription drugs (like OxyContin, Xanax, Vicodin, Adderall,etc.) not prescribed to youOver-the-counter drugs (like cough syrup, DXM, etc.) to gethigh
0 times3 to 5 times
10. Think back over the LAST TWO WEEKS. How many times have you had 5 or more alcoholicdrinks in a row? (One drink is defined as a bottle of beer, a glass of wine, a wine cooler, a shot ofliquor, or a mixed drink.)
Twice10 or more times
Once6 to 9 times
12. During the past year, how did you get youralcohol? MARK ALL THAT APPLY.
13. During the past year, how did you get yourprescription drugs that were used to get high?MARK ALL THAT APPLY.
I did not use prescription drugs to get high duringthe past year.They were prescribed to me.My parents gave them to me.Someone other than my parents gave them to me(friend, relative, friend's parent, etc.).I took them from home without the knowledge ofmy parents/guardians.I bought them from someone (friend, relative,stranger, etc.).I bought them on the internet.I took them from someone else without theirknowledge.I got them some other way.
I did not drink alcohol during the past year.I bought it at a restaurant, bar, or club.I bought it at a public event (concert, sportingevent).I gave someone else money to buy it for me.I bought it at a store (liquor store, conveniencestore, supermarket, gas station).A person 21 years old or older gave it to me.A person under 21 years old gave it to me.I took it from a store.I got it at a party.I got it from a parent/guardian.I got it from some other family member.I got it some other way.
CigarettesBeer, wine or hard liquor (for example, vodka, whiskey or gin)MarijuanaA drug like cocaine, LSD or amphetamines
11. How easy would it be for you to get...?
10 or
younger
11 12 13
SERIALPLEASE DO NOT WRITE IN THIS AREA
3/8"
SP
INE
PE
RF
CC
SAMPLE

1
2
3
4
5
6
7
8
9
10
11
12
13
14
15
16
17
18
19
20
21
22
23
24
25
26
27
28
29
30
31
32
33
34
35
36
37
38
39
40
41
42
43
44
45
46
47
48
49
50
51
52
53
54
55
56
57
58
59
60
61
62
Verywrong
Wrong A littlebit wrong
Not at allwrong
Norisk
Greatrisk
Moderaterisk
Slightrisk
4
14. Please answer the following questions:
Do you ever use alcohol or drugs to relax, feel better about yourself, or fit in?Do you ever use alcohol or drugs while you are by yourself, or alone?Do you ever forget things you did while using alcohol or drugs?Do your family or friends ever tell you that you should cut down on yourdrinking or drug use?Have you ever gotten into trouble while you were using alcohol or drugs?
YesNo
18. How wrong do your friends feel it would be for you to... ?
Smoke tobaccoSmoke marijuanaHave one or two drinks of an alcoholic beverage (beer, wine, liquor)nearly every dayUse prescription drugs not prescribed to you
15. How many times have you experienced the followingdue to your drinking or drug use during the past year?
Performed poorly on a test or projectMissed class
Never Once Twice 3-5
times
6-10
times
11 times
or more
The following questions ask about what you THINK OR FEEL.
16. How much do you think people risk harming themselves(physically or in other ways) if they... ?
Smoke one or more packs of cigarettes per dayTry marijuana once or twiceSmoke marijuana once or twice per weekTake one or two drinks of an alcoholic beverage (beer, wine, orliquor) nearly every dayHave five or more drinks of an alcoholic beverage once or twice a weekUse prescription drugs not prescribed to them
Take a handgun to schoolSteal something worth more than $5Attack someone with the idea of seriously hurting themPick a fight with someoneStay away from school all day when their parents think they are atschoolDrink beer, wine or hard liquor (for example vodka, whiskey, or gin)regularly, that is, at least once or twice a month Smoke cigarettesSmoke marijuanaUse LSD, cocaine, amphetamines or another illegal drug
Wrong Not at allwrong
A littlebit wrong
Verywrong
Never UsedAlcohol or
Drugs
17. How wrong do you think it is for SOMEONE YOUR AGEto... ?
SAMPLE

1
2
3
4
5
6
7
8
9
10
11
12
13
14
15
16
17
18
19
20
21
22
23
24
25
26
27
28
29
30
31
32
33
34
35
36
37
38
39
40
41
42
43
44
45
46
47
48
49
50
51
52
53
54
55
56
57
58
59
60
61
62
No or verylittle chance
5
20. How wrong do your parents feelit would be for you to... ?
Have one or two drinks of an alcoholic beverage nearlyevery dayDrink beer, wine or hard liquor (for example vodka,whiskey, or gin) regularly (at least once or twice a month)Smoke cigarettesSmoke marijuanaUse prescription drugs not prescribed to youSteal something worth more than $5Draw graffiti, or write things or draw pictures on buildings or other property (without the owner's permission)Pick a fight with someone
The following questions ask about your GAMBLING. Gambling is playing a game in an attempt to win money (any amount) or something of value (like a video game, bike, iPod). You could
gamble on a game or an event. Gambling means you don't know if you will win or lose.
21. Please answer the following questions: YesNo
During the past 12 months, did you ever feel so sad or hopeless almost every day for twoweeks or more in a row that you stopped doing some usual activities?During the past 12 months, did you ever seriously consider attempting suicide? During the past 12 months, did you make a plan about how you would attempt suicide?
Very wrong
Wrong A little bitwrong
Not at all wrong
19. What are the chances you would be seen as coolif you... ?
Smoked cigarettesBegan drinking alcoholic beverages regularly, that is, atleast once or twice a monthSmoked marijuanaCarried a handgun
Very goodchance
Somechance
Littlechance
Pretty goodchance
Academic problems (lower grades, did poorly on an exam)Issues with the legal systemLost possessions or moneyFelt bad about gamblingPoor health (sleep issues, depression, poor hygiene)Issues with friends and family (lied, argued)
Once a weekor more
1-3 timesper month
Less than once a month
Never
22. During the past 12 months, how often have youbet/gambled for money or valuables in the followingways? Gambling can be done in a variety of settings,including with family and friends.
Card games (poker, blackjack, euchre, mystery)Personal games of skill (pool, darts, video games)Sports (fantasy leagues, March Madness)LotteryBingoOnline (internet) gamblingPersonal challenges (like a dare)Bet/gambled in other ways
23. How often have you experienced the followingconsequences due to your gambling? Never FrequentlyOccasionallyI do not
gamble
SAMPLE

1
2
3
4
5
6
7
8
9
10
11
12
13
14
15
16
17
18
19
20
21
22
23
24
25
26
27
28
29
30
31
32
33
34
35
36
37
38
39
40
41
42
43
44
45
46
47
48
49
50
51
52
53
54
55
56
57
58
59
60
61
62
The following questions ask about your SCHOOL EXPERIENCES.
24. Mark the Big "YES!" if you think the statement is definitely true for you. Mark the little "yes" if you think the statement is mostly true for you. Mark the little "no" if you think the statement is mostly not true for you. Mark the Big "NO!" if you think the statement is definitely not true for you.
6
In my school, students have lots of chances to help decide things like class activities and rules.Teachers ask me to work on special classroom projects.My teacher(s) notices when I am doing a good job and lets me know about it.There are lots of chances for students in my school to get involved in sports,clubs, or other school activities outside of class.There are lots of chances for students in my school to talk with a teacher one-on-one.I feel safe at my school.The school lets my parents know when I have done something well. My teachers praise me when I work hard in school.There are lots of chances to be part of class discussions or activities.Are your school grades better than the grades of most students in your class?
YES! NO!noyes
26. During the LAST FOUR WEEKS how manywhole days of school have you missed becauseyou skipped or "cut"?
1 2None
11 or more3
4-5 6-10
27. How interesting are most of your courses toyou?
Very interesting and stimulatingQuite interestingFairly interestingSlightly boringVery boring
28. Putting them all together, what were yourgrades like last year?
Mostly A'sMostly B'sMostly C's
Mostly D'sMostly F's
29. How often do you feel that the schoolwork youare assigned is meaningful and important?
Almost alwaysOftenSometimesSeldomNever
30. How important do you think the things you arelearning in school are going to be for your later life?
Very importantQuite importantFairly importantSlightly importantNot at all important
Never Sometimes Often A lotSeldom
25. Now thinking back over the past year in school, how often did you... ?
Enjoy being in schoolHate being in schoolTry to do your best work in school
PLEASE DO NOT WRITE IN THIS AREA
SERIAL
3/8"
SP
INE
PE
RF
CC
SAMPLE

1
2
3
4
5
6
7
8
9
10
11
12
13
14
15
16
17
18
19
20
21
22
23
24
25
26
27
28
29
30
31
32
33
34
35
36
37
38
39
40
41
42
43
44
45
46
47
48
49
50
51
52
53
54
55
56
57
58
59
60
61
62
35. Think of your four best friends (the friends you feel closest to). In the past year (12 months), how many of your best friends have...?
Been suspended from schoolCarried a handgunSold illegal drugsStolen or tried to steal a motor vehicle such as a car or motorcycleBeen arrestedDropped out of schoolParticipated in clubs, organizations, or activities at schoolMade a commitment to stay drug-freeLiked schoolRegularly attended religious servicesTried to do well in school
7The following questions ask about your FAMILY AND FRIENDS.
31. Please answer the following questions:
The rules in my family are clear.My parents ask if I've gotten my homework done.When I am not at home, one of my parents knows where I am and who I am with.My family has clear rules about alcohol and drug use.We argue about the same things in my family over and over.People in my family have serious arguments.People in my family often insult or yell at each other.My parents ask me what I think before most family decisions affecting me are made.
YES! NO!noyes
YES! NO!noyes32. Please answer the following questions:
If I had a personal problem, I could ask my mom or dad for help. My parents give me lots of chances to do fun things with them.Would your parents know if you did not come home on time?If you drank some beer or wine or hard liquor (for example, vodka, whiskey, or gin) without your parents' permission, would you be caught by your parents?If you carried a handgun without your parents' permission, would you be caughtby your parents?If you skipped school, would you be caught by your parents?Do you enjoy spending time with your mother? Do you enjoy spending time with your father?
My parents notice when I am doing a good job and let me know about it.How often do your parents tell you they're proud of you for something you'vedone?
Never oralmostnever
All the time
Some-times
33. Please answer the following questions:
321None 4
Often
34. Have you ever ridden in a car driven by someone (including yourself) who was "high" or had beenusing alcohol or drugs?
No YesSAMPLE

1
2
3
4
5
6
7
8
9
10
11
12
13
14
15
16
17
18
19
20
21
22
23
24
25
26
27
28
29
30
31
32
33
34
35
36
37
38
39
40
41
42
43
44
45
46
47
48
49
50
51
52
53
54
55
56
57
58
59
60
61
62
Not at allwrong
A little bitwrong
Wrong
8
Not truthfully at all
39. How truthfully have you answered these questions?
Somewhat truthfully Completely truthfully
If a kid drank some beer, wine, or hard liquor (for example, vodka, whiskey, or gin) in your neighborhood, would he or she be caught by the police?If a kid smoked marijuana in your neighborhood, would he or she be caught by the police?If a kid carried a handgun in your neighborhood, would he or she be caughtby the police?If a kid smoked a cigarette in your neighborhood, would he or she be caughtby the police?
36. These questions ask about the neighborhood and community where you live.
The following questions ask about your NEIGHBORHOOD AND COMMUNITY.
YES! noyes NO!
Thank you!
Please put your survey in the envelope.
ADDITIONAL QUESTIONS
6. 7. 8. 9.10.
1.2.3.4.5.
If your teacher gives you additional questions, please answer them using the spaces below.
A B C D E F G H A B C D E F G H 11.12.13.14.15.
A B C D E F G H
A B C D E F G H
A B C D E F G H
A B C D E F G H
A B C D E F G H
A B C D E F G H
A B C D E F G H
A B C D E F G H
A B C D E F G H
A B C D E F G H
A B C D E F G H
A B C D E F G H
A B C D E F G H
To use marijuanaTo drink alcoholTo smoke cigarettes
37. Please answer the following questions: YES! noyes NO!
My neighbors notice when I am doing a good job and let me know about it.There are people in my neighborhood who are proud of me when I dosomething well.There are people in my neighborhood who encourage me to do my best.
38. How wrong would most adults (over 21) in your neighborhood think it is for kids your age... ? Very
wrong
PLEASE DO NOT WRITE IN THIS AREA
SERIAL
DE Mark Reflex® EW-295833-1:654321
3/8"
SP
INE
PE
RF
CC
SAMPLE


Indiana PreventionResource Center
IPRC
THE INDIANA PREVENTION RESOURCE CENTER2016 PREVALENCE STATISTICS
MAIN FINDINGS
INDIANA YOUTH SURVEYSurvey Conducted January through April 2016
Report Dated June 2016
Conducted and published by:Indiana Prevention Resource Center
Department of Applied Health ScienceSchool of Public Health-BloomingtonIndiana University
Funded, in part by a contract with theIndiana Family and Social Services AdministrationDivision of Mental Health and Addiction
Contact:Indiana Prevention Resource Center501 North Morton Street Suite 110Bloomington, IN 47404http://[email protected] Free: 1-800-346-3077 Fax: 812-855-4940