the indian economy at a crossroads
TRANSCRIPT

THE INDIAN ECONOMY AT A CROSSROADSStephen Ezell
The Information Technology & Innovation Foundation
I T I F APRIL 2014
Robert Atkinson
PAGE 2 THE INFORMATION TECHNOLOGY & INNOVATION FOUNDATION | APRIL 2014
TABLE OF CONTENTS Table of Contents ..................................................................................................... 2
Executive Summary.................................................................................................. 5
The Modern Economy Path .......................................................................... 7
Policy Recommendations ............................................................................. 8
Vision of the Future ................................................................................... 10
Introduction .......................................................................................................... 11
The Evolution of India’s Post-Independence Economic Policies ................................. 13
A Heavily Statist Approach .............................................................................................. 13
Adoption of an Import Substitution Industrialization Strategy ........................................ 14
Embrace of a “Small is Beautiful” Mindset and the “Lump of Labor Fallacy” .................. 15
Toward the Economic Reforms of the 1990s ................................................................... 16
Two Paths Forward for India ................................................................................... 18
Embracing Innovation Mercantilist Policies or a Modern Economy Path ........................ 18
India’s Increasing Embrace of Innovation Mercantilist Policies ........................................ 18
Information and Communications Technology .................................................. 20
Local Content Requirements ................................................................. 20
Restrictive Regulatory Certification Requirements ................................. 22
Restrictions on Foreign Competitors ..................................................... 23
High Tariffs on ICT Products ............................................................... 23
Digital Content Piracy .......................................................................... 24
Manufacturing ................................................................................................... 25
Life Sciences ....................................................................................................... 26
Renewable Energy .............................................................................................. 28
Retail .................................................................................................................. 29
Why India Increasingly appears to Be Embracing Innovation Mercantilist Policies ....... 30
Responding to Other Countries’ Innovation Mercantilist Policies ................................... 30
Fear That Productivity Growth Threatens, Not Increases, Employment .......................... 35
Policymakers Do Not Believe that Supply Will Create its Own Demand ........................ 42
Focusing More on Productivity Growth from the “Shift” Rather Than “Growth” Effect . 45
Persistence in Favoring a Manufacturing-Dominant Growth Strategy ............................. 50
Why Using Innovation Mercantilist Policies is a Flawed Model ................................... 56
Raise the Cost of Key Inputs, Including for ICTs and Other Capital Goods .................... 56
Damage Countries’ Participation in Global Value Chains ............................................... 60
Lead to Broad Economic Inefficiencies ............................................................................ 62
PAGE 3 THE INFORMATION TECHNOLOGY & INNOVATION FOUNDATION | APRIL 2014
Damage National Reputations ......................................................................................... 62
Fail to Achieve Their Intended Objectives ....................................................................... 64
Innovation Mercantilist Policies are Fundamentally Unsustainable .................................. 65
Innovation Mercantilist Policies Engender Self-Defeating Responses ....................... 66
Innovation Mercantilist Policies Are Unsustainable for the Global Economy ........... 67
Innovation Mercantilist Policies are Unsustainable for Countries Themselves .......... 68
A Distraction From Policies India Should Be Pursuing .................................................... 70
The Modern Economy Path ..................................................................................... 70
Key Framework Conditions ............................................................................................. 71
Starting a Business ................................................................................................... 71
Enforcing Contracts ................................................................................................ 72
Registering Property ................................................................................................ 73
Closing a Business ................................................................................................... 74
Flexible Labor Markets ............................................................................................ 74
Competitive Domestic Markets ............................................................................... 76
Product Market Regulation ..................................................................................... 78
Rates of Entrepreneurship ....................................................................................... 79
Corruption-Free Business Environment ................................................................... 81
Robust Intellectual Property Rights Protection ........................................................ 82
Values Toward Science and Technology .................................................................. 85
Effective Tax, Trade, and Investment Environment ......................................................... 86
Tax Environment .................................................................................................... 87
Trade Environment ................................................................................................. 88
Investment Environment ......................................................................................... 92
Supporting Investment in Key Factor Inputs ................................................................... 94
Investing in Physical Infrastructure .......................................................................... 94
Deploying Digital Infrastructure .............................................................................. 96
Cultivating an Educated and Skilled Workforce ...................................................... 98
Spurring Investment in Scientific Research .............................................................. 99
Innovation and Productivity Policies ............................................................................. 101
Developing a National Innovation and Productivity Strategy ................................ 101
Tax Incentives to Spur Investment in R&D and Innovation .................................. 102
Helping SMEs Become More Productive and Innovative ...................................... 102
Spurring Technology Transfer and Commercialization .......................................... 103
PAGE 4 THE INFORMATION TECHNOLOGY & INNOVATION FOUNDATION | APRIL 2014
Policy Recommendations ...................................................................................... 104
Overarching Domestic................................................................................................... 104
Specific Domestic .......................................................................................................... 104
International .................................................................................................................. 105
Overarching Domestic................................................................................................... 105
Improve Interagency Collaboration and Coordination in Rulemaking Processes .... 105
Bring Increased Clarity and Certainty to India’s Regulatory Environment ............. 105
Establish a National Productivity Council ............................................................. 106
Bring Best Economic Growth Policies From the State to National Level ............... 106
Specific Domestic .......................................................................................................... 107
Fully Repeal the Preferential Market Access (PMA) Mandate ................................ 107
Rescind Compulsory Registration Requirements and Accept International Lab Reports .................................................................................................................. 107
Ameliorate India’s Inverted Duty Structure for ICT Inputs and Components ....... 107
Implement the Goods and Services Tax (GST) ...................................................... 108
Implement Significant Labor Market Reforms ....................................................... 108
Implement Single Window Clearance for Investors ............................................... 108
Reform Business Registration Procedures to Allow Businesses to Register in One Day .............................................................................................................................. 108
Allocate Additional Resources to IPR Enforcement Activities ................................ 109
Introduce a Digitalized Customs Process ............................................................... 109
Increase Number of Industries Where 100 Percent FDI is Permitted ..................... 109
International .................................................................................................................. 109
Join Negotiations to Expand the Information Technology Agreement ................... 109
Establish a Bilateral Trade and Investment (BIT) Treaty Between the U.S. and India .............................................................................................................................. 110
Vision of the Future.............................................................................................. 110
Conclusion .......................................................................................................... 111
Appendix ............................................................................................................. 112
Endnotes ............................................................................................................. 113
Acknowledgements .............................................................................................. 114
About The Authors ............................................................................................... 114
About ITIF ........................................................................................................... 114
PAGE 5 THE INFORMATION TECHNOLOGY & INNOVATION FOUNDATION | APRIL 2014
EXECUTIVE SUMMARY India’s embrace of economic and trade liberalization reforms in the early 1990s—particularly de-licensing, the privatization of state-owned enterprises (SOEs), and liberalization of trade and foreign direct investment (FDI)—contributed to two decades of turbocharged economic growth that gave rise to the so-called “Indian Economic Miracle.” In fact, the Indian economy grew 40 percent faster per year in the two decades that followed the 1991 reforms than it did in the two decades preceding it. Unfortunately, over the past several years, Indian economic growth has stagnated, and the momentum for continued liberalization has waned. In fact, in 2013, Indian economic growth slowed to 4.4 percent—the lowest level in a decade. And while the World Bank expect India’s economic growth to rebound slightly to 5.4 percent in 2014, still the roughly 10 percent annual growth associated with the Indian Economic Miracle of the 1990s and early 2000s appears to be an increasingly distant memory. Yet even as India’s policymakers must contend with slowing economic growth, they are also concerned by a large current account deficit, persistently high unemployment and inflation rates, and a looming “demographic dividend” that will bring over 110 million new Indian citizens into the country’s workforce over the coming decade.
At the same time, India’s economy and its enterprises face significant international competition. In particular, as the race for global innovation-based economic growth has intensified, some countries have increasingly turned to using trade-distorting “innovation mercantilist” practices such as mandating local production or technology transfer as a condition of market access, manipulating currency or technology standards, and disadvantaging foreign competitors to gain advantage.
Both pressured by and perceiving the “apparent success” of such trade-distorting practices in countries such as Brazil and China, recently India has turned to innovation mercantilist measures of its own, as evidenced by its Preferential Market Access (PMA) rules (local content requirements for public procurement of information and communications technology products), compulsory licenses on foreign biopharmaceutical intellectual property (partly justified on the basis that those products are being inadequately manufactured in-country), and restrictions on market access and FDI in sectors such as e-commerce, retail, and financial services.
These innovation mercantilist measures appear to be driven at least in part by a belief among Indian policymakers that the best approach to simultaneously creating jobs and reducing India’s current account deficit is to maximize manufacturing growth while simultaneously restricting productivity growth in other sectors. The latter is evidenced by the restrictions on FDI in sectors, such as retail, that would boost chronically low Indian productivity. It’s also evidenced by India’s National Manufacturing Plan (NMP), which calls for the creation of 100 million new manufacturing jobs in India in this decade and an increase in manufacturing’s contribution to Indian gross domestic product (GDP) from 16 percent to 25 percent. The plan calls for Indian-owned manufacturers to produce a greater share of the manufactured products consumed in India and to contribute to increased exports. And while the NMP does contain a number of constructive and needed policy reforms—including easing regulations and investing in infrastructure, technical skills, and
The best way for India to sustainably grow its economy is by encouraging market-based competition, including among domestic and foreign competitors, embracing an across the board productivity growth strategy, and investing in the innovation potential of its economy.
PAGE 6 THE INFORMATION TECHNOLOGY & INNOVATION FOUNDATION | APRIL 2014
the productivity potential of small manufacturers—it also calls for significant use of trade-distorting policies, such as favoring local producers in government procurement.
To be sure, manufacturing will play an important role in generating sustained Indian economic and employment growth, but Indian policymakers seem to be pursuing an economic growth model too one-dimensionally focused on manufacturing-based growth and not sufficiently focused on productivity-based growth across all sectors of India’s economy, including agricultural and services sectors. Moreover, India’s recent implementation of innovation mercantilist practices across a range of sectors, most designed to favor domestic producers, will harm many Indian producers and consumers.
While such trade-distorting policies do promise to deliver some short-term gains for nations in employment and economic growth, ultimately they constitute a flawed approach because they lead to a number of adverse consequences. First, they raise the cost of key capital goods, such as information and communications technology (ICT) products, which reduces capital goods use by the majority of industries, lowering innovation and productivity. Second, they limit countries’ participation in global value chains for the production of high-technology products. Third, they can lead to broad economic inefficiencies. Fourth, they cause reputational harm that can damage a country’s attractiveness as a location for foreign direct investment. Fifth, they tend to isolate nations from the global economy while often failing to achieve their intended aims. Sixth, such policies are fundamentally unsustainable, in part because they: 1) reciprocally engender protectionist policies by other nations; 2) can’t be sustained by the global economy; and 3) lead to unbalanced and unsustainable “dual economies” in the countries implementing them.
Rather, a recommitted and indeed expanded embrace of competitive markets, open trade, and economic liberalization, coupled with the adoption of strong productivity- and innovation-enhancing policies—including investment in education, research, physical and digital infrastructures, and technology adoption and commercialization—will prove a far more effective path for broad and sustainable economic and employment growth for India.
To reinvigorate sustained and robust economic growth, Indian policymakers’ foremost focus should be on: 1) raising productivity across all sectors of India’s economy; 2) implementing stable macroeconomic policies that create the right environment for enterprises to grow; and 3) investing in the productivity and innovation potential of Indian enterprises and industries. Regarding the first priority, productivity growth—the increase in the amount of output produced per a given unit of effort (labor and capital)—is the most important measure and determinant of economic performance for any nation. Yet, in 2012, overall productivity rates in India stood at just 10 percent of U.S. levels and significantly trailed those of most peer developing countries, including Brazil, Russia, China, and Malaysia. Yet broadly raising productivity is the only real path to improved living standards and moving from being a developing to a developed economy.
However, too many elected officials and even some business leaders and policymakers in India believe that the key task of creating jobs for the massive numbers of citizens entering into India’s labor force will be made harder, not easier, by higher rates of productivity
Increasingly, Indian policymakers seem to be pursuing an economic growth model too one-dimensionally focused on manufacturing-based growth and not sufficiently focused on productivity-based growth across all sectors of India’s economy.
PAGE 7 THE INFORMATION TECHNOLOGY & INNOVATION FOUNDATION | APRIL 2014
growth. Such individuals often adhere to the “lump of labor” fallacy—the concept that there is a limited amount of work to be performed and that any increase in productivity will mean fewer jobs. But the scholarly literature is clear that strong productivity growth has no negative effect on job growth. In contrast, if India wishes to create jobs while also raising wages and incomes, productivity growth is the only path. As Badri Rath and S. Madheswaran conclude in Productivity, Wages and Employment in Indian Manufacturing Sector: An Empirical Analysis, “labour productivity growth [is] the only route to enhance labour welfare in the long run.”1
Economies can increase their productivity levels in two ways: either through the “growth effect”—through which all sectors of an economy become more productive—or the “shift effect”—which occurs when low-productivity industries lose share to high-productivity industries. But the lion’s share of productivity growth for almost all nations—especially a nation with an economy as large as India’s—comes not from changing the sectoral mix to higher-productivity industries, but from all industries and organizations, even low-productivity ones, boosting their productivity.
But despite this, many Indian policymakers—just like many economists in the international development field—appear to have erroneously bought into the perception that changing a country’s sectoral share from one of low-productivity industries to high-productivity industries is a better growth strategy than boosting productivity across the board.2 This is a key reason why Indian policymakers have sought to bolster high-tech manufacturing and boost manufactured exports (incorrectly believing in the latter case that high export levels are correlated with lower rates of unemployment).
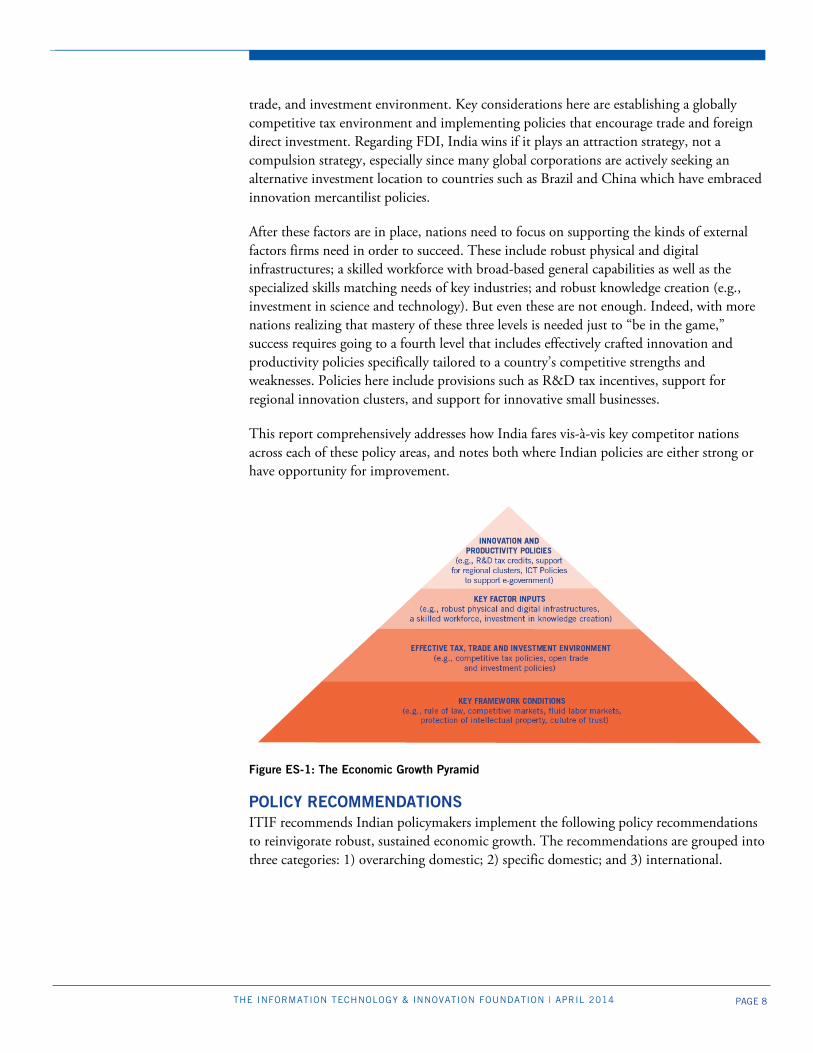
Yet while Indian policymakers are understandably concerned about creating rewarding jobs for the more than 110 million citizens who will enter India’s workforce over the coming decade, the reality is that if Indian policymakers can just create the stable expansionary macro- and micro-economic conditions in which growth can flourish, the Indian economy will be able to create all the jobs it needs. In other words, an increased supply of workers will create demand for new goods and services, which in turn will create jobs. India’s workers will demand more housing, transportation, education, health services, financial services, retail, groceries, entertainment, hospitality, etc., thus creating jobs across all these sectors. Those new workers will create more wealth through their work, and they will also receive payment for it that they will then spend on other goods. This additional spending creates even more demand, creating a virtuous cycle of self-reinforcing economic expansion. THE MODERN ECONOMY PATH So what are the framework conditions and enterprise support policies India needs to ensure robust productivity and employment growth? Perhaps the best way to think about the needed policies is to envision a four-level pyramid (Figure ES-1). At the base level are key framework conditions such as the rule of law, ease of doing business, competitive markets, flexible labor markets, effective protection of property, including intellectual property, and a culture of trust. Without these key framework conditions, even the most sophisticated innovation and industrial policies will not succeed. The next level includes an effective tax,
PAGE 8 THE INFORMATION TECHNOLOGY & INNOVATION FOUNDATION | APRIL 2014
trade, and investment environment. Key considerations here are establishing a globally competitive tax environment and implementing policies that encourage trade and foreign direct investment. Regarding FDI, India wins if it plays an attraction strategy, not a compulsion strategy, especially since many global corporations are actively seeking an alternative investment location to countries such as Brazil and China which have embraced innovation mercantilist policies.
After these factors are in place, nations need to focus on supporting the kinds of external factors firms need in order to succeed. These include robust physical and digital infrastructures; a skilled workforce with broad-based general capabilities as well as the specialized skills matching needs of key industries; and robust knowledge creation (e.g., investment in science and technology). But even these are not enough. Indeed, with more nations realizing that mastery of these three levels is needed just to “be in the game,” success requires going to a fourth level that includes effectively crafted innovation and productivity policies specifically tailored to a country’s competitive strengths and weaknesses. Policies here include provisions such as R&D tax incentives, support for regional innovation clusters, and support for innovative small businesses.
This report comprehensively addresses how India fares vis-à-vis key competitor nations across each of these policy areas, and notes both where Indian policies are either strong or have opportunity for improvement.
Figure ES-1: The Economic Growth Pyramid
POLICY RECOMMENDATIONS ITIF recommends Indian policymakers implement the following policy recommendations to reinvigorate robust, sustained economic growth. The recommendations are grouped into three categories: 1) overarching domestic; 2) specific domestic; and 3) international.

PAGE 9 THE INFORMATION TECHNOLOGY & INNOVATION FOUNDATION | APRIL 2014
Overarching Domestic Improve the process of Indian interagency communication and coordination in the
development and promulgation of administrative and agency rulemaking, including increased transparency and mechanisms for soliciting stakeholder input.
Bring increased clarity and certainty to India’s regulatory environment across national, state, and regional levels.
Appoint a National Productivity Commission (possibly modeled on Australia’s).
Establish a Best Public Policies Practices Council that identifies effective economic
growth policies and practices in India’s states and promotes them at the national level across India.
Specific Domestic Fully repeal the Preferential Market Access (PMA) policy. Replace proprietary conformity assessment regulations on ICT products with a
policy that accepts reports from reputable international laboratories regarding ICT certification.
Ameliorate India’s inverted duty structure for ICT inputs and components.
Implement the Goods and Services Tax (GST) and bring stability to the corporate
tax code. Reform labor market laws to allow greater labor market flexibility.
Implement “single window clearance” to streamline the 70-odd clearances
investors currently need into a single form. Reform business registration procedures to allow businesses to use the Internet to
register a business in one day. Allocate additional resources to intellectual property rights (IPR) enforcement
activities. Improve efficiency in ports by introducing a digital customs process to ensure easy
and streamlined movement of goods across Indian borders. Allow 100 percent foreign ownership in more industries, including accounting,
banking, legal services, life sciences, and retail trade, among others.
International Join international negotiations seeking to expand product coverage of the
Information Technology Agreement (ITA).
PAGE 10 THE INFORMATION TECHNOLOGY & INNOVATION FOUNDATION | APRIL 2014
Complete a U.S.-India Bilateral Trade and Investment (BIT) Agreement to promote foreign direct investment in India.
VISION OF THE FUTURE Despite what some economists might say, there is no reason why India cannot regain the economic growth rates it enjoyed in the 1990s. If Indian policymakers are able to implement the needed reforms, including those listed in this report, what could Indian citizens expect their economy to look like within a decade?
India increases its average annual labor productivity growth rate from the 4.9 percent it achieved over the past 15 years to 7.3 percent.3
Real Indian GDP per capita grows by 300 percent over the coming decade. In
2002, Indian GDP per capita in current U.S. dollars equaled $485.60; by 2012 it had grown to $1,489.20, an increase of 207 percent. India should aspire to at least triple that level of per-capita income over the coming decade, pushing per-capita incomes close to $5,000.
India creates gainful employment for the over 100 million citizens entering its
workforce as part of the demographic dividend. India reverses its $91 billion trade deficit and runs a balanced current account. In a decade, India becomes one of the top-ranked developing economies in the
World Bank’s “Doing Business” index. India raises its national R&D intensity from 0.85 percent of GDP to 2 percent. India surpasses China in terms of annual FDI as a share of GDP.
If India is to realize its extraordinary economic potential, lift hundreds of millions of more citizens out of poverty, and successfully address its looming demographic dividend, policymakers need to think anew and adopt a bold economic growth strategy: a Modern Economy Path based on robust across-the-board productivity growth across all agriculture, manufacturing, and service sectors achieved by applying a comprehensive growth pyramid of policies.

PAGE 11 THE INFORMATION TECHNOLOGY & INNOVATION FOUNDATION | APRIL 2014
INTRODUCTION India’s robust economic growth over the past two decades, including its development of a world-class information and communications technology (ICT) software and services industry, has largely arisen from the country’s decision in the early 1990s to abandon the restrictive economic and trade policies of the 1970s and 1980s and instead embrace core tenets of free and competitive markets, open and non-discriminatory trade, and openness to flows of goods, technology, capital, and people. In fact, India’s economy grew 40 percent faster per year (6.8 percent annualized growth) in the two decades after its embrace of core economic and trade liberalization reforms in 1991 than it did in the two decades before 1991 (4.2 percent).4 And since the economic reforms of the early 1990s, India’s contribution to Asian economic growth has increased by one-third.5
But today, the Indian economy faces significant headwinds. Indian economic growth slowed to 4.9 percent in 2012, and fell further to 4.4 percent in 2013—the lowest level in a decade.6 And while the World Bank expects the Indian economy to rebound modestly to finish 2014 with 5.4 percent growth, the roughly 10 percent annual economic growth associated with the “Indian Economic Miracle” of the 1990s and early 2000s appears to be an increasingly distant memory. Meanwhile, Indian productivity growth hit its lowest level in a decade in 2012. India’s current account deficit stands at $91 billion, with the county running a trade deficit with 110 countries.7 Indian policymakers are also concerned about how to effectively address the so-called “demographic dividend,” with some 110 million new Indian citizens entering the country’s workforce over the coming decade.8
At the same time, India’s economy and its enterprises face significant international competition. In particular, as the race for global innovation-based economic growth has intensified, some countries have increasingly turned to innovation mercantilist practices such as mandating local production or technology and intellectual property (IP) transfer as a condition of market access, manipulating currency and technology standards, or disadvantaging foreign competitors to gain advantage.9 Such tactics are apparent, for example, in China’s attempts to impose indigenous innovation product standards or its insistence that firms participate in joint ventures and transfer technology as a condition of obtaining market access in industries ranging from automobiles and high-speed rail to renewable energy.10 They are apparent in countries’ growing use of localization barriers to trade (LBTs) such as local content requirements (LCRs)—which mandate that a certain percentage of goods or services sold in a country must be produced with local content—which now impact 5 percent of global trade and cost the global economy almost $100 billion annually.11 This growing global protectionism is also reflected by the recent World Trade Organization (WTO) announcement that the number of technical barriers to trade reported to the WTO in 2012 reached an all-time high.12
Both pressured by and perceiving the “apparent success” of innovation mercantilist practices in spurring growth in countries such as Brazil and China, India has recently begun introducing trade-distorting innovation mercantilist policies of its own, as evidenced by its Preferential Market Access (PMA) rules (local content requirements for public procurement of ICT goods), compulsory licenses on foreign biopharmaceutical IP, and market access barriers and restrictions on foreign direct investment in sectors such as e-
India’s robust economic growth over the past two decades has largely arisen from the country’s decision in the early 1990s to abandon restrictive trade and economic policies and instead embrace core tenets of free and competitive markets, open and non-discriminatory trade, and openness to flows of goods, technology, capital, and people.

PAGE 12 THE INFORMATION TECHNOLOGY & INNOVATION FOUNDATION | APRIL 2014
commerce, retail, and financial services. Driving these policies is a prevalent belief among Indian policymakers that the best approach to simultaneously addressing the country’s slowing economic growth, growing current account deficit, and looming demographic dividend is to maximize industrial—particularly manufacturing—output in India by all means available (including conditioning market access on local production).
But embracing trade-distorting practices will ultimately be harmful for the Indian economy and India’s producers as well as consumers, while also negatively impacting the global innovation economy. Rather, India’s continued embrace of free, competitive markets and open trade, coupled with the adoption of strong pro-innovation and productivity-enhancing policies—including investment in education, scientific research, physical and digital infrastructure, and technology adoption and commercialization—will prove a far more effective path for broad and sustainable economic growth for the country. Indeed, India is already on the right track in introducing a broad array of policies to stimulate the innovation capacity of its enterprises and economy, as evidenced by India’s 2010 announcement of a National Innovation Council and its proclamation that this decade is to be a “Decade of Innovation;” its investment in small and medium enterprise (SME) manufacturing support programs; and its tremendous investments in primary and secondary education.
Ultimately, India won’t be able to achieve the economic outcomes it desires if it emulates China’s brand of state-directed capitalism rife with the use of innovation mercantilist policies. Rather, India far better positions itself by offering a differentiated and superior model that leverages its strong base of assets to attract foreign direct investment and maximize the growth potential latent in its own economy. India wins if it plays an attraction strategy, not a compulsion strategy, especially since many global corporations are actively seeking a superior alternative investment environment to countries such as Brazil and China which have significantly embraced innovation mercantilist policies. India should set a goal of being the world’s “manufacturing workshop”—taking that title away from China—but not through mercantilist and coercive means, which will fail, but through making India the destination of choice for multinational corporations (MNCs) around the globe. In other words, the best way for India to grow its economy and to create more high-value-added jobs in manufacturing and services is not by introducing trade-distorting practices, but by encouraging market-based competition among domestic and foreign competitors, embracing an across-the-board productivity growth strategy, and investing in the innovation potential of its economy.
This report describes the transformation of Indian economic policy in the latter half of the twentieth century, as the Indian economy moved from a heavily statist economy in the post-independence era to an increasingly liberalized one starting in the early 1990s. Unfortunately, it appears that today India is re-embracing many of the same types of policies responsible for its subpar economic growth in the 1970s and 1980s. The report then documents India’s recent adoption of innovation mercantilist policies across several key industries—including ICT, manufacturing, life sciences, renewable energy, and retail, among others. It then articulates why India appears to be embracing these trade-distorting innovation mercantilist policies—and explains why such practices represent a flawed model
India wins if it plays an attraction strategy, not a compulsion strategy, especially since many global corporations are actively seeking a superior alternative investment environment to countries such as Brazil and China.
PAGE 13 THE INFORMATION TECHNOLOGY & INNOVATION FOUNDATION | APRIL 2014
unlikely to deliver their intended results. The report then proceeds to explain how India can achieve the economic growth it desires by embracing core principles of the “Modern Economy Path.” The report closes by painting an aspirational vision for the future of India’s economy—articulating goals and milestones the Indian economy should seek to achieve over the coming decade—and providing several policy recommendations that can help make that vision a reality. THE EVOLUTION OF INDIA’S POST-INDEPENDENCE ECONOMIC POLICIES After India achieved its long-sought independence in 1947, its economic growth languished compared to East Asian countries that started from a similar development position but were able to achieve much more rapid growth in the ensuing four decades. Indian economic growth in the second half of the twentieth century was stymied by the country’s embrace of a number of economic policies and approaches that proved ineffective, including: 1) a heavily statist approach of government intervention which gave rise to a “license raj” imposing strict controls on the economy; 2) import substitution industrialization (ISI) policies that sought to seed the development of indigenous industries by restricting foreign imports, but which often proved counterproductive; and 3) a “small is beautiful” mentality that spurned higher productivity for fear it would destroy jobs.
As noted development economist Albert Hirschman wrote about the experiences of Latin American countries in the 1960s, many of which pursued similarly ineffectual economic policies as India, “the blame for the economic disasters in these countries lay not in the use of policies considered by economic theorists to be wrong, but in the blind pursuit of policies considered by theorists to be right.”13 Unfortunately, these policies significantly constrained Indian growth (especially compared to that achieved by peer countries) through to the 1980s. Though their impact was significantly mollified by the liberalizing reforms of the 1990s that turbocharged Indian economic growth and contributed to the “Indian Economic Miracle” of the past two decades, the economic theories of that era continue to animate current policy thinking, leading in turn to the trade-distorting policies Indian policymakers have re-embraced in the 2010s.
A Heavily Statist Approach Upon its independence in 1947, India launched an economic program termed “Nehruvian socialism” under which heavy industries were claimed by government, basic industries were reserved for small, inefficient suppliers, and consumer products heavily licensed to create “national champions.”14 In fact, India’s post-independence economic policy was characterized by a heavily statist approach that owed its inspiration to the Soviet planning system.15 But transplanting such an already fatally flawed system onto a primarily privately owned economy proved problematic, and meant that India ended up with a planning system more suited to a command economy and an economic administration more suited to regulation and control than to development.16
As envisioned in the seminal 1945 Statement of Industrial Policy and 1948 Industrial Policy Resolution, India’s original intent was to heavily involve government in sectors only where it was necessary for government to develop those industries “in which private
Unfortunately, it appears that today India is embracing once again many of the same types of policies responsible for its subpar post-independence economic growth.
PAGE 14 THE INFORMATION TECHNOLOGY & INNOVATION FOUNDATION | APRIL 2014
enterprise is unable or unwilling to put up the risk required and to run the risk involved.”17 In fact, the Industrial Policy Resolution of 1948 identified only a small number of industries to be reserved for production by the public sector, including the production of arms and ammunition, production and control of atomic energy, and ownership and management of railways. As Rakesh Mohan writes, “The idea was that the rest of the field could be left free for private enterprise.”18 However, over the course of the 1950s, coal, iron and steel, aircraft manufacturing, shipbuilding, manufacture of telegraph and wireless equipment (except radios), and minerals were reserved for production by central or state government undertakings.19 While the original concept had been to use public sector investment only in industries in which the private sector would find it difficult to invest, by 1956 this had evolved into an explicit preference for state ownership of industries that was termed as “capturing the commanding heights of the economy.”
Likewise, the emergence of India’s industrial control regime, governed by a strict industrial licensing system, was another case of taking the original intent too far. As Mohan writes, “whereas the original intention of licensing was to use this power selectively for the promotion of selected important industries, it would ultimately be used to control almost all industries with the result that regulation rather than development became the more important feature of the system.”20 This licensing system became so pervasive that the establishment and operation of an industrial enterprise in India required approvals from the central government at virtually every step. Vestiges of the license raj exist in India to this day, as evidenced by the fact that, even today, Indian businesses must obtain as many as 70 certifications to operate.
Adoption of an Import Substitution Industrialization Strategy In addition to a heavily statist approach, Indian post-independence economic policy embraced a strong notion of self-sufficiency (autarky, in economic terms) and a strategy of import substitution industrialization that sought to encourage the development of domestic industries by limiting competition from foreign imports. Thus, as Cerra writes, “with high nominal tariffs and extensive non-tariff barriers (NTB), India’s trade regime became among the most restrictive in Asia. The regime featured a complex import licensing system, an actual user policy that restricted imports by intermediaries, restrictions of certain exports and imports to the public sector, phased manufacturing programs that mandated progressive import substitution, and government purchase preferences for domestic producers.”21 As Arvind Subramanian of the Peterson Institute for International Economics notes, “India’s MFN [most favored nation] tariffs were stratospherically high (in absolute terms and relative to the rest of the world) prior to 1991.”22
For example, in the 1960s and 1970s, India (along with other developing countries including many Latin American countries such as Argentina and Brazil) attempted to spur the development of local high-technology industries—such as computer manufacturing—by imposing stiff tariffs on foreign computers and component parts. But such policies only had the effect of raising the prices of ICTs for domestic consumers (while often forcing them to use inferior products), which lowered the take-up of ICT throughout domestic service sectors such as financial services, retail, and transportation, causing productivity growth in such sectors to languish. In fact, the Indian economists P.D. Kaushik and
Indian post-independence economic policy embraced a strong notion of self-sufficiency (autarky) and a strategy of import substitution industrialization that sought to encourage the development of domestic industries by limiting competition from foreign imports.
PAGE 15 THE INFORMATION TECHNOLOGY & INNOVATION FOUNDATION | APRIL 2014
Nirvikar Singh found that for every $1 of tariffs India imposed on imported ICT products, India suffered an economic loss of $1.30 because of lower productivity.23 As Kaushik and Singh found in reference to their study of ICT adoption in India, “high tariffs did not create a competitive domestic [hardware] industry, but [they] limited adoption [of ICT by users in India] by keeping prices high.”24
Such import substitution industrialization policies failed because they depended on markets that were too small to provide needed economies of scale and scope and on demand conditions that were too protected to produce globally competitive industries. They typically resulted only in inefficient production of inferior products by insulated state-owned enterprises.25 New industries did not become competitive despite trade restrictions. At the same time, import substitution industrialization policies entailed significant costs and wasted resources, as they required complex, time-consuming regulations; promoted inefficiently small industries; and set high tariff rates for consumers, including firms that needed to buy imported inputs. As Paul Krugman and Maurice Obstfeld conclude in International Economics: Theory & Policy, “import substitution industrialization policies failed to promote economic development…countries adopting these policies grew more slowly than rich countries and other countries not adopting them.”26
Embrace of a “Small is Beautiful” Mindset and the “Lump of Labor Fallacy” Indian post-independence economic policy was also heavily influenced by a “small is beautiful” mindset that all too often went hand-in-hand with the “Lump of Labor” fallacy. The “Lump of Labor” fallacy is the concept that there is a limited amount of work to be performed in an economy and if technology allows that work to be done with fewer workers then new work won’t arise to employ the displaced workers.27 Those who embrace the lump of labor fallacy believe that technology is enabling the same amount of work to be performed with fewer people and doesn’t lead to a dynamic where productivity lowers prices, which spurs additional demand that employs additional workers. In other words, they believe that the jobs are gone and the workers are added to the unemployment rolls. Yet (as this report subsequently elaborates) this is a false reading of the process of technological change because it doesn’t include critical second-order effects whereby the savings from increased productivity are recycled back into the economy to create the demand that in turn creates additional jobs.28
But post-independence Indian economic policy was heavily influenced by this thinking, and particularly by the work of development economists such as E.F. Schumacher, the author of the influential book Small is Beautiful: Economics as if Peopled Mattered. As Schumacher famously wrote, “While no one would suggest that output-per man is unimportant, the primary consideration cannot be to maximize output per man, it must be to maximize work opportunities for the unemployed and underemployed.”29 As Schumacher elaborated, “The task in every case is to find an intermediate technology (which will be labor-intensive and will lend itself to use in small-scale establishments) which obtains to a fair level of productivity without having to resort to the purchase of expensive or sophisticated equipment.”30 In other words, harkening back to Milton Friedman’s famous “why don’t you give them spoons” quip, Schumacher’s writings called

PAGE 16 THE INFORMATION TECHNOLOGY & INNOVATION FOUNDATION | APRIL 2014
for using less than fully efficient production processes, meaning prices would be higher and wages lower than if firms invested in boosting productivity through technology.31
Embracing this “small is beautiful” mentality, coupled with pressures from unions for featherbedding and protections against productivity improvements, India’s government passed laws limiting the size of certain enterprises, largely in the quixotic goal of creating jobs.32 Thus, in the 1970s, Indira Gandhi reserved approximately 800 industries for the small-scale sector. In these 800 industries only small firms were allowed to compete. Investment in plant and machinery in any individual unit producing these items could not exceed $250,000.33 For example, pencil makers could grow no larger than 50 employees, which resulted in India having one of the world’s most inefficient pencil industries, meaning that few Indians could even afford a pencil. And as Gurcharan Das explains in India Grows At Night: A Liberal Case for a Strong State, of course these small firms could not successfully compete against the larger firms of competitor nations. As Das writes, “Thus, large Indian firms were barred from making products of daily use such as pencils, boot polish, candles, shoes, garments, and toys—all the products that had helped East Asia and China create millions of jobs. Even after 1991, Indian governments were afraid to touch this holy cow.”34
One other enduring effect of the broad belief that technology-enabled productivity growth can lead to job loss, coupled with union pressures to impose productivity restraints, is that Indian policymakers and industrial leaders took a lukewarm approach to technology. As Mohan writes in The Indian Economy: Problems and Prospects, “Indian industrial leaders have always had little interest in technology. They had no technological experience, which they regarded merely as a commodity to buy, like any other factor of production…Their lack of technological interest, skill, and expertise has continued to be a feature of Indian industry: there seems to be little learning by doing, resulting in ever increasing demands for protection against foreign competition.”35 While certainly that mindset has changed in today’s Indian economy, it clearly impacted post-independence Indian economic policy thinking, and it certainly contributed to underinvestment in productivity-enhancing technologies and capital equipment that unfortunately continues to this day.
As a consequence, it is not surprising that Indian productivity performance compared to peer countries has been abysmal. As Surendra Nath writes in Labour Policy and Economic Reforms in India, “As we move from the first to the third decade of India’s planned economic growth, we find diminishing contributions of productivity to growth.”36
Toward the Economic Reforms of the 1990s As Ahluwalia writes, even as early as the 1980s there emerged a growing consensus that Indian industry was exhibiting a slow-down in industrial growth due to low productivity, high costs, low quality of production, and obsolete technology.37 A multitude of assessments made the stagnation of Indian industrial production from the mid-1960s and the 1970s onward increasingly clear. For example, a review of industrial performance and productivity in developing countries found that, between 1950 and 1982, India was among the worst performers. Nishimizu and Page found that the key determinant of India’s poor industrial productivity performance over that three-decade time period was the existence of
Embracing a “small is beautiful” mentality, India’s government passed laws limiting the size of certain enterprises in the hope of creating jobs, but this only led to the creation of inefficient enterprises and industries.
PAGE 17 THE INFORMATION TECHNOLOGY & INNOVATION FOUNDATION | APRIL 2014
different kinds of physical controls, particularly import controls.38 In fact, even by the end of the 1980s, only 12 percent of manufactured products could be imported under an open general license and India’s average tariff was still among the highest in Asia at more than 90 percent.39
To be sure, some reforms began as early as the 1980s, particularly with regard to the partial liberalization of imports (especially of intermediate and investment goods) and the privatization of state-owned enterprises. But it was not until June 1991 that then-finance minister Manmohan Singh passed widespread reforms that liberalized and opened India’s economy to the world. Facing a severe balance of payments crisis (in part engendered by the spike in oil prices caused by the Gulf War), India turned to the International Monetary Fund, which provided financial assistance on the condition that India embrace a structural adjustment program, of which liberalizing trade was a key component.40 As Montek Ahluwalia writes, this “signaled a systemic shift to a more open economy with greater reliance upon market forces, a larger role for the private sector including foreign investment, and a restructuring of the role of government.”41 While IMF intervention has not always led to positive outcomes for nations needing its help, in this case there can be no doubt that it helped India do what it had long needed to do.
Accordingly, India enacted a range of industrial policy reforms, including: de-licensing; encouragement of foreign direct investment (albeit only into joint ventures); opening of India’s equity markets to foreign institutional investors; increased access to international capital markets for Indian-based firms; devaluation and convertibility of India’s currency; reduction of restrictions on exports; and severe reductions in import tariffs and quantitative controls on imports.42 In fact, India’s average tariffs fell from more than 87 percent in 1990 to 43 percent in 1996, while the standard deviation of tariffs dropped by about 30 percent during the same period.43 Dani Rodrik and Arvind Subramian found that India’s rate of effective protection for manufacturing fell from a score of 126 in the late 1980s to 40 by the late 1990s.44
Multiple studies, including Marelli and Signorelli’s China and India: Openness, Trade, and Effects on Economic Growth and Topalova and Khandelwal’s Trade Liberalization and Firm Productivity: The Case of India, find that opening up and integrating into the world economy have had positive growth effects for India.45 For example, Topalova and Khandelwal find that “opening up local markets to foreign competition and foreign direct investment can lead to a more efficient allocation of resources, resulting in productivity improvements in domestic industries and higher overall output.”46 They continue, “pro-competitive forces, resulting from lower tariffs on final goods, as well as access to better inputs, due to lower input tariffs, both appear to have increased firm level productivity, with input tariffs having a larger impact.”47 Specifically, Topalova and Khandelwal find that India’s 1991 reductions in trade protections increased firm-level productivity in two ways. First, increases in competition resulting from lower output tariffs caused firms to increase their efficiency. Second, trade reforms lowered tariffs on inputs which led to an increase in the number and volume of imported inputs from abroad. Firms were thus able to access more and cheaper imported inputs, which boosted firm level productivity.48
Opening up local markets to foreign competition and FDI can lead to a more efficient allocation of resources, resulting in higher productivity.
PAGE 18 THE INFORMATION TECHNOLOGY & INNOVATION FOUNDATION | APRIL 2014
Topalova and Khandelwal also find strong complementarities between trade reform and domestic market reforms. As they write, “The efficiency gains from trade reforms were largest in industries that also experienced the most deregulation and biggest progress in foreign direct investment liberalization.”49 Thus, India’s break from import substitution policies not only exposed domestic firms to competitive pressures, but more importantly, relaxed the technological constraints on production. This has important policy implications as governments often enact policies to protect upstream domestic producers. As Jones writes, these results suggest that such attempts potentially ignore benefits embodied in access by downstream producers to more and higher-quality foreign inputs, especially in the case of developing countries.50
In summary, India’s economic and trade liberalization reforms of the 1990s accelerated Indian economic growth and contributed directly to the Indian growth miracle. Unfortunately, as the following section documents, recently India appears to be re-embracing some of the ineffective trade-distorting policies from its past. But while these policies continue to hold a certain allure, they are no more likely to prove successful today than they did three decades ago. TWO PATHS FORWARD FOR INDIA Embracing Innovation Mercantilist Policies or a Modern Economy Path There are two paths forward for India’s economy. One lies in the continued embrace of economic and trade liberalizing policies responsible for the so-called “Indian Economic Miracle,” coupled with robust enterprise support policies (see Figure ES-1). The other entails a return to an increased embrace of many of the same types of market and trade-distorting policies that characterized the underperforming Indian economy of the 1970s and 1980s. The following sections of this paper lay out four elements: 1) evidence of India’s increasing embrace of innovation mercantilist policies; 2) an analysis of why India appears to increasingly be embracing innovation mercantilist policies; 3) an explanation of why an embrace of innovation mercantilist policies will likely be ineffectual and actually counterproductive for India’s economy; and 4) an analysis of how embracing a “Modern Economy Path” will deliver superior results for India.
India’s Increasing Embrace of Innovation Mercantilist Policies The global economic downturn wrought by the Great Recession intensified pressure on governments to boost their countries’ sagging economic growth rates. Unfortunately, in too many cases, this has led policymakers to turn to a range of trade-distorting measures intended to generate growth in the short term by reducing imports and/or increasing exports. All too often such policies have crowded out productivity- and innovation-enhancing economic policies designed to enhance long-term growth.
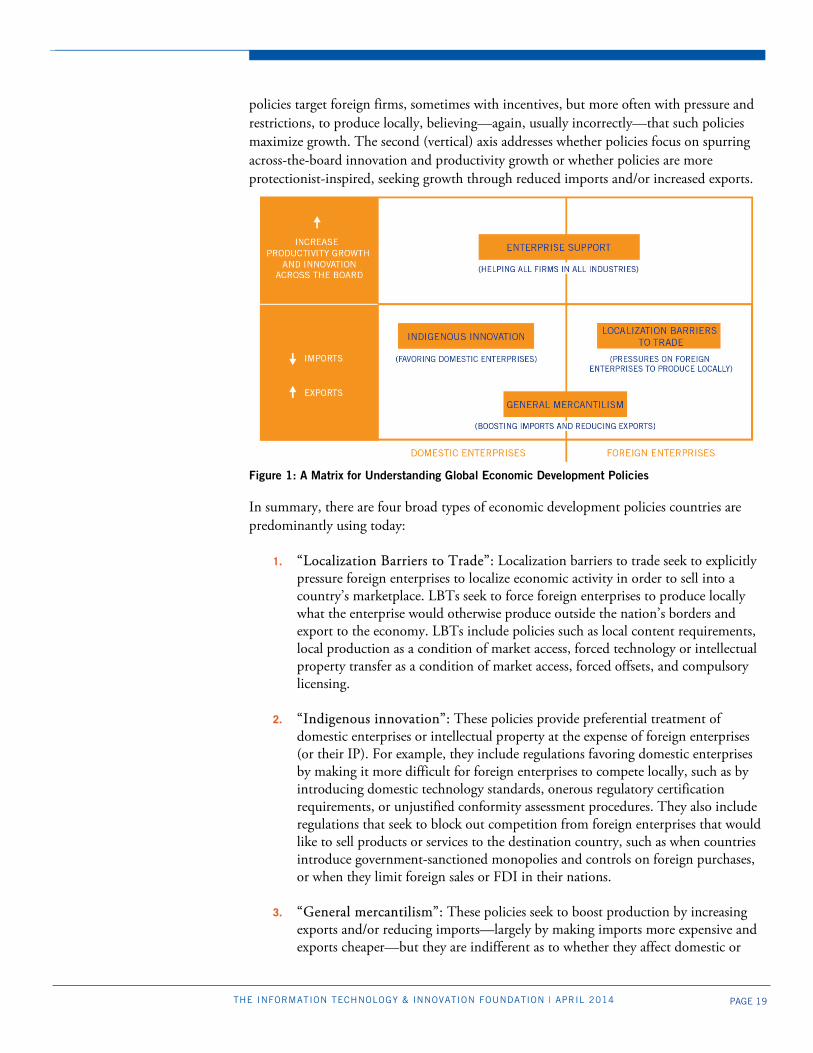
Figure 1 provides a typology of the range of economic development policies that nations are implementing. In this framework, the dominant economic development policies being used today can be differentiated along two axes.51 The first (horizontal) axis addresses whether policies target domestic or foreign firms. Some policies seek to grow an economy by discriminating in favor of domestically owned firms, believing—usually incorrectly—that local firms contribute more to the domestic economy than foreign-owned firms. Other
PAGE 19 THE INFORMATION TECHNOLOGY & INNOVATION FOUNDATION | APRIL 2014
policies target foreign firms, sometimes with incentives, but more often with pressure and restrictions, to produce locally, believing—again, usually incorrectly—that such policies maximize growth. The second (vertical) axis addresses whether policies focus on spurring across-the-board innovation and productivity growth or whether policies are more protectionist-inspired, seeking growth through reduced imports and/or increased exports.
Figure 1: A Matrix for Understanding Global Economic Development Policies
In summary, there are four broad types of economic development policies countries are predominantly using today:
1. “Localization Barriers to Trade”: Localization barriers to trade seek to explicitly pressure foreign enterprises to localize economic activity in order to sell into a country’s marketplace. LBTs seek to force foreign enterprises to produce locally what the enterprise would otherwise produce outside the nation’s borders and export to the economy. LBTs include policies such as local content requirements, local production as a condition of market access, forced technology or intellectual property transfer as a condition of market access, forced offsets, and compulsory licensing.
2. “Indigenous innovation”: These policies provide preferential treatment of domestic enterprises or intellectual property at the expense of foreign enterprises (or their IP). For example, they include regulations favoring domestic enterprises by making it more difficult for foreign enterprises to compete locally, such as by introducing domestic technology standards, onerous regulatory certification requirements, or unjustified conformity assessment procedures. They also include regulations that seek to block out competition from foreign enterprises that would like to sell products or services to the destination country, such as when countries introduce government-sanctioned monopolies and controls on foreign purchases, or when they limit foreign sales or FDI in their nations.
3. “General mercantilism”: These policies seek to boost production by increasing
exports and/or reducing imports—largely by making imports more expensive and exports cheaper—but they are indifferent as to whether they affect domestic or
PAGE 20 THE INFORMATION TECHNOLOGY & INNOVATION FOUNDATION | APRIL 2014
foreign enterprises. What matters is where the production occurs, not who performs it. This category includes policies such as currency manipulation, export subsidies, or high tariffs that have the effect of broadly increasing the price of imports while reducing the cost of exports.
4. “Enterprise support:” Finally, the fourth, and superior, set of policies that
countries can implement to achieve faster and more sustainable economic growth—although they are all too often neglected or eschewed for policies in one of the prior three categories—entails enacting a range of pro-innovation economic development policies that not only fundamentally raise the competitiveness of a nation’s economy and its ability to attract foreign direct investment on its own merits, but also, and more importantly, seeks to boost productivity growth across the board in all industries—traded and non-traded alike.
Localization barriers to trade, indigenous innovation, and general mercantilist policies are all forms of innovation mercantilism. All are inferior to “enterprise support” strategies. Unfortunately, as this section documents, India has begun to rely more heavily on the first three types of policies in at least five key economic sectors: information and communications technology, manufacturing, biotechnology/life sciences, renewable energy, and retail.
Information and Communications Technology India has introduced a range of innovation mercantilist policies in the ICT sector, including local content requirements, onerous regulatory certification requirements, restrictions on foreign competitors, and maintenance of high tariffs on ICT products. Foreign competitors in the ICT sector have also been hampered by difficulty in protecting their intellectual property rights in India. While many of these policies threaten to impose significant barriers to trade in the ICT sector, they will likely do little to foster domestic ICT manufacturing in India, but instead produce perverse consequences of discouraging investment, weakening ICT infrastructure, and increasing costs to Indian consumers and firms that use ICT.52 However, as this section also documents, the positive news is that recent months have seen the Indian government modulate—though not completely repeal—several of these trade-restrictive ICT policies.
Local Content Requirements
In February 2012, the Indian Ministry of Communications and Information Technology (MCIT) announced a Preferential Market Access (PMA) mandate for electronic goods which imposed local content requirements on the procurement of telecommunications and information technology products by both government and private sector entities with “security implications for the country.” As originally envisioned, a specified share of each telecommunications product’s market—starting at 30 percent in 2012 and rising potentially to 100 percent by 2020—would have to be filled by Indian-based manufacturers.53 For information technology products, the stipulated local content percentage started at 25 percent, rising to 45 percent within five years.54 As originally envisioned, the PMA’s coverage was so broad that it easily impacted roughly half, or about $9.3 billion, of India’s $20.5 billion ICT marketplace.55 The policy sought to help India achieve a goal of having 80 percent of the computers and electronics sold in India be
PAGE 21 THE INFORMATION TECHNOLOGY & INNOVATION FOUNDATION | APRIL 2014
manufactured domestically by 2020, with at least 50 percent of that production being met by Indian products.56 In short, the PMA was designed to institutionalize preferences for domestic ICT manufacturers in the procurement of ICT products in Indian markets.
On July 8, 2013, India’s government announced that it would suspend and review its Preferential Market Access requirements for local content as applied to private sector procurements.57 ITIF applauds the Indian government for recognizing the concerns voiced by foreign governments, investors, and the international ICT community and rescinding the PMA’s application to private sector procurements. However, India’s government intends to move forward with the application of the PMA to government procurement activity, which will nevertheless impose a significant distortion on India’s ICT market. With government procurement accounting for approximately 10 percent of India’s total ICT marketplace, and “public sector undertakings”—including state-owned or state-influenced enterprises in sectors such as education, healthcare, energy, utilities, and mining—accounting for another 20 percent of India’s ICT market, India’s public sector PMA requirements will still impact approximately 30 percent of India’s ICT marketplace.58 In fact, if India fully implements the PMA for government procurement, then ITIF estimates that foreign imports of ICT products to serve Indian government procurement would decline by up to $6.5 billion in the year 2020.59
As ITIF writes in Why India’s PMA Will Harm the Indian and Global Economies, while some have argued that the PMA is a temporary, limited, and non-distortionary measure designed to give a slight and momentary boost to domestic electronics and ICT hardware manufacturers, the reality is that the PMA is a highly distortive policy which is likely to damage both the Indian and broader global economy.60 In reality, the PMA:
1. Is a trade-distortionary policy that will entail at least a de facto price or quality preference which will have significant negative effects on Indian citizens;
2. Far from making ICT products in India more secure—is actually likely to make them less secure;
3. Will degrade global trade and contribute to spillover and contagion effects
reducing global trade and economic integration;
4. Is distinct and more severe than many other countries’ preferences for local production in government procurement activity; and
5. Is unlikely to have any significant long-term effectiveness as an instrument to bolster domestic manufacturing, while in fact possibly distracting Indian policymakers from enacting the kinds of policies they need to truly enhance the competitiveness of India’s economy and manufacturing industries.61
The PMA will raise government costs by making the procurement of ICT products more expensive, leading to one of the following several undesirable outcomes: 1) India’s government will procure fewer, or more inferior, ICT products, which will compromise or outright preclude the provision of much-needed e-government services and solutions, such
India’s PMA policy is unlikely to benefit India’s ICT manufacturers, and overall is likely to harm India’s broader economy.
PAGE 22 THE INFORMATION TECHNOLOGY & INNOVATION FOUNDATION | APRIL 2014
as Indian citizens’ ability to efficiently conduct business with Indian government agencies online or the deployment of advanced ICT systems such as health IT or intelligent transportation systems; 2) India’s government will have to increase expenditures—and thus raise taxes—to maintain the same level of ICT procurement; or 3) India’s government will have to forgo other expenditures to cover the increased cost of expenditures on ICT products. In all three of these cases, average Indian citizens will suffer. In short, the PMA is a distortive policy that is unlikely to prove effective as it will impose costs on India’s economy and citizens. It should be repealed in full.
Restrictive Regulatory Certification Requirements
India has advanced policies that effectively restrict market access of imports of a large number of ICT products via in country testing and certification requirements. Specifically, in 2012, India’s Department of Electronics and Information Technology (DEITY) issued a “Compulsory Registration Order” for product safety that requires new electronics equipment that are imported into or sold in India to be tested by domestic labs, approved by the Bureau of Indian Standards (BIS), and then specially labeled prior to going on the market.62 Though the order was initially thought only to apply to consumer products, it was subsequently extended to cover most ICT products, including highly specialized equipment such as servers and storage devices. The rules now require all testing to be done in BIS labs in India, regardless of whether the products have already been tested and certified by internationally accredited labs. The policy will has forced manufacturers of ICT and other electronic products ranging from televisions and DVD players to notebook computers and servers and storage products to submit their products for India-based testing, even if they were already tested to the same standard internationally.
But these compulsory registration requirements were developed with limited industry consultations, were practically unworkable, and veered markedly from global norms. In particular, given India’s admitted lack of testing capacity and infrastructure, as well as the extremely burdensome administrative and product labeling requirements, it proved impossible for global companies to import most of these products by an October 3, 2013 deadline.63 Recognizing this, on September 30, 2013, DEITY announced a three-month delay in its implementation of the testing requirements on imported electronic goods.64 Yet, in the fourth quarter of 2013, even as hundreds of ICT products sat awaiting BIS registration, DEITY began imposing fines on foreign ICT companies for not having safety certificates completed, despite the fact that the delays were caused by BIS. In total, U.S. and other foreign ICT enterprises have paid hundreds of thousands of dollars in fines and have incurred millions of dollars in new compliance and liability costs.65 Moreover, the time-to-market delays and regulatory uncertainty introduced by the compulsory registration order threaten to jeopardize as much as one billion dollars of exports and potential sales of ICT products per quarter.66
India’s compulsory registration requirements are based on an Indian standard that is identical to the international standard for product safety which the global ICT industry already uses to test and certify products. As a result, companies have been forced to re-test their products (only within India) with no benefits to product safety. Moreover, even though ostensibly the requirements were introduced to ensure “public safety,” they have

PAGE 23 THE INFORMATION TECHNOLOGY & INNOVATION FOUNDATION | APRIL 2014
been applied to a wide range of specialized ICT equipment (such as high-end servers) that do not pose a safety risk to the public. Put simply, India’s compulsory registration scheme is practiced similarly nowhere else in the world. Moreover, there are longer-term concerns that this registration model will become a model for testing and certification in other areas, such as product security. India’s compulsory registration requirements constitute an unnecessary non-tariff barrier that should be repealed, with India returning to accepting certifications delivered by internationally reputable labs.
Restrictions on Foreign Competitors
India has introduced several restrictions on foreign enterprises seeking to compete in Indian ICT markets. For instance, on September 20, 2012, India’s Department of Industrial Policy and Promotion (“DIPP”) issued Press Note 5, which reformed India’s foreign direct investment regime in the retail sector. While the directive did laudably expand FDI limits in India’s retail sector, it introduced new regulations which prohibit foreign retailers from selling directly to Indian consumers via e-commerce.67 Due to an absolute ban on foreign investment in online business-to-consumer e-commerce, foreign corporations do not have any flexibility in setting up a joint venture with a prospective Indian partner, or investing even a minority stake in an existing Indian company in this space. Elsewhere, early indications are that India is seeking to exclude foreign information and communications technology vendors from participating in the country’s $4 billion national fiber optic network project that will bring high-speed Internet connections to rural areas throughout India.68
Meanwhile, foreign investment limits remain across several Indian telecommunications sectors. Foreign investment in wireless and fixed telecommunications in India is limited to 74 percent, and India’s initial licensing fee (approximately $500,000 per service) for telecommunications providers serves as a barrier to market entry for smaller market players.69 India’s Ministry of Information and Broadcasting has also set foreign ownership limits in the satellite sector and established preferences for Indian satellite firms in providing capacity for delivery of direct-to-home subscription television services.70
While the policy has not been enacted, India’s government has also explored enacting local data storage laws. Specifically, the Indian government has proposed a measure that would require companies to locate part of their ICT infrastructure within the country to provide investigative agencies with ready access to encrypted data on their servers. This measure would also require that data of Indian citizens, government organizations, and firms hosted on the servers of these companies not be moved out of the country.71 As ITIF writes in The False Promise of Data Nationalism, while an increasing number of countries have introduced local data storage laws, such efforts to keep data within national borders are misguided and ineffective in making data more secure.72
High Tariffs on ICT Products
Maintaining high tariffs on imports of ICT products remains an important component of India’s strategy to support indigenous ICT manufacturing. The Information Technology Agreement (ITA) is a multilateral trade agreement established in 1996 and now acceded to by 75 countries that eliminates tariffs on trade in hundreds of ICT products. However, India thus far has declined to participate in international negotiations to expand the
PAGE 24 THE INFORMATION TECHNOLOGY & INNOVATION FOUNDATION | APRIL 2014
product lines covered by the ITA. In fact, on January 23, 2013, India’s Department of Electronics and Information Technology actually proposed higher duties on imported electronic products not covered by India’s current commitments as part of the ITA in order to boost local manufacturing.73 Products affected would include consumer products, medical electronics, and home and patient safety monitoring devices—many of the same ICT products that international negotiators are now trying to bring under the scope of an expanded ITA. Meanwhile, India continues to impose high tariffs on entertainment software and hardware products, including PC game products, console game products, game console hardware, and game activation cards. For example, India has set tariffs of 28.85 percent on iPods, video game consoles, and video games.74
Digital Content Piracy
While certainly not the result of any intentional government policy, digital content piracy, especially that affecting software, music, and film, continues to be a major challenge in India. As the United States Trade Representative’s Office 2012 Special 301 Report notes, “large-scale copyright piracy, especially in the software, optical media, and publishing industries” persists in India.75 For instance, the Business Software Alliance’s 2011 Global Piracy Study found that the commercial value of PC software theft in India in 2011 totaled $2.9 billion, with the software piracy rate reaching 63 percent.76 By 2013, the percent of unlicensed software used by Indian enterprises fell slightly, to 61 percent, though the commercial value of unlicensed software remained well over $2 billion.77
Illegal downloading sites; P2P (peer-to-peer) filesharing; BitTorrent trackers and indexes; streaming sites; deep linking sites; blogs, forums, and social network sites directing users to infringing files; cyberlockers used to advertise massive amounts of infringing materials; and piracy through auction sites all continue to plague IP rights holders in India.78 For example, a recent study tracking downloading IP-addresses on P2P networks found India to be in the top 10 Internet P2P piracy countries in the world.79 In 2012, the music industry estimated total loss of over $431 million in India, as online music piracy rates exceeded 90 percent.80
Yet digital piracy in India harms domestic competitors just as it does foreign ones. Indeed, the Indian film industry has been significantly impacted by online piracy. For example, a study undertaken by the Motion Pictures Distributor’s Association placed India among the top 10 countries in the world for Internet piracy, as pirated films out of India appear on the Internet in an average of 3.15 days.81 Hollywood (English Films), Bollywood (Hindi Films), Tollywood (Telugu Films), and Kollywood (Tamil Films) are the prime victims of this piracy. Research has shown that online piracy of film and television content in India occurs primarily through file sharing networks. For example, Vishal Bharadwaj's Kaminey was downloaded a record number of times (estimated at 350,000 times) in India and abroad. The situation is equally perilous for regional language films with 88 percent of Telugu and 80 percent of Tamil films being downloaded from the Internet. These statistics demonstrate the need for Indian authorities to devote additional resources toward the protection of intellectual property rights, particularly those of digital content rights holders.
Digital content piracy, especially that affecting software, music, and film, continues to remain a major challenge in India.
PAGE 25 THE INFORMATION TECHNOLOGY & INNOVATION FOUNDATION | APRIL 2014
Manufacturing India’s National Manufacturing Policy, introduced in November 2011, contains a number of laudable policies to bolster India’s manufacturing sector, such as its commitment to address an “inadequate physical infrastructure, complex regulatory environment, and inadequate availability of skilled manpower” which “have constrained the growth of manufacturing in India.”82 Unfortunately, alongside the many constructive recommendations sit several trade-distorting policies, including the document’s call for “preferential purchases by government agencies of indigenously developed products and technologies.”83 Specifically, the National Manufacturing Policy calls for “government procurement with stipulation of local value addition” across a number of technologies, including “solar energy equipment, IT hardware and IT-based security systems, and fuel-efficient transport equipment such as hybrid and electric automobiles” as well as for all equipment used in building infrastructure in India, including “power; roads and highways; railways; aviation; and ports.”84
Though India became an observer to the WTO’s Government Procurement Agreement in February 2010, it continues to retain a number of preferences for domestic entities in its government procurement activities. For example, India’s 2006 Micro, Small and Medium Enterprise (MSME) Act authorizes the government to provide procurement preferences to MSMEs. Preferences are also provided to Indian state-owned enterprises. Not surprisingly, foreign firms are disadvantaged and “rarely win Indian government contracts” due to the preferences afforded to Indian state-owned enterprises and the prevalence of such enterprises.85
India’s National Manufacturing Policy further notes the importance of trade policy in impacting domestic production, stating that “the import and export regime, whether tariffs or export promotion measures, constitute important policy instruments which shape a country’s production profile.”86 Unfortunately, India maintains high peak tariff rates on a range of manufactured goods. These tariffs seek to favor India’s domestic corporations at the expense of manufacturing and jobs in the United States and elsewhere.87 For example, tariff peaks on automobiles and motorcycles reach 75 percent for new products and 100 percent for used products.88 To promote domestic automobile and textile production, India maintains duties on certain products that can range as high as 75 percent to 300 percent.89 India’s average applied tariff on automobile vehicles is 23.7 percent.90
Overall, U.S. exports to India face an average applied tariff of more than 13 percent, over six times higher than average U.S. duties on Indian goods.91 In fact, according to the WTO, India’s average bound tariff rate in 2010 was 46.4 percent, while its simple most-favored nation (MFN) average applied tariff was 12 percent.92 Despite its goal of moving toward Association of Southeast Asian Nations (ASEAN) tariff rates (approximately 5 percent on average), India has not systemically reduced its basic customs duty in the past five years.93
India also makes substantial use of forced offset provisions in the manufacturing sector. For example, India established its defense offset policy in 2005. The program requires companies to invest 30 percent or more of the value of contracts greater than 3 billion
While India’s National Manufacturing Policy contains a number of laudable policies to bolster India’s manufacturing sector, unfortunately alongside the many constructive recommendations are several trade-distorting policies.
PAGE 26 THE INFORMATION TECHNOLOGY & INNOVATION FOUNDATION | APRIL 2014
rupees (approximately $56 million) in Indian-produced parts, equipment, or services.94 India’s projected $20 billion purchase of 126 fighter aircraft is expected to specify a 50 percent offset.95 India recently expanded its use of offsets to include civil aviation, and “has indicated that it is considering broadening the areas of acceptable offsets.”96 Going forward, India will likely require that aerospace companies such as Airbus and Boeing produce aerospace parts and components in India as a condition of selling aircraft to Indian airlines.97
Life Sciences Foreign intellectual property rights holders in the life sciences sector have encountered significant challenges in protecting their intellectual property rights in India, particularly with regard to issuance of compulsory licenses, patent denials, and patent revocations. In fact, over the past two years, at least 15 foreign biopharmaceutical products have had their patent rights compromised in India.98
For example, on March 9, 2012, the Indian Patent Controller General granted a compulsory license to Natco, an Indian pharmaceutical company, enabling it to produce a patented cancer drug (Nexavar, or sorafenib tosylate) made by Bayer.99 Nexavar is a life-extending oncology drug used to treat advanced stages of kidney, liver, and thyroid cancer, for which all the R&D work on the drug was performed in the United States.100 India’s Patent Controller General ruled against Bayer on three counts, including one contending that the patent was not “worked” (i.e., exercised) to the fullest practical extent in India because it was not manufactured there—a policy decision that discriminates against imports in violation of India’s commitments as part of the World Trade Organization’s Trade-Related Aspects of Intellectual Property (TRIPS) agreement. To be sure, the 2001 Doha Declaration on TRIPS and Public Health affirmed the right of countries to issue compulsory licenses in extraordinary situations of extreme urgency or other national emergency to address legitimate public health needs.101 But the Indian Patent Controller General’s decision distorts what was intended as a public health exception into an industrial policy. As the United States Trade Representative Office’s 2013 Special 301 report argued with regard to the ruling:
India’s decision to restrict patent rights of an innovator based, in part, on the innovator’s decision to import its products, rather than manufacture them in India, establishes a troubling precedent. Unless overturned, the decision could potentially compel innovators outside India—including those in sectors well beyond pharmaceuticals, such as green technology and information and communications technology—to manufacture in India in order to avoid being forced to license an invention to third parties.102
India has considered issuing compulsory licenses on at least three additional anti-cancer drugs.103 As PharmaTimes Online explains, in January 2013, the Indian government started to implement plans “to revoke patents and issue compulsory licenses on another three cancer drugs—Roche’s Herceptin and Bristol-Myers Squibb’s Sprycel and Ixempra.”104 (As of April 2014, the Indian Ministry of Health was said to be “in the process of finalizing its arguments” that a compulsory license for Sprycel was “necessary” based on the “public
PAGE 27 THE INFORMATION TECHNOLOGY & INNOVATION FOUNDATION | APRIL 2014
non-commercial use and urgency clause” of TRIPS Section 92.)105 The additional compulsory licenses are being considered on the same grounds that contributed to issuance of the compulsory license for Nexavar, namely that: 1) the drug prices are too high; 2) the domestic market has not been adequately supplied; and 3) the drug is not being manufactured sufficiently in India. Under threat of the issuance of a compulsory license, in August 2013 Swiss drug developer Roche decided to no longer maintain its patent on the anti-breast cancer drug Herceptin. As Reuters explained, “India’s government had been considering issuing a compulsory license that would have overridden Roche’s patent and allowed other local companies to produce cheaper versions.”106 In short, India’s use of compulsory licenses is growing and this poses a serious threat to the ability of foreign biopharmaceutical intellectual property rights holders to protect their IP, not just in India, but also in other countries such as South Africa that are considering issuing compulsory licenses on novel medicines, taking a page from India’s playbook.
Patent denials constitute another challenge for biopharmaceutical rights seekers in India. For example, Novartis’s breakthrough anti-leukemia drug, Glivec, enjoys patent protection in over 40 countries, including China, Russia, and Taiwan. But, in April 2013, the Indian Supreme Court rejected Novartis’s application for Glivec patent rights in India. The two-judge bench found Glivec had failed “in both the tests of invention and patentability.”107 The court argued that because the active compound in Glivec, imatinib mesylate, was already known prior to Novartis’s filing for a patent for Glivec in India, it did not meet a requirement of Indian patent law, Section 3(d), which holds that pharmaceutical companies have to prove significant clinical efficacy enhancements in their drugs over already-patented compounds.108 In response, Novartis argued that it had transformed the chemical compound into a “beta crystal” form, making it a viable and more effective treatment for the cancer—a basis for Glivec patent provision accepted by at least three dozen other nations but rejected in India. This decision followed the Indian Intellectual Property Appellate Board’s (IPAB) November 2012 decision to reject AstraZeneca’s application for the lung cancer drug Iressa, citing the lack of an inventive step.109 However, as the 2013 Special 301 report contends:
Recent decisions by India’s Supreme Court with respect to India’s prohibition on patents for certain chemical forms absent a showing of “enhanced efficacy” may have the effect of limiting the patentability of potentially beneficial innovations. Such innovations would include drugs with fewer side effects, decreased toxicity, or improved delivery systems. Moreover, the decision appears to confirm that India’s law creates a special, additional criterion for select technologies, such as pharmaceuticals, which could preclude issuance of a patent even if the applicant demonstrates that the invention is new, involves an inventive step, and is capable of industrial application.110
In other words, the patentability standards established under Section 3(d) of India’s Patents Act—which require a demonstration of “enhanced efficacy”—erects an additional hurdle to obtaining a pharmaceutical patent in India that goes beyond the TRIPS standard that inventions that are new, involve an inventive step, and are capable of industrial application are entitled to patent protection. Moreover, this additional condition of showing
Foreign intellectual property rights holders in the life sciences sector have encountered challenges in protecting their intellectual property rights in India, particularly with regard to issuance of compulsory licenses, patent denials, and patent revocations.
PAGE 28 THE INFORMATION TECHNOLOGY & INNOVATION FOUNDATION | APRIL 2014
“enhanced efficacy” appears to be applied only to pharmaceuticals, thus unfairly discriminating against a particular field of technology.111 Not only does Section 3(d) have the effect of limiting patentability of potentially beneficial biopharmaceutical innovations, it also undermines incentives for innovation by preventing patentability for improvements which do not relate to efficacy, such as an invention relating to the improved safety of a product.112
Foreign intellectual property rights holders also face the revocation of patents in India. For instance, in February 2013, the Indian Patent Controller revoked a patent for Pfizer’s anti-cancer medicine Sutent, using a “hindsight analysis” that cited a lack of inventiveness. The revocation came despite the fact that the Indian patent for sunitinib (which covers the active compound in Sutent) had been in effect for five years prior to its revocation.113 As it had in India, sunitib has received patent protection in over 90 other countries, but has not had its patent revoked in any nation except for India. The revocation allows Indian generic companies to manufacture and sell generic copies of Sutent long before the patent is set to expire. In June 2013, India’s Intellectual Property Appellate Board remanded the patent office’s order revoking Pfizer’s patent sunitib for another review.
Separately, in November 2012, IPAB revoked the patent for Roche’s hepatitis C drug Pegasys, citing the lack of an inventive step, despite the fact that Roche had received a patent for Pegasys from the Indian patent authority in 2006.114 This followed the Chennai Patent Office’s revocation of Merck’s patent for an anti-asthma drug in December 2012, citing the lack of an inventive step. And in August 2013, India revoked patents that had been awarded to the firm Allergan for its ocular hypertension drug Ganfort and its glaucoma treatment Combigan, again citing the lack of an inventive step.115
Beyond compulsory licensing, patent denials, and patent revocations, additional examples of Indian intellectual property rules stifling biopharmaceutical innovation include: abusive pre-grant opposition proceedings; a lack of protection for clinical test and other data that innovative pharmaceutical manufacturers are required to submit during the marketing approval process; lax patent enforcement for patented pharmaceutical products when a generic product seeks marketing approval during the patent term; and unnecessarily burdensome patent application requirements.116 For example, in April 2014, Gilead Sciences encountered two pre-grant oppositions for a patent it is seeking in India for a Hepatitis C drug it invented called Sovaldi.117 The challenge—filed by India’s Natco Pharma and the Initiative for Medicines, Access & Knowledge—contends that Gilead’s Solvaldi is not “inventive enough” because it is based on “old science.” This despite the fact that in December 2013 Sovaldi won a priority review and “breakthrough therapy” designation from the U.S. Food and Drug Administration.118
Renewable Energy Prior to 2009, India required 51 percent domestic equity ownership for firms in the renewable energy sector. This obligation was meant to encourage technology transfer by global players and to force multinationals to use locally sourced components and labor.119 In 2009, India commendably reformed these regulations to permit 100 percent foreign direct investment in the renewable energy sector.
PAGE 29 THE INFORMATION TECHNOLOGY & INNOVATION FOUNDATION | APRIL 2014
Unfortunately, at the same time, India also introduced local content requirements for wind turbines and for solar photovoltaic cells (PVs), the latter as part of India’s Jawaharlal Nehru National Solar Mission (JNNSM, also known as India’s SunShot). These local content requirements seek to promote creation of domestic solar and wind turbine equipment manufacturing industries in India. For wind projects producing greater than 10 megawatts (MW) which began operation after January 2012, the Indian government requires that the equipment (i.e., wind turbines) used contain at least 50 percent local content. For solar installations generating between 10 KW (kilowatts) and 10 MW, India requires 60 percent local content in the PV equipment used. India has further introduced local content requirements for grid-connected solar PV and solar thermal projects. Further, all silicon PV projects are required to use cells and modules manufactured in India if they are to be eligible to receive feed-in-tariffs.120
In February 2013, the United States requested WTO dispute settlement consultations with the Indian government concerning the domestic content requirements in India’s national solar program.121 But despite the fact that the United States had brought this WTO dispute in early 2013, India continued its use of solar LCRs by maintaining them for the first tranche of projects introduced under the JNNSM Phase II guidelines issued in October 2013.122 This prompted the United States Trade Representative’s Office to launch a second case at the WTO in February 2014 regarding domestic content requirements in India’s solar program.123 The U.S. solar industry estimates that India’s LCRs on solar products have placed $200 million to $300 million in U.S. exports at risk.124
Renewable energy industries in India are heavily subsidized. In fact, almost 100 percent of expected solar PV generation over the coming decades will be subsidized.125 Further, certain provisions in India’s National Manufacturing Policy have sought to curtail patent rights on renewable energy technologies in order to facilitate technology transfer to India in the clean energy sector.126
Retail As the McKinsey Global Institute (MGI) notes, the Indian retail sector—valued at $435 billion as of 2010—suffers from very low levels of productivity. One important path forward for higher retail productivity is to allow greater levels of foreign direct investment in retail. In September 2012, the Indian government approved a policy permitting FDI in the multi-brand retail sector, but only up to 51 percent ownership stakes and it left to each Indian state the final decision on whether to authorize such FDI in its territory. In addition, where such FDI will be allowed, the policy imposes conditions on entry, including the following: investment of at least approximately $100 million, of which at least 50 percent must be in “back-end infrastructure” (e.g., processing, distribution, quality control, packaging, logistics, storage, and warehouses) within three years of the initial investment; opening stores only in cities identified in the 2011 census as having populations greater than one million residents; and, reminiscent of the “small is beautiful” policies of the past, sourcing at least 30 percent of purchases from “Indian ‘small enterprises’ which have a total investment in plant [and] machinery not exceeding [$1 million].”127 This condition is also mandatory for single-brand retail investors (such as Gucci and Ikea) if they invest beyond 51 percent. For example, because of these
PAGE 30 THE INFORMATION TECHNOLOGY & INNOVATION FOUNDATION | APRIL 2014
restrictions, Walmart runs two wholesale stores in India because local laws designed to protect owners of smaller shops limit overseas companies to operating single-brand stores, or wholesale outlets.128 This is a surefire strategy to keep productivity low, for as the McKinsey Global Institute found, innovative retailers such as Walmart contributed to approximately 15 percent of the U.S. productivity acceleration in the last half of the 1990s.129
India’s September 2012 retail policy announcement also explicitly prohibits FDI in single-brand and multi-brand retail by means of electronic commerce.130 As Bloomberg Businessweek notes, India’s e-commerce market is expected to grow to $22 billion by 2019, but foreign competitors such as Amazon are impeded from competing in India’s e-commerce market because of Indian government rules that bar companies from owning inventory and selling directly to the nation’s billion-plus consumers.131 These types of policies represent a continuation of a long tradition of post-war Indian economic policy that has sought to favor small firms, with the only result being lower productivity and incomes for Indian citizens. WHY INDIA INCREASINGLY APPEARS TO BE EMBRACING INNOVATION MERCANTILIST POLICIES Five major influences appear to be driving India’s recent embrace of innovation mercantilist policies. First, they represent a reaction to other countries’ mercantilist policies which are damaging India’s economy (not to mention the broader global economy) and thus pressuring India to enact mercantilist policies of its own. Second, Indian policymakers worry that productivity-based growth threatens, not creates, jobs—and moreover do not believe that an increased supply of workers will on its own naturally create robust demand for goods and services, thus fueling broad employment growth. Third, Indian policymakers, like many economists in the international development field, appear to have erroneously bought into the perception that changing the compositional share of India’s economy from one of low-productivity industries to high-productivity industries is a better growth strategy than boosting productivity across the board in all sectors. Yet, for these reasons, Indian policymakers have sought economic and employment growth primarily by bolstering manufacturing and boosting manufactured exports—in part through the use of trade-distorting policies such as the PMA—incorrectly believing that trade surpluses are positively correlated with economic growth. Finally, all too often India has refrained from embracing politically difficult choices—such as opening up sectors like retail to foreign competition or embracing privatization in the energy sector—for fear of upsetting entrenched domestic constituencies.
Responding to Other Countries’ Innovation Mercantilist Policies The use of innovation mercantilist policies such as localization barriers to trade has spiked in recent years, sparking a contagion effect as nations erect new barriers of their own in response to those of others. To be sure, dozens of nations are complicit in this, including Argentina, Brazil, China, Russia, and Vietnam (and even on rarer occasion European Union countries and the United States). While this trend has several causes—and has been exacerbated by the Great Recession—to a certain degree it can be traced back to a change in China’s economic policy in the mid-2000s. Up through the mid-2000s, Chinese
PAGE 31 THE INFORMATION TECHNOLOGY & INNOVATION FOUNDATION | APRIL 2014
economic policy largely focused on encouraging foreign direct investment, promising to be a low-cost production platform for foreign multinational corporations (in part through mercantilist policies such as currency manipulation and export subsidies). But by 2006, China made the strategic decision to shift away from attracting the commodity-based production facilities of foreign MNCs and move toward a “China Inc.” development model focused on helping Chinese firms, often at the expense of foreign firms.132 The path to prosperity now became “indigenous innovation” (in Chinese, zizhu chuagnxin), with a focus on helping Chinese firms move toward higher-value-added production activities (an approach India has increasingly sought to emulate). To achieve that, China ramped up its mercantilist efforts.
Indeed, China’s policies represent a departure from traditional competition and international trade norms. Its strategy for globalization is to win in virtually all industries. To get there, as ITIF writes in Enough is Enough: Confronting Chinese Economic Mercantilism, China is “practicing economic mercantilism on an unprecedented scale.”133 China has embraced a broad and deep range of mercantilist policies, everything from massive subsidies for state-owned enterprises, abuse of anti-trust policy, currency manipulation, and standards manipulation to the theft of intellectual property and forced transfer of technology as a condition of market access. As Dani Rodrik concurs, “Today, China is the leading bearer of the mercantilist torch…Much of China’s economic miracle is the product of an activist government that has supported, stimulated, and openly subsidized industrial producers.”134
China’s extensive use of such polices has distorted global trade and investment patterns and significantly hurt other developing nations that might otherwise have received some of the investment and gained some of the global market share that China has captured. Not only has this meant slower economic growth in these third-party nations, such as India; more troublingly, it has encouraged these nations to ramp up their own trade-distorting policies in response.135 Indeed, the deleterious impact of Chinese mercantilist policies has been particularly harmful to India—and has not been missed by officials in New Delhi. As Dr. Harsh V. Pant of King’s College London argues, “The arc of Indian foreign policy since [the late 1990s] has been a reaction to China’s growing profile.”136
The magnitude of trade flows between China and India was close to zero before the onset of Indian trade liberalization in 1991, but since then trade between the two emerging economies has grown rapidly, with China-India trade growing by 30 percent over the last decade. By 2011, the Chinese share of Indian import value reached 12 percent, while Indian exports accounted for 5.5 percent of Chinese imports. However, as Figure 2 shows, India’s terms of trade with China have turned increasingly negative over the past decade.
In fact, India’s trade deficit with China totaled $175 billion over the six years from 2007 to 2012, accounting for 54 percent of India’s aggregate $325 billion current account deficit accrued over that period. Indian Commerce Ministry Joint Secretary Asit Tripathy asserted in September 2013 that India’s widening trade deficit with China “was not sustainable in the long run” and called on China to provide more market access for Indian products.137 India’s large trade deficit with China stems in part from the fact that India does not receive
India’s large trade deficit with China stems in part from the fact that India does not receive a larger share of the global production activity that China has captured, in part because of China’s mercantilist practices, and in part because Indian exports to China are artificially expensive given China’s currency manipulation.

PAGE 32 THE INFORMATION TECHNOLOGY & INNOVATION FOUNDATION | APRIL 2014
a larger share of the global production activity that China has captured, in part because of China’s mercantilist practices, and in part because Indian exports to China are artificially expensive given China’s currency manipulation. While clearly a multitude of factors influence the terms of trade between nations, it appears that India’s economy has been significantly negatively impacted by two Chinese mercantilist policies in particular: currency manipulation and predatory pricing.
Figure 2: India’s Exports to and Imports from China, 2003-2012138
Currency manipulation makes a country’s exported products cheaper and thus more competitive in international markets while making foreign imports more expensive. Currency manipulation is a blanket, economy-wide, trade-distorting policy that gives countries an unfair comparative advantage. Countries that manipulate their currencies frustrate a natural adjustment mechanism in international trade, for if their currencies appreciated prices of their exports would become more expensive and imports from other nations less expensive.139
Economists at the Peterson Institute for International Economics have found that China has been consistently undervaluing its currency for some time.140 And, as Gulzar Natarjan finds, “there may be a strong case now for many developing economies that, despite China’s exchange rate flexibility since 2005, they are bearing the brunt of China’s currency manipulation.”141 According to IMF data, while China’s renminbi appreciated against the U.S. dollar from 2000 to 2012, it actually depreciated against many other currencies: by 0.7 percent against the euro, by 45 percent against the Brazilian real, and by 30 percent against the Indian rupee.142 As Natarjan continues, “In particular, India has been among the worst affected by China’s currency manipulation. In real terms, the renminbi has depreciated by 30 percent [against the rupee] since January 2000. These trends are yet
PAGE 33 THE INFORMATION TECHNOLOGY & INNOVATION FOUNDATION | APRIL 2014
another reason for India to rally other developing countries around an agenda that focuses on China’s currency manipulation and its beggar-thy-neighbor impact on other emerging economies.”143 To get a sense of the magnitude of the effect, in 2012, China’s $3.3 trillion in foreign currency reserves (in large part accumulated through unfair trade practices such as currency manipulation) equaled approximately $2,450 in reserves for every Chinese citizen—an amount nearly double India’s per-capita GDP. A recent Reserve Bank of India report blamed India’s trade deficit in part on Chinese currency manipulation, but was quickly buried for fear of antagonizing Chinese officials.144
China has also used predatory pricing practices against other nations, including India, particularly through the practice of “dumping,” which occurs when an exporter from a foreign country sells a product in the destination country at a price below “normal value” (usually meaning sold below the cost of production or the cost at which the product is sold in the home country). In response, since 1992, India has initiated 159 anti-dumping cases against China.145 Not only has India filed more anti-dumping investigations against China than any other country at the WTO, this represents the largest number of anti-dumping investigations filed by any country against another. The complaints cover a wide range of products, from toys, textiles, and mobile phones to tires and chemicals.146 At least 120 of these cases have resulted in the imposition of duties against Chinese producers.147 Between 1995 and 2011, China accounted for 22.4 percent of anti-dumping cases India initiated and 25 percent of measures India has imposed against its trading partners worldwide.148
The Indian newspaper The Statesman has warned that Chinese dumping is irreparably damaging “the Indian domestic market and producers” and “if the current situation continues Indian industry would cease to exist.”149 To be sure, a country’s impetus for undertaking anti-dumping investigations normally arises from complaints lodged by domestic enterprises and industries allegedly harmed by the unfair price practices of foreign competitors. Certainly, there are cases when domestic industries agitate for protection because they are losing out in legitimate market-based competition, not because foreign competitors are dumping products. However, many of the anti-dumping investigations brought by India against China appear to have merit. For instance, an anti-dumping investigation addressing imports of Chinese tires into India in the late 2000s found that Chinese tires sold in India were 30 percent cheaper than the cost of tires produced in India and that 80 percent to 85 percent of Indian demand for tires was being met by Chinese imports.150
Again, one of the distinctive characteristics of China’s mercantilist policies is that their practitioners are often state-owned enterprises (SOEs), or if not SOEs, at least heavily state-subsidized industries. For example, the Chinese government heavily subsidizes its solar products industry with the goal of increasing global market share, even if it means selling products at a loss.151 In fact, in 2010, the top five Chinese solar companies received the equivalent of over $31.3 billion in low-interest loans from the state-owned China Development Bank and other subsidies from national and provincial government agencies.152 As Ben Santarris, Director of Corporate Communications for SolarWorld, a German solar panel manufacturer, explained, “pervasive and all-encompassing Chinese subsidies are decimating our industry.”153 And it’s quite clear that India has introduced its
In 2012, China’s $3.3 trillion in foreign currency reserves equaled approximately $2,450 in reserves for every Chinese citizen—an amount nearly double India’s per-capita GDP.
PAGE 34 THE INFORMATION TECHNOLOGY & INNOVATION FOUNDATION | APRIL 2014
local content requirements in the solar industry in direct response to China. As one op-ed noted, “The LCR clauses were incorporated by India to protect domestic solar industry against imports from China.”154
But Chinese subsidies go far beyond the country’s solar industry. According to Caing Statistics, over 90 percent of Chinese companies listed on public markets in 2010 were granted government subsidies.155 And as Haley and Haley detail, the subsidies take a variety of forms, including free- or low-cost loans, subsidized energy, and subsidized raw materials, land, and technology. For example, China’s steel industry received $27 billion in energy subsidies alone from 2000 to 2007. China’s paper industry received $33 billion in subsidies of all kinds from 2002 to 2009.156
Another form of subsidy is the reduced profit rates Chinese SOEs have to generate. As an in-depth 2011 study by the Unirule Institute, an independent Chinese think tank, found, in 2009 the return on equity of Chinese state-owned enterprises was about half the rate of non-state-owned enterprises, a substantial “subsidy” in and of itself. But without their government-granted advantages, including preferential financing from state banks and free land, Chinese SOEs would have operated at a 6.29 percent loss from the period 2001 to 2009.157
In addition, there are subsidies specifically tied to exports. Even though export subsidies are illegal under the WTO, China uses them extensively.158 In 2007, China devoted more than $15 billion to export-enhancing subsidies to its steel industry.159 And while China announced reductions in steel subsidies, the reductions are focused on commodity-grade steels, and it has increased value-added tax (VAT) rebates on exports of value-added steels.160 Yet the subsidies go far beyond steel. For example, the Chinese central government provided subsidy grants of $6.7 million and $22.5 million to Chinese wind turbine manufacturers that agreed not to buy imported components.161
China also targets foreign firms with discriminatory anti-trust investigations. For example, in November 2013, China launched an anti-trust probe against U.S. chipmaker Qualcomm. While Qualcomm has not been charged by China’s National Development and Reform Commission (NDRC) for breaking any laws, as Reuters explains, the move “is likely tied to the impending $16 billion rollout of commercial fourth-generation services by China’s big carriers and is likely a pre-emptive measure that will allow China’s telecom providers to gain leverage in royalty negotiations ahead of the rollout of new high-speed mobile networks.”162 In other words, China is likely launching the anti-trust probe to gain leverage to get Qualcomm to lower the royalties it earns on its chipsets, which are the only ones that can support a handset using both 3G and 4G wireless networks in China.163 Qualcomm is not alone, as the NDRC has actually launched nearly 20 pricing-related probes of domestic and foreign firms over the last three years, including also launching a pricing investigation into the pharmaceutical industry earlier in 2013.164 More broadly, the antitrust provisions in China’s antimonopoly law have raised serious questions among U.S. and EU antitrust experts, who warn that the law can be used as a tool against foreign company actions that affect Chinese markets, a policy that affects Indian enterprises as much as Western ones.165
PAGE 35 THE INFORMATION TECHNOLOGY & INNOVATION FOUNDATION | APRIL 2014
China’s rampant use of mercantilist policies amplifies the importance of achieving genuine market-based trade in which trade and investment decisions are made on the basis of voluntary, competitively determined business decisions. Unfortunately, countries such as China are unlikely to abandon their trade-distorting policies overnight. Yet India’s response should not be to respond with its own protectionist policies, but rather to respond: 1) with appropriate defensive trade protection actions (i.e., filing anti-dumping cases); 2) by joining other nations, particularly the United States and European Union nations, in aggressively contesting Chinese and other countries’ mercantilist practices; and 3) by developing a range of pro-innovation economic development policies that not only support the competitiveness of private sector enterprises but that also—and more importantly—seek to boost productivity growth across the board in all industries, traded and non-traded alike. As Narendar Pani presciently writes in The Hindu, “Given the extent to which Chinese products are making inroads into the Indian market, developing a more vibrant and innovative technology regime may itself be a national priority.”166
Fear That Productivity Growth Threatens, Not Increases, Employment In speaking to the CEO of a major Indian manufacturing company at a conference in India in 2009, one of this report’s authors expressed puzzlement as to why so many Indian operations appeared so over-manned. Instead of agreeing and speaking about how government policy could encourage business actions to boost productivity, the CEO replied, “India cannot afford productivity, we need the jobs.”167 Like E.F. Schumacher, the CEO had bought into the myth that productivity growth destroys jobs, a view that has become all too prevalent among Indian policymakers and businessmen, as it has in most corners of the developing world. In other words, too many business leaders and policymakers believe that the key task of creating jobs for the massive numbers of people entering the labor force is made harder, not easier, by higher rates of productivity growth, even when the key determining factor as to why developing nations are in fact “developing” and not “developed” is low productivity.
Indeed, the suggestion that productivity growth—whether wrought by new technologies, automation, or innovation—destroys jobs over the long run is incorrect, as academic studies in both the developed and developing world have found.168 As the McKinsey Global Institute summarizes, “Countries with the highest productivity [including the United States, Germany, France, the United Kingdom, Japan, and Korea] have the highest GDP per capita. Clearly, increases in productivity in these countries have not led to a decline in employment.”169 In fact, the scholarly evidence supports the idea that technological change does not lead to fewer jobs, and in fact may actually increase employment. As a definitive 1994 Organization for Economic Co-operation and Development (OECD) study found:
Technology both eliminates jobs and creates jobs. Generally it destroys lower wage, lower productivity jobs, while it creates jobs that are more productive, high-skill and better paid. Historically, the income-generating effects of new technologies have proved more powerful than the labor-displacing effects: technological progress has been accompanied not only by higher output and productivity, but also by higher overall employment.170
As academic studies in both the developed and developing world have clearly shown, the suggestion that productivity growth destroys jobs over the moderate and long term is incorrect.
PAGE 36 THE INFORMATION TECHNOLOGY & INNOVATION FOUNDATION | APRIL 2014
Similarly, in a paper for the International Labour Organization’s 2004 World Employment Report, Van Ark, Frankema, and Duteweerd surveyed empirical evidence and found strong support for simultaneous growth in per-capita income, productivity, and employment in the medium term.171 Likewise, Trehan finds that productivity-enhancing technology shocks reduce unemployment for several years going forward.172 He writes:
Productivity grew noticeably faster than usual in the late 1990s, while the unemployment rate fell to levels not seen for more than three decades. This inverse relationship between the two variables also can be seen on several other occasions in the postwar period and leads one to wonder whether there is a causal link between them. The empirical evidence presented here shows that a positive technology shock leads to a reduction in the unemployment rate that persists for several years.173
Some studies do find that employment decreases in the short run in response to a productivity shock, but that jobs grow in the medium to long term: Basu, Fernald, and Kimball find this result, with labor (and investment) inputs falling immediately after productivity-enhancing technology shocks but quickly returning labor usage to normal with increased output.174 Using evidence from Korea, Kim, Lin, and Park also find support for a short-term negative and medium-term positive relationship between aggregate productivity and employment.175 Chen, Rezai, and Semmler examine unemployment and find evidence that in the short run, productivity and unemployment are weakly positively correlated. In the medium and longer term, however, they find that productivity growth is strongly negatively correlated with unemployment.176
The positive relationship between productivity and jobs appears to hold in developing nations just as it does in developed ones, even though many policymakers persist in believing that employment growth is dependent on ensuring low, not high, productivity growth. For example, the World Development Report 2013: Jobs study examines productivity growth in 97 developed and developing countries over the past decade and finds that jobless growth has been quite rare and simultaneous employment and productivity growth is much more common.177 In a study of the relationship between productivity and employment in developing nation economies, the United Nations Industrial Development Organization finds that, in fact, “productivity is the key to employment growth.”178 It goes on to note:
The link between productivity and the creation of jobs is strong but somewhat complex. In a static formulation, employment and productivity are in an inverse relationship: A given quantity of work to be done will require fewer and fewer jobs as productivity increases. In dynamics, though, the relationship is altogether different. Real wages divided by labour productivity is what defines the share of the wage bill in value added. Thanks to this relationship, the share of the wage bill can be reduced without affecting the income of the workers. The larger capital residual stimulates investment and, finally, jobs.179
While the aggregate-level evidence is clear that higher productivity does not lead to fewer jobs, particularly in the medium and long term, what is the effect at the industry and firm
PAGE 37 THE INFORMATION TECHNOLOGY & INNOVATION FOUNDATION | APRIL 2014
level? Firm-level studies show many beneficial employment effects from productivity gains, although at the more granular level it is possible to observe that certain firms and workers may lose out. In response to technological change, many companies produce the same with fewer workers—these are the firms and industries where “robots are stealing jobs.” But at the same time, some companies that increase productivity are able to sell more because their costs go down, and are able to maintain or even increase the number of workers they employ. Chang, Hornstein, and Sarte examine reasons for industry-level differences in firms’ reactions to technological change, showing that firms in industries with low inventory costs, elastic demand, and flexible prices are more likely to increase employment after a productivity shock.180 In other words, in industries where price declines are more likely to stimulate demand increases, productivity increases are more likely to not lead to job losses.
Broader studies confirm these results for both developed and developing countries. For example, in a large cross-country (OECD and non-OECD) study of more than 26,000 manufacturing firms, Dutz et al. find that establishments with increasing productivity actually have higher employment growth than non-increasing firms.181 The strength of a firm’s productivity-driven employment growth is significantly positively associated with the share of the firm’s workforce that is unskilled, debunking the conventional wisdom that productivity-driven growth is not inclusive. Along the same lines but covering a broad array of industries, a study by the International Finance Corporation of firms in 106 developing countries found similar workforce growth in firms where productivity increases had occurred.182
Unfortunately, embrace of the “Lump of Labor” fallacy—the concept that there is a limited amount of labor to be performed in an economy—remains all too prevalent in nations, including in India. But this view fails to recognize that the savings from new productivity gains must flow back into an economy through one or more of the following three channels: lower prices, higher wages for the fewer remaining employers, or higher profits.183 For example, in a competitive ICT product manufacturing market, most of the savings from higher productivity would flow back to consumers in the form of relatively lower prices for computers or mobile phones. Consumers might use these savings to buy more or better ICT products, go out to dinner, buy books, or purchase any number of other things. This economic activity in turn creates demand that other companies (e.g., automobile manufacturers, construction firms, restaurants, movie theaters, and hotels) respond to by hiring more workers. In other words, raising the productivity of one industry increases demand, either in that industry or in all the other industries in aggregate.
We can call these direct and indirect (“second order”) effects. Direct effects occur when companies or industries change their productivity and employment simultaneously because the change in their production processes directly changes their need for workers. Indirect effects occur when technological improvements increase demand and lower the prices consumers pay for goods and services, thereby giving them more purchasing power and stimulating growth in other sectors, which leads to a self-reinforcing economic expansion, as Figure 3 shows.
In a study of the relationship between productivity and employment in developing nations, the United Nations Industrial Development Organization finds that, in fact, “productivity is the key to employment growth.”
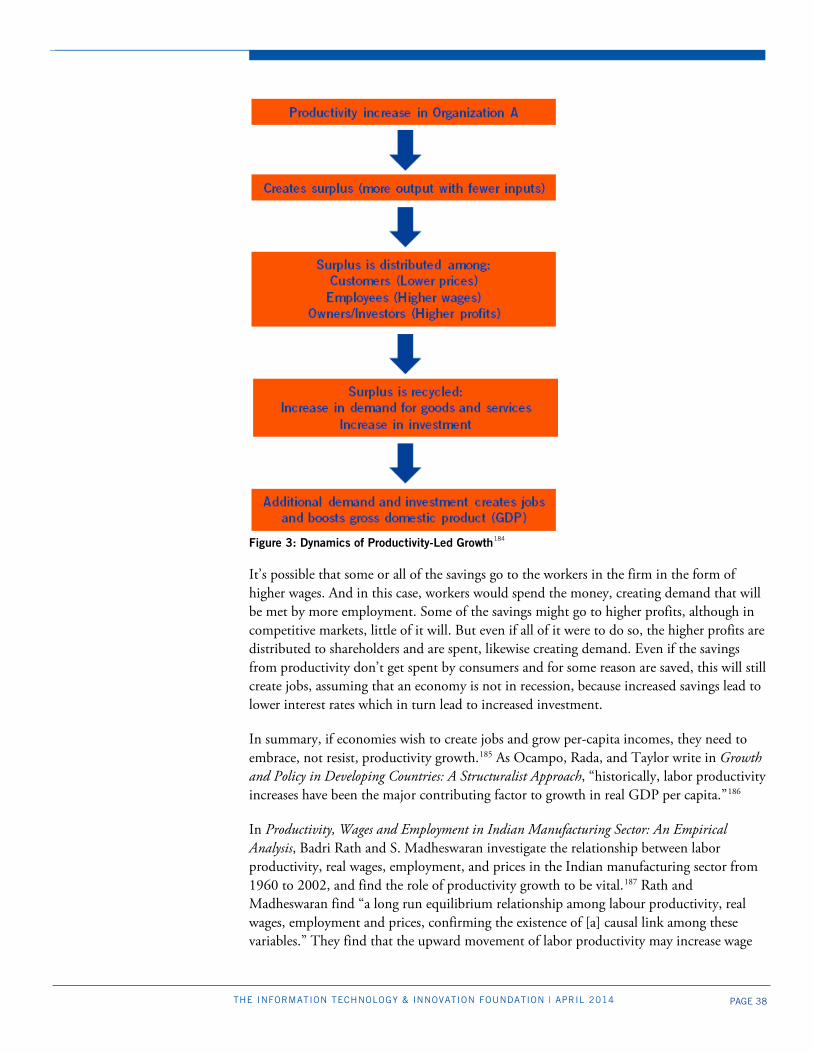
PAGE 38 THE INFORMATION TECHNOLOGY & INNOVATION FOUNDATION | APRIL 2014
Figure 3: Dynamics of Productivity-Led Growth184
It’s possible that some or all of the savings go to the workers in the firm in the form of higher wages. And in this case, workers would spend the money, creating demand that will be met by more employment. Some of the savings might go to higher profits, although in competitive markets, little of it will. But even if all of it were to do so, the higher profits are distributed to shareholders and are spent, likewise creating demand. Even if the savings from productivity don’t get spent by consumers and for some reason are saved, this will still create jobs, assuming that an economy is not in recession, because increased savings lead to lower interest rates which in turn lead to increased investment.
In summary, if economies wish to create jobs and grow per-capita incomes, they need to embrace, not resist, productivity growth.185 As Ocampo, Rada, and Taylor write in Growth and Policy in Developing Countries: A Structuralist Approach, “historically, labor productivity increases have been the major contributing factor to growth in real GDP per capita.”186
In Productivity, Wages and Employment in Indian Manufacturing Sector: An Empirical Analysis, Badri Rath and S. Madheswaran investigate the relationship between labor productivity, real wages, employment, and prices in the Indian manufacturing sector from 1960 to 2002, and find the role of productivity growth to be vital.187 Rath and Madheswaran find “a long run equilibrium relationship among labour productivity, real wages, employment and prices, confirming the existence of [a] causal link among these variables.” They find that the upward movement of labor productivity may increase wage

PAGE 39 THE INFORMATION TECHNOLOGY & INNOVATION FOUNDATION | APRIL 2014
rates and employment generation. As the authors conclude, “labour productivity growth [is] the only route to enhance labour welfare in the long run,” and “without increasing the productivity, our government should not expect more employment generation and better standard of living of the workers in manufacturing sector because our conclusion shows that these four variables cannot move independently.”188
Productivity growth will also be vital to eradicating poverty. In research performed in 2010, Ahsan et al.’s paper, Growth, Employment, and Poverty Trends in India: Unbundling the Links, examines long-term links between poverty reduction and trends in labor markets using state level data for India’s major states in the two decades spanning from 1983 to 2003. They find that “increases in long-term labor productivity are positively correlated with a decrease in poverty.”189 As they write, our “analysis suggests the concerns with “jobless” growth to be somewhat misplaced as neither the employment intensity of growth nor the employment rate across states is found to be significant in reducing poverty. Rather, it is the growth in labor productivity that has the largest impact.”190 They further find that “the role of employment in the manufacturing sector in reducing poverty has not been significant.”
Going forward, the McKinsey Global Institute argues that productivity growth will be the key to growth in the Indian economy through 2020. In The world at work: Jobs, pay, and skills for 3.5 billion people, McKinsey finds that productivity growth will contribute 6.7 percent to India’s anticipated 8 percent compound annual growth rate from 2010 to 2020, while growth in employment will contribute just 1.3 percent to India’s anticipated 8 percent growth. In other words, 80 percent of the growth in India’s economy over the coming decade is expected to arise from productivity gains.191
However, some in India argue that increasing productivity should not be India’s primary economic goal—despite the fact that India’s labor productivity rate in 2010 was one-third that of China’s and 91 percent below the U.S. level, or that the 5.9 percent average annual growth in India’s labor productivity from 2006 to 2011 was barely half China’s 10.4 percent average annual growth—because they contend that the link between higher productivity and job growth has been broken.192 For example, in an op-ed for The Hindu Business Line, Ashoak Upadhyay argues that “more [productivity] growth equals less jobs,” and contends that, “what studies in America and India have discovered is a decoupling of employment from the causal chain of rising productivity and economic growth.”193
Upadhyay agrees that the positive relationship between productivity and employment growth held true in India, but only until 1991, the “watershed year” in which he argues the link between productivity and employment growth broke. Upadhyay cites data from the International Labor Organization’s 2012 Global Employment Trends report showing that, in India, “total employment grew by only 0.1 percent over the five years to 2009/10 (from 457.9 million in 2004/5 to 458 million in 2009/10) while labour productivity grew by more than 34 percent.”194
But looking at just one period tells us very little about the relationship between productivity and jobs. Is 34 percent productivity high compared to other periods, or low? In fact, in India over the past decade, higher rates of labor productivity have tended to be
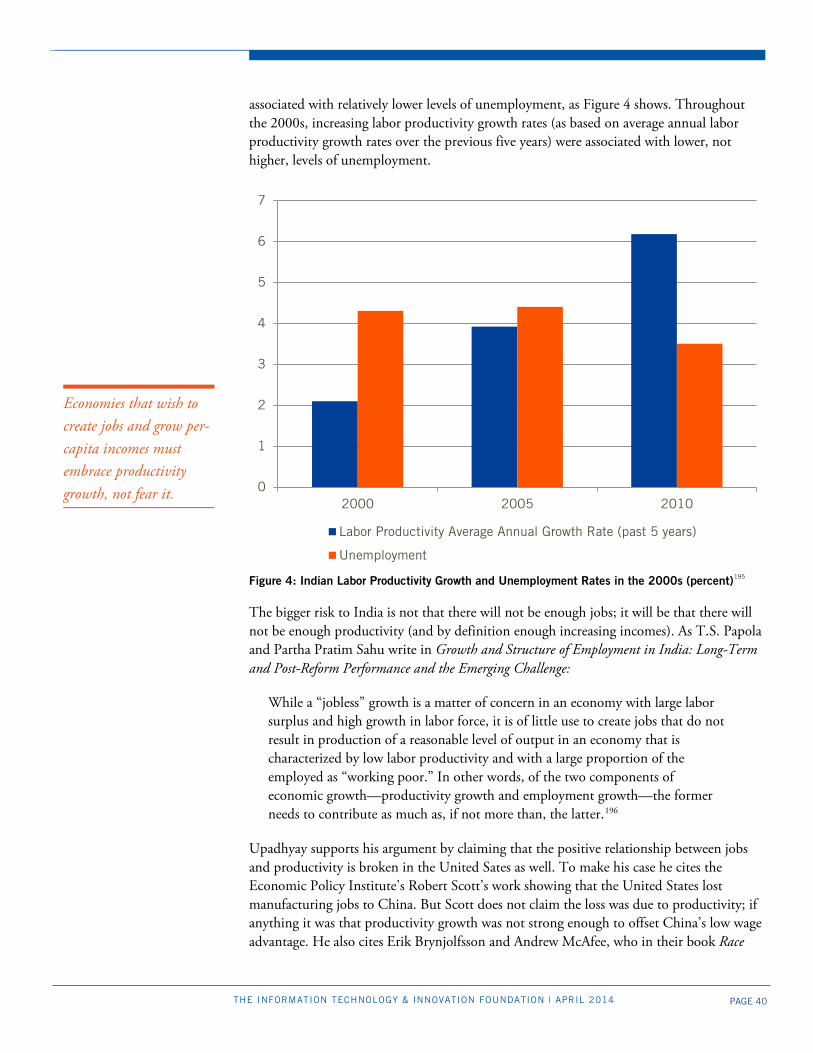
PAGE 40 THE INFORMATION TECHNOLOGY & INNOVATION FOUNDATION | APRIL 2014
associated with relatively lower levels of unemployment, as Figure 4 shows. Throughout the 2000s, increasing labor productivity growth rates (as based on average annual labor productivity growth rates over the previous five years) were associated with lower, not higher, levels of unemployment.
Figure 4: Indian Labor Productivity Growth and Unemployment Rates in the 2000s (percent)195
The bigger risk to India is not that there will not be enough jobs; it will be that there will not be enough productivity (and by definition enough increasing incomes). As T.S. Papola and Partha Pratim Sahu write in Growth and Structure of Employment in India: Long-Term and Post-Reform Performance and the Emerging Challenge:
While a “jobless” growth is a matter of concern in an economy with large labor surplus and high growth in labor force, it is of little use to create jobs that do not result in production of a reasonable level of output in an economy that is characterized by low labor productivity and with a large proportion of the employed as “working poor.” In other words, of the two components of economic growth—productivity growth and employment growth—the former needs to contribute as much as, if not more than, the latter.196
Upadhyay supports his argument by claiming that the positive relationship between jobs and productivity is broken in the United Sates as well. To make his case he cites the Economic Policy Institute’s Robert Scott’s work showing that the United States lost manufacturing jobs to China. But Scott does not claim the loss was due to productivity; if anything it was that productivity growth was not strong enough to offset China’s low wage advantage. He also cites Erik Brynjolfsson and Andrew McAfee, who in their book Race
0
1
2
3
4
5
6
7
2000 2005 2010
Labor Productivity Average Annual Growth Rate (past 5 years)
Unemployment
Economies that wish to create jobs and grow per- capita incomes must embrace productivity growth, not fear it.
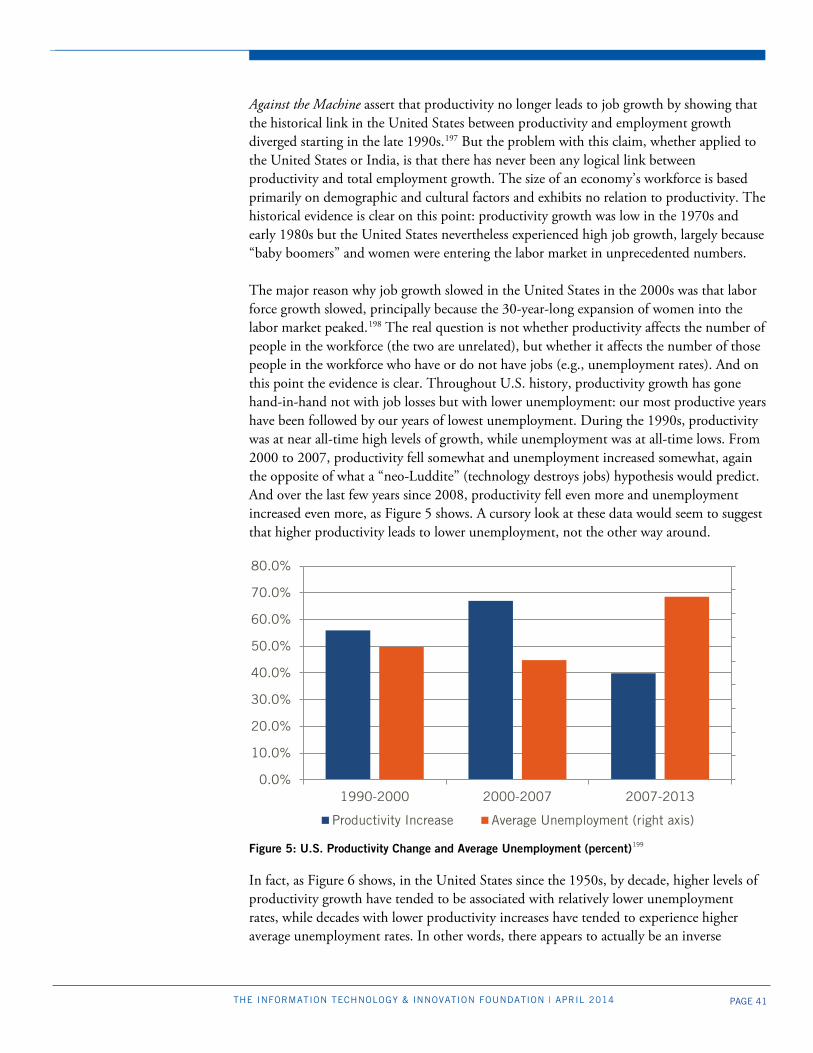
PAGE 41 THE INFORMATION TECHNOLOGY & INNOVATION FOUNDATION | APRIL 2014
Against the Machine assert that productivity no longer leads to job growth by showing that the historical link in the United States between productivity and employment growth diverged starting in the late 1990s.197 But the problem with this claim, whether applied to the United States or India, is that there has never been any logical link between productivity and total employment growth. The size of an economy’s workforce is based primarily on demographic and cultural factors and exhibits no relation to productivity. The historical evidence is clear on this point: productivity growth was low in the 1970s and early 1980s but the United States nevertheless experienced high job growth, largely because “baby boomers” and women were entering the labor market in unprecedented numbers. The major reason why job growth slowed in the United States in the 2000s was that labor force growth slowed, principally because the 30-year-long expansion of women into the labor market peaked.198 The real question is not whether productivity affects the number of people in the workforce (the two are unrelated), but whether it affects the number of those people in the workforce who have or do not have jobs (e.g., unemployment rates). And on this point the evidence is clear. Throughout U.S. history, productivity growth has gone hand-in-hand not with job losses but with lower unemployment: our most productive years have been followed by our years of lowest unemployment. During the 1990s, productivity was at near all-time high levels of growth, while unemployment was at all-time lows. From 2000 to 2007, productivity fell somewhat and unemployment increased somewhat, again the opposite of what a “neo-Luddite” (technology destroys jobs) hypothesis would predict. And over the last few years since 2008, productivity fell even more and unemployment increased even more, as Figure 5 shows. A cursory look at these data would seem to suggest that higher productivity leads to lower unemployment, not the other way around.
Figure 5: U.S. Productivity Change and Average Unemployment (percent)199
In fact, as Figure 6 shows, in the United States since the 1950s, by decade, higher levels of productivity growth have tended to be associated with relatively lower unemployment rates, while decades with lower productivity increases have tended to experience higher average unemployment rates. In other words, there appears to actually be an inverse
0.0%
10.0%
20.0%
30.0%
40.0%
50.0%
60.0%
70.0%
80.0%
1990-2000 2000-2007 2007-2013
Productivity Increase Average Unemployment (right axis)
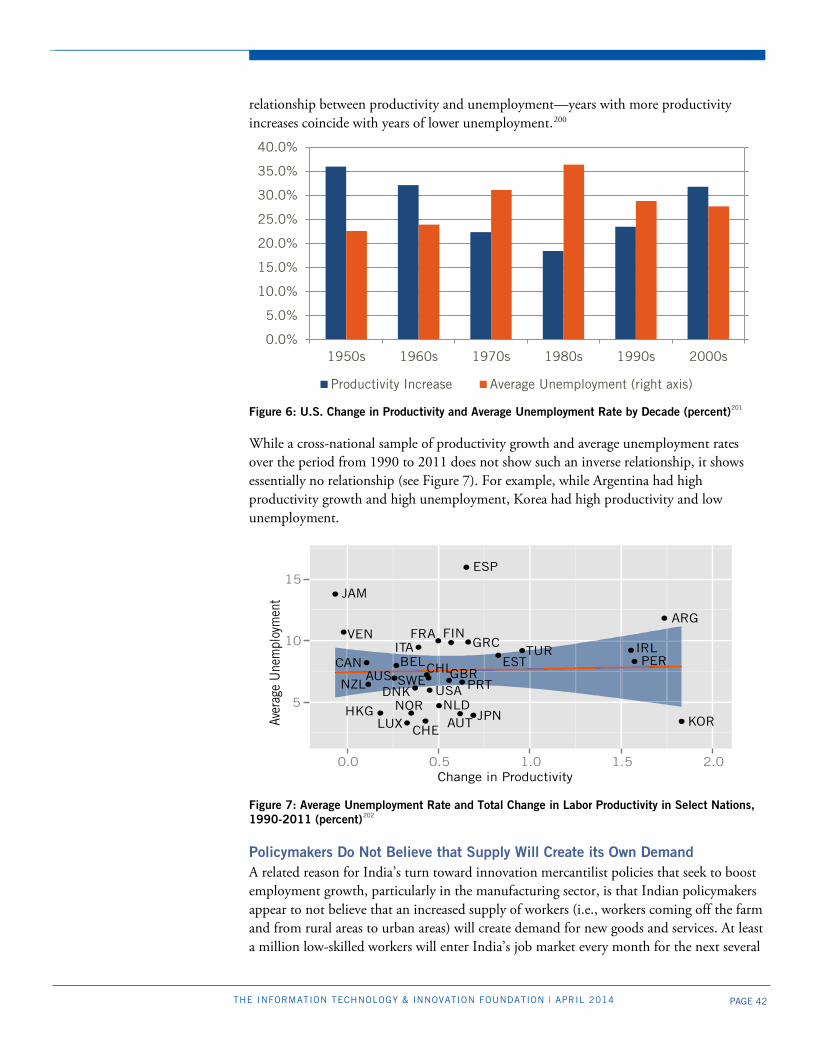
PAGE 42 THE INFORMATION TECHNOLOGY & INNOVATION FOUNDATION | APRIL 2014
relationship between productivity and unemployment—years with more productivity increases coincide with years of lower unemployment.200
Figure 6: U.S. Change in Productivity and Average Unemployment Rate by Decade (percent)201
While a cross-national sample of productivity growth and average unemployment rates over the period from 1990 to 2011 does not show such an inverse relationship, it shows essentially no relationship (see Figure 7). For example, while Argentina had high productivity growth and high unemployment, Korea had high productivity and low unemployment.
Figure 7: Average Unemployment Rate and Total Change in Labor Productivity in Select Nations, 1990-2011 (percent)202
Policymakers Do Not Believe that Supply Will Create its Own Demand A related reason for India’s turn toward innovation mercantilist policies that seek to boost employment growth, particularly in the manufacturing sector, is that Indian policymakers appear to not believe that an increased supply of workers (i.e., workers coming off the farm and from rural areas to urban areas) will create demand for new goods and services. At least a million low-skilled workers will enter India’s job market every month for the next several
0.0%
5.0%
10.0%
15.0%
20.0%
25.0%
30.0%
35.0%
40.0%
1950s 1960s 1970s 1980s 1990s 2000s
Productivity Increase Average Unemployment (right axis)
ARG
AUS
AUT
BELCAN
CHE
CHL
DNK
ESP
EST
FINFRA
GBR
GRC
HKG
IRLITA
JAM
JPN KORLUX
NLDNOR
NZL
PER
PRTSWE
TUR
USA
VEN
5
10
15
0.0 0.5 1.0 1.5 2.0Change in Productivity
Aver
age
Une
mpl
oym
ent
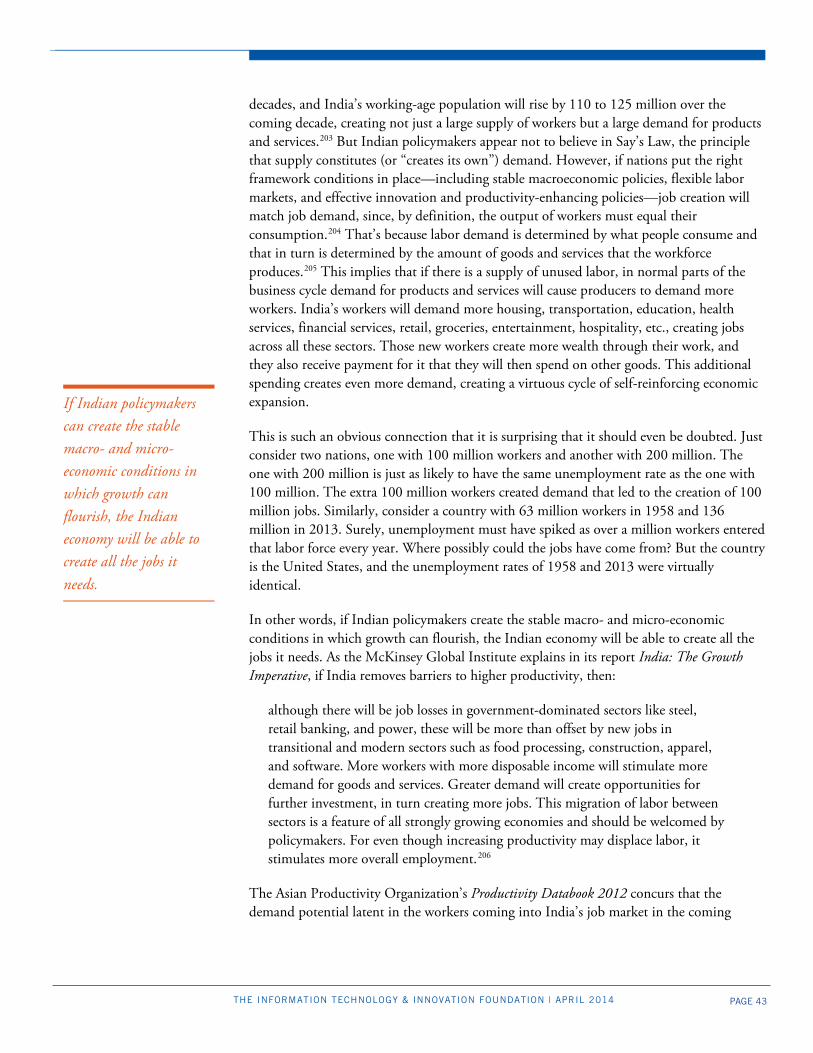
PAGE 43 THE INFORMATION TECHNOLOGY & INNOVATION FOUNDATION | APRIL 2014
decades, and India’s working-age population will rise by 110 to 125 million over the coming decade, creating not just a large supply of workers but a large demand for products and services.203 But Indian policymakers appear not to believe in Say’s Law, the principle that supply constitutes (or “creates its own”) demand. However, if nations put the right framework conditions in place—including stable macroeconomic policies, flexible labor markets, and effective innovation and productivity-enhancing policies—job creation will match job demand, since, by definition, the output of workers must equal their consumption.204 That’s because labor demand is determined by what people consume and that in turn is determined by the amount of goods and services that the workforce produces.205 This implies that if there is a supply of unused labor, in normal parts of the business cycle demand for products and services will cause producers to demand more workers. India’s workers will demand more housing, transportation, education, health services, financial services, retail, groceries, entertainment, hospitality, etc., creating jobs across all these sectors. Those new workers create more wealth through their work, and they also receive payment for it that they will then spend on other goods. This additional spending creates even more demand, creating a virtuous cycle of self-reinforcing economic expansion.
This is such an obvious connection that it is surprising that it should even be doubted. Just consider two nations, one with 100 million workers and another with 200 million. The one with 200 million is just as likely to have the same unemployment rate as the one with 100 million. The extra 100 million workers created demand that led to the creation of 100 million jobs. Similarly, consider a country with 63 million workers in 1958 and 136 million in 2013. Surely, unemployment must have spiked as over a million workers entered that labor force every year. Where possibly could the jobs have come from? But the country is the United States, and the unemployment rates of 1958 and 2013 were virtually identical.
In other words, if Indian policymakers create the stable macro- and micro-economic conditions in which growth can flourish, the Indian economy will be able to create all the jobs it needs. As the McKinsey Global Institute explains in its report India: The Growth Imperative, if India removes barriers to higher productivity, then:
although there will be job losses in government-dominated sectors like steel, retail banking, and power, these will be more than offset by new jobs in transitional and modern sectors such as food processing, construction, apparel, and software. More workers with more disposable income will stimulate more demand for goods and services. Greater demand will create opportunities for further investment, in turn creating more jobs. This migration of labor between sectors is a feature of all strongly growing economies and should be welcomed by policymakers. For even though increasing productivity may displace labor, it stimulates more overall employment.206
The Asian Productivity Organization’s Productivity Databook 2012 concurs that the demand potential latent in the workers coming into India’s job market in the coming
If Indian policymakers can create the stable macro- and micro-economic conditions in which growth can flourish, the Indian economy will be able to create all the jobs it needs.

PAGE 44 THE INFORMATION TECHNOLOGY & INNOVATION FOUNDATION | APRIL 2014
decade can provide the employment opportunities needed, provided Indian policymakers get the macroeconomic framework conditions right. The report argues that:
India, on the other hand [compared to China], has one of the most favorable demographics in waiting. This demographic dividend can work wonders to produce virtuous cycles of wealth creation if it is combined with appropriate health, labor, financial, human capital, and growth-enhancing economic policies. If India is able to capitalize on this dividend, it may well overtake China in economic growth in the not-so-distant future. However, the experience of East Asia suggests that this dividend is far from being automatic but needs to be earned. This one-off opportunity will pass in a couple of generations, and it will be regrettable if it is missed.207
Likewise, as Mukesh Ambani explains in his essay “Making the Next Leap,” in Reimagining India, “already the Indian middle class exceeds four hundred million, and by 2040, it could conceivably top one billion—which would create a wave of new demand with the power to inspire all manner of innovative new products and services.”208 Or, as Arvind Subramanian further elaborates in his essay “The Precocious Experiment” in Reimagining India, “growth begets growth” and “while policymakers have done the minimum to start growth, growth itself is now the driver of change, and is begetting more.”209 Subramanian notes that this process works through several channels, including “a three-decade long growth spurt [that] has fostered entrepreneurship” and which “helps keep the economic engine purring,” as well as the fact that “rising demand allows the private to supplant the public sector” in sectors such as energy and education.
To be sure, unemployment has remained a challenge, particularly in developing countries such as India, where the situation is complicated by a large “informal” sector—often comprising more than half the population. On average, these informal jobs are much less productive than formal sector employment, and have correspondingly low wages. (That’s why virtually all economic studies find that formalization is always a positive contributor to economic growth, and that formalization of any hitherto informal segment of the economy increases the rate of economic growth.) 210
Informal employment is sometimes understood as a version of unemployment. But informal employment can be seen as a manifestation of Say’s Law, where informal jobs are created by society’s unlimited demand for goods and services. However, it reveals an important caveat to the law: if informality is widespread it means that the workers in informal sectors are not productive enough to demand more goods and services, and so the impact on job growth is limited. Policies that enable informality only provide a low-wage equilibrium where employers in both the formal and informal sector have less incentive to raise employee productivity.
However, when employers have incentives to raise productivity, as is happening in China as the country’s large body of farm-to-factory workers dries up, employee wages begin to rise faster than productivity, requiring companies to boost productivity even more, which in turn lowers price and raises demand even more. Fortunately for India, evidence shows that the country does not have to wait for a macroeconomic labor supply crunch to

PAGE 45 THE INFORMATION TECHNOLOGY & INNOVATION FOUNDATION | APRIL 2014
incentivize productivity: policies designed to increase business productivity can push wages up, prices down, and demand for more workers up on their own, as Cheong and Jansen found in their study of employment, productivity, and trade in developing countries.211 Put simply, if Indian policymakers can put in place the right, stable macroeconomic conditions along with productivity-enhancing economic policies, the country will be able to create the tens of millions of jobs it needs to meet the demographic dividend.
Focusing More on Productivity Growth from the “Shift” Rather Than “Growth” Effect As noted, productivity growth—the increase in the amount of output produced per a given unit of effort (labor and capital)—is the most important measure and determinant of economic performance for any nation.212 Economies can increase their productivity in two ways: either through the “growth effect” or the “shift effect.” In the first, all sectors of an economy become more productive. For example, a country’s retail, banking, transportation, and automobile manufacturing sectors might all increase their productivity at the same time. This can happen as a result of firms investing in new technologies or improving workers’ skills, or by higher productivity firms gaining market share from lower productivity firms within an industry (e.g., Walmart gaining customers that used to shop at “mom and pop” stores). The second method, the shift effect, occurs when low-productivity industries lose share to high-productivity industries (e.g., a country’s semiconductor industry grows while its textile industry shrinks).
But which productivity strategy—across-the-board growth or the shift effect—is the best path to higher productivity and higher per-capita income? The answer depends in large part on the size of the economy. The larger the economy, the more important the growth effect is, while the smaller the economy, the more important the shift effect is. To understand why, consider an automobile factory in a small city. If its managers install a new computer-aided manufacturing system and raise the plant’s productivity (the growth effect), a large share of the benefits will flow to the firm’s customers around the nation and even around the world in the form of lower prices. The city will benefit only to the extent that its residents buy cars from that factory or if some of the increases in productivity go to higher wages instead of only to lower prices.213 In contrast, if the city attracts another auto plant to replace a textile firm (where value added per worker is less) that moved overseas to a low-wage nation—an example of the shift effect—most of the benefits will accrue to residents in the form of higher wages for the workers who moved from the textile plant to the car factory (and from more spending at local-serving businesses such as restaurants, dry cleaners, furniture stores, etc.). This means that, while both productivity strategies can boost productivity levels and lead to higher per-capita incomes, across-the-board productivity growth—rather than a shift to higher-value-added sectors—will be more important for larger economies because their consumers will capture a greater share of the productivity gains.
Put simply, the lion’s share of productivity growth for almost all nations, especially a nation with an economy as large as India’s, comes not from changing the sectoral mix to higher-productivity industries, but from all industries and organizations, even low-productivity ones, boosting their productivity.214 But despite the fact that an across-the-
Productivity growth—the increase in the amount of output produced per a given unit of effort (labor and capital)—is the most important measure and determinant of economic performance for any nation.

PAGE 46 THE INFORMATION TECHNOLOGY & INNOVATION FOUNDATION | APRIL 2014
board productivity growth strategy can set the foundation for providing the economic and employment growth countries need, policymakers in developing nations all too often think that such a strategy will be insufficient to generate satisfactory economic and employment growth.215
This mirrors a long tradition in the international development field of focusing more on growth from the shift effect than from the growth effect. As Paul Krugman writes in The Fall and Rise of Development Economics, there is a long history of the emphasis on the shift strategy.216 Krugman cites a seminal 1943 paper by Rosenstein Rodan that argued for investment in manufacturing, discussing how “unemployed workers...are taken from the land and put into a large new shoe factory.”217 In the late 1950s, Albert O. Hirschman’s The Strategy of Economic Development articulated the theory of forward and backward linkages, which was largely premised on the notion of large scale capital formation in select manufacturing industries that then provided linkages, as nations evolved from agriculture.218 In the 1960s, Walt Rostow’s Stages of Growth argued that countries must grow first through agriculture, then manufacturing, and finally services. Essentially, Rostow asserted that countries go through each of these stages fairly linearly, where stage one reflects a primary society of agriculture, stage two represents an industrial revolution, stage three represents a manufacturing economy, stage four represents a diversification toward a consumer goods economy, and stage five represents an economy with high disposable income.219
As Sukti Dasgupta and Ajit Singh explain in Manufacturing, Services and Premature Deindustrialization in Developing Countries: A Kaldorian Analysis, the Cambridge economist Nicholas Kaldor argued that “the rate of productivity growth depends on the expansion of the manufacturing sector. Expansion of the manufacturing sector will lead to more productivity growth from the manufacturing sector, which will lead to more productivity across the whole economy.”220 The so-called “Kaldor’s growth laws” held that, “the more rapid expansion of manufacturing relative to the economy results in more rapid GDP growth as well as more rapid productivity growth within manufacturing and also agriculture.”221
This deep bias in favor of the shift strategy of development continues to be reflected in much of today’s scholarly development literature. For example, Enrique Casares argues in Productivity, Structural Change in Employment and Economic Growth that sector-specific productivity changes in the manufacturing sector can increase the aggregate growth rate of an economy, but when sector-specific productivity changes occur in the non-manufacturing sector, the aggregate growth rate of an economy remains the same. In other words, all structural changes are dependent on the manufacturing sector because it is this sector that is responsible for transferring knowledge to other sectors.222
Despite this tradition—and frankly, bias—in the development literature, more recent evidence, and perhaps more recent circumstances (e.g., the importance of traded services and the easier ability to increase non-manufacturing productivity through information technology), suggest that it is not the shift effect that maximizes growth in developing nations; rather, it is the growth effect. Indeed, an increasingly robust body of economics
PAGE 47 THE INFORMATION TECHNOLOGY & INNOVATION FOUNDATION | APRIL 2014
literature finds that across-the-board productivity growth is actually the key driver of economic growth, for developed and developing countries alike.
In other words, the productivity and innovation capacity of a country’s sectors matters more than its mix of sectors, suggesting that across-the-board productivity growth is the optimal way for countries, developed and developing alike, to grow. This is exactly what the McKinsey Global Institute’s 2010 report, How to Compete and Grow: A Sector Guide to Policy, finds. Countries that outperform their peers on productivity do not have a more “favorable” sector mix (e.g., more high-tech industries), but instead have more productive firms overall, regardless of sector.223 As the report elaborates:
Some observers believe that countries can outperform their peers because they have a mix of sectors that have a more favorable growth momentum. But the mix of sectors does not explain differences in the growth performance of countries with similar levels of income at all. The mix of sectors is surprisingly similar across countries at broadly equivalent stages of economic development. It is not the mix of sectors that decides the growth in developed economies, but rather the actual performance within the sectors compared with their counterparts in peer economies…This demonstrates the fact that, even if they started with a less favorable sector mix, the fastest-growing countries outperformed their peers in terms of their sector competitiveness.224
These findings apply not just to the developed world; similar results held when applied to a basket of six developing countries: Brazil, China, India, Mexico, Russia, and South Africa. McKinsey found that compound annual growth rates from 1995 to 2005 ranged from 3.5 percent in Brazil, to 5.5 percent in India, to 9.1 percent in China, as Figure 8 shows. These actual growth rates differ from the “growth momentum” predicted by these countries’ initial sectoral mixes in 1995. That is, if each country’s sectors had grown at the average growth rate of the six countries’ respective sectors, Brazil’s economy would have been expected to grow by 5.9 percent, India’s by 5.2 percent, and China’s by 5.7 percent. Thus, the variation from this prediction in the actual performance of these countries with their given sector mixes—from positive 3.4 percent and 0.3 percent in the cases of China and India, respectively, to negative 2.5 percent for Brazil—explains overall differences in growth. As McKinsey concludes, “this demonstrates the fact that, even if they started with a less favorable sector mix, the fastest-growing countries outperformed their peers in terms of their sector competitiveness.”225 In other words, attracting or growing firms in high-value-added export sectors is not likely to be the major path to growth for India in the long run, but boosting productivity across the vast swath of sectors in its economy—the majority of them non-traded, domestic-serving sectors—is.226
Similarly, Kucera and Roncolato decompose aggregate labour productivity and employment growth into their sectoral components and assess within-sector and employment reallocation effects for a sample of 81 developed and developing countries using data going back to the mid-1980s.227 They define the “reallocation effect” as the change in aggregate productivity resulting from shifts in the composition of employment or output among sectors with different levels of productivity, and the “within-sector effect” as
The productivity and innovation capacity of a country’s sectors matters more than its mix of sectors, suggesting that across-the-board productivity growth is the optimal way for countries, developed and developing alike, to grow.

PAGE 48 THE INFORMATION TECHNOLOGY & INNOVATION FOUNDATION | APRIL 2014
the change in aggregate productivity resulting from the sum of changes in productivity within sectors.
Figure 8: Contribution to Total Value Added, 1995-2005 Compound Annual Growth Rate (percent)228
As Figure 9 shows, the authors find that aggregate labor productivity growth in Asia is driven as much as services as by industry and that the within-sector effects on aggregate labor productivity growth are more important than employment reallocation effects, a pattern that holds for all regions.229 In other words, they find that productivity growth across all sectors is more powerful than reallocating the mix of sectors toward those with higher productivity growth. For India, the authors find that within-sector effects contributed 5 percent and reallocation affects just 0.3 percent to India’s average annual labor productivity growth from 1999 to 2008. In other words, the growth effect accounted for 94 percent of all productivity growth. Across 14 assessed Asian economies, within-sector effects were also far stronger drivers of labor productivity growth, accounting for 2.9 percent of labor productivity growth, while reallocation effects accounted for only 1 percent of growth.
Further, Kucera and Roncolato find that “within-sector effects are more important than reallocation effects in accounting for the wide gap in labour productivity growth between Asia and LAC [Latin America and the Caribbean].”230 This finding corroborates research performed by Ocampo, Rada, and Taylor from 2009, which evaluated 12 country groups comprised of 57 developed and transition countries across Asia and Latin America.231 Their research found that total reallocation effects were positive for both regions, but that total within-sector effects were much larger for Asia, and that, in sum, the wide gap in aggregate labor productivity growth between the two regions is accounted for more by within-sector than reallocation effects.232
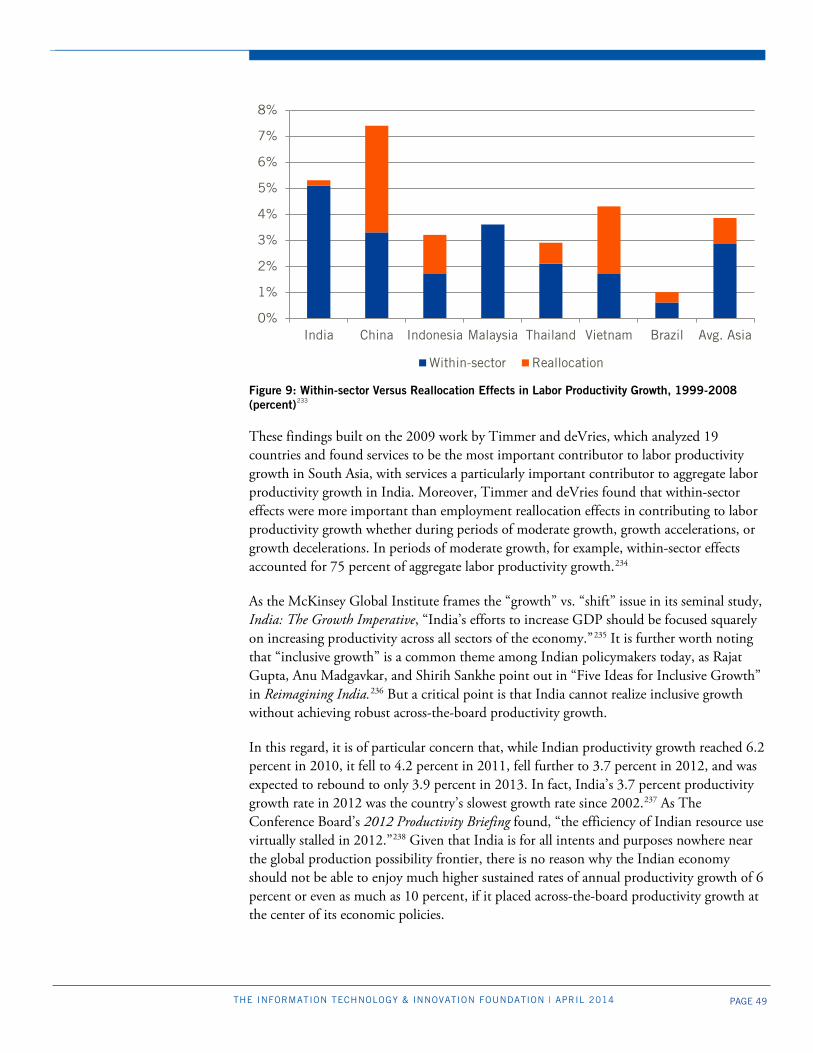
PAGE 49 THE INFORMATION TECHNOLOGY & INNOVATION FOUNDATION | APRIL 2014
Figure 9: Within-sector Versus Reallocation Effects in Labor Productivity Growth, 1999-2008 (percent)233
These findings built on the 2009 work by Timmer and deVries, which analyzed 19 countries and found services to be the most important contributor to labor productivity growth in South Asia, with services a particularly important contributor to aggregate labor productivity growth in India. Moreover, Timmer and deVries found that within-sector effects were more important than employment reallocation effects in contributing to labor productivity growth whether during periods of moderate growth, growth accelerations, or growth decelerations. In periods of moderate growth, for example, within-sector effects accounted for 75 percent of aggregate labor productivity growth.234
As the McKinsey Global Institute frames the “growth” vs. “shift” issue in its seminal study, India: The Growth Imperative, “India’s efforts to increase GDP should be focused squarely on increasing productivity across all sectors of the economy.”235 It is further worth noting that “inclusive growth” is a common theme among Indian policymakers today, as Rajat Gupta, Anu Madgavkar, and Shirih Sankhe point out in “Five Ideas for Inclusive Growth” in Reimagining India.236 But a critical point is that India cannot realize inclusive growth without achieving robust across-the-board productivity growth.
In this regard, it is of particular concern that, while Indian productivity growth reached 6.2 percent in 2010, it fell to 4.2 percent in 2011, fell further to 3.7 percent in 2012, and was expected to rebound to only 3.9 percent in 2013. In fact, India’s 3.7 percent productivity growth rate in 2012 was the country’s slowest growth rate since 2002.237 As The Conference Board’s 2012 Productivity Briefing found, “the efficiency of Indian resource use virtually stalled in 2012.”238 Given that India is for all intents and purposes nowhere near the global production possibility frontier, there is no reason why the Indian economy should not be able to enjoy much higher sustained rates of annual productivity growth of 6 percent or even as much as 10 percent, if it placed across-the-board productivity growth at the center of its economic policies.
0%
1%
2%
3%
4%
5%
6%
7%
8%
India China Indonesia Malaysia Thailand Vietnam Brazil Avg. Asia
Within-sector Reallocation
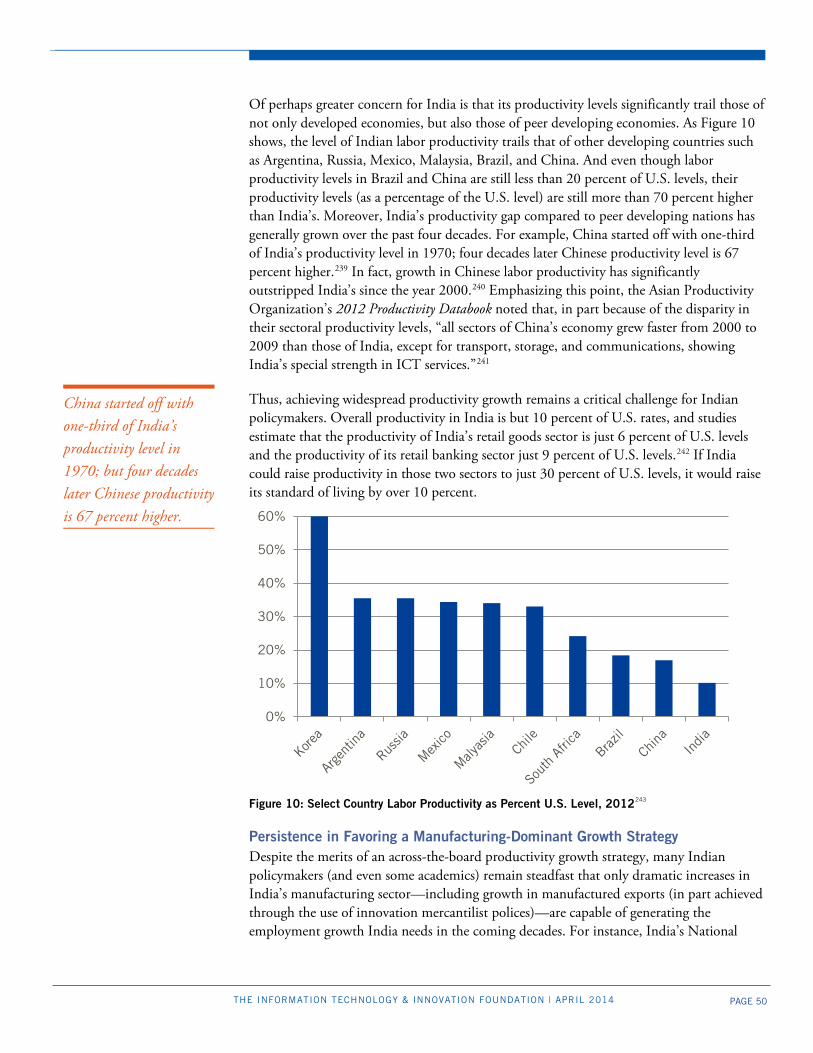
PAGE 50 THE INFORMATION TECHNOLOGY & INNOVATION FOUNDATION | APRIL 2014
Of perhaps greater concern for India is that its productivity levels significantly trail those of not only developed economies, but also those of peer developing economies. As Figure 10 shows, the level of Indian labor productivity trails that of other developing countries such as Argentina, Russia, Mexico, Malaysia, Brazil, and China. And even though labor productivity levels in Brazil and China are still less than 20 percent of U.S. levels, their productivity levels (as a percentage of the U.S. level) are still more than 70 percent higher than India’s. Moreover, India’s productivity gap compared to peer developing nations has generally grown over the past four decades. For example, China started off with one-third of India’s productivity level in 1970; four decades later Chinese productivity level is 67 percent higher.239 In fact, growth in Chinese labor productivity has significantly outstripped India’s since the year 2000.240 Emphasizing this point, the Asian Productivity Organization’s 2012 Productivity Databook noted that, in part because of the disparity in their sectoral productivity levels, “all sectors of China’s economy grew faster from 2000 to 2009 than those of India, except for transport, storage, and communications, showing India’s special strength in ICT services.”241
Thus, achieving widespread productivity growth remains a critical challenge for Indian policymakers. Overall productivity in India is but 10 percent of U.S. rates, and studies estimate that the productivity of India’s retail goods sector is just 6 percent of U.S. levels and the productivity of its retail banking sector just 9 percent of U.S. levels.242 If India could raise productivity in those two sectors to just 30 percent of U.S. levels, it would raise its standard of living by over 10 percent.
Figure 10: Select Country Labor Productivity as Percent U.S. Level, 2012243
Persistence in Favoring a Manufacturing-Dominant Growth Strategy Despite the merits of an across-the-board productivity growth strategy, many Indian policymakers (and even some academics) remain steadfast that only dramatic increases in India’s manufacturing sector—including growth in manufactured exports (in part achieved through the use of innovation mercantilist polices)—are capable of generating the employment growth India needs in the coming decades. For instance, India’s National
0%
10%
20%
30%
40%
50%
60%
China started off with one-third of India’s productivity level in 1970; but four decades later Chinese productivity is 67 percent higher.
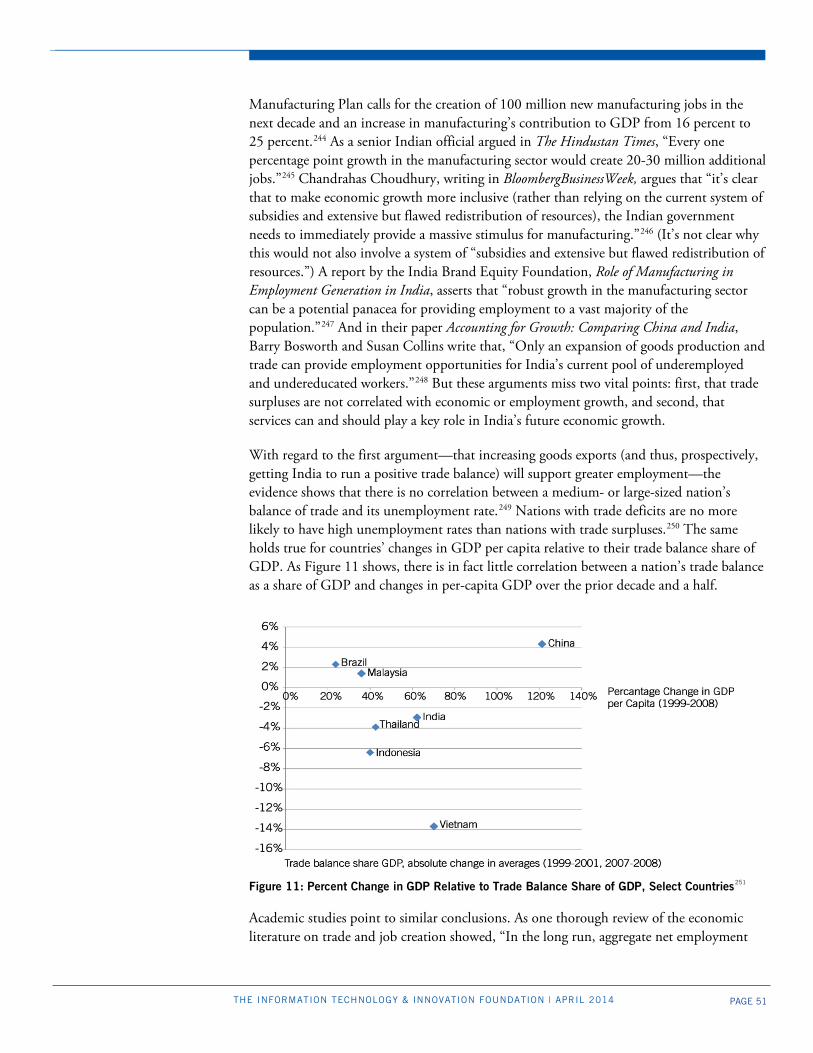
PAGE 51 THE INFORMATION TECHNOLOGY & INNOVATION FOUNDATION | APRIL 2014
Manufacturing Plan calls for the creation of 100 million new manufacturing jobs in the next decade and an increase in manufacturing’s contribution to GDP from 16 percent to 25 percent.244 As a senior Indian official argued in The Hindustan Times, “Every one percentage point growth in the manufacturing sector would create 20-30 million additional jobs.”245 Chandrahas Choudhury, writing in BloombergBusinessWeek, argues that “it’s clear that to make economic growth more inclusive (rather than relying on the current system of subsidies and extensive but flawed redistribution of resources), the Indian government needs to immediately provide a massive stimulus for manufacturing.”246 (It’s not clear why this would not also involve a system of “subsidies and extensive but flawed redistribution of resources.”) A report by the India Brand Equity Foundation, Role of Manufacturing in Employment Generation in India, asserts that “robust growth in the manufacturing sector can be a potential panacea for providing employment to a vast majority of the population.”247 And in their paper Accounting for Growth: Comparing China and India, Barry Bosworth and Susan Collins write that, “Only an expansion of goods production and trade can provide employment opportunities for India’s current pool of underemployed and undereducated workers.”248 But these arguments miss two vital points: first, that trade surpluses are not correlated with economic or employment growth, and second, that services can and should play a key role in India’s future economic growth.
With regard to the first argument—that increasing goods exports (and thus, prospectively, getting India to run a positive trade balance) will support greater employment—the evidence shows that there is no correlation between a medium- or large-sized nation’s balance of trade and its unemployment rate.249 Nations with trade deficits are no more likely to have high unemployment rates than nations with trade surpluses.250 The same holds true for countries’ changes in GDP per capita relative to their trade balance share of GDP. As Figure 11 shows, there is in fact little correlation between a nation’s trade balance as a share of GDP and changes in per-capita GDP over the prior decade and a half.
Figure 11: Percent Change in GDP Relative to Trade Balance Share of GDP, Select Countries251
Academic studies point to similar conclusions. As one thorough review of the economic literature on trade and job creation showed, “In the long run, aggregate net employment
PAGE 52 THE INFORMATION TECHNOLOGY & INNOVATION FOUNDATION | APRIL 2014
largely is unaffected by international factors, whereas these factors have important allocative effects in the short and long run, both between and within detailed industries.” In other words, despite what policymakers in many nations believe, trade surpluses or deficits can change the mix of industries and firms, but they don’t change the overall number of domestic jobs or the rate of job growth over the medium and long term. As a National Bureau of Economics Research paper concluded in considering China, “while exports have become increasingly important in stimulating employment in China…the same gains could be obtained from growth in domestic demand, especially for tradable goods.”
The logic underlying this goes back to the simple Macroeconomics 101 growth equation: a change in GDP equals the sum of the changes in consumer spending, government spending, corporate investment, and net exports (exports minus imports). [For those who remember their macroeconomics, this is the classic GDP = C + I + G + (Ex-Im) formula.] In other words, India could grow just as rapidly by pursuing a robust domestic expansionary economy that drives growth through increased domestic consumption, business investment, and/or government spending. As noted, if countries have put the right macroeconomic conditions in place (e.g., a loose monetary policy, aggressive fiscal policy, and a better social safety net so citizens aren’t compelled to save most of their money for their future security), they don’t need trade surpluses to create jobs. As noted previously, as more Indian workers move from rural areas to urban areas, they should automatically be able to get jobs as long as India runs an expansionary domestic economic policy, because each new Indian worker also automatically becomes a new Indian consumer, creating demand to employ other workers.
With regard to the second issue, there has been extensive debate about India’s development path and its relevance for other developing countries, in particular whether and how services can provide an alternative to manufacturing as a driver of economic development.252 In Structure Matters: Sectoral drivers of growth and the labour productivity-employment relationship, Kucera and Roncolato point out that the development literature has taken three different perspectives on the role of services in countries’ economic development, with services as either:
1. A potential substitute for manufacturing, enabling countries to leapfrog from agriculture to services and pass over manufacturing to a large extent.
2. A lagging complement to manufacturing, expanding alongside manufacturing because services are, as Kaldor put it, “derived from…industrial activities.”
3. A leading complement to manufacturing, expanding alongside manufacturing because, in contrast to Kaldor, services can generate industrial as well as other activities. In this view, services can be a leading sector, though a strong manufacturing base remains essential.253
Each view has its adherents. Ghani and Kharas argue that India’s experience shows that services can provide an alternative to manufacturing as a leading sector in driving economic growth, for services have become increasingly tradeable, and share with manufacturing the potential for increasing returns to scale. As they write, “The globalization of services
The evidence shows that there is no correlation between a medium- or large-sized nation’s balance of trade and its unemployment rate.
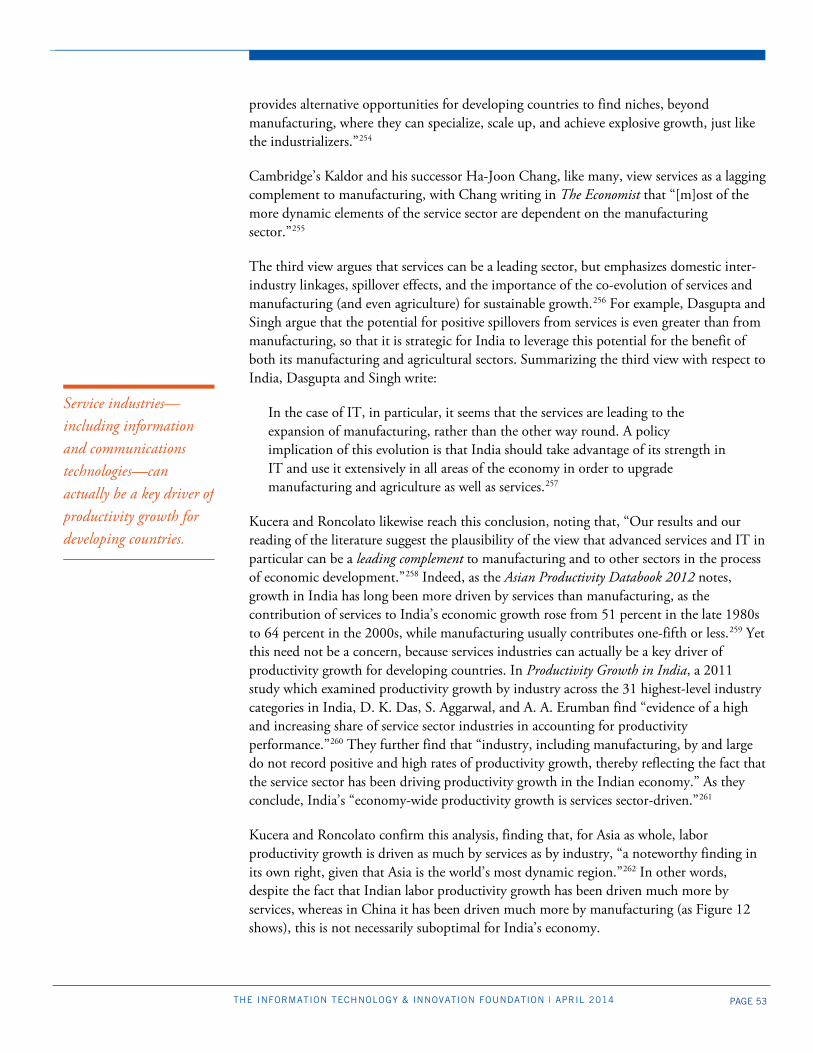
PAGE 53 THE INFORMATION TECHNOLOGY & INNOVATION FOUNDATION | APRIL 2014
provides alternative opportunities for developing countries to find niches, beyond manufacturing, where they can specialize, scale up, and achieve explosive growth, just like the industrializers.”254
Cambridge’s Kaldor and his successor Ha-Joon Chang, like many, view services as a lagging complement to manufacturing, with Chang writing in The Economist that “[m]ost of the more dynamic elements of the service sector are dependent on the manufacturing sector.”255
The third view argues that services can be a leading sector, but emphasizes domestic inter-industry linkages, spillover effects, and the importance of the co-evolution of services and manufacturing (and even agriculture) for sustainable growth.256 For example, Dasgupta and Singh argue that the potential for positive spillovers from services is even greater than from manufacturing, so that it is strategic for India to leverage this potential for the benefit of both its manufacturing and agricultural sectors. Summarizing the third view with respect to India, Dasgupta and Singh write:
In the case of IT, in particular, it seems that the services are leading to the expansion of manufacturing, rather than the other way round. A policy implication of this evolution is that India should take advantage of its strength in IT and use it extensively in all areas of the economy in order to upgrade manufacturing and agriculture as well as services.257
Kucera and Roncolato likewise reach this conclusion, noting that, “Our results and our reading of the literature suggest the plausibility of the view that advanced services and IT in particular can be a leading complement to manufacturing and to other sectors in the process of economic development.”258 Indeed, as the Asian Productivity Databook 2012 notes, growth in India has long been more driven by services than manufacturing, as the contribution of services to India’s economic growth rose from 51 percent in the late 1980s to 64 percent in the 2000s, while manufacturing usually contributes one-fifth or less.259 Yet this need not be a concern, because services industries can actually be a key driver of productivity growth for developing countries. In Productivity Growth in India, a 2011 study which examined productivity growth by industry across the 31 highest-level industry categories in India, D. K. Das, S. Aggarwal, and A. A. Erumban find “evidence of a high and increasing share of service sector industries in accounting for productivity performance.”260 They further find that “industry, including manufacturing, by and large do not record positive and high rates of productivity growth, thereby reflecting the fact that the service sector has been driving productivity growth in the Indian economy.” As they conclude, India’s “economy-wide productivity growth is services sector-driven.”261
Kucera and Roncolato confirm this analysis, finding that, for Asia as whole, labor productivity growth is driven as much by services as by industry, “a noteworthy finding in its own right, given that Asia is the world’s most dynamic region.”262 In other words, despite the fact that Indian labor productivity growth has been driven much more by services, whereas in China it has been driven much more by manufacturing (as Figure 12 shows), this is not necessarily suboptimal for India’s economy.
Service industries—including information and communications technologies—can actually be a key driver of productivity growth for developing countries.
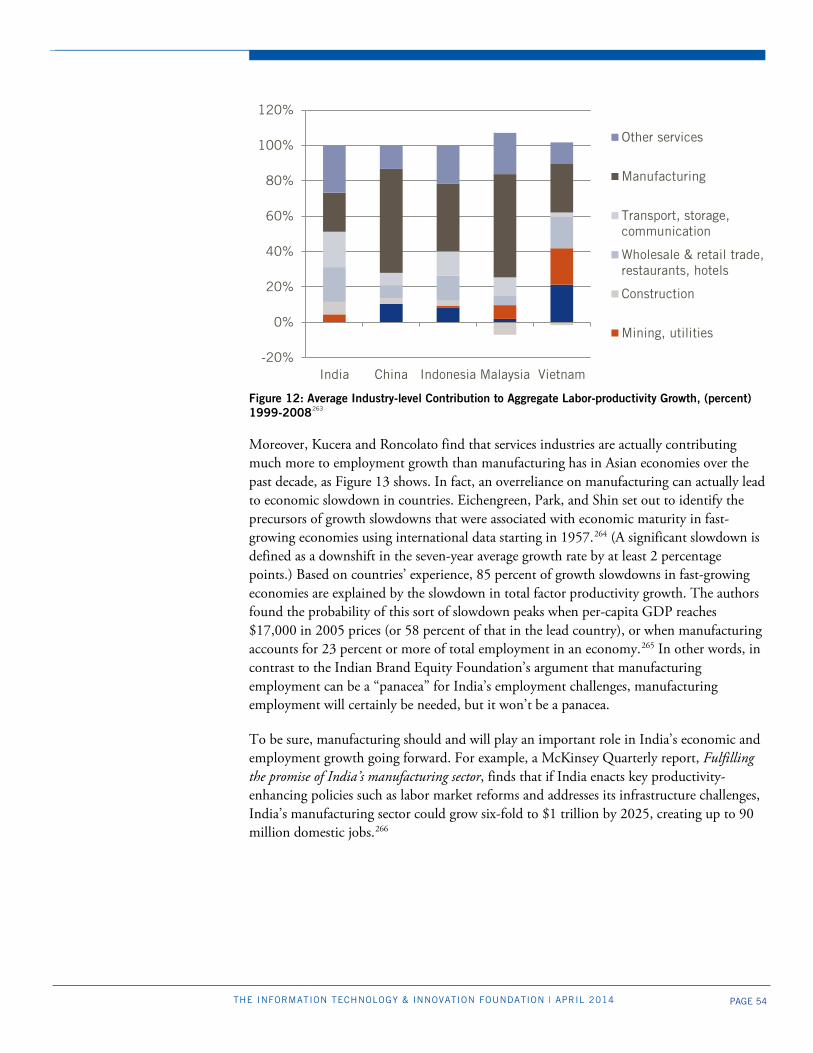
PAGE 54 THE INFORMATION TECHNOLOGY & INNOVATION FOUNDATION | APRIL 2014
Figure 12: Average Industry-level Contribution to Aggregate Labor-productivity Growth, (percent) 1999-2008263
Moreover, Kucera and Roncolato find that services industries are actually contributing much more to employment growth than manufacturing has in Asian economies over the past decade, as Figure 13 shows. In fact, an overreliance on manufacturing can actually lead to economic slowdown in countries. Eichengreen, Park, and Shin set out to identify the precursors of growth slowdowns that were associated with economic maturity in fast-growing economies using international data starting in 1957.264 (A significant slowdown is defined as a downshift in the seven-year average growth rate by at least 2 percentage points.) Based on countries’ experience, 85 percent of growth slowdowns in fast-growing economies are explained by the slowdown in total factor productivity growth. The authors found the probability of this sort of slowdown peaks when per-capita GDP reaches $17,000 in 2005 prices (or 58 percent of that in the lead country), or when manufacturing accounts for 23 percent or more of total employment in an economy.265 In other words, in contrast to the Indian Brand Equity Foundation’s argument that manufacturing employment can be a “panacea” for India’s employment challenges, manufacturing employment will certainly be needed, but it won’t be a panacea.
To be sure, manufacturing should and will play an important role in India’s economic and employment growth going forward. For example, a McKinsey Quarterly report, Fulfilling the promise of India’s manufacturing sector, finds that if India enacts key productivity-enhancing policies such as labor market reforms and addresses its infrastructure challenges, India’s manufacturing sector could grow six-fold to $1 trillion by 2025, creating up to 90 million domestic jobs.266
-20%
0%
20%
40%
60%
80%
100%
120%
India China Indonesia Malaysia Vietnam
Other services
Manufacturing
Transport, storage,communication
Wholesale & retail trade,restaurants, hotels
Construction
Mining, utilities
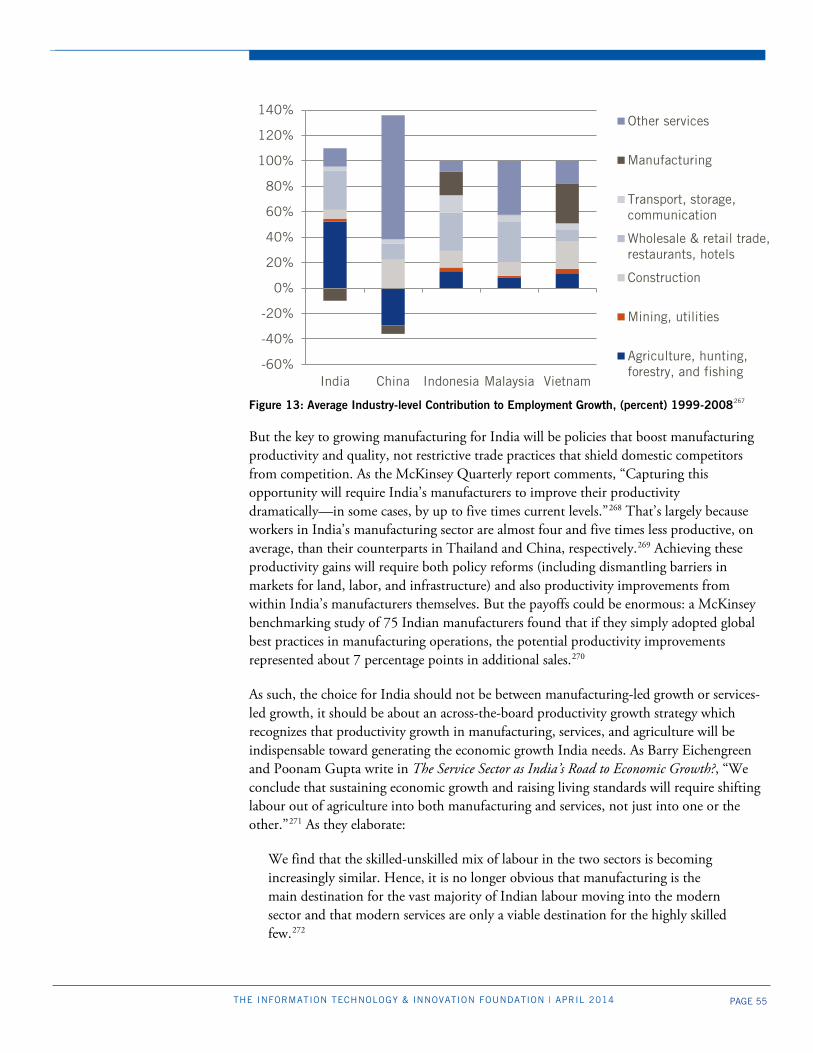
PAGE 55 THE INFORMATION TECHNOLOGY & INNOVATION FOUNDATION | APRIL 2014
Figure 13: Average Industry-level Contribution to Employment Growth, (percent) 1999-2008267
But the key to growing manufacturing for India will be policies that boost manufacturing productivity and quality, not restrictive trade practices that shield domestic competitors from competition. As the McKinsey Quarterly report comments, “Capturing this opportunity will require India’s manufacturers to improve their productivity dramatically—in some cases, by up to five times current levels.”268 That’s largely because workers in India’s manufacturing sector are almost four and five times less productive, on average, than their counterparts in Thailand and China, respectively.269 Achieving these productivity gains will require both policy reforms (including dismantling barriers in markets for land, labor, and infrastructure) and also productivity improvements from within India’s manufacturers themselves. But the payoffs could be enormous: a McKinsey benchmarking study of 75 Indian manufacturers found that if they simply adopted global best practices in manufacturing operations, the potential productivity improvements represented about 7 percentage points in additional sales.270
As such, the choice for India should not be between manufacturing-led growth or services-led growth, it should be about an across-the-board productivity growth strategy which recognizes that productivity growth in manufacturing, services, and agriculture will be indispensable toward generating the economic growth India needs. As Barry Eichengreen and Poonam Gupta write in The Service Sector as India’s Road to Economic Growth?, “We conclude that sustaining economic growth and raising living standards will require shifting labour out of agriculture into both manufacturing and services, not just into one or the other.”271 As they elaborate:
We find that the skilled-unskilled mix of labour in the two sectors is becoming increasingly similar. Hence, it is no longer obvious that manufacturing is the main destination for the vast majority of Indian labour moving into the modern sector and that modern services are only a viable destination for the highly skilled few.272
-60%
-40%
-20%
0%
20%
40%
60%
80%
100%
120%
140%
India China Indonesia Malaysia Vietnam
Other services
Manufacturing
Transport, storage,communication
Wholesale & retail trade,restaurants, hotels
Construction
Mining, utilities
Agriculture, hunting,forestry, and fishing
PAGE 56 THE INFORMATION TECHNOLOGY & INNOVATION FOUNDATION | APRIL 2014
Thus, vibrant and competitive manufacturing and services sectors will be vital to India’s economic growth going forward. Accordingly, it is imperative that as they seek to introduce growth policies, policymakers not implement reforms such as the Preferential Market Access policy that seek to advantage one sector (i.e., ICT manufacturing) over, and often at the expense of, another (i.e., ICT services).
Professor Raghuram G. Rajan, former Chief Economic Advisor to India’s Ministry of Finance and now Governor of the Reserve Bank of India, struck the right tone in an April 2013 speech, noting:
We can create our unique path by emphasizing on things we are already good at, like services, rather than creating a manufacturing revolution. I am not arguing against creating a manufacturing revolution. I am only saying that do we necessarily need to focus on that in the same way we focused on job-intensive industry? We can instead say let us create the environment for a variety of businesses to flourish, whether it is manufacturing, whether it is services, or rural industries. Let us create the possibility by doing what is necessary—by building the connectivity, by building the infrastructure, by enabling finance and education—and see what happens.273
It’s getting those conditions right for a variety of businesses to flourish—the Modern Economy Path—that is the subject of the next-to-last section of this report, but first we examine why countries’ use of innovation mercantilist policies constitutes a flawed economic model. WHY USING INNOVATION MERCANTILIST POLICIES IS A FLAWED MODEL While innovation mercantilist policies can deliver some short-term gains in employment and economic growth for countries, ultimately they are a flawed model because they lead to a number of unintended and adverse consequences. First, such policies tend to raise the cost of key capital goods, such as ICTs, which damages capital goods-using industries and lowers innovation, productivity, and economic growth. Second, they damage countries’ participation in global value chains for the production of high-technology products. Third, they can lead to broad economic inefficiencies. Fourth, they cause reputational harm to a country that can damage its attractiveness as a location for foreign direct investment. Fifth, they tend to isolate nations from the global economy while often failing to achieve their intended aims. Sixth, such policies are fundamentally unsustainable, in part because they: 1) reciprocally engender protectionist policies by other nations; 2) can’t be sustained by the global economy; and 3) lead to unbalanced and unsustainable “dual economies” in many countries that implement them. Finally, such policies distract countries from the types of policies they really should be implementing.
Raise the Cost of Key Inputs, Including for ICTs and Other Capital Goods A fundamental weakness of innovation mercantilist policies is that they often raise the cost of critical capital goods inputs, particularly for general purpose technologies such as ICTs, and this stunts innovation and productivity growth across all sectors of an economy,
The choice for India should not be between manufacturing-led growth or services-led growth, it should be about growth strategy that targets productivity growth across all sectors.
PAGE 57 THE INFORMATION TECHNOLOGY & INNOVATION FOUNDATION | APRIL 2014
thereby compromising broader economic growth. Innovation mercantilist policies can also raise the price of key consumer goods, such as pharmaceutical drugs, medical devices, and clean energy, limiting their adoption and use as well.
But capital investment in machinery, equipment, and software is a fundamental driver of innovation and productivity growth for nations. Without new capital investment refreshing a nation’s capital stock, innovation loses its power, productivity growth stagnates, and business competitiveness declines. Firms’ investments in capital equipment are especially important because they produce spillovers that extend beyond the firm and benefit the broader economy. For example, Van Ark finds that the spillovers from investment in new capital equipment are larger than the size of the benefits accrued by the investing firm.274 And investment in some capital goods—notably ICTs—is even more important because they have even larger impacts on growth because they enable downstream innovations in products, processes, business models, and business organization.275 For ICTs, Hitt finds that the spillovers from firms’ investments in information processing, equipment, and software (IPES) are “significant and almost as large in size as the effects of their own IPES investment.”276 This is a key reason why ICTs represent “super capital” that continues to generate a bigger return to productivity growth than most other forms of capital investment.277
And this explains why ICTs have become the modern economy’s greatest driver of economic growth, in developed and developing countries alike. For example, according to Japan’s Ministry of Internal Affairs and Communications, ICT usage contributed 34 percent of the country’s economic growth from 2005 to 2010.278 ICT usage in China has also played a critical role in growth, accounting for 38 percent of total factor productivity growth and as much as 21 percent of GDP growth.279 Likewise, a World Bank report, Kenya Economic Update, found that “ICT has been the main driver of Kenya’s economic growth over the last decade,” with ICTs responsible for roughly one-quarter of Kenya’s GDP growth during the 2000s.280 As Manchester University’s Richard Heeks concludes, “ICTs will have contributed something like one-quarter of GDP growth in many developing countries during the first decade of the twenty-first century.”281 In other words, the impact of ICTs on India’s economy goes far beyond the 7.5 percent of Indian GDP directly accounted for by India’s ICT services/business processing outsourcing sector and the 3.3 percent of GDP that India’s Internet-based enterprises will contribute to Indian GDP by 2015.282 Rather, ICT empowers India’s economic growth by raising the productivity and innovation potential of every single sector in India’s economy.
Yet, by definition, innovation mercantilist policies raise the price of—and/or compel the use of inferior—capital goods, such as ICTs, and this hurts capital goods users, including not just large and small companies, but also the growing share of “prosumers” (e.g., consumers who use ICT to assume part of the production function). Raising the price of, or limiting access to, best-of-breed capital goods and services only inhibits their adoption by both manufacturers and domestic-serving sectors of an economy—such as financial services, retail, transportation, education, and government—and this severely limits productivity growth across all of these sectors.
While innovation mercantilist policies can deliver some short-term gains, ultimately they are a flawed model because they lead to a number of unintended and adverse consequences.
PAGE 58 THE INFORMATION TECHNOLOGY & INNOVATION FOUNDATION | APRIL 2014
India’s experience with imposing high tariffs on ICT products as part of its import substitution industrialization policies in the 1970s provides a strong example of how higher costs for ICTs retards productivity growth in other sectors of the economy and ultimately lowers overall economic growth. In the 1970s and 1980s, India erected barriers to the importation of computers and other ICT hardware (including high tariffs and domestic production requirements) with the intent of spurring development of a domestic computer manufacturing industry. But, as noted, the Indian economists Kaushik and Singh found that for every $1 of tariffs India applied to imported computers, the country lost $1.30 in broader economic costs, particularly the productivity losses that occurred in other sectors of the economy as they used relatively less ICT.283 Thus, in the interest of favoring one industry—domestic ICT hardware manufacturers—India’s policies ended up harming all the other industries in its economy. The LCRs Indian policymakers are considering today in the ICT sector—notably the Preferential Market Access mandate and the exclusion of foreign vendors from the country’s national fiber optic deployment—are likely to have a similar effect in terms of raising the cost of or compelling the use of inferior ICTs, which will likely reduce ICT adoption and/or constrain the effectiveness of the ICT solutions deployed.
Interestingly, Mexico encountered a similar experience in the 1990s, when its government, in the interest of trying to spur development of an indigenous computer manufacturing industry, imposed joint venture and domestic content requirements on leading computer manufacturers including Apple, Compaq, Hewlett-Packard (HP), and others. But by forcing the computer manufacturers to source components from domestic producers whose components were more expensive and of inferior quality, these requirements contributed to the computers coming off Mexican assembly lines to serve local markets being three to four years behind industry standards and selling for prices 150 percent to 300 percent higher than the world average.284 As in India, this contributed to reduced ICT adoption and lower productivity growth across many Mexican industries.
Trade-distorting policies applied to the ICT sector damage all ICT-using industries, but none more so than a country’s ICT services sector, which explicitly relies upon access to affordable, best-of-breed ICT products. But by introducing distortive policies such as the PMA in an effort to favor its ICT manufacturing sector, India’s government risks inflicting significant harm on its IT-business process outsourcing industry, despite the fact that India’s ICT services sector contributes 7.5 percent of India’s GDP and remains one of India’s fastest-growing industries.285 The sector has grown six times faster than both India’s GDP and exports over the past 15 years and was expected to generate revenues of $108 billion and exports of $75.8 billion 2013.286 In fact, as Figure 14 shows, ICT services exports account for over 45 percent of India’s total services exports, the highest percentage of any developing country.287 Further, the sector supports 3 million direct jobs and an additional 9.5 million indirect jobs.288 But policies that favor India’s ICT manufacturing industry to the detriment of its ICT services sector risk undermining the very industry that drives a high percentage of the country’s services exports and provides an important source of economic and employment growth.
Policies that favor India’s ICT manufacturing industry to the detriment of its ICT services sector risk undermining the very industry that drives a high percentage of the country’s services exports and provides an important source growth.
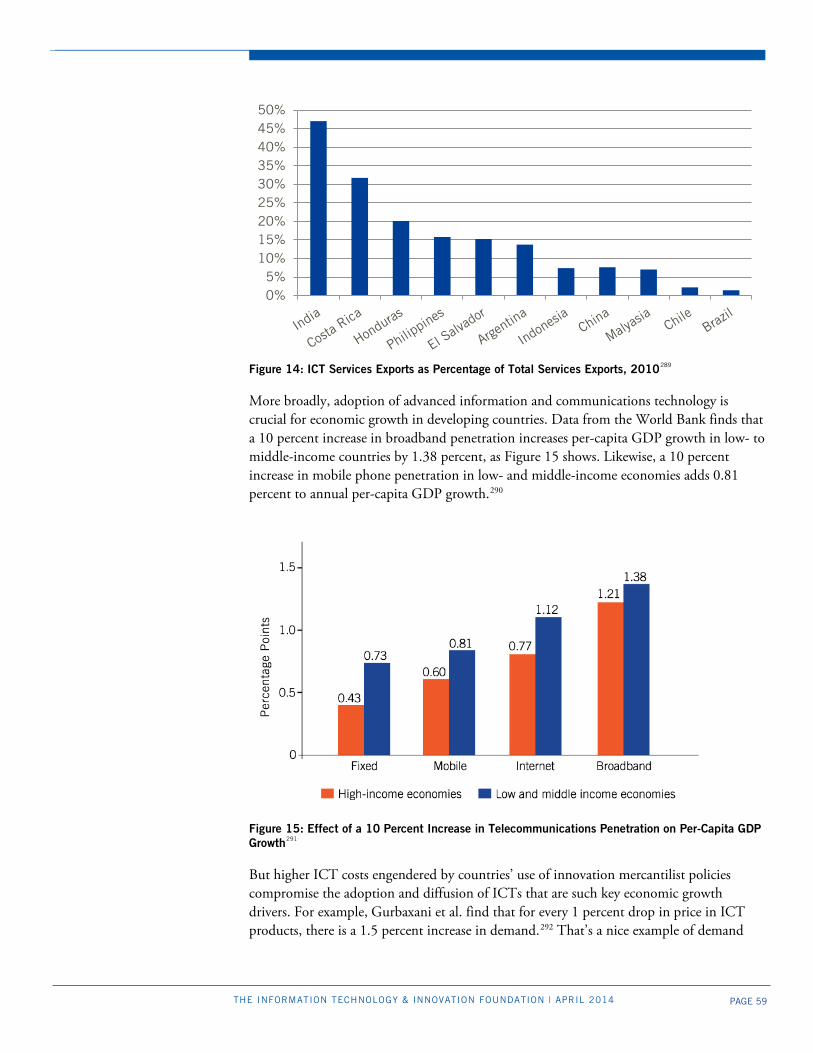
PAGE 59 THE INFORMATION TECHNOLOGY & INNOVATION FOUNDATION | APRIL 2014
Figure 14: ICT Services Exports as Percentage of Total Services Exports, 2010289
More broadly, adoption of advanced information and communications technology is crucial for economic growth in developing countries. Data from the World Bank finds that a 10 percent increase in broadband penetration increases per-capita GDP growth in low- to middle-income countries by 1.38 percent, as Figure 15 shows. Likewise, a 10 percent increase in mobile phone penetration in low- and middle-income economies adds 0.81 percent to annual per-capita GDP growth.290
Figure 15: Effect of a 10 Percent Increase in Telecommunications Penetration on Per-Capita GDP Growth291
But higher ICT costs engendered by countries’ use of innovation mercantilist policies compromise the adoption and diffusion of ICTs that are such key economic growth drivers. For example, Gurbaxani et al. find that for every 1 percent drop in price in ICT products, there is a 1.5 percent increase in demand.292 That’s a nice example of demand
0%5%
10%15%20%25%30%35%40%45%50%
PAGE 60 THE INFORMATION TECHNOLOGY & INNOVATION FOUNDATION | APRIL 2014
elasticity—lower prices leading to increased demand for a product or service. It’s why trade-barrier eliminating agreements such as the Information Technology Agreement have played such a profound role in reducing prices for ICT products and in facilitating the diffusion of ICTs, such as mobile phones, throughout developing countries.293 For instance, in India, the number of cellular phone subscribers per 100 inhabitants increased from just 0.03 per 100 inhabitants in 1996 to 72 in 2011.294 To be sure, many factors contributed to the increased adoption of information technologies, such as mobile phones, by Indian businesses and consumers over this timeframe, but their constantly decreasing costs were a key reason. However, when trade-distorting policies raise the cost of ICTs, thereby slowing their diffusion and adoption throughout an economy, it’s another way they undermine critical economic growth processes.
Damage Countries’ Participation in Global Value Chains The best way for countries to ensure their participation in global supply chains is by reducing barriers to trade and investment. More and more of the world’s economic activity is now organized through global value chains and strategic networks, rather than through arm’s length sales between vertically integrated buyers and sellers in different countries.295 The most obvious evidence of this trend lies in the percentage of world trade comprised of intermediate goods (goods sold to businesses, not consumers)—which now accounts for nearly a 60 percent share of world imports.296
But as the OECD’s research into Measuring Trade in Value Added finds:
The growing fragmentation of production across borders has important policy implications. It highlights the need for countries wanting to reap the gains from value chain participation to have open, predictable and transparent trade and investment regimes as tariffs and other unnecessarily restrictive non-tariff measures impact foreign suppliers, international investors, and domestic producers.297
That’s why the OECD has found that countries not participating in the Information Technology Agreement saw their participation in global ICT value chains decline by over 60 percent from 1996 (when the ITA was chartered) to 2009.298 And it explains why most ITA members, including India, have experienced faster growth in ICT services exports as a percentage of their overall services exports than non-ITA members, as Figure 16 illustrates. In fact, the percent that ICT services exports accounts for out of the country’s total service exports increased by more than 50 percent (from the first year in which data is available to 2011) in China, Malaysia, and the Philippines, while ICT services exports as a percentage of the country’s total services exports fell by 178 percent and 247 percent, respectively, in non-ITA member countries Chile and Brazil.299 The message is clear: countries that don’t participate in open, cross-border flows of ICT products, such as by imposing local content requirements, only end up excising themselves from global value chains and production networks for ICT products.300
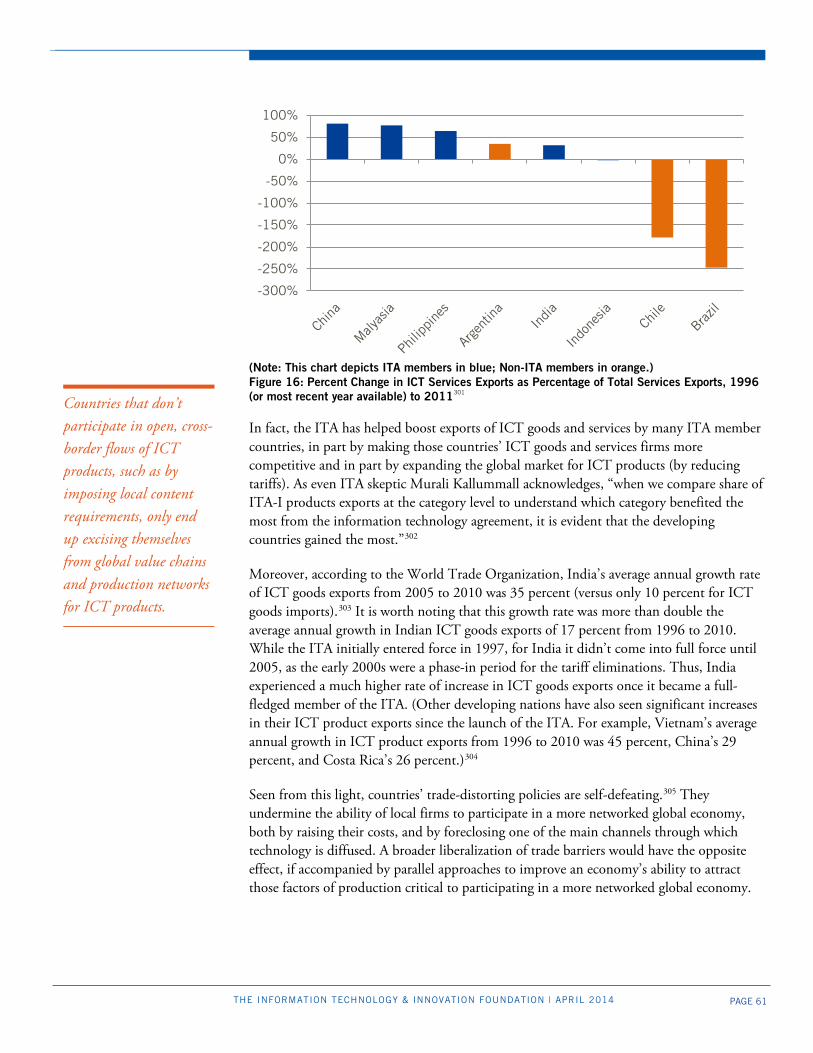
PAGE 61 THE INFORMATION TECHNOLOGY & INNOVATION FOUNDATION | APRIL 2014
(Note: This chart depicts ITA members in blue; Non-ITA members in orange.) Figure 16: Percent Change in ICT Services Exports as Percentage of Total Services Exports, 1996 (or most recent year available) to 2011301
In fact, the ITA has helped boost exports of ICT goods and services by many ITA member countries, in part by making those countries’ ICT goods and services firms more competitive and in part by expanding the global market for ICT products (by reducing tariffs). As even ITA skeptic Murali Kallummall acknowledges, “when we compare share of ITA-I products exports at the category level to understand which category benefited the most from the information technology agreement, it is evident that the developing countries gained the most.”302
Moreover, according to the World Trade Organization, India’s average annual growth rate of ICT goods exports from 2005 to 2010 was 35 percent (versus only 10 percent for ICT goods imports).303 It is worth noting that this growth rate was more than double the average annual growth in Indian ICT goods exports of 17 percent from 1996 to 2010. While the ITA initially entered force in 1997, for India it didn’t come into full force until 2005, as the early 2000s were a phase-in period for the tariff eliminations. Thus, India experienced a much higher rate of increase in ICT goods exports once it became a full-fledged member of the ITA. (Other developing nations have also seen significant increases in their ICT product exports since the launch of the ITA. For example, Vietnam’s average annual growth in ICT product exports from 1996 to 2010 was 45 percent, China’s 29 percent, and Costa Rica’s 26 percent.)304
Seen from this light, countries’ trade-distorting policies are self-defeating.305 They undermine the ability of local firms to participate in a more networked global economy, both by raising their costs, and by foreclosing one of the main channels through which technology is diffused. A broader liberalization of trade barriers would have the opposite effect, if accompanied by parallel approaches to improve an economy’s ability to attract those factors of production critical to participating in a more networked global economy.
-300%
-250%
-200%
-150%
-100%
-50%
0%
50%
100%
Countries that don’t participate in open, cross-border flows of ICT products, such as by imposing local content requirements, only end up excising themselves from global value chains and production networks for ICT products.
PAGE 62 THE INFORMATION TECHNOLOGY & INNOVATION FOUNDATION | APRIL 2014
Lead to Broad Economic Inefficiencies Innovation mercantilist policies tend to lead to broad economic inefficiencies in the nations that field them. To be sure, such policies can get some additional local industrial production established, but these polices are not free. While sometimes they cost governments more money directly (e.g., when price preferences for local producers are used in public procurement), in many cases the costs are borne by consumers and other businesses, representing a hidden tax that policymakers can more easily impose than a direct surcharge. As political scientist Mancur Olsen explained in The Logic of Collective Action, it’s easier to pass bad policies when the costs are dispersed among a large group while the benefits are narrowly concentrated.306 And indeed, most countries’ trade-distorting policies hurt consumers, businesses, and/or taxpayers by raising the cost of products and services. For example, governments that favor domestic bidders over foreign ones in government procurement contracts can hurt themselves and/or their own citizens if they have not thoroughly evaluated the merits of foreign bidders’ products and services in a good-faith effort to select best-value bids.
This is why OECD data strongly suggest that increasing competition in government procurement practices can make a big difference for economies.307 As India’s Draft National Competition Policy observes:
Public procurement of goods and services is a key economic activity of governments—accounting for 20 to 30 percent of GDP in India...As per the findings of an OECD survey, savings to public treasuries between 17 percent and 43 percent have been achieved in some developing countries through implementation of competitive procurement processes. In view of the huge public expenditure on procurement including in the infrastructure sector, substantial savings can be achieved in India by infusing greater competition, which in turn could release resources for the much needed investment in social sector development in the country.308
Accordingly, when nations use price preferences or local content requirements in public procurement activity, they increase inefficiencies that harm economic growth.
The same effect occurs when countries impose unfair standards-related measures on behalf of domestic industries, which degrades international trade while at the same time imposing additional costs that harm consumers and businesses. These costs can be significant. The OECD estimates that complying with economy-specific technical standards can add as much as 10 percent to the cost of an imported product.309 While not as damaging as mandatory domestic technology standards, countries that require onerous and duplicative in-country certification testing on a range of computer and electronics equipment (as India has done), also unnecessarily raise costs for consumers of ICT products.
Damage National Reputations Attracting foreign direct investment constitutes an increasingly important component of many countries’ economic development strategies. But innovation mercantilist policies can damage countries’ reputations as attractive locations for foreign direct investment and other

PAGE 63 THE INFORMATION TECHNOLOGY & INNOVATION FOUNDATION | APRIL 2014
enterprise activity. The attitude among businesses becomes, “why would we want to invest in countries that use these policies unless we are forced to do so?” And, as such, they invest the bare minimum they have to.
Unfortunately, this dynamic has been quite apparent in India in recent months, where it’s clear that the country’s recent implementation of several trade-distorting policies have contributed to declines, rather than increases, in inbound foreign direct investment. For example, FDI into India’s electronics and telecommunications sectors substantially declined following the Indian government’s announcement of its Preferential Market Access policy. Specifically, FDI into India’s telecommunications sector fell from $2 billion in the period from April 2011 to March 2012 to just $70.6 million from April 2012 to December 2012. FDI into India’s electronics sector fell by over 80 percent between those two timeframes.310
Likewise, in the fall of 2012, India partially loosened restrictions on foreign direct investment in its retail sector, allowing foreign companies to invest in Indian supermarkets for the first time, up to a maximum stake of 51 percent. But as The New York Times writes, India “expected a number of major retailers like Walmart and other companies to come rushing in. [But] the companies have instead stayed away, worried by the government’s constant policy changes” and “lack of clarity on policies such as how much of a company’s products would have to be sourced locally.”311 Reactions like these are why, across India’s entire economy, FDI inflow fell by a total of 13.5 percent in 2012.312 As The Economist writes, in the end, “coercing Indians and foreigners to do business [in India] is self-defeating.”313
Put simply, innovation mercantilist policies damage the relationship between managers running multinational businesses and government officials in the countries that implement them. Ultimately, they undermine the investment climate and cause global enterprises and their establishments to search for other countries in which to locate globally mobile investment activity.
While some have expressed concern that an increase in FDI into India in sectors such as retail might cost Indian workers jobs, the reality is that FDI plays an important role in helping make Indian workers more efficient. Savings generated by increased efficiency are passed on to consumers, which in turn enables consumers to buy more goods, expanding the domestic economy and creating opportunities for workers in small retailers who may lose jobs, either in other retailers or in other manufacturing or service sectors. As former United Nations Secretary General Koffi Annan summarizes the tremendous benefits of FDI for developing economies: “With the enormous potential to create jobs, raise productivity, enhance exports, and transfer technology, foreign direct investment is a vital factor in the long-term economic development of developing countries.”314 In short, foreign direct investment is a vital component of economic growth. FDI creates jobs, empowers Indian workers to compete globally, and generates valuable spillover effects for the rest of the economy.
Innovation mercantilist policies damage countries’ reputations as attractive locations for foreign direct investment and other enterprise activity, causing companies only to invest the bare minimum necessary.
PAGE 64 THE INFORMATION TECHNOLOGY & INNOVATION FOUNDATION | APRIL 2014
Fail to Achieve Their Intended Objectives Innovation mercantilist policies further represent a poor policy instrument because in the long run they isolate nations from global markets instead of integrating them and very often fail to achieve their intended aims. India has encountered this experience in its imposition of domestic content requirements for solar photovoltaic (PV) cells. To try to ensure that the installation of capacity created domestic solar manufacturing, the Jawaharlal Nehru National Solar Mission included a local content requirement: developers must use cells and modules manufactured in India. However, the LCR requirement made an exception for solar PV developers using thin film technologies, which may be imported. Accordingly, the vast majority of solar developers in India use imported thin film modules, which are less expensive than domestically produced modules.315
But this LCR seems to have only distorted the Indian market for PV modules. Globally, only 11 percent of PV deployment is in thin film, while 89 percent is in crystalline silicon (CSi), the dominant technology.316 In contrast, more than 70 percent of Indian PV capacity subsidized through the latest batch of JNNSM auctions was imported thin film. Thus, the LCR has failed to accomplish its goal. At best, the LCR has led to small increases in domestic manufacturing, with domestic module manufacturers capturing an estimated additional 3 percent to 7 percent of the domestic market as a result of the LCR. India’s government is now considering expanding the LCR to cover all solar cell technologies. But, as Gary Hufbauer notes, “expanding the scope of LCRs will not solve the range of problems hindering India’s solar manufacturing sector. Moreover, across the solar electricity value chain, manufacturing creates only 25 percent of jobs; the rest are in installation and sales. Even if the LCR creates [some additional] domestic manufacturing jobs, it threatens far more jobs downstream if it impedes the overall development of solar installations.”317 As the German Development Institute concludes in its report, Exploring the Effectiveness of Local Content Requirements in Promoting Solar PV Manufacturing in India:
It is clear that LCRs as they were designed in Phase 1 of the JNNSM were not effective. They may have helped Indian manufacturers weather some of the storm that has hit the global solar manufacturing industry in the past few years. But there have been significant reductions in employment and development of the full range of technological capabilities needed to make India a solar leader has not taken place.318
More broadly, as Georgetown University Professor Ted Moran finds in Harnessing Foreign Direct Investment for Development, “the historical experience of trying to build up the host country industrial base through imposing domestic content requirements on protected foreign investors…has turned out to be quite disappointing.”319 Moran’s research finds that foreign-owned plants that are built to serve protected host country markets consistently fail to live up to their infant-industry or import substitution industrialization goal of creating internationally competitive operations. Rather, their operations are typically sub-scale and incorporate older technology and quality control mechanisms. Somewhat counter-intuitively, the performance requirements imposed on these investors—such as joint venture and domestic content requirements—result in fewer backward linkages and less
PAGE 65 THE INFORMATION TECHNOLOGY & INNOVATION FOUNDATION | APRIL 2014
technology transfer than their export-oriented FDI counterparts. As Moran concludes, “FDI projects oriented toward protected local markets detract from host country welfare and retard host country growth with stronger adverse effects than have previously been documented.”320
In contrast, Moran finds that foreign-owned plants that are built to penetrate international markets, often as part of the parent multinational’s own supply chain, operate with the most advanced technologies and embody the most sophisticated quality control procedures. They pay wages higher than their local counterparts do, and as the complexity of their operations increases, they seek to attract and keep skilled workers by offering superior working conditions. And they generate backward linkages to local firms if the host country business climate and worker training institutions are conducive to the emergence of suppliers.
For instance, once Mexico abandoned the mandatory joint ventures required by its domestic content informatics policy, it achieved results not unlike those previously seen in East Asian countries such as Malaysia, Singapore, and Thailand. Mexico’s decision to allow IBM to establish a wholly owned plant dedicated to exporting components and products into the parent’s Western Hemisphere sourcing network stimulated HP and Apple to follow in IBM’s footsteps, building new full-scale production sites for export as well as domestic sales. These moves saw the emergence of a “Little Silicon Valley” near Guadalajara, Mexico, as companies like 3Com, IBM, Intel, and HP started bringing their component suppliers, such as Flextronics and NatSteel Electronics, with them from Southeast Asia.
Ultimately, Moran finds that “the positive contribution to host country growth and welfare from FDI projects that are incorporated into the multinational corporation’s international supply network is ten to twenty times more powerful than has conventionally been estimated.”321 The message is clear: foreign direct investment works best in developing countries when multinational corporations are attracted to the investment environment and can freely integrate the operations of the establishment into the organization’s international supply network.
Innovation Mercantilist Policies are Fundamentally Unsustainable Countries that seek to grow through innovation mercantilist policies—which are almost always predicated on shifting the composition of a country’s economy toward higher-value-added traded sectors that can drive export-led growth—will ultimately find these practices unsustainable, for several reasons. First, when one country implements such policies, it engenders a similar response from other nations that ultimately undermines the utility of these policies. Second, countries’ export-led growth policies are unsustainable for the global economy. Finally, export-led growth policies tend to give rise to an unsustainable “dual economy” in which a country’s traded sectors may thrive for a time, but are ultimately compromised by uncompetitive and unproductive domestic serving non-traded sectors.
If India has to limit access to its market to meet its export goals, it will only encourage other countries to limit access to their markets, thus precluding India from meetings its export goals.
PAGE 66 THE INFORMATION TECHNOLOGY & INNOVATION FOUNDATION | APRIL 2014
Innovation Mercantilist Policies Engender Self-Defeating Responses When one country introduces trade-distorting policies, it encourages other countries to do so as well. Consider the global ICT sector. India has set a goal to increase its ICT exports thirteen-fold from $5.5 billion today to $80 billion by 2020.322 However, if India enacts local content requirements as a way to expand domestic ICT goods production and subsequently ICT goods exports—thus making it more difficult for enterprises in other nations to export some share of their ICT goods production to India—then those nations are likely to enact their own local content requirements or erect other trade barriers that diminish the potential for Indian ICT goods and services exports to their nations. In other words, if India has to limit access to its market to meet its export goals, it will only encourage other countries to limit access to their markets, thus precluding India from meeting its export goals.
In fact, LCRs have become increasingly pervasive in the global ICT sector. For example, Brazil’s “IT Maior” strategy has promulgated local content requirements for the Brazilian Telecommunications Agency’s deployment of 4G wireless networks in Brazil. The IT Maior strategy also calls for stringent local content requirements in the Brazilian government’s procurement of software—including by requiring the certification of software as domestic in order to obtain government procurement preferences—in an effort to boost domestic software development. Elsewhere, Indonesia’s Telecommunications and Wireless Broadband Decree requires all telecom service operators to spend 35 percent of their capital expenditures on domestically manufactured equipment, and requires local content of 30 percent to 50 percent in the wireless broadband sector. It’s expected that, by 2016, the Indonesian government will require at least 50 percent of telecommunications equipment to be locally sourced.323 And as part of Russia’s “Localization Initiative,” which seeks to ensure that most telecommunications equipment sold in the Russian market is manufactured within the territory of Russia, the country has set “desired localization levels” of up to 70 percent for certain types of telecommunications equipment.324
Thus, when one country enacts trade-distorting policies, it ignites a contagion effect that encourages other nations to erect similar policies, and this leads to a slippery slope causing a fragmentation of global production and threatening to undermine the fundamental principles of liberalized global trade. To be sure, India was not the first provocateur in this chain; it was not the first country to explore introducing LCRs for public procurements in the ICT sector. Arguably, India’s attempt to introduce ICT LCRs through the PMA in February 2012 could be viewed as a reaction to the indigenous innovation policies China sought to enact starting after 2006, or the Russian localization initiative announced in 2011; just as Brazil might argue that its IT Maior strategy was a justified response to India’s PMA or China’s indigenous innovation policies before it. But the causation is incidental, and moreover one country’s protectionist policies do not justify another’s. Rather, India would be better served not by using other countries’ trade-distorting policies as a justification for its own, but by joining the United States (and most European Union nations) in pushing back against the countries fielding such innovation mercantilist practices and by becoming a stronger advocate for trade-liberalizing agreements, such as the aforementioned Information Technology Agreement.
PAGE 67 THE INFORMATION TECHNOLOGY & INNOVATION FOUNDATION | APRIL 2014
As noted, that agreement has played a catalytic role in expanding global trade in ICT products. In fact, from 1996 to 2008, total global two-way trade in ICT products covered by the ITA increased more than 10 percent annually, from $1.2 trillion to $5.0 trillion.325 The product line expansion of the ITA now under international negotiation could bring an additional $800 billion in two-way trade in global ICT products under the ITA.326 ITIF estimates that such an ITA expansion would result in annual global GDP becoming $190 billion larger than it otherwise would be.327 Put simply, ITA expansion would increase the size of the global marketplace for ICT products and services and provide India a larger market in which to export its ICT products and services. Thus, participating in ITA expansion would be a much more preferable way for India to achieve its goal of expanding its ICT exports thirteen-fold by 2020 than erecting LCRs such as the PMA.
However, it’s worth noting that this pernicious dynamic is not confined to the ICT sector. India’s issuance of a compulsory license for Bayer’s anti-cancer drug Nexavar will not only enable generic drug manufacturers in India to produce the drug, it is likely to motivate other nations to issue compulsory licenses as well. For instance, in September 2013, South Africa’s Draft National Policy on Intellectual Property proposed using compulsory licensing both as a bargaining tool in price negotiations with producers of innovative medicines and as a means to promote technology transfer to South Africa.328 South Africa further proposes to adopt a number of India’s practices, including extensive pre- and post-grant opposition and a renewed commitment to not adopt regulatory data protection or to allow for patent term restoration in the case of regulatory delays.329 South Africa’s draft policy makes several explicit references to India’s IP policies in justifying its positions. For its part, China has not yet granted any compulsory licenses on biopharmaceutical products, but it recently “announced an intention to do so in the future.”330 Moreover, while Indian generic drug manufacturers may benefit from policies such as compulsory licenses today, such actions establish a dangerous precedent, and open the door for other nations to issue compulsory licenses on biopharmaceutical IP developed in India in the future.
Innovation Mercantilist Policies Are Unsustainable for the Global Economy As more countries attempt to compete by fielding export-led growth strategies fueled by innovation mercantilist policies, the combined weight of these policies has become unsustainable for the global economy. As BusinessWeek has framed the issue, “Everyone wants to export their way out of trouble, but can’t.”331 Or, as The Economist has observed, “the combined surplus of all the countries pursuing an [export-led] growth strategy has been too much for the rich world, especially America, to absorb comfortably. The best insurance against trade protectionism is macroeconomic stimulus. Boosting demand at home will decrease the temptation to divert it from abroad.”332 In other words, it may once have worked for China, Japan, and Korea to grow their economies predominantly by using an export-led growth strategy, but a similar strategy won’t work for India because the United States and Europe are no longer in a position to import sufficient amounts to make such a strategy work. Ultimately, neither markets in the United States nor Europe—nor even both combined—are large enough if nations such as Argentina, Brazil, China, India, and Russia continue to promote exports while limiting imports as their primary path to prosperity, making export-led growth strategies an unsustainable approach for the countries that practice them and for the rest of the world.

PAGE 68 THE INFORMATION TECHNOLOGY & INNOVATION FOUNDATION | APRIL 2014
Innovation Mercantilist Policies are Unsustainable for Countries Themselves But it’s not just that countries’ use of trade-distorting policies is proving unsustainable for the global economy; trade-distorting policies are unsustainable for the countries using such policies themselves. A key reason why such policies are often only effective over the short term is that by focusing almost entirely on helping a few capital goods-producing industries with heavy export potential, countries miss out on the far more powerful and sustainable opportunity to achieve economic growth though raising domestic productivity growth. Moreover, such policies run the risk of creating unsustainable “dual economies” with competitive traded sectors but languishing domestic-serving, non-traded sectors.
A crucial point that countries fielding export-led growth strategies (often supported by trade-distorting policies) neglect is that the vast majority of economic benefits from technology—as much as 80 percent—come from the widespread usage of that technology, while only approximately 20 percent of the benefits of technology come from its production. Ultimately, countries’ export-led growth strategies miss the greatest opportunity to improve their economic growth, which is increasing the productivity of domestic sectors, particularly through the application and diffusion of general purpose technologies such as ICTs.
Consider Israel’s experience. Israel has been held out as a poster child for high-tech development, and as a model to many other nations for “how to do it right.” But delving into Israel’s experience, Lach et al. found that while Israel’s ICT sector boomed during the 1990s, becoming “a hotbed of innovation and technological advance by worldwide standards,” the country’s overall productivity remained sluggish, with traditional sectors both in manufacturing and services seemingly unable to benefit from the success of Israel’s ICT sector, leading to the emergence of a “dual economy.” The authors note that “the problem with this picture is that such disparities across sectors cannot support the growth of the whole economy over time…A fast-growing GPT-producing sector is not enough to guarantee sustained growth.” Lach et al. argue that two primary reasons explain why Israel’s ICT sector failed to act as a general purpose technology for the entire economy. First, because Israel’s ICT sector was overwhelmingly export-oriented—it exported more than 70 percent of its output—and other sectors of Israel’s economy did not benefit from the rapid and pervasive adoption of ICTs with the concordant dynamic efficiency gains. Second, government policy in Israel explicitly supported product innovation rather than process innovation, unwittingly creating a bias against the service sectors as well as against process-oriented sectors, such as chemicals and construction.333 The authors conclude by reiterating that “facilitating the adoption of ICT in traditional industries is crucial to achieving economy-wide growth.”334
India, albeit from a lower level of development, appears to be following a similar path to Israel. For example, a very small share of the output of Indian ICT service firms (less than 5 percent) is consumed in India by Indian firms.335 The lion’s share is exported. As such, the rest of the Indian economy has extremely low productivity. No doubt the vast majority of countries with export-led growth strategies share these features in common with Israel and India. Clearly, the Israeli experience shows that the existence of a successful local ICT-producing sector by itself is not enough to generate sustained and widespread growth.336
When countries enact innovation mercantilist policies, they ignite a contagion effect that encourages other nations to erect similar policies, thus fragmenting global production and undermining fundamental principles of liberalized global trade.
PAGE 69 THE INFORMATION TECHNOLOGY & INNOVATION FOUNDATION | APRIL 2014
Moreover, the lack of productivity gains in domestic service sectors can imperil the long-term competitiveness of nations’ manufacturing industries producing their traded goods, because service industries boost other industries’ competitiveness. Consider the phenomenon South Korea is currently experiencing. Logistics, financial, consulting, engineering, and software-design industries serve as intermediate inputs to manufacturing industries (in fact, the intermediate demand rate of South Korea’s service sector is approximately 40 percent) and play critical roles in boosting their competitiveness.337 For instance, market research, technological research and development, human resource management, business consulting, and financial services play major roles in producing and selling automobiles. But as Kim Jung-Woo of South Korea’s Samsung Economic Research Institute (SERI) notes, “Compared to the biggest OECD economies, the productivity of South Korea’s service industries appears to be low,” with the labor productivity of South Korea’s service industries just half that of its manufacturing industries. Indeed, the per-capita value-added of even Korea’s most productive service sectors—financial and real estate services—are only 50 percent to 80 percent of the productivity rates of major OECD countries, and the per-capita value-added of South Korea’s wholesale/retail industry is less than 30 percent of U.S. levels. As Jung-Woo cautions, “If South Korean service industries’ productivity continues to remain low while their weight in the GDP grows, it could undermine the productivity of the nation’s whole economy.”338
Japan has encountered a similar experience. The country certainly boasts world-leading exporters of manufactured products—Sony, Toshiba, Toyota, etc.—but because it has never really focused on the non-traded sectors of its economy, only about one-quarter of its economy is growth-oriented, and it noticeably lacks any world-class service firms. Japan’s service sectors have achieved but a fraction of Western productivity levels. Japan’s retail sector has achieved barely half of U.S. productivity levels, while its construction and food processing industries have reached only 40 percent and 33 percent of U.S. productivity levels, respectively. With these three sectors accounting for approximately 22 percent of total Japanese employment, the country’s economy as a whole suffers badly from lagging service sector productivity, explaining why the whole of Japan’s economy—even with some of the world’s most productive manufacturing industries—is only 70 percent as productive as America’s.339 With Japan’s share of the global economy falling from 14 percent to 8 percent over the past two decades, the country has entered what The Economist describes as a state of “gentle decline.”340 Thus, countries relying predominantly on export-led strategies risk being a one-trick pony; they may reach the technological frontier and boost growth for a while, but they are liable to languish there, or perhaps even decline if global export markets become saturated, and as countries with more robust service sectors pass them by.
By focusing predominantly on export-led growth generated through its traded sectors, China is making a similar mistake today. A central goal of the Chinese government’s economic development strategy is to promote seven Strategic and Emerging Industries—ICT; clean energy; materials science; nuclear fusion and nuclear-waste management; stem cells and regenerative medicine; public health; and the environment—and to have these seven industries contribute 15 percent of overall value-added to China’s GDP by 2020.341 But even if China is successful in its strategy to promote these seven Strategic and Emerging Industries—spending the equivalent of $1.5 trillion by 2020 to do so—it will
PAGE 70 THE INFORMATION TECHNOLOGY & INNOVATION FOUNDATION | APRIL 2014
have only gained the equivalent of 14 months of productivity growth (assuming a continuation of past overall Chinese economic and productivity growth trends).342 In other words, China will invest a lot of money and effort for very little payoff.
A Distraction From Policies India Should Be Pursuing The final way innovation mercantilist policies damage the countries that implement them is that they represent a shortcut to growth through which countries try to attract foreign investment without having to make the tough policy reforms required to make their economies genuinely competitive. Instead of creating the prerequisites of a vibrant economy—strong infrastructure, education, scientific research, and a good business and regulatory environment, etc.—innovation mercantilist policies attempt to achieve growth by distorting markets.
But such policies merely give governments a “way out” from doing the hard work of addressing real economic challenges. For example, India is one of the weakest investors in R&D among developing countries. It has one of the lowest numbers of researchers per capita among major developing countries; with only 120 researchers for every million people, it has a rate one fifth China’s and one twenty-fifth Korea’s.343 It has an infrastructure investment deficit running into the hundreds of billions, as evidenced by recurring rolling power blackouts, inadequate ports, and limited road connections, which hurt manufacturers that require state-of-the-art infrastructure and access to reliable power and water. As the following section explains, it’s by successfully addressing these types of challenges that countries can both stimulate the domestic investment and attract the foreign investment they desire to sustainably grow their economies. THE MODERN ECONOMY PATH Perhaps the best way to think about the policies needed to effectively grow any economy in the twenty-first century, including India’s, is to envision a four-stage pyramid, as depicted by The Economic Growth Pyramid in Figure 17.
At the base level are key framework conditions: factors such as the rule of law, ease of doing business, competitive markets, flexible labor markets, effective protection of property, including intellectual property, and a culture of trust. Without these key framework conditions, even the most sophisticated innovation policies will not succeed. The next level above these basic framework conditions includes an effective tax, trade, and investment environment. Key considerations here are establishing a globally competitive tax environment and implementing policies that enable trade and foreign investment. As these factors are in place, nations need to then focus on the next level above which comprises key factor inputs: the kinds of external factors firms need in order to succeed. These include robust physical and digital infrastructures; a skilled workforce with broad-based general capabilities but also the specialized skills matching the needs of key industries; and robust knowledge creation (e.g., investment in science and technology). But even these are not enough for success. Indeed, with more nations realizing that mastery of these three levels is what is needed just to “be in the game,” success requires going beyond this, to a fourth level, that includes effectively crafted innovation and productivity policies specifically tailored with regard to a country’s competitive strengths and weaknesses. Policies in this
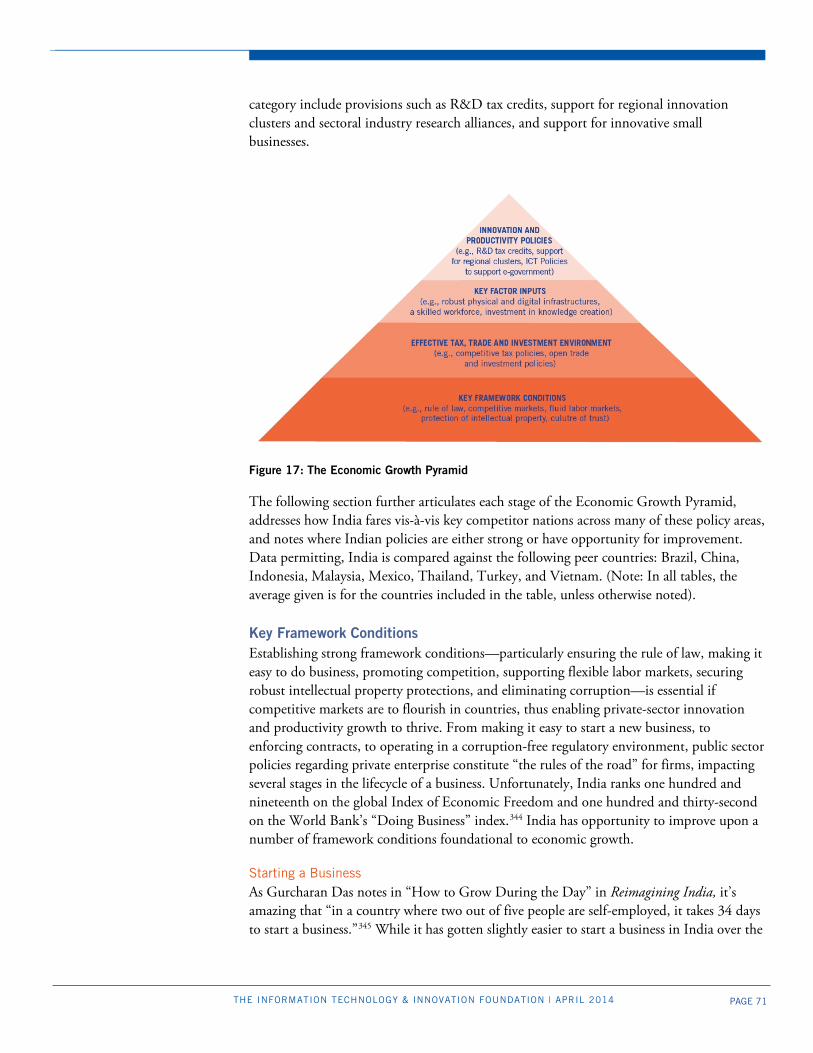
PAGE 71 THE INFORMATION TECHNOLOGY & INNOVATION FOUNDATION | APRIL 2014
category include provisions such as R&D tax credits, support for regional innovation clusters and sectoral industry research alliances, and support for innovative small businesses.
Figure 17: The Economic Growth Pyramid
The following section further articulates each stage of the Economic Growth Pyramid, addresses how India fares vis-à-vis key competitor nations across many of these policy areas, and notes where Indian policies are either strong or have opportunity for improvement. Data permitting, India is compared against the following peer countries: Brazil, China, Indonesia, Malaysia, Mexico, Thailand, Turkey, and Vietnam. (Note: In all tables, the average given is for the countries included in the table, unless otherwise noted). Key Framework Conditions Establishing strong framework conditions—particularly ensuring the rule of law, making it easy to do business, promoting competition, supporting flexible labor markets, securing robust intellectual property protections, and eliminating corruption—is essential if competitive markets are to flourish in countries, thus enabling private-sector innovation and productivity growth to thrive. From making it easy to start a new business, to enforcing contracts, to operating in a corruption-free regulatory environment, public sector policies regarding private enterprise constitute “the rules of the road” for firms, impacting several stages in the lifecycle of a business. Unfortunately, India ranks one hundred and nineteenth on the global Index of Economic Freedom and one hundred and thirty-second on the World Bank’s “Doing Business” index.344 India has opportunity to improve upon a number of framework conditions foundational to economic growth.
Starting a Business As Gurcharan Das notes in “How to Grow During the Day” in Reimagining India, it’s amazing that “in a country where two out of five people are self-employed, it takes 34 days to start a business.”345 While it has gotten slightly easier to start a business in India over the
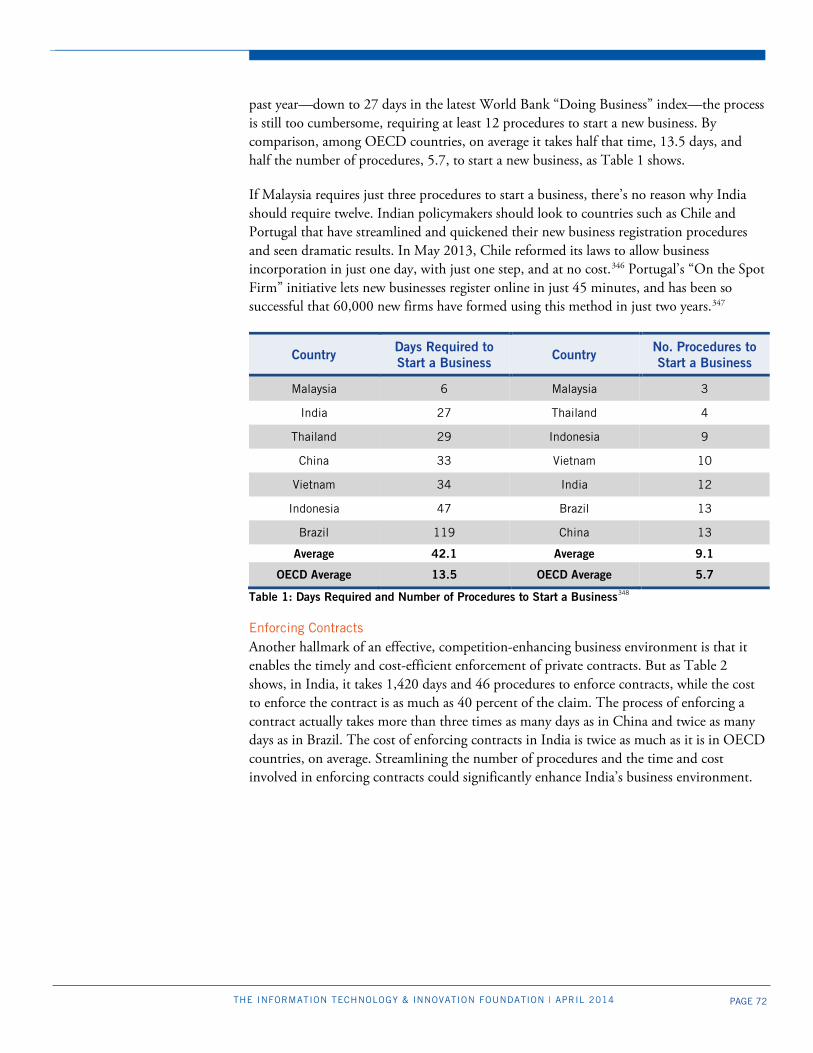
PAGE 72 THE INFORMATION TECHNOLOGY & INNOVATION FOUNDATION | APRIL 2014
past year—down to 27 days in the latest World Bank “Doing Business” index—the process is still too cumbersome, requiring at least 12 procedures to start a new business. By comparison, among OECD countries, on average it takes half that time, 13.5 days, and half the number of procedures, 5.7, to start a new business, as Table 1 shows.
If Malaysia requires just three procedures to start a business, there’s no reason why India should require twelve. Indian policymakers should look to countries such as Chile and Portugal that have streamlined and quickened their new business registration procedures and seen dramatic results. In May 2013, Chile reformed its laws to allow business incorporation in just one day, with just one step, and at no cost.346 Portugal’s “On the Spot Firm” initiative lets new businesses register online in just 45 minutes, and has been so successful that 60,000 new firms have formed using this method in just two years.347
Country Days Required to Start a Business Country No. Procedures to
Start a Business
Malaysia 6 Malaysia 3
India 27 Thailand 4
Thailand 29 Indonesia 9
China 33 Vietnam 10
Vietnam 34 India 12
Indonesia 47 Brazil 13
Brazil 119 China 13
Average 42.1 Average 9.1
OECD Average 13.5 OECD Average 5.7
Table 1: Days Required and Number of Procedures to Start a Business348
Enforcing Contracts Another hallmark of an effective, competition-enhancing business environment is that it enables the timely and cost-efficient enforcement of private contracts. But as Table 2 shows, in India, it takes 1,420 days and 46 procedures to enforce contracts, while the cost to enforce the contract is as much as 40 percent of the claim. The process of enforcing a contract actually takes more than three times as many days as in China and twice as many days as in Brazil. The cost of enforcing contracts in India is twice as much as it is in OECD countries, on average. Streamlining the number of procedures and the time and cost involved in enforcing contracts could significantly enhance India’s business environment.
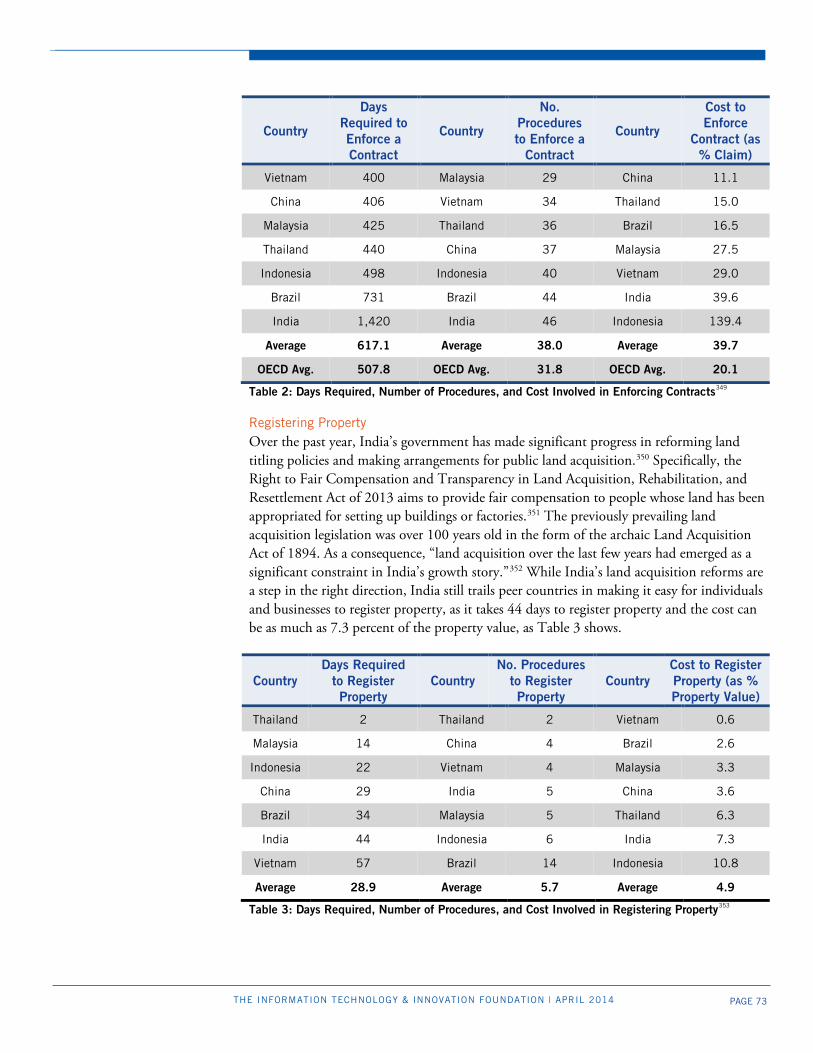
PAGE 73 THE INFORMATION TECHNOLOGY & INNOVATION FOUNDATION | APRIL 2014
Country
Days Required to Enforce a Contract
Country
No. Procedures to Enforce a
Contract
Country
Cost to Enforce
Contract (as % Claim)
Vietnam 400 Malaysia 29 China 11.1
China 406 Vietnam 34 Thailand 15.0
Malaysia 425 Thailand 36 Brazil 16.5
Thailand 440 China 37 Malaysia 27.5
Indonesia 498 Indonesia 40 Vietnam 29.0
Brazil 731 Brazil 44 India 39.6
India 1,420 India 46 Indonesia 139.4
Average 617.1 Average 38.0 Average 39.7
OECD Avg. 507.8 OECD Avg. 31.8 OECD Avg. 20.1
Table 2: Days Required, Number of Procedures, and Cost Involved in Enforcing Contracts349
Registering Property Over the past year, India’s government has made significant progress in reforming land titling policies and making arrangements for public land acquisition.350 Specifically, the Right to Fair Compensation and Transparency in Land Acquisition, Rehabilitation, and Resettlement Act of 2013 aims to provide fair compensation to people whose land has been appropriated for setting up buildings or factories.351 The previously prevailing land acquisition legislation was over 100 years old in the form of the archaic Land Acquisition Act of 1894. As a consequence, “land acquisition over the last few years had emerged as a significant constraint in India’s growth story.”352 While India’s land acquisition reforms are a step in the right direction, India still trails peer countries in making it easy for individuals and businesses to register property, as it takes 44 days to register property and the cost can be as much as 7.3 percent of the property value, as Table 3 shows.
Country Days Required
to Register Property
Country No. Procedures
to Register Property
Country Cost to Register Property (as % Property Value)
Thailand 2 Thailand 2 Vietnam 0.6
Malaysia 14 China 4 Brazil 2.6
Indonesia 22 Vietnam 4 Malaysia 3.3
China 29 India 5 China 3.6
Brazil 34 Malaysia 5 Thailand 6.3
India 44 Indonesia 6 India 7.3
Vietnam 57 Brazil 14 Indonesia 10.8
Average 28.9 Average 5.7 Average 4.9
Table 3: Days Required, Number of Procedures, and Cost Involved in Registering Property353
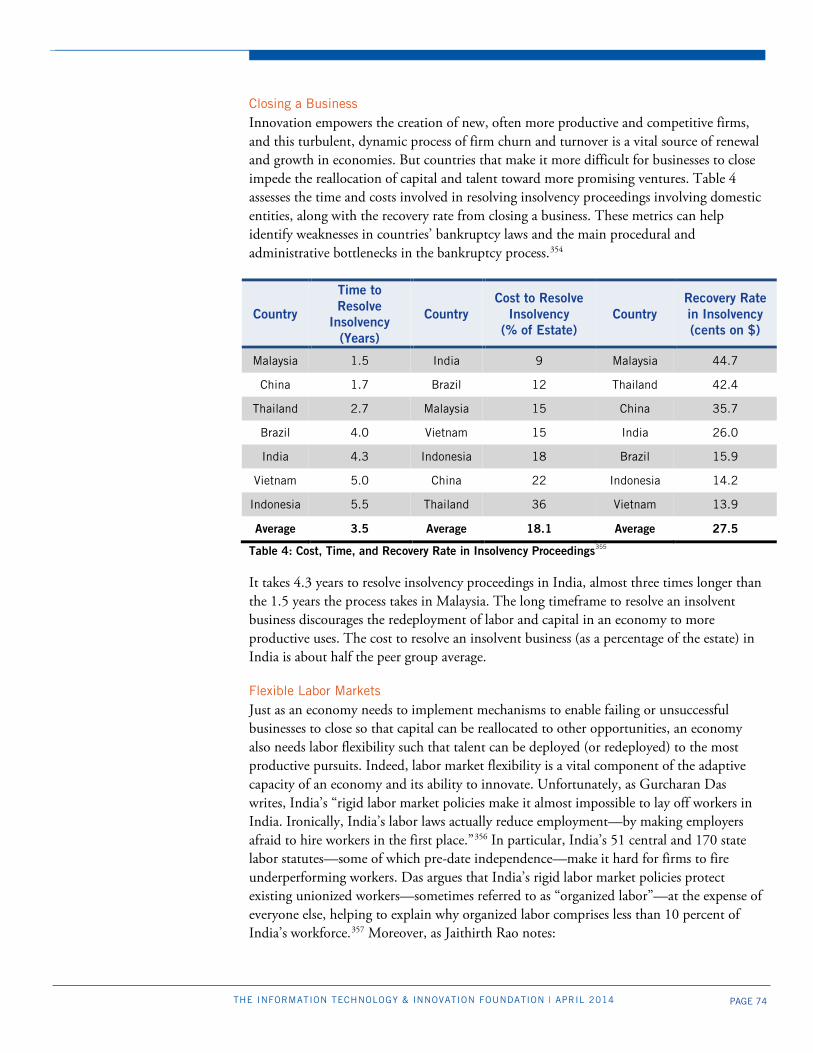
PAGE 74 THE INFORMATION TECHNOLOGY & INNOVATION FOUNDATION | APRIL 2014
Closing a Business Innovation empowers the creation of new, often more productive and competitive firms, and this turbulent, dynamic process of firm churn and turnover is a vital source of renewal and growth in economies. But countries that make it more difficult for businesses to close impede the reallocation of capital and talent toward more promising ventures. Table 4 assesses the time and costs involved in resolving insolvency proceedings involving domestic entities, along with the recovery rate from closing a business. These metrics can help identify weaknesses in countries’ bankruptcy laws and the main procedural and administrative bottlenecks in the bankruptcy process.354
Country
Time to Resolve
Insolvency (Years)
Country Cost to Resolve
Insolvency (% of Estate)
Country Recovery Rate in Insolvency (cents on $)
Malaysia 1.5 India 9 Malaysia 44.7
China 1.7 Brazil 12 Thailand 42.4
Thailand 2.7 Malaysia 15 China 35.7
Brazil 4.0 Vietnam 15 India 26.0
India 4.3 Indonesia 18 Brazil 15.9
Vietnam 5.0 China 22 Indonesia 14.2
Indonesia 5.5 Thailand 36 Vietnam 13.9
Average 3.5 Average 18.1 Average 27.5
Table 4: Cost, Time, and Recovery Rate in Insolvency Proceedings355
It takes 4.3 years to resolve insolvency proceedings in India, almost three times longer than the 1.5 years the process takes in Malaysia. The long timeframe to resolve an insolvent business discourages the redeployment of labor and capital in an economy to more productive uses. The cost to resolve an insolvent business (as a percentage of the estate) in India is about half the peer group average.
Flexible Labor Markets Just as an economy needs to implement mechanisms to enable failing or unsuccessful businesses to close so that capital can be reallocated to other opportunities, an economy also needs labor flexibility such that talent can be deployed (or redeployed) to the most productive pursuits. Indeed, labor market flexibility is a vital component of the adaptive capacity of an economy and its ability to innovate. Unfortunately, as Gurcharan Das writes, India’s “rigid labor market policies make it almost impossible to lay off workers in India. Ironically, India’s labor laws actually reduce employment—by making employers afraid to hire workers in the first place.”356 In particular, India’s 51 central and 170 state labor statutes—some of which pre-date independence—make it hard for firms to fire underperforming workers. Das argues that India’s rigid labor market policies protect existing unionized workers—sometimes referred to as “organized labor”—at the expense of everyone else, helping to explain why organized labor comprises less than 10 percent of India’s workforce.357 Moreover, as Jaithirth Rao notes:

PAGE 75 THE INFORMATION TECHNOLOGY & INNOVATION FOUNDATION | APRIL 2014
There are no clear rules for lay-offs. In order to lay off workers, an employer needs the “approval” of the government in power. And, of course, such approval is never given as the unions do not tolerate it. Paradoxically, this situation results not in worker protection, but in employers deciding that they will minimize the numbers of workers they need. In a capital-scare country, which has plenty of labor, the signal given to workers is that they are better off adding machines than workers.358
And to Rao’s point, studies have shown how tighter rules impede growth in labor-intensive industries and prompt firms to remain small.359 As the 2013 World Development Report writes, “In India, complex and cumbersome labor market institutions have unambiguously negative effects on economic efficiency but these institutions have remained largely untouched for 60 years. Tolerance for the avoidance or evasion of distortive regulation can help contain their cost but not ensure dynamism. In India, widespread noncompliance has been the dominant response to cumbersome labor regulations.”360 As the 2013 World Development Report continues:
Creative destruction, the mainstay of economic growth, happens to a large extent through labor reallocation. As workers move from jobs in low-productivity firms and obsolete firms to jobs in more dynamic economic units, output increases and the economy moves closer to the efficiency frontier. Differences in productivity across economic units underlie this creative destruction process. Such differences can reflect a healthy ecosystem driven by competition which offers the basis for efficiency-enhancing job reallocation. Market imperfections and government failures may hinder labor reallocation, however, resulting in a wider dispersion of productivity and many missed opportunities for growth.361
In short, bringing more flexibility to India’s labor markets would be one of the most important reforms the country could make to unlock the potential of Indian economic growth. Unfortunately, India has among the most restrictive employment legislation in the entire world. The OECD provides a measure of Employment Protection Legislation, indexed on a scale of zero to six, from least to most restrictive. Of 40 nations assessed by the OECD, India has the thirty-ninth most protective legislation for regular employment, surpassed only by Indonesia, as Figure 18 shows.
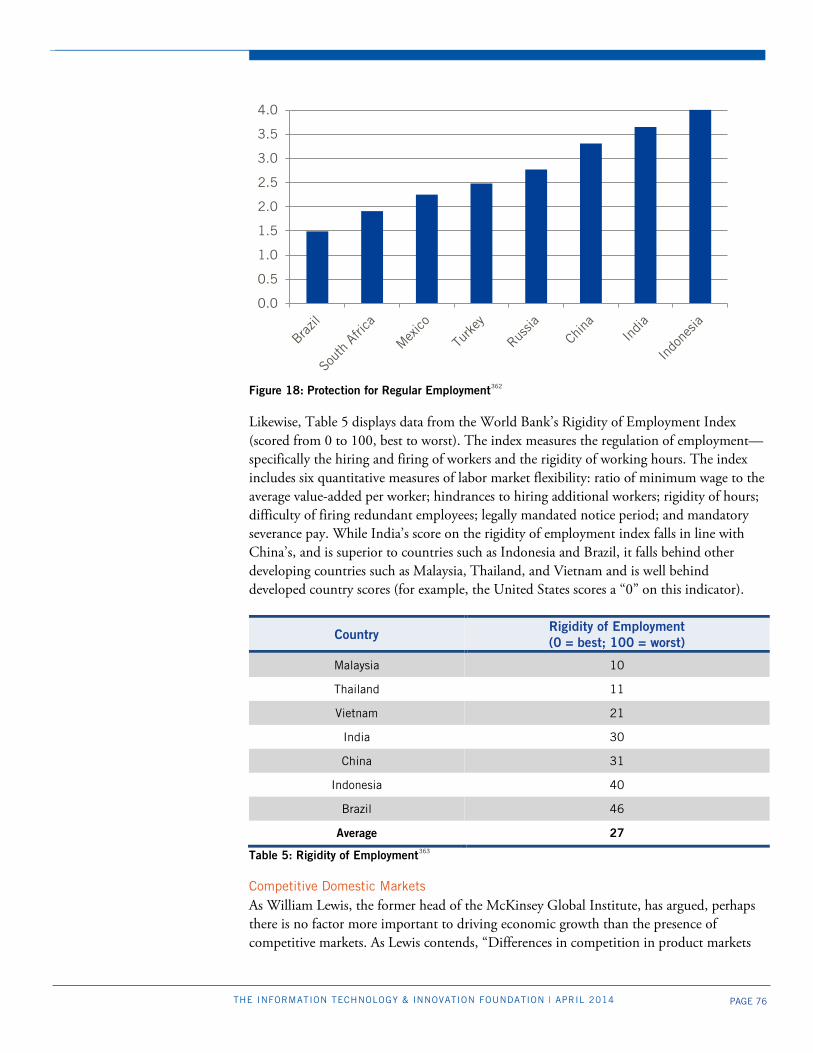
PAGE 76 THE INFORMATION TECHNOLOGY & INNOVATION FOUNDATION | APRIL 2014
Figure 18: Protection for Regular Employment362
Likewise, Table 5 displays data from the World Bank’s Rigidity of Employment Index (scored from 0 to 100, best to worst). The index measures the regulation of employment—specifically the hiring and firing of workers and the rigidity of working hours. The index includes six quantitative measures of labor market flexibility: ratio of minimum wage to the average value-added per worker; hindrances to hiring additional workers; rigidity of hours; difficulty of firing redundant employees; legally mandated notice period; and mandatory severance pay. While India’s score on the rigidity of employment index falls in line with China’s, and is superior to countries such as Indonesia and Brazil, it falls behind other developing countries such as Malaysia, Thailand, and Vietnam and is well behind developed country scores (for example, the United States scores a “0” on this indicator).
Country Rigidity of Employment (0 = best; 100 = worst)
Malaysia 10
Thailand 11
Vietnam 21
India 30
China 31
Indonesia 40
Brazil 46
Average 27
Table 5: Rigidity of Employment363
Competitive Domestic Markets As William Lewis, the former head of the McKinsey Global Institute, has argued, perhaps there is no factor more important to driving economic growth than the presence of competitive markets. As Lewis contends, “Differences in competition in product markets
0.0
0.5
1.0
1.5
2.0
2.5
3.0
3.5
4.0

PAGE 77 THE INFORMATION TECHNOLOGY & INNOVATION FOUNDATION | APRIL 2014
are much more important [than differences in labor and capital markets]. Policies governing competition in product markets are as important as macroeconomic policies.”364 Countries that support competitive domestic markets create the conditions for new entrepreneurial ventures to flourish while at the same time incentivizing established firms to continue to innovate and to boost productivity. But countries that protect entrenched, incumbent, or politically favored industries from market-based competition only damage their own country’s productivity and economic growth potential.
To be sure, India has made considerable progress over the years in fostering more competitive markets. Yet in many sectors, such as retail, India has long precluded or restricted competition by making it difficult for foreign competitors such as Walmart and Carrefour to enter its markets. India has also limited foreign competition in a number of services sectors, particularly in accounting, banking, insurance, and legal services.365 For example, The Bar Council of India (BCI) is the governing body for the legal profession in India, and membership in the BCI is mandatory to practice law in India, but is limited to Indian citizens. Moreover, foreign law firms are not allowed to open offices in India.366
Yet for competitive domestic markets to thrive, governments must resist vested interests that can organize to limit competition, whether from foreign or domestic entrants. The OECD provides data on the overall regulatory protection countries provide to incumbents, which considers legal barriers to entry, antitrust exemptions, barriers in network sectors, and barriers in services (on a scale of zero to six, from best to worst). Of 40 nations assessed by the OECD, India scores twenty-fourth on this indicator. And while India does score better than several peer countries, including Russia, China, Mexico, and Indonesia, as Figure 19 shows, India still has significant opportunity for improving the competitiveness of its markets.
Figure 19: Overall Regulatory Protection of Incumbents367
Competitive domestic markets are also shaped by the extent of government involvement in the economy, particularly in the form of state-owned enterprises or state-supported enterprises (SSEs). In countries in which SOEs account for a disproportionate share of economic activity, private market-based economic activity is substantially distorted, particularly because SOEs enjoy advantages such as: monopoly access to markets through
0.00.51.01.52.02.53.03.54.0
Membership in the Bar Council of India is mandatory to practice law in India, but is limited to Indian citizens, and foreign law firms are not allowed to open offices in India.

PAGE 78 THE INFORMATION TECHNOLOGY & INNOVATION FOUNDATION | APRIL 2014
sharply constrained (foreign and domestic) competition; public subsidies, including preferential access to free or discounted land, capital, and even labor; and exemptions from certain laws and regulations. To measure this, the Fraser Institute uses an index of government enterprise and investment based on the number, composition, and share of output supplied by state-operated enterprises and government investment as a share of total investment. Countries are ranked from ten to zero, with those where there are few SOEs and where government investment is generally less than 15 percent of total investment receiving a ten, and those where the economy is dominated by SOEs and where government investment exceeds 50 percent of total investment receiving a zero.368 As Table 6 illustrates, India scores a 4.0 on this indicator, with government’s investment as a share of total investment in the economy at approximately one-quarter.
Country Government Enterprise &
Investment Rating (10 = Best; 0 = Worst)
Government Investment as a Share of Total Investment in
Economy (%)
Brazil 8.0 15.2
Thailand 7.0 20.1
Indonesia 7.0 NA
India 4.0 24.1
Malaysia 2.0 42.7
China 0.0 50.9
Vietnam NA NA
Average 4.7 30.6 Table 6: Government Investment as a Share of Total Investment in Economy, 2013369
Product Market Regulation As the OECD notes, “Excessive regulation of product markets is a barrier to the diffusion of technology and lowers the speed at which labour productivity catches up to the level of the best performing economies.”370 Unfortunately, according to the OECD, “the overall regulatory environment in India is still distinctly less favorable to competition than the average OECD country and even some non-member countries.”371 The OECD measures the restrictiveness of economy-wide product market regulation with an index that measures state control, barriers to entrepreneurship, and obstacles to trade and investment on a scale of zero to six, from least to most restrictive. As Figure 20 shows, India has among the most restrictive product market regulations of any country measured by the OECD—in fact, it ranks thirty-seventh out of 40 countries assessed—with only Russia and China scoring more poorly.
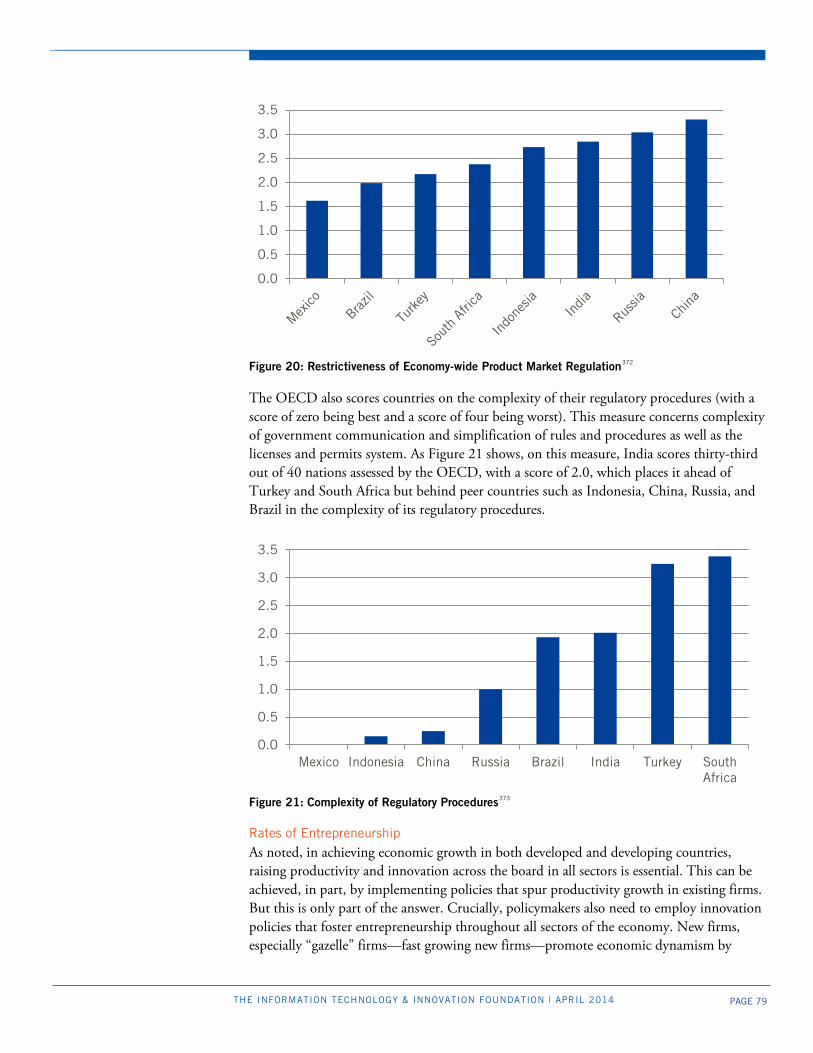
PAGE 79 THE INFORMATION TECHNOLOGY & INNOVATION FOUNDATION | APRIL 2014
Figure 20: Restrictiveness of Economy-wide Product Market Regulation372
The OECD also scores countries on the complexity of their regulatory procedures (with a score of zero being best and a score of four being worst). This measure concerns complexity of government communication and simplification of rules and procedures as well as the licenses and permits system. As Figure 21 shows, on this measure, India scores thirty-third out of 40 nations assessed by the OECD, with a score of 2.0, which places it ahead of Turkey and South Africa but behind peer countries such as Indonesia, China, Russia, and Brazil in the complexity of its regulatory procedures.
Figure 21: Complexity of Regulatory Procedures373
Rates of Entrepreneurship As noted, in achieving economic growth in both developed and developing countries, raising productivity and innovation across the board in all sectors is essential. This can be achieved, in part, by implementing policies that spur productivity growth in existing firms. But this is only part of the answer. Crucially, policymakers also need to employ innovation policies that foster entrepreneurship throughout all sectors of the economy. New firms, especially “gazelle” firms—fast growing new firms—promote economic dynamism by
0.0
0.5
1.0
1.5
2.0
2.5
3.0
3.5
0.0
0.5
1.0
1.5
2.0
2.5
3.0
3.5
Mexico Indonesia China Russia Brazil India Turkey SouthAfrica
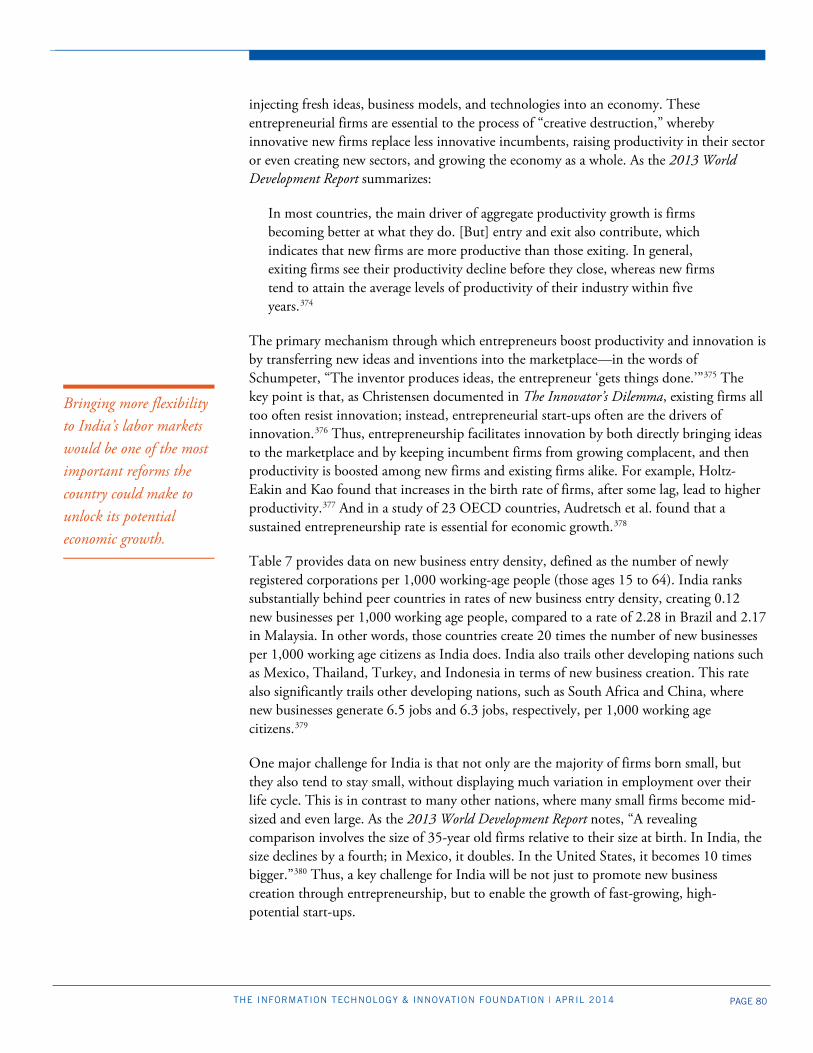
PAGE 80 THE INFORMATION TECHNOLOGY & INNOVATION FOUNDATION | APRIL 2014
injecting fresh ideas, business models, and technologies into an economy. These entrepreneurial firms are essential to the process of “creative destruction,” whereby innovative new firms replace less innovative incumbents, raising productivity in their sector or even creating new sectors, and growing the economy as a whole. As the 2013 World Development Report summarizes:
In most countries, the main driver of aggregate productivity growth is firms becoming better at what they do. [But] entry and exit also contribute, which indicates that new firms are more productive than those exiting. In general, exiting firms see their productivity decline before they close, whereas new firms tend to attain the average levels of productivity of their industry within five years.374
The primary mechanism through which entrepreneurs boost productivity and innovation is by transferring new ideas and inventions into the marketplace—in the words of Schumpeter, “The inventor produces ideas, the entrepreneur ‘gets things done.’”375 The key point is that, as Christensen documented in The Innovator’s Dilemma, existing firms all too often resist innovation; instead, entrepreneurial start-ups often are the drivers of innovation.376 Thus, entrepreneurship facilitates innovation by both directly bringing ideas to the marketplace and by keeping incumbent firms from growing complacent, and then productivity is boosted among new firms and existing firms alike. For example, Holtz-Eakin and Kao found that increases in the birth rate of firms, after some lag, lead to higher productivity.377 And in a study of 23 OECD countries, Audretsch et al. found that a sustained entrepreneurship rate is essential for economic growth.378
Table 7 provides data on new business entry density, defined as the number of newly registered corporations per 1,000 working-age people (those ages 15 to 64). India ranks substantially behind peer countries in rates of new business entry density, creating 0.12 new businesses per 1,000 working age people, compared to a rate of 2.28 in Brazil and 2.17 in Malaysia. In other words, those countries create 20 times the number of new businesses per 1,000 working age citizens as India does. India also trails other developing nations such as Mexico, Thailand, Turkey, and Indonesia in terms of new business creation. This rate also significantly trails other developing nations, such as South Africa and China, where new businesses generate 6.5 jobs and 6.3 jobs, respectively, per 1,000 working age citizens.379
One major challenge for India is that not only are the majority of firms born small, but they also tend to stay small, without displaying much variation in employment over their life cycle. This is in contrast to many other nations, where many small firms become mid-sized and even large. As the 2013 World Development Report notes, “A revealing comparison involves the size of 35-year old firms relative to their size at birth. In India, the size declines by a fourth; in Mexico, it doubles. In the United States, it becomes 10 times bigger.”380 Thus, a key challenge for India will be not just to promote new business creation through entrepreneurship, but to enable the growth of fast-growing, high-potential start-ups.
Bringing more flexibility to India’s labor markets would be one of the most important reforms the country could make to unlock its potential economic growth.
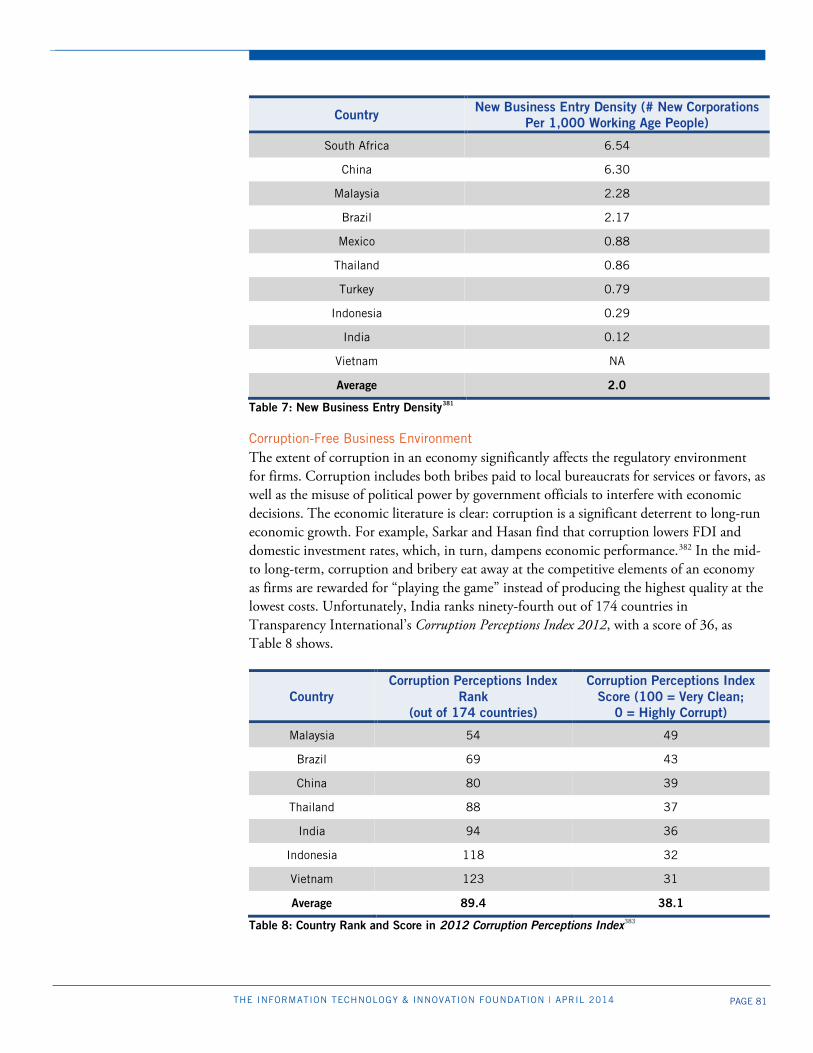
PAGE 81 THE INFORMATION TECHNOLOGY & INNOVATION FOUNDATION | APRIL 2014
Country New Business Entry Density (# New Corporations Per 1,000 Working Age People)
South Africa 6.54
China 6.30
Malaysia 2.28
Brazil 2.17
Mexico 0.88
Thailand 0.86
Turkey 0.79
Indonesia 0.29
India 0.12
Vietnam NA
Average 2.0
Table 7: New Business Entry Density381
Corruption-Free Business Environment The extent of corruption in an economy significantly affects the regulatory environment for firms. Corruption includes both bribes paid to local bureaucrats for services or favors, as well as the misuse of political power by government officials to interfere with economic decisions. The economic literature is clear: corruption is a significant deterrent to long-run economic growth. For example, Sarkar and Hasan find that corruption lowers FDI and domestic investment rates, which, in turn, dampens economic performance.382 In the mid- to long-term, corruption and bribery eat away at the competitive elements of an economy as firms are rewarded for “playing the game” instead of producing the highest quality at the lowest costs. Unfortunately, India ranks ninety-fourth out of 174 countries in Transparency International’s Corruption Perceptions Index 2012, with a score of 36, as Table 8 shows.
Country Corruption Perceptions Index
Rank (out of 174 countries)
Corruption Perceptions Index Score (100 = Very Clean;
0 = Highly Corrupt)
Malaysia 54 49
Brazil 69 43
China 80 39
Thailand 88 37
India 94 36
Indonesia 118 32
Vietnam 123 31
Average 89.4 38.1
Table 8: Country Rank and Score in 2012 Corruption Perceptions Index383
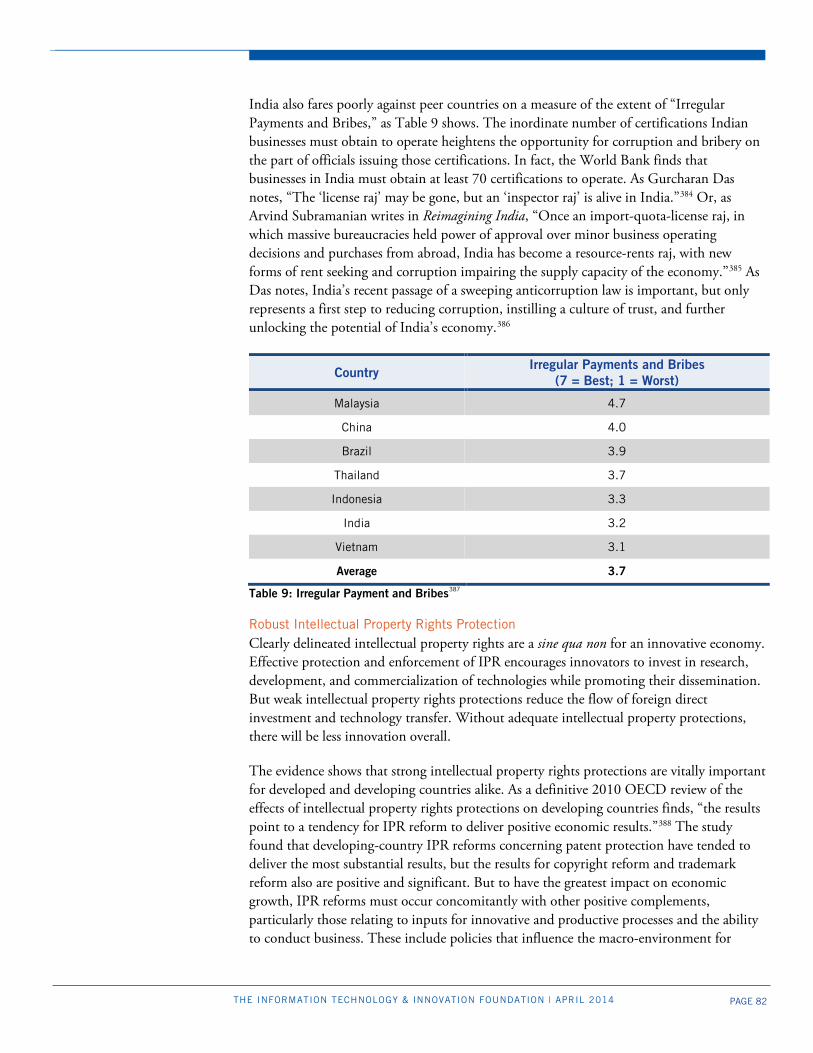
PAGE 82 THE INFORMATION TECHNOLOGY & INNOVATION FOUNDATION | APRIL 2014
India also fares poorly against peer countries on a measure of the extent of “Irregular Payments and Bribes,” as Table 9 shows. The inordinate number of certifications Indian businesses must obtain to operate heightens the opportunity for corruption and bribery on the part of officials issuing those certifications. In fact, the World Bank finds that businesses in India must obtain at least 70 certifications to operate. As Gurcharan Das notes, “The ‘license raj’ may be gone, but an ‘inspector raj’ is alive in India.”384 Or, as Arvind Subramanian writes in Reimagining India, “Once an import-quota-license raj, in which massive bureaucracies held power of approval over minor business operating decisions and purchases from abroad, India has become a resource-rents raj, with new forms of rent seeking and corruption impairing the supply capacity of the economy.”385 As Das notes, India’s recent passage of a sweeping anticorruption law is important, but only represents a first step to reducing corruption, instilling a culture of trust, and further unlocking the potential of India’s economy.386
Country Irregular Payments and Bribes
(7 = Best; 1 = Worst)
Malaysia 4.7
China 4.0
Brazil 3.9
Thailand 3.7
Indonesia 3.3
India 3.2
Vietnam 3.1
Average 3.7
Table 9: Irregular Payment and Bribes387
Robust Intellectual Property Rights Protection Clearly delineated intellectual property rights are a sine qua non for an innovative economy. Effective protection and enforcement of IPR encourages innovators to invest in research, development, and commercialization of technologies while promoting their dissemination. But weak intellectual property rights protections reduce the flow of foreign direct investment and technology transfer. Without adequate intellectual property protections, there will be less innovation overall.
The evidence shows that strong intellectual property rights protections are vitally important for developed and developing countries alike. As a definitive 2010 OECD review of the effects of intellectual property rights protections on developing countries finds, “the results point to a tendency for IPR reform to deliver positive economic results.”388 The study found that developing-country IPR reforms concerning patent protection have tended to deliver the most substantial results, but the results for copyright reform and trademark reform also are positive and significant. But to have the greatest impact on economic growth, IPR reforms must occur concomitantly with other positive complements, particularly those relating to inputs for innovative and productive processes and the ability to conduct business. These include policies that influence the macro-environment for
PAGE 83 THE INFORMATION TECHNOLOGY & INNOVATION FOUNDATION | APRIL 2014
firms, as well as the availability of resources (for example, those related to education), legal and institutional conditions, and fiscal incentives.389
Nations that have not implemented or do not enforce robust intellectual property rights protections hurt their economic development in at least three principal ways. First, they deter future innovative activity by their innovators. Second, they discourage trade and foreign direct investment, hurting their own consumers and businesses, both by limiting their choices and by inhibiting their enterprises’ abilities to access best-of-breed technologies that are vital to boosting domestic productivity. Third, in countries with weak IPR protections, firms are forced to invest undue amounts of resources in IP protection rather than invention.390
Ironically, developing countries’ own economic development opportunities and intellectual property development potential are often inhibited by their weak intellectual property protections. For instance, the lack of effective protection for intellectual property rights has limited the introduction of advanced technology and innovation investments by foreign companies in China, reducing potential benefits to local innovation capacity.391 As Cavazos Cepeda, Lippoldt, and Senft find in a case study of IPR protections in that economy: “China has made progress in strengthening the protection of intellectual property over the past two decades, as attested to by indicators such as the Patent Rights Index…However, uncertainty around the protection of intellectual property [remains] an important deterrent for foreign as well as domestic firms engaging in R&D-related activities.”392
Ultimately, as Cavazos Cepeda, Lippoldt, and Senft find, countries in which “uncertainties in the IP environment persist” are “likely to fall short of their innovation potential,” as some firms may withdraw from innovative activities or divert energy into alternative approaches for IP protection.393 Thus, if countries are to realize their vision of fostering regional trade and foreign direct investment while at the same time maximizing their full innovation and economic growth potential, it is imperative that they both implement and enforce strong IPR protections.
Perhaps the most comprehensive cross-country assessment of countries’ IPR protections is the “Park Index,” which provides an index of patent rights for 110 countries, with data going back to 1960. It presents the sum of five separate scores, for coverage (inventions that are patentable); membership in international treaties; duration of protection; enforcement mechanisms; and restrictions (for example, compulsory licensing in the event that a patented invention is not sufficiently exploited).394 The index was designed to provide an indicator of the strength of patent protection in countries (though not the overall quality of countries’ patent systems).395
To be sure, as Table 10 shows, in the 2000s India did make considerable and laudable improvement with regard to the strength of patent rights. In fact, of 52 countries assessed by ITIF using the Park Index, India achieved the most improvement of any nation in patent rights protection from 2000 to 2005.396 This largely reflects India’s introduction of a basic intellectual property framework in the mid-2000s, including incorporating a 20-year patent protection provision. Yet still, India scores below China on the Park Index, and
Nations that fail to implement robust IP protections deter future innovative activity by their own innovators, discourage trade and FDI, and force firms to invest undue amounts of resources in IP protection rather than invention.
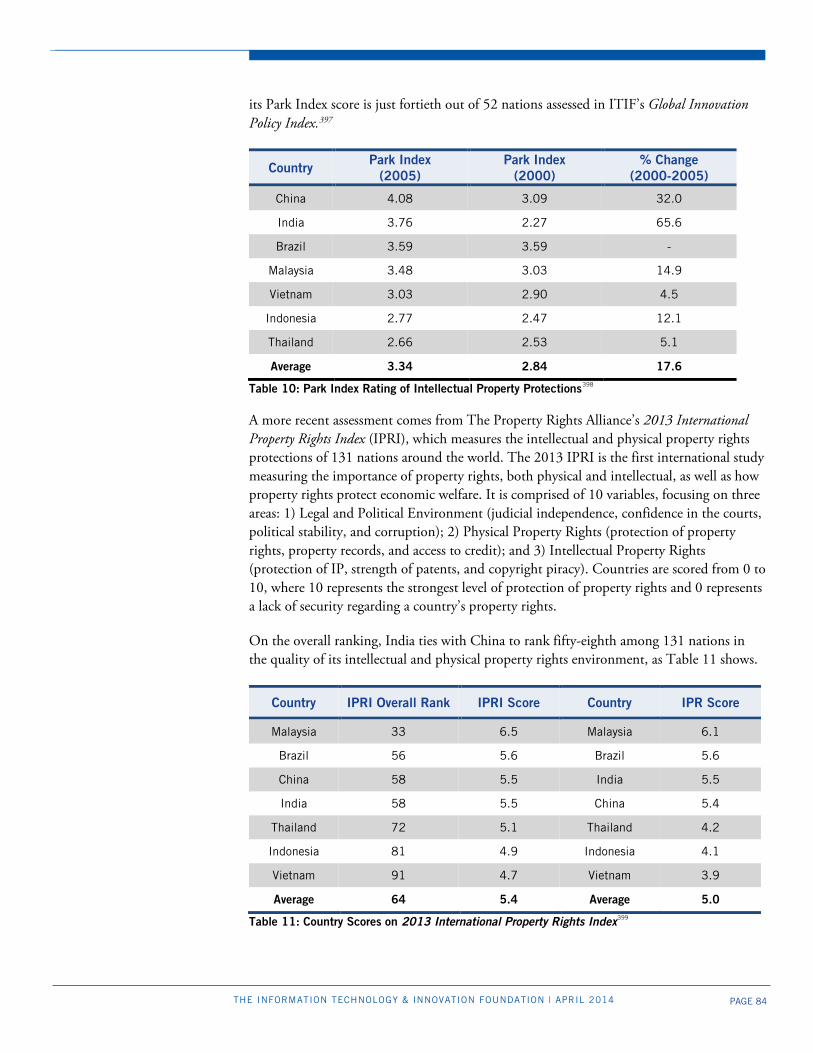
PAGE 84 THE INFORMATION TECHNOLOGY & INNOVATION FOUNDATION | APRIL 2014
its Park Index score is just fortieth out of 52 nations assessed in ITIF’s Global Innovation Policy Index.397
Country Park Index
(2005) Park Index
(2000) % Change
(2000-2005)
China 4.08 3.09 32.0
India 3.76 2.27 65.6
Brazil 3.59 3.59 -
Malaysia 3.48 3.03 14.9
Vietnam 3.03 2.90 4.5
Indonesia 2.77 2.47 12.1
Thailand 2.66 2.53 5.1
Average 3.34 2.84 17.6
Table 10: Park Index Rating of Intellectual Property Protections398
A more recent assessment comes from The Property Rights Alliance’s 2013 International Property Rights Index (IPRI), which measures the intellectual and physical property rights protections of 131 nations around the world. The 2013 IPRI is the first international study measuring the importance of property rights, both physical and intellectual, as well as how property rights protect economic welfare. It is comprised of 10 variables, focusing on three areas: 1) Legal and Political Environment (judicial independence, confidence in the courts, political stability, and corruption); 2) Physical Property Rights (protection of property rights, property records, and access to credit); and 3) Intellectual Property Rights (protection of IP, strength of patents, and copyright piracy). Countries are scored from 0 to 10, where 10 represents the strongest level of protection of property rights and 0 represents a lack of security regarding a country’s property rights.
On the overall ranking, India ties with China to rank fifty-eighth among 131 nations in the quality of its intellectual and physical property rights environment, as Table 11 shows.
Country IPRI Overall Rank IPRI Score Country IPR Score
Malaysia 33 6.5 Malaysia 6.1
Brazil 56 5.6 Brazil 5.6
China 58 5.5 India 5.5
India 58 5.5 China 5.4
Thailand 72 5.1 Thailand 4.2
Indonesia 81 4.9 Indonesia 4.1
Vietnam 91 4.7 Vietnam 3.9
Average 64 5.4 Average 5.0
Table 11: Country Scores on 2013 International Property Rights Index399
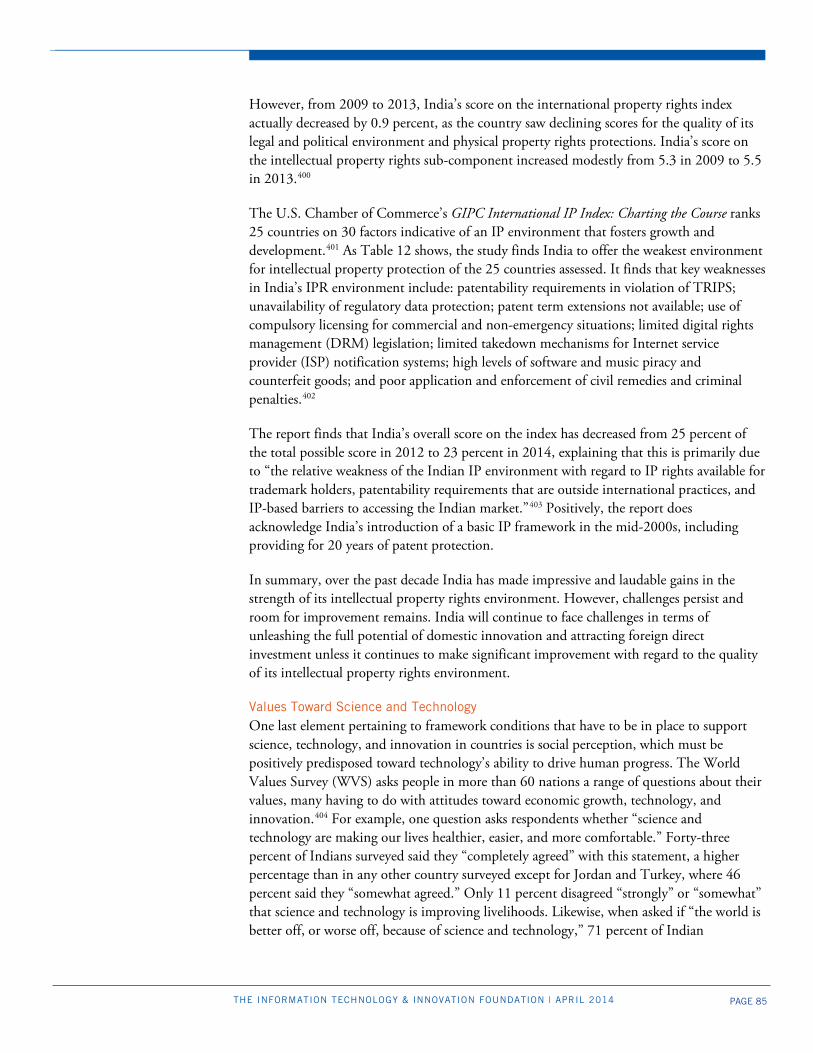
PAGE 85 THE INFORMATION TECHNOLOGY & INNOVATION FOUNDATION | APRIL 2014
However, from 2009 to 2013, India’s score on the international property rights index actually decreased by 0.9 percent, as the country saw declining scores for the quality of its legal and political environment and physical property rights protections. India’s score on the intellectual property rights sub-component increased modestly from 5.3 in 2009 to 5.5 in 2013.400
The U.S. Chamber of Commerce’s GIPC International IP Index: Charting the Course ranks 25 countries on 30 factors indicative of an IP environment that fosters growth and development.401 As Table 12 shows, the study finds India to offer the weakest environment for intellectual property protection of the 25 countries assessed. It finds that key weaknesses in India’s IPR environment include: patentability requirements in violation of TRIPS; unavailability of regulatory data protection; patent term extensions not available; use of compulsory licensing for commercial and non-emergency situations; limited digital rights management (DRM) legislation; limited takedown mechanisms for Internet service provider (ISP) notification systems; high levels of software and music piracy and counterfeit goods; and poor application and enforcement of civil remedies and criminal penalties.402
The report finds that India’s overall score on the index has decreased from 25 percent of the total possible score in 2012 to 23 percent in 2014, explaining that this is primarily due to “the relative weakness of the Indian IP environment with regard to IP rights available for trademark holders, patentability requirements that are outside international practices, and IP-based barriers to accessing the Indian market.”403 Positively, the report does acknowledge India’s introduction of a basic IP framework in the mid-2000s, including providing for 20 years of patent protection.
In summary, over the past decade India has made impressive and laudable gains in the strength of its intellectual property rights environment. However, challenges persist and room for improvement remains. India will continue to face challenges in terms of unleashing the full potential of domestic innovation and attracting foreign direct investment unless it continues to make significant improvement with regard to the quality of its intellectual property rights environment.
Values Toward Science and Technology One last element pertaining to framework conditions that have to be in place to support science, technology, and innovation in countries is social perception, which must be positively predisposed toward technology’s ability to drive human progress. The World Values Survey (WVS) asks people in more than 60 nations a range of questions about their values, many having to do with attitudes toward economic growth, technology, and innovation.404 For example, one question asks respondents whether “science and technology are making our lives healthier, easier, and more comfortable.” Forty-three percent of Indians surveyed said they “completely agreed” with this statement, a higher percentage than in any other country surveyed except for Jordan and Turkey, where 46 percent said they “somewhat agreed.” Only 11 percent disagreed “strongly” or “somewhat” that science and technology is improving livelihoods. Likewise, when asked if “the world is better off, or worse off, because of science and technology,” 71 percent of Indian

PAGE 86 THE INFORMATION TECHNOLOGY & INNOVATION FOUNDATION | APRIL 2014
participants responded that the world would be “a lot better off”—double the percentage responding similarly in China. The favorable predisposition to the ability of science and technology to positively transform India’s society and economy is a particularly strong feature of India’s innovation ecosystem.
Country 2014 GIPC International IP Index Score
United States 28.52
United Kingdom 27.59
France 27.15
Singapore 25.12
Australia 24.18
Japan 23.24
New Zealand 21.32
Canada 17.40
Malaysia 14.36
Mexico 14.27
Colombia 13.66
Chile 13.55
Russia 13.28
Turkey 12.38
United Arab Emirates (UAE) 11.72
Ukraine 11.68
China 11.62
South Africa 11.60
Brazil 10.83
Nigeria 9.80
Argentina 9.45
Indonesia 8.09
Vietnam 7.80
Thailand 7.34
India 6.95
Average 15.32
Table 12: 2014 GIPC International IP Index Score405
Effective Tax, Trade, and Investment Environment An effective tax, trade, and investment environment is crucial to the proper functioning of market economies. This section describes the importance of each of these policy areas and compares India to peer developing nations on these policy issues.
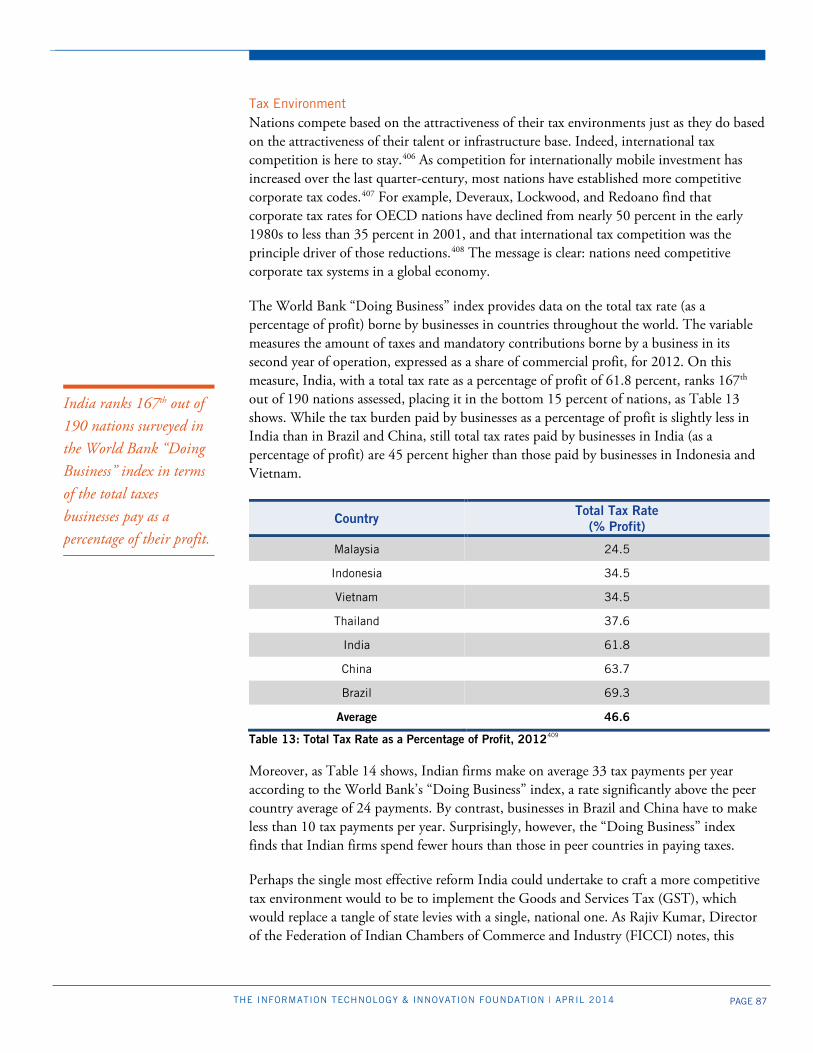
PAGE 87 THE INFORMATION TECHNOLOGY & INNOVATION FOUNDATION | APRIL 2014
Tax Environment Nations compete based on the attractiveness of their tax environments just as they do based on the attractiveness of their talent or infrastructure base. Indeed, international tax competition is here to stay.406 As competition for internationally mobile investment has increased over the last quarter-century, most nations have established more competitive corporate tax codes.407 For example, Deveraux, Lockwood, and Redoano find that corporate tax rates for OECD nations have declined from nearly 50 percent in the early 1980s to less than 35 percent in 2001, and that international tax competition was the principle driver of those reductions.408 The message is clear: nations need competitive corporate tax systems in a global economy.
The World Bank “Doing Business” index provides data on the total tax rate (as a percentage of profit) borne by businesses in countries throughout the world. The variable measures the amount of taxes and mandatory contributions borne by a business in its second year of operation, expressed as a share of commercial profit, for 2012. On this measure, India, with a total tax rate as a percentage of profit of 61.8 percent, ranks 167th out of 190 nations assessed, placing it in the bottom 15 percent of nations, as Table 13 shows. While the tax burden paid by businesses as a percentage of profit is slightly less in India than in Brazil and China, still total tax rates paid by businesses in India (as a percentage of profit) are 45 percent higher than those paid by businesses in Indonesia and Vietnam.
Country Total Tax Rate (% Profit)
Malaysia 24.5
Indonesia 34.5
Vietnam 34.5
Thailand 37.6
India 61.8
China 63.7
Brazil 69.3
Average 46.6
Table 13: Total Tax Rate as a Percentage of Profit, 2012409
Moreover, as Table 14 shows, Indian firms make on average 33 tax payments per year according to the World Bank’s “Doing Business” index, a rate significantly above the peer country average of 24 payments. By contrast, businesses in Brazil and China have to make less than 10 tax payments per year. Surprisingly, however, the “Doing Business” index finds that Indian firms spend fewer hours than those in peer countries in paying taxes.
Perhaps the single most effective reform India could undertake to craft a more competitive tax environment would to be to implement the Goods and Services Tax (GST), which would replace a tangle of state levies with a single, national one. As Rajiv Kumar, Director of the Federation of Indian Chambers of Commerce and Industry (FICCI) notes, this
India ranks 167th out of 190 nations surveyed in the World Bank “Doing Business” index in terms of the total taxes businesses pay as a percentage of their profit.

PAGE 88 THE INFORMATION TECHNOLOGY & INNOVATION FOUNDATION | APRIL 2014
would be as significant as India “signing a free-trade deal with itself.” As The Economist notes, creating a GST is an obvious way to boost trade and growth and to lure investors to a bigger single market, “yet state governments and the opposition are blocking it, distrusting the center to dish out revenues fairly.”410
Country Hours Needed to Pay Taxes Country No. Tax Payments
Made Per Year
Malaysia 133 China 7
India 243 Brazil 9
Indonesia 259 Malaysia 13
Thailand 264 Thailand 22
China 338 Vietnam 32
Vietnam 872 India 33
Brazil 2,600 Indonesia 51
Average 672.7 Average 23.9
Table 14: Hours Needed to Pay Taxes and Number Tax Payments per Year411
Finally, by not providing a clear and transparent tax environment for foreign enterprises operating in India, officials disadvantage foreign enterprises relative to domestic competitors. For example, on September 30, 2013, Indian authorities froze all of Nokia’s assets in India, including its bank account and factories.412 This followed a raid conducted by Indian authorities at Nokia’s factory in Chennai in January 2013 over outstanding tax payments estimated at 20.8 billion rupees ($333 million). Similarly, British telecommunications provider Vodafone is contesting efforts by Indian authorities to require it to pay as much as $3 billion related to its acquisition of a majority stake in a local cellphone operator in 2007.413 The excessive number of large-dollar tax controversies in India demonstrates a clear need for improvements in the fairness, predictability, transparency, consistency, and efficiency of Indian tax law, collection, due process, and dispute resolution.414
Trade Environment Regarding embracing open trade, data suggests that free trade benefits developed and developing countries alike. For example, a World Bank study of 77 developing countries over a period of 20 years found that a developing country’s productivity is larger the more open the country is to trade with industrial countries and the greater its foreign R&D investment.415 Exposing domestic firms to international markets and forcing them to compete against sophisticated global competitors makes trade a strong driver of innovation and productivity growth. In fact, data from the OECD Innovation Microdata Project shows that exposure to international markets has a strong positive effect on either firms’ incentives to innovate or on their ability to innovate.416 In part, this occurs because international trade and investment allow for a freer flow of technologies across borders, enhancing competitive pressures and opening new markets. And a number of studies find that firms that are involved in trade and investment are more productive and innovative than purely domestic firms.417
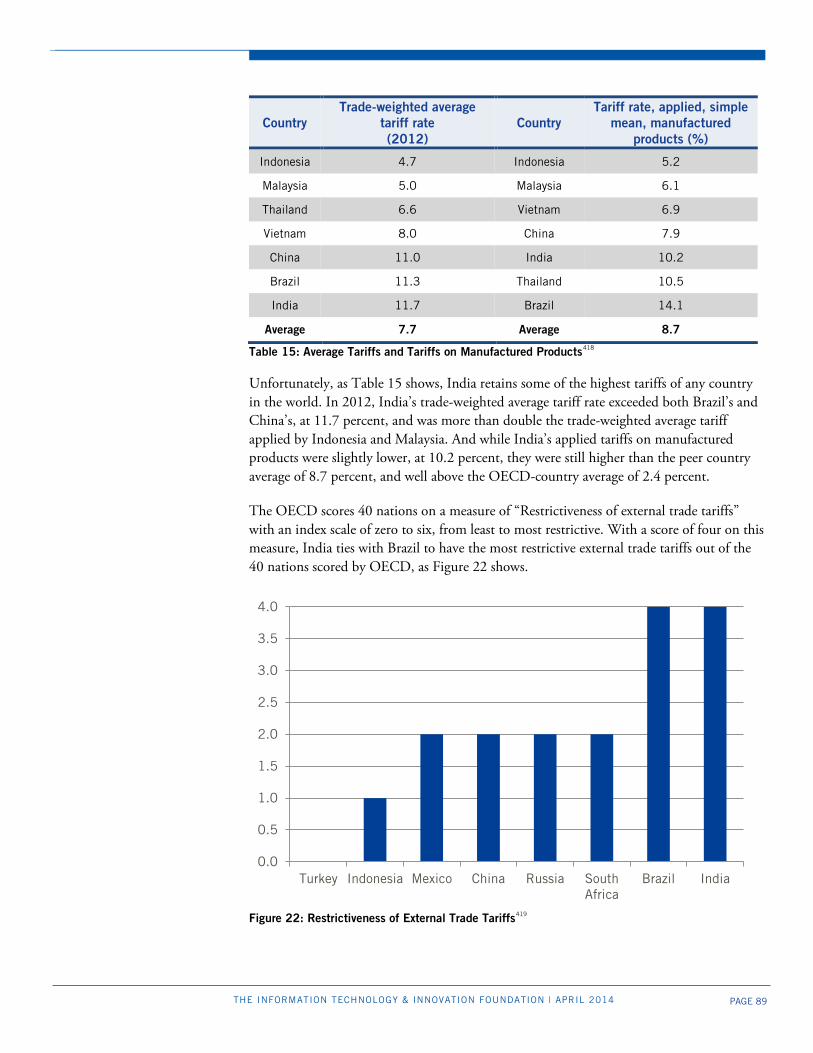
PAGE 89 THE INFORMATION TECHNOLOGY & INNOVATION FOUNDATION | APRIL 2014
Country Trade-weighted average
tariff rate (2012)
Country Tariff rate, applied, simple
mean, manufactured products (%)
Indonesia 4.7 Indonesia 5.2
Malaysia 5.0 Malaysia 6.1
Thailand 6.6 Vietnam 6.9
Vietnam 8.0 China 7.9
China 11.0 India 10.2
Brazil 11.3 Thailand 10.5
India 11.7 Brazil 14.1
Average 7.7 Average 8.7
Table 15: Average Tariffs and Tariffs on Manufactured Products418
Unfortunately, as Table 15 shows, India retains some of the highest tariffs of any country in the world. In 2012, India’s trade-weighted average tariff rate exceeded both Brazil’s and China’s, at 11.7 percent, and was more than double the trade-weighted average tariff applied by Indonesia and Malaysia. And while India’s applied tariffs on manufactured products were slightly lower, at 10.2 percent, they were still higher than the peer country average of 8.7 percent, and well above the OECD-country average of 2.4 percent.
The OECD scores 40 nations on a measure of “Restrictiveness of external trade tariffs” with an index scale of zero to six, from least to most restrictive. With a score of four on this measure, India ties with Brazil to have the most restrictive external trade tariffs out of the 40 nations scored by OECD, as Figure 22 shows.
Figure 22: Restrictiveness of External Trade Tariffs419
0.0
0.5
1.0
1.5
2.0
2.5
3.0
3.5
4.0
Turkey Indonesia Mexico China Russia SouthAfrica
Brazil India
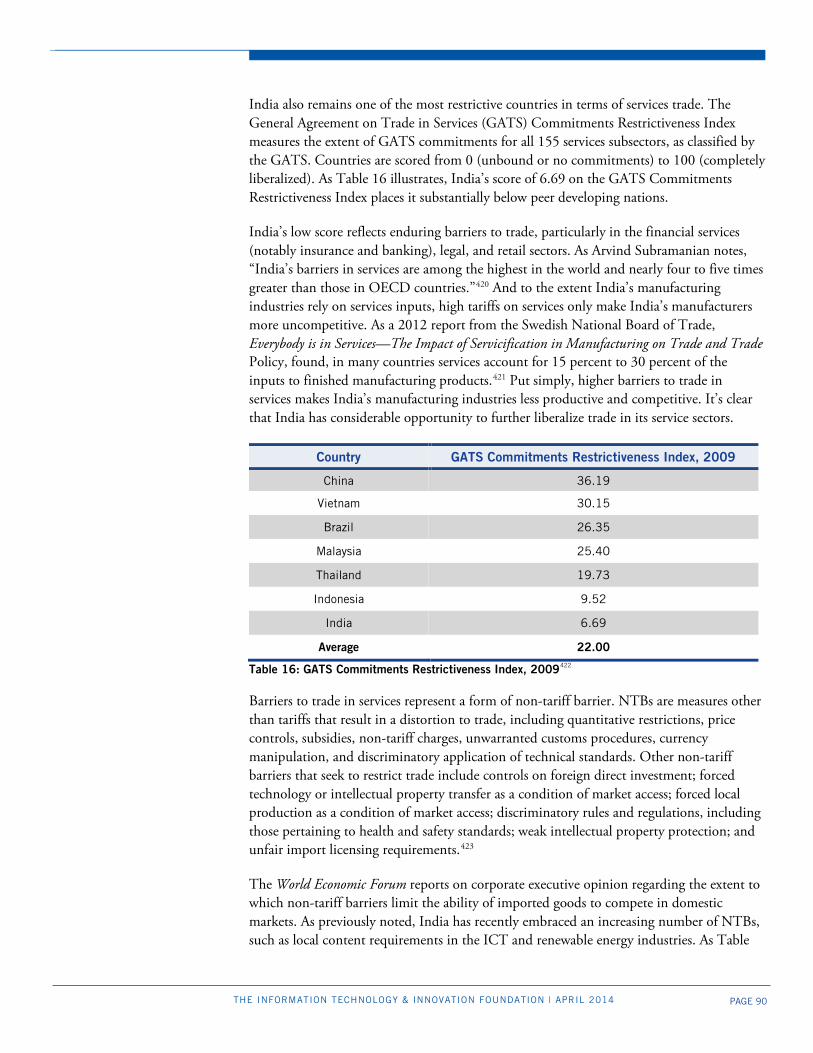
PAGE 90 THE INFORMATION TECHNOLOGY & INNOVATION FOUNDATION | APRIL 2014
India also remains one of the most restrictive countries in terms of services trade. The General Agreement on Trade in Services (GATS) Commitments Restrictiveness Index measures the extent of GATS commitments for all 155 services subsectors, as classified by the GATS. Countries are scored from 0 (unbound or no commitments) to 100 (completely liberalized). As Table 16 illustrates, India’s score of 6.69 on the GATS Commitments Restrictiveness Index places it substantially below peer developing nations.
India’s low score reflects enduring barriers to trade, particularly in the financial services (notably insurance and banking), legal, and retail sectors. As Arvind Subramanian notes, “India’s barriers in services are among the highest in the world and nearly four to five times greater than those in OECD countries.”420 And to the extent India’s manufacturing industries rely on services inputs, high tariffs on services only make India’s manufacturers more uncompetitive. As a 2012 report from the Swedish National Board of Trade, Everybody is in Services—The Impact of Servicification in Manufacturing on Trade and Trade Policy, found, in many countries services account for 15 percent to 30 percent of the inputs to finished manufacturing products.421 Put simply, higher barriers to trade in services makes India’s manufacturing industries less productive and competitive. It’s clear that India has considerable opportunity to further liberalize trade in its service sectors.
Country GATS Commitments Restrictiveness Index, 2009
China 36.19
Vietnam 30.15
Brazil 26.35
Malaysia 25.40
Thailand 19.73
Indonesia 9.52
India 6.69
Average 22.00
Table 16: GATS Commitments Restrictiveness Index, 2009422
Barriers to trade in services represent a form of non-tariff barrier. NTBs are measures other than tariffs that result in a distortion to trade, including quantitative restrictions, price controls, subsidies, non-tariff charges, unwarranted customs procedures, currency manipulation, and discriminatory application of technical standards. Other non-tariff barriers that seek to restrict trade include controls on foreign direct investment; forced technology or intellectual property transfer as a condition of market access; forced local production as a condition of market access; discriminatory rules and regulations, including those pertaining to health and safety standards; weak intellectual property protection; and unfair import licensing requirements.423
The World Economic Forum reports on corporate executive opinion regarding the extent to which non-tariff barriers limit the ability of imported goods to compete in domestic markets. As previously noted, India has recently embraced an increasing number of NTBs, such as local content requirements in the ICT and renewable energy industries. As Table
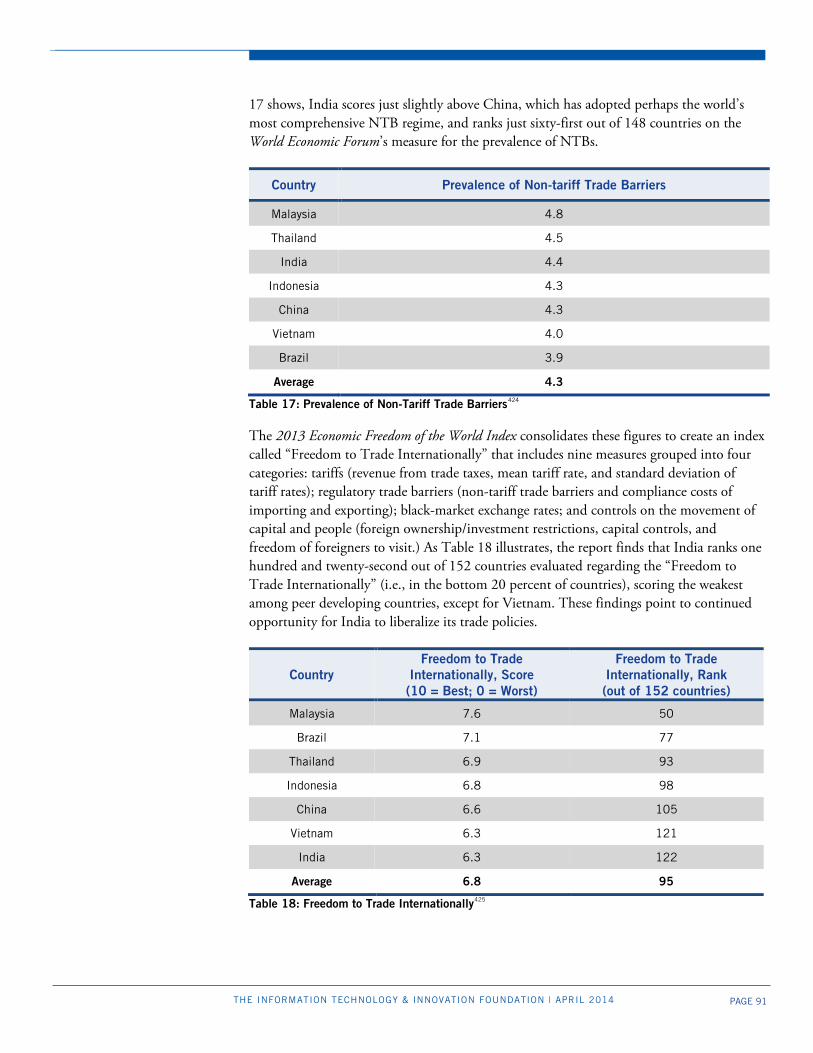
PAGE 91 THE INFORMATION TECHNOLOGY & INNOVATION FOUNDATION | APRIL 2014
17 shows, India scores just slightly above China, which has adopted perhaps the world’s most comprehensive NTB regime, and ranks just sixty-first out of 148 countries on the World Economic Forum’s measure for the prevalence of NTBs.
Country Prevalence of Non-tariff Trade Barriers
Malaysia 4.8
Thailand 4.5
India 4.4
Indonesia 4.3
China 4.3
Vietnam 4.0
Brazil 3.9
Average 4.3
Table 17: Prevalence of Non-Tariff Trade Barriers424
The 2013 Economic Freedom of the World Index consolidates these figures to create an index called “Freedom to Trade Internationally” that includes nine measures grouped into four categories: tariffs (revenue from trade taxes, mean tariff rate, and standard deviation of tariff rates); regulatory trade barriers (non-tariff trade barriers and compliance costs of importing and exporting); black-market exchange rates; and controls on the movement of capital and people (foreign ownership/investment restrictions, capital controls, and freedom of foreigners to visit.) As Table 18 illustrates, the report finds that India ranks one hundred and twenty-second out of 152 countries evaluated regarding the “Freedom to Trade Internationally” (i.e., in the bottom 20 percent of countries), scoring the weakest among peer developing countries, except for Vietnam. These findings point to continued opportunity for India to liberalize its trade policies.
Country Freedom to Trade
Internationally, Score (10 = Best; 0 = Worst)
Freedom to Trade Internationally, Rank (out of 152 countries)
Malaysia 7.6 50
Brazil 7.1 77
Thailand 6.9 93
Indonesia 6.8 98
China 6.6 105
Vietnam 6.3 121
India 6.3 122
Average 6.8 95
Table 18: Freedom to Trade Internationally425

PAGE 92 THE INFORMATION TECHNOLOGY & INNOVATION FOUNDATION | APRIL 2014
Finally, with regard to the number of days and the number of procedures it takes to export and import products into a country, India requires more documents both to export and to import than any peer country assessed, as Tables 19 and 20 show.
Country Time to Export (Days) Country Documents to Export (No.)
Malaysia 11 Indonesia 4
Brazil 13 Malaysia 5
Thailand 14 Thailand 5
India 16 Vietnam 6
Indonesia 17 Brazil 7
China 21 China 8
Vietnam 21 India 9
Average 16.1 Average 6.3
Table 19: Time and Number of Days Required to Export426
If products can be exported from Indonesia with just four documents, or imported to China with just five documents, there is no reason why India needs to require double that number of documents to accomplish the same procedure. The time needed both to export from and import to India is in line with the peer country average, though could be significantly accelerated.
Country Time to Import (Days) Country Documents to Import (No.)
Malaysia 8 China 5
Thailand 13 Thailand 5
Brazil 17 Malaysia 6
India 20 Indonesia 7
Vietnam 21 Brazil 8
Indonesia 23 Vietnam 8
China 24 India 11
Average 18 Average 7.1
Table 20: Time and Number of Days Required to Import427
Investment Environment It’s vital that a country’s investment environment affords an attractive climate for both domestic and foreign firms desiring to invest in a country. Unfortunately, as The Economist notes, even some of India’s leading companies, such as Tata Sons and Mahindra, “seem keener on expanding globally than on building factories at home.”428 In fact, for every dollar of foreign direct investment made by outsiders in Indian manufacturing in the five years to March 2012, local firms invested 65 cents in manufacturing abroad. And as The Economist notes, “what manufacturing FDI India does attract tends to be high-end—
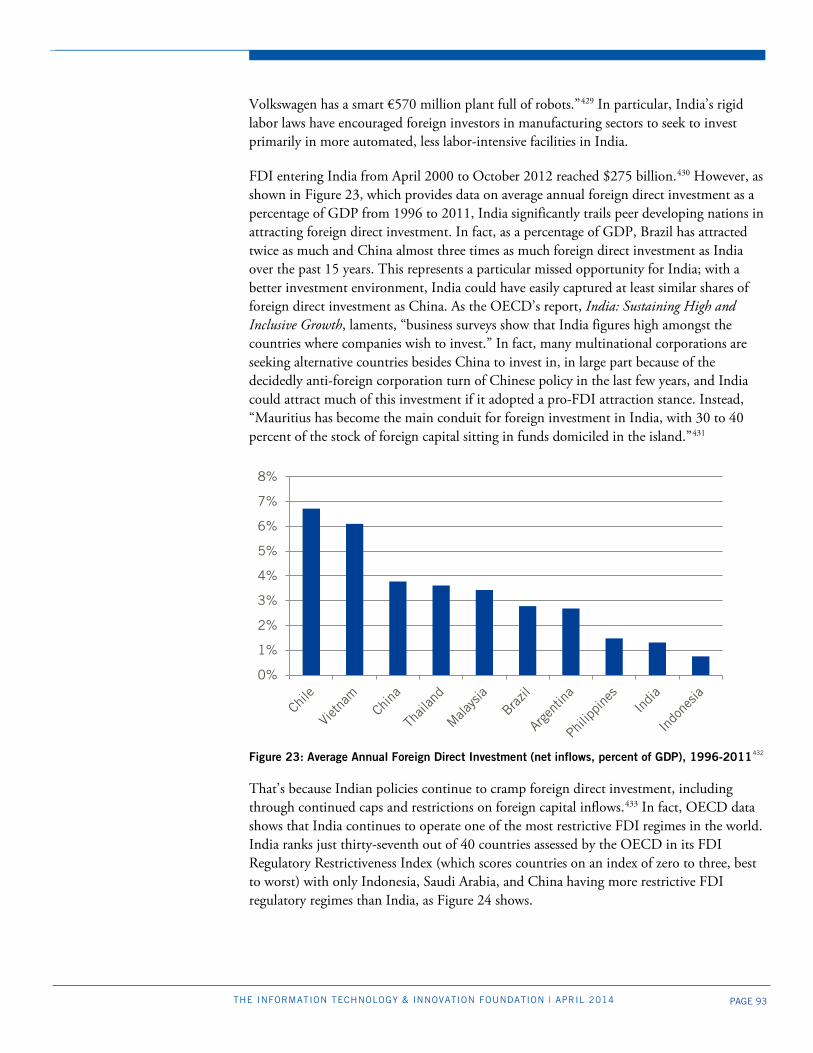
PAGE 93 THE INFORMATION TECHNOLOGY & INNOVATION FOUNDATION | APRIL 2014
Volkswagen has a smart €570 million plant full of robots.”429 In particular, India’s rigid labor laws have encouraged foreign investors in manufacturing sectors to seek to invest primarily in more automated, less labor-intensive facilities in India.
FDI entering India from April 2000 to October 2012 reached $275 billion.430 However, as shown in Figure 23, which provides data on average annual foreign direct investment as a percentage of GDP from 1996 to 2011, India significantly trails peer developing nations in attracting foreign direct investment. In fact, as a percentage of GDP, Brazil has attracted twice as much and China almost three times as much foreign direct investment as India over the past 15 years. This represents a particular missed opportunity for India; with a better investment environment, India could have easily captured at least similar shares of foreign direct investment as China. As the OECD’s report, India: Sustaining High and Inclusive Growth, laments, “business surveys show that India figures high amongst the countries where companies wish to invest.” In fact, many multinational corporations are seeking alternative countries besides China to invest in, in large part because of the decidedly anti-foreign corporation turn of Chinese policy in the last few years, and India could attract much of this investment if it adopted a pro-FDI attraction stance. Instead, “Mauritius has become the main conduit for foreign investment in India, with 30 to 40 percent of the stock of foreign capital sitting in funds domiciled in the island.”431
Figure 23: Average Annual Foreign Direct Investment (net inflows, percent of GDP), 1996-2011432
That’s because Indian policies continue to cramp foreign direct investment, including through continued caps and restrictions on foreign capital inflows.433 In fact, OECD data shows that India continues to operate one of the most restrictive FDI regimes in the world. India ranks just thirty-seventh out of 40 countries assessed by the OECD in its FDI Regulatory Restrictiveness Index (which scores countries on an index of zero to three, best to worst) with only Indonesia, Saudi Arabia, and China having more restrictive FDI regulatory regimes than India, as Figure 24 shows.
0%
1%
2%
3%
4%
5%
6%
7%
8%

PAGE 94 THE INFORMATION TECHNOLOGY & INNOVATION FOUNDATION | APRIL 2014
Figure 24: FDI Regulatory Restrictiveness Index434
Supporting Investment in Key Factor Inputs Even if they get the key enabling conditions right, to succeed, governments need to support investment in certain key inputs—particularly physical and digital infrastructure, a skilled and educated workforce, and scientific research—which constitute foundational building blocks that enable productivity and innovation to flourish across all sectors of an economy. While India has made progress across each of these areas in recent years, significant room for improvement remains.
Investing in Physical Infrastructure Extensive and efficient physical infrastructure is critical for ensuring the effective functioning of an economy, as it is an important factor in determining the location of economic activity and the kinds of activities or sectors that can develop.435 Well-developed infrastructure reduces the effect of distance between regions, integrating the national market and connecting it at low cost to global markets. In addition, the quality and extensiveness of infrastructure networks significantly impact economic growth and reduce income inequalities and poverty in a variety of ways.436 Furthermore, a well-developed transport and communications infrastructure network is a prerequisite for less-developed communities to be able to access core economic activities and services.
Addressing its underdeveloped physical infrastructure—particularly with regard to its transportation network and energy production and distribution—remains one of India’s biggest challenges. As Table 21 shows, India places below the peer country average in terms of the overall quality of its infrastructure. In fact, “infrastructure disabilities [alone] lead to a cost disadvantage of 6 to 8 percent for Indian manufacturers.”437 Moreover, India is failing to deliver the necessary infrastructure to support economic growth at a double-digit pace. Indeed, India faces an estimated $1 trillion dollar infrastructure deficit over the next five years, according to India’s Finance Minister Palaniappan Chidambaram.438
0.0
0.5
1.0
1.5
2.0
2.5
SouthAfrica
Turkey Brazil Russia Mexico India Indonesia China
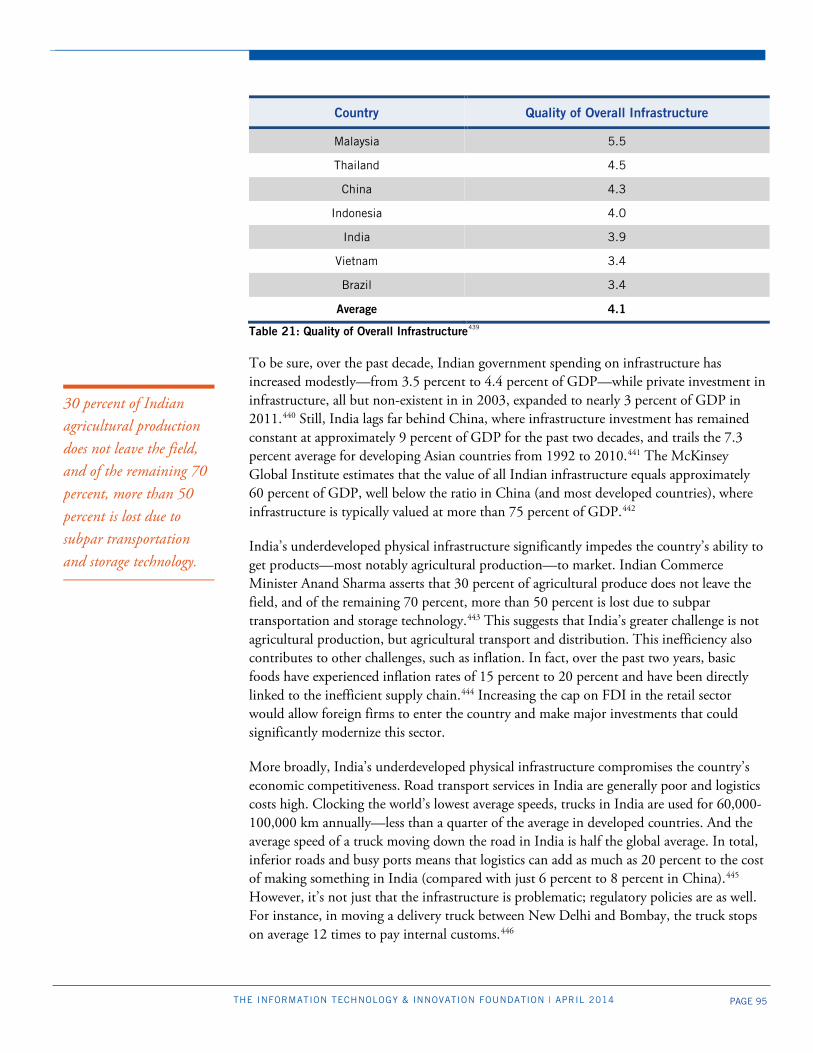
PAGE 95 THE INFORMATION TECHNOLOGY & INNOVATION FOUNDATION | APRIL 2014
Country Quality of Overall Infrastructure
Malaysia 5.5
Thailand 4.5
China 4.3
Indonesia 4.0
India 3.9
Vietnam 3.4
Brazil 3.4
Average 4.1
Table 21: Quality of Overall Infrastructure439
To be sure, over the past decade, Indian government spending on infrastructure has increased modestly—from 3.5 percent to 4.4 percent of GDP—while private investment in infrastructure, all but non-existent in in 2003, expanded to nearly 3 percent of GDP in 2011.440 Still, India lags far behind China, where infrastructure investment has remained constant at approximately 9 percent of GDP for the past two decades, and trails the 7.3 percent average for developing Asian countries from 1992 to 2010.441 The McKinsey Global Institute estimates that the value of all Indian infrastructure equals approximately 60 percent of GDP, well below the ratio in China (and most developed countries), where infrastructure is typically valued at more than 75 percent of GDP.442
India’s underdeveloped physical infrastructure significantly impedes the country’s ability to get products—most notably agricultural production—to market. Indian Commerce Minister Anand Sharma asserts that 30 percent of agricultural produce does not leave the field, and of the remaining 70 percent, more than 50 percent is lost due to subpar transportation and storage technology.443 This suggests that India’s greater challenge is not agricultural production, but agricultural transport and distribution. This inefficiency also contributes to other challenges, such as inflation. In fact, over the past two years, basic foods have experienced inflation rates of 15 percent to 20 percent and have been directly linked to the inefficient supply chain.444 Increasing the cap on FDI in the retail sector would allow foreign firms to enter the country and make major investments that could significantly modernize this sector.
More broadly, India’s underdeveloped physical infrastructure compromises the country’s economic competitiveness. Road transport services in India are generally poor and logistics costs high. Clocking the world’s lowest average speeds, trucks in India are used for 60,000-100,000 km annually—less than a quarter of the average in developed countries. And the average speed of a truck moving down the road in India is half the global average. In total, inferior roads and busy ports means that logistics can add as much as 20 percent to the cost of making something in India (compared with just 6 percent to 8 percent in China).445 However, it’s not just that the infrastructure is problematic; regulatory policies are as well. For instance, in moving a delivery truck between New Delhi and Bombay, the truck stops on average 12 times to pay internal customs.446
30 percent of Indian agricultural production does not leave the field, and of the remaining 70 percent, more than 50 percent is lost due to subpar transportation and storage technology.
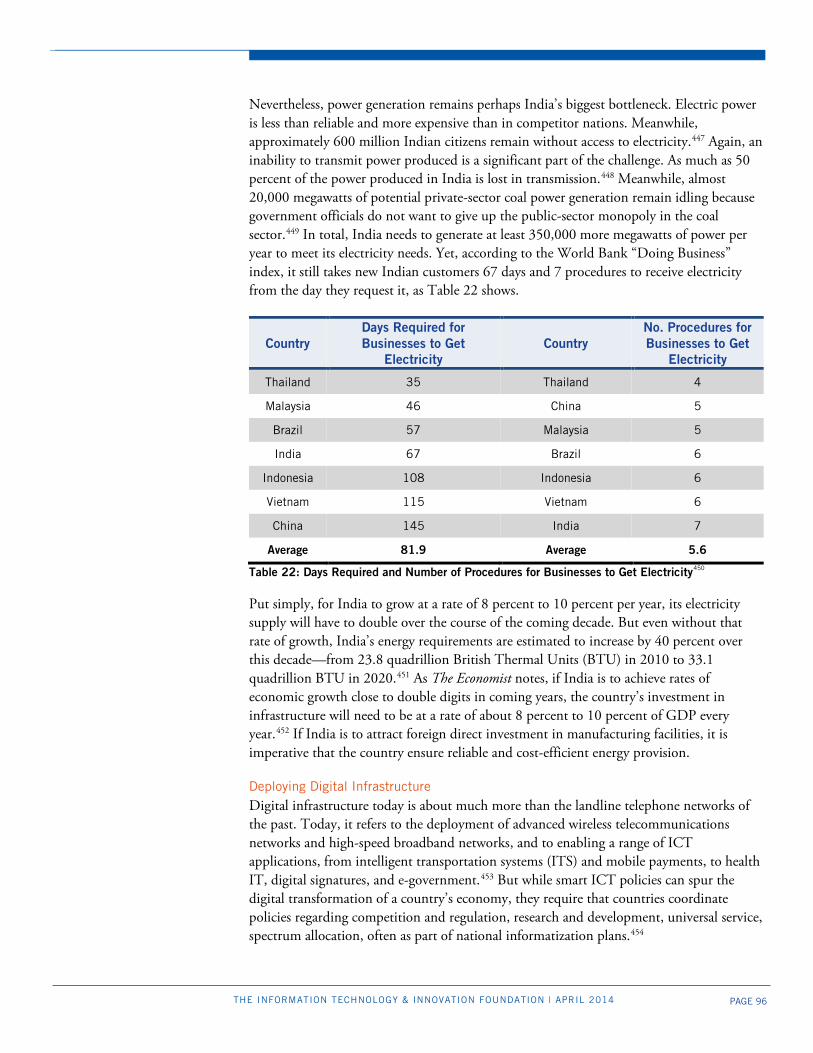
PAGE 96 THE INFORMATION TECHNOLOGY & INNOVATION FOUNDATION | APRIL 2014
Nevertheless, power generation remains perhaps India’s biggest bottleneck. Electric power is less than reliable and more expensive than in competitor nations. Meanwhile, approximately 600 million Indian citizens remain without access to electricity.447 Again, an inability to transmit power produced is a significant part of the challenge. As much as 50 percent of the power produced in India is lost in transmission.448 Meanwhile, almost 20,000 megawatts of potential private-sector coal power generation remain idling because government officials do not want to give up the public-sector monopoly in the coal sector.449 In total, India needs to generate at least 350,000 more megawatts of power per year to meet its electricity needs. Yet, according to the World Bank “Doing Business” index, it still takes new Indian customers 67 days and 7 procedures to receive electricity from the day they request it, as Table 22 shows.
Country Days Required for Businesses to Get
Electricity Country
No. Procedures for Businesses to Get
Electricity
Thailand 35 Thailand 4
Malaysia 46 China 5
Brazil 57 Malaysia 5
India 67 Brazil 6
Indonesia 108 Indonesia 6
Vietnam 115 Vietnam 6
China 145 India 7
Average 81.9 Average 5.6
Table 22: Days Required and Number of Procedures for Businesses to Get Electricity450
Put simply, for India to grow at a rate of 8 percent to 10 percent per year, its electricity supply will have to double over the course of the coming decade. But even without that rate of growth, India’s energy requirements are estimated to increase by 40 percent over this decade—from 23.8 quadrillion British Thermal Units (BTU) in 2010 to 33.1 quadrillion BTU in 2020.451 As The Economist notes, if India is to achieve rates of economic growth close to double digits in coming years, the country’s investment in infrastructure will need to be at a rate of about 8 percent to 10 percent of GDP every year.452 If India is to attract foreign direct investment in manufacturing facilities, it is imperative that the country ensure reliable and cost-efficient energy provision.
Deploying Digital Infrastructure Digital infrastructure today is about much more than the landline telephone networks of the past. Today, it refers to the deployment of advanced wireless telecommunications networks and high-speed broadband networks, and to enabling a range of ICT applications, from intelligent transportation systems (ITS) and mobile payments, to health IT, digital signatures, and e-government.453 But while smart ICT policies can spur the digital transformation of a country’s economy, they require that countries coordinate policies regarding competition and regulation, research and development, universal service, spectrum allocation, often as part of national informatization plans.454
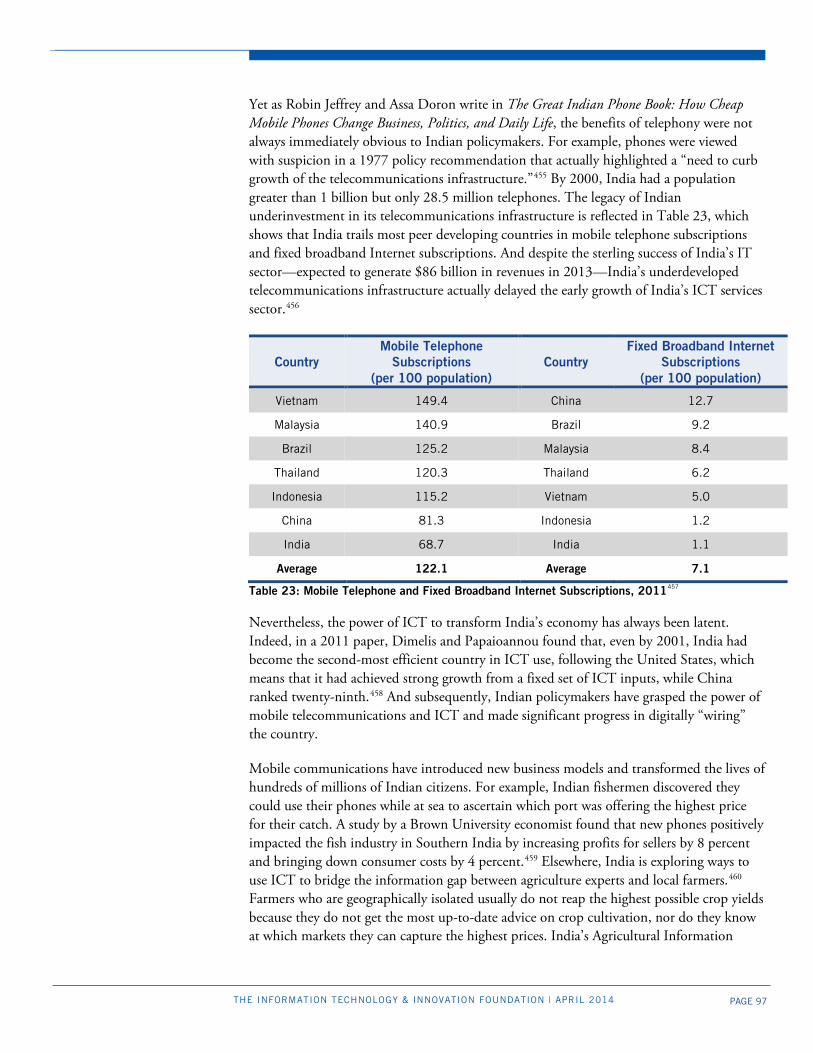
PAGE 97 THE INFORMATION TECHNOLOGY & INNOVATION FOUNDATION | APRIL 2014
Yet as Robin Jeffrey and Assa Doron write in The Great Indian Phone Book: How Cheap Mobile Phones Change Business, Politics, and Daily Life, the benefits of telephony were not always immediately obvious to Indian policymakers. For example, phones were viewed with suspicion in a 1977 policy recommendation that actually highlighted a “need to curb growth of the telecommunications infrastructure.”455 By 2000, India had a population greater than 1 billion but only 28.5 million telephones. The legacy of Indian underinvestment in its telecommunications infrastructure is reflected in Table 23, which shows that India trails most peer developing countries in mobile telephone subscriptions and fixed broadband Internet subscriptions. And despite the sterling success of India’s IT sector—expected to generate $86 billion in revenues in 2013—India’s underdeveloped telecommunications infrastructure actually delayed the early growth of India’s ICT services sector.456
Country Mobile Telephone
Subscriptions (per 100 population)
Country Fixed Broadband Internet
Subscriptions (per 100 population)
Vietnam 149.4 China 12.7
Malaysia 140.9 Brazil 9.2
Brazil 125.2 Malaysia 8.4
Thailand 120.3 Thailand 6.2
Indonesia 115.2 Vietnam 5.0
China 81.3 Indonesia 1.2
India 68.7 India 1.1
Average 122.1 Average 7.1
Table 23: Mobile Telephone and Fixed Broadband Internet Subscriptions, 2011457
Nevertheless, the power of ICT to transform India’s economy has always been latent. Indeed, in a 2011 paper, Dimelis and Papaioannou found that, even by 2001, India had become the second-most efficient country in ICT use, following the United States, which means that it had achieved strong growth from a fixed set of ICT inputs, while China ranked twenty-ninth.458 And subsequently, Indian policymakers have grasped the power of mobile telecommunications and ICT and made significant progress in digitally “wiring” the country.
Mobile communications have introduced new business models and transformed the lives of hundreds of millions of Indian citizens. For example, Indian fishermen discovered they could use their phones while at sea to ascertain which port was offering the highest price for their catch. A study by a Brown University economist found that new phones positively impacted the fish industry in Southern India by increasing profits for sellers by 8 percent and bringing down consumer costs by 4 percent.459 Elsewhere, India is exploring ways to use ICT to bridge the information gap between agriculture experts and local farmers.460 Farmers who are geographically isolated usually do not reap the highest possible crop yields because they do not get the most up-to-date advice on crop cultivation, nor do they know at which markets they can capture the highest prices. India’s Agricultural Information
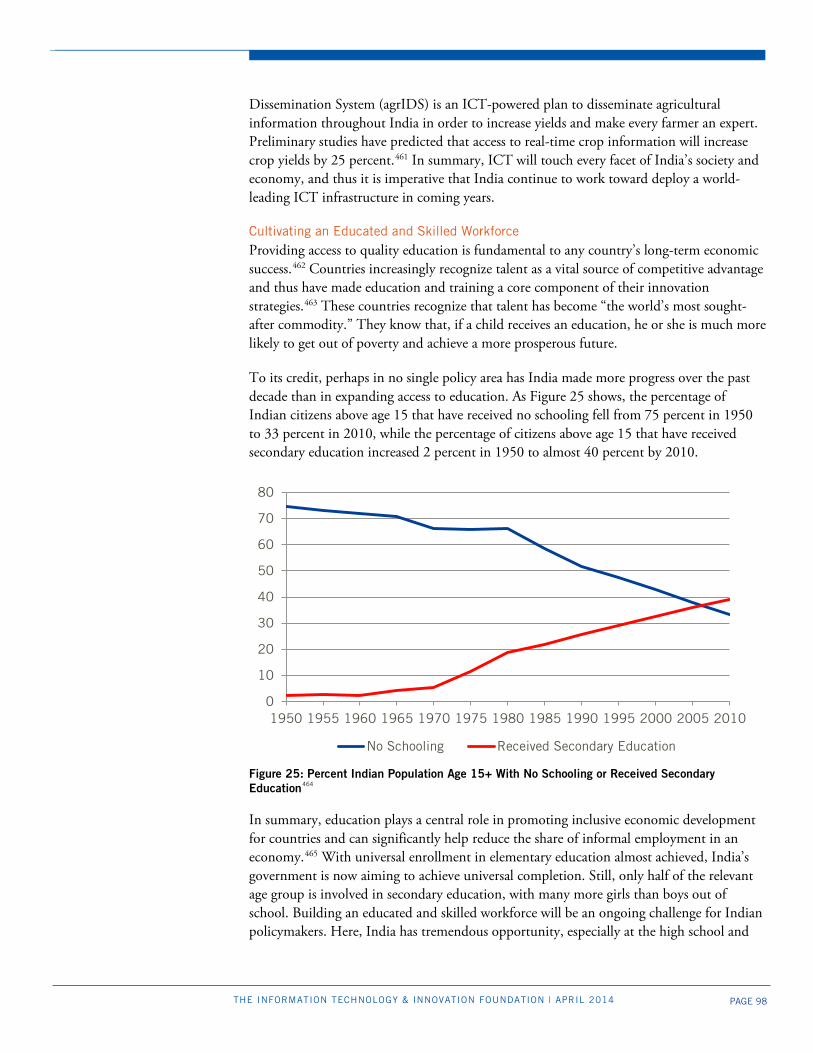
PAGE 98 THE INFORMATION TECHNOLOGY & INNOVATION FOUNDATION | APRIL 2014
Dissemination System (agrIDS) is an ICT-powered plan to disseminate agricultural information throughout India in order to increase yields and make every farmer an expert. Preliminary studies have predicted that access to real-time crop information will increase crop yields by 25 percent.461 In summary, ICT will touch every facet of India’s society and economy, and thus it is imperative that India continue to work toward deploy a world-leading ICT infrastructure in coming years.
Cultivating an Educated and Skilled Workforce Providing access to quality education is fundamental to any country’s long-term economic success.462 Countries increasingly recognize talent as a vital source of competitive advantage and thus have made education and training a core component of their innovation strategies.463 These countries recognize that talent has become “the world’s most sought-after commodity.” They know that, if a child receives an education, he or she is much more likely to get out of poverty and achieve a more prosperous future.
To its credit, perhaps in no single policy area has India made more progress over the past decade than in expanding access to education. As Figure 25 shows, the percentage of Indian citizens above age 15 that have received no schooling fell from 75 percent in 1950 to 33 percent in 2010, while the percentage of citizens above age 15 that have received secondary education increased 2 percent in 1950 to almost 40 percent by 2010.
Figure 25: Percent Indian Population Age 15+ With No Schooling or Received Secondary Education464
In summary, education plays a central role in promoting inclusive economic development for countries and can significantly help reduce the share of informal employment in an economy.465 With universal enrollment in elementary education almost achieved, India’s government is now aiming to achieve universal completion. Still, only half of the relevant age group is involved in secondary education, with many more girls than boys out of school. Building an educated and skilled workforce will be an ongoing challenge for Indian policymakers. Here, India has tremendous opportunity, especially at the high school and
0
10
20
30
40
50
60
70
80
1950 1955 1960 1965 1970 1975 1980 1985 1990 1995 2000 2005 2010
No Schooling Received Secondary Education

PAGE 99 THE INFORMATION TECHNOLOGY & INNOVATION FOUNDATION | APRIL 2014
college level, to leverage the open courseware movement by utilizing MOOCS (massive open, online courses).
Spurring Investment in Scientific Research A country’s science and R&D policies are crucial determinants of its economic vitality.466 This entails increasing public funding for R&D, ensuring that businesses have incentives to invest in R&D, and implementing policies that enable the nation’s organizations to adopt newer and better technologies than are currently in use. Underlying these policies is the fact that, without them, the level of innovation in an economy is almost always suboptimal from a societal perspective. Indeed, the significant spillover benefits from innovation mean that, even under “perfect” market conditions, the private sector will underinvest in the factors that produce innovation, including R&D. Furthermore, organizations often fail to adequately adopt existing innovations, in part because of “learning failures,” but also because spillover effects apply to companies’ investments in new capital equipment.467
India commanded an estimated 2.9 percent share of the global $1.4 trillion in R&D spending in 2012, up from 2.6 percent in 2010.468 India’s estimated gross expenditure on R&D in 2012 of $41.3 billion represented 0.8 percent of GDP, yet this amount as a share of GDP was half that invested in China, as Table 24 shows.
Country R&D as Percentage GDP (Forecast, 2012)
China 1.60
Brazil 1.25
India 0.85
Malaysia 0.70
Thailand 0.25*
Indonesia 0.20
Vietnam 0.19*
Average 0.72
* Data is actual 2010 Table 24: Forecast R&D as a percentage of GDP, 2012469
In current dollars, India’s estimated $41.3 billion R&D investment in 2012 was one-fifth China’s investment of $198.9 billion, suggesting that India will need to devote additional resources to supporting scientific research to move closer to the investment levels of peer nations. While India’s investment in R&D has been increasing—its average annual growth in R&D expenditure reached 9 percent from 1996 to 2007—this level still trailed growth rates in China (22 percent), Malaysia (18 percent), Singapore (14.5 percent), Thailand (14.5 percent), Taiwan (11 percent), and South Korea (10 percent).470
Government funding accounts for approximately two-thirds of aggregate Indian investment in R&D (though this is down from 82 percent in 2000), and the share of business R&D expenditure in India remains considerably below the OECD median.471 At the same time, as the OECD Science, Technology, Industry Outlook 2012 report notes with
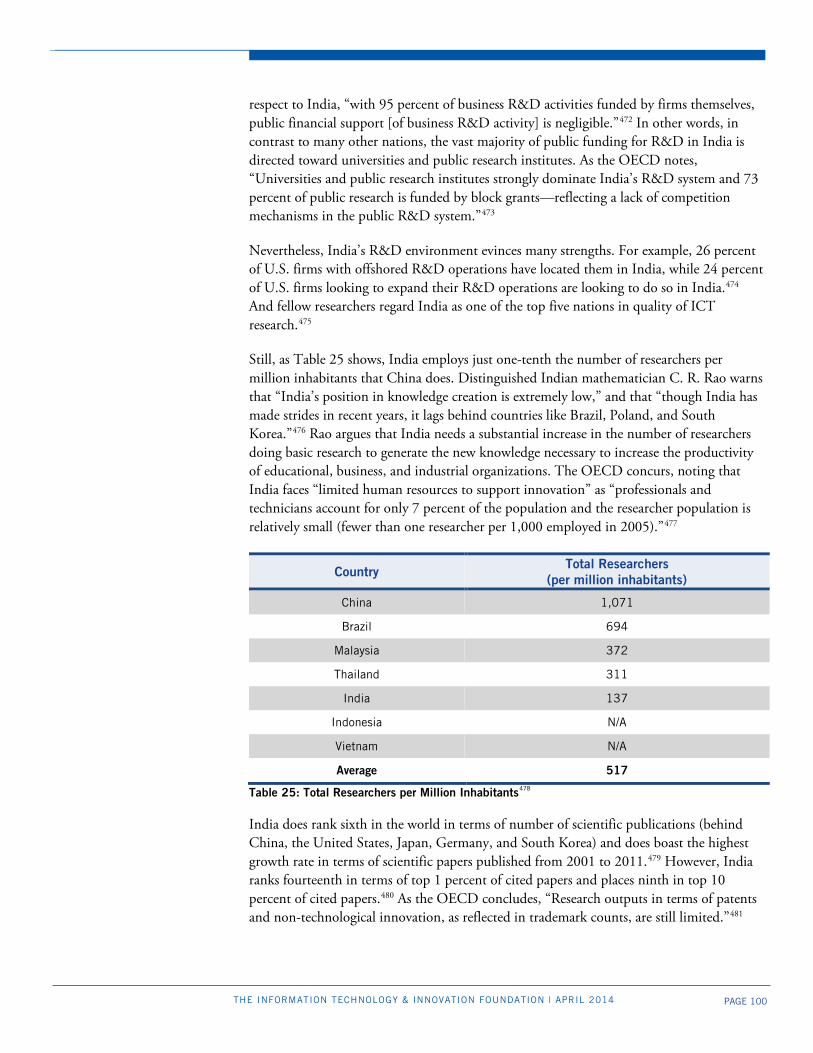
PAGE 100 THE INFORMATION TECHNOLOGY & INNOVATION FOUNDATION | APRIL 2014
respect to India, “with 95 percent of business R&D activities funded by firms themselves, public financial support [of business R&D activity] is negligible.”472 In other words, in contrast to many other nations, the vast majority of public funding for R&D in India is directed toward universities and public research institutes. As the OECD notes, “Universities and public research institutes strongly dominate India’s R&D system and 73 percent of public research is funded by block grants—reflecting a lack of competition mechanisms in the public R&D system.”473
Nevertheless, India’s R&D environment evinces many strengths. For example, 26 percent of U.S. firms with offshored R&D operations have located them in India, while 24 percent of U.S. firms looking to expand their R&D operations are looking to do so in India.474 And fellow researchers regard India as one of the top five nations in quality of ICT research.475
Still, as Table 25 shows, India employs just one-tenth the number of researchers per million inhabitants that China does. Distinguished Indian mathematician C. R. Rao warns that “India’s position in knowledge creation is extremely low,” and that “though India has made strides in recent years, it lags behind countries like Brazil, Poland, and South Korea.”476 Rao argues that India needs a substantial increase in the number of researchers doing basic research to generate the new knowledge necessary to increase the productivity of educational, business, and industrial organizations. The OECD concurs, noting that India faces “limited human resources to support innovation” as “professionals and technicians account for only 7 percent of the population and the researcher population is relatively small (fewer than one researcher per 1,000 employed in 2005).”477
Country Total Researchers (per million inhabitants)
China 1,071
Brazil 694
Malaysia 372
Thailand 311
India 137
Indonesia N/A
Vietnam N/A
Average 517
Table 25: Total Researchers per Million Inhabitants478
India does rank sixth in the world in terms of number of scientific publications (behind China, the United States, Japan, Germany, and South Korea) and does boast the highest growth rate in terms of scientific papers published from 2001 to 2011.479 However, India ranks fourteenth in terms of top 1 percent of cited papers and places ninth in top 10 percent of cited papers.480 As the OECD concludes, “Research outputs in terms of patents and non-technological innovation, as reflected in trademark counts, are still limited.”481
PAGE 101 THE INFORMATION TECHNOLOGY & INNOVATION FOUNDATION | APRIL 2014
Innovation and Productivity Policies Following the previous point, investment in scientific research does not automatically turn into new technologies and innovations that can boost a country’s productivity and economic growth. Thus, it is vital that countries implement explicit policies to spur technology adoption and development, to facilitate the movement and commercialization of technologies from universities and federal laboratories to the private sector, and to help SMEs become more productive, as the following section documents.
Developing a National Innovation and Productivity Strategy In 2009, India declared the forthcoming decade of 2010 to 2020 to be a “Decade of Innovation.”482 Accordingly, India established a National Innovation Council in 2010 to define a new roadmap for research and innovation, and established a Science and Engineering Research Board as a funding agency.483 In 2013, the Government of India published a new Science, Technology, and Innovation (STI) Policy Statement, which recognized that “India has hitherto not accorded due importance to innovation as an instrument of policy,” and resolved to develop “a New Paradigm of STI for the people.” The plan focuses on the integration of science, technology, and innovation to create social good and economic wealth, recognizing Indian society as a major stakeholder.484
The STI Policy Statement declared a goal to raise India’s national R&D intensity (R&D as a share of GDP) from the 0.85 percent level of today to 2 percent by 2020.485 Further, in 2013, India’s Ministry of Finance launched an Inclusive Innovation Fund to focus on the needs of those in the lower rungs of society. And to improve the provision of human resources for STI, India’s 11th Plan (2007-12) gave top priority to education at all levels by significantly raising education budgets.486
While government support for innovation is important, Indian entrepreneurs and businesses are to be commended for pioneering new forms of innovation as well, particularly in the form of frugal innovation. As the United Kingdom’s National Endowment for Science, Technology, and the Arts (NESTA) writes in its report Our Frugal Future: Lessons from India’s Innovation System:
Frugal innovation is distinctive in its means and its ends. Frugal innovation responds to limitations in resources, whether financial, material or institutional, and using a range of methods, turns these constraints into an advantage. Through minimizing the use of resources in development, production and delivery, or by leveraging them in new ways, frugal innovation results in dramatically lower–cost products and services. Successful frugal innovations are not only low cost, but outperform the alternative, and can be made available at large scale.487
This phenomenon has also been described as “reverse innovation,” in which companies strip down full-featured products originally designed for developed economies to their core features and functions. They then tweak them to meet the needs of citizens in emerging market economies and sell them at much lower price points (often to mass markets). For
Indian policymakers declared the 2010s as a “Decade of Innovation” for India and chartered a National Innovation Council and Science, Technology, and Innovation Policy Statement to promote innovation in India.
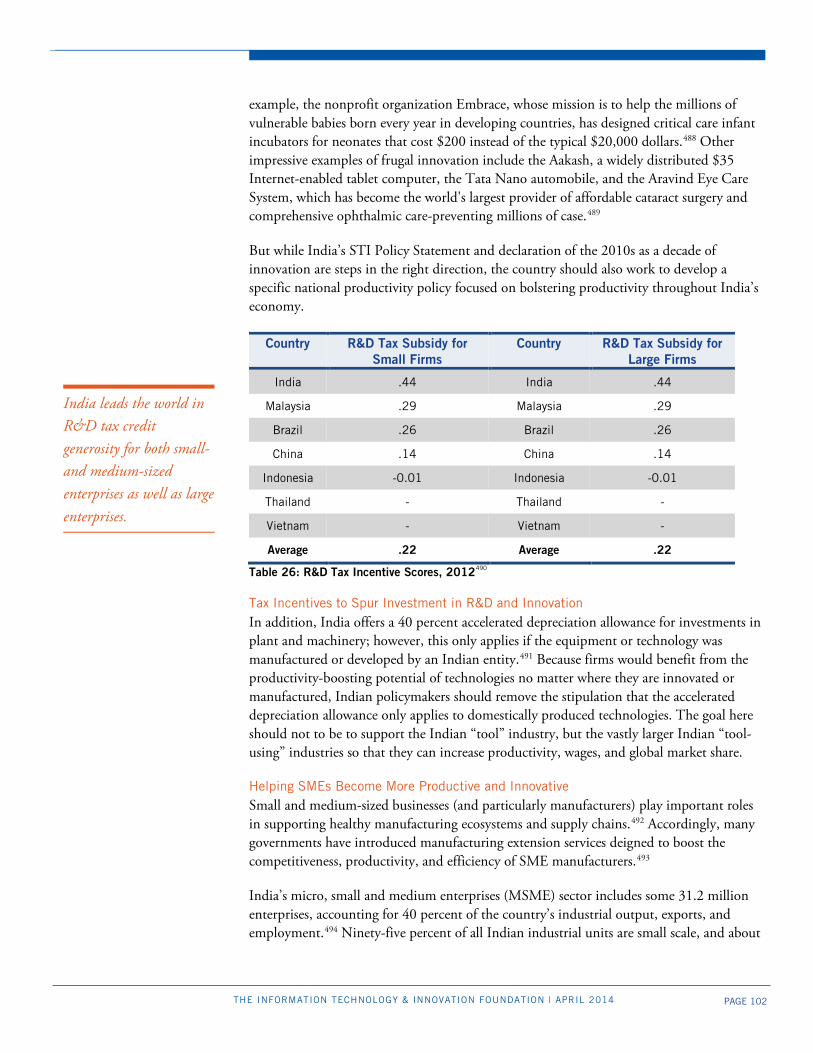
PAGE 102 THE INFORMATION TECHNOLOGY & INNOVATION FOUNDATION | APRIL 2014
example, the nonprofit organization Embrace, whose mission is to help the millions of vulnerable babies born every year in developing countries, has designed critical care infant incubators for neonates that cost $200 instead of the typical $20,000 dollars.488 Other impressive examples of frugal innovation include the Aakash, a widely distributed $35 Internet-enabled tablet computer, the Tata Nano automobile, and the Aravind Eye Care System, which has become the world's largest provider of affordable cataract surgery and comprehensive ophthalmic care-preventing millions of case.489
But while India’s STI Policy Statement and declaration of the 2010s as a decade of innovation are steps in the right direction, the country should also work to develop a specific national productivity policy focused on bolstering productivity throughout India’s economy.
Country R&D Tax Subsidy for Small Firms
Country R&D Tax Subsidy for Large Firms
India .44 India .44
Malaysia .29 Malaysia .29
Brazil .26 Brazil .26
China .14 China .14
Indonesia -0.01 Indonesia -0.01
Thailand - Thailand -
Vietnam - Vietnam -
Average .22 Average .22
Table 26: R&D Tax Incentive Scores, 2012490
Tax Incentives to Spur Investment in R&D and Innovation In addition, India offers a 40 percent accelerated depreciation allowance for investments in plant and machinery; however, this only applies if the equipment or technology was manufactured or developed by an Indian entity.491 Because firms would benefit from the productivity-boosting potential of technologies no matter where they are innovated or manufactured, Indian policymakers should remove the stipulation that the accelerated depreciation allowance only applies to domestically produced technologies. The goal here should not to be to support the Indian “tool” industry, but the vastly larger Indian “tool-using” industries so that they can increase productivity, wages, and global market share.
Helping SMEs Become More Productive and Innovative Small and medium-sized businesses (and particularly manufacturers) play important roles in supporting healthy manufacturing ecosystems and supply chains.492 Accordingly, many governments have introduced manufacturing extension services deigned to boost the competitiveness, productivity, and efficiency of SME manufacturers.493
India’s micro, small and medium enterprises (MSME) sector includes some 31.2 million enterprises, accounting for 40 percent of the country’s industrial output, exports, and employment.494 Ninety-five percent of all Indian industrial units are small scale, and about
India leads the world in R&D tax credit generosity for both small- and medium-sized enterprises as well as large enterprises.
PAGE 103 THE INFORMATION TECHNOLOGY & INNOVATION FOUNDATION | APRIL 2014
90 percent of all manufacturing establishments employ 5 to 49 workers in India.495 Fifty-five percent of India’s MSMEs operate in urban areas and 45 percent in rural areas, making their growth vital to India’s rural industrialization.
Through the National Innovation Council and as declared in the STI policy statement, India aims to strengthen the science and technology potential of MSMEs in semi-urban and rural areas, offering various awards and incentives to encourage entrepreneurship, cluster networking, and support to target groups (e.g., the National Award for Performance).496 To accelerate MSME growth, India’s MSME Ministry has introduced a number of impressive initiatives, including: Lean Manufacturing Competitiveness; Design Clinic; Marketing Assistance and Technology Upgradation; Technology and Quality Upgradation; Promotion of ICT Clusters; Tooling and Training Centers; Improving Quality in Products; Barcode Certification; IPR Awareness; and Nurturing Business Ideas, in addition to a Cluster Development Programme for Enhancing Productivity.497 Further, the “1,000 VSME Programme” (Visionary SME) will mentor 1,000 SMEs on the challenging spheres of design, R&D, sales, and supply chain to help them make the transition to a growth-oriented mindset.498 Though clearly execution and scale will be challenging, conceptually these initiatives are on par with efforts to support manufacturing SMEs in Western countries. Moreover, they represent exactly the types of constructive innovation policies India (like all nations) should be implementing to spur manufacturing productivity growth and to help spur innovation in SMEs. As Chandrajit Banerjee, the Director General of the Confederation of Indian Industries, correctly notes, “An effort to boost MSME manufacturing growth will eventually accelerate India’s emergence as a global hub for manufacturing.”499
Spurring Technology Transfer and Commercialization Innovation policies that leverage global knowledge networks and technology transfer compound the return to a country’s domestic innovation investments and raise innovation levels across the globe. In other words, obtaining the full benefits of university research relies on the effective transfer of knowledge from the university to the private sector so that it can be developed into marketable innovations.
Unfortunately, this has been a particular challenge for India, as there is “growing recognition that the relatively strong public science sector has not been generating positive spillovers leading to new enterprise formation in the private sector.”500 Part of the challenge has been that highly talented Indian scientists and engineers have moved overseas to develop technologies and start businesses. In fact, by 1986, nearly 60 percent of Indian Institute of Technology engineering graduates were migrating overseas, mostly to Silicon Valley. From 1995 to 2005, nearly one in six (15 percent) Silicon Valley start-ups were launched by Indian immigrants, the largest number for any immigrant group.501 Shanker Singham, Managing Director of the Competitiveness & Enterprise Development Project at Babson Global, points out that the trend continues to this day, citing “the fact that some 50 percent of start-ups in areas around Silicon Valley are by Indians.”502 In fact, 28 percent of engineering and scientific workers in Silicon Valley are of Indian nationality.503
Though clearly execution and scale will be challenging, conceptually India’s SME manufacturing support initiative is on par with efforts to support manufacturing SMEs in many Western countries.
PAGE 104 THE INFORMATION TECHNOLOGY & INNOVATION FOUNDATION | APRIL 2014
India has sought to introduce legislation promoting the commercialization of university research by vesting the IP rights of government-funded research with the university or research institution, just as a wide range of countries, including Brazil, China, Indonesia, Japan, Malaysia, the Philippines, Russia, Singapore, South Africa, South Korea, Taiwan, and the United States have done.504 India’s Parliament has drafted legislation, the Protection and Utilisation of Publicly Funded Intellectual Property Bill 2008, which in some cases would actually go beyond U.S. Bayh-Dole legislation by including patents, trademarks, and copyrights. As Greenhalgh notes, “It envisages that researchers will have ownership of IP rights generated by their research (except in cases of national security), thus giving the university research team incentives to exploit any commercial potential of their scientific research findings.”505 However, the legislation has proven controversial, with some arguing that the motivation of academic researchers is not matched by the incentive structure assumed in the legislation, and it has not yet passed India’s Parliament.506 The 2007 Dutz Commission report, Unleashing India’s Innovation: Towards Sustainable and Inclusive Growth, recommended improving India’s science industry interface by supporting additional technology transfer offices at universities and the creation of technology parks.
To be sure, there are a wide range of policies a country must get right on the Modern Economy Path, but doing so will be essential for India to return to the near-double digital economic growth it seeks in coming years. POLICY RECOMMENDATIONS ITIF recommends Indian policymakers implement the following policy recommendations to reinvigorate robust, sustained economic growth. The recommendations are grouped into three categories: 1) overarching domestic; 2) specific domestic; and 3) international.
Overarching Domestic Improve the process of Indian interagency communication and coordination in the
development and promulgation of administrative and agency rulemaking, including increased transparency and mechanisms for soliciting stakeholder input.
Bring increased clarity and certainty to India’s regulatory environment across
national, state, and regional levels. Appoint a National Productivity Commission (possibly modeled on Australia’s). Establish a Best Public Policies Practices Council that identifies effective economic
growth policies and practices in India’s states and promotes them at the national level across India.
Specific Domestic Fully repeal the Preferential Market Access (PMA) policy. Replace proprietary conformity assessment regulations on ICT products with a
policy that accepts reports from reputable international laboratories regarding ICT certification.

PAGE 105 THE INFORMATION TECHNOLOGY & INNOVATION FOUNDATION | APRIL 2014
Ameliorate India’s inverted duty structure for ICT inputs and components. Implement the Goods and Services Tax (GST) and bring stability to the corporate
tax code. Reform labor market laws to allow greater labor market flexibility. Implement “single window clearance” to streamline the 70-odd clearances
investors currently need into a single form. Reform business registration procedures to allow businesses to use the Internet to
register a business in one day. Allocate additional resources to IPR enforcement activities. Improve efficiency in ports by introducing a digital customs process to ensure easy
and streamlined movement of goods across Indian borders.
International Join international negotiations seeking to expand product coverage of the
Information Technology Agreement (ITA). Complete a U.S.-India Bilateral Trade and Investment (BIT) Agreement to
promote foreign direct investment in India. Overarching Domestic Improve Interagency Collaboration and Coordination in Rulemaking Processes Too often, rules are promulgated from agencies within India’s government without adequate time for review and comment from all affected stakeholders, both internal and external. Often, policies are advanced without sufficient notice and opportunity for input from affected industry stakeholders, despite the fact that transparency and public participation represent two features of the rulemaking process that can enhance rulemaking quality and legitimacy.507 In other cases, there is insufficient coordination within Indian government agencies. Therefore, the Indian government should undertake a thorough review of rulemaking procedures and make reforms, including a longer notice and comment period for industry and other affected stakeholders, and a process to ensure communication, coordination, and buy-in from multiple agencies and departments affected by rulemaking. Standardized requirements for consultations and time periods should apply across all ministries, addressing the current challenge that various ministries tend to decide for themselves whether they will issue drafts of proposed new rules, whether they will consult with stakeholders, and how that consultation will take place.
Bring Increased Clarity and Certainty to India’s Regulatory Environment
Beyond improving interagency collaboration and coordination in rulemaking processes, there is a dire need for certainty and consistency in India’s regulatory environment. As the OECD concludes in its report India: Sustaining High and Inclusive Growth, India needs to reduce “regulatory uncertainty” in order to promote sustainable growth.508 As Bloomberg
PAGE 106 THE INFORMATION TECHNOLOGY & INNOVATION FOUNDATION | APRIL 2014
BusinessWeek Akash Kapur concurs, “Policymaking has too often operated in a kind of muddled middle: a series of policy zigzags and U-turns, a set of conflicting and contradictory signals about the nation’s commitment to markets and capitalism.”509 Enterprises—whether domestic businesses or multinational corporations—cannot develop long-term plans for investment and growth in the face of constantly changing rules and regulations. Bringing increased clarity and certainty to India’s regulatory environment across national, state, and regional levels will stimulate economic growth and promote greater FDI. Also, in this regard, it’s important that state and regional governments honor agreements and commitments made by the national government to industries and enterprises.
Establish a National Productivity Council Australia’s Productivity Commission Act of 1998 established the Australian Productivity Commission as an independent research and advisory body whose mission is to promote productivity-enhancing public policies, initiate research on industry and productivity issues, hold public inquiries, and promote public understanding of matters related to industry and productivity.510 The Commission produces an Annual Report that comments on government policies affecting industry performance, as well as on trends in the productivity of the economy and living standards. The Productivity Commission has played an important role in both highlighting, documenting, and enabling the role that productivity growth plays in contributing to Australia’s economic growth and enhancing the standard of living of Australian citizens.
India should likewise establish its own National Productivity Commission, as recommended by the Tiruchi Productivity Council in 2010.511 As Raja Mutthirulandi, Honorary Secretary General of the Productivity Council, argued, achieving India’s objective of “inclusive growth” will require sustained productivity growth. As the Hindu Times paraphrased Mutthirulandi, “achieving inclusive growth in a country like India—having vast disparities in many crucial aspects such as literacy, skill development, poverty, industrial growth, geo-climatic variations and so on—can be achieved only through renewed commitments and constant adherence to productivity concepts and practices.”512 In addition to fulfilling functions similar to Australia’s Productivity Commission—such as advocating for productivity-enhancing public policies and commissioning original research regarding the impact of productivity growth on economic and employment growth—an Indian Productivity Commission could also help advance the productivity movement by supporting and coordinating the work of the country’s 37 local-level productivity councils.513
Bring Best Economic Growth Policies From the State to National Level As Ruchir Sharma notes in “Breakout or Washout,” in Reimaging India, Indian states have become laboratories for new policies and “economic growth strategies that fit the unique competitive advantages of each region.”514 Indeed, as Appendix 1 illustrates, Indian states as diverse as Andhra Pradesh, Bishar, Gujarat, Odisha, and Puducherry have outpaced their peers in economic growth in recent years. For instance, from 2012 to 2013, Bihar realized 14 percent growth, Madhya Pradesh 10 percent, and Odisha 9.1 percent, far outpacing India’s average 5.9 percent economic growth in 2013.515 Gujarat has grown faster than China over the past two decades.
PAGE 107 THE INFORMATION TECHNOLOGY & INNOVATION FOUNDATION | APRIL 2014
Indeed, a number of Indian states are aggressively promoting economic growth strategies, and more formalized effort should be made both to cross-pollinate the best economic growth strategies across India’s states, and also to identify the best practices at the state level that might be migrated to the national level. As such, the Indian government should establish a Best Public Policies Practices Council that identifies effective economic growth policies and practices in India’s states and promotes them at the national level.
Specific Domestic Fully Repeal the Preferential Market Access (PMA) Mandate ITIF applauds the Indian government for recognizing the concerns voiced by foreign governments, investors, and the international ICT community and rescinding the PMA’s application to private sector procurement activity in July 2013. However, the PMA’s continuing application to Indian government and SOE procurement will still impact approximately 30 percent of India’s ICT market and thus threatens to significantly distort the market for production of ICT and electronic goods in India. Moreover, India’s application of the PMA to government procurement activity only extends the growing global use of local content requirements, sustaining a contagion effect that has a significant impact on dampening global trade in ICT products. While the PMA may result in some incremental increase in ICT production activity in India, it threatens to harden a perspective among global corporations that they will invest in India only when forced to do so, not when they desire to do so. Accordingly, Indian policymakers should fully repeal the PMA.
Rescind Compulsory Registration Requirements and Accept International Lab Reports As noted, India’s compulsory registration requirements for ICT products introduce unnecessary testing requirements for ICT products. India’s compulsory registration requirements are duplicative and based on an Indian standard that is identical to the international standard which the global ICT industry already uses to test and certify products. As a result, companies have been forced to re-test their products (only within India) with no benefits to product safety. India’s compulsory registration requirements constitute an unnecessary non-tariff barrier that should be repealed, with India returning to accepting certifications delivered by internationally reputable labs.
Ameliorate India’s Inverted Duty Structure for ICT Inputs and Components Indian ICT manufacturers are hampered by an inverted duty structure that has maintained high tariffs on a range of ICT parts, components, inputs, and supplies which in many cases has made it difficult for India’s ICT manufacturers to affordably acquire needed components for the manufacture of ICT products. In fact, in many cases, India’s inverted duty structure means that duties on parts and components are often higher than duties on finished products (such as smart cards), and this has made India a less attractive location as an assembler and integrator of finished ICT products. India’s inverted duty structure is certainly a real impediment for India’s ICT manufacturers; however, it’s a self-imposed handicap entirely within the purview of Indian policymakers to address by decreasing tariffs on—and thus the cost of—key ICT inputs.
PAGE 108 THE INFORMATION TECHNOLOGY & INNOVATION FOUNDATION | APRIL 2014
Implement the Goods and Services Tax (GST) The Goods and Services Tax (GST) would replace a tangle of state levies with a single, national one. An Indian GST would represent a comprehensive tax on the manufacture, sale, and consumption of goods and services at the national level. It would lead to the abolition of other taxes, such as octroi, Central Sales Tax, State-level sales tax, entry tax, stamp duty, telecom license fees, turnover tax, tax on consumption or sale of electricity, taxes on transportation of goods and services, and others, thus curtailing the multiple layers of taxation that currently exist in India.516 As Rajiv Kumar, Director of the Federation of Indian Chambers of Commerce and Industry (FICCI) notes, this would be as significant as India “signing a free-trade deal with itself.” In fact, it’s estimated that the growth-enhancing impacts of switching to a GST could generate an additional $15 billion annually for India’s economy.517
Implement Significant Labor Market Reforms As the OECD notes in its “Better Policies” Series on Sustaining High and Inclusive Growth in India, “improving the functioning of India’s labour market is essential to long-term growth but also to reduction of inequalities.”518 Indeed, onerous procedural requirements such as dismissal laws under the Industrial Disputes Act—which require manufacturing firms with more than 100 employees to request permission from the Ministry of Labour and Employment before dismissing just one worker—most likely restrict job creation in large manufacturing firms, especially compared with firms in the informal sector. As the OECD report explains, “Experiences from a number of countries show that labour market regulatory reforms can boost income and employment security and encourage expansion of formal employment without reducing labour market dynamism.”519 Indeed, India should make significant reforms to a regulatory system that “provides a minority of workers with very strong protection against dismissals, while the majority of workers in India [85 percent of which are located in the informal sector] have almost no protections.”520 In exchange for moving toward a more balanced system that relaxes procedural restrictions on dismissals for protected workers, India should compensate with increased severance pay and re-employment assistance for dismissed workers. Such reforms are needed both at the federal and state levels in India.
Implement Single Window Clearance for Investors India should eliminate the patchwork of clearances and compliances required of investors and combine the nearly 70 required clearances into a single comprehensive form that investors only need to submit once, achieving a true “single window clearance” for investors.521 Combining the almost 70 clearance documents into a single form will make India a more conducive environment for investment.
Reform Business Registration Procedures to Allow Businesses to Register in One Day There is no reason why business registration, especially small business registration, should be so difficult in India (or in any nation). Portugal went from requiring 20 different forms to create a business (a process that took up to 80 days) to a digitalized process based on one website. A firm can be created in just a few days using its new “Firm Online” program. Sixty-thousand new Portuguese businesses have registered that way in less than two years. In May 2013, Chile reformed its laws to allow business incorporation in just one day, with
PAGE 109 THE INFORMATION TECHNOLOGY & INNOVATION FOUNDATION | APRIL 2014
just one step, and at no cost.522 India should reimagine its business registration procedures to allow new businesses to register in just one day over the Internet.
Allocate Additional Resources to IPR Enforcement Activities India ranked last in the U.S. Chamber of Commerce’s 2014 GIPC International IP Index, Charting the Course, which ranked 25 countries on 30 factors indicative of an IP environment that fosters growth and development. The music industry estimated a total loss of over $431 million in 2012 and upwards of 90 percent music piracy online, while a study undertaken by Motion Pictures Distributor’s Association places India among the top 10 countries in the world for Internet piracy of movies, a practice that harm both domestic and foreign film producers alike. Meanwhile, software piracy rates in India top 60 percent. Accordingly, India should allocate additional resources to combat digital content piracy and better protect intellectual property rights holders, both domestic and foreign.
Introduce a Digitalized Customs Process India should improve efficiency in its ports by introducing a digitalized customs process that ensures easy and streamlined movement of goods across India’s borders. Compared to peer countries, as Tables 19 and 20 illustrated, it takes far too many days to import and export products from India. Moreover, in many countries, the losses businesses incur—through delays at the border, lack of transparency and predictability, complicated documentation requirements, and similar outdated customs procedures—can actually exceed the cost of tariffs.523 In fact, one survey of companies in the Asia-Pacific region found customs procedures to be the single most serious trade impediment, ahead of restrictive administrative regulations and tariffs.524 A digitalized customs process would benefit both India’s domestic exporters and firms that leverage foreign imports, and contribute to the overall efficiency and productivity potential of India’s economy.
Increase Number of Industries Where 100 Percent FDI is Permitted India should undertake a comprehensive examination of how barriers to foreign direct investment can be removed at federal, state, and regional levels, looking to coordinate foreign direct investment policies across the federal and state levels so that businesses face a more consistent regulatory policy environment. In particular, India should permit 100 percent foreign direct investment in a greatly expanded number of industries, including legal services, life sciences, and retail trade.
International Join Negotiations to Expand the Information Technology Agreement As noted, India has elected not to participate in ongoing negotiations to expand the Information Technology Agreement, a multilateral trade agreement established in 1996 now acceded to by 79 countries that eliminates tariffs on trade in hundreds of ICT products. ITA expansion would bring more than 250 ICT product lines under ITA coverage, bringing an additional $800 billion in two-way trade in global ICT products under the ITA. ITA expansion would be beneficial for India, particularly because it would contribute to helping India meet its goal of increasing ICT exports thirteen-fold by 2020 by expanding international trade in ICT products.
PAGE 110 THE INFORMATION TECHNOLOGY & INNOVATION FOUNDATION | APRIL 2014
Establish a Bilateral Trade and Investment (BIT) Treaty Between the U.S. and India Bilateral investment treaties negotiated between nations help to protect private investment in foreign countries, particularly by requiring that investors and their “covered investments” (that is, investments of a company of one BIT party in the territory of the other party) be treated as favorably as the host party treats its own investors and their investments, or investors and investments from any third country, by establishing clear limits on the expropriation of investments, and by providing for the transferability of investment-related funds into and out of a host country without delay and using a market rate of exchange.525
Presently, there are over 3,000 BITs globally. The United States has concluded 47 BITs, 41 of which have entered into force.526 India has signed Bilateral Investment Protection Agreements (BIPAs, India’s term for BITs) with 82 countries, of which 72 are already in force.527 Yet progress toward completing a U.S.-India Bilateral Trade Agreement has lagged since negotiations toward completing a U.S.-India BIT began in August 2009. In part this was because India suspended negotiations on new BIPAs in January 2013 until a review of its model BIPA text was completed following a spate of show cause notices received by the Indian Government from foreign companies seeking to recover their investments under the existing agreement.
Nevertheless, as the report The United States and India: BIT and Beyond explains, both the United States and India stand to benefit considerably from completing a BIT Agreement, for it would “provide a more robust and long-term sense of certainty in the Indian investment climate for American businesses, while also making India more attractive for other investors.”528 Moreover, as Meredith Broadbent and Robbins Pancake argue in Reinvigorating the U.S. Bilateral Investment Treaty Program: A Tool to Promote Trade and Economic Development, BITs have played beneficial roles in poverty reduction in the nations with which the United States has negotiated such agreements.529 A BIT would represent a concrete and constructive step toward deepening and strengthening the U.S.-India trade relationship and pave the way toward more extensive trade agreements between the two nations. Ideally, the BIT would represent an important step toward an eventual free trade relationship between India and the United States. VISION OF THE FUTURE We know the robust economic growth rates that are possible for India’s economy. We’ve seen them before. Despite what some neoclassical economists might say, there is no reason why India cannot experience very rapid GDP growth, especially if it enables high levels of productivity growth, which should be much easier for a developing nation like India to achieve than a nation like the United States. If Indian policymakers are able to implement the needed reforms, including those listed throughout this report, what could Indian citizens expect their economy to look like within a decade?
India increases its average annual labor productivity growth rate from the 4.9 percent it achieved over the past 15 years to 7.3 percent.530
PAGE 111 THE INFORMATION TECHNOLOGY & INNOVATION FOUNDATION | APRIL 2014
Real Indian GDP per capita grows by 300 percent over the coming decade. In 2002, Indian GDP per capita in current U.S. dollars equaled $485.60; by 2012 it had grown to $1,489.20, an increase of 207 percent. India should aspire to at least triple that level of per-capita income over the coming decade, pushing per-capita incomes close to $5,000.
India creates gainful employment for the over 100 million citizens entering its
workforce as part of the demographic dividend. India reverses its $91 billion trade deficit and runs a balanced current account. In a decade, India becomes one of the top ranked developing economies in the
World Bank’s “Doing Business” index. India raises its national R&D intensity from 0.85 percent of GDP to 2 percent. India surpasses China in terms of annual FDI as a share of GDP.
CONCLUSION In the early 1990s, India’s embrace of economic and trade liberalization reforms yielded two decades of robust economic growth that gave rise to the so-called Indian Economic Miracle. But recently, momentum for continued liberalization has waned. Facing slower growth, Indian policymakers have increasingly turned toward an economic development approach prioritizing industrial, particularly manufacturing, growth over across-the-board productivity growth, which has in part contributed to India’s recent embrace of a number of trade-distorting, innovation mercantilist policies. But while policies such as the PMA or compulsory licensing of biopharmaceutical IP appear to offer short-term benefits, they lead India down the wrong track and will ultimately prove counterproductive, by actually hampering domestic innovation, decreasing entrepreneurial development, and leading to retaliatory measures by other nations. Rather, a continued embrace of the Modern Economy Path—based on competitive markets, liberalized trade, and across-the-board productivity growth—will be a much more effective path to achieving the broad and sustainable employment and economic growth India seeks.
And to be clear, it’s not only in America’s interest for India to remain committed to open, market-based trade and robust IP protections; it’s also in India’s. If India is to realize its extraordinary economic potential and lift hundreds of millions of its citizens out of poverty, the best way to do so is through innovation—by investing in R&D, protecting the rights of innovators, raising productivity across the board, and unleashing the incredible innovation potential latent in India’s economy.
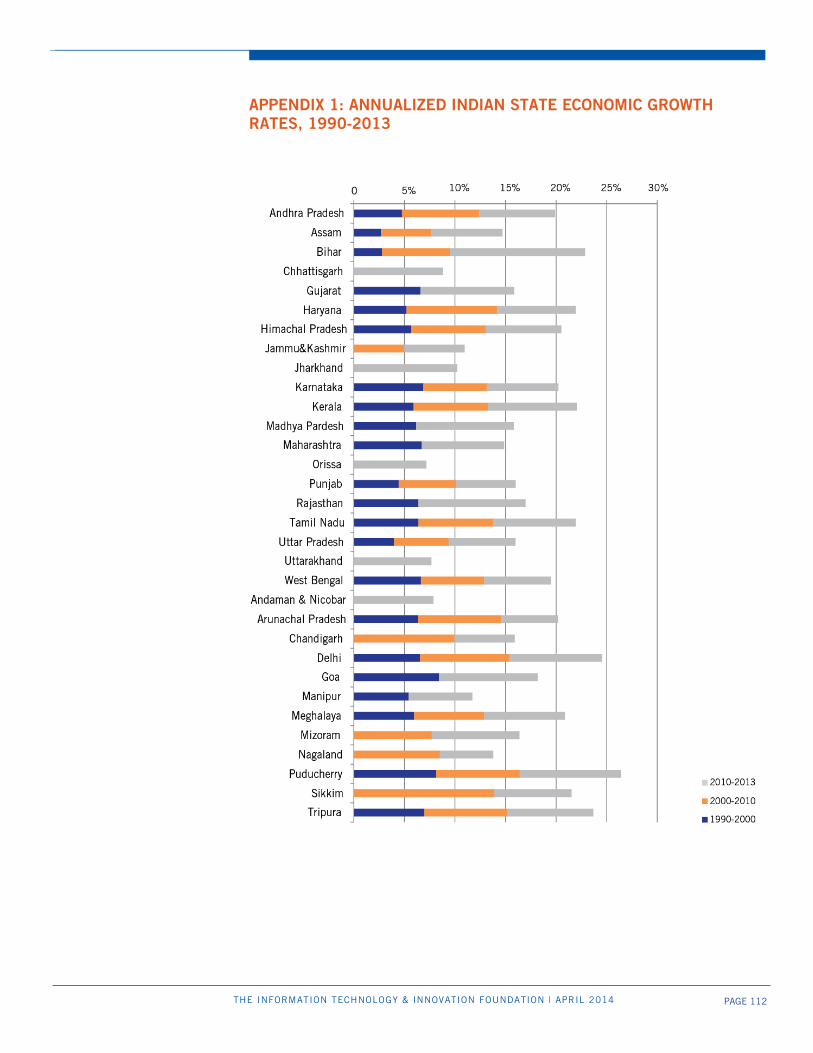
PAGE 112 THE INFORMATION TECHNOLOGY & INNOVATION FOUNDATION | APRIL 2014
APPENDIX 1: ANNUALIZED INDIAN STATE ECONOMIC GROWTH RATES, 1990-2013
PAGE 113 THE INFORMATION TECHNOLOGY & INNOVATION FOUNDATION | APRIL 2014
ENDNOTES
1. Badri Narayan Rath and S. Madheswaran, “Productivity, Wages and Employment in Indian Manufacturing Sector: An Empirical Analysis” (Institute for Social and Economic Change, 2005), http:// www.hss.iitb.ac.in/ties07/paper/ts5/psB/2.doc.
2. Such thinking has a long tradition, including going back to Albert O. Hirschman’s Strategy of Economic Development.
3. The Conference Board, “Total Economy Database, Summary Statistics 1966-2013” (The Conference Board, January 2013), 10, http://www.conference-board.org/data/economydatabase/.
4. Author’s analysis of World Bank Development Indicators Data. World Bank, World Development Indicators (GDP growth [annual %]; accessed January 24, 2013).
5. Specifically, India contributed just 9.8 percent of regional economic growth from 1970 to 1990, a rate that increased to 15.5 percent in the period from 1990 to 2010. Asian Productivity Organization (APO), APO Productivity Databook 2012 (APO, 2012), 23, http://www.apo-tokyo.org/publications/files/ind_APO_Productivity_Databook_2012.pdf.
6. “World Bank projects 5.7% growth for India in FY 2015,” Business Standard, April 9, 2014, http://www.business-standard.com/article/pti-stories/world-bank-projects-5-7-growth-for-india-in-fy-2015-114040901452_1.html.
7. World Bank, World Development Indicators (Current account balance [BoP, current US$]; accessed April 11, 2014), http://data.worldbank.org/indicator/BN.CAB.XOKA.CD?display=default.
8. “India will add 110 mn people to global workforce by 2020: Study,” The Economic Times, July 28, 2010, http://articles.economictimes.indiatimes.com/2010-07-28/news/27623896_1_labour-laws-gdp-growth-ilo.
9. Robert D. Atkinson, Stephen J. Ezell, and Michelle A. Wein, “Localization Barriers to Trade: Threat to the Global Innovation Economy” (ITIF, September 2013), http://www2.itif.org/2013-localization-barriers-to-trade.pdf.
10. Robert D. Atkinson, “Enough is Enough: Confronting Chinese Economic Mercantilism” (ITIF, February 2012), http://www2.itif.org/2012-enough-enough-chinese-mercantilism.pdf.
11. Gary Clyde Hufbauer et al., Local Content Requirements: A Global Problem (Washington, DC: The Peterson Institute for International Economics, September 2013), xxi.
12. “Around the Globe,” Washington Trade Daily 21, no. 185 and 186, September 17 and 18, 2013. 13. Albert O. Hirschman, “The Political Economy of Latin American Development: Seven Exercises in
Retrospection,” Latin American Research Review 22, no. 3 (1987). 14. Rick Rossow, “The Expansion of India’s Localization Policies” (presentation, McLarty Associates, Half
Moon Bay, California, October 22, 2013). 15. Rakesh Mohan, “Industrial Policy and Controls,” in The Indian Economy: Problems and Prospects, ed.
Bilal Jalan (New Dehli, India: Penguin, 2004), 101. 16. Mohan, “Industrial Policy and Controls,” 101. 17. Mohan, “Industrial Policy and Controls,” 103. 18. Ibid. 19. Ibid. 20. Mohan, “Industrial Policy and Controls,” 104. 21. Valerie Cerra and Sweta Saxena, “What Caused the 1991 Currency Crisis in India?,” IMF Staff Papers
49, no. 3 (2000): http://www.imf.org/external/pubs/ft/staffp/2002/03/pdf/cerra.pdf. 22. Trade, Investment, and Industrial Policies in India: Effects on the U.S. Economy: Hearing No. 332-543,
Before the United States International Trade Commission (2014) (written testimony of Arvind Subramanian, Center for Global Development), 6, http://www.usitc.gov/press_room/documents/testimony/332_543_001.pdf.
23. P.D. Kaushik and Nirvikar Singh, “Information Technology and Broad-Based Development: Preliminary Lessons from North India,” UC Santa Cruz Economics Working Paper No. 522 (July 2002), http://papers.ssrn.com/sol3/papers.cfm?abstract_id=344830.
24. Ibid. 25. Rudiger Dornbusch, F. Leslie, and C.H. Helmers, eds., The Open Economy: Tools for Policymakers in Developing Countries (New York: Oxford University Press, 1988).
PAGE 114 THE INFORMATION TECHNOLOGY & INNOVATION FOUNDATION | APRIL 2014
26. Paul Krugman and Maurice Obstfeld, International Economics: Theory & Policy, Seventh Edition (New York: Addison Wesley, 2005).
27. Ben Miller and Robert D. Atkinson, “Are Robots Taking Our Jobs, or Making Them?” (ITIF, September 2013), 2, http://www2.itif.org/2013-are-robots-taking-jobs.pdf.
28. Ibid. 29. E.F. Schumacher, Small is Beautiful: Economics As If People Mattered (London: Blond & Briggs, 1973). 30. Ibid. 31. While visiting a developing Asian country in the 1960s where a new canal was being built, Milton
Friedman was shocked to see that, instead of using modern tractors and earth movers, the workers had shovels. Friedman asked why there were so few machines. The government bureaucrat explained: “You don’t understand. This is a jobs program.” To which Friedman replied: “Oh, I thought you were trying to build a canal. If it’s jobs you want, then you should give these workers spoons, not shovels.”
32. Featherbedding involves labor union practices that require the employer to pay for the performance of what the employer considers to be unnecessary work or for work that is not in fact performed or to employ workers who are not needed.
33. Montek S. Ahluwalia, “Economic Reforms in India Since 1991: Has Gradualism Worked?,” Journal of Economic Perspectives 16, no. 3 (Summer 2002): 67-88.
34. Gurcharan Das, India Grows At Night: A Liberal Case for a Strong State (New Delhi: Penguin, 2012), 35. 35. Mohan, “Industrial Policy and Controls.” 36. Surendra Nath, “Labour Policy and Economic Reforms in India” in Reforming the Labor Market, ed.
Bibek Debroy and P.D. Kaushik (Academic Foundation, 2005), 198. 37. Isher Judge Ahluwalia, Industrial Growth in India: Stagnation since the Mid-sixties (Oxford: Oxford
University Press, 1985). 38. Mieko Nishimizu and John M. Page, Jr., “Productivity Change and Dynamic Comparative Advantage,”
Review of Economics and Statistics 68 (1986). 39. Cerra and Saxena, “What Caused the 1991 Currency Crisis in India?” 40. Petia Topalova and Amit Khandelwal, “Trade Liberalization and Firm Productivity: The Case of India,”
The Review of Economics and Statistics (January 2010), 2, http://www0.gsb.columbia.edu/faculty/akhandelwal/papers/productivity_21.pdf.
41. Ahluwalia, “Economic Reforms in India Since 1991: Has Gradualism Worked?” 42. U.S.-India Trade Relations: Opportunities and Challenges, Before the Subcommittee on Trade Committee on
Ways and Means U.S. House of Representatives (March 13, 2013) (testimony of Dean C. Garfield, President & CEO, Information Technology Industry Council), 4, http://waysandmeans.house.gov/uploadedfiles/garfield_testimony31313.pdf.
43. Topalova and Khandelwal, “Trade Liberalization and Firm Productivity: The Case of India,” 5-6. 44. Dani Rodrik and Arvind Subramanian, “From ‘Hindu Growth’ to Productivity Surge: The Mystery of
the Indian Growth Transition,” NBER Working Paper No. 10376 (March 2004), http://www.nber.org/papers/w10376.
45. Enrico Marelli and Marcello Signorelli, “China and India: Openness, Trade and Effects on Economic Growth,” The European Journal of Comparative Economics 8, no. 1 (2011): 129-154, http://eaces.liuc.it/18242979201101/182429792011080106.pdf.
46. Topalova and Khandelwal, “Trade Liberalization and Firm Productivity: The Case of India,” 5-6. 47. Ibid. 48. Pinelopi Goldberg, Amit Khandelwal, Nina Pavcnik, and Petia Topalova, “Trade Liberalization and New
Imported Inputs,” American Economic Review 99, no. 2 (2009): 494-500. 49. Topalova and Khandelwal, “Trade Liberalization and Firm Productivity: The Case of India.” 50. Charles I. Jones, “Intermediate Goods and Weak Links in the Theory of Economic Development”
(working paper, Stanford University and NBER, August 2010), http://www.stanford.edu/~chadj/links500.pdf.
51. Atkinson, Ezell, and Wein, “Localization Barriers to Trade,” 8. 52. United States Trade Representative’s Office (USTR), 2012 National Trade Estimate Report on Foreign
Trade Barriers (USTR, March 2012), 192, http://www.ustr.gov/sites/default/files/NTE%20Final%20Printed_0.pdf.
PAGE 115 THE INFORMATION TECHNOLOGY & INNOVATION FOUNDATION | APRIL 2014
53. Amol Sharma, “India to Western Tech Firms: To Sell It Here, Build It Here,” Wall Street Journal, January 8, 2013, http://online.wsj.com/article/SB10001424127887323482504578227583950036410.html.
54. R. Jai Krishna, “India Suspends ‘Buy India’ Provisions,” Wall Street Journal, July 9, 2013, http://online.wsj.com/article/SB10001424127887323823004578593322244132636.html#printMode.
55. U.S.-India Trade Relations: Opportunities and Challenges, 7 (testimony of Dean C. Garfield). 56. Telecom Industry Association and U.S. India Business Council, “Summary of TRAI’s Recommendations
on Encouraging Domestic Manufacturing of Telecommunications Equipment” (TIA and USIBC, 2012), 1.
57. Stephen Ezell, “India to Reevaluate Preferential Market Access (PMA) Rules,” The Innovation Files (blog), July 9, 2013, http://www.innovationfiles.org/india-to-reevaluate-preferential-market-access-pma-rules.
58. Data from World Information Technology and Services Alliance, Digital Planet 2010 (WITSA, 2010). 59. Trade, Investment, and Industrial Policies in India: Effects on the U.S. Economy: Hearing No. 332-543,
Before the United States International Trade Commission (2014) (written testimony of Stephen J. Ezell, Senior Analyst, ITIF), 4-5, https://s3.amazonaws.com/www2.itif.org/2014-testimony-itc-india-hearing.pdf. ITIF further estimates that U.S.-based ICT production would fall by an estimated $1.7 billion, costing the United States 10,500 jobs, annually.
60. Stephen J. Ezell, “Why India’s PMA Will Harm the Indian and Global Economies” (ITIF, March 2014), 1, http://www2.itif.org/2014-why-india-pma-harm-global-economies.pdf.
61. Ibid., 2. 62. Joshua Rosenberg, “India’s Proposed ‘Registration’ Plan is a Market Access Barrier,” ITI Policy Blog,
September 24, 2013, http://blog.itic.org/blog/indias-proposed-registration-plan-is-a-market-access-barrier.
63. Rosenberg, “India’s Proposed ‘Registration’ Plan is a Market Access Barrier.” 64. Dean C. Garfield, “India at an Economic Crossroads: Retreat or Advance,” ITI Policy Blog, September
30, 2013, http://blog.itic.org/blog/india-at-an-economic-crossroads-retreat-or-advance. 65. Consumer Electronics Association, Information Technology and Industry Council, and
Telecommunications Industry Association, “Letter to Secretary Pritzker, Ambassador Froman, and Caroline Atkinson on India’s Compulsory Registration Order,” September 23, 2013, http://blog.itic.org/dotAsset/14a42a08-15ac-48fa-9b64-8d2d2ae6c4f9.pdf.
66. Trade, Investment, and Industrial Policies in India (written testimony of Stephen Ezell), 4. 67. U.S. India Business Council, “Letter to Shri Saurabh Chandra, Secretary, Department of Industrial
Policy & Promotion Re: Proposal for Liberalization of E-Commerce,” January 23, 2013. 68. Jamie Yap, “India bars foreign vendors from national broadband initiative,” ZDNet, January 21, 2013,
http://www.zdnet.com/in/india-bars-foreign-vendors-from-national-broadband-initiative-7000010055/. 69. USTR, 2013 National Trade Estimate Report, 184. 70. United States Trade Representative’s Office, “2013 Section 1377 Review: On Compliance with
Telecommunications Trade Agreements” (USTR, 2013), 17, http://www.ustr.gov/sites/default/files/04032013%202013%20SECTION%201377%20Review.pdf.
71. Business Roundtable, “Promoting Economic Growth through Smart Global Information Technology Policy: The Growing Threat of Local Data Server Requirements” (Business Roundtable, June 2012), 6, http://businessroundtable.org/uploads/studies-reports/downloads/Global_IT_Policy_Paper_final.pdf.
72. Daniel Castro, “The False Promise of Data Nationalism” (ITIF, December 2013), http://www2.itif.org/2013-false-promise-data-nationalism.pdf.
73. Surabhi Agarwal, “Govt considering hiking duties on imported electronic items,” LiveMint/The Wall Street Journal, January 23, 2013, http://www.livemint.com/Politics/ZLkgoqwp3UplCJ009OlC1N/Govt-considering-hiking-duties-on-imported-electronic-items.html.
74. “How Much Customs Duty You Have to Pay for Importing Goods into India?,” Digital Inspiration (blog), May 30, 2013, http://www.labnol.org/india/custom-import-duties/19306/.
75. United States Trade Representative’s Office, 2012 Special 301 Report (USTR, April 2012), 35-36, http://www.ustr.gov/sites/default/files/2012%20Special%20301%20Report.pdf.
PAGE 116 THE INFORMATION TECHNOLOGY & INNOVATION FOUNDATION | APRIL 2014
76. Business Software Alliance and International Data Corporation, “Shadow Market: 2011 BSA Global Software Piracy Study” (BSA and IDC, 2011), http://portal.bsa.org/globalpiracy2011/downloads/study_pdf/2011_BSA_Piracy_Study-Standard.pdf.
77. Trade, Investment, and Industrial Policies in India: Effects on the U.S. Economy: Pre-Hearing Before the United States International Trade Commission (January 30, 2014) (statement of Michael Schlesinger, International Intellectual Property Alliance), 25, http://www.iipa.com/pdf/2014_Jan30_USITC_Testimony.pdf.
78. Trade, Investment, and Industrial Policies in India (statement of Michael Schlesinger), 32. 79. Utpal Borpujari, “India Major Online Film Piracy Hub,” Deccan Herald, January 30, 2014,
http://www.deccanherald.com/content/41541/india-major-online-film-piracy.html. 80. Schlesinger, “IIPA Pre-Hearing Brief: Trade, Investment, and Industrial Policies in India,” 32. 81. PricewaterhouseCoopers, “Economic Contribution of the Indian Film and Television Industry,” Motion
Picture Distributors Association, March 2010, http://www.mpaa-india.org/press/EconomicContribution.pdf.
82. Government of India, Ministry of Commerce & Industry, Department of Industrial Policy and Promotion (Manufacturing Policy Section), “Press Note No. 2—National Manufacturing Policy,” November 4, 2011, 1, http://commerce.nic.in/whatsnew/National_Manfacruring_Policy2011.pdf.
83. Government of India, “National Manufacturing Policy,” 7. 84. Government of India, “National Manufacturing Policy,” 25. 85. USTR, 2013 National Trade Estimate Report, 180. 86. Government of India, “National Manufacturing Policy,” 31. 87. Trade, Investment, and Industrial Policies in India: Effects on the U.S. Economy: Hearing No. 332-543
Before the United States International Trade Commission (2014) (written testimony of Linda Dempsey, National Association of Manufacturers), http://www.nam.org/~/media/3ED0952F5D9249FB858CA238A3B47E36.ashx.
88. USTR, 2013 National Trade Estimate Report, 178. 89. Trade, Investment, and Industrial Policies in India (written testimony of Linda Dempsey), 3. 90. Trade, Investment, and Industrial Policies in India (written testimony of Arvind Subramanian). 91. Trade, Investment, and Industrial Policies in India (written testimony of Linda Dempsey), 3. 92. USTR, 2013 National Trade Estimate Report, 178. 93. Ibid. 94. Ibid., 180. 95. “Defence offsets set to zoom past $4bn mark,” The Times of India, May 15, 2012,
http://articles.timesofindia.indiatimes.com/2012-05-15/india/31710669_1_defence-procurement-policy-defence-ministry-foreign-armament.
96. USTR, 2013 National Trade Estimate Report, 184. 97. Atkinson, Ezell, and Wein, “Localization Barriers to Trade,” 32. 98. Trade, Investment, and Industrial Policies in India: Effects on the U.S. Economy: Hearing No. 332-543
Before the United States International Trade Commission (2014) (written testimony of Rod Hunter, PhRMA).
99. Geeta Anand and Rumman Ahmed, “Bayer Loses Drug Ruling in India,” The Wall Street Journal, March 13, 2012, http://online.wsj.com/article/SB10001424052702304537904577277001285472654.html.
100. Trade, Investment, and Industrial Policies in India: Effects on the U.S. Economy: Investigation No. 332-543 (January 30, 2014) (written testimony of Philip Blake), 3.
101. Michelle Wein, “Let’s Clear a Few Things Up: On the Subject of Compulsory Licensing in TRIPS,” The Innovation Files (blog), June 27, 2013, http://www.innovationfiles.org/lets-clear-a-few-things-up-on-the-subject-of-compulsory-licensing-in-trips/.
102. USTR, 2013 Special 301 Report (USTR, May 2013), 39, http://www.ustr.gov/sites/default/files/05012013%202013%20Special%20301%20Report.pdf.
103. Hearing on U.S.-India Trade Relations: Opportunities and Challenges, Before the House Committee on Ways and Means Subcommittee on Trade, 113th Cong. (2013) (written statement of Stephen J. Ezell, Senior Analyst, ITIF), http://www2.itif.org/2013-us-india-trade-relations-opportunities-challenges.pdf.
PAGE 117 THE INFORMATION TECHNOLOGY & INNOVATION FOUNDATION | APRIL 2014
104. Kevin Grogan, “India to issue compulsory licenses on Roche, B-MS drugs,” PharmaTimes Online, January 15, 2013, http://www.pharmatimes.com/article/13-01-15/India_to_issue_compulsory_licences_on_Roche_B-MS_drugs.aspx.
105. Jayati Ghose and Kirtika Suneja, “Health min pushes for cancer drug license, DIPP pushes back,” Financial Express, April 3, 2014, http://www.financialexpress.com/news/health-min-pushes-for-cancer-drug-licence-dipp-pushes-back/1237897.
106. Amy Kazmin, “Roche drops patent for Herceptin in India,” Financial Times, August 16, 2013, http://www.ft.com/intl/cms/s/0/b8c9cf06-0676-11e3-9bd9-00144feab7de.html#axzz2ep3cnAHE.
107. Jai Krishna and Jeanne Whalen, “Novartis Loses Glivec Patent Battle in India,” Wall Street Journal, April 1, 2013, http://online.wsj.com/news/articles/SB10001424127887323296504578395672582230106; Jeanne Whalen and Kenan Machado, “India Deals Blow to Drug Makers,” Wall Street Journal, August 4, 2013, http://online.wsj.com/news/articles/SB10001424127887324635904578644100746473088.
108. Ibid. 109. CR Sukumar, “Patents appeal board rejects AstraZeneca's plea on cancer drug,” Economic Times,
November 29, 2012, http://articles.economictimes.indiatimes.com/2012-11-29/news/35410732_1_patent-protection-patent-application-patent-law.
110. USTR, 2013 Special 301 Report, 38. 111. Trade, Investment, and Industrial Policies in India (written testimony of Rod Hunter), 2. 112. Ibid. 113. Hearing on U.S.-India Trade Relations: Opportunities and Challenges, Before the House Committee on Ways
and Means Subcommittee on Trade, 113th Cong. (2013) (testimony of Roy F. Waldron, Chief Intellectual Property Counsel, Pfizer, Inc.), http://waysandmeans.house.gov/uploadedfiles/pfizer_testimony31313.pdf.
114. Rumman Ahmed, “India Revokes Roche Patent,” Wall Street Journal, November 3, 2012, http://online.wsj.com/news/articles/SB10001424052970204846304578096483954249650.
115. Clay Helfand, “Allergan takes latest IP hit as India revokes 2 patents,” FiercePharma, August 9, 2013, http://www.fiercepharma.com/story/allergan-takes-latest-ip-hit-india-revokes-2-patents/2013-08-09.
116. Trade, Investment, and Industrial Policies in India (written testimony of Rod Hunter), 2. 117. Zeba Siddiqui, “Natco seeks to block Gilead's hepatitis C drug patent in India – source,” Reuters, April
10, 2014, http://in.reuters.com/article/2014/04/10/natco-pharma-sovaldi-idINDEEA3909920140410. 118. “Gilead's Sovaldi for Chronic Hepatitis C Wins FDA Approval,” Genetic Engineering & Biotechnology
News, December 9, 2013, http://www.genengnews.com/gen-news-highlights/gilead-s-solvadi-for-chronic-hepatitis-c-wins-fda-approval/81249216/.
119. Jan-Christoph Kuntze and Tom Moerenhout, “Local Content Requirements and the Renewable Energy Industry: A Good Match?” (International Centre for Trade and Sustainable Development, 2013), 26, http://ictsd.org/downloads/2013/06/local-content-requirements-and-the-renewable-energy-industry-a-good-match.pdf.
120. Kuntze and Moerenhout, “Local Content Requirements and the Renewable Energy Industry,” 42. 121. USTR, “United States Challenges India’s Restrictions on U.S. Solar Exports,” news release, February
2013, http://www.ustr.gov/about-us/press-office/press-releases/2013/february/us-challenges-india-restrictions-solar.
122. Government of India, Ministry of New & Renewable Energy, “Final Guidelines for Implementation of Scheme for Setting up of 750 MW of Grid-connected Solar PV Power Projects under Batch-1 of Phase-II of JNNSM with Viability Gap Funding support from NCEF,” April 4, 2013, http://mnre.gov.in/file-manager/UserFiles/revised-VGF_750MW_Guidelines_for-grid-solar-power-projects.pdf.
123. Krista Hughes and Frank Jack Daniel, “U.S. launches new trade action against India over solar program,” Reuters, February 10, 2014, http://www.reuters.com/article/2014/02/10/us-usa-trade-india-idUSBREA161W220140210.
124. William Mauldin, “U.S. Files Complaint on India Solar Plans,” Wall Street Journal, February 10, 2014, http://online.wsj.com/news/articles/SB10001424052702304104504579375132667070044.
125. Hufbauer et al., Local Content Requirements: A Global Problem, 95. 126. USTR, 2013 National Trade Estimate Report, 180.
PAGE 118 THE INFORMATION TECHNOLOGY & INNOVATION FOUNDATION | APRIL 2014
127. USTR, 2013 National Trade Estimate Report, 185; Laurie Burkitt, “Wal-Mart to Launch E-Commerce and Open Wholesale Stores in India,” Wall Street Journal, April 8, 2014, http://online.wsj.com/news/articles/SB10001424052702304819004579488843785884708.
128. Saikat Chatterjee, “Wal-Mart May Open Hundreds of India Stores if Foreign Restrictions Lifted,” Bloomberg, July 22, 2010, http://www.bloomberg.com/news/2010-07-22/wal-mart-s-indian-partner-bharti-plans-to-open-140-retail-stores-this-year.html.
129. Bill Lewis et al., “US productivity growth, 1995–2000” (McKinsey Global Institute, October 2001), http://www.mckinsey.com/insights/americas/us_productivity_growth_1995-2000.
130. U.S. India Business Council, “Letter to Shri Saurabh Chandra Re: Proposal for Liberalization of E-Commerce.”
131. Mahesh Sharma, “Amazon and EBay Inch Into India's E-Commerce Market,” Bloomberg Businessweek, January 23, 2014, http://www.businessweek.com/printer/articles/179693-amazon-and-ebay-inch-into-indias-e-commerce-market.
132. Stephen Ezell, “China’s Economic Mercantilism,” IndustryWeek, June 24, 2013, http://www.industryweek.com/public-policy/chinas-economic-mercantilism.
133. Atkinson, “Enough is Enough,” 5. 134. Dani Rodrik, “The New Mercantilist Challenge,” Project Syndicate (blog), January 9, 2013,
http://www.project-syndicate.org/commentary/the-return-of-mercantilism-by-dani-rodrik#YgzmoOudt4fSDolB.99.
135. Atkinson, Ezell, and Wein, “Localization Barriers to Trade.” 136. Erin Fried, “India’s Response to a Rising China: Economic and Strategic Challenges and Opportunities,”
The National Bureau of Asian Research, August 30, 2011, http://www.nbr.org/research/activity.aspx?id=169#.Us27i_u5-4E.
137. Sujay Mehdudia, “‘Widening trade deficit with China not sustainable’,” The Hindu, September 13, 2013, http://www.thehindu.com/business/Economy/widening-trade-deficit-with-china-not-sustainable/article5160816.ece.
138. Data source: UN Comtrade Database, http://comtrade.un.org/, accessed December 13, 2013. 139. Stephen J. Ezell and Robert D. Atkinson, The Good, The Bad, and the Ugly (and the Self-destructive) of
Innovation Policy: A Policymaker’s Guide to Crafting Effective Innovation Policy (ITIF, 2010), 65-67, http://www.itif.org/files/2010-good-bad-ugly.pdf.
140. Fred Bergsten, “Beijing Is Key to Creating More US Jobs,” Foreign Policy, April 14, 2010, http://www.iie.com/publications/opeds/oped.cfm?ResearchID=1545.
141. Gulzar Natarjan, “The Impact of China’s currency manipulation on emerging economies,” Urbanomics (blog), May 3, 2012, http://gulzar05.blogspot.com/2012/05/impact-of-chinas-currency-manipulation.html.
142. Ibid. 143. Ibid. 144. Rossow, “The Expansion of India’s Localization Policies.” 145. “India initiated 159 anti-dumping cases against China,” The Economic Times, August 12, 2013,
http://articles.economictimes.indiatimes.com/2013-08-12/news/41332741_1_anti-dumping-probe-trade-deficit-product-and-country.
146. Ananth Krishnan, “India-China meet to discuss trade disputes,” The Hindu, April 15, 2012, http://www.thehindu.com/news/international/indiachina-meet-to-discuss-trade-disputes/article3315474.ece.
147. H. Vandenbussche and Ch. Viegelhan, “Indian Antidumping Measures against China: Evidence from Monthly Trade Data,” UCL Discussion Paper No. 2012-25 (Institut de Recherches Economiques de Sociales de l’Université catholidue de Louvain, 2012), http://sites.uclouvain.be/econ/DP/IRES/2012025.pdf.
148. Ibid. 149. “India faces Chinese dumping threat,” The Statesman, May 18, 2009,
http://www.iitrade.ac.in/kmarticle.php?topic=India%20faces%20Chinese%20dumping%20threat. 150. Ibid. 151. Matthew Stepp and Robert D. Atkinson, “Green Mercantilism: Threat to the Clean Energy Economy”
(ITIF, June 2012), 7, http://www2.itif.org/2012-green-mercantilism.pdf.

PAGE 119 THE INFORMATION TECHNOLOGY & INNOVATION FOUNDATION | APRIL 2014
152. Usha C. V. Haley and George T. Haley, Subsidies to Chinese Industry: State Capitalism, Business Strategy, and Trade Policy (Oxford: Oxford University Press, 2013).
153. Keith Bradsher, “China Benefits as U.S. Solar Industry Withers,” New York Times, September 1, 2011, http://www.nytimes.com/2011/09/02/business/global/us-solar-company-bankruptcies-a-boon-for-china.html.
154. Burghard Ilge and Kavaljit Singh, “Global Trade War Over Local Content Requirements,” Counter Currents, February 18, 2013, http://www.countercurrents.org/ksingh180213.htm. The commentators also indict the United States, “since both these countries offer cheaper loans to Indian projects to buy their equipment.” India has opened anti-dumping investigations against China, Malaysia, and Taiwan (and also the United States) regarding dumping of solar photovoltaic cells.
155. “Listed Companies in 2010 that were granted government subsidies,” Caing Statistics. 156. Haley and Haley, Subsidies to Chinese Industry. 157. Hong Sheng, The Nature, Performance and Reform of State-owned Enterprises (China: Unirule Institute of
Economics, 2012). 158. World Trade Organization, “Subsidies and Countervailing Measures,”
http://www.wto.org/english/tratop_e/scm_e/scm_e.htm. 159. Robert E. Scott, “That ‘Buy America’ Provision,” New York Times, February 11, 2009,
http://roomfordebate.blogs.nytimes.com/2009/02/11/that-buy-american-provision/. 160. “June Chinese Steel Exports Hit New High (Again),” Seeking Alpha, July 11, 2010,
http://seekingalpha.com/article/213947-june-chinese-steel-exports-hit-new-high-again. 161. Bradsher, “China Benefits as U.S. Solar Industry Withers.” 162. Supantha Mukherjee and Neha Alawadhi, “China probe may be aimed at Qualcomm's 4G royalties,”
Reuters, November 26, 2013, http://www.chicagotribune.com/business/sns-rt-us-qualcomm-china-20131125,0,577289.story.
163. Ibid. 164. “Qualcomm faces China antitrust probe,” BBC, November 25, 2013,
http://www.bbc.co.uk/news/technology-25084078. 165. Atkinson, “Enough is Enough,” 41. 166. Narendar Pani, “Innovation, to what end?,” The Hindu Business Line, November 5, 2013,
http://www.thehindubusinessline.com/opinion/columns/narendar-pani/innovation-to-what-end/article5317838.ece.
167. Robert D. Atkinson and Stephen J. Ezell, Innovation Economics: The Race for Global Advantage (New Haven, CT: Yale University Press, 2012), 327-329.
168. Miller and Atkinson, “Are Robots Taking Our Jobs, or Making Them?” 169. Bill Lewis et al., “India: The Growth Imperative” (The McKinsey Global Institute, 2001), 3,
http://www.mckinsey.com/insights/india/growth_imperative_for_india. 170. Organization for Economic Co-operation and Development (OECD), Technology, Productivity and Job
Creation: Best Policy Practices (Paris: OECD, 1998), 9, http://www.oecd.org/dataoecd/39/28/2759012.pdf.
171. Bart van Ark, Ewout Frankema, and Hedwig Duteweerd, “Productivity and Employment Growth: An Empirical Review of Long and Medium Run Evidence” (working paper, Groningen Growth and Development Centre, May 2004).
172. Bharat Trehan, “Productivity shocks and the unemployment rate,” Federal Reserve Bank of San Francisco Economic Review (2003): 13-27, http://www.frbsf.org/economic-research/publications/economic-review/2003/article2.pdf.
173. Ibid. 174. Susanto Basu, John L. Fernald, and Miles S. Kimball, “Are Technology Improvements Contractionary?,”
American Economic Review 96, no. 5 (December 2006): 1418-1448. 175. Sangho Kim, Hyunjoon Lim, and Donghyun Park, “Productivity and Employment in a Developing
Country: Some Evidence from Korea,” World Development 38, no. 4 (2010): 514-522. 176. Pu Chen, Armon Rezai, and Willi Semmler, “Productivity and Unemployment in the Short and Long
Run” (working paper, SCEPA, September 21, 2007), http://ideas.repec.org/p/epa/cepawp/2007-8.html. 177. World Bank, World Development Report 2013: Jobs (International Bank for Reconstruction and
Development / World Bank, 2013), doi:10.1596/978-0-8213-9575-2.
PAGE 120 THE INFORMATION TECHNOLOGY & INNOVATION FOUNDATION | APRIL 2014
178. Anders Isaksson, Thiam Hee Ng, and Ghislain Robyn, Productivity in Developing Countries: Trends and Policies (Vienna: UNIDO, 2005), 139.
179. Ibid. 180. Yongsung Chang, Andreas Hornstein, and Pierre-Daniel Sarte, “On the employment effects of
productivity shocks: The role of inventories, demand elasticity, and sticky prices,” Journal of Monetary Economics 56 (2009): 328-343.
181. Mark A. Dutz, Ioannis Kessides, Stephen O’Connell, and Robert D. Willig, “Competition and Innovation-Driven Inclusive Growth,” World Bank Policy Research Working Paper No. 5852 (October 2011), doi: 10.1596/1813-9450-5852.
182. Anqing Shi and Roland Michelitsch, “Assessing Private Sector Contributions to Job Creation: IFC Open Source Study” (International Finance Corporation, 2013), http://www.ifc.org/wps/wcm/connect/e54e96004aebaed68e6afe888d4159f8/IFC_DOTS_factsheet_Productivity.pdf?MOD=AJPERES.
183. Miller and Atkinson, “Are Robots Taking Our Jobs, or Making Them?,” 11. 184. Lewis et al., “India: the Growth Imperative,” 40. 185. Basu, Fernald, and Kimball, “Are Technology Improvements Contractionary?” 186. J.A. Ocampo, C. Rada, and L. Taylor, Growth and Policy in Developing Countries: A Structuralist
Approach (New York: Columbia University Press, 2009). 187. Rath and Madheswaran, “Productivity, Wages and Employment in Indian Manufacturing Sector.” 188. Ibid. 189. Ahmad Ahsan, Catalina Gutiérrez, Pierella Paci, and Marco Ranzani, “Growth, Employment, and
Poverty Trends in India: Unbundling the Links” (IZA / World Bank Conference, May 2010), http://www.iza.org/conference_files/worldb2010/paci_p2857.pdf.
190. Ibid. 191. Richard Dobbs et al., The world at work: Jobs, pay, and skills for 3.5 billion people (New York: McKinsey
Global Institute, June 2012), 83, http://www.mckinsey.com/insights/employment_and_growth/the_world_at_work.
192. Asian Productivity Organization, APO Productivity Databook 2012, 63; The Conference Board, “Total Economy Database, Summary Statistics 1966-2013,” 5 (Table 4).
193. Ashoak Upadhyay, “Get real. More growth=less jobs,” The Hindu Business Line, April 23, 2013, http://www.thehindubusinessline.com/opinion/columns/ashoak-upadhyay/get-real-more-growthless-jobs/article4647602.ece.
194. Ibid. 195. World Bank DataBank (2013 World Development Indicators; accessed December 3, 2013). 196. T.S. Papola and Partha Pratim Sahu, “Growth and Structure of Employment in India: Long-Term and
Post-Reform Performance and the Emerging Challenge” (Institute for Studies in Industrial Development, March 2012), http://isidev.nic.in/pdf/ICSSR_TSP_PPS.pdf.
197. Erik Byrnjolfsson and Andrew McAfee, Race Against the Machine (Lexington, MA: Digital Frontier Press, 2012).
198. See this BLS publication for a definitive analysis of causes of changes in U.S. labor force over time: Mitra Toossi, “A century of change: the U.S. labor force, 1950–2050,” Bureau of Labor Statistics Monthly Labor Review, May 2002, http://www.bls.gov/opub/mlr/2002/05/art2full.pdf. Productivity is not one of the causes listed.
199. Federal Reserve Bank of St. Louis, FRED Graph (PAYEMS, OPHPBS, UNRATE; accessed August 29, 2013), http://research.stlouisfed.org/fred2/graph/?g=lQo.
200. Miller and Atkinson, “Are Robots Taking Our Jobs, or Making Them?,” 15-16. 201. Federal Reserve Bank of St. Louis, FRED Graph (PAYEMS, OPHPBS, UNRATE; accessed August 29,
2013), http://research.stlouisfed.org/fred2/graph/?g=lQo. 202. World Bank DataBank (2013 World Development Indicators; accessed August 27, 2013),
http://databank.worldbank.org; Robert C. Feenstra, Robert Inklaar, and Marcel P. Timmer, “The Next Generation of the Penn World Table” (research paper, National Science Foundation / Sloan Foundation, April 2013), http://www.rug.nl/research/ggdc/data/pwt/v80/the_next_generation_of_the_penn_world_table.pdf.
PAGE 121 THE INFORMATION TECHNOLOGY & INNOVATION FOUNDATION | APRIL 2014
203. “Wasting time: India’s demographic challenge,” The Economist, May 11, 2013, http://www.economist.com/news/briefing/21577373-india-will-soon-have-fifth-worlds-working-age-population-it-urgently-needs-provide.
204. Robert D. Atkinson, The Past and Future of America’s Economy: Long Waves of Innovation That Power Cycles of Growth (Northampton, MA: Edward Elgar, 2004), 255.
205. Ibid. 206. Lewis et al., “India: the Growth Imperative,” 9-10. 207. Asian Productivity Organization, APO Productivity Databook 2012, 38. 208. Mukesh Ambani, “Making the Next Leap,” in Reimagining India: Unlocking the Potential of Asia’s Next
Superpower, ed. McKinsey & Company (New York: Simon & Schuster, 2013), 35. 209. Arvind Subramanian, “The Precocious Experiment,” in Reimagining India, 94. 210. Niru Yadav and Siddhartha Mitra, “Linkages between Informality, Competition, and Economic
Growth” (CUTS International, September 2009), 1, http://www.cuts-citee.org/pdf/Viewpoint-Linkages_between_Informality_Competition_and_Economic_Growth.pdf.
211. D. Cheong, M. Jansen, and R. Peters, “Employment, Productivity and Trade in Developing-Country Agriculture,” in Shared Harvests: Agriculture, Trade, and Employment, ed. D. Cheong, M. Jansen, and R. Peters (Geneva: ILO / UNCTAD, 2013), 31-71, http://www.ilo.org/wcmsp5/groups/public/---ed_emp/documents/genericdocument/wcms_212868.pdf.
212. Robert D. Atkinson and Daniel K. Correa, The 2007 State New Economy Index: Benchmarking Economic Transformation in the States (ITIF, February 2007), 6, http://www.itif.org/files/2007_State_New_Economy_Index.pdf.
213. When firms are in competitive markets (including competitive labor and product markets), the benefits of productivity increases flow to consumers in the form of lower real prices.
214. Ezell and Atkinson, The Good, Bad, and the Ugly of Innovation Policy. 215. Ezell, Atkinson, and Wein, “Localization Barriers to Trade,” 54-56. 216. Paul Krugman, “The Fall and Rise of Development Economics,”
http://web.mit.edu/krugman/www/dishpan.html. 217. PN Rosenstein-Rodan, “Problems of Industrialization of Eastern and South-Eastern Europe,” The
Economic Journal 53, no. 210-211 (June-September, 1943): 202-211, http://www.artsci.wustl.edu/~cedec/azariadis/teaching/e5861Fl07/papers/RosensteinRodan_ej43.pdf.
218. Albert O. Hirschman, The Strategy of Economic Development (Boulder, CO: Westview Press, 1988). 219. W.W. Rostow, “The Five Stages of Growth—A Summary," in The Stages of Economic Growth: A Non-
Communist Manifesto (Cambridge: Cambridge University Press, 1960), 4-16, https://www.mtholyoke.edu/acad/intrel/ipe/rostow.htm.
220. Sukti Dasgupta and Ajit Singh, “Manufacturing, services and premature deindustrialization in developing countries: A Kaldorian analysis,” United Nations University Research Paper No. 2006/49 (UNU-WIDER, May 2006), http://www.rrojasdatabank.info/rp2006-49.pdf.
221. David Kucera and Leanne Roncolato, “Structure Matters: Sectoral drivers of growth and the labour productivity-employment relationship,” International Labour Office Research Paper No. 3 (December 2012), 1, http://www.ilo.org/wcmsp5/groups/public/---dgreports/---inst/documents/publication/wcms_195178.pdf.
222. Enrique Casares, “Productivity, Structural Change in Employment and Economic Growth,” Estudios Económicos 22, no. 2 (July-December 2007): 335-355, http://codex.colmex.mx:8991/exlibris/aleph/a18_1/apache_media/5V3NPV92IBJ7Q8K86T6S8S62FRTYV9.pdf.
223. McKinsey Global Institute, “How to compete and grow: A sector guide to policy” (McKinsey Global Institute, March 2010), 11, http://www.mckinsey.com/mgi/reports/freepass_pdfs/competitiveness/Full_Report_Competitiveness.pdf.
224. Ibid., 26-27. 225. Ibid., 27. 226. Robert D. Atkinson, “Globalisation, New Technology and Economic Transformation,” in Social Justice
in the Global Age, ed. O. Cramme and P. Diamond (Cambridge: Polity Press, 2009). 227. Kucera and Roncolato, “Structure Matters,” 1. 228. McKinsey Global Institute, “How to compete and grow: A sector guide to policy,” 26-27.

PAGE 122 THE INFORMATION TECHNOLOGY & INNOVATION FOUNDATION | APRIL 2014
229. Ibid., 28. 230. Ibid., 28. 231. Ocampo, Rada, and Taylor, Growth and Policy in Developing Countries: A Structuralist Approach. 232. Kucera and Roncolato, “Structure Matters,” 7. 233. Ibid., 48. 234. M. Timmer and G. de Vries, “Structural Change and Growth Accelerations in Asia and Latin America: A New Sectoral Data Set,” Cliometrica 3, no. 2 (2009): 165-190. 235. Lewis et al., “India: The Growth Imperative," 2. 236. Rajat Gupta, Anu Madgavkar, and Shirih Sankhe, “Five Ideas for Inclusive Growth,” in Reimagining
India, 105-111. 237. The Conference Board, “2012 Productivity Brief—Key Findings” (The Conference Board, 2012), 7,
http://www.conference-board.org/pdf_free/economics/TED2.pdf. 238. Ibid. 239. Asian Productivity Organization, APO Productivity Databook 2012, 63. 240. Ibid. 241. Asian Productivity Organization, APO Productivity Databook 2012, 106. 242. Lewis et al., “India: the Growth Imperative.” 243. The Conference Board, “Total Economy Database, Summary Statistics 1966-2013,” 10. 244. Government of India, Ministry of Commerce & Industry, “Press Note No. 2—National Manufacturing
Policy.” 245. Gaurav Choudhury and Zia Haq, “Gambling for Growth Again,” The Hindustan Times, March 10,
2013, http://www.hindustantimes.com/business-news/gambling-for-growth-again/article1-1023972.aspx. 246. Chandrahas Choudhury, “India’s Economy Leaves Job Growth in the Dust,” Bloomberg, March 14,
2013, http://www.bloomberg.com/news/2013-03-14/india-s-economy-leaves-job-growth-in-the-dust.html.
247. India Brand Equity Foundation (IBEF), “Role of Manufacturing in Employment Generation in India,” (IBEF, 2012), http://www.ibef.org/download/Role-of-Manufacturing-in-Employment-Generation-in-India.pdf.
248. Barry Bosworth and Susan M. Collins, “Accounting for Growth: Comparing China and India,” Journal of Economic Perspectives 22, no. 1 (Winter 2008): 64.
249. Atkinson, Enough is Enough, 55. 250. Ibid. 251. World Bank, World Development Indicators (external balance of goods and services, percent of GDP;
unemployment, total, percent of total labor force; population, total, sample includes only countries with populations greater than 25 million; January 2012), http://data.worldbank.org/data-catalog/world-development-indicators.
252. Kucera and Roncolato, “Structure Matters,” 1. 253. Ibid., 2-3. 254. Ejaz Ghani and Homi Kharas, “The Service Revolution,” Economic Premise, no. 14 (May 2010),
http://siteresources.worldbank.org/INTPREMNET/Resources/EP14.pdf. 255. “Economist Debates: Manufacturing: This house believes than an economy cannot survive without a big
manufacturing base,” The Economist, June 28, 2011, http://www.economist.com/debate/days/view/714. 256. Kucera and Roncolato, “Structure Matters,” 1. 257. Sukti Dasgupta and Ajit Singh, “Will Services be the New Engine of Indian Economic Growth?,”
University of Cambridge Centre for Business Research Working Paper No. 310 (2005), 1055, http://www.cbr.cam.ac.uk/pdf/WP310.pdf.
258. Kucera and Roncolato, “Structure Matters,” 31. 259. Asian Productivity Organization, APO Productivity Databook 2012, 13. 260. D. K. Das, S. Aggarwal, and A. A. Erumban, Productivity Growth in India (presentation, Rio de Janeiro
Brazil, India-KLEMS Project Meeting, November 17-18, 2011), http://www.cepal.cl/de/agenda/4/45384/Sesi%C3%B3n_1._India.pdf.
261. Ibid. 262. Kucera and Roncolato, “Structure Matters,” 31. 263. Ibid., 24.
PAGE 123 THE INFORMATION TECHNOLOGY & INNOVATION FOUNDATION | APRIL 2014
264. Barry Eichengreen, Donghyun Park, and Kwanho Shin, “When Fast Growing Economies Slow Down: International Evidence and Implications for China,” NBER Working Paper No. 16919 (2011),
http://oetrc.lixin.edu.cn/files/100133/1109/115_20450f50521.pdf. 265. Asian Productivity Organization, APO Productivity Databook 2012, 64. 266. Rajat Dhawan, Gautam Swaroop, and Adil Zainulbhai, “Fulfilling the promise of India’s manufacturing
sector,” McKinsey Quarterly, March 2012, http://www.asia.udp.cl/Informes/2012/manufacturing_india.pdf.
267. Kucera and Roncolato, “Structure Matters,” 24. 268. Ibid., 2. To improve total factor productivity three to five times, a manufacturer would have to improve
its labor productivity by a factor of 2.0 to 3.0, and its capital productivity by a factor of 1.5 to 2.0. 269. Ibid. 270. Ibid., 4. 271. Barry Eichengreen and Poonam Gupta, “The Service Sector as India’s Road to Economic Growth?”
(ICRIER, April 2010), http://www.icrier.org/pdf/Working%20Paper%20249.pdf. 272. Ibid. 273. “India could grow via intensive services: Raghuram Rajan,” The Economic Times, April 4, 2013,
http://articles.economictimes.indiatimes.com/2013-08-04/news/41059275_1_financial-services-raghuram-rajan-manufacturing.
274. Bart Van Ark, “Measuring the New Economy, An International Comparative Perspective,” Review of Income and Wealth 48 (2002): 1-14.
275. Atkinson, The Past and Future of America’s Economy. 276. In other words, firms capture on average only about half the total societal benefits from their investments
in IPES. See Lorin M. Hitt and Prasanna Tambe, “Measuring Spillovers from Information Technology Investments” (proceedings of the 27th International Conference on Information Systems, 2006), 1793, http://opim.wharton.upenn.edu/~lhitt/files/itspillovers.pdf.
277. Robert D. Atkinson and Andrew McKay, “Digital Prosperity: Understanding the Economic Benefits of the Information Technology Revolution” (ITIF, 2007), 12, http://www.itif.org/files/digital_prosperity.pdf; Oxford Economics and AT&T, “Capturing the ICT Dividend: Using technology to drive productivity and growth in the EU” (white paper, Oxford Economics, September 2011), http://danielelepido.blog.ilsole24ore.com/files/oxford-economics.pdf.
278. Hideyuki Oku, “Japan National Strategy for ICT R&D” (presentation, ICT Global Strategy Bureau, Ministry of Internal Affairs and Communications, Tokyo), http://ec.europa.eu/information_society/activities/foi/research/eu-japan/prog/docs/day1stam/hoku.pdf.
279. Atkinson and McKay, “Digital Prosperity”; Almas Heshmati and Wanshan Yang, “Contribution of ICT to the Chinese Economic Growth” (working paper, RATIO Institute and Techno-Economics and Policy Program, College of Engineering, Seoul National University, February 2006).
280. The World Bank, Poverty Reduction and Economic Management Unit, Africa Region, Kenya Economic Update (Nairobi: The World Bank, December 2010), http://siteresources.worldbank.org/KENYAEXTN/Resources/KEU-Dec_2010_with_cover_e-version.pdf.
281. Richard Heeks, “ICT and Economic Growth: Evidence from Kenya,” ICTs for Development (blog), June 16, 2011, http://ict4dblog.wordpress.com/2011/06/26/ict-and-economic-growth-evidence-from-kenya/.
282. Chandra Gnanasambandam et al., Online and upcoming: The Internet’s impact on India (McKinsey Global Institute, December 2012), 2-3.
283. Kaushik and Singh, “Information Technology and Broad-Based Development.” 284. Theodore H. Moran, Harnessing Foreign Direct Investment for Development: Policies for Developed and
Developing Countries (Center for Global Development, 2006), 17, http://siteresources.worldbank.org/INTRANETTRADE/Resources/Internal-Training/Ted_Moran_Paper.pdf.
285. NASSCOM, “The IT-BPO Sector in India: Strategic Review 2012” (NASSCOM, 2012), 3, http://www.nasscom.in/sites/default/files/researchreports/SR_2012_Executive_Summary.pdf.
286. Ibid., 1. 287. World Bank, World Development Indicators (ICT services exports, % of total services exports; accessed
December 10, 2012), http://data.worldbank.org/indicator/BX.GSR.CCIS.ZS.
PAGE 124 THE INFORMATION TECHNOLOGY & INNOVATION FOUNDATION | APRIL 2014
288. NASSCOM, “The IT-BPO Sector in India: Strategic Review 2012,” 1. 289. World Bank, World Development Indicators (ICT services exports, % of total services exports). 290. The International Bank for Reconstruction and Development, “2009 Information and Communications
for Development: Extending Reach and Increasing Impact” (The World Bank, 2009), http://web.worldbank.org/WBSITE/EXTERNAL/TOPICS/EXTINFORMATIONANDCOMMUNICATIONANDTECHNOLOGIES/EXTIC4D/0,,contentMDK:22229759~menuPK:5870649~pagePK:64168445~piPK:64168309~theSitePK:5870636,00.html. See also, Asheeta Bhavnani et al., “The Role of Mobile Phones in Sustainable Rural Poverty Reduction” (The World Bank, ICT Policy Division, July 15, 2008), http://siteresources.worldbank.org/EXTINFORMATIONANDCOMMUNICATIONANDTECHNOLOGIES/Resources/The_Role_of_Mobile_Phones_in_Sustainable_Rural_Poverty_Reduction_June_2008.pdf.
291. The International Bank for Reconstruction and Development, “2009 Information and Communications for Development.”
292. Jason Dedrick, Vijay Gurbaxani, and Kenneth L. Kraemer, “Information Technology and Economic Performance: A Critical Review of the Empirical Evidence,” ACM Computing Surveys 35, no. 1 (March 2003): 1.
293. Stephen J. Ezell, “The Benefits of the ITA Expansion for Developing Countries” (ITIF, December 2012), http://www2.itif.org/2012-benefits-ita-developing-countries.pdf.
294. World Bank, World Bank Development Indicators (mobile cellular subscriptions per 100 people; accessed February 16, 2014), http://data.worldbank.org/indicator/IT.CEL.SETS.P2.
295. Grant Aldonas, “Trade Policy in a Digital Age” (SplitRock International, May 15, 2013). 296. Timothy J. Sturgeon and Olga Memedovic, “Mapping Global Value Chains: Intermediate Goods Trade
and Structural Change in the World Economy” (United Nations Industrial Development Organization, 2011), Figure 1.
297. OECD, “Implications of Global Value Chains for Trade, Investment, Development, and Jobs” (OECD, August 6, 2013), 8, http://www.oecd.org/sti/ind/G20-Global-Value-Chains-2013.pdf.
298. Ibid., 20. 299. Ezell, “The Benefits of the ITA Expansion for Developing Countries,” 14. 300. Hearing on Digital Trade in the U.S. and Global Economies (written testimony of Stephen J. Ezell). 301. World Bank, World Development Indicators (ICT services exports, % of total services exports; accessed
December 10, 2012), http://data.worldbank.org/indicator/BX.GSR.CCIS.ZS. Data for Argentina, Brazil, and Chile begins in 1996. Data for Malaysia and the Philippines begins in 1999, in 2000 for India, and in 2004 for Indonesia.
302. Murali Kallummal, “Process of Trade Liberalization under the Information Technology Agreement (ITA): The Indian Experience” (working paper, Centre for WTO Studies).
303. World Trade Organization (WTO), 15 Years of the Information Technology Agreement: Trade, innovation, and global production networks (Geneva: WTO, 2012), 54-55, http://www.wto.org/english/res_e/publications_e/ita15years_2012full_e.pdf.
304. Ibid. 305. Aldonas, “Trade Policy in a Digital Age.” 306. Mancur Olson, The Logic of Collective Action: Public Goods and the Theory of Groups (Boston, MA:
Harvard University Press, 1971). 307. OECD, “Transparency in Government Procurement: The Benefits of Efficient Governance” (OECD,
May 2013), 8, http://search.oecd.org/officialdocuments/displaydocumentpdf/?doclanguage=en&cote=td/tc/wp%282002%2931/final.
308. The Ministry of Corporate Affairs of the Government of India, “Draft National Competition Policy 2011” (New Delhi: Ministry of Corporate Affairs, September 2011), http://www.mca.gov.in/Ministry/pdf/Draft_National_Competition_Policy.pdf.
309. Keith E. Maskus, Tsunehiro Otsuki, and John S. Wilson, “The Costs of Complying with Foreign Product Standards for Firms in Developing Countries: An Econometric Study” (working paper, Institute of Behavioral Science, University of Colorado at Boulder, May 19, 2004), 7, http://www.colorado.edu/ibs/pubs/pec/pec2004-0004.pdf.

PAGE 125 THE INFORMATION TECHNOLOGY & INNOVATION FOUNDATION | APRIL 2014
310. Press Information Bureau, Government of India, “Statement Referred to In Reply to Parts (a) & (b) of the Lok Sabha Unstarred Question No. 2269 For Answer on 11.03.2013 Regarding FDI Inflow,” http://www.pib.nic.in/archieve/others/2013/mar/d2013031105.pdf.
311. Gardiner Harris and Bettina Wassener, “A Summer of Troubles Saps India’s Sense of Confidence,” New York Times, August 18, 2013, http://www.nytimes.com/2013/08/19/business/global/a-summer-of-troubles-saps-indias-confidence.html?pagewanted=all&_r=0; Tom Wright, Made Sentana, and Sudeep Jain, “Fear of Fed Retreat Roils India,” Wall Street Journal, August 20, 2013, http://online.wsj.com/article/SB10001424127887324747104579022561743516666.html.
312. “FDI into India declines 13.5 percent in 2012: Unctad,” Business Standard, January 25, 2013, http://www.business-standard.com/article/economy-policy/fdi-into-india-declines-13-5-in-2012-unctad-113012500095_1.html.
313. “Made outside India,” The Economist, August 10, 2013, http://www.economist.com/news/international/21583285-growth-slows-and-reforms-falter-economic-activity-shifting-out-india-made-outside.
314. United Nations, World Development Report: FDI policies for development: National and International perspectives (New York, United Nations Press: 2003): iii.
315. Hufbauer et al., Local Content Requirements: A Global Problem, 94. 316. M. J. Shiao, “Thin Film Manufacturing Prospects in the Sub-Dollar-Per-Watt Market,” Greentech Solar, June 21, 2012, www.greentechmedia.com/articles/read/thin-film-
manufacturingprospects-in-the-sub-dollar-per-watt-market. 317. Hufbauer et al., Local Content Requirements: A Global Problem, 108. 318. Oliver Johnson, “Exploring the Effectiveness of Local Content Requirements in Promoting Solar PV
Manufacturing in India” (German Development Institute, November 2013), 25, http://www.die-gdi.de/uploads/media/DP_11.2013.pdf.
319. Moran, Harnessing Foreign Direct Investment for Development, 15. 320. Ibid. 321. Ibid., 2. 322. India Ministry of Communications and Information Technology (MCIT), Department of Electronics
and Information Technology, “National Policy Electronics 2012” (MCIT, November 19, 2012). 323. USTR, 2013 Section 1377 Review, 23. 324. USTR, 2013 National Trade Estimate Report, 331. 325. Stephen J. Ezell, “How ITA Expansion Benefits the Chinese and Global Economies” (ITIF, April 2014). 326. Ezell, “The Benefits of ITA Expansion for Developing Countries,” 1. 327. Ibid., 19. 328. Republic of South Africa Department of Trade and Industry, “Draft National Policy on Intellectual
Property, 2013,” Government Gazette, no. 36816 (September 4, 2013), http://www.gov.za/documents/download.php?f=198116.
329. Trade, Investment, and Industrial Policies in India: Effects on the U.S. Economy: Hearing No. 332-543, Before the United States International Trade Commission (2014) (written testimony of Philip Blake, Bayer Corporation), 5.
330. “China and India Challenge Pharma Giants to Boost their Healthcare Systems,” Healthcare Finance News, August 12, 2012, http://www.healthcarefinancenews.com/press-release/china-and-india-challenge-pharma-giants-boost-their-healthcare-systems.
331. Simon Kennedy, “When Everybody Exports, Nobody Wins,” Bloomberg BusinessWeek, September 26, 2010, 16-17, http://www.businessweek.com/print/magazine/content/10_39/b4196016894680.htm.
332. “Industrial design: Can governments help revive innovation and trade?,” The Economist, October 1, 2009, http://www.economist.com/node/14530154.
333. Saul Lach, Gil Shiff, and Manuel Trajtenberg, “Together but Apart: ICT and Productivity Growth in Israel” (Centre for Economic Policy Research, February 2008), http://papers.ssrn.com/sol3/papers.cfm?abstract_id=1094469.
334. Ibid., 4 335. Robert D. Atkinson (president, ITIF) in discussion with officials from Tata Group in 2007 in India. 336. Lach et al., “Together but Apart: ICT and Productivity,” 30.
PAGE 126 THE INFORMATION TECHNOLOGY & INNOVATION FOUNDATION | APRIL 2014
337. Kim Jung Woo, “International Comparison of the Korean Service Industries’ Productivity,” Weekly Insight (Samsung Economic Research Institute), April 14, 2008, 10-15.
338. Ibid. 339. William H. Lewis, “The Power of Productivity: Wealth, Poverty, and the Threat to Global Stability”
(presentation to the Information Technology and Innovation Foundation, May 6, 2008), 7, http://www.itif.org/files/LewisPresentation.pdf.
340. “Strength amid paralysis,” The Economist, July 15, 2010, http://www.economist.com/node/16591237. 341. Atkinson, Enough is Enough, 24. 342. Atkinson, Enough is Enough, 67. For the United States to match China’s commitment to its SEIs on a
per-GDP basis, it would have to pass an American Recovery and Reinvestment Act every year for the next five years and dedicate close to 100 percent of the funds to industry.
343. Rajiv Kumar and Abhijit Sen Gupta, “Towards a Competitive Manufacturing Sector” (working paper, Indian Council for Research on International Economic Relations, February 2008), 3, http://www.icrier.org/pdf/Working%20Paper%20203.pdf.
344. Gurcharan Das, “How to Grow During the Day,” in Reimagining India, 26. 345. Ibid. 346. “Chile’s new law: incorporate your business in just one day, in one step, and for free,” Startup Chile
(blog), May 6, 2013, http://startupchile.org/chiles-new-law-incorporate-your-business-in-just-one-day-in-just-one-step-and-for-free/.
347. Portuguese Ministry of Justice, “On the Spot Firm” (presentation, Finland, September 2006), http://www.4qconference.org/liitetiedostot/bp_esitykset/Portugal_C.pdf.
348. World Bank and International Finance Corporation, “Doing Business 2013: Smarter Regulations for Small and Medium-Size Enterprises” (International Bank for Reconstruction and Development / The World Bank, 2013), http://www.doingbusiness.org/~/media/GIAWB/Doing%20Business/Documents/Annual-Reports/English/DB13-full-report.pdf.
349. World Bank and International Finance Corporation, “Doing Business: Enforcing Contracts,” http://www.doingbusiness.org/data/exploretopics/enforcing-contracts.
350. OECD, Economic Policy Reforms: Going for Growth (Paris: OECD, 2013), 169, http://www.oecd.org/inclusive-growth/Economic%20Policy%20Reforms%202013%20Going%20for%20Growth.pdf.
351. Confederation of Indian Industry, “Land acquisition law decoded,” Economy and Industry 2, no. 3 (October-November 2013): 18.
352. Ibid. 353. World Bank and International Finance Corporation, “Doing Business 2013.” 354. World Bank and International Finance Corporation, “Doing Business: Closing a Business,”
http://www.doingbusiness.org/data/exploretopics/closing-a-business. 355. World Bank and International Finance Corporation, “Doing Business 2013.” 356. Das, India Grows at Night, 35-36. 357. Ibid. 358. Jaithirth Rao, “No law for worker rights,” Tehelka, September 8, 2012, http://www.tehelka.com/7-no-
law-for-worker-rights/. 359. “Wasting time,” The Economist. 360. World Bank, World Development Report 2013, 37. 361. Ibid., 313. 362. OECD, Economic Policy Reforms: Going for Growth, 273. 363. Klaus Schwab et al., The Global Competitiveness Report 2010-2011 (Geneva: World Economic Forum,
2010), 446, http://www3.weforum.org/docs/WEF_GlobalCompetitivenessReport_2010-11.pdf. 364. Lewis, “The Power of Productivity.” 365. USTR, 2013 National Trade Estimate Report, 182-184. 366. Ibid., 184. 367. OECD, Economic Policy Reforms: Going for Growth, 279. 368. James Gwartney, Joshua Hall, and Robert Lawson, Economic Freedom of the World 2013 Annual Report
(Fraser Institute, 2013), 235-236, http://www.freetheworld.com/2013/EFW2013-complete.pdf.

PAGE 127 THE INFORMATION TECHNOLOGY & INNOVATION FOUNDATION | APRIL 2014
369. Ibid. (Data collected from individual economy profiles throughout the report.) 370. OECD, “OECD Better Policy Series—India: Sustaining High and Inclusive Growth” (OECD, October
2012), 8, http://www.oecd.org/india/IndiaBrochure2012.pdf. 371. Ibid. 372. OECD, Economic Policy Reforms: Going for Growth, 276. 373. Ibid. 374. World Bank, 2013 World Development Report, 101. 375. Joseph A. Schumpeter, “The Creative Response to Economic History,” Journal of Economic History 7, no.
2 (1947): 149–159; Hugo Erken, “Productivity, R&D and Entrepreneurship” (doctoral thesis, Erasmus Research Institute of Management, Rotterdam, November 27, 2011), http://repub.eur.nl/res/pub/14004/EPS2008147ORG9058921796Erken.pdf.
376. Clayton M. Christensen, The Innovator’s Dilemma: When New Technologies Cause Great Firms to Fail (Boston: Harvard Business School Press, 1997).
377. Douglas Holtz-Eakin and Chihwa Kao, “Entrepreneurship and Economic Growth,” Center for Policy Research Working Paper No. 50 (February 2003), https://www.maxwell.syr.edu/uploadedFiles/cpr/publications/working_papers/wp50.pdf.
378. David B. Audretsch et al., “Impeded Industrial Restructuring: The Growth Penalty,” Kyklos 55, no. 1 (2002): 81–97.
379. World Bank and International Finance Corporation, “Doing Business: Entrepreneurship” (accessed December 1, 2013), http://www.doingbusiness.org/data/exploretopics/entrepreneurship.
380. World Bank, 2013 World Development Report, 12. 381. Ibid. 382. Hiren Sarkar and M. Aynul Hasan, “Impact of Corruption on the Efficiency of Investment: Evidence
from A Cross-Country Analysis,” Asia-Pacific Development Journal 8, no. 2 (2001): 112. 383. Transparency International, “Corruption Perceptions Index 2012” (Transparency International, 2012),
http://www.ey.com/Publication/vwLUAssets/2012_TI_CPI/$FILE/2012%20TI%20CPI.pdf. 384. Das, India Grows at Night. 385. Arvind Subramanian, “The Precocious Experiment,” in Reimagining India, 93. 386. Das, “How to Grow During the Day,” in Reimaging India. 387. Klaus Schwab et al., The Global Competitiveness Report 2013-2014 (Geneva: World Economic Forum,
2010), 414, http://www3.weforum.org/docs/WEF_GlobalCompetitivenessReport_2013-14.pdf. 388. Ricardo Cavazos Cepeda, Douglas C. Lippoldt, and Jonathan Senft, “Policy Complements to the
Strengthening of IPRS in Developing Countries,” OECD Trade Policy Working Paper No. 104 (2010), 2, http://dx.doi.org/10.1787/5km7fmwz85d4-en.
389. Ibid. 390. Robert D. Atkinson, Stephen J. Ezell, and Luke A. Stewart, The Global Innovation Policy Index (ITIF,
March 2012), 72, http://www2.itif.org/2012-global-innovation-policy-index.pdf. 391. Xiolan Fu, “Foreign Direct Investment, Absorptive Capacity and Regional Innovation Capabilities:
Evidence from China,” Oxford Development Studies 36, no. 1 (2008): 89–110. 392. Cavazos Cepeda, Lippoldt, and Senft, “Policy Complements,” 27–28. 393. Ibid. 394. Walter G. Park, “International Patent Protection: 1960–2005,” Research Policy 37, no. 4 (2008): 791–
766. 395. Under this index, an economy may effectively protect patents but also issue many bad patents and still
receive a high score. 396. Atkinson, Ezell, and Stewart, The Global Innovation Policy Index, 75. 397. Ibid. 398. Park, “International Patent Protection: 1960-2005.” 399. Francesco DeLorenzo, “The 2013 International Property Rights Index” (Americans for Tax Reform
Foundation / Property Rights Alliance, 2013), 70, http://www.propertyrightsalliance.org/userfiles/2013%20International%20Property%20Rights%20Index-PRA.pdf.
400. Ibid., 20.
PAGE 128 THE INFORMATION TECHNOLOGY & INNOVATION FOUNDATION | APRIL 2014
401. U.S. Chamber of Commerce, Global Intellectual Property Center, “GIPC International IP Index: Charting the Course” (U.S. Chamber of Commerce, January 2014), 28, http://www.theglobalipcenter.com/wp-content/themes/gipc/map-index/assets/pdf/Index_Map_Index_2ndEdition.pdf.
402. Ibid., 73. 403. Ibid., 74. 404. World Values Survey, “New Wave of Surveys,” 2008,
http://www.worldvaluessurvey.org/wvs/articles/folder_published/article_base_116. 405. Ibid., 28 406. Robert D. Atkinson, “Effective Corporate Tax Reform in the Global Innovation Economy” (ITIF, July
2009), 6, http://www.itif.org/files/090723_CorpTax.pdf. 407. Atkinson and Ezell, Innovation Economics, 171. 408. Michael Devereux, Ben Lockwood, and Michela Redoano, “Horizontal and Vertical Indirect Tax
Competition: Theory and Some Evidence from the USA,” Journal of Public Economics 91 (2007): 451-479.
409. World Bank and International Finance Corporation, “Doing Business: Paying Taxes” (accessed December 11, 2013), http://www.doingbusiness.org/data/exploretopics/paying-taxes.
410. “Aim Higher,” The Economist, September 29, 2012, http://www.economist.com/node/21563414. 411. World Bank and International Finance Corporation, “Doing Business 2013.” 412. Mark Scott, “India and Nokia in Tax Dispute Before Microsoft Deal,” New York Times, September 30,
2013, http://www.nytimes.com/2013/10/01/technology/india-seizes-nokia-assets-in-tax-dispute.html?_r=0&pagewanted=print.
413. Ibid. 414. Robert Hoffman, “Why Returning India to a Path of Innovation and Smart Growth is Good for
India...and America,” ITI Policy Blog, June 27, 2013, http://blog.itic.org/blog/why-returning-india-to-a-path-of-innovation-and-smart-growth-is-good-for-indiaand-america.
415. David T. Coe, Elhanan Helpman, and Alexander W. Hoffmeister, “North-South R&D Spillovers,” The Economic Journal 107 (1997): 134, http://www.jstor.org/pss/2235275.
416. Osamu Onodera, “Trade and Innovation Project: A Synthesis Paper,” OECD Trade Policy Working Paper No. 72 (August 7, 2008), 12, http://www.oecd.org/dataoecd/60/22/41105505.pdf.
417. Ibid., 4. 418. Trade-weighted average tariff rate; 2012 or most recent available year. Schwab et al., The Global
Competitiveness Report 2013-2014, 479; The World Bank, (Tariff rate, applied, simple mean, manufactured products (%); accessed November 1, 2013), http://data.worldbank.org/indicator/TM.TAX.MANF.SM.AR.ZS.
419. OECD, Economic Policy Reforms: Going for Growth, 280. 420. Trade, Investment, and Industrial Policies in India (written testimony of Arvind Subramanian), 9. 421. Sweden National Board of Trade, “Everybody is in Services—The Impact of Servicification in
Manufacturing on Trade and Trade” (Sweden National Board of Trade, 2012), 10, http://www.kommers.se/Documents/dokumentarkiv/publikationer/2012/skriftserien/report-everybody-is-in-services.pdf.
422. World Bank, World Trade Indicators (GATS commitments restrictiveness index, 2009; accessed October 8, 2013), http://info.worldbank.org/etools/wti/3a.asp?pillarID=1&indList=66&indList=118&indList=152&indList=161&indList=190®ionID=0&periodID=16#.
423. Atkinson, Ezell, and Stewart, The Global Innovation Policy Index, 28. 424. Schwab et al., The Global Competitiveness Report 2013-2014, 478. 425. Gwartney, Lawson, and Hall, Economic Freedom of the World: 2013 Annual Report, 10-14. 426. World Bank and International Finance Corporation, “Doing Business 2013.” 427. Ibid. 428. “Wasting time,” The Economist. 429. Ibid.
PAGE 129 THE INFORMATION TECHNOLOGY & INNOVATION FOUNDATION | APRIL 2014
430. Greenhalgh, “Science, Technology, Innovation and IP in India: New Direction and Prospects,” University of Oxford Department of Economics Discussion Paper No. 660 (October 2013), 25, http://www.economics.ox.ac.uk/materials/papers/12771/paper660.pdf.
431. “Wasting time,” The Economist. 432. World Bank, World Development Indicators (Foreign direct investment, net inflows, % of GDP;
accessed January 23, 2013), http://data.worldbank.org/indicator/BX.KLT.DINV.WD.GD.ZS. 433. “Aim Higher,” The Economist. 434. OECD, “India: Sustaining High and Inclusive Growth,” 13. 435. Klaus Schwab et al., The Global Competitiveness Report 2012-2013 (Geneva: World Economic Forum,
2013), http://www3.weforum.org/docs/WEF_GlobalCompetitivenessReport_2012-13.pdf. 436. D. A. Aschauer, “Is Public Expenditure Productive?,” Journal of Monetary Economics 23, no. 2 (1989):
117–200; D. Canning, M. Fay, and R. Perotti, “Infrastructure and Economic Growth,” in International Differences in Growth Rates, ed. M. Baldarassi, L. Paganetto, and E. Phelps (New York: MacMillan, 1994); W. Easterly, The Elusive Quest for Growth (Cambridge, MA: MIT Press, 2002); E. M. Gramlich, “Infrastructure Investment: A Review Essay,” Journal of Economic Literature 32, no. 3 (1994): 1176–96.
437. Kedia, Kathuria, and Singh, “Deconstructing India’s PMA Policy.” 438. “India has $1 trillion infrastructure deficit: Chidambaram tells World Bank,” The Times Of India, April
21, 2013, http://timesofindia.indiatimes.com/business/international-business/India-has-1-trillion-infrastructure-deficit-Chidambaram-tells-World-Bank/articleshow/19660814.cms.
439. Schwab et al., The Global Competitiveness Report 2013-2014, 432. 440. Rajiv Lall, “India’s infrastruggles,” in Reimagining India, 233. 441. Ibid. 442. Ibid. 443. Dev Lewis, “India Economic Growth: Once a Shining Economy, India is in Danger of Running Out of
Gas,” PolcyMic, October 8, 2012, http://www.policymic.com/articles/16089/india-economic-growth-once-a-shining-economy-india-is-in-danger-of-running-out-of-gas.
444. Ibid. 445. “Wasting time,” The Economist. 446. Rossow, “The Expansion of India’s Localization Policies.” 447. Government of India, Planning Commission, “Power and Energy,”
http://planningcommission.nic.in/sectors/index.php?sectors=energy. 448. Rossow, “The Expansion of India’s Localization Policies.” 449. Rajiv Kumar, “The future of US-India relations” (remarks at conference, American Enterprise Institute,
Washington, DC, November 20, 2013). 450. World Bank and International Finance Corporation, “Doing Business 2013.” 451. Battelle and R&D Magazine, “2012 Global R&D Funding Forecast” (Battelle, 2012), 31,
http://battelle.org/docs/default-document-library/2012_global_forecast.pdf. 452. “India’s economy: The half-finished revolution,” The Economist, July 21, 2011,
http://www.economist.com/node/18986387. 453. Information Technology and Innovation Foundation, “Explaining International IT Application
Leadership” (ITIF, September 15, 2011), http://www.itif.org/publications/explaining-international-it-application-leadership.
454. Atkinson, Ezell, and Stewart, The Global Innovation Policy Index, 85. 455. “Where fingers do the walking,” The Economist, March 23, 2013,
http://www.economist.com/news/books-and-arts/21573956-measuring-telecom-effect-where-fingers-do-walking.
456. McKinsey Global Institute, “How to compete and grow: A sector guide to policy,” 37. 457. Schwab et al., The Global Competitiveness Report 2010-2011, 514, 516. Number of mobile telephone and
fixed broadband Internet subscriptions per 100 people. International Telecommunication Union, ITU World Telecommunication/ICT Indicators Database 2013 (June 2013 edition).
458. Sophia P. Dimelis and Sotiris K. Papaioannou, “Technical Efficiency and the Role of ICT: A Comparison of Developed and Developing Countries,” Emerging Markets Finance & Trade 47, no. 3, (July–August 2011): 40-53, http://ideas.repec.org/a/mes/emfitr/v47y2011i0p40-53.html.
PAGE 130 THE INFORMATION TECHNOLOGY & INNOVATION FOUNDATION | APRIL 2014
459. Tim Arango, “Market Data, Far from the Market,” New York Times, June 19, 2008, http://www.nytimes.com/2008/06/29/business/29essay.html
460. Robert D. Atkinson and Daniel D. Castro, The Digital Quality of Life: Understanding the Personal & Social Benefits of the Information Technology Revolution (ITIF, October 2008), http://www.itif.org/files/DQOL.pdf.
461. P. Kristhna Reddy and R. Ankaiah, “A Framework of Information Technology Based Agriculture Information Dissemination System to Improve Crop Productivity,” Current Science 88, no. 12 (June 25, 2005): 1905, http://www.iiit.net/~pkreddy/pkreddypapers/CurrentScience2005.pdf.
462. OECD, “India: Sustaining High and Inclusive Growth,” 5. 463. Atkinson and Ezell, Innovation Economics, 179. 464. Robert Barro and Jong-Wha Lee, “Barro Lee Educational Attainment Dataset: Education Attainment for
Population Aged 15 and Over” (accessed December 10, 2013), http://www.barrolee.com/. 465. OECD, “India: Sustaining High and Inclusive Growth,” 26. 466. Atkinson, Ezell, and Stewart, The Global Innovation Policy Index, 38. 467. See literature review in Atkinson, “Effective Corporate Tax Reform in the Global Innovation Economy.”
For example, companies underinvest because they are unable to capture all of the benefits from their investments.
468. Battelle and R&D Magazine, “2012 Global R&D Funding Forecast,” 3. 469. Battelle and R&D Magazine, “2012 Global R&D Funding Forecast,” 5; Tokyo Subeyo, “The
performance of research in Indonesia,” The Jakarta Post, July 2, 2010, http://www.thejakartapost.com/news/2010/07/02/the-performance-research-indonesia.html.
470. Battelle and R&D Magazine, “2012 Global R&D Funding Forecast,” 30. 471. OECD, “India: Sustaining High and Inclusive Growth,” 14. 472. OECD, OECD Science, Technology, Industry Outlook 2012 (Paris, France: OECD, 2012), 314. 473. OECD, “India: Sustaining High and Inclusive Growth,” 14. 474. Battelle and R&D Magazine, “2012 Global R&D Funding Forecast,” 27, 29. 475. Ibid., 35. 476. “India's position in knowledge creation is extremely low,” The Hindu, January 10, 2012,
http://www.thehindu.com/todays-paper/tp-national/tp-karnataka/indias-position-in-knowledge-creation-is-extremely-low/article2789216.ece.
477. OECD, “India: Sustaining High and Inclusive Growth,” 14. 478. United Nations Education, Scientific, and Cultural Organization (UNESCO), UNESCO Science Report
2010 (UNESCO Publishing, 2010), Table 4: Total researchers and per million inhabitants, 2002 and 2007, 496, http://www.uis.unesco.org/Library/Documents/UNNESCOSR10-eng.pdf. 1999-2008 Researchers per labor force: UNESCO, Institute of Statistics (2010)
479. Greenhalgh, “Science, Technology, Innovation and IP in India,” 23. 480. Ibid. 481. OECD, “India: Sustaining High and Inclusive Growth,” 14. 482. Greenhalgh, “Science, Technology, Innovation and IP in India,” 21. 483. OECD, OECD Science, Technology, Industry Outlook 2012, 314. 484. Greenhalgh, “Science, Technology, Innovation and IP in India,” 21. 485. OECD, “India: Sustaining High and Inclusive Growth,” 14. 486. Ibid. 487. Kirsten Bound and Ian Thornton, Our Frugal Future: Lessons from India’s Innovation System (London:
NESTA, July 2012), 6, http://www.nesta.org.uk/sites/default/files/our_frugal_future.pdf. 488. Atkinson and Ezell, Innovation Economics, 114. 489. NESTA, “Frugal Innovations,” http://www.nesta.org.uk/news/frugal-innovations. 490. Stewart, Warda, and Atkinson, “We’re #27!: The United States Lags Far Behind in R&D Tax Incentive
Generosity,” 11-12. 491. Greenhalgh, “Science, Technology, Innovation and IP in India,” 24. 492. Scott M. Andes, Stephen Ezell, and Jesús Leal, “Benchmarking Manufacturing Extension Services in
Latin America and Caribbean Countries” (ITIF, October 2013).
PAGE 131 THE INFORMATION TECHNOLOGY & INNOVATION FOUNDATION | APRIL 2014
493. Stephen J. Ezell and Robert D. Atkinson, “International Benchmarking of Countries’ Policies and Programs Supporting SME Manufacturers” (ITIF, September 2011), http://www.itif.org/files/2011-sme-manufacturing-tech-programss-new.pdf.
494. Chandrajit Banerjee, “Growth Imperative,” Economy & Industry 2, no. 3 (October-November 2013), 6. 495. Pankaj M. Madhani, “SME's as Growth Driver of Indian Economy: Strategic HR Issues and
Perspectives” (working paper, ICFAI Business School, 2012), http://papers.ssrn.com/sol3/papers.cfm?abstract_id=2004826.
496. OECD, “India: Sustaining High and Inclusive Growth,” 15. 497. Madhani, “SME's as Growth Driver of Indian Economy.” 498. Ibid. 499. Ibid. 500. Greenhalgh, “Science, Technology, Innovation and IP in India,” 22. 501. Sean Randolph, “Silicon Valley Expats Spur Innovation in India,” Yale Global Online, September 2,
2010, http://yaleglobal.yale.edu/print/6509. 502. William New, “India Weathering Doubts About Its Approach To Intellectual Property,” Intellectual
Property Watch, November 18, 2013, http://www.ip-watch.org/2013/11/18/india-weathering-doubts-about-its-approach-to-intellectual-property/.
503. Greenhalgh, “Science, Technology, Innovation and IP in India,” 24. 504. Atkinson, Ezell, and Stewart, The Global Innovation Policy Index, 46. 505. Greenhalgh, “Science, Technology, Innovation and IP in India,” 22. 506. Ibid. 507. Cary Coglianese, Heather Kilmartin, and Evan Mendelson, “Transparency and Public Participation in the Rulemaking Process: A Nonpartisan Presidential Transition Task Force Report” (University of
Pennsylvania Law School, July 2008), http://www.hks.harvard.edu/hepg/Papers/transparencyReport.pdf. 508. OECD, “India: Sustaining High and Inclusive Growth.” 509. Akask Kapur, “India’s Election Choice: Growth Economy or Welfare State,” Bloomberg BusinessWeek,
April 3, 2014, http://www.businessweek.com/articles/2014-04-03/indias-election-choice-growth-economy-or-welfare-state.
510. Australian Government Productivity Commission, “A Quick Guide to the Productivity Commission,” http://www.pc.gov.au/about-us/quick-guide.
511. “Need to set up National Productivity Commission,” The Hindu, February 21, 2010, http://www.thehindu.com/todays-paper/tp-national/tp-tamilnadu/need-to-set-up-national-productivity-commission/article715035.ece.
512. Ibid. 513. Ibid. 514. Ruchir Sharma, “Breakout or Washout,” in Reimagining India, 15. 515. Sumnima Udas, “India elections 2014: A look forward,” CNN, January 5, 2014,
http://www.cnn.com/2014/01/05/world/asia/india-elections-look-forward/. 516. “GST India,” accessed March 4, 2014, http://gstindia.com/. 517. Ibid. 518. OECD, “India: Sustaining High and Inclusive Growth,” 28. 519. Ibid., 29. 520. Ibid. 521. Rajiv Kumar, “Time for Stern Action,” The Mail Today, January 8, 2014,
http://sagarmediainc.wordpress.com/2014/01/02/time-for-stern-action/. 522. “Chile’s new law: incorporate your business in just one day, in one step, and for free,” Startup Chile. 523 OECD, Overcoming Border Bottlenecks: The costs and benefits of trade facilitation (Paris: OECD, 2009),
90. 524 Ibid., 82. 525. United States Trade Representative’s Office, “Bilateral Investment Treaties,” http://www.ustr.gov/trade-
agreements/bilateral-investment-treaties. 526. Shayerah Ilias Akhtar and Martin A. Weiss, “U.S. International Investment Agreements: Issues for Congress” (Congressional Research Service, April 29, 2013), 2,
http://www.fas.org/sgp/crs/row/R43052.pdf.

PAGE 132 THE INFORMATION TECHNOLOGY & INNOVATION FOUNDATION | APRIL 2014
527. “India, US completed 3 rounds of negotiations for BIT,” The Economic Times, August 5, 2013, http://articles.economictimes.indiatimes.com/2013-08-05/news/41093194_1_india-us-trade-policy-forum-three-rounds-treaty.
528. Matthew Stokes and Niraj Patel, “BIT and Beyond: Advancing the US-India Economic Relationship” (Center for Strategic and International Studies, November 2012), 18-19, http://csis.org/files/publication/121126_Stokes_BITandBeyond_web.pdf.
529. Meredith Broadbent and Robbins Pancake, “Reinvigorating the U.S. Bilateral Investment Treaty Program: A Tool to Promote Trade and Economic Development” (Center for Strategic and International Studies, June 2012), http://csis.org/files/publication/120629_Broadbent_ReinvigoratingBIT_Web.pdf.
530. The Conference Board, “Total Economy Database, Summary Statistics 1966-2013” (The Conference Board, January 2013), 10, http://www.conference-board.org/data/economydatabase/.
PAGE 133
THE INFORMATION TECHNOLOGY & INNOVATION FOUNDATION | APRIL 2014
ACKNOWLEDGEMENTS The authors wish to thank the following individuals for offering input and assistance in developing this report: Kathryn Angstadt, Bethany Imondi, Alex Key, and Elizabeth Stewart. Any errors or omissions are the authors’ alone. ABOUT THE AUTHORS Stephen Ezell is a senior analyst at the Information Technology and Innovation Foundation, with a focus on science, technology, and innovation policy issues. Mr. Ezell holds a B.S. from the School of Foreign Service at Georgetown University, with an Honors Certificate from Georgetown’s Landegger International Business Diplomacy program. He is the co-author of Innovation Economics: The Race for Global Advantage (Yale University Press, September 2012). Dr. Robert Atkinson is the president of the Information Technology and Innovation Foundation. He is also the author of the books Innovation Economics: The Race for Global Advantage (Yale University Press, September 2012) and The Past and Future of America’s Economy: Long Waves of Innovation that Power Cycles of Growth (Edward Elgar, 2005). Dr. Atkinson received his Ph.D. in City and Regional Planning from the University of North Carolina at Chapel Hill in 1989. ABOUT ITIF The Information Technology and Innovation Foundation (ITIF) is a Washington, D.C.-based think tank at the cutting edge of designing innovation strategies and technology policies to create economic opportunities and improve quality of life in the United States and around the world. Founded in 2006, ITIF is a 501(c)3 nonprofit, non-partisan organization that documents the beneficial role technology plays in our lives and provides pragmatic ideas for improving technology-driven productivity, boosting competitiveness, and meeting today’s global challenges through innovation. FOR MORE INFORMATION, CONTACT ITIF BY PHONE AT 202.449.1351, BY EMAIL AT [email protected], ONLINE AT WWW.ITIF.ORG, JOIN ITIF ON LINKEDIN OR FOLLOW ITIF ON TWITTER @ITIFDC AND ON FACEBOOK.COM/INNOVATIONPOLICY.