the importance of spectral scanning and spectral ….pdf · 1 the importance of spectral scanning...
TRANSCRIPT

1
The Importance of Spectral Scanning and Spectral Analysis for Achieving the Optimal Assay PerformanceThermo Fisher Scientific, Sample Preparation & Analysis, Vantaa, Finland
Ap
plica
tion
No
tes
IntroductionFluorometric measurement wavelengths are commonly selected following the reagent manufacturer’s recommendations or taken from the literature. This does not necessarily lead to optimal assay performance, because:
• thereagentmanufacturer’srecommendationsarenotalways based on the real peak excitation and emission wavelengths of the label.
• thepeakexcitationand/oremissionwavelengthsmayshift according to the assay environment (e.g. pH, temperature, polarity and ionic strength)
• inamulti-labelassaytheoptimalwavelengthsdependon the selected label mixture and the effect of each label on each other.
Microplate readers can roughly be divided into two instrument types based on the technology used for the selectionofmeasurementwavelengths:monochromator-basedandfilter-basedinstruments.Monochromator-based instruments use monochromators for wavelength selection,andcanbeusedbothforspectralandsingle/multi-wavelengthmeasurements,asafullspectralrangeofwavelengthsisalwaysavailableonboard.Filter-basedinstruments use optical filters as wavelength selectors; so the wavelength range is limited to a certain number offiltersavailablefortheinstrumentmodel.Filter-basedinstruments cannot be used for measuring spectra. Monochromator-basedinstrumentsare,therefore,clearlysuperiortofilter-basedinoptimizingthemeasurementparameters.
OverviewThis paper presents:
• howtogainadvantagesfromusingaspectralscanningmicroplatereaderinassayoptimization.
• howthereagentmanufacturer’srecommendationsformeasurementwavelengthscandifferfromtheoptimizedwavelengths.
• howtheassayenvironmentcanaffectthelabel’sspectralproperties.
• howthemeasurementwavelengthsofmulti-labelassaysareoptimized.
MethodsThe measurement wavelengths of several fluorometric labelswereoptimizedwithaspectralscanningmicroplatereader. The materials used in this study were:
• fromacommercialsourcedCaspase-3assaykit
• fluorometriclabels:MeU,AlexaFluor488,6-ROX,andAlexaFluor680
• 96-wellmicroplates
The measurements were performed using the Thermo Scientific Varioskan Flash spectral scanning multitechnology microplate reader, which offers several measurement technologies (absorbance, fluorescence intensity,time-resolvedfluorescenceandluminescence).See Figure 1.
Figure 1. Varioskan® Flash spectral scanning multitechnology microplate reader
Results
1. Kit recommendations vs. optimal wavelengths AcommercialFRET(FluorescenceResonanceEnergyTransfer)-basedCaspase-3assaywasusedtodemonstratethat the measurement wavelengths recommended in the kit insert do not always represent the optimal
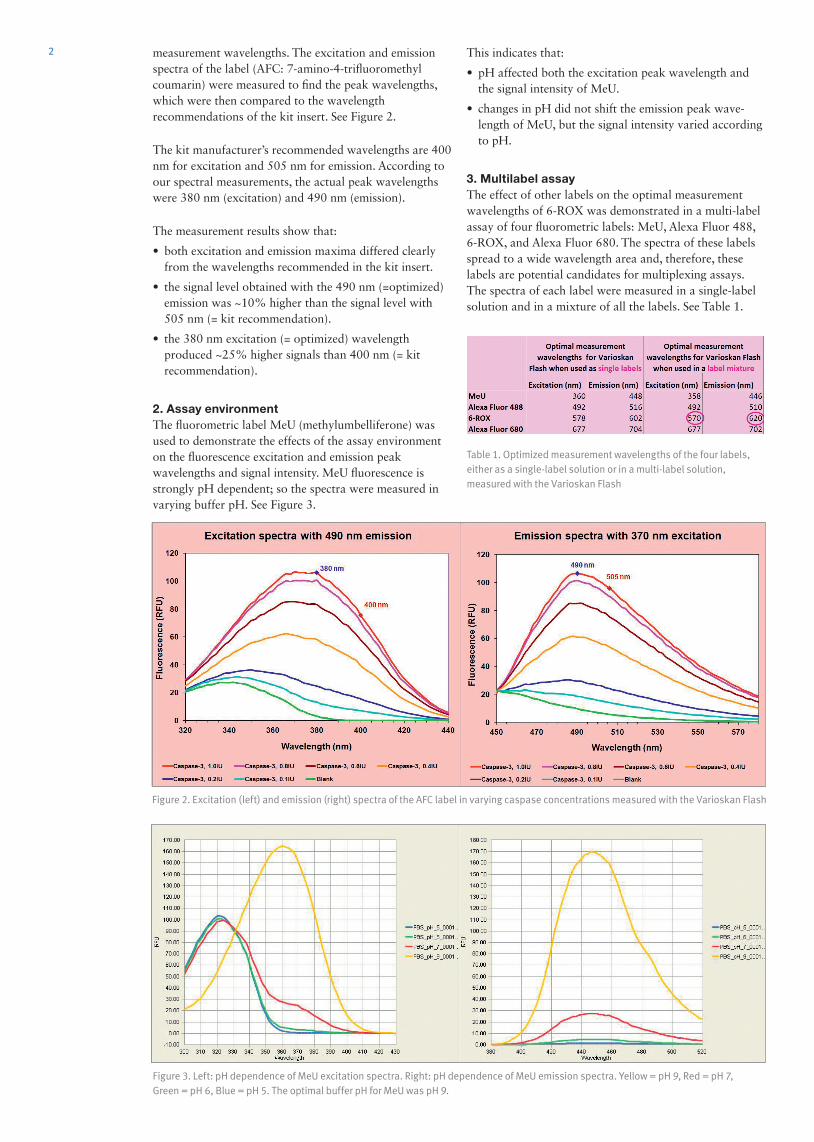
2 measurement wavelengths. The excitation and emission spectraofthelabel(AFC:7-amino-4-trifluoromethylcoumarin) were measured to find the peak wavelengths, which were then compared to the wavelength recommendations of the kit insert. See Figure 2.
Thekitmanufacturer’srecommendedwavelengthsare400nmforexcitationand505nmforemission.Accordingtoour spectral measurements, the actual peak wavelengths were380nm(excitation)and490nm(emission).
The measurement results show that:
• bothexcitationandemissionmaximadifferedclearlyfrom the wavelengths recommended in the kit insert.
• thesignallevelobtainedwiththe490nm(=optimized)emissionwas~10%higherthanthesignallevelwith505nm(=kitrecommendation).
• the380nmexcitation(=optimized)wavelengthproduced~25%highersignalsthan400nm(=kitrecommendation).
2. Assay environment ThefluorometriclabelMeU(methylumbelliferone)wasused to demonstrate the effects of the assay environment on the fluorescence excitation and emission peak wavelengthsandsignalintensity.MeUfluorescenceisstrongly pH dependent; so the spectra were measured in varyingbufferpH.SeeFigure3.
This indicates that:
• pHaffectedboththeexcitationpeakwavelengthandthesignalintensityofMeU.
• changesinpHdidnotshifttheemissionpeakwave-lengthofMeU,butthesignalintensityvariedaccordingto pH.
3. Multilabel assayThe effect of other labels on the optimal measurement wavelengthsof6-ROXwasdemonstratedinamulti-labelassayoffourfluorometriclabels:MeU,AlexaFluor488,6-ROX,andAlexaFluor680.Thespectraoftheselabelsspread to a wide wavelength area and, therefore, these labels are potential candidates for multiplexing assays. Thespectraofeachlabelweremeasuredinasingle-labelsolution and in a mixture of all the labels. See Table 1.
Table 1. Optimized measurement wavelengths of the four labels, either as a single-label solution or in a multi-label solution, measured with the Varioskan Flash
Figure 2. Excitation (left) and emission (right) spectra of the AFC label in varying caspase concentrations measured with the Varioskan Flash
Figure 3. Left: pH dependence of MeU excitation spectra. Right: pH dependence of MeU emission spectra. Yellow = pH 9, Red = pH 7, Green = pH 6, Blue = pH 5. The optimal buffer pH for MeU was pH 9.

The measurements show that:
• optimalmeasurementwavelengthsforthemulti-labelsolution were quite similar to the optimal wavelengths ofthesingle-labelsolutionsforalltheotherlabelsexcept6-ROX.
• inamulti-labelsolution6-ROXhada~20%highersignal/backgroundratiowhenusingtheoptimizedwavelengths for the label mixture in comparison to the wavelengthsoptimalforasingle-labelsolutionof6-ROX.
Spectral analysis of the results The Varioskan Flash microplate reader was controlled using Thermo Scientific SkanIt Software. This software offers an easy setup for the measurement of both excitation and emission spectra within the same protocol. The software includes automatic calculation options, e.g. for finding peak wavelengths, maximum signals and so on, thereby making the spectral analysis effortless. See Figure4.
ConclusionsAspectralscanninginstrumentisverybeneficialin:
• determiningtherealpeakwavelengthsofthespectra.
• furtheroptimizingtheperformanceofcommercialkitsinstead of relying solely on the reagent manufacturer’s recommendations.
• studyingthespectralshiftsaccordingtochangesintheassay environment.
• developingmulti-labelassays.
• checkingthepurityofreagentsandsamples.
• monitoringthestabilityofcompoundsorreagents.
For more information on the Varioskan Flash spectral scanning multitechnology microplate reader, visit: www.thermoscientific.com/varioskan
Figure 4. SkanIt® Software spectral analysis options make the result analysis quick and easy for assay optimization.
ANMRVario_0712
thermoscientific.com/liquidhandling © 2012 Thermo Fisher Scientific Inc. All rights reserved. All trademarks are the property of Thermo Fisher Scientific Inc. and its subsidiaries. Specifications, terms and pricing are subject to change. Not all products are available in all countries. Please consult your local sales representative for details.
North America: +1 800 522 7763Europe: Austria +43 1 801 40 0Belgium +32 2 482 30 30Finland/Nordic +358 9 329 100 France +33 2 28 03 20 00Germany National Toll Free 08001-536 376
Germany International +49 6184 90 6940Italy +39 02 95059 1Netherlands +31 76 571 4440Russia/CIS +7 (812) 703 42 15 Spain/Portugal +34 93 223 3154Switzerland +41 44 454 12 12UK/Ireland +44 870 609 9203
Asia: India +91 22 5542 9494Japan +81 45 453 9220China +86 21 6865 4588 or +86 10 5850 3588Other Asian countries +852 2885 4613Countries not listed: +49 6184 90 6940 or +33 2 28 03 20 00
Ap
plica
tion
No
tes