the importance of protein dynamics in the rna …
TRANSCRIPT
The Pennsylvania State University
The Graduate School
Eberly College of Science
THE IMPORTANCE OF PROTEIN DYNAMICS
IN THE RNA DEPENDENT RNA POLYMERASE
OF POLIOVIRUS
A Thesis in
Chemistry
by
Jesse L. Welch
© 2011 Jesse L. Welch
Submitted in Partial Fulfillment
of the Requirements
for the Degree of
Master of Science
May 2011
ii
The thesis of Jesse L. Welch was reviewed and *approved by the following:
David D. Boehr
Assistant Professor of Chemistry
Thesis Advisor
Craig E. Cameron
Paul Berg Professor of Biochemistry and Molecular Biology
Alan J. Benesi
Director of the NMR Facility and Lecturer in Chemistry
Martin J. Bollinger
Professor of Chemistry and Professor of Biochemistry and Molecular Biology
Kenneth Feldman
Department Head, Chemistry Department
*Signatures will be on file in the Graduate School

iii
ABSTRACT
Positive strand RNA viruses, such as poliovirus, cause a wide range of health problems
such as poliomyelitis, SARS, and hepatitis C1-5
. The lifecycle of these viruses involves entry
into the host cell by some form of receptor mediated endocytosis, translation of the viral RNA,
replication of the viral RNA, construction of new virions, and eventually the destruction of the
host cell6-14
. This project focuses upon the RNA dependent RNA polymerase (RdRp) from
poliovirus. Fidelity mutants, such as G64S, greatly influence the fidelity of this protein without
any substantial change in structure32
. In addition, molecular dynamics simulations show
considerable amounts of correlated motion between residues, and these results all suggest the
possibility of an internal amino acid network important for enzyme catalysis and regulation.
Here we utilize NMR to investigate this network. Because the protein is large (~52kDa),
selective labeling of the methionine residues is applied to give us regional probes. Changes to
chemical shifts and peak intensities among numerous mutants provided a means of detecting
structural and/or dynamic changes throughout the protein. These findings strongly support the
existence of a dynamic network that is important for governing enzyme function and fidelity.

iv
TABLE OF CONTENTS
List of Tables……………………………………………………………………………...V
List of Figures……………………………………………………………………………..VI
Chapter One
Introduction………………………………………………………………………………...1
Poliovirus: The Viral Lifecycle……………………………………………….........1
The Viral Proteome………………………………………………………………....2
Impact of the Proteins on the Cell Morphology………………………………….....3
The RNA Dependent RNA Polymerase………………………………………….....4
NMR for Protein Dynamics – Limitations and Options for Large Proteins………...8
Project Aim…………………………………………………………………….........9
Chapter Two
Introduction…………………………………………………………………………………10
Materials and Methods……………………………………………………………………...11
Preparation of Mutant Plasmids……………………………………………………..11
Overexpression of Mutant RdRp…………………………………………………...11
Purification of Mutant Proteins……………………………………………………...13
NMR Acquisition Protocol………………………………………………………….13
Results and Discussion……………………………………………………………………...14
Acquisition and Assignment of Methionine Probes in the Wild Type Spectrum…..14
Chemical Shift Analysis of Mutant RdRp……………….……………………........15
The High Fidelity (Gly64Ser) RdRp Mutant.………………………………………20
Conclusion…………………………………………………………………………………..25
Chapter Three
Introduction…………………………………………………………………………………27
Materials and Methods……………………………………………………………………...31
32
P Labeled UTP Enzyme Activity Assay…………………………………………..31
NMR Acquisition……………………………………………………………………31
Results and Discussion………………………………………………………………………31
Investigation of Activity Mutants…………………………………………………...31
Enzyme Assays for Met to Ile mutant RdRp……………..…………………………35
Network Analysis through changes in NMR resonance peak intensities ...…………36
Conclusion…………………………………………………………………………………...40
Conclusion and Future Directions…………………………………………………………...43
References……………………………………………………………………………...........47

v
LIST OF TABLES
Table 2.1 - The Distribution and Location of Methionine Residues……………………………12
Table 2.2A - The 1H and
13C Chemical Shift Values for Methionine Residues……………….17
Table 2.2B - 1H Chemical Shift Differences from the WT……………………………………...18
Table 2.2C - 13
C Chemical Shift Differences from the WT……………………………………..19
Table 2.3 - Relative Intensities of Both Peaks for Met6 and Met187…………………...............23
Table 3.1 - Relative Activity of Each of Ibrahim’s Mutants…………………………………….30
Table 3.2 - Significant Differences in Intensity Relative to the Intensity of the Met86 Peak…...38
Table 3.3 - Z Values (Absolute Value) for Intensity Values with the Met86 Internal Standard..38
Table 3.4 – Significant Differences in Intensity Relative to the Intensity of the Met241 Peak…39
Table 3.5 - Z Values (Absolute Value) for Intensity Values with the Met251 Internal Standard.39

vi
LIST OF FIGURES
Figure 1.1 – The Picornavirus Proteome………………………………………………………..3
Figure 1.2 – Comparison of the Active Site Topography……………………………………….5
Figure 1.3 – Important Active Site Residues in Poliovirus RdRp……………………...………7
Figure 2.1 - 1H/
13C HSQC for Wild Type and the Met354Ile Mutant………………………….16
Figure 2.2 - Intensity of Each Methionine Peak Relative to its Solvent Accessibility...………..16
Figure 2.3 – Location of the G64S Residue…………………………………………………….21
Figure 2.4 - 1H,
13C HSQC spectra for WT, G64S, and Met323Ile……………………………..22
Figure 2.5 – The Dynamic Loop in Poliovirus RdRp…………………………………………..24
Figure 3.1 – Dynamic Cross Correlation Map………………………………………………….28
Figure 3.2 – Ibrahim’s Proposed Network of Correlated Motion………………………………29
Figure 3.3 - Locations of Dr. Mustafa’s Mutants Relative to the Affected…………………….30
Figure 3.4 - 1H,
13C HSQC Spectra of Each Activity Mutant Compared to the Wild Type….33-34
Figure 3.5 – The Fold Decrease in Activity for Selected Methionine/Isoleucine Mutants….….35

1
Chapter One
Positive strand RNA viruses are a class of viruses whose genetic information is stored as
RNA. In particular, infection by poliovirus causes poliomyelitis, which affects the nervous
system and may lead to full or partial paralysis. Muscle pain, sensitivity to touch, or even
difficulty of breathing are common symptoms1,2
. Historically, this has required the application
of breathing support as part of the treatment for infected individuals. Fortunately, the western
world now has vaccines against poliomyelitis; however, this remains a serious problem in
developing parts of the world3-5
.
The RNA virus lifecycle
The viruses in the Picornaviridae family all share a similar life cycle. The virion starts as
single strands of positive sense RNA containing the viral genome, wrapped in a capsid protein
coat. The four capsid proteins (VP1 – VP4) are encoded in the P1 region of the viral genome6,7
.
In rhinoviruses, Coxsackie viruses, and poliovirus the surface of the protein coat is characterized
by a canyon that serves as the site of attachment with host receptors6. In poliovirus, the cell
surface receptor Pvr binds to this canyon with its N-terminal D1 domain7. This binding causes
the virion to uncoat and the contents of the virion to gain entry to the cytosol. This is believed to
be due to receptor-mediated endocytosis yet the precise process remains unclear6. The 5’
untranslated region (5’UTR) contains an internal ribosomal entry sequence (IRES) which drives
the translation of the entire polyprotein forward (Figure 1.1)7,8
. Viral proteins and host cofactors
(like the NS2-3 protease and NS3-4A serine protease) along the surface of the endoplasmic
reticulum (ER) process the polyprotein into the P1, P2, and P3 regions8,9
. In particular, P1 is
further cleaved into the structural proteins VP0 (an immature intermediate later cleaved into VP2
& VP4), VP1, and VP36.

2
The viral proteome
The non-structural proteins P2 and P3 are cleaved into 2A, 2BC, 3AB, and 3CD (Figure
1.1). 2A and 3C further process these intermediates into 2B, 2C, 3A, 3B, 3C, and 3D7. In
poliovirus, 3CD is able to enter the nucleus as this intermediate contains a nuclear localization
sequence (NLS)6,7
. Once inside, the active protease begins to cleave numerous factors connected
to DNA dependent RNA polymerases I, II, and III such as the TATA box binding protein (TBP),
octamer binding protein (OCT-1), histone H3, the cyclic AMP-responsive element binding
protein (CREB), the transcription activator p53, and DNA polymerase III. All of this serves to
hinder cellular transcription within the host cell7. In addition, 3C cleaves eIF4AI and 2A cleaves
the eukaryotic initiation factors eIF4GI and eIF4GII, which are essential to the formation of a
competent initiation complex at the 5’ end of mRNA7. Furthermore, 2A and 3C cleave the
poly(A) binding protein (PABP)7. These events shut down translation in the host cell.

3
Figure 1.1:The picornavirus proteome7. The 5’UTR possesses an IRES sequence that drives the
translation of the polyprotein forward with the host ribosome. This polyprotein consists of three
regions: P1, P2, and P3. Host cofactors like NS2-3 protease and viral proteins process the
polyprotein into the intermediates, and the mature proteins as diagrammed above.
Impact of the viral proteins on cell morphology
The nonstructural proteins in poliovirus directly impact the morphology of the host cell. 2A
cleaves cytokeratin 8 and 3C cleaves microtubulin-associated protein 410,11
. These events are
believed to cause a breakdown of the cytoskeleton7,10,11
. Infected cells also exhibit a degradation
of the host’s nuclear pore complex, and nuclear proteins accumulate in the cytosol7. 2B and 2BC
tend to aggregate on the surface of the Golgi and the ER, leading to the formation of new
vesicles from the ER through an undetermined mechanism12
. 2B and 2BC are then found on the
surface of these vesicles, which begin to accumulate in the cytoplasm12
. Transport of protein to
the Golgi from the ER is also inhibited because 2B and 2BC increase the rate of Ca2+
efflux,
which disrupts Ca2+
homeostasis7. 3A is also capable of inhibiting protein traffic, but it
accomplishes this by redistributing ADP-ribosylation factors (Arf) away from the Golgi where

4
they are otherwise necessary membrane components in the secretory pathway7. Introduction of
brefeldin
A (BFA) prevents the inactive GDP bound Arf from being converted back to GTP bound
Arf, which also seems to stop viral RNA replication7.
Yeast cells expressing 2B demonstrate that the 2B protein associates with the Golgi,
causes an aggregation of glycoproteins, and ultimately leads to the dissociation of the Golgi13
.
The current theory suggests 2B promotes fusion of the Golgi cisternae with the ER, which would
also account for the observed swelling of the ER lumen13
. Expression of 2BC demonstrates that
in the last stages of infection the permeability of the plasma membrane is substantially raised.
The membrane potential drops as sodium and potassium ions are moved across the membrane,
and passive diffusion of low molecular weight metabolites increases14
. It is worth noting that
activation of specific phospholipases (phospholipase C in poliovirus) occurs during the increased
membrane permeability, though the mechanism behind these events remains to be understood.
The RNA-dependent RNA polymerase
The viral 3D protein, otherwise known as the RNA-dependent RNA polymerase (RdRp)
is required for replication of the RNA viral genome. The structures of RdRps resemble a cupped
right hand containing a palm, fingers, and thumb subdomains15
(Figure 1.2). Despite the
differences in amino acid sequences, the active site topography is remarkably similar across all
RNA viruses.

5
Figure 1.2: Comparison of the active site topography of (A) poliovirus RdRp15
, (B) HCV
RdRp16
, and (C) Coxsackievirus B3 RdRp17
. Motifs A – G are labeled green, blue, red, yellow,
purple, black, and orange respectively. The Gly64 residue in the poliovirus RdRp is labeled in
magenta with a green border. Despite differences in the overall structure of each polymerase, the
active site topographies are the same.
The polymerase active site contains motifs A-G, each essential for proper polymerase
function. Motifs A and C each possess an aspartic acid residue that help coordinate Mg2+
ions in
the core of the polymerase18,19
. These Mg2+
ions are critical for phosphodiester bond formation
as they neutralize the negative charges of the phosphate groups20
. Motif B contains Asn 297
(poliovirus numbering) that interacts with the Asp 238 residue of motif A18
. By positioning this
aspartate, motif B effectively discriminates between NTPs and dNTPs18
. Motifs A-D each
A B
C

6
contribute a β-strand to form the core of the palm subdomain18
. Motif E contains a network of
hydrophobic interactions with this β-sheet core in order to position the thumb subdomain18
.
Nucleotide binding to the RdRp/template complex is driven forward by the interaction between
motif F and the triphosphate group21,22
. The functional importance of motif G remains unknown
although substitutions in this motif impede polymerase function21
.
The replication of plus-strand RNA is best understood in the case of poliovirus. The 100
nucleotides at the 5’ end of the plus-strand RNA form a cloverleaf structure that is not present in
the complimentary negative-strand23
. A ribosome-associated cellular factor (p36) from the host
cell binds to the stem loop on the furthest 5’end while 3CD binds to the stem loop on the
opposite end23
. 3AB then binds to 3CD to anchor the replication complex23
. 3AB is associated
with the vesicle membranes building up in the cytoplasm because 3A is very hydrophobic. 3B
(VPg) can serve as a template for plus-strand RNA synthesis after uridylation23-24
. Since the
plus-strand possesses the cloverleaf structure, it is proposed to anchor the replication complex
while the negative-strand serves as the template for plus-strand synthesis23
.
Once 3AB has been cleaved, the 3B component (VPg) is uridylylated by 3D in the
presence of a poly(A) template to serve as a primer for RNA synthesis18,23-25
. This primer is
present at the 5’ end of each RNA strand synthesized as 3D begins elongation from here25
. The
RdRp from poliovirus carries out elongation according to a five step kinetic scheme. After the
polymerase forms a complex with the template/primer substrate, it proceeds to bind the
appropriate NTP27-29
. This is followed by a conformational change that brings the complex into
a catalytically active form27-29
. At this point the α phosphate group is connected to the growing

7
chain via phosphoryl transfer27-29
. Following phosphoryl transfer, a second conformational
change occurs in order to release pyrophosphate.
Step 1 Step 2 Step 3 Step 4 Step 5
ERn + NTP --------->ERnNTP --------> *ERnNTP --------> *ERn+1PPi --------> ERn+1PPi--------> ERn+1 + PPi
Scheme 1.1: Kinetic scheme of nucleotide incorporation by poliovirus RdRp28
. This involves
binding of the appropriate NTP, conformational change, phosphoryl transfer, another
conformational change, and finally the release of pyrophosphate.
Because of the similar active site topography and cupped right hand structure, the catalytic
mechanisms for other viral RdRps are likely to be the same as that for poliovirus RdRp (Figure
1.3). Aspartic acid residues from motifs A and C coordinate Mg2+
in the active site, which in turn
stabilizes the NTP within the active site18,19
. Once oriented within the active site, an unknown
general base deprotonates the 3’-OH of the primer or growing strand to facilitate the formation
of a new phosphodiester bond27-29
. Lys359 then protonates the pyrophosphate to make it a better
leaving group.
Figure 1.3: Important active site residues in poliovirus RdRp with bound ATP. Aspartic acid
residues in motifs A and C coordinate Mg2+
ions in the active site. Lys359 acts as an active site
acid to protonate the pyrophosphate leaving group.

8
The frequency of correct nucleotide incorporation (fidelity) is naturally low for most
RdRps relative to DNA dependent DNA polymerases (DdDp’s). One reason is that RdRps lack
the exonuclease proofreading domain that is common to DdDps. By possessing a high degree of
genetic variability, the virus is better able to adapt to changes in its environment31
. However, a
point mutation (G64S) was isolated by Kirkegaard and Pfieffer that substantially increased the
fidelity of the viral RdRp32
. Surprisingly, this increase in fidelity attenuated the virus so
effectively that it served as an effective poliovirus vaccine in mice33
. Apparently, the virus
requires a certain amount of genetic variability in order to adapt to changing environments and
survive. This genetic variability gives rise to a flexible quasi-species whose variability is
severely hindered by the G64S mutation. The most interesting structural aspect of this mutation
is that it is distal from the active site (Figure 1.1A) and causes no change in the active site
topography or overall structure of the free protein34
. This suggests that the antimutator might
impact fidelity by somehow affecting the flexibility of the protein in order to tune fidelity.
NMR for protein dynamics – Limitations and options for larger proteins
Poliovirus RdRp is a 52kDa protein. NMR offers a multitude of ways to study the internal
dynamics of proteins. Unfortunately, most NMR techniques are limited by the size of the
protein. Large proteins often give rise to extensive signal overlap due to the complexity of the
spectra35
. They also have slower tumbling times which cause rapid transverse relaxation,
leading to lower sensitivity and line broadening35
. Generally, proteins >30kDa are considered to
be large by NMR standards so different strategies are needed to examine the larger proteins35-36
.
TROSY (transverse relaxation optimized spectroscopy) is one NMR experiment that increases
the spectral resolution of the spectrum35
. Instead of decoupling multiplets, TROSY generally
disregards all but the narrowest, most slowly relaxing line in each multiplet35
. Another strategy

9
is perdeuteration, replacing certain hydrogen atoms near the 13
C/15
N label with deuterium. 2H is
less effective than 1H at causing dipolar relaxation of the directly attached nucleus
36. Thus,
replacing protons with deuterium near the label will increase the T2 time for that label36
. For
especially large proteins, segmental labeling is often used36
. Instead of running labels
throughout the entire protein, segmental labeling involves the labeling of only certain amino
acids or regions of the protein. One drawback is that this method only enables us to see parts of
the protein at a time, instead of looking at the whole. Still, this method potentially offers us
more structural and dynamic probes than other techniques such as fluorescence labeling.
Project Aim
This project aims to explore the structure and internal dynamics of poliovirus RdRp.
This protein is ~52kDa which limits our options by NMR. Selective amino acid labeling of the
terminal methyl groups of each methionine residue enables us to probe the structure and
dynamics of each region of the protein. Findings made with poliovirus RdRp will likely translate
to other viral RdRp systems as well since the general cupped right hand structure and active site
topography are similar. In the long term, an understanding of the protein dynamics present in
viral RdRps may influence future drug and vaccine development efforts. In addition,
interactions between the RdRp and other proteins in the replication complex may also affect
internal dynamics. This would offer an additional level of regulation for the replication process.

10
Chapter Two
Introduction
RNA dependent RNA polymerases (RdRps) are essential to the life cycle of RNA
viruses. Once anchored at the replication complex by 3AB, these polymerases can utilize
uridylated 3B as a primer and replicate new RNA. These polymerases are so important to the
lifecycle of RNA viruses that alteration of their fidelity by certain point mutations will attenuate
the virus enough to make viable vaccine strains23
. These polymerases are a primary target for
future drug and vaccine development efforts. Furthermore, interactions between the viral
polymerase and other proteins within the replication complex may influence or coordinate events
during replication.
The primary aim of this project is to better understand the inner workings of the RNA
polymerase from poliovirus. Crystal structures of wild type (WT) and fidelity-mutant (G64S)
RdRp revealed no significant structural change between the two in the free state37
. This
suggested that the difference in function and fidelity might arise not because of differences in the
‘static’ or average structure, but due to differences in the dynamic fluctuations experienced by
the WT and mutant enzymes. NMR methods are capable of monitoring these dynamics over a
broad range of timescales at the atomic level making it invaluable for studying the internal
motions of proteins35,36
. Unfortunately, proteins larger than ~30kDa are considered to be large
by NMR standards; poliovirus polymerase is 52kDa.
In the larger project scheme, we wished to probe the internal dynamics of the poliovirus
RdRp through NMR methodology using the terminal methyl group of methionines as convenient
and practical probes. As a first step, I used a site-directed mutagenesis based

11
approach to assign the 15 resonances observed in the 1H,
13C HSQC of ε-
13CH3 labeled RdRp.
These studies were not only successful in assigning the NMR spectrum, but careful analysis of
the Met to Ile spectra suggested that there are long range interactions in poliovirus RdRp that
may be important for its function and/or regulation.
Materials and Methods
Preparation of mutant plasmids. Methionine residues served as excellent probes for our
selective labeling strategy because they are distributed throughout the entire protein (Table 1).
In order to properly identify which peaks in the HSQC spectrum of the wild type poliovirus
RdRp correspond to which methionine residue, single Met to Ile mutations were generated for
each Met residue in the protein. This was done according to the accompanying protocol using
the Quickchange kit from Stratagene. All mutant plasmids were sequenced by the Penn State
nucleic acid facility to confirm their integrity.
Overexpression of mutant RdRp. The aforementioned plasmids were transformed into Met
auxotrophic B834 (DE3) cells. The expression was carried out according to an auto-induction
procedure published by Studier and modified by the Cameron lab38
. The media was
supplemented with 13
CH3 – labeled methionine for isotopic incorporation. Following the
collection of cells through centrifugation, cells were resuspended in 100mL of a wash solution
(10mM Tris, 1mM EDTA, pH 8.0), centrifuged again, and stored at -80oC.

12
Table 2.1 – Distribution and location of Met residues in poliovirus 3Dpol
and
primers designed
Methionine Location Primer sequence for site-directed mutagenesis (5’ � 3’)
Met6 Fingers GGTGGTGAAATCCAGTGGATCAGACCTTCGAAGG
Met74 Fingers GTGGATGAGTACATCAAAGAGGCAGTAGACCACTATGCT
Met86 Fingers CACTATGCTGGCCAGCTCATCTCACTAGAC
Met95 Fingers GACATCAACACAGAACAAATCTGCTTGGAGGATGCC
Met101 Fingers TGCTTGGAGGATGCCATCTATGGCACTGATGGT
Met123Ile Fingers GGTTACCCGTACGTAGCAATCGGAAAGAAGAAGAGAGAC
Met123Leu Fingers GGTTACCCGTACGTAGCATTGGGAAAGAAGAAGAGAGAC
Met141 Fingers ACCAGAGACACTAAGGAAATCCAAAAACTGCTCGAC
Met187 Fingers GACTCAGTGGCAATCAGAATGGCTTTTGGGAACCTATATGCT
Met189 Fingers GACTCAGTGGCAATGAGAATCGCTTTTGGGAACCTATATGCT
Met225 Palm – Motif A GGAGCAAAATTCCGGTATTGATCGAAGAGAAGCTGTTTGC
Met251 Fingers GGTTCGAGGCACTAAAGATCGTGCTTGAGAAAATCGG
Met286 Palm – Motif B GTGAAGGGCGGTATCCCATCTGGCTGCTCAGG
Met299 Palm – Motif B GGTACCTCAATTTTTAACTCAATCAATAACAACTTGATTATCAGGACACTC
Met323 Palm – Motif C GACCACCTAAAAATCATTGCCTATGGTGATGATGTAATTGC
Met354 Palm – Motif D GACTATGGACTAACTATCACTCCAGCTGACAAATCAGC
Met392 Thumb CCATTTCTTATTCATCCAGTAATCCCAATGAAGGAAATTCATGAATCA
Met394 Thumb CCATTTCTTATTCATCCAGTAATGCCAATCAAGGAAATTCATGAATCAATTAG
ATGG

13
Purification of mutant proteins. The purification procedure is a modification of an existing
purification procedure39-41
. Importantly, the poliovirus RdRp is expressed as a fusion protein
with an N-terminal SUMO domain, and also contains an N-terminal hexahistidine tag. This
allows for the production of the correct N-terminal Gly1 in RdRp following processing. The cells
were lysed by sonication and the resulting solutions were centrifuged. The supernatant was
passed over a Ni-NTA column where the desired protein remained due to its N-terminal
hexahistidine affinity tag. Once separated from other cellular components, the protein was
eluted from the column with high imidazole buffers. SDS PAGE was utilized on each fraction to
determine the presence of protein, and the fractions with protein were combined. The
concentration of protein in the combined fraction was determined by UV absorbance (ε280=
76,000) and 1µg UlpI per mg protein was added to cleave the pSUMO domain and
accompanying N-terminal histidine tag. These solutions were dialyzed overnight (80mM Tris at
pH 8.0, 500mM NaCl, 20% w/v glycerol, 10mM βmercaptoethanol, and 60µM ZnCl2) and again
for a few hours the subsequent day (100mM potassium phosphate at pH 8.0, 20% w/v glycerol,
10mM βmercaptoethanol, and 60µM ZnCl2). The untagged RdRp was then subject to an
additional Ni-NTA column for further purification. Fractions were tested again by SDS PAGE
and protein containing fractions were again combined. These solutions were spin concentrated
to ~100 – 300µM protein and exchanged into an NMR buffer (25mM potassium phosphate,
150mM NaCl, 1mM DTT, 0.02% w/v sodium azide, all in D2O) using zebra spin desalting
columns from Thermo Scientific.
NMR acquisition protocol. Most of the 1H,
13C HSQC were collected with a 600MHz
BrukerAvance III spectrometer with a triple resonance TCI cryoprobe. The spectra were

14
collected at 298K in each case and were generally 64 (t1) × 512 (t2). The number of scans was
usually 256, although this was subject to increase for the lower concentration samples as needed.
Results and Discussion
Acquisition and assignment of Met probes in the wild type spectrum
There are seventeen Met residues in poliovirus RdRp that span the entire protein (Table
1). In our labeling scheme, the terminal methyl group of each methionine was labeled with 13
C
so that each residue would give rise to a single peak in a 1H,
13C HSQC . However, we only
observe 15 resonances in the wild type spectrum (Figure 2.1A). To assign the spectrum, mutant
RdRps were generated in which each Met was separately mutated to Ile (or Leu in the case of
Met123). This resulted in the loss of a single peak in most of the spectra, which permitted a
means in which to assign each resonance (Figure 2.1B). The spectral dispersion looked good for
the spectra although there was some slight overlap between Met123 and Met392. The peaks
with the highest intensity are Met86, Met123, and Met251. This is not particularly surprising
given that Met86 and Met251 are the most solvent exposed methionines in the protein (Figure
2.2). Solvent exposed residues have less restricted motion so their T1 times are expected to be
longer and the intensity of the signal is greater.
Importantly, we were unable to assign any resonances for Met286 or Met299. Met286 resides
upon a loop in motif B and Met299 resides on the end of a helix very near this loop. One
possible explanation for the lack of signal for these mutants is intermediate exchange. In cases
of intermediate exchange, the signal is broadened until it is no longer visible in the spectrum.
Another possible explanation is that these resonances are buried in a rigid region of the protein
with little motion. In either case, this would lead to a low signal intensity. Importantly, mutation

15
of the other Met did not reveal any additional peaks that could potentially be assigned to Met286
or Met299.
Chemical shift analysis of mutant RdRp
Some of the Met to Ile mutations gave rise to an unexpected two resonances associated
with Met6 and Met187 (Figure 2.1B). This happens with the mutants Met141Ile, Met187Ile,
Met189Ile, Met251Ile, Met323Ile, and Met354Ile (Figure 2.3). Additional information came
when we looked more closely at the chemical shifts of each of the peaks in each spectrum. The
1H and
13C chemical shifts of each peak in each spectrum are organized in Table 2A. Substantial
differences (>0.04ppm for 1H, >0.15ppm for
13C) in chemical shift between mutant spectra and
the wild-type were observed with some mutants as highlighted in yellow in Table 2B (for 1H)
and Table 2C (for 13
C). Several of these larger chemical shift differences can be readily
explained. Met95 hydrogen bonds with the backbone structure that Met189 resides on, so the
mutation Met95Ile would understandably impact the chemical shift of Met189. Met187 and
Met286 are in regions that have Van der Waal’s interactions with each other, so mutating
Met286Ile would likely cause small changes to these interactions to affect Met187. Finally,
Met323 and Met225 are spatially close to each other, so it may not be surprising that the
Met323Ile mutation affected Met225. However, some of the other differences were not readily
explained. Met354 is 42.4Ǻ away from Met123 yet mutation of Met123 still causes a chemical
shift change for the resonance associated with Met354.

16
Figure 2.1:1H,
13C HSQC for wild type (A) and the Met354Ile mutant (B). Notice the absence of
the Met354 peak in the second spectrum. Two peaks are seen for Met6 and Met187 for this
mutant as well; an unexpected discovery that would seem indicative of two protein
conformations.
Figure 2.2: Intensity of each methionine peak relative to its solvent accessibility. The intensity
increases as accessibility increases in a linear manner. Met6 appears to be an exception to this
trend, but its two peaks and differing relaxation time suggest it may be involved in
conformational exchange.

17
Table 2.2A The 1H and
13C chemical shift values for Met residues in each spectra. The top
number represents the 1H chemical shift and the bottom number represents the 13
C chemical shift
WT M6I M74I M86I M95I M1011 M123L M141I M187I M189I M225I M251I M286I M299I M323I M354I M392I M394I
M6 #1 0.87
15.3
N/A
N/A
N/A
N/A
N/A
N/A
N/A
N/A
0.85
15.3
0.88
15.4
0.84
15.4
0.89
15.4
0.87
15.3
0.87
15.3
0.88
15.4
0.84
15.3
0.85
15.3
0.86
15.3
0.87
15.3
0.82
15.3
0.86
15.3
M6 #2 N/A
N/A
N/A
N/A
0.95
15.4
0.96
15.4
N/A
N/A
N/A
N/A
0.97
15.4
0.95
15.4
0.95
15.4
N/A
N/A
0.95
15.4
N/A
N/A
N/A
N/A
0.95
15.4
0.95
15.4
0.95
15.4
N/A
N/A
N/A
N/A
M74 0.56
14.7
0.56
14.7
N/A
N/A
0.58
14.7
0.56
14.7
0.56
14.7
0.56
14.8
0.56
14.7
0.56
14.7
0.56
14.7
0.56
14.7
0.58
14.8
0.56
14.7
0.52
14.5
0.57
14.7
0.54
14.7
0.56
14.7
0.56
14.7
M86 2.09
16.6
2.09
16.6
2.09
16.6
N/A
N/A
2.10
16.6
2.09
16.7
2.09
16.6
2.09
16.6
2.09
16.6
2.09
16.7
2.09
16.7
2.09
16.6
2.09
16.6
2.09
16.7
2.09
16.7
2.09
16.6
2.09
16.6
2.09
16.6
M95 1.73
17.1
1.74
17.1
1.73
16.9
1.74
16.9
N/A
N/A
1.74
17.1
1.73
17.1
1.75
17.1
1.73
17.1
1.73
17.3
1.73
17.1
1.73
17.0
1.73
17.1
1.73
17.1
1.73
17.0
1.74
17.0
1.73
17.0
1.74
17.0
M101 1.88
17.3
1.88
17.4
1.88
17.3
1.90
17.3
1.78
17.2
N/A
N/A
1.89
17.3
1.82
17.2
1.86
17.3
1.87
17.2
1.88
17.3
1.89
17.3
1.88
17.2
1.88
17.2
1.88
17.2
1.88
17.3
1.88
17.2
1.88
17.2
M123 1.90
16.5
1.90
16.5
1.89
16.5
1.90
16.5
1.91
16.6
1.89
16.6
N/A
N/A
1.90
16.7
1.90
16.5
1.89
16.5
1.90
16.5
1.90
16.6
1.89
16.5
1.90
16.5
1.89
16.5
1.90
16.5
1.90
16.5
1.90
16.5
M141 2.10
20.6
2.11
20.6
2.11
20.5
2.12
20.6
2.13
20.6
2.11
20.5
2.10
20.6
N/A
N/A
2.11
20.6
2.09
20.6
2.10
20.6
2.11
20.6
2.10
20.5
2.10
20.6
2.10
20.6
2.11
20.6
2.10
20.6
2.10
20.6
M187 #1 2.39
16.9
2.39
16.8
N/A
N/A
N/A
N/A
N/A
N/A
2.38
16.9
2.39
17.0
2.39
17.0
N/A
N/A
2.38
17.0
2.39
16.9
2.39
16.9
2.35
16.9
2.38
16.9
2.38
16.8
2.39
16.9
2.38
16.9
2.39
16.9
M187 #2 N/A
N/A
N/A
N/A
2.38
17.5
2.39
17.6
2.37
17.5
N/A
N/A
N/A
N/A
2.38
17.6
N/A
N/A
2.39
17.6
N/A
N/A
2.39
17.6
N/A
N/A
N/A
N/A
2.39
17.6
2.39
17.5
N/A
N/A
N/A
N/A
M189 2.04
16.1
2.04
16.1
2.06
16.2
2.07
16.2
2.08
16.2
2.04
16.2
2.03
16.2
2.03
16.1
2.05
16.2
N/A
N/A
2.04
16.2
2.05
16.2
2.03
16.1
2.04
16.2
2.04
16.1
2.04
16.2
2.04
16.2
2.04
16.1
M225 1.46
19.3
1.46
19.2
1.46
19.2
1.47
19.3
1.46
19.3
1.46
19.2
1.46
19.3
1.46
19.2
1.47
19.2
1.46
19.3
N/A
N/A
1.46
19.3
1.46
19.3
1.47
19.2
1.50
19.5
1.44
19.3
1.47
19.3
1.46
19.3
M251 2.13
17.2
2.13
17.2
2.13
17.1
2.13
17.2
2.13
17.2
2.13
17.2
2.12
17.2
2.12
17.2
2.13
17.2
2.12
17.2
2.12
17.2
N/A
N/A
2.13
17.2
2.12
17.1
2.12
17.2
2.13
17.2
2.13
17.2
2.13
17.2
M323 1.65
17.4
1.65
17.4
1.67
17.4
1.66
17.5
1.65
17.5
1.65
17.4
1.65
17.5
1.65
17.4
1.65
17.4
1.65
17.5
1.68
17.6
1.65
17.4
1.65
17.4
1.68
17.5
N/A
N/A
1.63
17.5
1.65
17.4
1.65
17.4
M354 0.48
13.6
0.48
13.7
0.47
17.4
0.49
13.7
0.46
13.6
0.47
13.7
0.47
13.8
0.47
13.8
0.47
13.8
0.48
13.7
0.48
13.7
0.48
13.8
0.47
13.6
0.49
13.8
0.48
13.6
N/A
N/A
0.48
13.8
0.48
13.7
M392 1.85
16.3
1.85
16.3
1.85
16.3
1.86
16.3
1.86
16.2
1.85
16.3
1.85
16.3
1.85
16.3
1.85
16.3
1.85
16.3
1.85
16.2
1.85
16.3
1.85
16.3
1.85
16.3
1.85
16.3
1.85
16.3
N/A
N/A
1.86
16.3
M394 1.47
14.4
1.47
14.5
1.47
14.4
1.47
14.4
1.45
14.3
1.47
14.4
1.47
14.5
1.47
14.5
1.47
14.5
1.47
14.5
1.49
14.5
1.48
14.5
1.47
14.4
1.47
14.5
1.47
14.4
1.48
14.4
1.49
14.5
N/A
N/A

18
Table 2.2B1H Chemical Shift Differences from the WT. Substantial differences in chemical shift
(>0.04ppm) for 1H are highlighted in yellow.
M6I M74I M86I M95I M101I M123L M141I M187I M189I M225I M251I M286I M299I M323I M354I M392I M394I
M6 N/A N/A N/A N/A 0.02 0.02 0.03 0.02 0.00 0.00 0.00 0.03 0.02 0.01 0.00 0.04 0.01
M74 0.00 N/A 0.02 0.00 0.00 0.00 0.00 0.01 0.00 0.00 0.02 0.00 0.04 0.01 0.02 0.00 0.00
M86 0.00 0.01 N/A 0.00 0.00 0.00 0.00 0.00 0.00 0.00 0.00 0.00 0.00 0.00 0.00 0.00 0.00
M95 0.00 0.00 0.00 N/A 0.00 0.01 0.01 0.01 0.00 0.00 0.00 0.00 0.00 0.00 0.00 0.00 0.00
M101 0.00 0.00 0.01 0.10 N/A 0.01 0.06 0.01 0.01 0.00 0.00 0.00 0.00 0.00 0.00 0.00 0.00
M123 0.00 0.00 0.00 0.01 0.01 N/A 0.00 0.01 0.01 0.00 0.00 0.00 0.00 0.00 0.00 0.00 0.00
M141 0.00 0.01 0.02 0.03 0.01 0.00 N/A 0.01 0.01 0.00 0.01 0.00 0.00 0.00 0.01 0.00 0.00
M187 0.00 N/A N/A N/A 0.01 0.00 0.00 N/A 0.01 0.00 0.00 0.04 0.01 0.01 0.00 0.01 0.00
M189 0.00 0.02 0.03 0.04 0.00 0.01 0.00 0.02 N/A 0.00 0.02 0.00 0.00 0.00 0.01 0.00 0.00
M225 0.00 0.00 0.01 0.00 0.00 0.00 0.00 0.01 0.00 N/A 0.00 0.00 0.01 0.05 0.02 0.01 0.01
M251 0.00 0.00 0.00 0.00 0.00 0.00 0.00 0.00 0.00 0.00 N/A 0.00 0.01 0.00 0.00 0.00 0.00
M323 0.00 0.02 0.01 0.01 0.00 0.00 0.00 0.00 0.00 0.03 0.00 0.00 0.03 N/A 0.03 0.00 0.00
M354 0.01 0.00 0.01 0.01 0.00 0.01 0.00 0.00 0.00 0.01 0.00 0.01 0.02 0.00 N/A 0.01 0.01
M392 0.00 0.00 0.01 0.01 0.00 0.00 0.00 0.00 0.00 0.00 0.00 0.00 0.00 0.00 0.00 N/A 0.01
M394 0.01 0.00 0.00 0.02 0.00 0.00 0.00 0.01 0.00 0.02 0.01 0.00 0.01 0.00 0.01 0.02 N/A

19
Table 2.2C 13
C Chemical Shift Differences from the WT. Substantial differences in chemical
shift (>0.15 ppm for 13
C) are highlighted in yellow.
M6I M74I M86I M95I M101I M123L M141I M187I M189I M225I M251I M286I M299I M323I M354I M392I M394I
M6 N/A N/A N/A N/A 0.03 0.10 0.07 0.07 0.05 0.03 0.08 0.02 0.02 0.01 0.02 0.01 0.00
M74 0.27 N/A 0.03 0.02 0.08 0.12 0.06 0.07 0.04 0.07 0.11 0.05 0.15 0.02 0.00 0.00 0.01
M86 0.02 0.02 N/A 0.00 0.03 0.00 0.01 0.01 0.02 0.01 0.00 0.01 0.01 0.02 0.01 0.01 0.01
M95 0.02 0.18 0.15 N/A 0.04 0.05 0.05 0.01 0.18 0.00 0.08 0.00 0.00 0.06 0.03 0.04 0.03
M101 0.07 0.01 0.07 0.09 N/A 0.09 0.00 0.10 0.02 0.03 0.05 0.05 0.01 0.03 0.00 0.01 0.02
M123 0.05 0.01 0.06 0.06 0.06 N/A 0.17 0.03 0.03 0.02 0.06 0.01 0.02 0.01 0.02 0.01 0.01
M141 0.01 0.03 0.01 0.04 0.06 0.07 N/A 0.04 0.02 0.01 0.03 0.03 0.01 0.01 0.02 0.00 0.00
M187 0.07 N/A N/A N/A 0.02 0.11 0.10 N/A 0.15 0.01 0.05 0.06 0.06 0.02 0.00 0.04 0.00
M189 0.03 0.01 0.05 0.07 0.05 0.05 0.05 0.01 N/A 0.02 0.04 0.02 0.02 0.00 0.01 0.03 0.00
M225 0.04 0.04 0.02 0.04 0.09 0.03 0.05 0.08 0.02 N/A 0.03 0.00 0.07 0.21 0.02 0.01 0.02
M251 0.03 0.10 0.01 0.01 0.03 0.04 0.01 0.01 0.03 0.01 N/A 0.01 0.05 0.01 0.01 0.00 0.00
M323 0.00 0.03 0.04 0.05 0.02 0.05 0.00 0.00 0.04 0.16 0.04 0.01 0.12 N/A 0.08 0.00 0.02
M354 0.07 0.03 0.09 0.05 0.06 0.16 0.14 0.13 0.04 0.02 0.13 0.03 0.17 0.09 N/A 0.11 0.08
M392 0.07 0.02 0.01 0.03 0.02 0.03 0.01 0.00 0.03 0.03 0.01 0.01 0.01 0.01 0.01 N/A 0.05
M394 0.01 0.02 0.02 0.06 0.05 0.08 0.06 0.04 0.04 0.10 0.06 0.00 0.04 0.00 0.01 0.11 N/A
One interesting fact revealed by this chemical shift analysis is that in the spectra for Met74Ile,
Met86Ile, and Met95Ile, the peaks for Met6 and Met187 have different chemical shifts than the
same peaks in the other spectra. In fact, they align with the second peak that arises in the other
six spectra. This implies the existence of a second conformational state that is repressed in the
WT enzyme yet prominent when certain mutations are made.

20
The high fidelity (Gly64Ser)RdRp mutant
Another interesting development was the isolation of the Gly64Ser mutation, isolated by
Kirkegaard and Pfieffer, which substantially increased the fidelity of the viral RdRp32
. A 1H,
13C
HSQC was obtained for this mutant version of the protein by Dr. Xiaorong Yang. What is
particularly interesting with this mutant is that it is able to impact the fidelity of the enzyme
although Gly64 is distal from the active site (Figure 2.3).
The idea of a second conformational state is further supported by information obtained
from the Gly64Ser mutation. The resonance for Met6 in the HSQC of Gly64Ser has a chemical
shift that nearly matches the second peak that arises in the six aforementioned cases where two
peaks were found (Figure 2.4). This is the same phenomenon that we observe in the HSQC
spectra for Met74Ile, Met86Ile, and Met95Ile regarding Met6. It remains unknown whether this
second conformation, induced by the Gly64Ser mutation, has any impact on the activity or
fidelity of the enzyme.

21
Figure 2.3 – Location of Gly64 in relation to the active site and functionally
important motifs. Motifs A-G are labeled green, blue, red, yellow, purple, black,
and orange respectively. Gly64 is shown in pink.
The wild type spectrum overlaid with the Gly64Ser spectrum is shown in Figure 2.4. It is
particularly interesting that while the peak for Met6 in Gly64Ser is of a different chemical shift
than the one in the wild type spectrum, there appears to be no significant chemical shift
difference in Met187. In the spectrum where two resonances were observed for Met6 (Figure
2.1), two peaks were also observed for Met187. However, in Gly64Ser RdRp, Met6 takes the
alternative chemical shift while Met187 remains the same. In addition, chemical shift
differences exist for the resonances of Met74, Met86, and Met354. This suggests that the
Gly64Ser mutation causes a conformational or flexibility change that is different from what is
seen emerging in Figure 2.1.

22
Figure 2.41H,
13C HSQC spectra for WT (black), G64S (red), and Met323Ile (blue). This
methionine to isoleucine mutant is one of six that causes two peaks to occur for Met6 and
Met187. While one of these aligns with the WT, the other exhibits a completely different
chemical shift. Met6 is blown up in the lower right to illustrate the positions of each peak
relative to each other.
The relative intensities of each of the two peaks for Met6 and Met187 were investigated in each
spectra where they were notably affected. The relative peak intensities of the peaks should be
related to the proportion of protein in each of the associated conformations. In the six Met to Ile
mutants that gave two peaks, the distribution was either 50/50 or 60/40 in favor of the “wild
type” resonance (Table 3). However, mutation of Met74, Met86 and Met95 resulted in the
predominance of the second set of peaks, and hence a strong shift towards the second protein

23
conformation. As suggested before, this could mean there are two possible protein
conformations with one predominating under wild
type conditions while the Gly64Ser mutation might introduce a third possible conformation. In
agreement with this finding, 13
CH3 R2 relaxation dispersion studies by Dr. Yang suggested that
there was conformational exchange on the µs-ms timescale associated with the Met6, Met187
and Met189 resonances consistent with two potential conformations (data not shown).
Table 2.3 Relative intensities of both resonances for Met6 and Met187 in WT and mutant RdRp
spectra.
Met6 Met187
Resonance 1 Resonance 2 Resonance 1 Resonance 2
Wild Type ~100% 0% ~100% 0%
Met74Ile 0% ~100% 0 ~100
Met86Ile 0% ~100% 0 ~100
Met95Ile 0% ~100% 0 ~100
Met141Ile 59.7% 40.3% 59.7% 40.3%
Met187Ile 54.1% 45.9% N/A N/A
Met189Ile 60.2% 39.8% 59.3% 40.7%
Met251Ile 47.1% 52.9% 37.2% 62.8%
Met323Ile 66.1% 33.9% 66.5% 33.5%
Met354Ile 67.9% 32.1% 65.3% 34.7%

24
These conformational changes are certainly interesting, but it was the effects of the Gly64Ser
mutation that proved to be the most interesting. As previously mentioned, this residue is distant
from the active site and most functional motifs yet impacts the chemical shifts of distal
methionine residues including Met74, Met86, and Met354. In an attempt to understand this
phenomenon, the structure of the wild type poliovirus RdRp in its free state was examined more
closely. One possibility is that the motif B loop Met286 resides on interacts with Gly64 and
transfers the effect of the mutation to other regions of the protein (Figure 2.5). For example, one
end of this loop is in Van der Waals contact with Met187 through Ser291 while the other end is
involved in hydrogen bonds with the N-terminal β strand, which may explain why Met6 and
Met187 are so often conformationally coupled. Gly64 hydrogen bonds with Ala239 and Leu241
(motif A) and with Gly285 of motif B. Moreover, the equivalent Gly to Ser mutation (Gly62Ser)
in FMDV RdRp altered the structure of this loop, which in turn affected RNA binding44
. It is
possible that changes to the structure or dynamics of this loop, such as in the Gly64Ser mutation,
may impact the function or fidelity of the RdRp.

25
Figure 2.5 – The Dynamic loop in poliovirus RdRp may transfer the effects of the
Gly64Ser mutation to other parts of the protein through a series of internal interactions.
The flexible loop is in yellow while residues are labeled as G64 (red), Met74 (green),
Met86 (purple), Met286 (orange), Met299 (magenta), and Met354 (blue).
Conclusion
RNA dependent RNA polymerases are critical to the replication of the RNA genome in
positive strand RNA viruses. The RdRp of poliovirus is ~52kDa, large by NMR standards, but
possesses a good distribution of Met residues for affordable selective amino acid labeling. These
Met were labeled with 13
C at the terminal methyl group and assignments were made by preparing
a series of single point mutation mutants. This assignment strategy unexpectedly revealed a
wealth of new information about the protein. Six Met to Ile mutations were discovered that
generated two resonances for Met6 and Met187 in the 1H,
13C HSQC spectra. In each of these
cases, one peak matches the chemical shift of its respective peak in the wild type spectrum while
the other matches the chemical shift of its respective peak in the Gly64Ser mutant spectrum.
This implied the existence of two protein conformations such that one was predominant under
wild type conditions, but mutation of distal Met could result in significant changes to the
conformational equilibrium.

26
Another surprise was the complete lack of any peak for Met286 and Met299. This can be
understood by examining the structure of the protein and noting that these residues reside on a
flexible loop in motif B. It is possible that by being on this loop they are subject to intermediate
exchange and signal broadening. More importantly, this loop may be involved in transferring the
effects of the Gly64Ser mutation to distant residues in the protein and may even play a role in
how this mutation impacts the fidelity of the active site based on its position in the protein.
Examination of the chemical shifts for each spectrum also provided some new
information. Numerous significant differences in chemical shifts between the wild type and Met
to Ile mutations were observed and highlighted yellow in Tables 2B and 2C. For many of these
highlighted differences, the relevant peak is distant from the methionine residue that was
mutated. All of this suggests the existence of a long range network of internal interactions that
may play important roles in coordinating enzyme function and regulation.

27
Chapter Three
Introduction
One powerful way to further explore protein dynamics and important interactions in
proteins is through molecular dynamics simulations. These take ensemble averages for physical
parameters (like binding potentials, nonbonding interactions, and potential energy) and attempt
to predict how each atom in the protein will move44
. Ideally, the ensemble averages would
approximate the time averages of the system for each parameter, and we can observe what the
motion of the protein most likely looks like. While these are capable of determining fs-ns
timescale motions, the longer timescale motions (ms or higher) would be much more
computationally expensive44
.
Previously, Dr. Ibrahim Moustafa in the Cameron lab has carried out molecular dynamics
simulations on the poliovirus and related RdRps. Importantly, his results support the idea of an
internal network of interactions. A positive correlation between two residues in these studies
indicates that the two residues move in the same direction during the simulation while a negative
correlation indicates they are displaced in opposite directions. All possible combinations of two
residues and their correlations are summarized in the dynamic cross correlation map (DCCM),
which uses a scale from red (positive correlation) to purple (negative correlation) to describe the
motion of the protein within the simulation (Figure 3.1). Naturally, a residue will have a positive
correlation with itself and probably with nearby residues, so a diagonal positive correlation
throughout the map is to be expected. One interesting find (labeled I) is that some form of
positive correlation exists between motifs A and motif D, as well as between the fingers and
thumb domain (labeled II). The positive correlation between motifs A and D make sense
because both are predicted to be involved in nucleotidyl transfer. The thumb and finger domains

28
are both involved in transferring between the proposed open and closed conformation, so a
positive correlation there makes sense as well. Similar results were observed for other viral
RdRps (data not shown).
Figure 3.1 – Dynamic Cross Correlation map (DCCM) assembled from
Dr. Moustafa’s molecular dynamics simulation data for poliovirus RdRp.
The red and orange depict varying degrees ofpositive correlation in
displacement as defined by the scale on theright. Blue and dark blue
depict negative correlation in displacementbetween residues.
Careful analysis of the MD simulations from the viral RdRps suggested a network of correlated
motions that may be important for the function of the enzyme (Figure 3.2). Intriguingly, this
network included residues on the N-terminal β-strand containing Met6, the α-helix containing
Met187 and Met189, Met354 and Gly64. Thus, these results are consistent with the network we
identified in Chapter 2. To test the importance of this network, Dr. Moustafa mutated residues
(e.g. Leu97Ala, Asp266Ala, Leu50Ala, and Val42Leu/Leu50Val) predicted to be on the
network but distant from the active site, and assayed for changes to enzyme activity (Table 3.1).

29
Figure 3.2 – An illustration of Ibrahim’s proposed
network of correlated interactions within the protein.
The black circles represent residues that are a part of this
network.
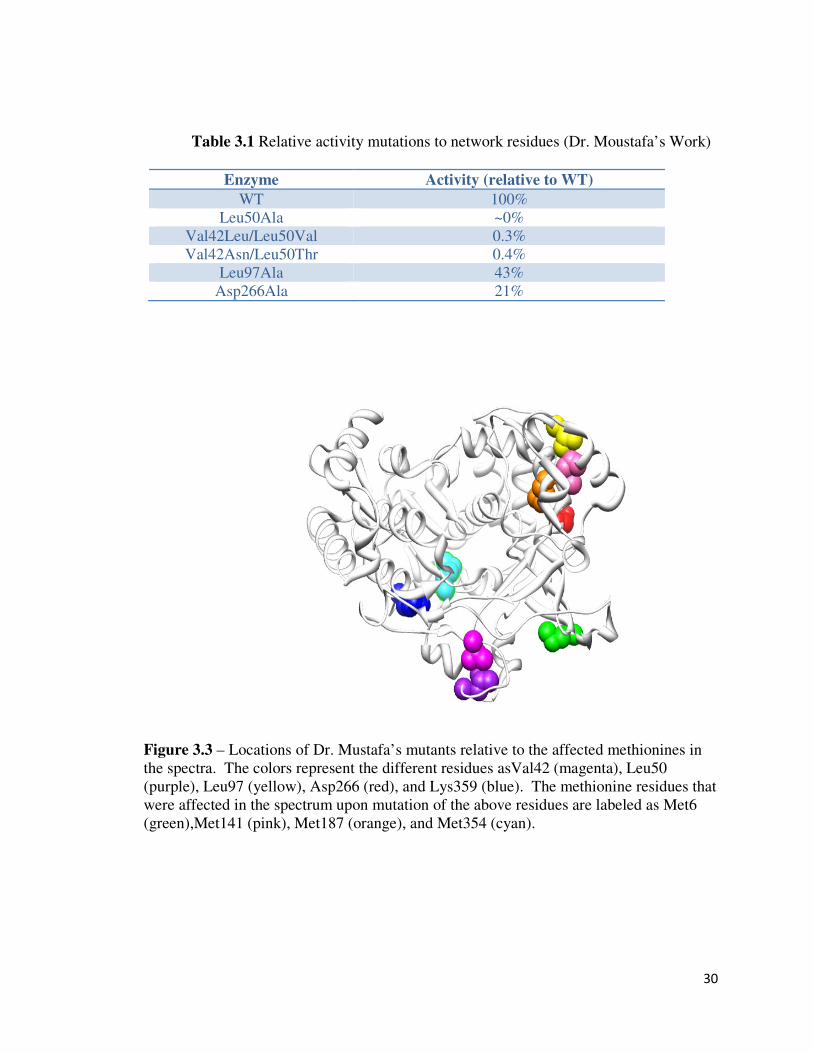
For example, mutation of Leu50Ala results in a substantial decrease in enzyme activity despite
the fact that this residue is distant from the active site (Table 3.1). Leu50 makes van der Waals
contact with Val42, and both residues are predicted to be involved in the correlated network.
Initially, it was predicted that the double mutation (Val42Leu/Leu50Val) would restore the
proper packing of these residues and thus restore the network and enzyme activity; however, this
was clearly not the case (Table 3.1). These results are very surprising since it suggests a subtle
change to this interaction can result in major changes to enzyme activity, again being distant
from the active site.
30
Table 3.1 Relative activity mutations to network residues (Dr. Moustafa’s Work)
Enzyme Activity (relative to WT)
WT 100%
Leu50Ala ~0%
Val42Leu/Leu50Val 0.3%
Val42Asn/Leu50Thr 0.4%
Leu97Ala 43%
Asp266Ala 21%
Figure 3.3 – Locations of Dr. Mustafa’s mutants relative to the affected methionines in
the spectra. The colors represent the different residues asVal42 (magenta), Leu50
(purple), Leu97 (yellow), Asp266 (red), and Lys359 (blue). The methionine residues that
were affected in the spectrum upon mutation of the above residues are labeled as Met6
(green),Met141 (pink), Met187 (orange), and Met354 (cyan).

31
These findings are especially interesting as they strongly support the idea of an internal dynamic
network. It is therefore prudent to explore this network in order to better understand its effects
on the activity and fidelity of the enzyme.
Materials & Methods 32
P Labeled UTP Enzyme Activity Assay. Radioactive 32
P (labeled at a phosphate) was used in
conjunction with a poly-A template to evaluate the activity of various mutants. Assay buffer
consisted of 50mM HEPES (pH 7.5), 5mM MgCl2, 1mM β-mercaptoethanol, 2µM dT15, 0.1µM
poly-A template, 0.5mM unlabeled UTP, and 60µM ZnCl2. Ten µCi/µL of the 32
P UTP was
then added to each 45µL sample of buffer and placed in a 37oC hotpad. Samples were initiated
with 5µL of a 2µM protein solution. Five microliters were removed and added to 5µL of EDTA
to quench the reaction at four time points for each reaction. Five microliters of each quench
solution was dropped onto Whatman paper, dried, and rinsed with a sodium phosphate buffer.
The radioactivity of each sample at each time point was measured by scintillation counter.
NMR Acquisition. The protocol for protein purification and NMR acquisition strategy are
described in Chapter 2. The intensities of each peak in each methionine to isoleucine spectrum
were recorded and the percent activity relative to Met86 and Met251 (two internal standards)
was calculated for each of these peaks as well. An average percentage and standard deviation for
each peak in these spectra was calculated for both internal standards. Large deviations in
intensity from the standard deviation were then observed and Z scores were calculated to gauge
the statistical reliability of the data.

32
Results and Discussion
Investigation of activity mutants
Analysis of the MD simulations suggested there was a network of amino acids that might
be important for the function and/or fidelity of poliovirus RdRp. To complement, Dr. Moustafa’s
enzyme assays, we wanted to investigate whether the mutations on the network resulted in any
any structural and/or dynamic changes that would correlate with their loss in activity. In
addition, an undergraduate whom I supervised, Dave Lum generated the Lys359Met mutant in
order to investigate the structure, dynamics, and importance of the Lys359 residue. This lysine
acts as a general acid that donates a proton to the pyrophosphate leaving group of nascent NTP,
making it a better leaving group27-29
. Our aim was to impose an additional methionine to that
position to probe its local dynamics. 1H,
13C HSQC spectra were recorded for each mutant to see
if our probes would experience any changes in flexibility or chemical environment. For the
double mutant, Val42Leu/Leu50Val, there were chemical shift changes relative to the wild type
for the peaks corresponding to Met74, Met187, Met354, and Met394. This is very important
because it suggests (minor) structural changes throughout the protein induced by the double
mutation. It is possible that these mutations somehow disrupted the network in order to disrupt
these distant methionine residues. Perhaps, an even more interesting find was the complete
disappearance of the Met6 peak in this spectrum. As per Chapter 2, Met6 can undergo
conformational exchange. Most likely, the Val42Leu/Leu50Val mutation induces a change in the
kinetics of the conformational exchange processes, such that exchange is now on the
intermediate timescale that would result in peak broadening and a severe loss in peak intensity.
In addition to the extra resonance in Lys359Met RdRp, the mutation exhibited the same
chemical shift deviation for the Met354 peak that Val42Leu/Leu50Val, but otherwise agrees

33
with the wild type spectrum. There were two resonances for Met187, similar to what has been
observed in five other Met to Ile mutations discussed in Chapter 2, but only the wild type peak
for Met6. These two residues had been conformationally coupled in previous mutations. The
resonance for the new Met in the 359 position is especially intense and possesses a chemical shift
equivalent to that of free methionine, likely because it is solvent exposed. The remaining
network mutants showed fewer changes in their spectra relative to the wild type enzyme.
Asp266Ala RdRp showed only a minor chemical shift change for Met187 while Asp266Asn
RdRp did not show any significant difference compared to the WT spectrum.. It is possible that
changes may have been caused by these mutants that are not visible by means of our Met probes.
Lastly, Leu97Ala showed minor chemical shift changes for Met141 and Met354. These spectra
are all shown in Figure 3.4.
A

34
Figure 3.4 - 1H,
13C HSQC spectra of each activity mutant compared to the wild type.
WT (black), Val42Leu/Leu50Val (magenta), and Lys359Met (blue)are compared in A).
Asp266Ala (green) and Asp266Asn (red) in B) andLeu97Ala (yellow) in C).
B
C

35
Enzyme assays for Met to Ile mutant RdRp. In Chapter 2, I showed that some of the Met to Ile
mutations resulted in interesting spectral differences compared to WT RdRp. We were interested
in also determining if these structural and/or dynamic changes resulted in any functional
changes. As such, 32
P UTP incorporation enzyme assays were carried out for each mutant and
compared to the wild type activity. In each case, the activity diminished relative to the wild type
enzyme for each mutant RdRp. The “fold difference” or “fold change” was calculated by
dividing the wild type activity for that experiment by the mutant activity for that experiment at
the same time point (Figure 3.5).
Figure 3.5 – The fold decrease in activity for each of the six methionine to
isoleucine mutations discussed in the previous chapter. The fold difference was
the average ratio of WT to mutant activity. As such, higher fold changes
represent greater drops in activity for that mutant.
Met86Ile RdRp showed an 8.7 fold difference relative to the wild type, which is a sizable
drop in activity relative to the wild type. Although this residue is solvent exposed, it also resides
in the interior of anα helix in the fingers domain. Perhaps more interestingly, Met141Ile and
Met187Ile provide the largest drops in activity out of all six mutants (~14 fold and ~4.8 fold
0
2
4
6
8
10
12
14
16
Met86Ile Met141IleMet187IleMet189IleMet251IleMet323IleMet354Ile
Ra
te W
T /
Ra
te M
uta
nt

36
respectively) while the remaining four show lower levels of diminished activity. While only 10-
20 fold drops in activity are considered to be significant for these preliminary assays, these
results are still interesting. It is known that Arg188 interacts with the α phosphate of the nascent
NTP during elongation42
. It is possible that the nearby Met187Ile mutation interferes with the
function of Arg188, thus reducing the activity of the protein. It is unclear why Met141Ile causes
such a substantial drop in activity relative to the other mutants. Interestingly, MD simulations
predict that the Thr138Met,Lys139His double mutant leads to numerous dynamic changes in the
active site (Janna Maranas, unpublished work). Given the proximity of Met141 to these
residues, it is possible that the Met141Ile mutation has a similar effect, and this might explain its
substantial decrease in enzyme activity.
Network analysis through changes in NMR resonance peak intensities
Results presented in Chapter 2 and this Chapter suggested that there is a network of
amino acids present in poliovirus RdRp that can alter the structure, dynamics and/or function of
the enzyme. Experimental methods to look at amino acid networks include monitoring changes
to hydrogen deuterium exchange or fluorescence induced by protein mutation45-46
. Amino acid
networks have been also been studied by NMR35-36
, by observing structural and/or dynamic
changes induced by various mutations. NMR observables that have been monitored include
chemical shift changes, as we have done in Chapter 2 and this Chapter, and changes to the T1, T2
and/or heteronuclear Overhauser effect (hetNOE) that report on ps-ns timescale dynamics35-36
.
While there is a potential to measure differences in T1, T2 and/or hetNOE for WT and mutant
enzymes, as Dr. Yang has previously done for the Gly64Ser mutation47
, this can also be very
time consuming. As an alternative, we decided to simply compare peak intensities between WT

37
and the various mutations we have generated. Significant changes in peak intensities would be a
first qualitative indication of potential changes in structural dynamics induced by the mutation.
For example, lower peak intensities might be indicative of intermediate exchange on the NMR
time scale. If necessary, a more rigorous analysis of dynamic changes through T1/T2/hetNOE
analysis and/or R2 relaxation dispersion experiments could be conducted at a later time.
One major obstacle to this study was that the concentrations of the RdRp proteins were
not carefully controlled at the time of NMR data collection. However, even small changes to
protein concentrations could result in major changes to peak intensities. To help solve this
problem, the peak intensities were compared to an ‘internal standard.’ In our case, we decided to
compare the other peak intensities to either the resonance for Met251 or Met86 (i.e. IN/IMet251 or
IN/IMet86). The rationale was that Met86 and Met251 are both highly solvent exposed (see
Chapter 2), and so, it was unlikely that mutations elsewhere would significantly affect the
chemical environment and/or dynamics of these probes. Moreover, having two independent
internal standards helped to counter the possibility that intensity changes to the internal standard
would give false positives elsewhere. To compare peak intensities, the average and standard
deviations for the relative peak intensities (either IN/IMet86 or IN/IMet251) were calculated for each
individual resonance by using the data for all the various spectra. One major advantage of this
approach is it took advantage of all the spectra we collected, and thus allowed us to gauge the
overall variability in peak intensities across sample preparations, enzymes and concentrations.
We believe this is a much more robust approach than simple comparison of WT and mutant peak
intensities. The Tables below summarize what was observed. A single “+” indicates an intensity
that lies outside the standard deviation (σ) for that peak while “++” denotes an intensity
difference greater than 1.5σ (note again, the standard deviation is calculated across the WT and

38
mutant enzymes). In addition, z values were calculated to determine the statistical reliability of
the intensity data, and the absolute values are reported in separate tables. Values greater than
1.50 (a difference greater than 1.5σ) are highlighted in yellow and indicate considerable
variation.
Table 3.2 Significant differences in resonance intensities when using Met86 as the internal
standard.
M6I M74I M86I M95I M101I M123I M141I M187I M189I M225I M251I M286I M299I M323I M354I M392I M394I
6 +
74 + 86
95 ++ 101 + ++
123 141 +
187 + 189 + +
225 + + 251 +
323 + 354 + +
392 + + 394 + + + +
Table 3.3 Z Values (absolute value) for intensity values with the Met86 internal standard
M6I M74I M86I M95I M101I M123I M141I M187I M189I M225I M251I M286I M299I M323I M354I M392I M394I
6 N/A 0.20 N/A 0.04 0.39 0.54 0.40 0.40 0.12 0.43 0.50 1.23 0.02 0.29 0.68 0.43 0.17
74 1.09 N/A N/A 0.87 0.07 0.66 0.41 0.00 0.16 0.44 0.03 0.85 0.44 0.12 0.42 0.32 0.08
86 0.00 0.00 N/A 0.00 0.00 0.00 0.00 0.00 0.00 0.00 0.00 0.00 0.00 0.00 0.00 0.00 0.00
95 1.52 0.50 N/A N/A 0.06 0.65 0.64 0.38 0.35 0.26 0.33 0.83 0.04 0.16 0.52 0.53 0.08
101 0.30 0.25 N/A 1.04 N/A 0.48 2.31 0.20 0.54 0.11 0.01 0.35 0.42 0.52 0.69 0.35 0.01
123 0.54 0.13 N/A 0.61 0.37 N/A 0.84 0.04 0.02 0.18 0.09 0.93 0.86 0.85 0.06 0.75 0.27
141 1.36 0.57 N/A 0.72 0.13 0.53 N/A 0.01 0.02 0.40 0.03 0.77 0.05 0.03 0.74 0.43 0.09
187 0.35 0.02 N/A 0.09 0.03 0.53 0.72 N/A 0.21 0.46 0.63 1.23 0.05 0.05 0.21 0.22 0.26
189 1.00 0.17 N/A 1.26 0.39 0.58 0.48 0.41 N/A 1.20 0.28 0.54 0.60 0.89 0.07 0.86 0.46
225 1.14 0.30 N/A 1.10 0.21 0.75 0.19 0.04 0.05 N/A 0.16 0.80 0.15 0.26 0.43 0.33 0.14
251 0.17 0.28 N/A 0.35 0.29 0.52 0.39 0.25 0.26 0.60 N/A 1.11 0.05 0.10 0.09 0.39 0.01
323 1.05 0.37 N/A 0.76 0.09 0.47 0.08 0.27 0.03 0.09 0.57 0.96 0.26 N/A 0.60 0.35 0.15
354 1.05 0.18 N/A 0.57 0.52 0.66 0.40 0.20 0.29 0.04 0.54 1.03 0.06 0.02 N/A 0.34 0.27
392 1.02 0.02 N/A 0.78 0.13 0.61 0.68 0.03 0.77 1.42 0.16 0.61 0.03 0.21 0.67 N/A 0.87
394 1.23 0.39 N/A 1.10 0.24 0.58 0.70 0.06 0.40 1.33 0.03 0.38 1.87 0.13 0.28 1.22 N/A

39
Table 3.4 Significant Differences in resonance intensities when using Met251 peak as an
internal standard
M6I M74I M86I M95I M101I M123I M141I M187I M189I M225I M251I M286I M299I M323I M354I M392I M394I
6 + + + + ++
74 ++ ++ ++ + 86 ++ + + +
95 ++ + ++ 101 ++
123 ++ ++ ++ 141 + + ++
187 ++ ++ + ++ 189 + + ++ ++ + +
225 ++ ++ + 251 +
323 ++ ++ + + + ++ 354 ++ + + ++ + +
392 + + + + ++ ++ 394 ++ ++ + ++ +
Table 3.5 Z values (absolute values) for intensity values with the Met251 internal standard
M6I M74I M86I M95I M101I M123I M141I M187I M189I M225I M251I M286I M299I M323I M354I M392I M394I
6 N/A 1.32 1.16 0.38 0.75 0.27 1.23 0.96 0.08 0.13 N/A 0.61 0.10 0.84 2.19 0.22 0.34
74 2.15 N/A 0.54 1.56 0.94 0.20 0.22 0.97 1.56 0.43 N/A 0.61 1.00 0.03 1.26 0.23 0.22
86 0.65 0.65 N/A 0.97 0.70 1.88 1.14 0.53 0.59 1.37 N/A 1.89 0.12 0.00 0.49 1.07 0.29
95 3.02 0.53 0.90 N/A 1.21 0.30 0.67 0.27 0.14 0.60 N/A 0.43 0.11 0.08 1.35 0.27 0.25
101 0.01 0.07 0.18 0.78 N/A 0.23 3.52 0.07 0.29 0.52 N/A 0.65 0.39 0.46 0.77 0.20 0.10
123 0.77 0.42 0.33 0.71 1.82 N/A 1.31 0.78 0.67 0.59 N/A 0.16 1.77 1.71 0.28 0.65 0.59
141 2.51 0.64 0.53 0.91 0.71 0.37 N/A 0.95 1.04 0.50 N/A 0.69 0.06 0.25 1.86 0.04 0.21
187 0.52 0.67 1.66 0.62 0.65 0.87 2.15 N/A 0.19 0.18 N/A 0.56 0.21 0.10 1.05 1.56 0.70
189 1.21 1.12 0.47 1.95 1.65 0.16 0.03 0.25 N/A 0.51 N/A 0.87 1.01 1.49 0.12 0.47 0.75
225 1.79 0.01 0.21 2.16 1.45 0.61 0.74 0.79 0.88 N/A N/A 0.74 0.32 0.47 1.25 0.32 0.18
251 0.00 0.00 0.00 0.00 0.00 0.00 0.00 0.00 0.00 0.00 N/A 0.00 0.00 0.00 0.00 0.00 0.00
323 2.12 0.27 0.75 1.40 0.74 0.29 1.21 0.02 1.02 1.01 N/A 0.28 0.57 N/A 1.76 0.10 0.42
354 2.32 0.19 0.35 1.08 1.06 0.97 0.24 0.04 1.91 1.36 N/A 0.09 0.15 0.27 N/A 0.15 0.70
392 1.35 0.69 0.65 1.01 1.11 0.02 0.65 0.57 1.18 0.83 N/A 0.94 0.04 0.30 1.56 N/A 1.60
394 1.67 0.04 0.31 1.57 1.47 0.31 0.47 0.88 1.71 0.69 N/A 1.14 3.46 0.00 0.70 1.02 N/A
This study provides a lot of very interesting information that is complimentary to the chemical
shift analysis provided in Chapter 2. Recall that there is a substantial 1H chemical shift change
that occurs for Met101 for Met141Ile compared to WT RdRp. A difference in intensity greater
than 1.5σ is observed in Met101 in the presence of this mutation when using either internal
standard. It may then be possible that some structural and/or dynamic correlation exists between

40
these two residues. It is also worth noting that significant differences in the intensities for Met74
and Met95 are observed in the presence of the Met6Ile mutation (with Met251 as the internal
standard). This is interesting because we know the mutations Met74Ile, Met86Ile, and Met95Ile
result in a significant chemical shift for the Met6 peak. What is more interesting is that while
these three mutations have the same impact on the chemical shift of this peak, only Met86Ile
shows no real change in intensity. This could mean that the Met86Ile mutation has a different
effect on Met6 than the other two mutations. It is worth noting that there appears to be variation
in the analysis when Met86 or Met251 is used as the internal standard, where there appears to be
more significant changes when Met251 is used as an internal standard. In general, there is less
variation in the data when Met251 is used as an internal standard compared to Met86 as an
internal standard.
Analysis of the resonance intensity data using the Met251 internal standard offers us
some very valuable information. We already know that the mutations Met74Ile, Met95Ile,
Met141Ile, Met225Ile, and Met354Ile cause spectral changes to the Met6 peak. From this
intensity study we now see that the Met6Ile mutation causes intensity changes to these same five
residues relative to Met251, despite the fact that there were no chemical shift changes in these
residues as a result of this mutation. This strengthens the possibility of long range interactions
between Met6 and these other five residues in the protein. These results also suggest Met6
participates in long range interactions to Met392 and Met394, which reside on the thumb
domain.
Conclusion
Dr. Ibrahim has demonstrated the existence of positive and negative correlations between amino
acids throughout the protein. In addition, he has demonstrated that there are several mutations

41
that can substantially impair the activity of the enzyme. These results supported the idea of an
internal dynamic network. These mutants were examined by 1H,
13C HSQC NMR and many
changes in chemical shift were observed in these spectra. Perhaps the most interesting finding
was the complete disappearance of the Met6 peak in the Val42Leu/Leu50Val spectrum. This
could be caused by changes in the flexibility of the N-terminal β strand region resulting in
intermediate exchange and signal broadening. This suggests the possibility that these changes in
activity are the result of dynamic changes to the internal network caused by these mutations.
The six methionine to isoleucine mutations that caused two peaks for Met6 and Met187
were also assayed for changes to enzyme activity in an attempt to correlate enzyme function to
the changes we observed in the NMR spectra. The two largest drops in activity were observed
for Met141 and Met187. In the case of Met187, it is possible this drop in activity can be
attributed to the mutations impact on Arg188, which interacts with the nascent NTP. However,
the cause of the drop in activity for Met141 is still poorly understood. Unpublished work from
Janna Maranas shows that mutating residues Thr138 to Met and Lys139 to His results in a drop
in protein flexibility throughout many regions of the active site (as predicted by MD
simulations). It is thus possible that the nearby Met141 residue possesses a similar effect, though
this remains untested. Nonetheless, these results do seem to suggest a correlation between
changes to the internal dynamic network and enzyme activity.
An additional method at detecting long-range interactions made use of changes to NMR
peak intensities brought about by the various Met to Ile mutations we generated. The intensity of
any given peak is directly related to the flexibility of the protein in that region where the probe is
located. As such, it seemed like it might be possible to map out where the flexibility of the
protein changes with each mutation based on where substantial changes to the intensity were

42
observed. Two internal standards were selected to address the possibility of changes to the
internal standard impacting the remaining results. Both internal standards agree that there is a
sizable change in intensity for Met101 upon mutation of Met141, and a large 1H chemical shift
difference was observed here as well. This suggests these residues might well be structurally
and/or dynamically correlated.
43
Chapter Four
Conclusions and Future Directions
Poliovirus RdRp serves as a suitable model system for understanding the types of internal
dynamic relationships that likely exist throughout viral RdRps. The overall right hand structure
of the protein and the active site topography are conserved in these polymerases from virus to
virus. Moreover, the Gly64Ser mutation causes an increase in incorporation fidelity in the
poliovirus RdRp, which is seen again in FMDV when the corresponding Gly to Ser mutation
(Gly62Ser) is imposed44
. Therefore, it seems highly likely that discoveries made regarding these
dynamic relationships in our poliovirus model system will translate into other viral RdRp
systems as well.
The Met to Ile mutants that resulted in two peaks for Met6 and Met187 showed drops in
activity relative to the wild type and left us with the idea that these two residues might be
conformationally coupled. Conformational coupling between the N-terminal β strand and the α
helix with Met187 suggests that changes in the regional dynamics near one residue will impact
the dynamics of the other residue. This may be important to function as Arg188 is known to
interact with the α phosphate of the nascent NTP during elongation42
. Therefore, it is possible
that changing the dynamics of this α helix may impair the polymerase’s ability to stabilize the
NTP within the active site. It might be interesting to install methionine probes in the RdRps of
other viruses and see if similar mutations reveal similar coupling as this would further the idea
that these dynamic interactions are common to other viral polymerases. If so, it would be even
more interesting to carry out 32
P UTP activity assays with these mutants to see if similar declines
in activity are observed in these other viral polymerases as well.

44
In poliovirus, it would be interesting to examine the activity drop for Met141 further as
this is by far the largest activity drop present amongst the six mutants. Specifically, sym/sub
assays and pre-steady state kinetics with this mutant would lead to a better understanding of how
the activity is being impaired (i.e. – impaired binding to template or impaired incorporation of
new NTP or some other effect)28
. It would also be interesting to see if this drop in activity is
accompanied by a change in enzyme fidelity. It is possible that the same internal dynamic
network that influences the fidelity of the enzyme may also influence the activity, so I believe
such experiments could potentially be very informative.
One of the major limitations to this work is that although the methionine probes are
distributed well throughout the protein we might not be getting a clear or complete picture of
what is going on as a result of any given mutation. As such, it would be interesting to install
isoleucine, tyrosine, and/or tryptophan probes to expand our vision. These new probes may offer
us new information that is currently unseen. In fact, many activity and fidelity mutants reported
for poliovirus RdRp should be reexamined in lieu of these new probes in hopes of discerning
new information from the protein.
It is important not to underestimate the importance of dynamics in protein function. The G64S
mutation shows that although little has changed structurally, the polymerase’s fidelity has
increased considerably. In fact, this increase in fidelity attenuated the virus so much that the
Cameron lab has found it to be a suitable poliovirus vaccine in mice33
.
It has previously been suggested that dynamic networks within proteins facilitate
allosteric regulation47
that in the case of RdRp may be important for regulating RNA replication
and transcription, such as by regulating protein-protein interactions. For example, the viral

45
polymerase, 3D (=RdRp), often exists as 3CD (protease-polymerase bifunctional protein) within
the host cell. Once it binds the template RNA, 3AB binds 3CD to anchor the replication
complex prior to replication23
. It stands to reason that these protein-protein interactions likely
impact the dynamic network of the viral polymerase and thereby influence its function. Because
these protein-protein interactions are present at the replication complex during replication it
would seem necessary to understand the effects of these interactions on the dynamic network in
order to more completely understand the role of the network on the function of the polymerase.
Of course, the ability of a protein to readily undergo conformational changes is dependent upon
its internal dynamics as a certain degree of flexibility is often required for the process48,49
. As
such, it is widely accepted that a protein’s function is largely related to dynamics50
.
Several other methods exist to look for amino acid networks in proteins. Fluorescence
correlation spectroscopy (FCS) and scanning FCS (sFCS) can be used to investigate the protein
dynamics on the µs to s timescale for GFP labeled proteins51
. These methods monitor changes in
fluorescent intensity within a measurement volume of a few femtoliters. These changes are
attributed to Brownian motion and diffusion, so it stands to reason this method could be used to
monitor molecular flexibility on this timescale. Another method is hydrogen/deuterium
exchange, which monitors the rate of exchange throughout the protein by NMR or mass
spectroscopy. Since the protein’s conformational state and flexibility both impact the rate of
exchange, this method can be used to track changes in the protein’s dynamics as a result of
mutation, protein-protein interactions, or allosteric regulation52
. These methods would
complement NMR studies.
The better we understand how these dynamic networks affect the function of the
polymerase, the better able we will be to exploit them for antiviral drug and vaccine

46
development. The Cameron lab has already demonstrated how a high fidelity mutant, Gly64Ser,
can be used to attenuate the virus for the application of a poliovirus vaccine. If the dynamic
networks of other viral polymerases resemble that of our model RdRp, similar attenuations might
be worth investigating for other untreatable conditions. Moreover, it is possible that these amino
acid networks evolved for the purpose of facilitating allosteric regulation. If this is the case, it
would greatly aid drug development efforts to determine how any given protein/small molecule
interaction would affect the dynamic network of the protein.

47
REFERENCES
1 Rekand, T.; Gramstad, A.; and Vedeler, CA. (2009). “Fatigue, pain and muscle weakeness
are frequent after Guillain-Barre syndrome and poliomyelitis.” Journal of Neurology,
vol. 256, no. 3, pgs. 349 – 354.
2 Laffont, I.; Julia, M.; Tiffreau, V.; Yelnik, A.; Herisson, C.; and Pelissier, J. (2010).
“Aging and sequelae of poliomyelitis.” Annals of Physical and Rehabilitation Medicine,
vol. 53, no. 1, pgs. 24 – 33.
3 Nte, A.R. and Frank-Briggs Al. (2009). “Acute flaccid paralysis: a misdiagnosis of
poliomyelitis.” Nigerian Journal of Medicine, vol. 18, no. 1, pgs. 110 – 112.
4 Vander Top, Elizabeth; Gentry-Nielson, Martha; Knoop, Floyd C. (2011). “Poliomyelitis.”
XPharm, The Comprehensive Pharmacology Reference, pgs. 1-4.
5 Duintjer, Tebbens; Radboud, J.; Pallansch, Mark A.; Alexander, James P.; and Thompson,
Kimberly M. (2010). “Optimal vaccine stockpile design for an eradicated disease:
Application to polio.” Vaccine, vol. 28, issue 26, pgs. 4312 – 4320.
6 Hogle, James M. (2002). “Poliovirus Cell Entry: Common Structural Themes in Viral Cell
Entry Pathways.” Annual Reviews in Microbiology, vol. 56, pgs. 680 – 702.
7 Lin, Jing-Yi; Chen, Tzu-Chun; Weng, Kuo-Feng; Chang, Shih-Cheng; Chen Li-Lien; and
Shih, Shin-Ru. (2009). “Viral and host proteins involved in picornavirus life cycle.”
Journal of Biomedical Science, vol. 16, no. 103, pgs.
8 Sabahi, Ali. (2009). “Hepatitis C Virus entry: the early steps in the viral replication cycle.”
Virology, vol. 6, pgs. 117.
9 Pawlotsky, Jean-Michael; Chevaliz, Stephane; and McHutchenson, John G. (2007).
“The Hepatitis C Virus Life Cycle as a Target for New Antiviral Therapies.” Reviews in
Basic and Clinical Gastroenterology, vol. 132, pgs. 1979 – 1998.
10 Joachims, M.; Harris, K.S.; and Etchison D. (1995). “Poliovirus protease 3C mediates
cleavage of microtubule-associated protein 4.” Virology, vol. 211, pgs. 451 – 461.
11 Seipelt, J.; Liebig, H.D.; Sommergruber, W.; Gerner, C.; and Kuechler E. (2000). “2A
proteinase of human rhinovirus cleaves cytokeratin 8 in infected HeLa cells.” Journal of
Biological Chemistry, vol. 275, pgs. 20084 – 20089.
12 Barco A. and Carrasco L. (1995). “A human virus protein, poliovirus protein 2BC,
induces membrane proliferation and blocks the exocytic pathway in the yeast Saccharomyces
cerevisiae.” EMBO Journal, vol. 16, pgs. 3349 – 3364.

48
13 Sandovol, I.V. and Carrasco L. (1997). “Poliovirus infection and expression of the
poliovirus protein 2B provoke the disassembly of the Golgi complex, the organelle target
for the antipoliovirus drug Ro-090179.” Journal of Virology, vol. 71, pgs. 4679 – 4693.
14 vanKuppeveld, Frank J.M.; Galama, Jochem M.D.; Zoll, Jan; van den Hurk, Patrick J.J.C.;
and Melchers, Willem J.G. (1996). “Coxsackie B3 Virus Protein 2B Contains a Cationic
Amphipathic Helix That Is Required for Viral RNA Replication.” Journal of Virology,
vol. 70, no. 6, pgs. 3876 – 3886.
15 Thompson, A.A.; Albertini, R.A.; and Peerson, O.B. (2007). “Stabilization of
poliovirus Polymerase by ATP binding and fingers-thumb interactions.” Journal of
Molecular Biology, vol. 366, pgs. 1459 – 1474.
16 Ruebsam, Frank; et. al. (2008). “Pyrrolo [1,2–b]pyridazin-2-ones as potent inhibitors
of HCV NS5B polymerase.” Bioorganic & Medicinal Chemistry Letters, vol. 18,
pgs. 3616 – 3621.
17 Campagnola, Grace; Weygandt, Mark; Scoggin, Kirsten; and Peerson, Olve. (2008).
“Crystal Structure of Coxsackievirus B3 3Dpol Highlights the Functional Importance
of Residue 5 in Picornavirus Polymerases.” Virology, vol. 82, no. 19,
pgs. 9458 – 9464.
18 Ferrer-Orta, Cristina; Arias, Armando; Escarmis, Cristina; and Verdauger, Nuria.
(2006). “A comparison of viral RNA-dependent RNA polymerases”. Current Opinion
in Structural Biology, vol. 16, pgs. 27 – 34.
19 Sabaadzovic, Sead; Ghanem-Sabanadzovic, Nina Abou; and Gorbalenya,
Alexander E. (2009). “Permutation of the active site of putative RNA-dependent
RNA Polymerase in a newly identified species of plant alpha-like virus.”
Virology, vol. 394, pgs. 1 – 7.
20 McDonald, Sarah M.; Tao, Yizhi J.; and Patton, John T. (2009). “The ins and outs of
four-tunneled Reoviridae RNA-dependent RNA polymerases.” Current Opinion in
Structural Biology, vol. 19, pgs. 775 – 782.
21 Cameron, Craig E.; Moustafa, Ibrahim M.; and Arnold, Jamie J. (2009). “Dynamics:
the missing link between structure and function of the viral RNA-dependent RNA
polymerase?” Current Opinion in Structural Biology, vol. 19, pgs. 768 – 774.
22 K.-S., Kenneth; Arnold, Jamie J.; and Cameron, Craig E. (2008). “Structure-Function
Relationships Among RNA-Dependent RNA Polymerases.” Current Topics in
Microbiology and Immunology, vol. 320, pg. 149.

49
23 Strauss, Daniel M.; Glustrum, Leslie W.; and Wuttke, Deborah S. (2003). “Towards an
Understanding of the Poliovirus Replication Complex: The Solution Structure of the Soluble
Domain of the Poliovirus 3A Protein.” Journal of Molecular Biology, vol. 330,
pgs. 225 – 234.
24 Andino, Raul; Rieckhof, Gabrielle E.; Achacoso, Philip L.; and Baltimore, David. (1993).
“Poliovirus RNA synthesis utilizes an RNP complex formed around the 5’ end of the
viral RNA.” The EMBO Journal, vol. 12, no. 9, pgs. 3587 – 3598.
25 Arnold, Jamie J.; Ghosh, Saikat Kumar B.; and Cameron, Craig E. (1999).
“Poliovirus RNA-Dependent RNA Polymerase (3Dpol). Journal of Biological
Chemistry, vol. 274, no. 52, pgs. 37060 – 37063.
26 Freistadt, Marion S.; Vaccaro, Joseph A.; and Eberle, Karen E. (2007). “Biochemical
characterization of the fidelity of poliovirus RNA-dependent RNA polymerase”.
Virology, 4:44.
27 Arnold, Jamie J. and Cameron, Craig E. (2000). “Poliovirus RNA-Dependent RNA
Polymerase (3Dpol).” Journal of Biological Chemistry, vol. 275, no. 8, pgs. 5329 –
5321.
28 Castro, Christian; Arnold, Jamie J.; and Cameron, Craig E. (2004). “Incorporation
fidelity of the viral RNA-dependent RNA polymerase: a kinetic, thermodynamic and
structural perspective.” Virus Research, vol. 107, pgs. 141 – 143.
29Gohara, David W.; Arnold, Jamie J.; and Cameron, Craig E. (2004). “Poliovirus
RNA-dependent RNA Polymerase (3Dpol): Kinetic, Thermodynamic, and Structural
Analysis of Ribonucleotide Selection.” Biochemistry, vol. 43, pgs. 5149 – 5158.
30 Arnold, Jamie J.; Gohara, David W.; and Cameron, Craig E. (2004). “Poliovirus
RNA-dependent RNA Polymerase (3Dpol): Pre Steady-State Kinetic Analysis of
Ribonucleotide Incorporation in the Presence of Mn2+.” Biochemistry, vol. 43,
pgs. 5138 – 5140.
31Vignuzzi, M.; Stone, J.K.; Arnold, Jamie J.; Cameron, Craig E.; and Andino R.
(2006). “Quasispecies diversity determines pathogenesis through cooperative
interactions in a viral population.” Nature, vol. 439, pgs. 344 – 348.
32 Pfieffer, Julie K. and Kirkegaard, Karla. (2003). “A single mutation in poliovirus RNA
Dependent RNA Polymerase confers resistance to mutagenic nucleotide analogs via
increased fidelity.” PNAS, vol. 100, no. 12, pgs. 7289 – 7294.
33Vignuzzi, Marco; Wendt, Emily; and Andino, Raul. (2008). “Engineering attenuated
virus vaccines by controlling replication fidelity.” Nature Medicine, vol. 14, pgs. 154 –
161.

50
34Marcotte, L.L.; Wass, A.B.; Gohara, D.W.; Pathak, H.B.; Arnold, J.J.; Filman, D.J.;
Cameron, C.E.; and Hogle, J.M. (2007). “Crystal structure of poliovirus 3CD protein:
virally encoded protease and precursor to the RNA-dependent RNA polymerase.”
pgs. 3583 – 3596.
35 Wider, Gerhard. (2005). “NMR Techniques Used with Very Large Biological
Macromolecules in Solution.” Methods in Enzymology, vol. 394, pgs. 382 – 398.
36 Venters, Ronald A.; Thompson, Richelle; and Cavanagh, John. (2002). “Current
approaches for the study of large proteins by NMR.” Journal of Molecular Structure,
vol. 602 – 603, pgs. 275 – 292.
37 Marcotte, L.L.; Gohara, D.G.; Filman, D.J.; Hogle, J.M. (2007). “Crystal Structure of the
Poliovirus RNA-Dependent RNA Polymerase Fidelity Mutant 3Dpol G64S.” Journal of
Virology, vol. 81, pgs. 3583 – 3596.
38 Studier, F.W. (2005). “Protein production by auto-induction in high density shaking
cultures.” Protein Expression and Purification, vol. 41, pgs. 207 – 234.
39 Arnold, J.J.; Bernal, A.; Uche, U.; Sterner, D.E.; Butt, T.R.; Cameron, C.E.; and Mattern,
M.R. (2006). “Small ubiquitin-like modifying protein isopeptidase assay based on
poliovirus RNA polymerase activity.” Analytical Biochemistry, vol. 350, pgs. 214 – 221.
40 Arnold, J.J.; Ghosh, S.K.; and Cameron, C.E. (1999). “Poliovirus RNA-Dependent RNA
Polymerase (3D(pol)). Divalent cation modulation of primer, template, and nucleotide
selection”. Journal of Biological Chemistry, vol. 274, pgs. 37060 – 37069.
41 Gohara, D.W.; Ha, C.S.; Kumar, S.; Ghosh, S.K.; Arnold, J.J.; Wisniewski, T.J.; and
Cameron, C.E. (1999). “Production of “authentic” poliovirus RNA-dependent RNA
polymerase (3D(pol)) by ubiquitin-protease-mediated cleavage in Escherichia coli.”
Protein Expression and Purification, vol. 17, pgs. 128 – 138.
42 Love, Robert A.; Maegley, Karen A.; Yu, Xiu; Ferre, Rose-Ann; Lingardo, Laura K.; Diehl,
Wade; Parge, Hans E.; and Fuhrman, Shella A. (2004). “The Crystal Structure of the RNA
Dependent RNA Polymerase from Human Rhinovirus A Dual Function Target for Common
Cold Antiviral Therapy.” Structure, vol. 12, no. 8, pg. 1533.
43 Ferrer-Orta, C; Sierra, M.; de la Higuera, I.; Agudo, R.; Arias, R.; Perez-Luque, R.; Escarmis,
C.; Domingo, E.; and Verdaguer, N. (2010). “Structure of foot-and-mouth disease virus
mutant polymerases with reduced sensitivity to ribavirin”. Journal of Virology, vol. 84,
pgs. 6188 – 6199.
44 Zwier, Matthew and Chong, Lillian T. (2010). “Reaching biological timescales with all-atom
molecular dynamics simulations.” Current Opinion in Pharmacology, vol. 10, no. 6,
pgs. 745 – 752.

51
45 Engen, John R. (2009). “Analysis of Protein Conformation and Dynamics by
Hydrogen/Deuterium Exchange MS”. Journal of Analytical Chemistry, vol. 81, no. 19,
pgs 7870 – 7875.
46 Day, Richard N. and Schaufele, Fred. (2008). “Fluorescent protein tools for studying protein
dynamics in living cells: a review. Journal of Biomedical Optics, vol. 13, no. 3.
47 Yang, Xiaorong; Welch, Jesse L.; Arnold, J.J.; and Boehr, David D. (2010). “Long range
interaction networks in the function and fidelity of poliovirus RNA dependent RNA
polymerase as studied by nuclear magnetic resonance spectroscopy.” Biochemistry,
vol. 49, no. 43, pgs. 9361 – 9371.
48 Bahar, Ivet; Channubhotla, Chakra; and Toby Dror. (2007). “Intrinsic dynamics of proteins
in the unbound state and relation to allosteric regulation.” Current Opinion in Structural
Biology, vol. 17, no. 6, pgs. 633 – 640.
49 Li, M.; Smith, C.J.; Walker, M.T.; and Smith, T.J. (2009). “Novel inhibitors complexed
with glutamate dehydrogenase: allosteric regulation by control of protein dynamics.”
Journal of Biological Chemistry, vol. 284, no. 34, pgs. 22988 – 30000.
50 Lin, Tu Liang and Song Guang. (2010). “Generalized spring tensor models for protein
fluctuation dynamics and conformation changes.” BMC Structural Biology, vol. 10.
51 Petrasek, Zdenek; Ries, Jonas; and Schwille, Petra. (2010). “Chapter 15 – Scanning FCS
for the Characterization of Protein Dynamics in Live Cells.” Methods in Enzymology,
vol. 472, pgs. 317 – 343.
52 Engen, John R. (2009). “Analysis of Protein Conformation and Dynamics by
Hydrogen/Deuterium Exchange MS”. Analytical Chemistry, vol. 81, no. 19,
pgs. 7870 – 7875.