the importance of innate resistance genes in respiratory
TRANSCRIPT
i
The Importance of Innate
Resistance Genes in
Respiratory Syncytial Virus
Replication in Airway Epithelial
Cells
Thesis submitted in accordance with the requirements of the
University of Liverpool for the degree of Master of Philosophy
(MPhil) by
Louise J Apperley
August 2012

ii
Acknowledgments
Throughout the entirety of my MPhil project, there have been a number of
individuals that provided me with continuous support and encouragement that I
would like to express thanks. I would firstly like to acknowledge the support
from my primary project supervisor Paul McNamara who has helped guide and
review my project over the course of the past year. I am also extremely grateful
for the support and assistance that Brian Flanagan has given me, particularly
with helping me understand my results and findings. I appreciate the time and
patience that both supervisors have given towards my project and am very
thankful for the potential future prospects that they have both provided me
with.
A special thanks goes to Professor R Tripp (University of Georgia, Atlanta) for
providing me with a platform to undertake my study. Without his identification
of selected genes, this study would not be possible. I also greatly appreciate
the protocol and reagents that he has provided for the initial stages of this
project.
A particular thanks also goes to David Fawkner-Corbett for assisting me with
any questions I had regarding the write-up of my project.
I would also like to acknowledge the help given to me by Deborah Howarth
and Caroline Broughton who have mentored and supported my laboratory
work during my time in the Duncan and Apex buildings. Having undertaken this
project with no previous laboratory experience, their patience and assistance
has been invaluable to the success of this project. I also appreciate the help
given to me by Angela Fonceca, who has supported me with my laboratory
work throughout my time at Alder Hey Hospital.
I would finally like to thank the laboratory teams at the Duncan and Apex
buildings as well as the institute staff at Alder Hey Hospital. They made my
time in the laboratories extremely enjoyable and assisted me with the many
queries that I had.

iii
Abstract
Introduction: Respiratory Syncytial Virus (RSV) is a leading cause of lower respiratory symptoms in infants, the elderly and the immunosuppressed worldwide. Approximately 70% of children become infected with RSV during their first year of life, and by the age of three almost all children will have been exposed to the virus. Approximately 2-3% of RSV infected infants require hospital admission. The aims of my MPhil project were as follows:
To determine whether I could ‘knockdown’ using siRNA, the expression of 26 innate resistance genes in airway epithelial cells, previously known to limit influenza..
To determine which genes provide protection against both influenza and RSV, by infecting ‘knockdown’ cultured epithelial cells with RSV, and measuring viral replication and RSV N gene expression.
To further investigate the significance of these results by focusing on three of these genes in more detail.
Methods: SiRNA was used to knockdown genes in A549 cell cultures. They were infected with RSV A2 strain two days after siRNA transfection, and a further two days later, mRNA was extracted and isolated from the cells. These samples were reverse transcribed, and RSV N gene expression analysed through real-time PCR. Further study on genes required the use of antibody staining, fluorescent-labelled RSV and confocal microscopy. Results: Initially, PCR assays were optimised and quantitative, and RSV concentration was standardised. Efficiency of siRNA reagent was proved with gene expression knocked down > 60%. Following RSV infection of these knocked down cultures, 20/26 genes were found to up-regulate RSV N gene expression after their gene expression had been reduced. Two genes (RNF168 and RFFL) caused a large increase in RSV expression after knockdown and so were investigated further as well as, UBE2G2, an associated protein, identified through an online database. Unfortunately, the impressive changes in RSV replication previously seen on knocking down RNF168 and RFFL could not be repeated, and UBE2G2 was found to have little effect on RSV replication. GPR34, which when knocked down caused morphological changes on light microscopy, was also studied further using red fluorescent-labelled RSV and antibodies. This protein was found to be located around the periphery of the cell and possibly around the nucleus, with protein knockdown causing blebbing of the cell membrane. Discussion: This work has shown that 20/26 genes previously reported to offer some protection against influenza, also provide some protection against RSV. These findings further our understanding of the pathogenesis of RSV disease, and highlight possible avenues for future therapeutic research. These might involve increasing expression of these 'innate resistance genes' in the respiratory epithelium.
iv
Abbreviations
AAP - American Academy of Paediatrics
APC - Antigen Presenting Cells
ASC – Antibody Secreting Cells
BSA - Bovine Serum Albumin
CCA - Chimpanzee Coryza Agent
CCR7 - Chemokine (C-C Motif) Receptor 7
CF - Cystic Fibrosis
CHD - Congenital Heart Disease
CLD - Chronic Lung Disease
CLR - C-type Lectin Receptors
CNOT4 - CCR4-NOT Transcription Complex, Subunit4
CTL - Cytotoxic T Lymphocyte
CX3CR1 - Chemokine (C-X3-C motif) Receptor 1
CXCR1 - Chemokine (C-X-C motif) Receptor 1
DAMP - Damage-Associated molecular Patterns
DC - Dendritic Cells
DMEM - Dulbecco's Modified Eagle Medium
DNA - Deoxyribonucleic Acid
DSRNA - Double Stranded RNA
ECP - Eosinophil Cationic Protein
FCS - Foetal Calf Serum
GAG - Glycoaminogylcans
GPR34 - G Protein-Coupled Receptor 34
HPA - Health Protection Agency

v
HRH2 - Histamine Receptor H2
HRH4 - Histamine Receptor H4
IFN - Interferon
IFNAR 1 and 2 - Interferon α/β receptor 1 and 2
Ig - Immunoglobulin
IL - Interleukin
IRF - Interferon Regulatory Transcription Factor
ISG - Interferon-Stimulated Gene
JAK1 - Janus Kinase 1
LRR Leucine-Rich Repeat
LRTI - Lower Respiratory Tract Infection
MAP3K1 - Mitogen Activated Kinase Kinase Kinase 1
MARCH6 - Membrane-Associated Ring Finger (C3HC4) 6
MHC - Major Histocompatibility Complex
MRNA - Messenger RNA
NF-ҡB - Nuclear Factor Kapper B
NK (T) - Natural Killer (T) Cells
NLR - Nucleotide Oligomerisation Domain (NOD)-Like Receptors
NS1 and NS2 - Non-Structural Genes
OR - Odds Ratio
ORF - Open Reading Frame
PAMPs - Pathogen-associated Molecular Patterns
PBS - Phosphate Buffered Saline
PCGF5 - Polycomb Group Finger 5
PCR - Polymerase Chain Reaction
PHF21A - PHD Finger Protein 21A

vi
PICU - Paediatric Intensive Care Unit
PPM1H - Protein Phosphatase, Mg2+/Mn2+ Dependent, 1H
PRRs - Pattern Recognition Receptors
RANTES - Regulated on Activation, Normal T Cell Expressed, and Presumably
Secreted
RAD18 - RAD18 Homolog
RCPCH - Royal College of Paediatrics and Child Health
RFFL - Ring Finger and FYVE-Like Domain Containing 1
RIG - Retinoic Acid-Inducible Gene
RISC - RNA - Inducing Silencing Complex
RNA - Ribonucleic Acid
RNF - Ring Finger Protein
RSV - Respiratory Syncytial Virus
RUFY1 - RUN and FYVE Domain Containing 1
SCD - Symptomatic Cardiac Disease
SiRNA - Small Interfering RNA
SP - Surfactant Proteins
STAT 1 and 2 - Signal Transducer and Activator of Transcription 1 and 2
Th1 and 2 - Helper T Lymphocyte
TLR - Toll-like Receptors
TNF - Tumour Necrosis Factor
TOPORS - Topoisomerase I Binding, Arginine/Serine Rich
Treg - T Regulatory
TRIM - Tripartite Motif Family
TYK2 - Tyrosine Kinase 2
UBE2G2 - Ubiquitin Conjugating Enzyme E2 G2
URTI - Upper Respiratory Tract Infection
vii
Table of Contents
1 Introduction ....................................................................................... 1
1.1 Respiratory Syncytial Virus (RSV) ..................................................... 1
1.1.1 Discovery of RSV ............................................................................. 1
1.1.2 Epidemiology of RSV Infection ......................................................... 2
1.1.3 Clinical Features of RSV .................................................................. 6
1.1.4 Risk Factors in RSV Infection ......................................................... 11
1.1.4.1 Premature Infants ................................................................... 11
1.1.4.2 Chronic Lung Disease of Prematurity ..................................... 11
1.1.4.3 Congenital Heart Disease ....................................................... 12
1.1.4.4 Genetic and Chromosomal Abnormalities .............................. 12
1.1.4.5 Immuno-compromise .............................................................. 13
1.1.4.6 Other Risk Factors .................................................................. 14
1.1.5 Management and Prevention of RSV Infection ............................... 14
1.2 Pathogenesis ..................................................................................... 17
1.2.1 RSV Structure and Function ........................................................... 17
1.2.2 RSV Viral Infection and Cytotoxicity ............................................... 21
1.2.3 The Immune Response to RSV ...................................................... 22
1.2.3.1 Innate Immunity ...................................................................... 23
1.2.3.2 Innate Immunity in RSV Infection............................................ 24
1.2.3.3 Adaptive Immunity .................................................................. 32
1.2.3.4 Adaptive Immunity In RSV Infection ....................................... 32
1.3 RNA Interference ............................................................................... 37
1.4 Innate Resistance Genes .................................................................. 40
1.4.1 Kinase Family ................................................................................. 43

viii
1.4.2 Phosphatase Family ....................................................................... 43
1.4.3 G Protein Coupled Receptor (GPCR) Family ................................. 44
1.4.4 E3 Subset Ubiquitin Ligase ............................................................ 46
1.4.4.1 Tripartite-Motif Protein (TRIM) Family ..................................... 49
1.5 Aims and Objectives ......................................................................... 50
2 Materials and Methodology ........................................................... 51
2.1 Cell Culture ........................................................................................ 51
2.1.1 Seeding A549 cells ......................................................................... 51
2.2 RSV Preparation ................................................................................ 51
2.2.1 RSV Propagation ............................................................................ 51
2.2.2 RSV Plaque Assay ......................................................................... 52
2.2.3 RSV Infection ................................................................................. 55
2.3 RNA Extraction and Isolation ........................................................... 55
2.3.1 Homogenising Sample ................................................................... 55
2.3.2 Phase Separation ........................................................................... 56
2.3.3 RNA Precipitation ........................................................................... 56
2.3.4 RNA Wash ...................................................................................... 56
2.3.5 Reverse Transcriptase ................................................................... 56
2.4 Real-Time Polymerase Chain Reaction ........................................... 57
2.4.1 Principles of Polymerase Chain Reaction ....................................... 58
2.4.2 Reagents and Processing the Polymerase Chain Reaction ........... 58
2.5 Innate DB ............................................................................................ 62
2.6 Statistical Analysis ............................................................................ 62
3 Validation of Candidate Innate Genes in RSV Replication using
SiRNA Transfection ............................................................................. 63
3.1 Introduction ....................................................................................... 63

ix
3.2 Methodology ...................................................................................... 63
3.2.1 SiRNA Transfection Protocol .......................................................... 63
3.2.2 RSV Dilution ................................................................................... 65
3.2.3 Analysing the Data ......................................................................... 67
3.2.3.1 Analysing Knockdown Data .................................................... 67
3.2.3.2 Analysing RSV Expression Data ............................................. 68
3.3 Results ............................................................................................... 69
3.3.1 Initial PCR Assays .......................................................................... 69
3.3.1.1 Determination of optimal RSVN-TAQ probe primer
concentration ......................................................................................... 69
3.3.1.2 Determining if the PCR assay is quantitative .......................... 69
3.3.1.3 Determination of optimal RSV concentration for use .............. 69
3.3.2 Knockdown Data ............................................................................ 74
3.3.2.1 MARCH6 ................................................................................ 74
3.3.2.2 GPR34 .................................................................................... 78
3.3.2.3 CCR7 ...................................................................................... 81
3.3.2.4 CNOT4 ................................................................................... 84
3.3.2.5 TRIM15 ................................................................................... 87
3.3.3 RSV N Gene Expression Data ....................................................... 91
3.3.3.1 GCPR Family Data ................................................................. 91
3.3.3.2 Ubiquitin E3 Ligase ................................................................. 98
3.3.4 Overview of Knockdown Data ...................................................... 107
3.3.4.1 Kinase Family ....................................................................... 107
3.3.4.2 Phosphatase Family ............................................................. 108
3.3.4.3 GCPR Family ........................................................................ 110
3.3.4.4 Ubiquitin E3 Ligase ............................................................... 111
3.4 Discussion ....................................................................................... 117
x
3.4.1 Optimisation of PCR Assay .......................................................... 117
3.4.2 Determination of the amount of RSV used to infect A549 cultures
117
3.4.3 Successful knockdown of gene expression by siRNA treatment. . 118
3.4.4 Influence that inhibition of gene expression has on RSV expression
118
3.4.5 Use of InnateDB to investigate pathways that may inhibit RSV
replication ..................................................................................... 119
4 The influence of UBE2G2, RFFL and RNF168 knockdown on RSV
N gene expression ............................................................................. 122
4.1 Introduction ..................................................................................... 122
4.2 Materials and Methods .................................................................... 123
4.2.1 Knockdown Protocol ..................................................................... 123
4.3 Results ............................................................................................. 123
4.3.1 Knockdown Data .......................................................................... 123
4.3.2 RSV Expression ........................................................................... 127
4.4 Discussion ....................................................................................... 131
4.4.1 Preliminary Time Course Results ................................................. 132
5 GPR34 ............................................................................................ 135
5.1 Introduction ..................................................................................... 135
5.2 Methods ............................................................................................ 135
5.2.1 Red fluorescent- labelled RSV Infection ....................................... 135
5.2.2 Microscopic Slide Production ....................................................... 136
5.2.3 GPR34 Antibody Staining ............................................................. 136
5.2.4 Confocal Microscope .................................................................... 137
5.3 Results ............................................................................................. 137
5.3.1 Morphological changes under light microscope ............................ 137

xi
5.3.2 A549 infection with Red-Fluorescent-labelled RSV ...................... 142
5.3.3 Results from GPR34 Antibody ...................................................... 144
5.4 Discussion ....................................................................................... 148
6 Final Discussion ........................................................................... 150
6.1 Validation of Innate Resistant Genes in RSV Replication using
SiRNA Transfection ................................................................................. 151
6.2 Further studies of RFFL and RNF168, and identification of
UBE2G2 .................................................................................................... 152
6.3 RSV and RNAi .................................................................................. 153
6.4 Morphological changes caused by GPR34 ................................... 154
6.5 Further investigations for RNF168 ................................................. 156
References ................................................................................................... 158

xii
List of Tables
Table 1-1: Name and details of E3 subset ubiquitin ligases ............................ 41
Table 2-1: Product details for other probe assays ........................................... 60
Table 2-2 A table showing temperature cycle used for amplification.
Recommended by Applied Biosystems. ......................................... 61
Table 3-1: Volumes of reagents for RNA isolation ........................................... 65
Table 3-2: Components and quantities (per well) for PCR preparation to
optimise RSVN-TAQ probe primer ................................................. 70
Table 3-3: Ct values for both L32 and MARCH6 probe in both MARCH6 and
Control knockdown A549 cells ....................................................... 75
Table 3-4: Calculations required showing the percentage of MARCH6 present
in the MARCH6 knockdown A549 cells .......................................... 76
Table 3-5: Ct values for both L32 and GPR34 probe in both GPR34 and
Control knockdown A549 cells. ...................................................... 78
Table 3-6: Calculations required showing the percentage of GPR34 present in
GPR34 knockdown A549 cells. ...................................................... 79
Table 3-7: Ct values for both L32 and CCR7 probe in both CCR7 and Control
knockdown A549 cells .................................................................... 81
Table 3-8: Calculations required showing the percentage of CCR7 present in
the CCR7 knockdown A549 cells ................................................... 82
Table 3-9: Ct values for both L32 and CNOT4 probe in both CNOT4 and
Control knockdown A549 cells ....................................................... 84
Table 3-10: Calculations required showing the percentage of CNOT4 present
in the CNOT4 transfected A549 cells ............................................. 85
Table 3-11: Ct values for both L32 and TRIM15 probe in both TRIM15 and
Control knockdown A549 cells ....................................................... 87
Table 3-12: Calculations required showing the percentage of TRIM15 present
in the TRIM15 knockdown A549 cells............................................. 88

xiii
Table 3-13: The PCR Ct values and averages for GPR34 transfected A549
cells over three experiments, compared to the Control .................. 92
Table 3-14: Conversion from PCR Ct values to percentage of RSV expression
within GPR34 knockdown A549 cells, compared to the Control ..... 93
Table 3-15: The average RSV expression percentage in relation to the control
when GPR34 siRNA is used to transfect A549 cells....................... 94
Table 3-16: The PCR ct values and averages for CCR7 transfected A549 cells
over three experiments, compared to the control ........................... 95
Table 3-17: Conversion from PCR ct values to percentage of RSV expression
within CCR7 transfected A549 cells, compared to the control ........ 96
Table 3-18: The average RSV expression percentage in relation to the control
when CCR7 siRNA is used to transfect A549 cells ........................ 97
Table 3-19: The PCR ct values and averages for CNOT4 knockdown A549
cells over three experiments, compared to the control ................... 98
Table 3-20: Conversion from PCR ct values to percentage of RSV expression
within CNOT4 knockdown A549 cells, compared to the control ..... 99
Table 3-21: The average RSV expression percentage in relation to the control
when CNOT4 siRNA is used to transfect A549 cells .................... 100
Table 3-22: The PCR ct values and averages for MARCH6 transfected A549
cells over three experiments, compared to the control ................. 101
Table 3-23: Conversion from PCR ct values to percentage of RSV expression
within MARCH6 knockdown A549 cells, compared to the control 102
Table 3-24: The average RSV expression percentage in relation to the control
when MARCH6 siRNA is used to transfect A549 cells ................. 103
Table 3-25: The PCR ct values and averages for TRIM15 transfected A549
cells over three experiments, compared to the control ................. 104
Table 3-26: Conversion from PCR ct values to percentage of RSV expression
within TRIM15 knockdown A549 cells, compared to the control ... 105
Table 3-27: The average RSV expression percentage in relation to the control
when TRIM15 siRNA is used to transfect A549 cells.................... 106

xiv
Table 3-28: Average percentage of RSV Expression, after three experiments,
when MAP3K1 of Kinase Family is transfected in A549 cells. ...... 107
Table 3-29: Average percentage of RSV expression, after three experiments,
when PPM1H of Phosphatase Family is transfected in A549 cells
..................................................................................................... 109
Table 3-30: Average percentage of RSV expression, after three experiments,
when genes of GCPR Family are knocked down in A549 cells .... 110
Table 3-31: Average percentage of RSV expression, after three experiments,
when genes of Ubiquitin E3 Ligase Family are knocked down in
A549 cells ..................................................................................... 112
Table 4-1: Average ct values for L32, RFFL, RNF168 and UBE2G2 expression
in knockdown A549 cells over six experiments ............................ 124
Table 4-2: Calculation steps from ct values to percentage of remaining gene
expression within A549 cells for RFFL, RNF168 and UBE2G2. ... 125
Table 4-3: The ct values and averages for the gene expression of RFFL,
RNF168 and UBE2G2 in knockdown cells, related to control. ...... 128
Table 4-4: RSV expression for each experiment, after knockdown, and the
subsequent average value. .......................................................... 130
xv
List of Figures
Figure 1-1: Seasonal and Yearly Variation of RSV Bronchiolitis Case Reports 4
Figure 1-2: Weekly Variation of RSV Bronchiolitis by Age of Patient ................ 5
Figure 1-3: Abnormal Chest X-Ray caused by RSV Bronchiolitis...................... 8
Figure 1-4: Alder hey Children's hospital Bronchiolitis Care Pathway ............... 9
Figure 1-5: RSV Proteins and Gene Map ........................................................ 18
Figure 1-6: Toll-Like Receptor Signalling ........................................................ 26
Figure 1-7: Interferon Signalling Pathway ....................................................... 29
Figure 1-8: Lymphocyte Differentiation ............................................................ 35
Figure 1-9: Structure of siRNA ........................................................................ 38
Figure 1-10: SiRNA (and microRNA) pathway ................................................ 39
Figure 1-11: Ubiquitin Proteosome System ..................................................... 48
Figure 2-1: RSV plaques formed during the plaque assay protocol. ............... 54
Figure 2-2: Primers used for PCR-based RSV (N Gene) detection ................. 60
Figure 3-1: PCR analysis of different RSVN-TAQ primer concentrations ........ 71
Figure 3-2: Five RSV concentrations detected by RSV primers analysed on
PCR ................................................................................................ 72
Figure 3-3: RSV expression at different RSV titrations in infected A549 cells . 73
Figure 3-4: The percentage of MARCH6 remaining within MARCH6
knockdown A549 cells, compared to the control ............................ 77
Figure 3-5: The percentage of GPR34 remaining within GPR34 knockdown
A549 cells, relative to the control .................................................... 80
Figure 3-6: The percentage of CCR7 remaining within CCR7 knockdown A549
cells, compared to the control ......................................................... 83
Figure 3-7: The percentage of CNOT4 remaining within CNOT4 transfected
A549 cells, relative to the control .................................................... 86

xvi
Figure 3-8: The percentage of TRIM15 remaining within TRIM15 knockdown
A549 cells, compared to the control ............................................... 89
Figure 3-9: The average values for each specific gene expression in
transfected A549 cells .................................................................... 90
Figure 3-10: A graph to show the percentage RSV expression when infected
A549 cells are transfected with GPR34 siRNA, compared to the
control. ............................................................................................ 94
Figure 3-11: A graph to show the % RSV expression when infected A549 cells
are transfected with CCR7 siRNA, compared to the control. .......... 97
Figure 3-12: A Graph to show the % RSV expression when infected A549 cells
are transfected with CNOT4 siRNA, compared to the control. ..... 100
Figure 3-13: A graph to show the % RSV expression when infected A549 cells
are transfected with MARCH6 siRNA, compared to the control. .. 103
Figure 3-14: A graph to show the % RSV expression when infected A549 cells
are transfected with TRIM15 siRNA, compared to the control. ..... 106
Figure 3-15: Average percentage of RSV expression of MAP3K1 transfected
A549 cells in relation to the control ............................................... 108
Figure 3-16: Average percentage of RSV Expression of PPM1H knockdown
A549 cells in relation to the control ............................................... 109
Figure 3-17: Average percentage of RSV expression from A549 cells
transfected with siRNA from the GCPR family, relative to the control
..................................................................................................... 111
Figure 3-18: Average percentage of RSV expression from A549 cells
transfected with siRNA from the Ubiquitin E3 Ligase Family, relative
to the control ................................................................................. 113
Figure 3-19: Average percentage of RSV expression from A549 cells
transfected with siRNA from the Ubiquitin E3 Ligase Family, relative
to the control ................................................................................. 114
Figure 3-20: Average percentage of RSV expression from A549 cells
transfected with siRNA from the Ubiquitin E3 Ligase Family, relative
to the control ................................................................................. 115

xvii
Figure 3-21: RSV N gene expression for all genes knocked down by siRNA 116
Figure 3-22: The protein-protein interactions of UBE2G2 (supplied by
InnateDB) ..................................................................................... 121
Figure 4-1: Remaining gene expression within transfected cells, post-
transfection of RFFL, RNF168 and UBE2G2 ................................ 126
Figure 4-2: Average percentage RSV expression, post transfection, after six
experiments. ................................................................................. 130
Figure 4-3: Percentage UBE2G2 expression during RSV infection ............... 132
Figure 4-4: Percentage RFFL expression over a RSV time course ............... 133
Figure 4-5: Percentage RNF168 expression over a RSV time course .......... 134
Figure 5-1: Morphological changes in GPR34 knockdown A549 cells on day
two following transfection (200x magnification) ............................ 138
Figure 5-2: Comparison of infected GPR34 knockdown A549 cells, infected
non-transfected A549 cells and non-infected, non-transfected A549
cells on day five. ........................................................................... 141
Figure 5-3: Comparison of red RSV infected A549 cells that are transfected or
non-transfected with GPR34 siRNA. ............................................ 143
Figure 5-4: Higher resolution image of the red RSV infected, GPR34
transfected A549 cells .................................................................. 144
Figure 5-5: GPR34 antibody staining ............................................................ 145
Figure 5-6: Cytokeratin (control) antibody staining ........................................ 146
Figure 5-7: GPR34 antibody staining within a single cell ............................... 147
1
1 Introduction
1.1 Respiratory Syncytial Virus (RSV)
Respiratory Syncytial Virus (RSV) is a leading cause of lower respiratory
symptoms in infants, the elderly and the immunosuppressed worldwide (1-5).
It is one of two human pneumoviruses within the Paramyxoviridae family (1,
6). RSV causes bronchiolitis, a condition of infants with high hospital
admission rates, characterised clinically by fever, nasal discharge and dry,
wheezy cough (7, 8).
1.1.1 Discovery of RSV
In 1857, Eberle described an infant disease with cough, wheezing and
respiratory difficulty. Although, at the time it was unknown what caused the
illness, this is now thought to be the first clinical description of RSV infection
(9). Nearly 100 years later, Adams investigated several epidemics of serious
respiratory disease in infants with cough, dyspnoea and cyanosis. A viral
cause for these symptoms and signs was suggested following the sudden
outbreak of disease and negative bacteriology results (10, 11). In 1955,
Blount et al described copious nasal discharge and sneezing, within a group
of chimpanzees that were kept for research purposes. From this discharge
they isolated a virus that they entitled “chimpanzee coryza agent” (CCA) (12).
During this time a laboratory worker, who worked with the chimpanzees, also
fell ill with similar respiratory problems and tests showed positive CCA
antibody titres (12). In the following year, Chanock et al found that a virus
affecting infants with lower respiratory tract disease was indistinguishable
from CCA in laboratory tests. They concluded that CCA was capable of
causing human disease (13). Notably, Chanock was also able to show the
“formation of syncytia or pseudo large cells” when cultured human epithelial
cells were infected with this organism, and suggested that “Respiratory
Syncytial Virus” would be a better name than CCA (14). Chanock identified
several characteristics of RSV: 1) RSV is a leading cause of bronchiolitis and
pneumonia in infants and young children, 2) Annual epidemics during the
winter months occur and last between three and five months, 3) Almost
2
100% of children are infected with RSV by the age of four years, and 4)
Reinfection does occur later in life, but usually manifests as a milder disease
(14, 15).
1.1.2 Epidemiology of RSV Infection
RSV is a common infection. During the first year of life approximately 70% of
children become infected with RSV, and by the age of three almost all
children will have been exposed to the virus, with around 50% having been
infected more than once (1, 6, 7, 16-22). Mild RSV infection normally results
in an Upper Respiratory Tract Infection (URTI), which resolves without the
need to seek medical attention (17, 22). Severe RSV disease is due to Lower
Respiratory Tract Infection (LRTI), and in infants manifests commonly as
bronchiolitis. Hospitalisation occurs in 2-3% of all infants infected with RSV
(18, 22-24). Hospital admission rates due to RSV have increased over the
last few decades, with the peak age of admission being between 2.5 and 4
months (6, 7, 25, 26). Krishnan reported that morbidity is highest during the
first six months of life, and that infection under two months of age is rare (17).
USA figures show that of the children hospitalised with bronchiolitis, 15-35%
require admission to paediatric intensive care unit (PICU) and 9% are in need
of mechanical ventilation (7, 23). In the UK, Crowcroft et al investigated
admission length of stay for RSV-infected infants in five London PICUs. The
mean duration of ventilation was 4.4 days, the length of admission in PICU,
8.6 days and length of hospitalisation, 15.9 days (27). The highest proportion
of children needing HDU/PICU care had predisposing conditions such as
congenital heart disease and chronic lung disease secondary to prematurity.
Graham reported that every year over 30 million children under the age of
five are infected with RSV globally, with over three million of these needing
hospitalisation (6). Fortunately Bronchiolitis-associated deaths are relatively
rare in the developed world. However, worldwide, RSV is responsible for
approximately 160,000 deaths annually for children under the age of five (7,
8, 28). In the UK, bronchiolitis mortality rates have dropped from 21.47 per
100,000 live-births to 1.82 per 100,000 live-births, between 1979 and 2000
(29). The RSV-attributed winter mortality rate for infants secondary to

3
respiratory causes, averaged over eleven winters, were 2.9 per 100,000
cases, relative to 8.4 per 100,000 cases for all causes (29). In the USA,
120,000 infants are hospitalised with RSV infection each year, with a post-
neonatal mortality rate, due to RSV, of 2.0 per 100,000 live-births. The
annual economic impact of RSV infection in infants in the USA is 600-750
million USD (1, 7, 15, 22, 28, 29).
Predictable seasonal RSV epidemics and consequent cases of bronchiolitis
are found globally. The disease occurs annually, but the exact months vary
slightly each year and between the different countries. In the Northern
Hemisphere including the UK and Northern Europe, RSV cases peak
annually in the winter months, usually between December and January. In
the USA, infection begins during late December in the South, spreading
throughout, and finally finishing in the Midwest. RSV rates peak throughout
the cool dry season in South America and South Africa, which is comparable
to tropical areas located north of the Equator, where the epidemic is during
the cool rainy season. In temperate climates RSV infection tends to be
highest during the winter months, with the exception of Hong Kong, where it
peaks during spring or summer (29).
As RSV bronchiolitis is predominantly a paediatric condition, the impact of
RSV disease in the elderly is easily overlooked. Although this is not a focus
of this thesis, it is worth noting that in the USA, RSV causes 12,000 to 14,000
deaths annually and hospitalises 200,000 to 400, 000 over-65 year olds (4,
6).
Figure 1.1 shows the yearly and seasonal variation of RSV bronchiolitis case
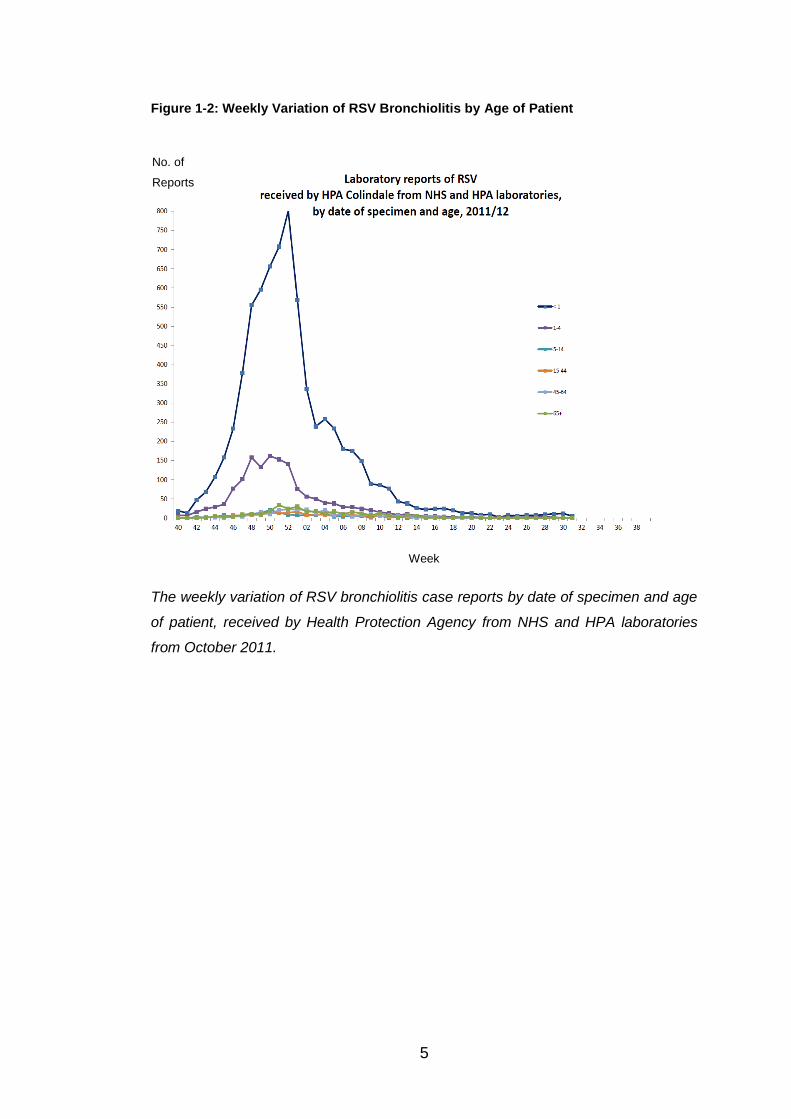
reports received from England and Wales. Figure 1.2 illustrates the weekly
variation of RSV bronchiolitis cases by the date of the specimen and the age
of the patient.

4
Figure 1-1: Seasonal and Yearly Variation of RSV Bronchiolitis Case Reports
The seasonal and yearly variation of RSV bronchiolitis case reports received by the
Health Protection Agency Collindale of Infections between 1991 and 2012, four
weekly, in England and Wales.
No. of
Reports
Year
5
Figure 1-2: Weekly Variation of RSV Bronchiolitis by Age of Patient
The weekly variation of RSV bronchiolitis case reports by date of specimen and age
of patient, received by Health Protection Agency from NHS and HPA laboratories
from October 2011.
No. of
Reports
Week

6
1.1.3 Clinical Features of RSV
RSV is known to cause a broad spectrum of disease, which can vary from
mild coryzal symptoms to life-threatening bronchiolitis and pneumonia (1,
30). Almost all infants and young children will initially present with the signs
and symptoms of a mild URTI. The three most common symptoms include
cough, rhinorrhoea and a low-grade fever (19, 26, 31-33).
Zuccotti and Manoha both undertook prospective studies to investigate the
clinical symptoms present in RSV infected infants and children. Zuccotti's
study was based in two paediatric clinics in the hospitals associated with
University of Milan, Italy, and took place for one year from December 2008,
involving children aged 0 to 15 years (31). Manoha's trial began in December
2002 and was completed in April 2004, retrieving participants under the age
of two, from the Paediatric Emergency Care Unit in the Hospital of Dijon,
France (32).
Zuccotti found that 100% of the patients (n=178) had cough and rhinorrhoea,
whereas Manoha’s patients (n=238), 73.1% had a cough and 68.9%
rhinorrhoea. Fever and feeding difficulties were respectively reported in 71%
and 68% of patients by Zuccotti and in 37.8% and 55.9% in Manoha (31, 32).
Other features reported were wheeze, feeding difficulties and sneezing (19,
26, 29, 33). Usually these symptoms resolved within weeks, with the most
common acute complications of an RSV bronchiolitis being acute otitis media
and apnoea (29).
Approximately 40-50% of infants infected with RSV develop lower respiratory
tract signs and symptoms but most of these children remain relatively well.
However, 4-5% do develop more severe lower respiratory symptoms and
signs that include apnoea, hypoxia, respiratory difficulty (shallow, rapid
breathing, nasal flaring, grunting, tracheal tug and intercostal recession),
head bobbing and characteristic cough (6, 19, 33-35).
A diagnosis of bronchiolitis is usually made by looking for the presence of the
above signs and symptoms, and for the characteristic fine inspiratory
crackles and/or high pitched expiratory wheeze heard on auscultation (35).
Investigations are often not needed apart from confirmation of RSV status for
7
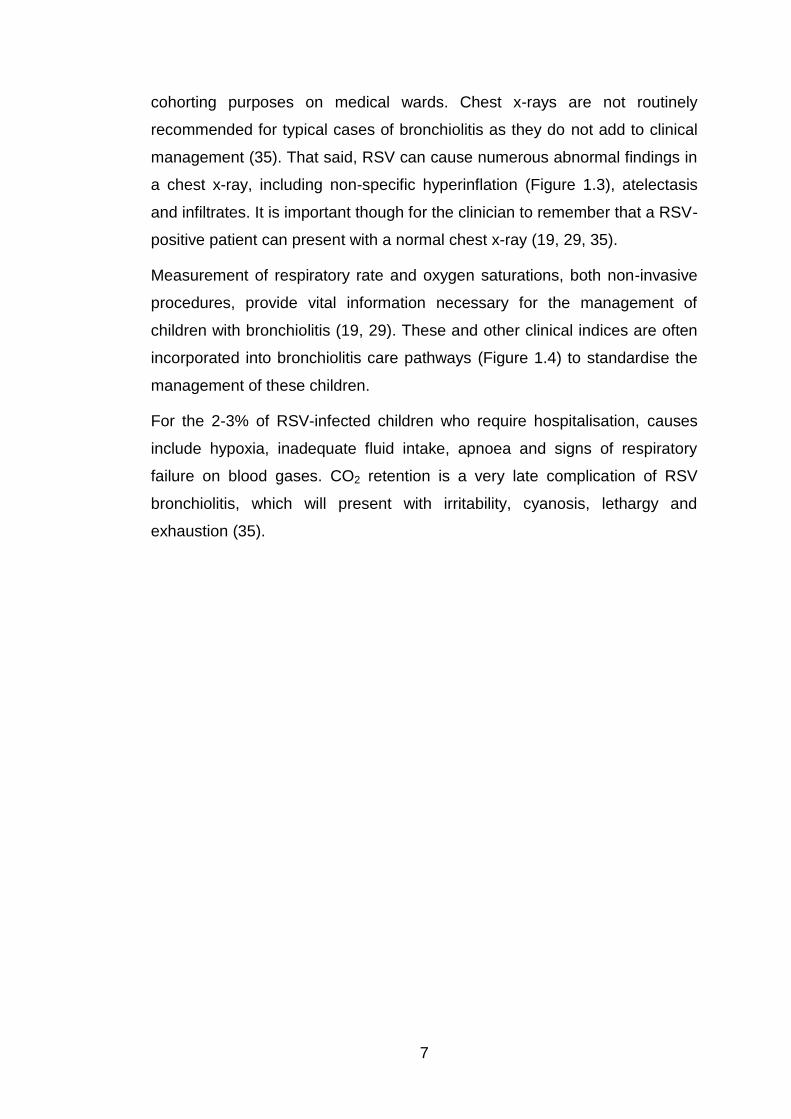
cohorting purposes on medical wards. Chest x-rays are not routinely
recommended for typical cases of bronchiolitis as they do not add to clinical
management (35). That said, RSV can cause numerous abnormal findings in
a chest x-ray, including non-specific hyperinflation (Figure 1.3), atelectasis
and infiltrates. It is important though for the clinician to remember that a RSV-
positive patient can present with a normal chest x-ray (19, 29, 35).
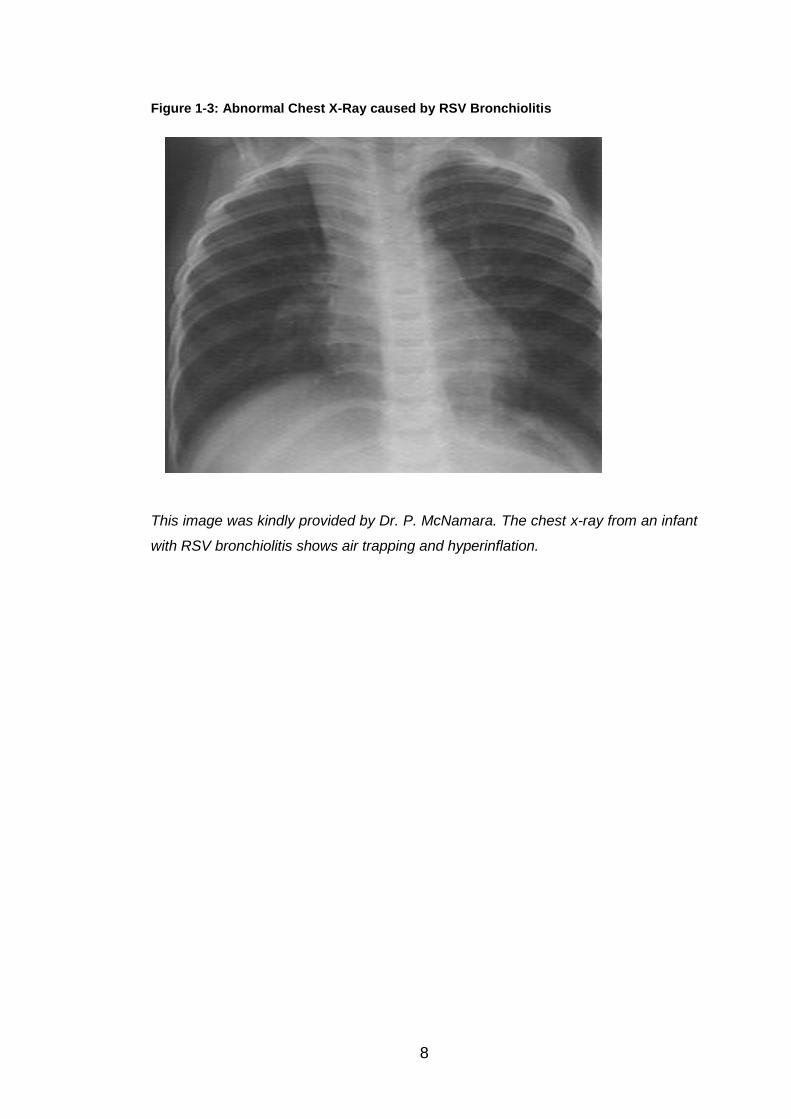
Measurement of respiratory rate and oxygen saturations, both non-invasive
procedures, provide vital information necessary for the management of
children with bronchiolitis (19, 29). These and other clinical indices are often
incorporated into bronchiolitis care pathways (Figure 1.4) to standardise the
management of these children.
For the 2-3% of RSV-infected children who require hospitalisation, causes
include hypoxia, inadequate fluid intake, apnoea and signs of respiratory
failure on blood gases. CO2 retention is a very late complication of RSV
bronchiolitis, which will present with irritability, cyanosis, lethargy and
exhaustion (35).
8
Figure 1-3: Abnormal Chest X-Ray caused by RSV Bronchiolitis
This image was kindly provided by Dr. P. McNamara. The chest x-ray from an infant
with RSV bronchiolitis shows air trapping and hyperinflation.
9
Figure 1-4: Alder hey Children's hospital Bronchiolitis Care Pathway
Infants up to 24 months via GP or self referral to A & E
Bronchiolitis - Care Pathway Flow Chart
Life ThreateningMild Moderate/Severe
Respiratory Assessment categorise severity of symptoms to
Nasopharyngeal aspirate
Oxygen to maintain SaO2 >92%
Discharge criteria metTemp. < 38
opa
Taking ¾ usual feed
SaO2 in air above 92%
Resp. rate below 50/min
Pulse rate below 140/min
RSV leaflet
Explain home care required
Arrange appropriate follow up
GP letter
HV liaison
Yes
No
Admit
following cohort policy
Oxygen SaO2 to maintain >92%
Follow pathway feeding regime
Admit
Oxygen to maintain SaO2 >92%
Nil by mouth, I.V. fluids
U & E’s CXR
Temp. > 38o
(pa) - FBC
blood culture
Consider antibiotic therapy
Discharge home
Symptoms Improving
Yes
No
Discharge criteria met for 12hrsTemp. < 38o pa
SaO2 in air above 92%
Oral feeding only
Fluid intake > 120ml/kg or if >6mths
and mixed feeding >600ml/day
Suction not required
Symptoms ImprovingYes
Oxygen to maintain SaO2 >92%
Ventilatory support,as indicated
Inform anaesthetist
Consider capillary gases
Nasopharyngeal aspirate when possible
Consider transfer to I.T.U
Transfer
according to cohort policy
Pathway feeding regime
No
NPA result known
Transfer according to cohort policy
Objective evidence of bacterial infection
commence antibiotic therapy
Consider transfer to I.T.U
Royal Liverpool Children’s NHS Trust
Alder Hey
Bronchfc2.ppt2002
NHS
This care pathway is kindly supplied by Dr. P. McNamara. It is followed for any
infants up the age of 24 months presenting to the Accident and Emergency
Department with signs and symptoms of RSV bronchiolitis. The severity of the
disease must be determined immediately and the steps followed to ensure correct
investigations and management is given at all times.
10
The effects of RSV are not just limited to the acute infection. Several studies
report that wheezy episodes are much more common following RSV infection
in early life, especially following severe disease (36, 37). Also, recurrent
wheeze secondary to RSV infection has also been associated with the
development of airway hyper-responsiveness (2, 37, 38). Stein et al
investigated this association in children who had confirmed RSV lower
respiratory illness up to the age of three (39). The results confirmed that
there was a significant increased risk of developing recurrent wheeze, after
an RSV lower respiratory tract illness, in the first ten years of life, which
gradually decreased with age, becoming insignificant by thirteen years (39).
This pattern was also similar when other lower respiratory tract infections
were investigated, but the results were less marked and less consistent than
those for RSV. Two other findings in children that had had RSV LRTI
included lower lung function during their school years if they were diagnosed
with RSV bronchiolitis in their infant years, and increased responsiveness to
bronchodilators at age eleven. Stein et al suggested that disruption of airway
tone could explain this association, where the tone improves with age,
explaining the weakening of this link (39). Conversely, Sigurs et al undertook
a prospective study following hospitalised infants with RSV bronchiolitis (91%
< 6 months) up to the age of 13. The findings showed that severe RSV
infection in early infancy was a strong risk factor for developing asthma up to
and during early adolescence. At the age of 13, 43% of the RSV group
(n=46) had current asthma and recurrent wheezing compared to 7.6% of the
control group (n=92), with a p value of < 0.001 (40). These differences
between Stein and Sigurs results may be due to a number of reasons.
Sigurs’ participants were all hospitalised during RSV infection, and all below
the age of one, showing that they may have extracted more severe RSV
bronchiolitis. The variation in population (Sigurs’ study was based in Swedan,
whereas Stein was in USA), climate factors and allergen load (as 28% of
Sigurs’ control group had positive skin prick tests, compared to 59% found in
Stein’s project) could also have contributed to the difference in results (39,
40).

11
An important feature of RSV infection is that sustained protective immunity
does not occur and re-infection may arise at anytime of the patient’s life,
regardless of the presence of the serum antibody (26, 29). Usually re-
infection will cause milder disease (6, 15).
1.1.4 Risk Factors in RSV Infection
Although all infants and young children are susceptible to RSV infection,
various factors can make an individual “high risk”, and more likely to be
hospitalised (41). The following predisposing conditions significantly increase
the risk of severe bronchiolitis (6, 7, 19, 23, 29, 38, 41-43).
1.1.4.1 Premature Infants
Premature infants (gestational age < 35wks) are prone to severe RSV
disease and particularly, severe bronchiolitis, because of their immature
immune system. Most maternal antibody transfer occurs during the third
trimester. This transfer is incomplete in preterm infants and thus they have
lower serum concentration of IgG antibodies and are at higher risk of
succumbing to infections (44-46). Other factors probably also play a role. For
instance, the quantity and quality of the neutrophils and complement in
preterm infants are significantly reduced compared to their full-term peers.
Generally the child is fully immunocompetent by six months of life (44, 45).
1.1.4.2 Chronic Lung Disease of Prematurity
Chronic lung disease (CLD) of prematurity is also a predisposing factor for
RSV infection because the respiratory system is abnormally developed (44).
Much of the lung development occurs in the third trimester. At 30 weeks
gestation the lung volume is only 34% of the final volume at term, and the
airspace walls are much thicker at 28μm, compared to the term
measurement of 17μm (47). This reduces compliance, flow and gas
exchange ability within the lungs. An increased risk of airway obstruction,
secondary to the reduced size of the airway and the increased production of
mucus and dislodging of the necrotic tissue within the lungs, is another
factor. Airway obstruction prevents the removal of secretions from the lower
12
airways, providing an ideal environment for infection (both viral and bacterial)
to occur (45).
1.1.4.3 Congenital Heart Disease
Congenital heart disease (CHD) is the third major risk factor that predisposes
infants to severe RSV bronchiolitis, especially if it causes pulmonary
hypertension (48). Kristensen et al’s case-control study assessed the risk
factors for RSV hospitalisation in children diagnosed with heart disease (49).
The study was based in Denmark, using a database to select children
diagnosed with both RSV and heart disease. Each patient was then paired
with a control at the same age resulting in a total of 313 pairs. The major risk
factors found were Down's syndrome (Section 1.1.4.4) and Cardiomyopathy
(OR 5.84). Haemodynamically significant heart disease (OR 1.53) had a
lesser effect, but was found to still be statistically significant in the study.
Young age and cardiac decompensation were both related to increased
severity of RSV infection and the need for respiratory intervention (49).
Alexander et al also undertook an observation cohort study in Australia,
searching institutional databases between 2005-09 (50). Participants were
children admitted with RSV bronchiolitis whom had a previous diagnosis of
symptomatic cardiac disease (SCD), defined as haemodynamic significant
cyanotic or acyanotic CHD, pulmonary hypertension or hypertrophic
cardiomyopathy. Results showed that patients with SCD were more likely to
be admitted secondary to RSV infection, and have a more complicated and
lengthy stay in hospital, requiring PICU admission and respiratory support.
Data showed that SCD made up 2-9% of the total RSV admissions and of
those admitted, around 20% required PICU attention (50).
1.1.4.4 Genetic and Chromosomal Abnormalities
Down's syndrome, trisomy 21, is the most common chromosomal
abnormality among live-born infants, and is characterised by various
dysmorphic features and congenital malformations such as CHD and
gastrointestinal disease (51). As mentioned in the previous section,
Kristensen completed a case-control study to find that Down’s syndrome was
the largest risk factor, when comparing RSV and heart disease, with an OR

13
of 3.24. Children with Down’s syndrome showed they were more susceptible
to obtaining RSV, but other factors that might contribute are immature lung
development, abnormal airway structure or the disturbance within the
immune response. All these features are commonly seen within children
suffering with Down’s syndrome (49).
Bloemers also reviewed the vulnerability of children, diagnosed with Down’s
syndrome, of obtaining RSV infection. Patients with Down’s syndrome alone
had an increased chance of hospital admission secondary to RSV by ten-
fold, compared to patients without Down’s. Similar to above, Down’s
syndrome patients with haemodynamically significant CHD are two times
more likely to be admitted than patients who suffer from haemodynamic
significant CHD, but do not have Down’s syndrome. The factors causing this
are similar to those mentioned by Kristensen, but Bloemers also added
atypical swallowing and aspiration, secondary to hypotonia (51).
Cystic Fibrosis (CF) is an autosomal recessive genetic disorder, which
results in increased mucus viscosity and thus impairing lung function. CF
patients are prone to extracting respiratory infections, including RSV. During
an acute pulmonary exacerbation secondary to a respiratory virus, CF
patients have a four-fold increased risk of developing a LRTI, and then
needing hospital admission. During infancy, RSV infection within CF patients
makes up approximately one third of admissions. There is some evidence
that CF patients diagnosed with RSV LRTI may have impaired lung function
for a number of months following the illness, but further investigation within
this area is required (52).
1.1.4.5 Immuno-compromise
RSV infection in the immunocompromised can be very serious. Ebbert
undertook a study with eleven RSV infected patients with underlying immuno-
compromise (53). He found that their chest radiographs displayed patchy or
nodular alveolar infiltrates throughout the lung, compared to the interstitial
infiltrates expected. Over 50% of the patients required intubation and
ventilation on intensive care, and six out of the eleven patients died, later to
be diagnosed with RSV pneumonitis (53).

14
1.1.4.6 Other Risk Factors
Other reported risk factors for RSV infection include: male gender, low birth
weight, chronological age (birth during first half of RSV season), multiple
birth, not breast fed < two months old, day care attendance, house crowding
(>4 people living in the house), sibling of school age, self or family history of
atopy, passive tobacco and environment pollutants exposure and underlying
neuromuscular disorder (6, 7, 19, 23, 29, 34, 42, 43, 45, 46, 48).
1.1.5 Management and Prevention of RSV Infection
There is a dearth of treatment options for infants with RSV bronchiolitis.
Currently, management consists of maintaining adequate hydration,
sometimes with naso-gastric or intravenous fluids, and supplemental oxygen
(19, 35).
A Cochrane Review has examined the use of nebulised hypertonic 3% saline
in the treatment of non-severe acute RSV bronchiolitis among hospitalised
infants (54). There were a number of reasons why hypertonic saline might
work in bronchiolitis. Firstly, hypertonic saline is thought to encourage the
osmotic flow of water towards the mucus layer of the airway, and rehydrate
the surface liquid and thus provoking mucus clearance. Secondly, the mucus
gel contains ionic bonds that can be broken by the hypertonic solution, which
therefore reduces the number of cross-linking, and lowers the viscosity and
elasticity of the mucus. Lastly, hypertonic saline releases prostaglandin E2,
which encourages the cilia to beat more efficiently (54).
The Cochrane group reviewed seven double-blinded, randomised control
trials of 3% hypertonic saline. The use of hypertonic saline, compared to
normal saline, significantly shortened the mean length of hospital stay by
1.16 days in total. The 95% confidence interval was -1.55 to -0.77 with a P
value of less than 0.00001, showing a 24.1% reduction. The rate of
hospitalisation and risk of readmission were also assessed, but neither
produced significant results. The risk of readmission was reduced by 8%
overall, but the P value equalled 0.82. RSV bronchiolitis is a burden to
hospitals during its peak onset, so finding this significant benefit in reducing

15
the length of hospital stay could have a positive impact, especially
economically, for both individual families and the health service (54).
Another Cochrane review concluded that bronchodilators are unlikely to play
an important role in the acute treatment of bronchiolitis. They do not improve
oxygen saturations, need for hospital admission or the number of days of
hospitalisation (55). Both Fitzgerald and Smyth suggested that epinephrine
had minimal improvement when used, but the significance of this remained
uncertain (29, 35). A recent Cochrane review demonstrated that epinephrine
was superior to placebo during the first 24hours, but there is still no data to
confirm the effectiveness of administering repeated or prolonged doses (56).
There have been suggested benefits when combining epinephrine with
steroids, but this requires more evidence and research before it should be
put into clinical practice (56). Antibiotics do not have a role in the treatment of
bronchiolitis either, unless in severe disease where there is potential doubt
over the diagnosis (23, 57). Ribavirin is a broad spectrum antiviral agent,
occasionally used in treating immunocompromised children, but evidence for
benefit is weak and with high cost and safety issues (it is potentially
teratogenic) it is not generally recommended (29, 35).
Vaccination development has been thwarted over the last fifty years. A
formalin-inactivated vaccine against RSV was developed during the 1960s
and initially proved promising as it produced high serum antibody titre. This
was soon dismissed as the results from its use in humans showed that the
vaccine caused an exaggerated and altered clinical response against the
natural form of RSV. Significantly more people vaccinated with RSV (80%)
were hospitalised with severe respiratory disease than non-vaccinated
controls (5%), during the first RSV season following the vaccination.
Therefore, this shows that the vaccine induced a disturbance within the
immune reaction (15, 36, 58).
Palivizumab is a monoclonal antibody used to prevent RSV disease in high-
risk infants. It acts by binding to the neutralising epitope found on the fusion
protein of the RSV molecule. Due to its expense it is only recommended as
prophylaxis for high-risk patients (4, 29, 41), and is administered as five
monthly intramuscular injections over the RSV season (October-March in the

16
UK) (19). The RCPCH guidelines for Palivizumab use states that if the infant
is under twelve months of age they are eligible for the vaccine if they suffer
from: 1) extreme prematurity, 2) acyanotic CHD, 3) congenital or acquired
lung disease and 4) immunodeficiency (19, 59). These guidelines vary
throughout countries, as the AAP states that the infant must be <32 weeks
gestation age with two or more risk factors, i.e. day care attendance; or suffer
from CHD, immunodeficiency, respiratory or neuromuscular disease (43, 60).

17
1.2 Pathogenesis
1.2.1 RSV Structure and Function
RSV is an enveloped, single-stranded negative RNA virus that belongs to the
Paramyxoviridae family. In total it has ten genes, which encode for 11
proteins, and is 15.2kb in size (1, 16, 19, 20, 30, 61, 62). The sequence order
of these ten genes is: 3’-NS1-NS2-N-P-M-SH-F-G-M2-L-5’ (Figure 1.5). Of
the 11 protein products, nine are structured components of the virion and two
are non-structural proteins (1).

18
Figure 1-5: RSV Proteins and Gene Map
This image shows: A) RSV proteins and B) gene map (taken from Collins et al) (30)
Section A is a negative-stained image of budding RSV virions under an electron microscope,
where V is the virion and F is the filamentous cytoplasmic structures. Where known, the RSV
protein locations and functions have been labelled. Section B shows the gene map of RSV
A2 strain. The overlapping M2-1 and M2-2 ORFs are shown above the sequence, and the
numbers below are the nucleotide lengths. The 3’ leader (le) and 5’ trailer (tr) regions are
labelled, and the underlined numbers are intergenic regions. The numbers above the gene
map are the amino acid lengths for each protein. The RSV proteins are: NS1, Non-structural
protein 1; NS2, Non-structural protein2; N, Nucleoprotein; P, Phosphoprotein; M, Matrix
protein; SH, Small hydrophobic glycoprotein; G, Attachment glycoprotein; F, Fusion
glycoprotein; M2-1, first ORF in M2 mRNA; M2-2, second ORF in M2 mRNA; and L, Large
polymerase protein.

19
The mature RSV virion contains a ribonucleoprotein (RNP) complex, which is
synthesised by links between the viral genomic RNA (vRNA), the
nucleocapsid (N) protein, the phospho (P) protein and the large (L) protein
(63). The RSV genome is retained within the helical nucleocapsid, which
protects the viral genetic information and acts as the viral replication template
(64, 65). The P protein is a homotetramer phosphoprotein, which is an
important element of the polymerase complex (30, 62). The viral polymerase
is reliant on the P protein during transcription for clearance and chain
elongation (30). The L protein stimulates RNA synthesis, encodes the RNA
polymerase and has a role in RNA transcription and replication (16, 30, 62).
Transcription also requires the M2 protein which encodes for two products: 1)
M2-1 – transcription factor; 2) M2-2 – transcription regulatory factor. The M2
mRNA contains two overlapping open reading frames (ORF1 and ORF2).
ORF1 promotes chain elongation transcription and optimises mRNA
production, whereas ORF2 regulates the accumulation of genomic and
antigenomic RNA (16, 30, 62, 66).
The non-structural genes 1 and 2 (NS1 and NS2) are small proteins, 139 and
124 amino acids long, respectively (67), whose names were derived because
they are produced in RSV-infected cells, but are not contained in the mature
virion structure (68). They counteract the host innate immune response by
expressing proteins that antagonise the interferon system. They especially
act by interfering with the induction of type I interferons (IFN), thus causing
vigorous replication of the virus and resulting in a more severe respiratory
disease (16, 30, 61-63, 67, 68). Overall there are two functioning interferon
pathways: 1) induction pathway, where the cells produce IFN; and 2)
response pathway, in which the cells react to the exogenous IFN (67).
Individually, NS1 has the greatest IFN inhibiting effect, but these work
synergistically (68).
The host immune system has developed an effective antiviral response
which reduces virus replication and spread. Janus kinases, JAK1 and TYK2,
are associated with the two subunits for type I IFN receptors. These receptor
tyrosine kinases are activated and result in tyrosine phosphorylation of signal
transducer and activator of transcription 2 (STAT2) and STAT1. Once these

20
are activated interferon-stimulated gene factor 3 (ISGF-3) complexes are
formed, and bind with the IFN-stimulated response elements (ISRE) to begin
gene transcription and then consequently antiviral immunity (69).
Both, NS1 and 2 proteins can form functional homo- and heteromers, which
are able to interfere within the signal transduction pathway, resulting in the
down-regulation of IFN-β. The IFN-induced signal transduction from its
receptor is suppressed through the JAK/STAT pathway, initiated by
proteasomal degradation (30, 67). It is thought that NS2 works in this way, as
proteasome inhibitor MG132 can inhibit it. The NS1 protein targets the
STAT2 pathway by synthesising an E3 ligase complex, which then continues
to degrade the pathway. Both the NS proteins can individually cause STAT2
degradation, but it is most effective when both proteins are contributing. It
has been suggested that the NS2 protein may influence the E3 ligase activity
by stabilising the complex for the NS1 protein to act upon (68, 69).
Ramaswamy’s work showed that RSV uses the NS2 protein to weaken type I
IFN antiviral response, and revealed that by inhibiting the STAT2 pathway it
lowered type I IFN-dependent signalling resulting in reduced gene expression
(70).
The M protein is the matrix protein and is located on the inner surface of the
viral envelope. This protein mediates the interaction between the plasma
membrane and the RNP during virion synthesis (30, 61, 62). Its positively
charged crystal structure recently revealed a monomer condensed with N-
terminal and C-terminal domains (30).
Also within the RSV structure there are three surface glycoproteins; the
heavily glycosylated G protein, the fusion (F) protein and a small hydrophobic
(SH) protein.
The G protein is a type II glycosylated transmembrane protein, approximately
298 amino acids long (6, 62). It is involved in the attachment of the virus to
target cells, and is also known as the “attachment glycoprotein” (6, 63). The
G protein is a target for neutralising antibodies, and has the most variability in
its structure compared to all the other RSV proteins. These antigenic
differences are found mostly between the two subgroups of RSV, A and B,

21
where the amino acid sequence can vary by approximately 50% (6, 62, 65).
These points have initiated research in potential G antigen vaccine designs.
The protein also has an unusual composition compared to the other
glycoproteins, because it is made up of around 30% serine and threonine
and 10% proline (6, 62). The G protein can also be expressed as membrane-
bound and secreted forms, where the latter interferes with antibody-mediated
neutralisation (16, 30, 65).
The F protein is a type I glycosylated transmembrane protein involved in viral
entry and cell-to-cell spread by plasma membrane fusion (6, 16, 62, 63, 71).
It is made up of 574 amino acids, with a trimeric coiled-coil structure
comparable to other fusion proteins within viruses (65). The F protein has an
inactivated form, F0. Cleavage of F0 causes activation to occur forming two
subunits, F1 and F2, covalently attached by disulphide bonds. It has been
recently found that both F proteins bind to glycosaminoglycans (GAGs),
mandatory for efficient RSV infection of cell lines (30). The G and F proteins
work together to become important protective antigens within the RSV
molecule, and the major targets for neutralising antibodies (65, 71, 72).
The G protein attaches the virus onto the respiratory epithelium, whilst the F
protein supports fusion between both the viral and cell membranes, and the
infected and adjacent cell membranes, resulting in the movement of genetic
material, and formation of the syncytia, respectively. These syncytia are
mandatory for cell-to-cell viral transmission, and are characteristic of the RSV
cytopathic effect (65). Thus, this describes that RSV directly spreads across
the respiratory epithelium.
The SH protein is the third integral transmembrane surface glycoprotein
whose function still remains unclear. Potential roles as a pentameric ion
channel and in membrane fusion have been suggested (6, 30, 62, 65). It has
not been extensively studied other than part of failed attempt to develop a
vaccine (6).
1.2.2 RSV Viral Infection and Cytotoxicity
RSV initially infects the upper respiratory tract, by principally targeting the
airway epithelial cells, the first line of defence for the body (16, 36). In those

22
that develop lower respiratory disease, it has an incubation period of two to
eight days before it spreads to the small bronchiolar epithelium lining (19, 21,
26). Between one to three days oedema, increased mucus production and
eventual necrosis and sloughing of the epithelium occur, resulting in small
airway obstruction (19, 24, 65). Clinically, this causes “air trapping and
hyperinflation or collapse/atelectasis of distal lung tissue” (24), and can lead
to hypoxia and respiratory failure (24, 65).
RSV pathogenesis remains controversial. RSV is a highly contagious virus,
whose tropism targets the superficial epithelial cells, thus reducing the impact
of the host response (6, 15, 22). Studies have shown that lung injury can be
exacerbated by the direct viral damage and the inflammatory responses
mediated by the virus (1, 73). Monick et al showed that RSV infection caused
apoptosis of the lung epithelial cells, but only after the cells had released
inflammatory mediators and conditions favourable for viral replication (16,
20). Collins also showed that RSV was not highly cytopathic, as he observed
delayed tissue damage after weeks of infection (30). Interestingly, he noticed
that ciliary function was soon impaired; again contributing to airway
obstruction (30). Studies by both Herranz and Martinez show that part of the
damage caused by RSV is due to the immune response (36, 61).
1.2.3 The Immune Response to RSV
The role of the mammalian immune system can be considered to be to
recognise and remove any unwanted foreign material within the body, whilst
minimising damage to the host during the immune response (74). The human
immune system has been classically divided into two separate components
or systems termed innate and adaptive immunity. The innate system
provides a first line of defence, which is always present and is also important
in inducing adaptive immunity. Adaptive immunity by comparison is
characterised typically by pathogen-specific antibody production and cell-
mediated immunity (75), exhibiting high specificity, tolerance to self tissues
and immunological memory. Collectively, the two systems are complex, each
composed of humoral factors and active specialised cells. However, they are

23
not independent but integrated and act together to combat infection (74, 76,
77).
1.2.3.1 Innate Immunity
Innate immune response is the first line of defence for the human body,
identifying foreign organisms within minutes of exposure (7, 76-78). The
innate response is mediated by a number of cell types, such as phagocytes
(leukocytes, macrophages, neutrophils and dendritic cells), eosinophils,
basophils, mast cells and natural killer (NK) cells. All these cells are involved
in phagocytosis, the killing of microbes and lysis of virus infected cells (77,
79, 80). This system also activates the complement cascade, subsequently
releasing proinflammatory cytokines and chemokines, which cause immune
cells to rapidly move to the site of infection (65, 74, 77, 78). This non-specific
process is not able to induce immunological memory within the innate cells,
distinguishing them from the adaptive system (76, 77, 79, 81).
All these cells have sensors, located within the cell surface, endosomal
membrane or cytoplasm, which detect structural motifs specific to pathogens,
termed pathogen-associated molecular patterns (PAMPs). The sensors that
recognise viral PAMPs are called pattern recognition receptors (PRRs) (78,
80, 82). Viral PAMP examples include double-stranded RNA, single-stranded
RNA, non-methylated CpG DNA and envelope glycoproteins (82).
PRRs are made up of four families; two are membrane bound (toll-like
receptors (TLR) and C-type lectin receptors (CLR)), and two are
cytoplasmatic (nucleotide oligomerisation domain (NOD)-like receptors (NLR)
and retinoic acid-inducible gene (RIG)- like receptors (RLR)) (74, 78)
Detection of PAMPs and endogenous alarm signals (such as crystalline uric
acid, heat shock proteins 60, 70, and 96, fragments of hyaluronan and
fibronectin (78)) are necessary for the innate immune system to be activated.
PAMPs are not expressed by vertebrates, which allows the host to
differentiate itself from an invading organism (74). It has also recently been
shown that PRRs identify endogenous damage-associated molecular
patterns (DAMP), expressed when host tissue has been damaged (78).
24
The innate immune response is also mediated by the antigen presenting cells
(APC) which include monophages, macrophages and DCs. These cells play
an important role in the bridging of the innate and adaptive systems, by
confining the threatening antigen, transporting and then presenting it to the
adaptive lymphocytes. Originally it was thought that the innate system was a
temporary, phylogenetic development of the immune response before the
adaptive system was activated, but evidence now suggests that the innate
immune response is often a requirement for the adaptive response to be
triggered (74, 76, 79, 82).
1.2.3.2 Innate Immunity in RSV Infection
In the lung, factors such as pulmonary surfactant, act as part of the innate
immune system to block viral infection including RSV. On infection the RSV-
induced immune response is characterised by interferon production and rapid
inflammation within the airway, causing inflammatory cells to migrate from
the bloodstream to the site of infection. Recruitment of these inflammatory
cells, predominantly neutrophils, primarily results from chemokine expression
following viral recognition by the innate immune system through pattern
recognition receptors. Detrimental lung damage may be secondary to the up-
regulation of chemokine production, as well as damage by the virus itself (1,
15, 24, 36, 61).
Pulmonary Surfactant
Pulmonary surfactant consists of lipids (90%) and proteins (10%) and makes
up a thin layer over the alveolar surface. Its role is to prevent alveolar
collapse on expiration by decreasing surface tension. Both lipids and proteins
interact with the proteins regulating lipids to maximise their role. In total there
are four types of surfactant proteins (SP): A, B, C and D. The two hydrophilic
proteins (SP-A and SP-D) are part of the C-type lectin family. C-type lectins
are proteins involved with protection against invading viruses. Collectins, a
family member, are vital soluble molecules in maintaining correct lung
mechanisms and during the innate immune response (7).
These surfactants have been shown to affect RSV pathogenesis and disease
severity in both human and animal models, and are thought to be one of the

25
first lines of resistance within the lungs. Surfactant A attaches to the RSV F
protein and encourages macrophage phagocytosis, whereas surfactant D
inhibits RSV binding and neutralisation of RSV G protein (16). Lower levels of
surfactants A and D have been found in the bronchoalveolar lavage of RSV
positive patients (7, 16, 22, 65).
Toll-like Receptors (TLRs)
On infection PRRs, such as TLRs, play an important role in viral recognition.
TLRs are highly evolutionally conserved within mammals. These type 1
integral transmembrane glycoproteins are PRRs, which form part of the
innate immune system and support the recognition of a variety of pathogen
structures including viral nucleic acids. They are structurally characterised by
leucine-rich repeat (LRR) motifs within the extracellular section. The LRR
domain has an important role in ligand binding, and comprises 19-25 copies
of repeated sequence consisting of 24-29 amino acids with the following
residues; xLxxLxLxx (79). Once bound these receptors can trigger the
immune response (79).
A virus is recognised by TLRs expressed on the epithelium, activating a
signalling pathway leading to the production of type I IFNs and transcription
factors, such as nuclear factor kappa B (NF-ҡB), a regulator of pro-
inflammatory cytokine and chemokines expression (Figure 1.6) (16, 22, 83,
84).
In RSV infection, the RSV F protein has been shown to bind to TLR4 causing
cytokine production (85, 86). Sensitivity towards endotoxins and other TLR4
ligands has been suggested as a possible explanation for the link between
RSV and inhaled allergen reactivity (16, 24). Rudd et al investigated the
association between TLR3 and RSV (87). This group found that RSV-
induced chemokine release was mediated by TLR3. These experiments
compared the response to RSV in lung epithelial cells expressing TLR3 to a
negative control. CXCL8 and CCL5/RANTES (regulated on activation, normal
T cell expressed, and presumably secreted) were significantly induced in the
transfected cells 48 hours post RSV infection. TLR3 did not influence RSV

26
replication (87). Both TLR3 and TLR4 are expressed in the lung during and
following infection (65).
Figure 1-6: Toll-Like Receptor Signalling
NF-ҚB IRF3, IRF5, IRF7
MyD88 MAL TRIF TRAM
IRAK-1, IRAK-4, TRAF6, ERK, JNKKinases:
Adapter Proteins:
Transcription factors:
TIR domain
Leucine rich repeats
Pathogen
Inflammatory genes
Eg TNF, IL1, IL6…
Interferons
IFNα, IFNβ…
Transcription
Co-receptor:
MD-2, CD14, CXCR4, SP-A…
TLR
This figure was kindly supplied by Dr. B Flanagan, and outlines the signalling
pathway for toll-like receptors. TLRs expressed on the cell surface or within cell
lysosome recognise pathogen associated molecular patterns (PAMPs). The
extracellular structure of the TLRs are made up of LRRs. Co-receptors enhance
TLR binding and signalling. For example, for TLR4 binding, MD-2 and CD14 are
needed. The Toll/IL-1 receptor homologous region (TIR) adapter proteins
become activated, thus continuing to activate the kinase proteins and then the
transcription factors. NF-ҡB migrates to the nucleus, upon activation, for
transcription of inflammatory genes. Interferon regulatory factors (IRF) initiate
transcription for interferon genes.
27
Interferons (IFN)
IFNs are a family of pleiotropic cytokines first described because of their
ability to ‘interfere’ with or enhance resistance to viral replication (82). The
importance of IFNs within the immune system has been demonstrated in
murine models of infection, which shows that when IFN expression is
reduced, pathogen spread is accelerated (16).
There are two main types of IFNs. The type I IFN family can be expressed by
most cells and include a number of highly related IFN-α forms, and one form
of IFN-β. Expressed rapidly following viral infection of a cell, they are
produced in response to PRR recognition of viral RNA or DNA. Type I IFNs
act through a common cell surface receptor, the IFN receptor, widely
expressed on most cell types and induce both autocrine and paracrine
effects (82). Activation of a cell by IFN inhibits viral replication by increasing
endonuclease expression which degrades viral nucleic acid and also
decreases viral protein translation. Type I IFNs also up-regulate cellular
major histocompatibility complex (MHC) class I expression, increasing the
potential for cells to be recognised by cytotoxic lymphocytes. They also
enhance NK cell activity and up-regulate expression of many proteins
including inflammatory chemokines (3, 5, 6, 16, 82, 88-92).
During early RSV infection type I IFN induction peaks, but soon declines as
the infection progresses. As mentioned above, RSV NS1 and NS2 proteins
act as type I IFN antagonists, with NS2 specifically interfering interferon
induced activation of STAT2 (30, 67).
Spann et al deleted NS1 and NS2 from the RSV genome, either individually
or in combination, and showed a 40,000-fold increase in IFN-β mRNA
expression when both proteins were deleted, compared to the control
infected cells (93). The levels of IFN-β were found when both proteins were
deleted together, deletion of NS1 only resulted in more IFN-β than deletion of
NS2 alone, suggesting NS1 is the major inhibitor of IFN production (93).
These results were quantified by antigen-capture enzyme-linked
immunosorbent assay. These data suggest that IFN-α/β production is a very

28
early response to virus infection and inhibition of IFN production by RSV is a
major mechanism to inhibit innate immunity (93, 94).
In contrast, whilst it has strong antiviral effects, type II IFN (IFN-γ) is more
closely related to adaptive immunity and produced by Th1, macrophages,
NKT and NK cells (3). The full role of type II IFN production during RSV
infection is still unclear. It has been shown that IFN-γ assists the cell-
mediated immune response against viral disease, and that there is an
association between low levels of IFN-γ and severe RSV disease (3).
Cormier et al investigated the role of IFN-γ in adult mice, and found that it
was important in the eradication of RSV, but may also been responsible for
tissue damage during the infection (26).

29
Figure 1-7: Interferon Signalling Pathway
This image shows the interferon signalling pathway (82).
The IFN-I is presented and binds to IFNAR-1 and -2 (interferon α/β receptor 1 and
2), which activate the Jak1 and Tyk2 kinases. This results in the phosphorylation of
STAT1 and STAT2 proteins. The IRF9 (interferon regulatory transcription factor 9)
binds to these two proteins to produce the ISGF3 (Interferon-stimulated gene factor
3) complex, which translocates to the nucleus and results in the transcription of
ISGs.

30
Neutrophils, Macrophages and Eosinophils
Neutrophils are the predominant leukocyte found in the airways of RSV
infected children, making up 93% and 76% of the inflammatory cells within
the upper and lower airway, respectively (65).
In RSV infection, neutrophil chemotaxis is dependent on chemokine
production, especially IL-8, released from airway epithelial cells and
macrophages (65). It has been suggested that RSV delays adaptive
immunity, perpetuating neutrophil recruitment, and consequently resulting in
cell damage by disrupting, necrotic neutrophils (24, 65). In vivo, neutrophils
are probably activated by a number of inflammatory signalling molecules, not
just RSV (95).
Alveolar macrophages express proinflammatory cytokines in response to
RSV infection, such as TNF-α and IL-8 within the lower respiratory tract.
They augment the innate response by encouraging vascular permeability and
the migration of lymphocytes, neutrophils and natural killer (NK) cells towards
infection. Later in RSV infection, macrophages hinder viral replication and
have a role in the debris clearance reducing further inflammation and lung
damage (96). In murine models, a lack of macrophages has also been shown
to limit T cell activation and recruitment, suggesting a role in the immune
response (16, 30, 65, 97). Sow et al investigated RSV susceptibility in
preterm and full-term lambs (42). Their study, with a total of twenty lambs,
showed that macrophage recruitment into the lungs was present in both
groups following RSV infection. However, in the preterm lambs,
macrophages differed in their activation process and being more immature.
These responses may be relevant to disease pathogenesis in human infants
born prematurely (42).
Eosinophils have been reported to show antiviral activity. Elevated blood
eosinophil cationic protein (ECP) is found in infants during recovery from
RSV bronchiolitis compared to other acute illnesses, and is also associated
with wheezing during RSV disease (6, 65).
31
Natural Killer (NK) Cells
NK cells are innate immune lymphocytes capable of recognising viral infected
cells by identifying abnormal cell surfaces secondary to the reduction of
cellular MHC class 1 expression induced by some viruses (16, 76).
NK cells can be activated by a number of cytokines, including IFN-β, IL-12
and TNF-α, all found in the lungs of RSV-infected patients. They are the first
subset of lymphocyte cells recruited to the lungs in RSV bronchiolitis.
Between days 3 and 4 post RSV infection, NK cell recruitment from the blood
to the lungs is at its highest in murine models (98). This is indirectly
supported by the observation that blood NK cell levels are significantly lower
in RSV infected children compared to controls (65). In RSV infection, there is
debate about whether macrophages activate and recruit NK cells. Recent
studies have shown that reduced number of macrophages can lower the
number of activated NK cells (16, 26, 65, 76, 80).
In primary RSV infection, invariant Natural Killer T (iNKT) cells, a subset of T
cells that express characteristics of both NK and T cells, have been shown to
release cytokines, especially IFN-γ, and to activate CD8 T cells (16, 82).
Dendritic Cells (DCs)
DCs are antigen-presenting cells that bridge the innate and adaptive immune
responses. In response to a foreign antigen, organ-derived DCs are triggered
and rapidly migrate to the regional lymph nodes taking with them antigens
from the tissue. Once in the lymph nodes, DCs mature, increase expression
of co-stimulatory molecules and regulatory cytokines, and present antigens to
T cells. The immunological synapse, a membrane structure found within the
interface between DCs and T cells, are critical for T cell activation. This
activation process requires specialised molecular rearrangements between
the DC and T cell surface, resulting in the polarisation of membrane-protein
domains (1).
DCs capable of presenting RSV antigens are normally located beneath the
respiratory epithelium. RSV has been shown to replicate within DCs and
affect their overall function, particularly by inhibiting T cell activation with the
lymph node (1).
32
Recent studies have suggested that this change in T cell activation could be
due to RSV-induced expression of soluble and/or membrane bound
molecules such as thymic stromal lymphopoietin (TSLP) (99). This molecule
has an important role in the maturation of T cells and through its induction.
RSV may affect the balance of Th1/Th2 cells, ultimately resulting in poor
immunity and slow viral eradication
Collectively, RSV can infect DCs, interfere with their development and impair
their functional capacity to promote T cell activation (1, 74, 75, 79).
1.2.3.3 Adaptive Immunity
Adaptive immunity is highly specific and becomes evident several days
following initial presentation of a foreign antigen. It can be divided into
humoral and cellular components mediated collectively by B and T
lymphocytes (79).
1.2.3.4 Adaptive Immunity In RSV Infection
Humoral Response
The antibody response to RSV has primarily been studied in serum rather
than the airway. Specific IgM levels increase initially at around five days post
infection and remain elevated for several weeks post infection. IgG is
produced subsequently around ten days post infection in serum and remains
elevated for several months thereafter (65). Protective mucosal IgA has been
shown to be elevated two to three days post-infection in adults (100). In
acute RSV bronchiolitis, there is debate around the significance of serum IgE
levels (65).
The humoral response includes antibodies specific for each of the RSV
proteins but viral neutralising antibodies are primarily against RSV F and G
proteins (65). In murine models, Haynes et al found that anti-SP antibodies
could initially reduce pulmonary inflammatory cell infiltration and the number
of proinflammatory cytokines expressed, while anti-F antibodies lowered the
virus titres (101). Lee et al investigated the levels of antibody-secreting cells
(ASCs) in adult patients infected with RSV (102). 90% of the RSV infected
patients had RSV F protein specific ASCs present within the first eleven days

33
of infection. No correlation was found between these RSV F specific ASCs
and serum IgG response to RSV F protein, suggesting that serum IgG is a
poor indicator of the response to RSV (102).
The young age of many RSV bronchiolitis patients suggests that they should
be protected by passive transfer of maternal immunoglobulins. Serum IgG
levels varied between 180 and 656mg/dL in preterm infants born between
24.5 and 35.5 weeks gestation (15). This is compared to 757 and 1100mg/dL
in full-term healthy newborns at gestational age of 37 to 40 weeks (15).
Serum IgG contains specific RSV neutralising antibodies, which should be
present during the first six months of life. This coincides with the peak age for
severe RSV bronchiolitis, causing debate on efficiency of these antibodies in
supporting protective immunity. However it seems that children with higher
titres of RSV neutralising antibodies are not as susceptible to the infection.
Infants with low IgG levels (mostly preterm newborns) were at higher risk of
developing RSV bronchiolitis and requiring hospitalisation, compared to
infants with higher cord blood IgG levels. Furthermore, mothers of infants
who did not become infected had higher maternal RSV specific IgG antibody
levels, compared to mothers of infected babies (15).
Cell-Mediated Response
There are a number of ways in which an impaired cell-mediated response
may be important in RSV disease pathogenesis. DiNapoli investigated the
effect that RSV has on the CD8+ CTL (cytotoxic T lymphocyte) response
within the lungs. In RSV-infected mice models, CD8+ CTLs are impaired
characterised by the low expression of IFN-γ, a measure of functionality. This
impairment was thought to reduce the host's immune response and thus
explain the ability RSV has to re-infect throughout life (103).
Other impairments in the cell-mediated response are, firstly, thought to be
due to immaturity of the immune response, as the patients are usually very
young. Secondly, RSV infection could permanently modify the antibody and T
cell response. Viral clearance relies on the maintenance of a balanced Th1/2
response, as this stimulates the release of neutralising antibodies and

34
cytotoxic CD8+ T cells. It is thought this response can become imbalanced,
so that the mechanism does not work successfully (1, 6, 15, 65, 79).

35
Figure 1-8: Lymphocyte Differentiation
This image was kindly supplied by Dr. B Flanagan. It shows the stages of T cell
differentiation into the four main types, and cytokines that they express. The main
function/s of each type are also labelled at the bottom. The abbreviations are as
follows: TH1, T helper cell 1; TH2, T helper cell 2; TH17, T helper cell 17; Treg,
Regulatory T cell; DC, Dendritic cells; Ker, Keratinocytes; Epit, Epithelial cells; B,
Basophils; Eos, Eosinophils; Mast, Mast cells; Fib, Fibroblasts; Epit, Epithelial cells;
and Neut, Neutrophils.

36
T Helper Responses
There are four main types of helper T cells: Th1, Th2, Th17 and T regulatory
(regs) (Figure 1.8).
In response to a pathogen, Th1 and Th2 cells release IFN-γ, IL2, TNF-α and
IL-4, IL-5, IL-10, IL-13, respectively (65). There is much debate about which
Th cell has the most involvement in response to RSV, but no extensive study
of the response by T regulatory or Th17 cells has been published. Most
reports focus on a potential bias towards Th1 or Th2 cell production in
humans. The first description of a Th1/2 polarisation came from murine
models. Vaccinating BALB/c mice with a recombinant virus primarily
expressing the RSV F protein, results in Th1 and CD8+ cytotoxic lymphocyte
activity (16). However, infecting mice with recombinant virus expressing the
RSV G protein, results in Th2 cytokine release and eosinophilia (65).
This work, and the clinical similarities between bronchiolitis and the prototypic
Th2 condition asthma, led to multiple studies trying to identify a Th2 response
in human infants with RSV bronchiolitis (30).
Positive correlations are seen in the nasal lavage fluids between infants
suffering from acute RSV bronchiolitis and elevated IL-4 and IL-5 expression,
compared to infants with URTI alone, emphasising possible Th2 involvement
within the disease (30, 104). Some studies showed that more IL-4 is present
in BAL samples of RSV infected children than IFN-γ. Other studies showed
that lung and tissue injury were more likely in the presence of Th2
polarisation during a second exposure of RSV infection. Collins et al also
reviewed other studies showing Th1 bias and Th1 and 2 responses to the
virus, thus concluding that Th2 is likely to play a role in the
immunopathogenesis of RSV infection, but may not be the dominant Th
lymphocyte response (30). In a separate study evidence for a Th1 response
was seen in nasopharyngeal secretions from RSV infected patients, which
showed increased levels of IFN-γ (1, 16, 26, 30, 65).
Cytotoxic Lymphocytes
In murine studies, CD8+ T cells are found to be elevated within the lungs and
surrounding tissues during RSV infection. Increased numbers of RSV specific

37
CD8+ cytotoxic lymphocytes have shown to be associated with improved
viral clearance. This suggests that an inadequate T cell response to RSV
could contribute to a poor memory immune response, subsequently
promoting reinfection (1, 16, 26, 30).
Approximately 80% of infants suffering from RSV bronchiolitis had RSV-
specific cytotoxic lymphocytes present within the lungs. These cells have a
short half life, thought to be due to them being preserved in preparation for a
second exposure of the virus. Older infants appear to have higher
concentrations of T cells, which again may be secondary to immune
immaturity in younger infants. RSV specific CD8+ T cells positively correlate
with IFN-γ levels, and inversely with IL-4 levels. Subsequently, if a T cell
response is present before an infant is one year old, then they have a
significantly reduced chance of obtaining severe disease in their second
exposure to the virus (65).
Oshansky et al compared RSV specific CD8+ T cells isolated in the lungs and
spleen in their ability to release IFN-γ (16). CD8+ T cells were less able to
release IFN-γ in the lung environment, and were not affected by other factors
such as virus type, viral antigen and infection course (16).
1.3 RNA Interference
In October 2006, the Nobel Prize for Physiology and Medicine was awarded
to Drs. Andrew Fire and Craig Mello for work originally published in 1998.
The Nobel Prize was for the discovery of RNA interference (RNAi), where
gene expression is inhibited by interfering with its transcription and
translation. They inserted long double-stranded RNA (dsRNA) into
Caenorhabditis elegans, which resulted in the silencing or "knockdown" of a
specific protein with the corresponding mRNA sequence. In 2001, it was
discovered that RNA interference also happens within human and other
mammalian cells.
Around this time, the concept of small-interfering RNAs (siRNA) was also
introduced. These short and specific dsRNA are approximately 21 to 23 base
pairs long (Figure 1.9). They are produced from long dsRNA by a Dicer (an
RNase) and have a distinctive layout, with a single-stranded 2-nucleotide

38
long 3’ overhang at both ends. They are able to continue the interference
function with their complementary, antisense strand to the target mRNA,
thus, producing a substance that specifically silences a gene function,
without modifying the gene itself (2, 105-111).
Figure 1-9: Structure of siRNA
The structure of the siRNA is specific for complementary binding within RISC (82).
The siRNA complex is made up of 21 nucleotides, a 19 base pair section of duplex
and two overhanging nucleotides on the 3' end of each strand.
There are two separate processes for generating RNAi (Figure 1.10): siRNA
and microRNA pathways. Both silence protein function, but the siRNA
process occurs mainly in the cytoplasm of the cell, whereas the microRNA
process occurs within the cell’s nucleus. In the siRNA pathway, the specific,
complementary siRNA becomes incorporated into the RNAi-induced
silencing complex (RISC) and the sense strand is cleaved off, leaving the
antisense strand in the RISC. This siRNA antisense strand is able to
recognise the target sequences of cytoplasmic mRNA and direct the RISC for
mRNA target cleavage (82). The siRNA process is more commonly used in
the study of human therapeutics (105, 106).
The impact of the discovery of RNAi has been profound as a research
technique, increasing our understanding of the pathogenesis of multiple
conditions. However, its great application may not yet have been realised,
given its obvious therapeutic potential.
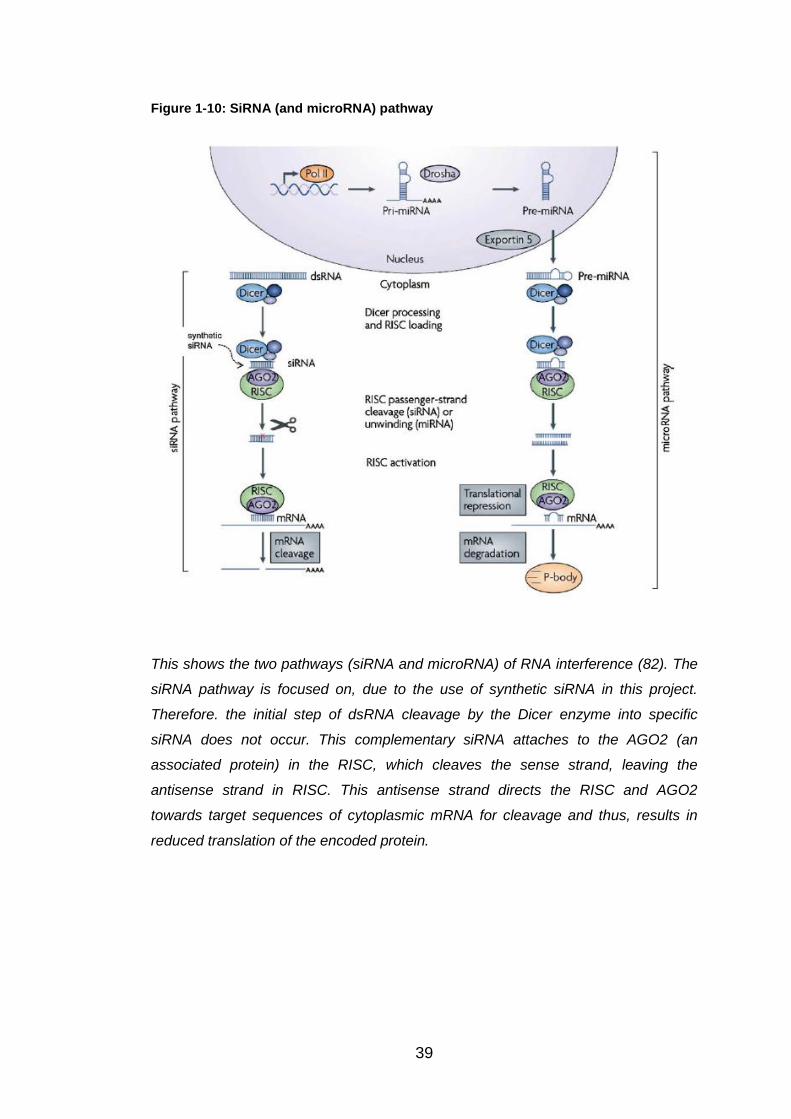
39
Figure 1-10: SiRNA (and microRNA) pathway
This shows the two pathways (siRNA and microRNA) of RNA interference (82). The
siRNA pathway is focused on, due to the use of synthetic siRNA in this project.
Therefore. the initial step of dsRNA cleavage by the Dicer enzyme into specific
siRNA does not occur. This complementary siRNA attaches to the AGO2 (an
associated protein) in the RISC, which cleaves the sense strand, leaving the
antisense strand in RISC. This antisense strand directs the RISC and AGO2
towards target sequences of cytoplasmic mRNA for cleavage and thus, results in
reduced translation of the encoded protein.

40
1.4 Innate Resistance Genes
Much of this thesis is based on studies initiated by Prof. Ralph Tripp in
Atlanta at University of Georgia. He has used high throughput screening to
investigate which genes regulate influenza replication, by knocking down the
expression of host genes in airway epithelial cells using siRNA. He has
provided the Alder hey RSV group with a list of 26 genes which, when
knocked down, caused increased influenza replication in airway epithelial
cells.
Table 1.1 shows the names and details of these genes. For most of them,
little published information is available.

41
Table 1-1: Name and details of E3 subset ubiquitin ligases
Gene/Protein Information
Kinase Family
Mitogen Activated Kinase Kinase Kinase 1 (MAP3K1) (112)
Found on chromosome 5. Serine/Threonine Kinase. Signal transduction. Activated by phosphorylation pathway and requires Mg2+ before it can phosphorylate other proteins.
Phosphatase Family
Protein Phosphatase, Mg2+/Mn2+ Dependent, 1H (PPM1H) (112)
Found on chromosome 12. Member of PP2C phosphatase family. Involved in signal transduction.
G-Protein Coupled Receptor Family
G Protein-Coupled Receptor 34 (GPR34) (112-115)
Found on X chromosome. Membrane protein. Orphan receptor in rhodopsin-like subset of GPCR family. Triggers intracellular signals through the stimulation of heterotrimeric G proteins. No interactions associated with this protein found.
Histamine Receptor H2 (HRH2) (112)
Found on chromosome 5. Maintains efficient cell growth and development.
HRH4 (112) Found on chromosome 18. Role in inflammation and allergic reactions.
Chemokine (C-C motif) Receptor 7 (CCR7) (116, 117)
Found on chromosome 17 and located on surfaces of B cells, T cells and DCs. Activated by two ligands: CCL19 and CCL21. Role: migration of immune cells to lymph nodes and development of DCs. RSV-infected CCR7-deficient mice suffered more severe disease, with impaired migration of immune cells and reduced T cell responses.
Chemokine (C-X-C motif) Receptor 3 (CXCR3) (118)
Found on chromosome X and binds to CXCL9, CXCL10 and CXCL11. Leukocyte trafficking and T cell polarisation.
Chemokine (C-X3-C motif) Receptor 1 (CX3CR1) (112)
Found on chromosome 3. Unique receptor for chemokine fractalkine (CX3CL1). Ability to bind with RSV G gylcoprotein.
E3 Subset Ubiquitin Ligases
Ring Finger Protein (RNF) 149 and RNF150 (112)
Found on chromosome 2 and 4, respectively. Roles in protein and zinc binding.
RNF168 (119-121) Found on chromosome 3. DNA damage ubiquitin ligase via post-translational modifications and contributes to K63-polyubiquitin chains. Chromatin binding by inducing ubiquitinylation of histones.
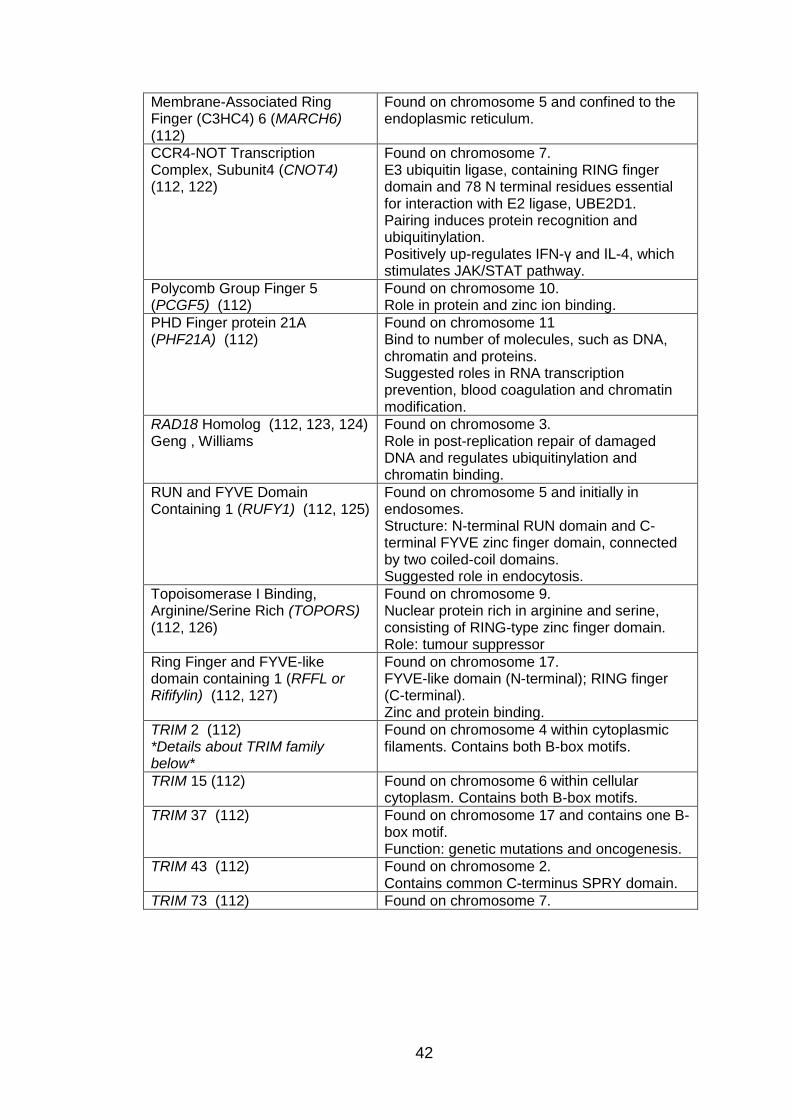
42
Membrane-Associated Ring Finger (C3HC4) 6 (MARCH6) (112)
Found on chromosome 5 and confined to the endoplasmic reticulum.
CCR4-NOT Transcription Complex, Subunit4 (CNOT4) (112, 122)
Found on chromosome 7. E3 ubiquitin ligase, containing RING finger domain and 78 N terminal residues essential for interaction with E2 ligase, UBE2D1. Pairing induces protein recognition and ubiquitinylation. Positively up-regulates IFN-γ and IL-4, which stimulates JAK/STAT pathway.
Polycomb Group Finger 5 (PCGF5) (112)
Found on chromosome 10. Role in protein and zinc ion binding.
PHD Finger protein 21A (PHF21A) (112)
Found on chromosome 11 Bind to number of molecules, such as DNA, chromatin and proteins. Suggested roles in RNA transcription prevention, blood coagulation and chromatin modification.
RAD18 Homolog (112, 123, 124) Geng , Williams
Found on chromosome 3. Role in post-replication repair of damaged DNA and regulates ubiquitinylation and chromatin binding.
RUN and FYVE Domain Containing 1 (RUFY1) (112, 125)
Found on chromosome 5 and initially in endosomes. Structure: N-terminal RUN domain and C-terminal FYVE zinc finger domain, connected by two coiled-coil domains. Suggested role in endocytosis.
Topoisomerase I Binding, Arginine/Serine Rich (TOPORS) (112, 126)
Found on chromosome 9. Nuclear protein rich in arginine and serine, consisting of RING-type zinc finger domain. Role: tumour suppressor
Ring Finger and FYVE-like domain containing 1 (RFFL or Rififylin) (112, 127)
Found on chromosome 17. FYVE-like domain (N-terminal); RING finger (C-terminal). Zinc and protein binding.
TRIM 2 (112) *Details about TRIM family below*
Found on chromosome 4 within cytoplasmic filaments. Contains both B-box motifs.
TRIM 15 (112)
Found on chromosome 6 within cellular cytoplasm. Contains both B-box motifs.
TRIM 37 (112) Found on chromosome 17 and contains one B-box motif. Function: genetic mutations and oncogenesis.
TRIM 43 (112)
Found on chromosome 2. Contains common C-terminus SPRY domain.
TRIM 73 (112) Found on chromosome 7.

43
These 26 'innate resistant genes' can be grouped into four families: Kinases
(1 gene), Phosphatase (1 gene), G Protein Coupled receptors (6 genes) and
Ubiquitin E3 Ligases (18 genes). These families are described below, along
with a few of the genes where more published information is available.
1.4.1 Kinase Family
The kinase cascade signals in response to extracellular stimuli and
compromises mitogen activated protein (MAP) kinase (MAPK), MAP kinase
kinase (MAP2K) and MAP kinase kinase kinase (MAP3K). The activated
cascade is involved in a number of cellular activities, such as cell growth,
migration, proliferation, differentiation, apoptosis and signal transduction, and
is regulated through a phosphorylation pathway from MAP3K to MAP2K to
MAPK. In total there are 13 members of the MAPK family, with the first being
discovered in the 1980s (128-131).
The only kinase identified by Prof Tripp was MAP3K1. This serine/ threonine
kinase is located on chromosome 5 and is important in the signal
transduction cascade that involves ERK and JNK pathways. It is triggered by
the phosphorylation pathway, and requires Mg2+ before it can phosphorylate
any other proteins (112).
1.4.2 Phosphatase Family
Protein phosphorylation and de-phosphorylation of both the kinase and
phosphatase families is pivotal for normal cell function and signal
transduction (132). Phosphates can block the phosphorylation relay between
MAP3K and MAP2K, and thus, have the power to alter the MAPK activity
regulating cell proliferation, survival or apoptosis (131, 133).
In total there are three main Phosphatase groups: 1) the Phosphoprotein
phosphatase (PPP) superfamily (including PP1, PP2A and PP2B families); 2)
the Transcription factor II F (TFIIF) superfamily; and 3) the Protein
phosphatase magnesium (Mg2+) and/or Manganese (Mn2+)-dependent (PPM)
superfamily (including PP2C family) (131). This last superfamily contains one
of the proteins identified in Atlanta (PPM1H).

44
PPM1H is a member of the PP2C phosphatase family located on
chromosome 12. There is no published data about PPM1H in association
with infection. Also, no interactions have been found between PPM1H and
other structures. From the information above, we can infer that PPM1H must
be involved with the MAPK cascade, influencing cell functions and signal
transduction (112).
1.4.3 G Protein Coupled Receptor (GPCR) Family
GPCRs are the largest and most diverse cell-surface protein superfamily,
with at least 1% of the mammalian genomes encoding this receptor group.
There are approximately 900 genes that programme for GPCRs in humans,
including 400 that are specific olfactory receptors. They are an impressive
group of cellular signal transducing proteins, whose role, as their name
implies, is to transfer information about a physical entity across cells to
stimulate a response. Their ability to mediate messages from a broad range
of ligands (including ions, hormones, neurotransmitters, odorants, lipids,
proteins and even photons) is a key feature of this family. This ability means
that these receptors play a role in external (e.g. photons inducing sight) and
internal (peptides inducing neurological effects) processes. Due to their
specificity, GPCRs are a popular choice for drug development research (134,
135).
They are also known as, seven transmembrane receptors, because of their
common structure; a central core domain consisting of seven
transmembrane-spanning hydrophobic α-helices. This complex contains 25-
35 amino acid residues each with three intracellular and three extracellular
hydrophilic loops. The intracellular C-terminal region participates in G-protein
linking and phosphorylation, whereas the extracellular N-terminal region is
important in chemokine binding. These chemokine GPCRs can stimulate a
number of processes, such as JAK, STAT and MAPK pathways (113, 136-
138).
GPCRs in vertebrates are classified into 5 groups:
1. Family A – Rhodopsin- like. This is the largest and most ancient of the
five subsets. It is further divided into P2Y12-like receptor group,

45
including ADP receptor P2Y12 and P2Y13, and the UDP-glucose
receptor P2Y14, and orphan receptors – GPR34, GPR38 and GPR87.
2. Family B – Secretin - like.
3. Family C – Glutamate – like.
4. Family D – Adhesion.
5. Family E – Frizzled/Taste2.
Unfortunately, “orphan” GPCRs, whose structures are similar to other
GPCRs but with unknown agonists, do not fit into any of the categories, apart
from the above three (114, 115, 135, 139).
Prof. Tripp's group identified six members of the GPCR family as being
important in influenza replication.
These include two histamine receptors (HRH2 and HRH4) that are expressed
on mast cells, enterochromaffin-like cells and neurons. They have similar
functions, primarily as signal transducers. As their names suggest, they play
a role in activating cells in the presence of histamine, an active amine
produced in allergic reactions. HRH4 has a regulation role in the innate
immune response, causing chemotaxis of a number of innate cells, such as
eosinophils, mast cells and DCs. It is known to interact with one molecule –
IRF8, one of a family of proteins that regulate IFN genes. Its only known
relationship with respiratory disease is the release of HRH4 into the airways
in asthma, with HRH4 antagonists suggesting that they may reduce levels of
eosinophils within the lungs and Th2 responses (112, 140, 141).
For CXCR3 most research has focused on its interaction with CXCL10. Roe
et al discovered that during RSV bronchiolitis, the levels of CXCR3 positive
Th1 lymphocytes are considerably lower in blood (142). This decrease was
thought to be secondary to elevated CXCL10 levels, with all the levels
returning back to normal three months post infection. McNamara et al found
elevated CXCL10 levels in the lungs of RSV infected infants, supporting this
idea (65). Roe suggests that the migration of Th1 lymphocytes towards the
lungs during RSV infection might account for the low blood levels (142).
Another suggestion from Roe is that Th1 lymphocyte death may result in
increased CXCL10 levels (65, 142).

46
CX3CR1 is the unique receptor for the chemokine fractalkine (CX3CL1), the
only member of the CX3C motif chemokine family (143). Fractalkine is a
large, membrane-bound glycoprotein core connected via a mucin stalk to a
COOH-terminal transmembrane segment (144). It can be found in soluble or
membrane-bound forms and acts as either a leukocyte chemoattractant or
cellular adhesion substrate (143, 145, 146). Fractalkine is released by human
epithelial cells in reply to the proinflammatory response (TNF-α and IL-1) and
results in migration of CX3CR1-expressing cells (monocytes, NK cells and T
lymphocytes) (147-149). Tripp et al discovered that RSV G glycoprotein has
a similar structure to fractalkine, and also has the ability to bind to CX3CR1
(150). This glycoprotein contains the CX3C motif on amino acids 182 to 186
and no other chemokine motif (145, 146, 148, 149, 151). Both fractalkine and
G protein are large glycoproteins with intracellular, transmembrane and
extracellular sections, with both secreting and membrane-bound structures.
They both have heparin-binding domains that can attach to
glycoaminoglycans (GAGs) on cell membranes. When the G protein binds
CX3CR1, two responses are seen (150). Firstly, leukocyte migration and
secondly viral clearance is reduced. These data suggest that RSV G protein
and fractalkine compete for CX3CR1 binding (146, 149, 152).
1.4.4 E3 Subset Ubiquitin Ligase
Ubiquitinylation is a process that determines the post-translational fate of a
protein (153). As well as protein turnover, ubiquitylation is important in cell
cycle development, DNA repair and signal transduction. It is thought that
viruses are able to affect this pathway, and recent data has shown that viral
entry into cells is blocked when ubiquitinylation is blocked (154).
Ubiquitylation involves the movement of ubiquitin, a stable 76 amino acid
protein, through an enzyme cascade to produce an isopeptide bond between
the ubiquitin and a lysine on a target protein (153). This bond is attached via
the C-terminus of the ubiquitin and the ϵ-amino group of the lysine. The
following three enzymes comprise the enzyme cascade (Figure 1.11):
ubiquitin-activating enzyme (E1), ubiquitin-conjugating enzyme (E2) and
ubiquitin ligase enzyme (E3). Most of the 'innate resistance genes' identified
47
by Prof. Tripp were E3 ubiquitin ligases, which contain a RING (Really
Interesting New Gene) domain. E3 ligases bridge the gap for the transfer of
the ubiquitin from the E2 site to the substrate. The RING-type E3 binds to E2
without modifying the structure and binds to the site furthest from E2’s active
site. This attachment is specific and initiates the chain development on the
lysine.
So far, over 650 human RING-type E3 ligases have been discovered.
Viswanathan has found that RSV can degrade STAT2 via the E3 ligase
complex (121, 153-156). 18 E3 ligases in total have been identified by Prof.
Tripp. This includes five members from the TRIM family (Section 1.4.4.1).
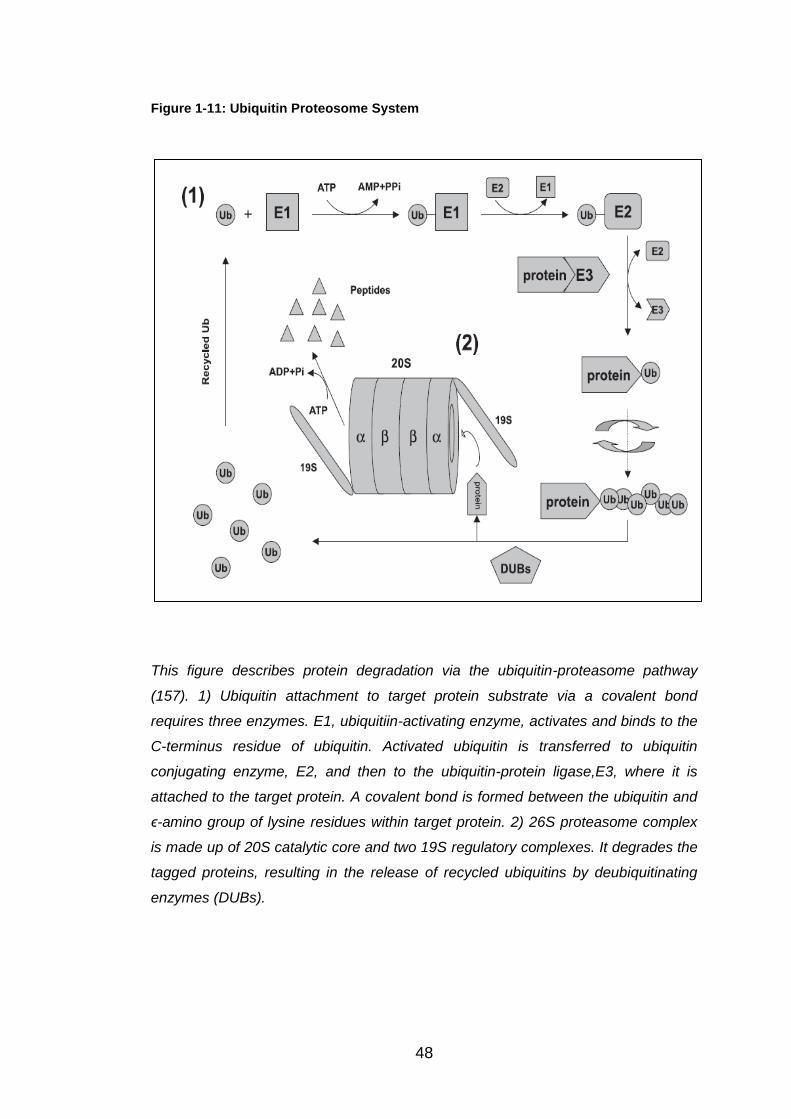
48
Figure 1-11: Ubiquitin Proteosome System
This figure describes protein degradation via the ubiquitin-proteasome pathway
(157). 1) Ubiquitin attachment to target protein substrate via a covalent bond
requires three enzymes. E1, ubiquitiin-activating enzyme, activates and binds to the
C-terminus residue of ubiquitin. Activated ubiquitin is transferred to ubiquitin
conjugating enzyme, E2, and then to the ubiquitin-protein ligase,E3, where it is
attached to the target protein. A covalent bond is formed between the ubiquitin and
ϵ-amino group of lysine residues within target protein. 2) 26S proteasome complex
is made up of 20S catalytic core and two 19S regulatory complexes. It degrades the
tagged proteins, resulting in the release of recycled ubiquitins by deubiquitinating
enzymes (DUBs).

49
1.4.4.1 Tripartite-Motif Protein (TRIM) Family
Five members of the TRIM superfamily have been identified by Prof. Tripp.
This superfamily, a subset of the ubiquitin E3 ligase family, is made up of
over 70 members (158) who encode proteins involved in a number of
biological processes, and are mainly found in both the cell cytosol and
nucleus (159). Each member consists of the same specific tripartite motif:
RING domain, one or two B-box motifs and a Coiled-coil region. Because of
this structure, TRIM members can also be called RBCC proteins (160).
RING domain: a zinc-finger binding motif located on the N terminus of the
TRIM members, within 10-20 amino acids of the initial methionine. As
mentioned above, it is an important component in E3 ubiquitin ligases and
thus is involved in ubiquitylation and protein-protein interactions (161).
B-box motifs: are cysteine-rich zinc-binding domains. Either 1 or 2 B-box
motifs are present in the TRIM member. If both B-box motifs are present then
B-box 1 always comes before B-box 2, whereas if only on B-box motif is
present then this will always be motif 2. These are unique to the TRIM family
and are important in viral replication (161). Uchil et al investigated the
absence of the B-box in TRIM15, and found that it caused the disappearance
of its antiviral state (158).
Coiled-coil domain: is made up of a number of α-helices, which mediates
homomeric and heteromeric interactions. They are present in a number of
proteins and are particular important in self-association (160).
The classification for the TRIM family is determined by the C-terminus, which
was discovered by Short and Cox. There are ten individual motifs, making up
nine families – CI to CIX. Two separate groups have since been added; CX
which contains TRIM45 and CXI for TRIM13 and TRIM59 as they do not fit
into the other groups. The most common C-terminals are: PRY domain with
approximately 61 amino acids and SPRY which consists of around 140
amino acids (161).
In recent data, it has been discovered that TRIMs have a role in innate
immunity. As mentioned above IFN-I programmes the antiviral state and from
this data has shown that IFN-I can up-regulate a number of TRIMs in

50
response to a viral infection (162). The TRIMs ability to inhibit the entry of the
virus, transcription and spread means research has begun to focus on its role
in immune signalling and antiviral environment (158-160, 162-164)
1.5 Aims and Objectives
This MPhil thesis is a continuation of the work undertaken by Professor R.
Tripp who provided the Alder Hey RSV group with a list of innate resistance
genes that when knocked down by siRNA, increased influenza replication in
airway epithelial cells
The aim of my work over this past year has been:
To determine whether I could ‘knockdown’ the expression these
twenty-six genes in airway epithelial cells using a similar siRNA
protocol to that used by Prof. Tripp.
To determine which genes provide protection against both influenza
and RSV, by infecting ‘knockdown’ cultured epithelial cells with RSV,
and measuring viral replication and RSV N gene expression.
To further investigate the significance of these results by focusing on
some of these genes in more detail.

51
2 Materials and Methodology
2.1 Cell Culture
A549 cells (a type II pulmonary epithelial cell line) were grown in Dulbecco’s
Modified Eagles Medium (DMEM, Sigma). Medium was supplemented with
10% Foetal Calf Serum (FCS, Sigma), L-glutamine 200mM (Sigma),
Penicillin 10,000units/ml (Sigma) and Streptomycin 10mg/ml (Sigma).
The cells were sub-cultured two to three times a week at a concentration of
106 cells/ml of fresh media in T75 flasks, incubated at 37oC with 5% carbon
dioxide.
2.1.1 Seeding A549 cells
Stock A549 cells were cultured as above and in each experiment seeded as
follows:
Media was removed from a T75 flask of cells, which were washed once with
10ml of Phosphate Bovine Saline (PBS). 5ml of 0.25% trypsin 0.02% EDTA
(Sigma) was then added and the flask was incubated at 37oC for two
minutes. The flask was then tapped to dislodge cells from the base of the
flask. 10ml of FCS supplemented media was then added (L-glut, Strep +
Pen) to neutralise and deactivate the trypsin. Cells were then centrifuged at
700 x g in room temperature for ten minutes, and the supernatant removed.
The pellet was resuspended in 5ml of media and the number of cells counted
using a haemocytometer. Depending on how many cells were needed, cells
were diluted with DMEM plus 10% FCS and pipetted into each well or flask.
2.2 RSV Preparation
2.2.1 RSV Propagation
Although I did not prepare all the RSV stocks over the year, the same
method of preparation was used for each batch.
52
Day One:
Hep2 cells were seeded at 30,000 cells/cm2 in a total volume of 15ml of
DMEM plus 10% FCS, in a T75 flask, and grown for 24 hours at 37oC in 5%
CO2 until 50% confluent.
Day Two
Medium was removed from cells at 50% confluence, and cells washed twice
with PBS. 500μl of an RSV A2 stock was placed in 4ml of FCS-free medium
and added to the flask of cells. To ensure the stock spread over the whole
flask they were rocked gently for two hours at 37oC.
13ml of medium (+ 2% FCS) was then added and the flask left overnight in
the incubator.
Day Three
The media was changed to ensure that both cells and virus had enough
nutrients and the flask was again incubated overnight at 37oC.
Day Four
Usually 48 hours post infection, infected cells from cultures showing visible
signs of cell death and detachment were harvested using a cell scraper. To
ensure virus integrity, the following steps were carried out rapidly and cells
kept on ice so that the RSV did not begin to degrade. The harvested cells
were placed into a 50ml tube and spun down at 1500rpm for 5mins at 4oC.
Supernatants were removed into a separate tube on ice and the pellet
resuspended in 2ml of the removed supernatant and mixed thoroughly,
before removing 1 ml into two microcentrifuge tubes on ice. The cells were
lysed using a 25gauge needle and 1ml syringe for ten passes on ice. This
caused the Hep2 cells to burst open and release RSV. Promptly, 500μl was
transferred to four pre-labelled cryovials and snap froze in liquid nitrogen.
Vials were ultimately stored at -70oC.
2.2.2 RSV Plaque Assay
The PFU per ml for each batch of RSV was measured using the following
protocol.

53
Day One:
2 x 10⁴ A549 cells per well were seeded into a flat bottomed 96 well plate. In
total, 27 wells (9x3) were used per batch of RSV, which was grown in DMEM,
supplemented with 10% FCS, L-glutamine, penicillin and streptomycin, at
37oC for 48 hours.
Day Three:
Eight two-fold serial dilutions of RSV stock to be titred were prepared as
follows. 500μl of FCS-free DMEM was placed into the first tube and 250μl in
seven further tubes, each prepared on ice to prevent the RSV from
degrading. RSV was removed from the -70oC and snap thawed using a water
bath at 37oC. 5μl of this RSV was then added to the first tube and mixed well,
dilution 1:100. 250μl was then transferred from the first tube to the second
and doubling dilutions prepared until the eighth tube.
A549 cells were then washed with PBS and 50μl of the above dilutions,
added to wells in triplicate going horizontally along the plate. The plate was
then left in the incubator at 37oC for two hours. Then 100μl of supplemented
DMEM (with FCS) was added to each well and the plate incubated overnight
at 37oC.
Day Four:
Cells were first washed with 100μl PBS per well and then fixed with 100%
methanol containing 2% hydrogen peroxide (100μl/well) at room temperature
for 20 minutes. Cells were again washed with 100μl PBS, carefully avoiding
disruption to the monolayer using a multi channel pipette. Care was taken to
avoid ejecting PBS directly onto the monolayer.
After 20 minutes, 100μl of biotinylated Goat anti-RSV antibody (Serotec),
diluted 1/200 with PBS and 1% Bovine Serum Albumin (BSA), was added to
each well and the plate incubated for one hour at room temperature.
Cells were then washed twice (100μl/well) with PBS/1% BSA, before 100μl of
extravidin peroxidase (2mg/ml; Sigma-Aldrich) diluted 1:500 with PBS was
added to each well and then left for 30 minutes at room temperature.

54
Cells were washed twice again with 100μl PBS/1% BSA prior to 50μl of a
solution prepared using one Sigma-Fast Red Tablet diluted in 5mls of PBS,
being added to each well for stain development. This was left for
approximately ten minutes, or until the plaques appeared. The reaction was
stopped by addition of PBS and plaques counted. The dilution that produced
around 100 – 200 plaques per well was selected and each replicate counted
to gain an average value. Dilutions above and below this one were also
counted to limit error. The RSV plaques have been shown in Figure 2.1.
The plaque forming units per ml was calculated using the formula:
Number of plaques x dilution (e.g. 100, 200, 400 etc) x 20.
The dilution for each well was as follows:
Dilution 1 = 1/100
Dilution 2 = 1/200
Dilution 3 = 1/400
Dilution 4 = 1/800
Dilution 5 = 1/1600
Dilution 6 = 1/3200
Dilution 7 = 1/6400
Dilution 8 = 1/12800
The Multiplicity of Infection (MOI) used in experiments was calculated, as
was the ratio between the number of RSV particles and the number of target
cells within a specific area or sample. This was calculated by dividing the
RSV particles over the known cell number.
Figure 2-1: RSV plaques
formed during the plaque
assay protocol.
55
2.2.3 RSV Infection
A549 cells were seeded into the correct sized plates or flasks as described in
Section 2.2.1. After 48 hours of incubation at 37oC, the cells were 90%
confluent and ready to be infected. The cells were washed once with PBS
prior to infection. Stock RSV was snap thawed using a water bath at 37oC
quickly to avoid virus degradation. Depending on the dilution and volume
required, the specific amount of RSV was mixed with FCS-free media and
placed onto the cells.
The cells were left to incubate at 37oC again for two hours, before
supplemented (+FCS) media was added. Following infection, cells were left
for either 24 or 48 hours depending on the experiment being undertaken.
2.3 RNA Extraction and Isolation
The extraction and isolation of RNA methodology is as described by the
manufacturers of TRIzol® reagent, Invitrogen.
2.3.1 Homogenising Sample
Culture supernatants were removed from the cells and stored at -20oC for
future experiments. The samples were then homogenised by TRIzol®
reagent (Invitrogen), which isolates good quality RNA from the A549 cells.
TRIzol® is a monophasic solution made up of phenol and guanidine
isothiocyanate. TRIzol® reagent can be a health hazard and must be used in
a fume cupboard and then neutralised with 1% sodium hydroxide before
being disposed of.
0.75ml of TRIzol® was used per 0.25ml of sample containing 5-10x106 cells.
Insufficient volumes would have caused DNA contamination within the
isolated RNA. It was important not to wash the cells before using the TRIzol®
because it would have increased the possibility of degradation of the mRNA.
The sample was pipetted up and down a number of times to ensure all the
cells were in the TRIzol® solution. Each sample was then placed into
individual tubes.

56
2.3.2 Phase Separation
The homogenised sample was then incubated at room temperature for five
minutes to ensure complete dissociation of nucleoprotein complexes had
occurred. Next, 0.2ml of chloroform per 1ml of TRIzol® initially used was
added to each sample, followed by a vortex for fifteen seconds to be sure
that they were thoroughly mixed. The samples were then incubated for two
minutes at room temperature before being centrifuged at 12,000 xg for ten
minutes. After this, the sample separated into three different layers: 1) lower
red phenol-chloroform phase; 2) interphase; 3) colourless upper aqueous
phase, which makes up approximately 50% of the volume and is where the
RNA was located.
The aqueous layer was removed carefully by angling the tube to 45o and
pipetting the clear layer. It was important to only get the one layer to prevent
DNA contamination. This solution was then placed into a new and clean tube.
2.3.3 RNA Precipitation
0.5ml of 100% isopropanol per 1ml of TRIzol® used was added to each
sample before being vortexed for fifteen seconds. The samples were then
placed into the -20oC freezer for 30 minutes. At this point the RNA was
normally invisible, but after freezing, the samples were centrifuged at 12,000
xg for fifteen minutes. This resulted in a gel-like pellet forming on the side
and bottom of each tube.
2.3.4 RNA Wash
The pellet was then washed with 1ml of 75% ethanol per 1ml of TRIzol®
used and kept in ethanol for storage. When needed, this solution was
centrifuged at 7500 xg for five minutes and the ethanol removed. The pellet
was then air dried for approximately five to ten minutes and once dry, 10μl of
sterile, nuclease- free water added to the pellet.
2.3.5 Reverse Transcriptase
cDNA (complementary DNA) for template real-time PCR to take place was
prepared using a High Capacity cDNA Reverse Transcription Kit (Applied

57
Biosystems). This supports cDNA synthesis using the random primer
scheme. The following components were added to each mRNA sample to be
reverse transcribed:
1. 10X RT Buffer 2μl/tube
2. 25X dNTP Mix (100mM) 1μl/tube
3. 10X RT Random Primers 2μl/tube
These components and 4μl of sterile, nuclease-free water were added to
each tube with a fourth component:
4. MultiscribeTM Reverse Transcriptase 1μl/tube
Samples were then left in a water bath at 37oC for one hour.
Once the cDNA was synthesised it was stored in -20oC until required for PCR
and then diluted either 1 in 5 or 1 in 10, with nuclease-free water, depending
on how much cDNA was needed.
2.4 Real-Time Polymerase Chain Reaction
A Polymerase Chain Reaction (PCR) amplifies a specific region of DNA to
generate thousands or millions of copies of that sequence. In this study,
quantitative real-time PCR was used to detect both the presence and the
concentration of RSV within the sample, and to confirm that the gene
expression had been inhibited through siRNA transfection.
Kerry Mullis, who went on to gain a Nobel Prize for this in 1993, discovered
traditional PCR in 1983. Real-Time PCR, applied in this study, was
introduced by Applied Biosystems in 1996, and has since become the most
sensitive and precise technique for detecting and quantifying both RNA and
DNA. Real-Time PCR is able to quantify the DNA during the early stages of
the reaction, whereas the Traditional PCR requires the use of Agarose gels
for detection at the end of the final phase. Therefore, difficulty with the gels,
transfer to membrane, use of radioactive probes and errors formed from
using the film as a detector have all been eradicated. As with all methods,
Real-Time PCR has its own limitations, but these can be reduced by
ensuring uniformity of the components from well-to-well by thoroughly mixing

58
all reagents and dispensing them equally. Dorak’s hint for this is “to use
calibrated, adjustable pipettors and to have a steady hand!” (165)
2.4.1 Principles of Polymerase Chain Reaction
There are four phases in total throughout the PCR amplification:
1. Baseline – amplification levels below those that can be detected by
the Real-Time PCR. Although no signal is released during these
cycles, exponential amplification is taking place.
2. Exponential – first signals above detection level. If assay is 100%
efficient, the product should double exactly per cycle to produce a
number of amplicons. It is during this phase the Real-Time PCR
quantifies the amplicons.
3. Linear – efficiency of amplification reduces as the reaction substances
are consumed. Instead of producing two amplicons, each molecule will
degrade to 1.95 and continue to decline.
4. Plateau – reaction ceases and no more products synthesised for
remaining cycles.
The threshold level is the point at which the fluorescent signal is detected,
above the background. This line is set during the exponential phase. Once
the sample reaches this level, the cycle number is quantified and this is the
result obtained from the Real-Time PCR – Cycle Threshold (Ct) (165).
There are three components to the Real-Time PCR instrument:
1. Light source – establishes receptor dye range detected by instrument
2. Detection system – spectral range and sensitivity of assay determined
3. Thermocycling mechanism – monitors speed that assay is run and
temperature changes between each wells (165).
2.4.2 Reagents and Processing the Polymerase Chain Reaction
TaqMan® probes are linear oligonucleotides that anneal to the
complementary, specific sequence on the template located between the
Forward and Reverse primers. The advantage of these probes is that they
are specific for each related assay. These probes are added to the TaqMan®
gene expression master mix, which contains the enzyme DNA polymerase.
59
Once the primers have attached onto a cDNA template the TaqDNA
polymerase is rapid to follow and copies the strand. The probe will attach
itself within the path of the enzyme, and once presented the enzyme cleaves
the probe.
TaqMan® probes have two ends, the high energy dye, Receptor, at the 5’
end and low energy substance, the Quencher, on the 3’ end. When intact,
both dyes are in close proximity and the quencher suppresses the signal
from the receptor dye. Once cleaved by the DNA polymerase, the reporter
and quencher dyes separate and become further apart. Fluorescent signals
are released from the receptor as the quencher can no longer inhibit them.
The TaqMan® probe therefore relies on the enzyme to cleave the two ends
apart to produce the signal (165)
The receptor dye that I used was 6-FAM (6-carboxy fluorescein), which is
successfully excited at 488nM, giving off a strong signal. This type also
conjugates easily to the oligonucleotide probes (165).
During my Real-Time PCR experiments, I used a LightCycler 480 instrument
that holds a 96-well PCR plate. A total of 25μl of reagents were pipetted into
each well.
For all the TaqMan® probe assays (Life Technologies; Table 2.1)) used,
except RSV, 1.25μl was added, with 12.5μl of TaqMan® gene expression
master mix (Applied Biosystems), per well. The RSV probe volumes were
different because the three primers, RSVAF (forward), RSVAR (reverse) and
RSVN-TAQ, were obtained individually and prepared, in contrast to the Life
Technology probe assays that were supplied ready mixed. The RSV primers
were designed from Dewhurst-Maridor et al paper (Figure 2.2) (166), and
synthesised by Sigma. RSVAF and RSVAR primers were mixed together
with Nuclease-free water in a 1 in 10 dilution. The third primer, a probe with
FAM dye linked to the 3’ prime end RSVN-TAQ was diluted separately, with
Nuclease-free water, again in a 1 in 10 dilution. Therefore into each well,
1.25μl of the mixed RSVAF and RSVAR probes, 1μl of RSVN-TAQ probe
(Section 3.3.1.1) and 12.5μl of TaqMan® gene expression master mix, was
added.
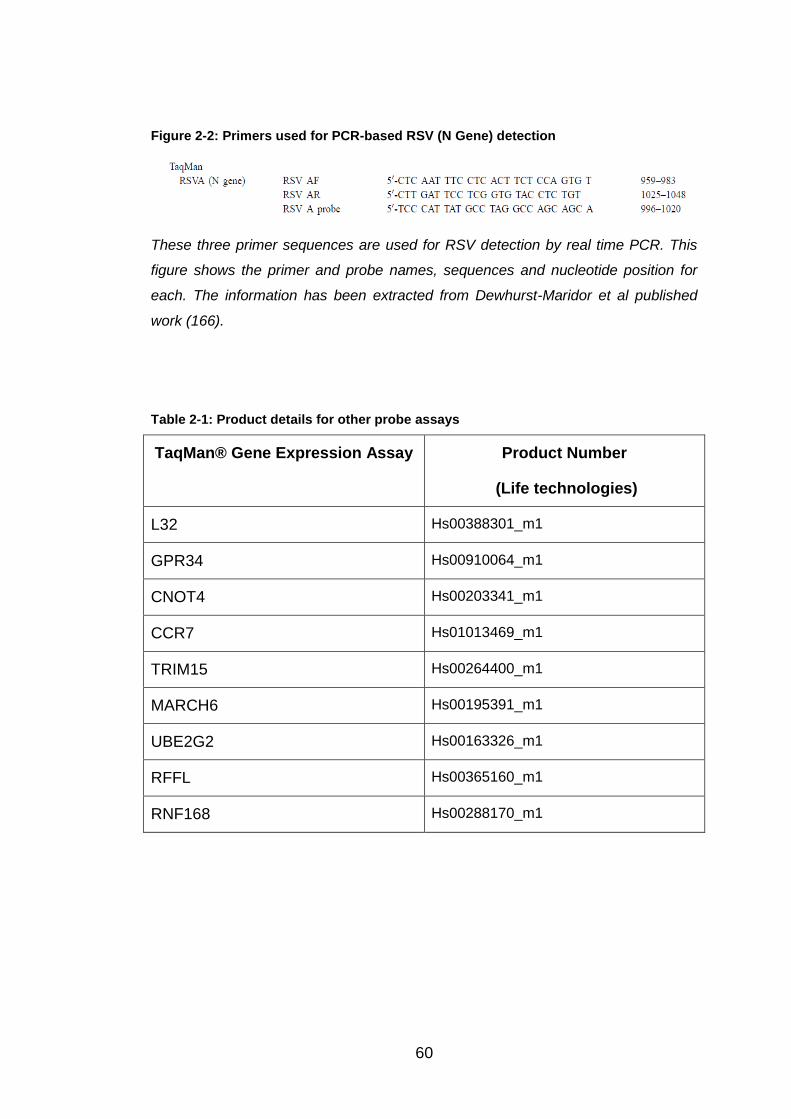
60
Figure 2-2: Primers used for PCR-based RSV (N Gene) detection
These three primer sequences are used for RSV detection by real time PCR. This
figure shows the primer and probe names, sequences and nucleotide position for
each. The information has been extracted from Dewhurst-Maridor et al published
work (166).
Table 2-1: Product details for other probe assays
TaqMan® Gene Expression Assay Product Number
(Life technologies)
L32 Hs00388301_m1
GPR34 Hs00910064_m1
CNOT4 Hs00203341_m1
CCR7 Hs01013469_m1
TRIM15 Hs00264400_m1
MARCH6 Hs00195391_m1
UBE2G2 Hs00163326_m1
RFFL Hs00365160_m1
RNF168 Hs00288170_m1

61
Table 2-2 A table showing temperature cycle used for amplification. Recommended by
Applied Biosystems.
The diluted cDNA was then added to each well to make the total volume up
to 25μl. Therefore, for all the wells with probes within, except RSV, 11.25μl of
cDNA was required, whereas 10.25μl of cDNA was used for the RSV probe
wells. Duplicates were prepared for each sample, so an average could be
calculated, limiting any possible errors. The L32 probe assay was used as a
control throughout my work, as RSV does not affect its expression in A549
cells.
The PCR plate was then covered with a film and spun in the centrifuge for
fifteen seconds to ensure all the contents were at the bottom of the well. The
plate was then placed into the LightCycler 480 Real-Time PCR instrument
and MxPro software used to complete the procedure. All the wells were
labelled accordingly with the correct probe and cDNA. The next step was to
set the correct temperature cycle for the PCR to work efficiently, and this
depended on the TaqMan® gene expression master mix used. I purchased
mine from Applied Biosystems and it contained “AmpliTaq Gold® DNA
Polymerase UP (Ultra Pure), Uracil-DNA Glycosylase (UDG), dTNPs with
dUTP, Passive Reference 1 and optimized mix components”.
Table 2-2 shows the temperature cycle and conditions used for amplification.
Step
UDG
Incubation
AMPLITaq
Gold, UP
Enzyme
Activation
PCR
HOLD
HOLD
CYCLE (60 cycles)
Denature Anneal/
Extend
Time 2 min 10 min 15 sec 1 min
Temp 50oC 95oC 95oC 60oC

62
2.5 Innate DB
InnateDB is a search tool available to investigate innate immune responses
within mammalian species. The database contents of genes, protein,
interaction and signalling responses have their roles in innate immunity
highlighted. InnateDB manually curate information by systematically
reviewing the experimentally-validated interactions from biomedical literature.
Human interactions especially, are completed with descriptive annotations of
each molecule, such as published reference and interaction detection. The
interactions are presented through the visual Cerebral programme, a
Cytoscape network visualisation software that presents the interaction
pathways in an intuitive layout.
The database is freely accessible for public online, and can be used to
search for specific genes or proteins of interest, with their associated
interactions and pathways. It includes over 18,000 molecular interactions and
over 1200 genes annotated relative to innate immunity. This tool has been
widely available since May 2008, and has been updated regularly since, with
a large update having taken place in February 2012.
The database is also a member of the “International Molecular Exchange
Consortium” (IMEx), which is detected to investigate protein-protein
interactions, through curative search techniques of published literature and
combining together onto websites.
2.6 Statistical Analysis
Due to the large variation between experiments, statistical analysis was not
possible. For each gene investigated, the mean (SEM) was calculated and
graphs produced with GraphPad Prism 6.

63
3 Validation of Candidate Innate Genes in RSV
Replication using SiRNA Transfection
3.1 Introduction
Twenty-six potential innate resistance genes to RSV infection were
investigated (Section 1.4). Reduced expression of each of these genes, by
siRNA knockdown had been shown to lead to increased influenza expression
in infected A549 cells (Prof. R Tripp). This chapter describes the work
undertaken to determine if any of these genes also influence RSV replication.
Prof. Tripp kindly provided siRNA with an optimised protocol for its use in
A549 cells. Prior to siRNA knockdown; I firstly optimised a quantitative real
time reverse transcription PCR assay to measure RSV replication (in this
case RSV N gene mRNA expression). Secondly, I determined the optimum
amount of RSV with which to infect the epithelial cell cultures. Finally, I tested
the efficiency of siRNA knockdown to ensure effective knockdown was
occurring. Only then did I measure the effect of knocking down expression of
each specific gene on RSV replication.
The online database, InnateDB (www.innateDB.org), was used to look for
common or shared interaction points and pathways between the 26 genes.
3.2 Methodology
3.2.1 SiRNA Transfection Protocol
SiRNA were used to knockdown candidate innate resistant genes in A549
cells. This is a temporary knockdown whereby expression of each gene can
be reduced by up to 80%. The percentage knockdown is calculated by
comparing expression in siRNA treated and control siRNA treated cells using
a gene specific TaqMan® PCR assay. The knockdown protocol was kindly
supplied by Prof. R Tripp, University of Georgia, and lasted five days in total.

64
Day One:
On day one, A549 cells were transfected with siRNA (Prof. R. Tripp; Life
Technologies) by firstly preparing a dilute Dharmafect 1 solution (0.4μl/well
Dharmafect (R Tripp or ThermoSCIENTIFIC) and 14.6μl/well of Hank’s
Balanced Salt Solution (Sigma), left at room temperature for 5-10mins). 15μl
of this solution was then pipetted into each well of a 96-well flat-bottomed
plate. 2.5μl of 2 uM siRNA was added to each well in duplicates so an
average could be calculated, followed by 2.5μl siRNA dilution buffer (Prof. R.
Tripp), at a 1 in 5 dilution. This resulted in a total volume of 20μl per well.
Four wells of A549 cells per plate with no siRNA (two infected and two not
infected) were included to act as extra controls. For these, to keep the
volume the same, 5μl of siRNA buffer was used per well. The plate was then
incubated at room temperature for twenty minutes whilst the A549 cells were
prepared.
The cells were seeded as explained in Section 2.1.1 using the cell density of
15,000 A549 cells per 80μl per well. The plate was then placed into an
incubator at 37oC, 5% CO2 for two days.
Day Three:
On Day three, the cells were infected with RSV following the protocol
described in Section 2.2.3. For this experiment it was important that the RSV
concentration was kept the same to minimise any errors. Therefore for each
RSV batch used, the titre was determined by plaque assay (Section 2.2.2)
and dilutions tested for infection efficiency by PCR before use. 50μl of dilute
RSV, containing 15,000 plaque-forming units to give an MOI of 1, in FCS-free
media was placed into each well. After two hour incubation 100μl of
supplemented media per well was added to make a total volume of 150μl.
Following this, the plate was incubated for a further two days at 37oC and 5%
CO2.
Day Five:
Cell supernatants were removed from the wells and placed in individual 1.5ml
microcentrifuge tubes, before being frozen at -20oc for future work.

65
RNA was extracted from the cells and isolated following the protocols
described in Section 2.3, using reagent volumes in Table 3.1:
Table 3-1: Volumes of reagents for RNA isolation
Reagent Volume (μl)/ sample
TRIzol® 125 (per well) N.B. The TRIzol® from the
two duplicated wells was merged into the
same microcentrifuge tube, to make a
total of 250μl per tube.
Chloroform 50
Isopropanol 200
Ethanol 500
Messenger RNA was then reverse transcribed to cDNA, as explained in
Section 2.3.5, and analysed by PCR over 60 cycles (Section 2.4).
L32 and RSV probes were always used for each cDNA sample analysed.
Also, if possible, the probes specific to the gene knocked down in that
sample were used to calculate the percentage knockdown. A control siRNA
(an irrelevant siRNA not affecting the cell during transfection) was used each
time for comparison. Expression of L32, RSV and specific probes were all
compared with the levels expressed in control siRNA transfected cells.
3.2.2 RSV Dilution
For each batch of RSV used, an RSV titration experiment was done so that
the correct RSV dilution could be calculated.
Day One:
Using a flat-bottomed 96-well plate, A549 cells were seeded at 20,000
cells/100μl/well in supplemented medium. In total 18 wells were used, nine
across and two down. This was because eight dilutions were used with
repeats and the ninth was the non-infected control. Once seeded, the plate
was left for 48hours at 37oC and 5% CO2.

66
Day Three:
The cells were infected. After washing with PBS, nine tubes were set up on
ice. All nine tubes had 125μl of FCS-free media placed into them. The RSV
was snap thawed using a 37oC water bath and 25μl of RSV was pipetted into
the first tube and mixed. 125μl was then taken from the tube and transferred
to the second tube, where it was mixed and 125μl was removed from the
second and placed into the third tube. This carried on to the last where the
mixture was left to give a total of 250μl. The first tube was discarded, and the
second one therefore was dilution one, and so on.
Thus, 50μl from tube two/dilution one was placed into the first well on the
plate, and then its duplicate below. Again, 50μl of the third tube/dilution two
was added to the next well across, and the one underneath. This carried on
until eight dilutions were complete. The ninth wells across only required 50μl
of FCS-free media as they were non-infected.
The final dilutions were:
Dilution 1 – 1/10
Dilution 2 – 1/20
Dilution 3 – 1/40
Dilution 4 – 1/80
Dilution 5 – 1/160
Dilution 6 – 1/320
Dilution 7 – 1/640
Dilution 8 – 1/1280
After incubation at 37oC for two hours, 100μl of supplemented medium was
added to each well, and the plate incubated for a further 48hours.
Day Five:
RNA was extracted and isolated as in the previous section, using the reagent
volumes in Table 3.1. After reverse transcription, expression of L32 and RSV
N gene were measured by real time PCR and data expressed as relative
RSV expression in comparison to L32.

67
3.2.3 Analysing the Data
3.2.3.1 Analysing Knockdown Data
For eight out of the 26 genes, specific probes were used, so that the level of
siRNA knockdown could be calculated. The probes were chosen based on
the published literature.
The percentage of gene left within the A549 cells was calculated in five steps
as follows:
1) The average ct value for the house keeping gene L32 minus the
average ct value for the specific probe for the gene knocked down in
the sample. E.g. The L32 expression for the GPR34 transfected cDNA
minus the GPR34 expression (GPR34 probe) of the same cDNA
sample.
This step normalised the PCR data within each of the samples by
accounting for differences in mRNA and therefore cDNA. This
produced a ct value relative to L32 expression.
2) The average ct value for L32 expression of the control siRNA
transfected cDNA minus the average ct value for the specific probe
expression (e.g. GPR34) against the sample cDNA sample.
Each probe in the experiment is reacted with the control transfected
cDNA. This step allows normalisation of the control so it can be
compared to the value produced in step 1.
3) The cycle value produced in step 2 minus the cycle value produced in
step 1. Therefore it is the control value minus the specific value.
The difference between the control and the test samples expression of
each gene can be identified here, in cycles.
4) 2 to the power of n, where n = value determined in step 3.
This calculation converts the value from a ct number to the fold
differences. This particular calculation is because every cycle is a 2
fold change.
5) 100 divided by n, where n= the value calculated in step 4.
68
This converts the value into percentage, so the percentage of that
gene left in the A549 cells is known, and confirming the siRNA
affectivity.
3.2.3.2 Analysing RSV Expression Data
For each sample, the percentage RSV N gene expression based on RSV ct
value was calculated in four steps:
1) The average ct value for L32 expression of the sample minus the
average ct value for RSV expression of the same sample.
This step was done to normalise the PCR data. This calculation
allowed correction for some of the samples potentially having more
mRNA and therefore cDNA within them.
2) The expression value calculated in step 1 for each sample minus the
control expression in step 1.
In this step RSV expression was compared to that in the control.
3) 2 to the power of n, where n = value determined in step 2.
This is the conversion from ct values to fold differences. This particular
calculation is because every cycle is a 2 fold change.
4) N multiplied by 100, where n = value calculate in step 3.
This is the conversion to RSV N gene expression in percentage.
As step 2 compares the expression to the control, then the control value will
become zero at this point. Once it is converted to a numerical value it
becomes one, and thus is always 100% for each experiment.

69
3.3 Results
3.3.1 Initial PCR Assays
3.3.1.1 Determination of optimal RSVN-TAQ probe primer concentration
It was important for the PCR assays to be optimised. Firstly, different
concentrations of the RSVN-TAQ probe were analysed so that the
concentration decided upon would be most favourable.
Table 3.2 outlines the components and their volumes required at each
concentration per well, as they are different to the quantities described in
Section 2.4.2. Each concentration was duplicated to minimise error.
Figure 3.1 shows RSV expression using different RSVN-TAQ probe primer
concentrations. Based on these results, it was decided upon that 1μl
(50pmol) of RSVN-TAQ primer would be used in each PCR well, when
detecting RSV. 1μl was optimal as it had a good dynamic range allowing
clear discrimination between positive and negative samples on the PCR
graph, whilst keeping the amount used comparatively low, to avoid
unnecessary waste.
3.3.1.2 Determining if the PCR assay is quantitative
It was also important to be sure that the PCR assay was quantitative. This
was done by using the RSV primers to detect RSV expression in samples
containing different concentrations of RSV. RSV was serially diluted by an
increasing dilution at 1:10 in nuclease-free water over five samples, and then
analysed in the PCR machine.
This experiment confirmed that the PCR assays were within the range of the
instrument and number of cycles. The observations in Figure 3.2 showed that
the PCR signal was proportionate to RSV, proving that it was quantitative.
3.3.1.3 Determination of optimal RSV concentration for use
The RSV concentration also had to be optimised to ensure the correct
amount of RSV was used for each experiment. Figure 3.3 shows the RSV N
gene expression for a number of different RSV concentrations.
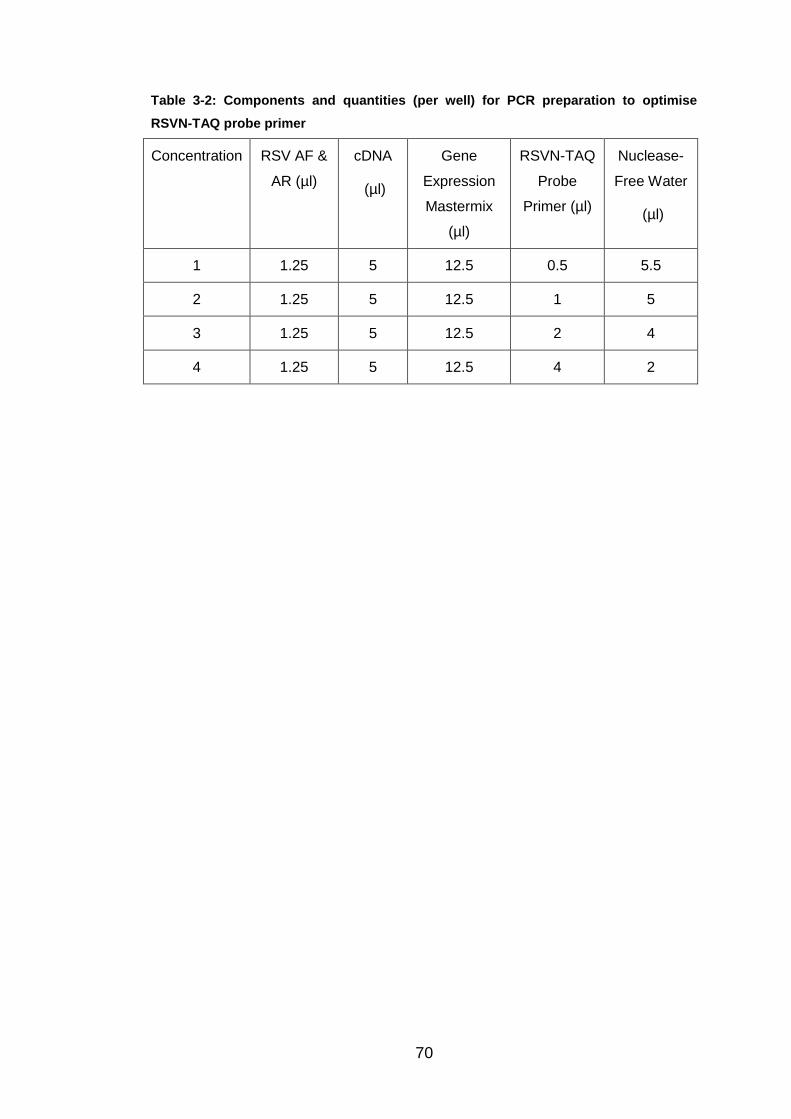
70
Table 3-2: Components and quantities (per well) for PCR preparation to optimise
RSVN-TAQ probe primer
Concentration RSV AF &
AR (µl)
cDNA
(µl)
Gene
Expression
Mastermix
(µl)
RSVN-TAQ
Probe
Primer (µl)
Nuclease-
Free Water
(µl)
1 1.25 5 12.5 0.5 5.5
2 1.25 5 12.5 1 5
3 1.25 5 12.5 2 4
4 1.25 5 12.5 4 2

71
Figure 3-1: PCR analysis of different RSVN-TAQ primer concentrations
This shows the Ct values obtained at different RSVN-TAQ primer concentrations
along each cycle. A total of 40 cycles was used. Duplicates were undertaken at
each concentration to minimise error. As labelled on the graph, four concentrations
of RSVN-TAQ primer were tested: 0.5, 1, 2 and 4μl.
Ct Value
4µl
2µl
1µl =
50pmol
0.5µl

72
Figure 3-2: Five RSV concentrations detected by RSV primers analysed on PCR
This shows the PCR analysis of RSV concentrations diluted by 1:10 over the five
samples. The ct values are given over 40 PCR cycles.
Ct Value
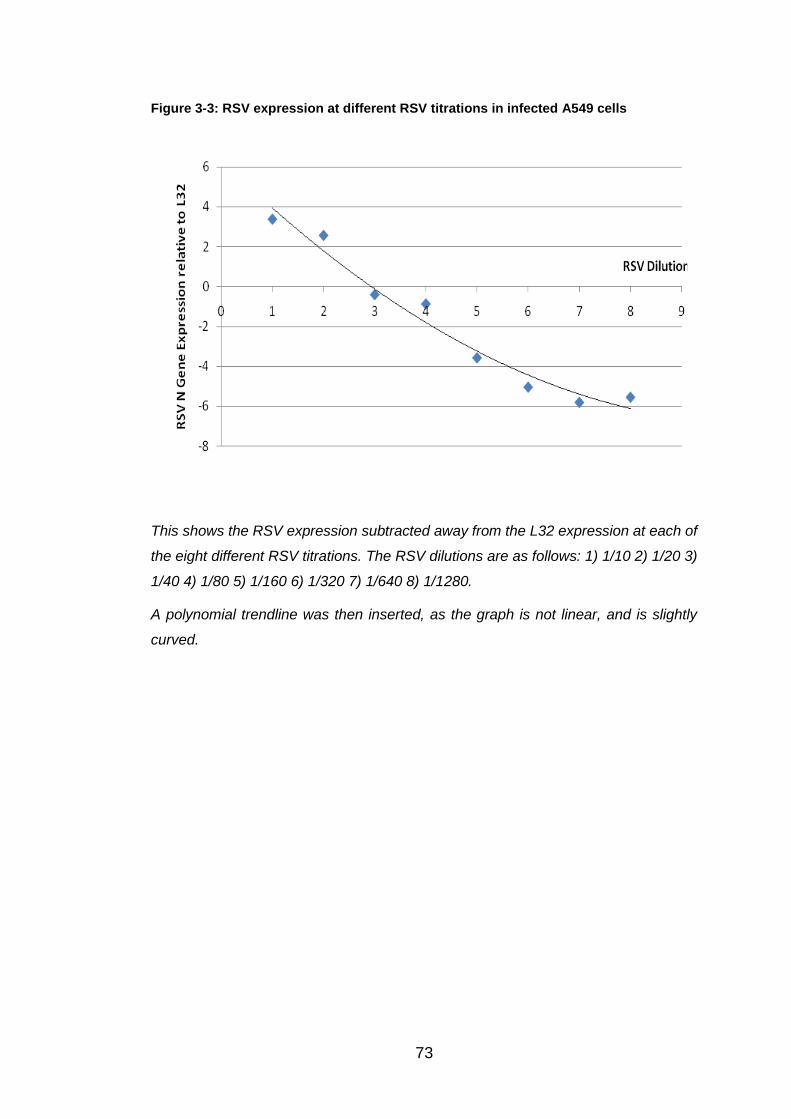
73
Figure 3-3: RSV expression at different RSV titrations in infected A549 cells
This shows the RSV expression subtracted away from the L32 expression at each of
the eight different RSV titrations. The RSV dilutions are as follows: 1) 1/10 2) 1/20 3)
1/40 4) 1/80 5) 1/160 6) 1/320 7) 1/640 8) 1/1280.
A polynomial trendline was then inserted, as the graph is not linear, and is slightly
curved.
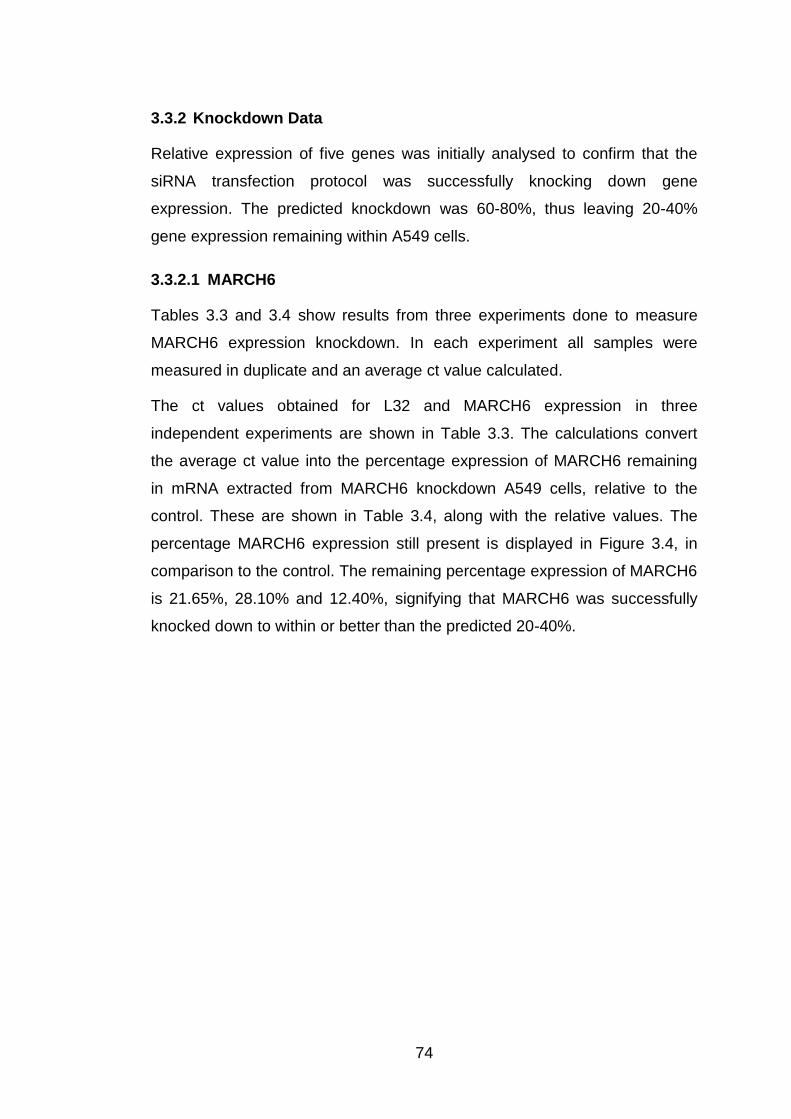
74
3.3.2 Knockdown Data
Relative expression of five genes was initially analysed to confirm that the
siRNA transfection protocol was successfully knocking down gene
expression. The predicted knockdown was 60-80%, thus leaving 20-40%
gene expression remaining within A549 cells.
3.3.2.1 MARCH6
Tables 3.3 and 3.4 show results from three experiments done to measure
MARCH6 expression knockdown. In each experiment all samples were
measured in duplicate and an average ct value calculated.
The ct values obtained for L32 and MARCH6 expression in three
independent experiments are shown in Table 3.3. The calculations convert
the average ct value into the percentage expression of MARCH6 remaining
in mRNA extracted from MARCH6 knockdown A549 cells, relative to the
control. These are shown in Table 3.4, along with the relative values. The
percentage MARCH6 expression still present is displayed in Figure 3.4, in
comparison to the control. The remaining percentage expression of MARCH6
is 21.65%, 28.10% and 12.40%, signifying that MARCH6 was successfully
knocked down to within or better than the predicted 20-40%.
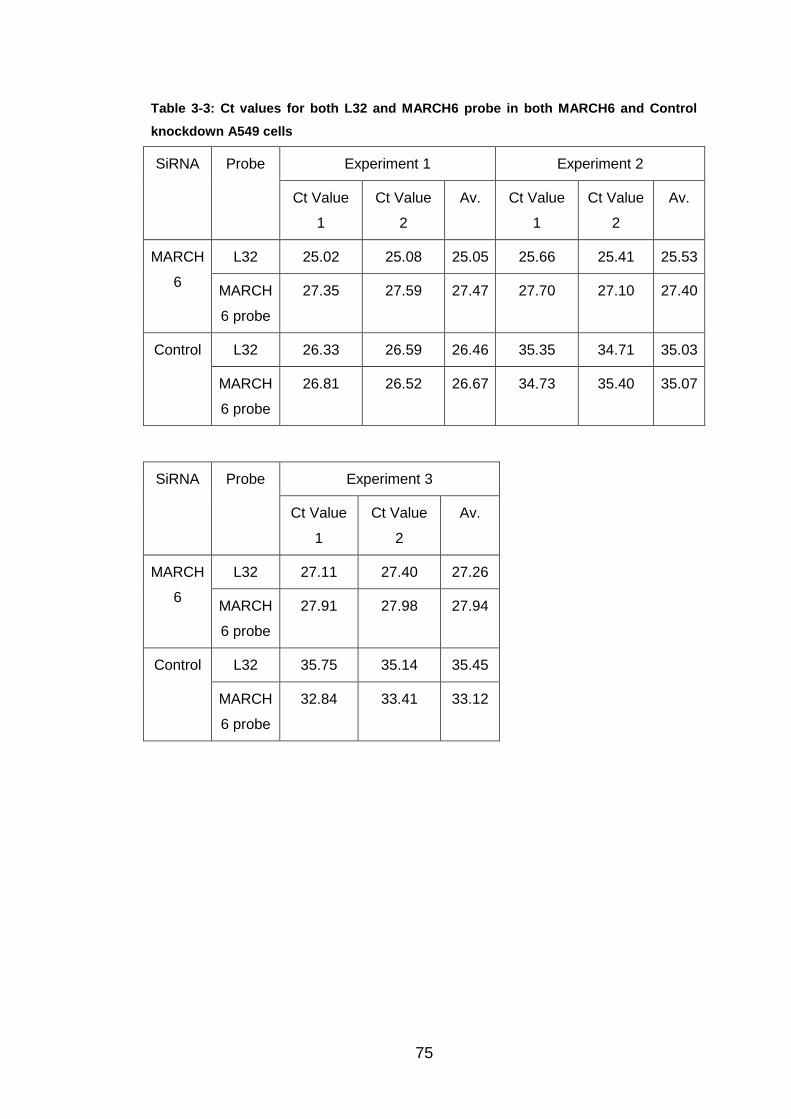
75
Table 3-3: Ct values for both L32 and MARCH6 probe in both MARCH6 and Control
knockdown A549 cells
SiRNA Probe Experiment 1 Experiment 2
Ct Value
1
Ct Value
2
Av. Ct Value
1
Ct Value
2
Av.
MARCH
6
L32 25.02 25.08 25.05 25.66 25.41 25.53
MARCH
6 probe
27.35 27.59 27.47 27.70 27.10 27.40
Control L32 26.33 26.59 26.46 35.35 34.71 35.03
MARCH
6 probe
26.81 26.52 26.67 34.73 35.40 35.07
SiRNA Probe Experiment 3
Ct Value
1
Ct Value
2
Av.
MARCH
6
L32 27.11 27.40 27.26
MARCH
6 probe
27.91 27.98 27.94
Control L32 35.75 35.14 35.45
MARCH
6 probe
32.84 33.41 33.12

76
Table 3-4: Calculations required showing the percentage of MARCH6 present in the
MARCH6 knockdown A549 cells
Step Exp 1
Calc.
Exp 1
Result
Exp 2
Calc.
Exp 2
Result
Exp 3
Calc.
Exp 3
Result
MARCH6
L32 value –
MARCH6
probe value
(Ct)
25.05 -
27.47
-2.42 25.53 -
27.40
-1.87 27.26 -
27.94
-0.69
Control
MARCH6 –
Control
MARCH6
probe (Ct)
26.46 -
26.67
-0.21 35.03 -
35.07
-0.04 35.45 -
33.12
2.32
Control –
Specific (Ct)
-0.21 -
-2.42
2.21 -0.04 -
-1.87
1.83 2.32 -
-0.69
3.01
2 to the
power of n
2^2.21 4.62 2^1.83 3.56 2^3.01 8.06
100/n (%) 100/4.62 21.65 100/3.56 28.10 100/8.06 12.40

77
Figure 3-4: The percentage of MARCH6 remaining within MARCH6 knockdown A549
cells, compared to the control
Control M.6 Exp 1 M.6 Exp 2 M.6 Exp 30
20
40
60
80
100
SiRNA transfected A549 cells% M
AR
CH
6 e
xp
ressio
n r
em
ain
ing
in
tran
sfe
cte
d A
549 c
ells
This shows the remaining percentage expression of MARCH6 in three different
experiments, compared to the control (=100%). MARCH6 has been abbreviated to
M.6 on the graph.
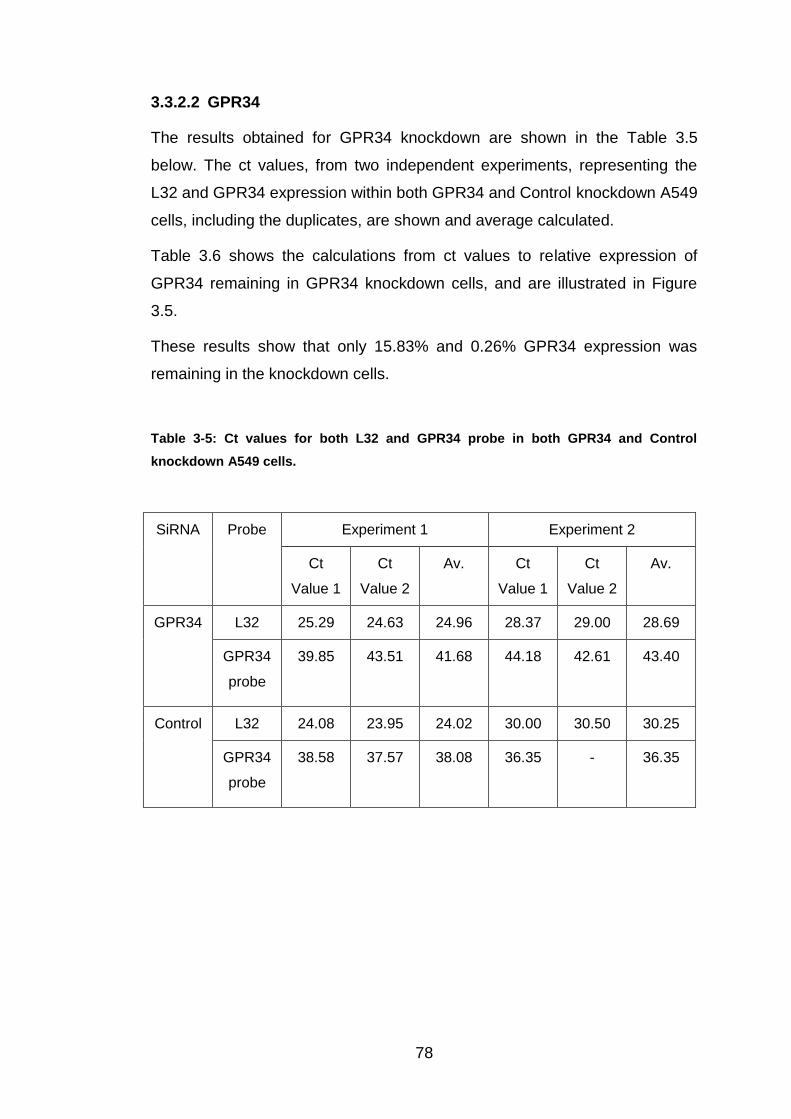
78
3.3.2.2 GPR34
The results obtained for GPR34 knockdown are shown in the Table 3.5
below. The ct values, from two independent experiments, representing the
L32 and GPR34 expression within both GPR34 and Control knockdown A549
cells, including the duplicates, are shown and average calculated.
Table 3.6 shows the calculations from ct values to relative expression of
GPR34 remaining in GPR34 knockdown cells, and are illustrated in Figure
3.5.
These results show that only 15.83% and 0.26% GPR34 expression was
remaining in the knockdown cells.
Table 3-5: Ct values for both L32 and GPR34 probe in both GPR34 and Control
knockdown A549 cells.
SiRNA Probe Experiment 1 Experiment 2
Ct
Value 1
Ct
Value 2
Av. Ct
Value 1
Ct
Value 2
Av.
GPR34 L32 25.29 24.63 24.96 28.37 29.00 28.69
GPR34
probe
39.85 43.51 41.68 44.18 42.61
43.40
Control L32 24.08 23.95 24.02 30.00 30.50 30.25
GPR34
probe
38.58 37.57 38.08 36.35
- 36.35

79
Table 3-6: Calculations required showing the percentage of GPR34 present in GPR34
knockdown A549 cells.
Step Experiment 1
Calculation
Experiment 1
Result
Experiment 2
Calculation
Experiment 2
Result
GPR34 L32
value –
GPR34 probe
value (Ct)
24.96 - 41.68 -16.72 28.69 - 43.40 -14.71
Control L32 –
Control
GPR34 probe
(Ct)
24.02 - 38.08 -14.06 30.25 - 36.35 -6.10
Control –
Specific (Ct)
-14.06 -
-16.72
2.66 -6.10 - -14.71 8.61
2 to the
power of n
2^2.66 6.32 2^8.61 390.72
100/n (%) 100/6.32 15.83 100/390.72 0.26

80
Figure 3-5: The percentage of GPR34 remaining within GPR34 knockdown A549 cells,
relative to the control
Control GPR34 Exp 1 GPR34 Exp 20
20
40
60
80
100
SiRNA Transfected A549 cells
% G
PR
34 e
xp
ressio
n r
em
ain
ing
in
tran
sfe
cte
d A
549 c
ells
This shows the results, from two independent experiments, illustrating the
percentage knockdown of GPR34 expression, compared to the control transfected
cells.
81
3.3.2.3 CCR7
In Table 3.7 below, the ct values of both L32 and CCR7 expression from
CCR7 and Control knockdown A549 cells, obtained from PCR analysis, are
shown. The average ct values from this experiment were calculated and then
used in Table 3.8 to produce the relative expression of CCR7 remaining in
the knockdown cells, compared to the control.
Figure 3.6 shows that the percentage remaining expression of CCR7 relative
to the control in a single experiment was 28.29%, again within the predicted
range of 20-40%
Table 3-7: Ct values for both L32 and CCR7 probe in both CCR7 and Control
knockdown A549 cells
SiRNA Probe Experiment 1
Ct Value 1 Ct Value 2 Average
CCR7 L32 26.76 26.79 26.77
CCR7 probe 35.43 36.17 35.80
Control L32 26.33 26.59 26.46
CCR7 probe 33.68 33.64 33.66

82
Table 3-8: Calculations required showing the percentage of CCR7 present in the CCR7
knockdown A549 cells
Step Experiment 1
Calculation
Experiment 1
Result
CCR7 L32 value – CCR7 probe
value (Ct)
26.77 - 35.80 -9.03
Control L32 – Control CCR7 probe
(Ct)
26.46 - 33.66 -7.21
Control – Specific (Ct) -7.21 - -9.03 1.82
2 to the power of n 2^1.82 3.53
100/n (%) 100/3.53 28.29

83
Figure 3-6: The percentage of CCR7 remaining within CCR7 knockdown A549 cells,
compared to the control
Control CCR70
20
40
60
80
100
SiRNA transfected A549 cells
% C
CR
7 e
xp
ressio
n r
em
ain
ing
in
tran
sfe
cte
d A
549 c
ells
This shows CCR7 expression of 28.29% post transfection from A549 cells,
compared to the control.
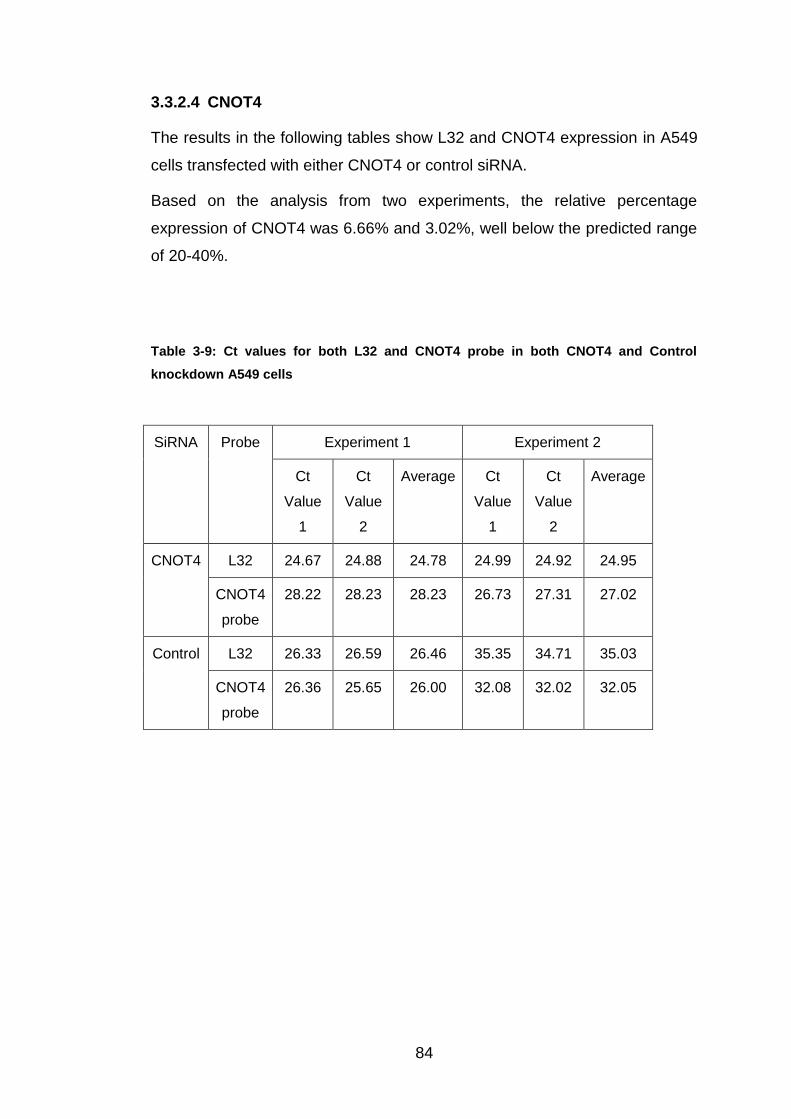
84
3.3.2.4 CNOT4
The results in the following tables show L32 and CNOT4 expression in A549
cells transfected with either CNOT4 or control siRNA.
Based on the analysis from two experiments, the relative percentage
expression of CNOT4 was 6.66% and 3.02%, well below the predicted range
of 20-40%.
Table 3-9: Ct values for both L32 and CNOT4 probe in both CNOT4 and Control
knockdown A549 cells
SiRNA Probe Experiment 1 Experiment 2
Ct
Value
1
Ct
Value
2
Average Ct
Value
1
Ct
Value
2
Average
CNOT4 L32 24.67 24.88 24.78 24.99 24.92 24.95
CNOT4
probe
28.22 28.23 28.23 26.73 27.31 27.02
Control L32 26.33 26.59 26.46 35.35 34.71 35.03
CNOT4
probe
26.36 25.65 26.00 32.08 32.02 32.05

85
Table 3-10: Calculations required showing the percentage of CNOT4 present in the
CNOT4 transfected A549 cells
Step Experiment 1
Calculation
Experiment 1
Result
Experiment 2
Calculation
Experiment 2
Result
CNOT4 L32
value –
CNOT4
probe value
(Ct)
24.78 - 28.23 -3.45 24.95 - 27.02 -2.07
Control L32 –
Control
CNOT4
probe (Ct)
26.46 - 26.00 0.46 35.03 - 32.05 2.98
Control –
Specific (Ct)
0.46 - -3.45 3.91 2.98 - -2.07 5.05
2 to the
power of n
2^3.91 15.01 2^5.05 33.06
100/n (%) 100/15.01 6.66 100/33.06 3.02

86
Figure 3-7: The percentage of CNOT4 remaining within CNOT4 transfected A549 cells,
relative to the control
Control CNOT4 Exp 1 CNOT4 Exp 20
20
40
60
80
100
SiRNA transfected A549 cells
% C
NO
T4 e
xp
ressio
n r
em
ain
ing
in
tra
nsfe
cte
d A
549 c
ells
This shows the percentage expression of CNOT 4 remaining in transfected A549
cells from two experiments, compared to the control.

87
3.3.2.5 TRIM15
The ct values of TRIM15 and L32 expression of TRIM15 or control
knockdown A549 cells, in two independent experiments, are shown in the
following tables.
The first experiment showed a total knockdown of 89.59%, leaving a TRIM15
expression of 10.41%. No TRIM15 expression in the transfected cells was
observed in Experiment 2, implying that TRIM15 had been successfully
knocked down below detection levels.
Table 3-11: Ct values for both L32 and TRIM15 probe in both TRIM15 and Control
knockdown A549 cells
SiRNA Probe Experiment 1 Experiment 2
Ct
Value
1
Ct
Value
2
Average Ct
Value
1
Ct
Value
2
Average
TRIM15 L32 25.05 25.16 25.11 34.98 35.39 35.19
TRIM15
probe
31.10 30.65 30.88 - - -
Control L32 35.35 34.71 35.03 26.33 26.59 26.46
TRIM15
probe
37.11 37.96 37.54 32.40 32.01 32.21
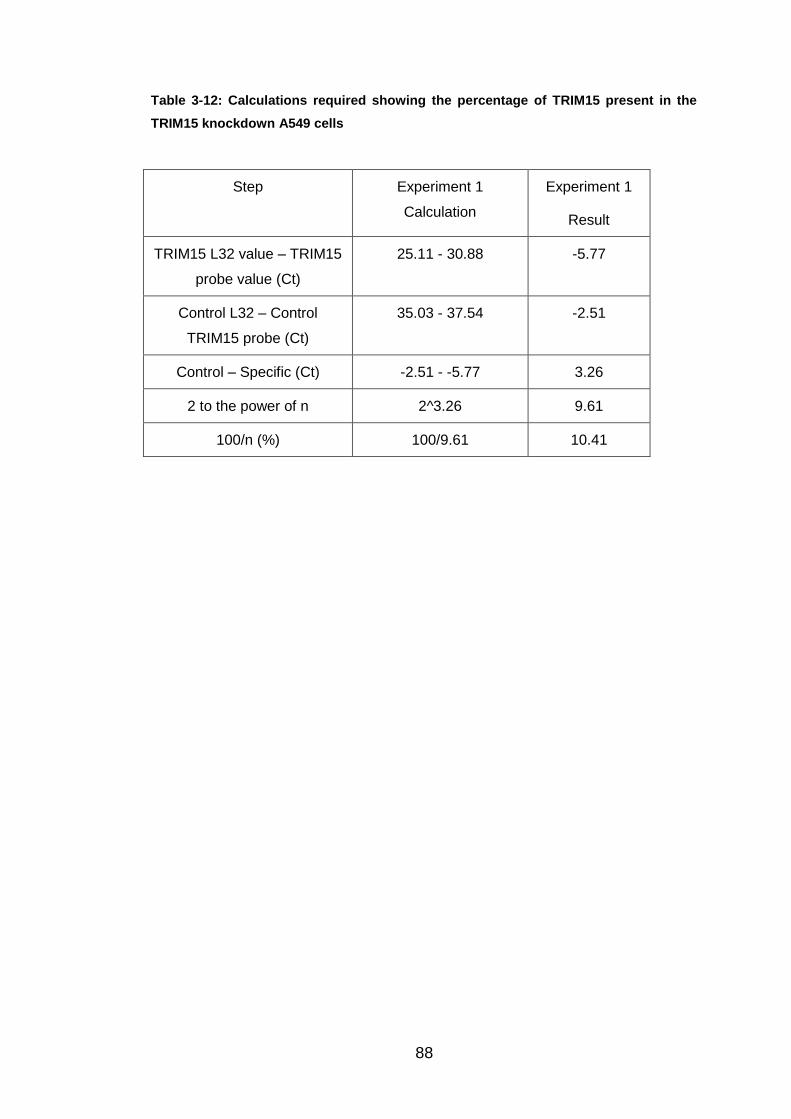
88
Table 3-12: Calculations required showing the percentage of TRIM15 present in the
TRIM15 knockdown A549 cells
Step Experiment 1
Calculation
Experiment 1
Result
TRIM15 L32 value – TRIM15
probe value (Ct)
25.11 - 30.88 -5.77
Control L32 – Control
TRIM15 probe (Ct)
35.03 - 37.54 -2.51
Control – Specific (Ct) -2.51 - -5.77 3.26
2 to the power of n 2^3.26 9.61
100/n (%) 100/9.61 10.41

89
Figure 3-8: The percentage of TRIM15 remaining within TRIM15 knockdown A549
cells, compared to the control
Control TRIM150
20
40
60
80
100
SiRNA transfected A549 cells
% T
RIM
15 e
xp
ressio
n r
em
ain
ing
in
tran
sfe
cte
d A
549 c
ells
This shows the result from experiment 1, showing the percentage knockdown of
expression of TRIM15, compared to control.

90
The average percentage expression for each siRNA transfected gene is
illustrated in Figure 3.9. It can be seen that expression of all five genes was
knocked down to below 30% of control values. The highest remaining
expression is CCR7 at 28.29% and the lowest remaining expression is
CNOT4 at 4.84%.
Figure 3-9: The average values for each specific gene expression in transfected A549
cells
Contr
ol
MARCH6
GPR34
CCR7
CNOT4
TRIM
15
0
20
40
60
80
100
SiRNA transfected gene
% p
rob
e e
xp
ressio
n in
sp
ecific
tran
sfe
cte
d A
549 c
ells
The average percentage expression of each of the five genes investigated post-
knockdown.
91
3.3.3 RSV N Gene Expression Data
RSV N gene expression in knockdown cells was compared to L32
expression, Ct values in gene specific knockdowns were compared to values
in matched infected siRNA control samples, with results expressed as a
percentage of RSV expression in the control. This was used to determine
whether differential RSV expression had occurred in the knockdown cells.
In total 26 different genes were analysed and a minimum of three
experiments performed for each. Full values achieved and calculations for
each of the genes focused on in Section 3.3.1 are shown below. For each of
the other 21 genes, the percentage RSV expression obtained in each
experiment and average has been shown and presented on graphs (Section
3.3.4), separated into the gene families for comparison, along with the
respective control.
3.3.3.1 GCPR Family Data
GPR34
Tables 3.13 and 3.14 show the results obtained following GPR34
knockdown. Ct values from the duplicated wells for L32 and RSV expression
in each experiment are shown in Table 3.13. The data used to calculate an
overall percentage of RSV expression relative to the control are shown in
Table 3.14.
The mean (SEM) increase in RSV N gene expression in GPR34 knockdown
cells in the three independent experiments was 244 (+/-89)%.

92
Table 3-13: The PCR Ct values and averages for GPR34 transfected A549 cells over
three experiments, compared to the Control
Experiment 1 Experiment 2
SiRNA Probe Ct
Value 1
Ct
Value 2
Av. Ct
Value 1
Ct
Value 2
Av.
GPR34 L32 26.23 26.16 26.19 40.99 42.53 41.76
RSV 27.52 27.35 27.44 42.32 41.42 41.87
Control L32 26.33 26.59 26.46 38.26 39.31 38.79
RSV 27.11 27.13 27.12 40.55 - 40.55
Experiment 3
SiRNA Probe Ct
Value 1
Ct
Value 2
Av.
GPR34 L32 25.29 24.63 24.96
RSV 29.04 28.59 28.82
Control L32 24.08 23.95 24.02
RSV 29.63 29.74 29.68

93
Table 3-14: Conversion from PCR Ct values to percentage of RSV expression within
GPR34 knockdown A549 cells, compared to the Control
Experiment 1 Experiment 2 Experiment 3
SiRNA
Step
GPR34 Control GPR34 Control GPR34 Control
Average
L32 Value
(Ct)
26.19 26.46 41.76 38.79 24.96 24.02
Average
RSV Value
(Ct)
27.44 27.12 41.87 40.55 28.82 29.68
L32 – RSV -1.24 -0.66 -0.11 -1.76 -3.86 -5.67
Expression
– Control
-0.58 0 1.65 0 1.81 0
2 to the
power of n
0.67 1 3.14 1 3.50 1
Multiply by
100 (%)
66.87 100 313.72 100 350.41 100
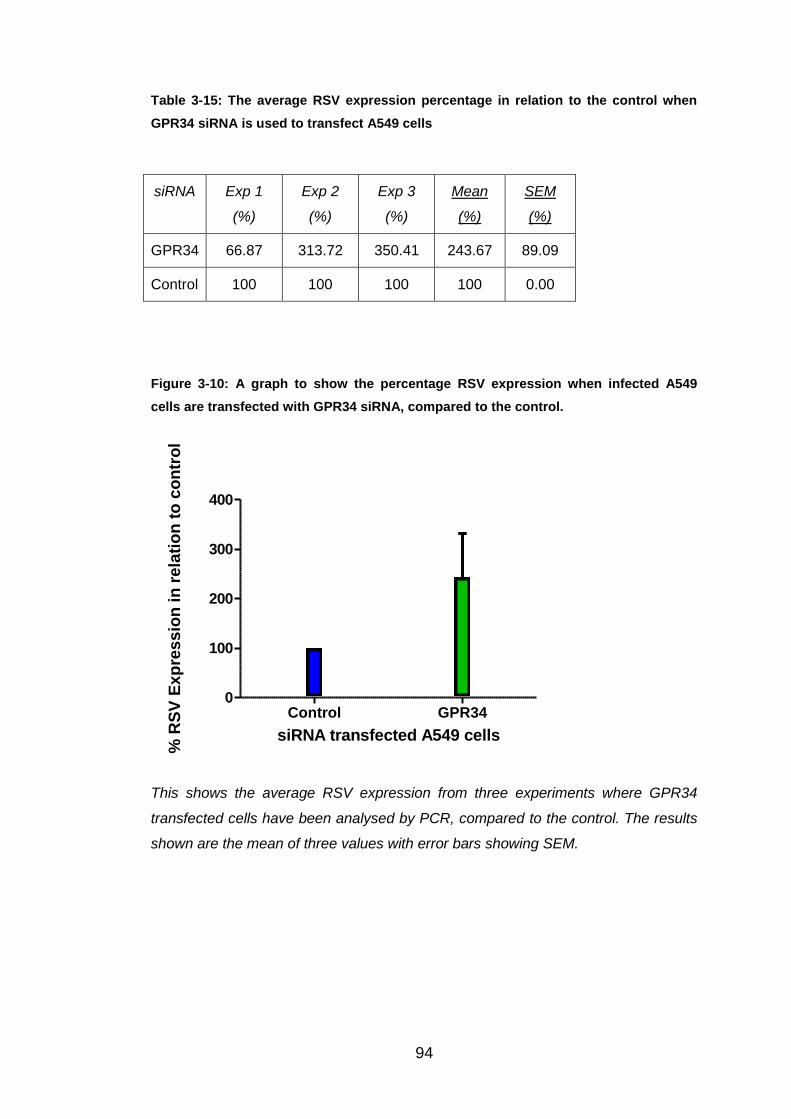
94
Table 3-15: The average RSV expression percentage in relation to the control when
GPR34 siRNA is used to transfect A549 cells
siRNA Exp 1
(%)
Exp 2
(%)
Exp 3
(%)
Mean
(%)
SEM
(%)
GPR34 66.87 313.72 350.41 243.67 89.09
Control 100 100 100 100 0.00
Figure 3-10: A graph to show the percentage RSV expression when infected A549
cells are transfected with GPR34 siRNA, compared to the control.
Control GPR340
100
200
300
400
siRNA transfected A549 cells
% R
SV
Ex
pre
ss
ion
in
re
lati
on
to
co
ntr
ol
This shows the average RSV expression from three experiments where GPR34
transfected cells have been analysed by PCR, compared to the control. The results
shown are the mean of three values with error bars showing SEM.

95
CCR7
Table 3.16 contains the duplicated ct values for L32 and RSV expression in
CCR7 and control knockdown cells, over three independent experiments.
The RSV N gene expression in the knockdown cells are shown in Tables
3.17 and 3.18.
The mean (SEM) RSV N gene expression in CCR7 knockdown cells was 97
(+/- 44)%.
Table 3-16: The PCR ct values and averages for CCR7 transfected A549 cells over
three experiments, compared to the control
Experiment 1 Experiment 2
SiRNA Probe Ct
Value 1
Ct
Value 2
Av. Ct V
Value 1
Ct
Value 2
Av.
CCR7 L32 26.76 26.79 26.77 31.56 32.05 31.80
RSV 26.58 26.53 26.55 37.34 37.39 37.37
Control L32 26.33 26.59 26.46 35.96 35.80 35.88
RSV 27.11 27.13 27.12 39.75 40.68 40.21
Experiment 3
SiRNA Probe Ct
Value 1
Ct
Value 2
Av.
CCR7 L32 26.97 27.19 27.08
RSV 32.59 32.61 32.60
Control L32 35.35 34.71 35.03
RSV 39.74 40.05 39.89
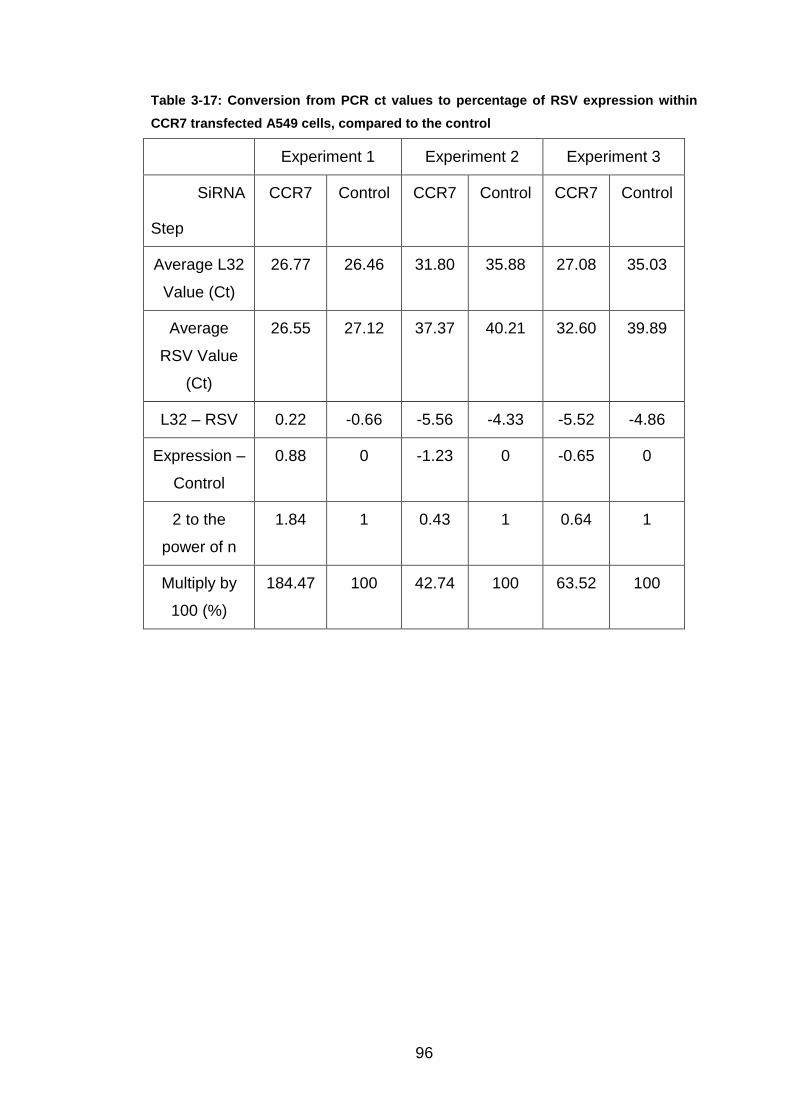
96
Table 3-17: Conversion from PCR ct values to percentage of RSV expression within
CCR7 transfected A549 cells, compared to the control
Experiment 1 Experiment 2 Experiment 3
SiRNA
Step
CCR7 Control CCR7 Control CCR7 Control
Average L32
Value (Ct)
26.77 26.46 31.80 35.88 27.08 35.03
Average
RSV Value
(Ct)
26.55 27.12 37.37 40.21 32.60 39.89
L32 – RSV 0.22 -0.66 -5.56 -4.33 -5.52 -4.86
Expression –
Control
0.88 0 -1.23 0 -0.65 0
2 to the
power of n
1.84 1 0.43 1 0.64 1
Multiply by
100 (%)
184.47 100 42.74 100 63.52 100

97
Table 3-18: The average RSV expression percentage in relation to the control when
CCR7 siRNA is used to transfect A549 cells
siRNA Exp 1
(%)
Exp 2
(%)
Exp 3
(%)
Mean
(%)
SEM
(%)
CCR7 184.47 42.74 63.52 96.91 44.19
Control 100 100 100 100 0.00
Figure 3-11: A graph to show the % RSV expression when infected A549 cells are
transfected with CCR7 siRNA, compared to the control.
Control CCR70
50
100
150
siRNA transfected A549 cells
% R
SV
Ex
pre
ss
ion
in
re
lati
on
to
co
ntr
ol
This shows the RSV expression of CCR7 transfected A549 cells, compared
to the control. The bar illustrates the mean percentage value taken from the
three experiments, with SEM error bars.

98
3.3.3.2 Ubiquitin E3 Ligase
CNOT4
Ct values and averages of L32 and RSV expression in CNOT4 and control
knockdown cells are shown in Table 3.19. These average values are used to
calculate the percentage RSV N gene expression at mRNA level in A549
cells transfected with CNOT4 and control siRNA (Tables 3.20 and 3.21)
The RSV N gene expression mean (SEM) in CNOT4 knockdown cells was
771 (+/- 736)%.
Table 3-19: The PCR ct values and averages for CNOT4 knockdown A549 cells over
three experiments, compared to the control
Experiment 1 Experiment 2
SiRNA Probe Ct
Value 1
Ct
Value 2
Av. Ct
Value 1
Ct
Value 2
Av.
CNOT4 L32 24.67 24.88 24.78 24.99 24.92 24.95
RSV 27.02 27.14 27.08 31.35 31.12 31.23
Control L32 26.33 26.59 26.46 35.35 34.71 35.03
RSV 27.11 27.13 27.12 39.74 40.05 39.89
Experiment 3
SiRNA Probe Ct
Value 1
Ct
Value 2
Av.
CNOT4 L32 39.62 39.28 39.45
RSV 38.05 37.85 37.95
Control L32 36.79 37.17 36.98
RSV 39.97 39.97 39.97

99
Table 3-20: Conversion from PCR ct values to percentage of RSV expression within
CNOT4 knockdown A549 cells, compared to the control
Experiment 1 Experiment 2 Experiment 3
SiRNA
Step
CNOT4 Control CNOT4 Control CNOT4 Control
Average
L32 Value
(Ct)
24.78 26.46 24.95 35.03 39.45 36.98
Average
RSV Value
(Ct)
27.08 27.12 31.23 39.89 37.95 39.97
L32 – RSV -2.3 -0.66 -6.28 -4.86 1.50 -2.99
Expression
– Control
-1.64 0 -1.42 0 4.49 0
2 to the
power of n
0.32 1 0.37 1 22.44 1
Multiply by
100 (%)
32.11 100 37.45 100 2243.99 100

100
Table 3-21: The average RSV expression percentage in relation to the control when
CNOT4 siRNA is used to transfect A549 cells
siRNA Exp 1
(%)
Exp 2
(%)
Exp 3
(%)
Mean
(%)
SEM
(%)
CNOT4 32.11 37.45 2244.00 771.18 736.41
Control 100 100 100 100 0.00
Figure 3-12: A Graph to show the % RSV expression when infected A549 cells are
transfected with CNOT4 siRNA, compared to the control.
Control CNOT40
200
400
600
800
1000
1200
1400
1600
SiRNA transfected A549 cells
% R
SV
Exp
ress
ion
in
re
lati
on
to
co
ntr
ol
This bar chart shows the mean (SEM) RSV expression for CNOT4 siRNA,
compared to the control.
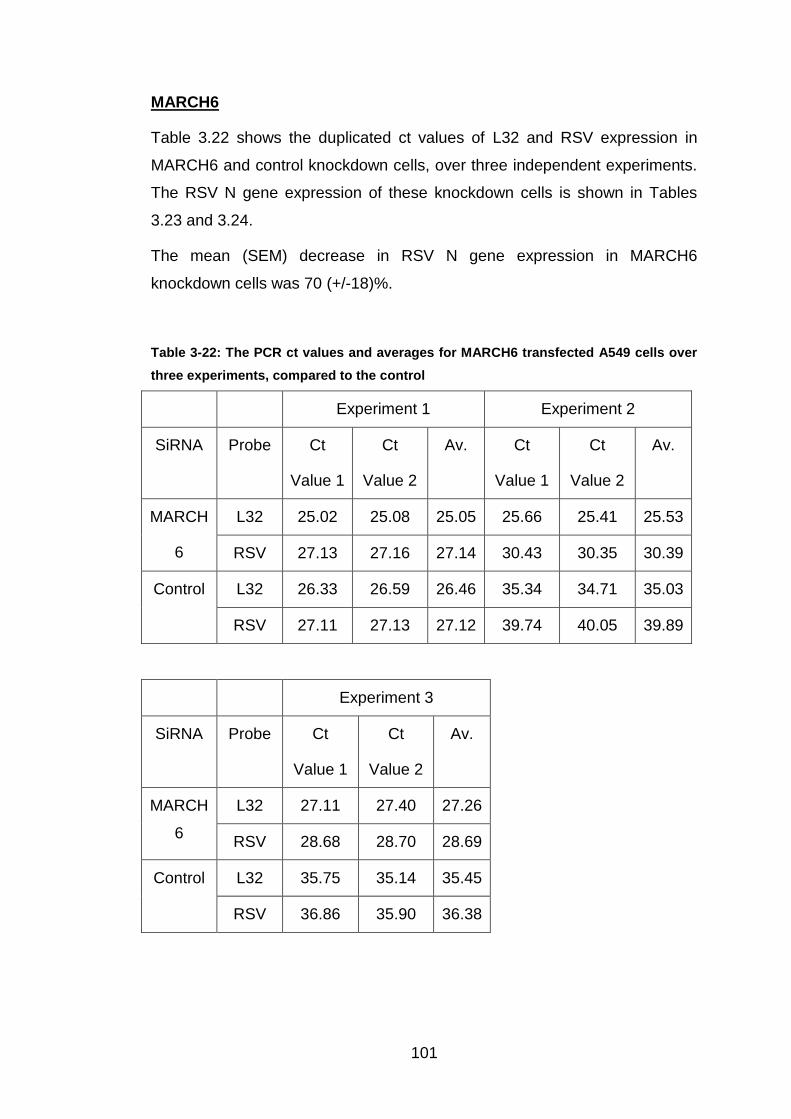
101
MARCH6
Table 3.22 shows the duplicated ct values of L32 and RSV expression in
MARCH6 and control knockdown cells, over three independent experiments.
The RSV N gene expression of these knockdown cells is shown in Tables
3.23 and 3.24.
The mean (SEM) decrease in RSV N gene expression in MARCH6
knockdown cells was 70 (+/-18)%.
Table 3-22: The PCR ct values and averages for MARCH6 transfected A549 cells over
three experiments, compared to the control
Experiment 1 Experiment 2
SiRNA Probe Ct
Value 1
Ct
Value 2
Av. Ct
Value 1
Ct
Value 2
Av.
MARCH
6
L32 25.02 25.08 25.05 25.66 25.41 25.53
RSV 27.13 27.16 27.14 30.43 30.35 30.39
Control L32 26.33 26.59 26.46 35.34 34.71 35.03
RSV 27.11 27.13 27.12 39.74 40.05 39.89
Experiment 3
SiRNA Probe Ct
Value 1
Ct
Value 2
Av.
MARCH
6
L32 27.11 27.40 27.26
RSV 28.68 28.70 28.69
Control L32 35.75 35.14 35.45
RSV 36.86 35.90 36.38

102
Table 3-23: Conversion from PCR ct values to percentage of RSV expression within
MARCH6 knockdown A549 cells, compared to the control
Experiment 1 Experiment 2 Experiment 3
SiRNA
Step
MARCH
6
Control MARCH
6
Control MARCH
6
Control
Average L32
Value (Ct)
25.05 26.46 25.53 35.03 27.26 35.45
Average
RSV Value
(Ct)
27.14 27.12 30.39 39.89 28.69 36.38
L32 – RSV -2.09 -0.66 -4.86 -4.86 -1.43 -0.94
Expression –
Control
-1.43 0 0.01 0 -0.50 0
2 to the
power of n
0.37 1 1.00 1 0.71 1
Multiply by
100 (%)
37.17 100 100.44 100 70.95 100

103
Table 3-24: The average RSV expression percentage in relation to the control when
MARCH6 siRNA is used to transfect A549 cells
siRNA Exp 1
(%)
Exp 2
(%)
Exp 3
(%)
Mean
(%)
SEM
(%)
MARCH6 37.17 100.44 70.95 69.52 18.28
Control 100 100 100 100 0.00
Figure 3-13: A graph to show the % RSV expression when infected A549 cells are
transfected with MARCH6 siRNA, compared to the control.
Control MARCH60
20
40
60
80
100
120
siRNA transfected A549 cells
% R
SV
Ex
pre
ss
ion
in
re
lati
on
to
co
ntr
ol
This demonstrates the RSV expression values produced in MARCH6 and control
transfected A549 cells. The expression has been converted from ct values given by
the PCR machine, to percentage, by a number of calculations, therefore showing
the mean (SEM) RSV N gene expression, relative to the control
TRIM15
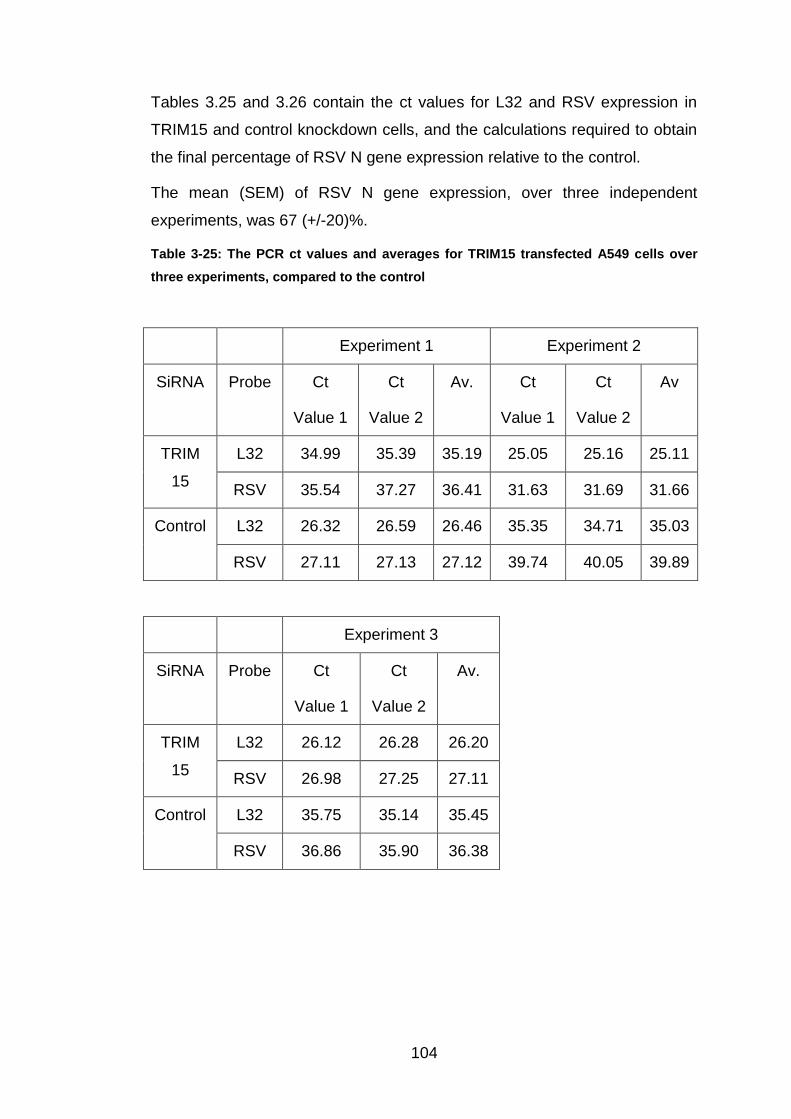
104
Tables 3.25 and 3.26 contain the ct values for L32 and RSV expression in
TRIM15 and control knockdown cells, and the calculations required to obtain
the final percentage of RSV N gene expression relative to the control.
The mean (SEM) of RSV N gene expression, over three independent
experiments, was 67 (+/-20)%.
Table 3-25: The PCR ct values and averages for TRIM15 transfected A549 cells over
three experiments, compared to the control
Experiment 1 Experiment 2
SiRNA Probe Ct
Value 1
Ct
Value 2
Av. Ct
Value 1
Ct
Value 2
Av
TRIM
15
L32 34.99 35.39 35.19 25.05 25.16 25.11
RSV 35.54 37.27 36.41 31.63 31.69 31.66
Control L32 26.32 26.59 26.46 35.35 34.71 35.03
RSV 27.11 27.13 27.12 39.74 40.05 39.89
Experiment 3
SiRNA Probe Ct
Value 1
Ct
Value 2
Av.
TRIM
15
L32 26.12 26.28 26.20
RSV 26.98 27.25 27.11
Control L32 35.75 35.14 35.45
RSV 36.86 35.90 36.38

105
Table 3-26: Conversion from PCR ct values to percentage of RSV expression within
TRIM15 knockdown A549 cells, compared to the control
Experiment 1 Experiment 2 Experiment 3
SiRNA
Step
TRIM15 Control TRIM15 Control TRIM15 Control
Average
L32 Value
(Ct)
35.19 26.46 25.11 35.03 26.20 35.45
Average
RSV Value
(Ct)
36.41 27.12 31.66 39.89 27.11 36.38
L32 – RSV -1.22 -0.66 -6.55 -4.86 -0.91 -0.94
Expression
– Control
-0.56 0 -1.69 0 0.02 0
2 to the
power of n
0.68 1 0.31 1 1.02 1
Multiply by
100 (%)
67.76 100 30.96 100 101.53 100

106
Table 3-27: The average RSV expression percentage in relation to the control when
TRIM15 siRNA is used to transfect A549 cells
siRNA Exp 1
(%)
Exp 2
(%)
Exp 3
(%)
Mean
(%)
SEM
TRIM15 67.76 30.96 101.53 66.75 20.38
Control 100 100 100 100 0.00
Figure 3-14: A graph to show the % RSV expression when infected A549 cells are
transfected with TRIM15 siRNA, compared to the control.
Control TRIM150
20
40
60
80
100
120
siRNA transfected A549 cells
% R
SV
Ex
pre
ss
ion
in
re
lati
on
to
co
ntr
ol
This bar chart shows the mean percentage RSV expression, plus SEM error bars, of
TRIM15 and control knockdown A549 cells.

107
3.3.4 Overview of Knockdown Data
For the other 21 genes investigated, the RSV expression for each of the
three or, in one case, four experiments has been shown below, along with
the subsequent averages, shown in Tables 3.28 to 3.33. The averages are
then analysed to determine whether RSV N gene expression is influenced by
the knockdown in expression of these specific genes.
The data has been structured into the four families, so that the members can
be compared to each other, and the control.
3.3.4.1 Kinase Family
The kinase family only contains one of the genes investigated, MAP3K1. The
RSV expression for each of the three experiments is shown in Table 3.28.
The mean (SEM) increase of RSV N gene expression in MAP3K1
knockdown cells was 156 (+/- 27)%.
Table 3-28: Average percentage of RSV Expression, after three experiments, when
MAP3K1 of Kinase Family is transfected in A549 cells.
SiRNA Experiment 1
(%)
Experiment 2
(%)
Experiment 3
(%)
Mean
(%)
SEM
(%)
MAP3K1 188.14 180.80 98.64 155.86 26.69

108
Figure 3-15: Average percentage of RSV expression of MAP3K1 transfected A549 cells
in relation to the control
Control MAP3K10
50
100
150
200
SiRNA Transfected Gene
% E
xp
res
sio
n r
ela
tive
to
Co
ntr
ol
This shows the percentage RSV expression for MAP3K1 transfected A549 cells, in
relation to the control. The error bars illustrate the SEM.
3.3.4.2 Phosphatase Family
Similar to the kinase family, there is only one member of the phosphatase
family included in the 26 genes being studied. The average RSV expression
results, obtained from the original ct values of L32 and RSV expression via
PCR, have been shown in Table 3.29.
The mean (SEM) RSV N gene expression, over three independent
experiments, in PPM1H knockdown cells was 347 (+/- 219) %, relative to the
control.

109
Table 3-29: Average percentage of RSV expression, after three experiments, when
PPM1H of Phosphatase Family is transfected in A549 cells
SiRNA Experiment
1
Experiment
2
Experiment
3
Mean
(%)
SEM
(%)
PPM1H 781.23 182.83 76.99 347.02 219.25
Figure 3-16: Average percentage of RSV Expression of PPM1H knockdown A549 cells
in relation to the control
Control PPM1H0
100
200
300
400
500
600
SiRNA transfected Gene
% E
xp
res
sio
n r
ela
tive
to
Co
ntr
ol
The mean RSV expression and SEM error bars are presented on the above graph.
The left bar is the control transfected cells, which always equals 100%, and on the
right is the PPM1H transfected cells.
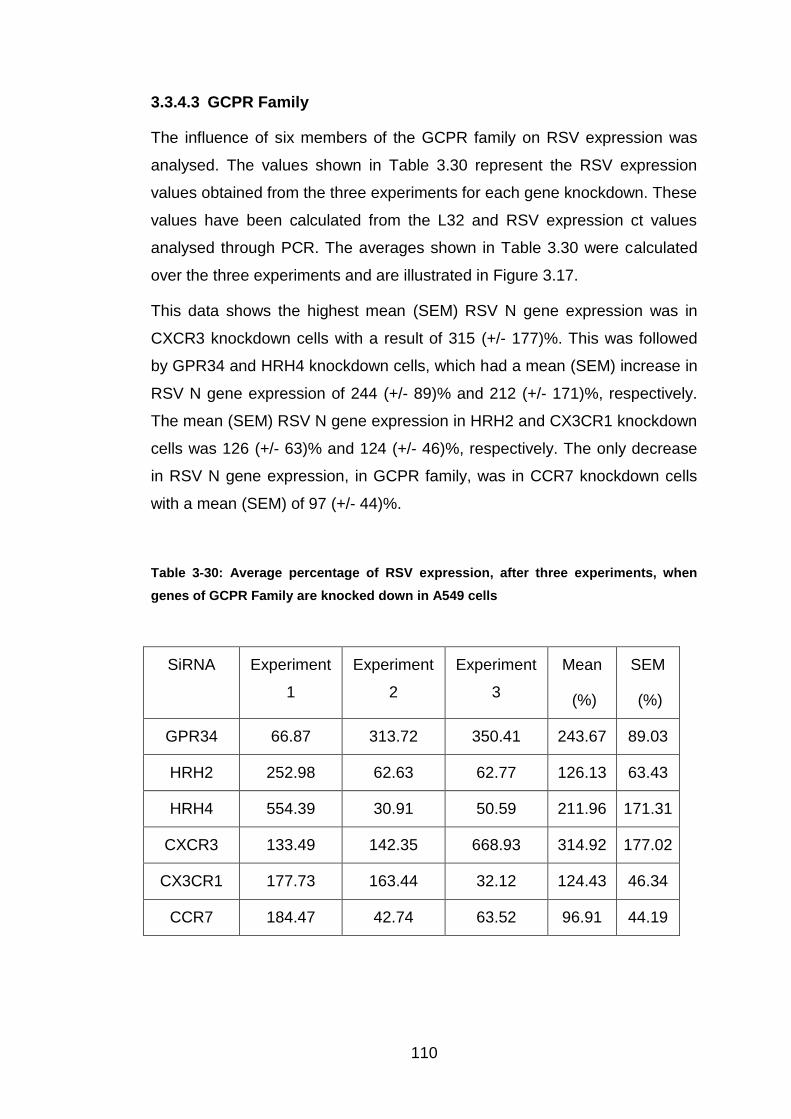
110
3.3.4.3 GCPR Family
The influence of six members of the GCPR family on RSV expression was
analysed. The values shown in Table 3.30 represent the RSV expression
values obtained from the three experiments for each gene knockdown. These
values have been calculated from the L32 and RSV expression ct values
analysed through PCR. The averages shown in Table 3.30 were calculated
over the three experiments and are illustrated in Figure 3.17.
This data shows the highest mean (SEM) RSV N gene expression was in
CXCR3 knockdown cells with a result of 315 (+/- 177)%. This was followed
by GPR34 and HRH4 knockdown cells, which had a mean (SEM) increase in
RSV N gene expression of 244 (+/- 89)% and 212 (+/- 171)%, respectively.
The mean (SEM) RSV N gene expression in HRH2 and CX3CR1 knockdown
cells was 126 (+/- 63)% and 124 (+/- 46)%, respectively. The only decrease
in RSV N gene expression, in GCPR family, was in CCR7 knockdown cells
with a mean (SEM) of 97 (+/- 44)%.
Table 3-30: Average percentage of RSV expression, after three experiments, when
genes of GCPR Family are knocked down in A549 cells
SiRNA Experiment
1
Experiment
2
Experiment
3
Mean
(%)
SEM
(%)
GPR34 66.87 313.72 350.41 243.67 89.03
HRH2 252.98 62.63 62.77 126.13 63.43
HRH4 554.39 30.91 50.59 211.96 171.31
CXCR3 133.49 142.35 668.93 314.92 177.02
CX3CR1 177.73 163.44 32.12 124.43 46.34
CCR7 184.47 42.74 63.52 96.91 44.19
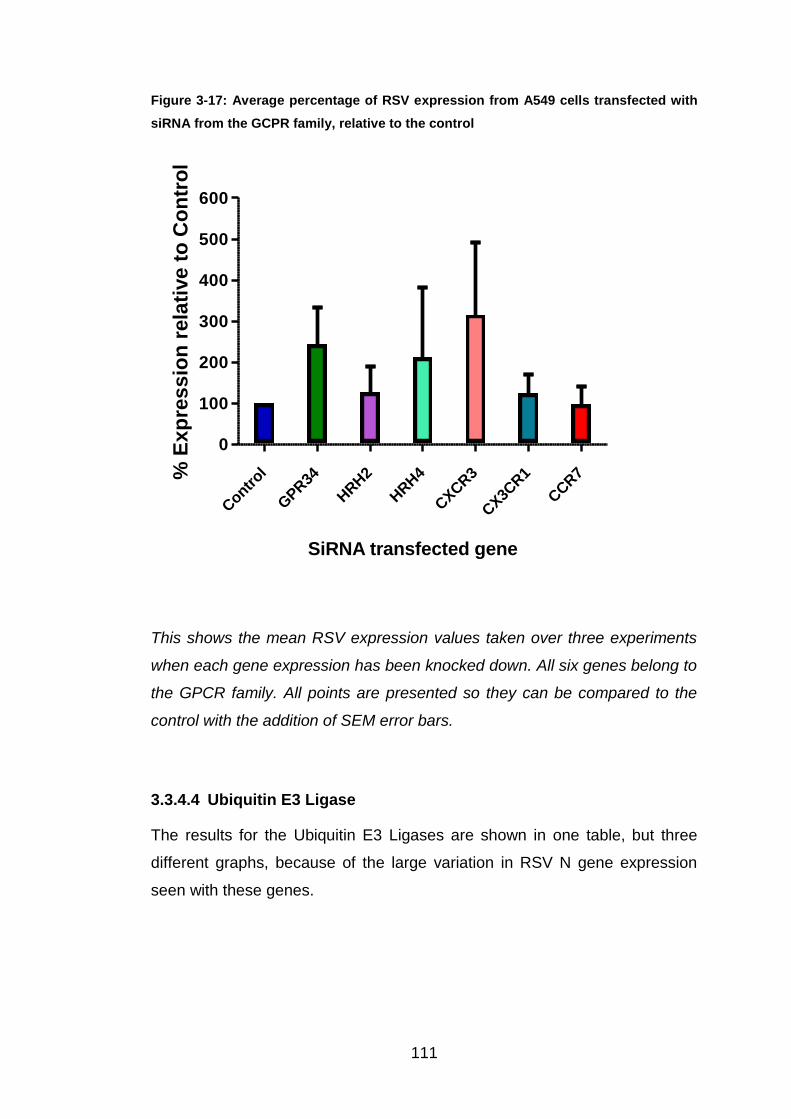
111
Figure 3-17: Average percentage of RSV expression from A549 cells transfected with
siRNA from the GCPR family, relative to the control
Contr
ol
GPR34
HRH2
HRH4
CXCR3
CX3C
R1
CCR7
0
100
200
300
400
500
600
SiRNA transfected gene
% E
xp
res
sio
n r
ela
tive
to
Co
ntr
ol
This shows the mean RSV expression values taken over three experiments
when each gene expression has been knocked down. All six genes belong to
the GPCR family. All points are presented so they can be compared to the
control with the addition of SEM error bars.
3.3.4.4 Ubiquitin E3 Ligase
The results for the Ubiquitin E3 Ligases are shown in one table, but three
different graphs, because of the large variation in RSV N gene expression
seen with these genes.

112
Table 3-31: Average percentage of RSV expression, after three experiments, when
genes of Ubiquitin E3 Ligase Family are knocked down in A549 cells
SiRNA Exp
1
Exp
2
Exp
3
Exp
4
Mean
(%)
SEM
(%)
RNF149 76.58 14.72 53.10 48.13 18.03
RNF150 150.20 52.79 213.80 138.93 46.82
MARCH6 37.17 100.44 70.95 69.52 18.28
HR 38.43 20.70 47.08 35.40 7.76
LOC
643904
134.35 3.63 175.09 104.36 51.72
PHF21A 95.01 454.76 79.41 209.73 122.60
RAD18 119.46 163.89 90.27 124.54 21.40
TOPORS 233.99 14.34 69.37 105.90 65.99
TRIM15 67.76 30.96 101.53 66.75 20.38
TRIM43 785.68 235.50 3.91 341.70 231.84
TRIM73 45.56 43.67 200.78 96.67 52.06
CNOT4 32.11 37.45 2244.00 771.18 736.41
PCGF5 1914.57 182.99 180.05 54.87 583.12 444.82
RUFY1 162.37 4688.97 105.07 1652.14 1518.51
TRIM37 3284.04 47.91 52.73 1128.23 1077.91
RNF168 330.09 1245856 88.28 415424.9 415215.70
RFFL 1766125 195.74 124.07 588814.9 588655.10
TRIM2 886.79 696303 90.45 232426.8 231938.30
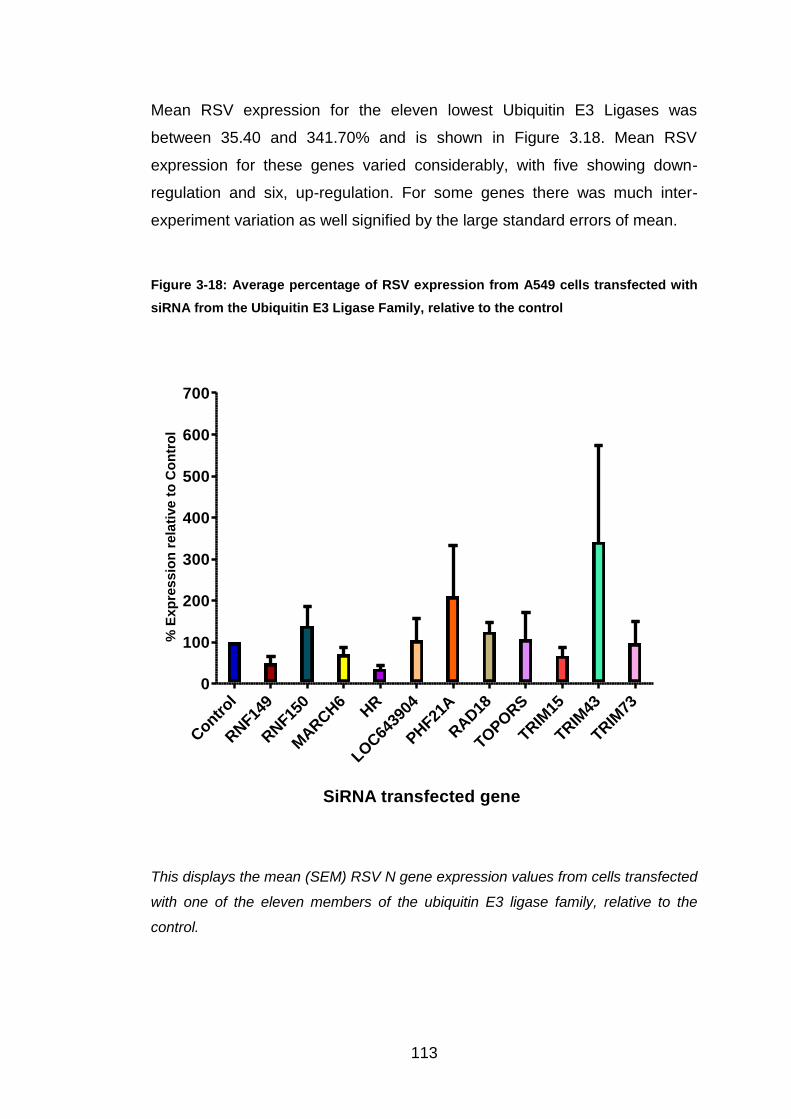
113
Mean RSV expression for the eleven lowest Ubiquitin E3 Ligases was
between 35.40 and 341.70% and is shown in Figure 3.18. Mean RSV
expression for these genes varied considerably, with five showing down-
regulation and six, up-regulation. For some genes there was much inter-
experiment variation as well signified by the large standard errors of mean.
Figure 3-18: Average percentage of RSV expression from A549 cells transfected with
siRNA from the Ubiquitin E3 Ligase Family, relative to the control
Contr
ol
RNF14
9
RNF15
0
MARCH6
HR
LOC64
3904
PHF21
A
RAD18
TOPORS
TRIM
15
TRIM
43
TRIM
73
0
100
200
300
400
500
600
700
SiRNA transfected gene
% E
xp
res
sio
n r
ela
tive
to
Co
ntr
ol
This displays the mean (SEM) RSV N gene expression values from cells transfected
with one of the eleven members of the ubiquitin E3 ligase family, relative to the
control.

114
Results for the next four genes with the next highest RSV expression are
shown in Figure 3.19. All experiments were repeated three times apart from
the PCGF5, which was repeated four times.
All four genes showed up-regulation of RSV N gene expression with a
variation of 445 and 1519%.
Figure 3-19: Average percentage of RSV expression from A549 cells transfected with
siRNA from the Ubiquitin E3 Ligase Family, relative to the control
Control CNOT4 PCGF5 RUFY1 TRIM370
500
1000
1500
2000
2500
3000
3500
4000
SiRNA transfected gene
% E
xp
res
sio
n r
ela
tive
to
Co
ntr
ol
Mean (SEM) RSV expression for four ubiquitin E3 ligase members are displayed in
the above graph relative to the control.
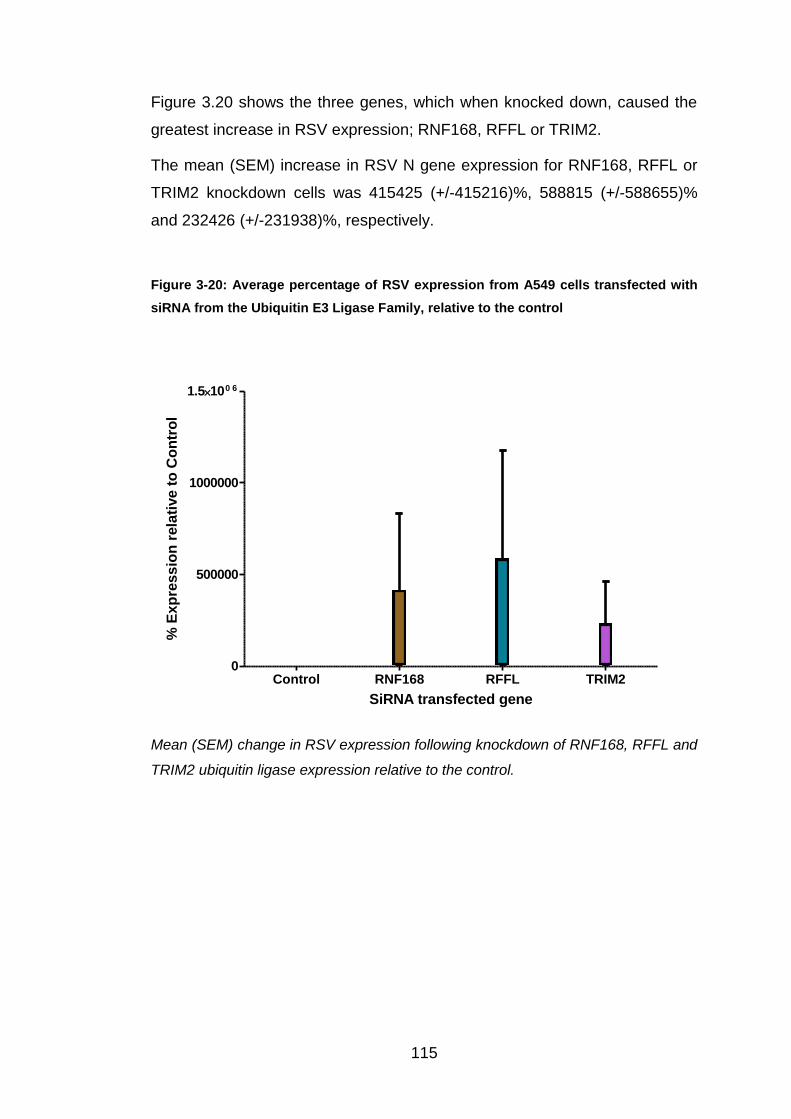
115
Figure 3.20 shows the three genes, which when knocked down, caused the
greatest increase in RSV expression; RNF168, RFFL or TRIM2.
The mean (SEM) increase in RSV N gene expression for RNF168, RFFL or
TRIM2 knockdown cells was 415425 (+/-415216)%, 588815 (+/-588655)%
and 232426 (+/-231938)%, respectively.
Figure 3-20: Average percentage of RSV expression from A549 cells transfected with
siRNA from the Ubiquitin E3 Ligase Family, relative to the control
Control RNF168 RFFL TRIM20
500000
1000000
1.5100 6
SiRNA transfected gene
% E
xp
ress
ion
rela
tive t
o C
on
tro
l
Mean (SEM) change in RSV expression following knockdown of RNF168, RFFL and
TRIM2 ubiquitin ligase expression relative to the control.

116
Figure 3.21 shows the relative RSV N gene expression for all genes from all
four families following knockdown plotted in a logarithmic scale.
Figure 3-21: RSV N gene expression for all genes knocked down by siRNA
Mean (SEM) RSV N gene expression displayed on a logarithmic scale for each of
the 26 gene expression knockdowns.
Gene Expression Knocked-Down

117
3.4 Discussion
This chapter describes how knocking down expression of each specific gene
affects RSV N gene expression.
Firstly, it was necessary to validate quantitative real-time reverse
transcription PCR assay to measure RSV expression. Next, determination of
how much RSV should be used to infect cells and, thirdly, to validate the
siRNA knockdown protocol before being able to assess the effect of each
specific gene on RSV expression.
3.4.1 Optimisation of PCR Assay
To ensure that the correct amount of RSVN-TAQ probe was used in our
experiments, I tested four different amounts of probe: 0.5, 1, 2 and 4µl. 1μl
(50pmol) was chosen for future use, because this provided a high level of
discrimination between the negative background and positive signal strength.
A potential limitation to our study was that we only used one RSV gene as a
surrogate for overall RSV replication; we do not know whether all RSV genes
are transcribed at the same rate. This could be improved by adding PCRs for
other RSV genes or by focusing on the plaque assay technique.
It was also important to show that the PCR assays were quantitative, which I
did by measuring RSV N gene expression by PCR in five different RSV
dilutions. Figure 3.2 illustrates that the signal obtained by PCR was
proportional and reflected the amount that the RSV sample had been diluted.
3.4.2 Determination of the amount of RSV used to infect A549 cultures
My objective in these experiments was to determine the amount of RSV
needed to infect A549s that would allow changes in RSV N gene expression
to be measured within the PCR range. Figure 3.3 illustrates the RSV
expression at different dilutions. A 1:50 RSV dilution was chosen, which gave
an MOI (Section 2.2.2) of 1. A MOI of one is ideal, because there is one viral
particle to each cell, ensuring complete infection. If the MOI is above one, it
may risk infecting the cells too much, causing death and therefore no mRNA
would be available to extract.

118
3.4.3 Successful knockdown of gene expression by siRNA treatment.
I next wanted to demonstrate the knockdown of gene expression successfully
occurred when cells were treated with siRNA. For my analysis to be valid it
was important to show that siRNA transfection knocked down specific gene
expression efficiently. The expected maximal knockdown using siRNA was
greater than or equal to 60%.
In section 3.3.2, the results for five randomly selected genes, which were
successfully knocked down, are shown. The most effective knockdown was
for CNOT4, which was knocked down by 95.16%, leaving only 4.84%
CNOT4 expression within transfected A549 cells. The least effective
knockdown was for CCR7, but this still only left 28.29% CCR7 expression
remaining, comfortably within the predicted knockdown range, and reassured
us that the siRNA technique and reagents were working effectively.
The expression assays were performed four days post knockdown and two
days post RSV infection. A possible reason for our knockdowns generally
exceeding the predicted range may be that mRNA expression for each gene
may have reduced further over the 48 hour time period post RSV infection.
However, as the knockdown levels were higher than expected, the protocol
was not altered or optimised further.
A limitation to this work is that RSV N gene expression was used as a
surrogate for RSV replication. Showing that RSV protein expression was
differentially affected, using a western blotting technique, would strengthen
our data.
3.4.4 Influence that inhibition of gene expression has on RSV
expression
Having demonstrated inhibition of gene expression following siRNA
treatment, the influence that knockdown of gene expression has on RSV
expression was measured by real-time PCR.
The only member of the Kinase family to be investigated, MAP3K1, showed
up-regulation of RSV N gene expression by 50% compared to the control.
Similarly, knockdown of PPM1H, the only phosphatase family member,

119
increased mean RSV N gene expression by over three times. Following
knockdown of the GPCR family, RSV expression for all genes (apart from
CCR7, which showed a slight drop in relative RSV expression to 97%)
increased compared to the control value. CXCR3 knockdown had the
greatest effect, increasing RSV N gene expression by over three times that of
the control.
The ubiquitin E3 ligases showed the greatest variation of the four families
studied. 18 members of this family were investigated with five showing down-
regulation of RSV N gene expression, implying that they do not have
protective role in RSV infection, in contrast to influenza. Figure 3.20 shows
the three E3 ligases whose knockdown had the greatest effect on RSV N
gene expression. Although RSV gene expression following RNF168, RFFL or
TRIM2 knockdown showed large variation, the effect of these knockdowns
dwarfed those seen for the other genes (Figure 3.21).
Prof. Tripp has already shown that each of these genes affects influenza
replication when knocked down. He analysed the change in expression by Z
score, but this was not possible with our results because to do this would
have required more than three experiments for each gene and this was not
possible within the time period of this MPhil year.
3.4.5 Use of InnateDB to investigate pathways that may inhibit RSV
replication
InnateDB is an online database, which provides information on genes
involved in innate immunity to infection and associated biochemical pathways
and protein-protein interactions. We used this database to investigate how
each gene might act to inhibit RSV replication. Figure 3.22 shows the protein-
protein interactions associated with the Ubiquitin E2 ligase, UBE2G2. This
protein interacts with three proteins that we found up-regulated RSV gene
expression when individually knocked down: RNF168 (415,414%), RFFL
(588,814%) and TRIM43 (342%).
In Chapter 4, I focus on the two genes within the UBE2G2's 'pathway' that
had the greatest affect on RSV replication when knocked down, namely

120
RNF168 and RFFL. Chapter 6 focuses on GPR34 because knockdown of
this protein was observed to cause morphological changes in A549 cells.

121
Figure 3-22: The protein-protein interactions of UBE2G2 (supplied by InnateDB)
This figure shows the protein-protein interactions involved with the ubiquitin
E2 ligase, UBE2G2. Potential protein-protein interactions are shown by
dotted lines.

122
4 The influence of UBE2G2, RFFL and RNF168
knockdown on RSV N gene expression
4.1 Introduction
The aim of the experiments included in this chapter were to investigate how
UBE2G2 influenced RSV replication, and to confirm the effects of RNF168
and RFFL by increasing the number of replicates.
UBE2G2, an E2 ligase, is found in all human tissues, and is a key component
of the endoplasmic reticulum-associated degradation (ERAD) pathway (167).
Misfolded or unassembled proteins within the endosplasmic reticulum (ER)
are targeted by the ERAD pathway for K48-linked polyubiquitination, which
marks a protein for proteasomal breakdown. This proteasomal breakdown
involves the activation of the ubiquitin ligases E1, E2 and E3, resulting in the
formation of covalent bonds between the ubiquitin and the lysine residues
within the target protein (Figure 1.5) (167).
Signal transduction and cell cycle activities such as proliferation and
apoptosis rely on an efficient ERAD pathway (167, 168). Ubiquitins are not
present in ER lumen, which means target proteins within the ER must be
relocated to the cytoplasm before having the K48-polyubiquitin chain
attached. UBE2G2’s suggested role is in assembling the K48-linked ubiquitin
chain before interaction with E3 ligases such as RNF168 or RFFL (167).
There are over thirty human E2 enzymes identified to date and all contain an
active site cysteine residue essential for ubiquitin attachment through the
thiolester bond. The catalytic core, approximately 150 amino acids in size,
contains the cysteine residue, plus α and β folds (167, 169). The E2 proteins
are ubiquitin-conjugating enzymes, where the activated ubiquitin is
transferred from the E1, ubiquitin-activating enzyme, to the active cysteine
residue.
E2 enzymes are subdivided into four groups, classified by the presence or
absence of the C- and N-terminal extensions in their core sequence (169):
123
Class I – small members of the E2 enzyme family, which consists almost
totally of the core domain.
Class II – includes a C-terminal extension from the core domain.
Class III – includes an N-terminal extension from the core domain.
Class IV – includes both C- and N- terminal extensions from the core domain.
UBE2G2, also known as UBC7, encodes for the ubiquitin-conjugating
enzyme E2 G2, which has a molecular weight of 18.6kDa and compromises
165 amino acids. This gene, located on chromosome 21, band q22.3,
interacts with a number of RING-finger E3 ligases (169).
The crystal structure of UBE2G2 contains a 13-residue sequence insertion
below the active site cysteine, which also includes four conserved acidic
residues, essential to its catalytic function. Substitution of these residues
inhibits assembly of the poly-ubiquitin chain, but little more is known about
how this function occurs. Above the active site, all E2 ligases have an
asparagine residue (N81 in UBE2G2) necessary for catalytic function (112,
167-169).
4.2 Materials and Methods
4.2.1 Knockdown Protocol
UBE2G2 siRNA was obtained from Life Technologies. The five-day
knockdown protocol outlined in Section 3.2.1 was again followed for
UBE2G2, RNF168 and RFFL. Due to the large variation in RSV expression
seen following previous knockdowns, six duplicates of A549 cells were
transfected with UBE2G2, RNF168 and RFFL siRNA.
4.3 Results
4.3.1 Knockdown Data
Table 4.1 shows the average ct values for each of the three genes of interest
and the control gene L32, from each of the six experiments. The mean (SEM)
percentage knockdown for each gene is shown in Table 4.2 and Figure 4.1.
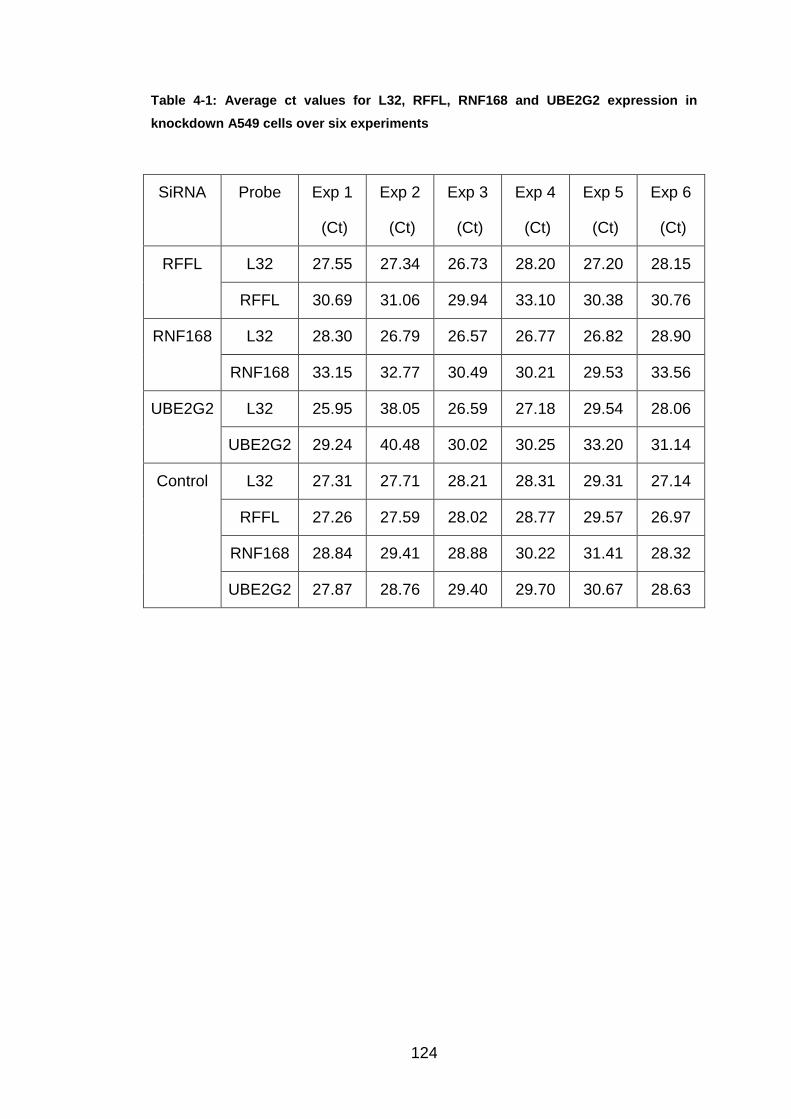
124
Table 4-1: Average ct values for L32, RFFL, RNF168 and UBE2G2 expression in
knockdown A549 cells over six experiments
SiRNA Probe Exp 1
(Ct)
Exp 2
(Ct)
Exp 3
(Ct)
Exp 4
(Ct)
Exp 5
(Ct)
Exp 6
(Ct)
RFFL L32 27.55 27.34 26.73 28.20 27.20 28.15
RFFL 30.69 31.06 29.94 33.10 30.38 30.76
RNF168 L32 28.30 26.79 26.57 26.77 26.82 28.90
RNF168 33.15 32.77 30.49 30.21 29.53 33.56
UBE2G2 L32 25.95 38.05 26.59 27.18 29.54 28.06
UBE2G2 29.24 40.48 30.02 30.25 33.20 31.14
Control L32 27.31 27.71 28.21 28.31 29.31 27.14
RFFL 27.26 27.59 28.02 28.77 29.57 26.97
RNF168 28.84 29.41 28.88 30.22 31.41 28.32
UBE2G2 27.87 28.76 29.40 29.70 30.67 28.63

125
Table 4-2: Calculation steps from ct values to percentage of remaining gene
expression within A549 cells for RFFL, RNF168 and UBE2G2.
Step Exp 1 Exp 2 Exp 3 Exp 4 Exp 5 Exp 6
Specific:
L32 -
Probe
RFFL -3.14 -3.72 -3.21 -4.90 -3.18 -2.61
RNF168 -4.85 -5.99 -3.93 -3.44 -2.71 -4.66
UBE2G2 -3.30 -2.43 -3.43 -3.07 -3.66 -3.08
Control:
L32 -
probe
RFFL 0.05 0.12 0.19 -0.46 -0.26 0.17
RNF168 -1.54 -1.70 -0.68 -1.91 -2.11 -1.19
UBE2G2 -0.56 -1.05 -1.19 -1.39 -1.36 -1.50
Control -
Specific
RFFL 3.19 3.84 3.40 4.44 2.92 2.78
RNF168 3.32 4.29 3.25 1.53 0.60 3.48
UBE2G2 2.74 1.38 2.24 1.68 2.30 1.59
2 to the
power of
n
RFFL 9.09 14.32 10.56 21.63 7.57 6.87
RNF168 9.95 19.49 9.51 2.89 1.52 11.12
UBE2G2 6.66 2.60 4.71 3.20 4.91 3.00
100/n
(%)
RFFL 11.00 6.98 9.47 4.62 13.21 14.56
RNF168 10.05 5.13 10.51 34.63 65.98 8.99
UBE2G2 15.02 38.42 21.24 31.21 20.38 33.33
The mean (SEM) of the knockdown values for each gene relative to the
control, over six experiments are shown in Figure 4.1. The average RFFL,
RNF168 and UBE2G2 gene expression remaining was 10 (+/-1.5)%, 23 (+/-
10)% and 27 (+/-4)%, respectively.
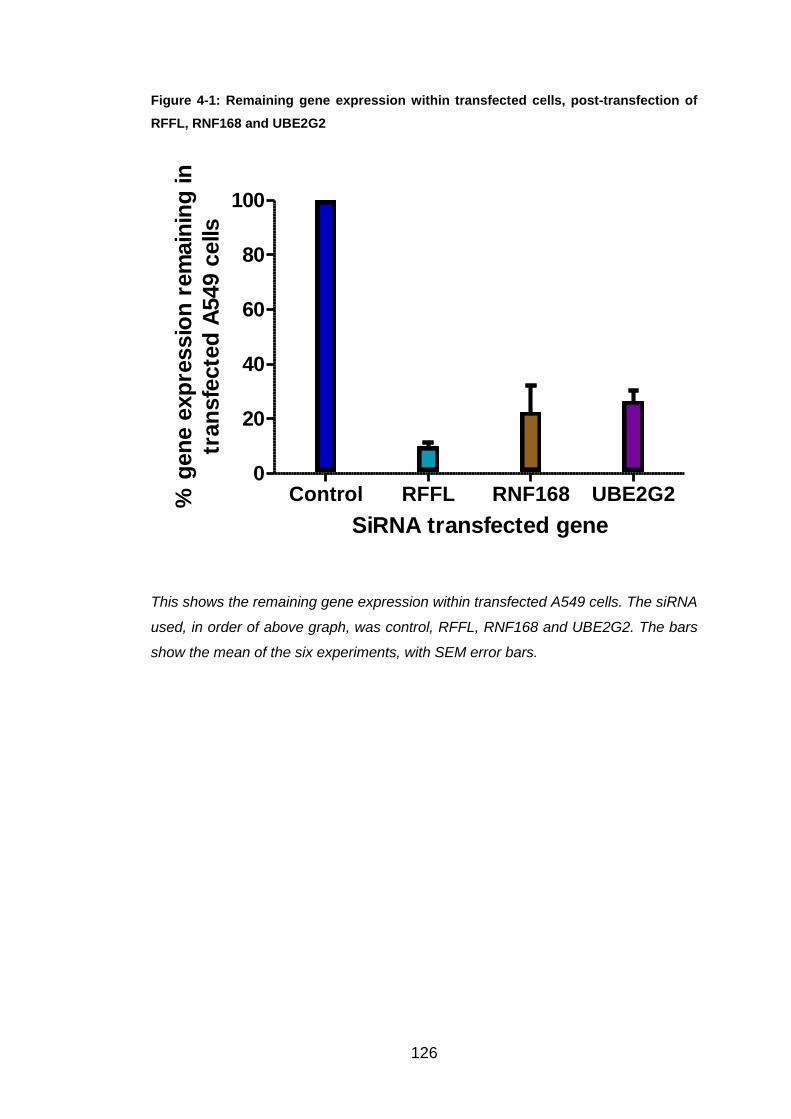
126
Figure 4-1: Remaining gene expression within transfected cells, post-transfection of
RFFL, RNF168 and UBE2G2
Control RFFL RNF168 UBE2G20
20
40
60
80
100
SiRNA transfected gene
% g
en
e e
xp
ressio
n r
em
ain
ing
in
tran
sfe
cte
d A
549 c
ells
This shows the remaining gene expression within transfected A549 cells. The siRNA
used, in order of above graph, was control, RFFL, RNF168 and UBE2G2. The bars
show the mean of the six experiments, with SEM error bars.
127
4.3.2 RSV Expression
Having confirmed gene knockdown, I investigated its effect on RSV
replication and expression in knocked down cultures. The L32 and RSV
expression ct values are shown in Table 4.3 for each of the gene expression
knockdown in all six experiments. The averages were calculated so that ct
values could be converted into percentage RSV expression (Table 4.4).
Figure 4.2 shows RSV N gene expression following knockdown of the three
genes. Following knockdown of RNF168 and UBE2G2, RSV expression
increased by 180 (+/-51)% and 113 (+/-25)%, respectively. RFFL transfection
resulted in a slight down-regulation of RSV expression (96 (+/-17)%).
Variation between experiments was much less than seen previously.
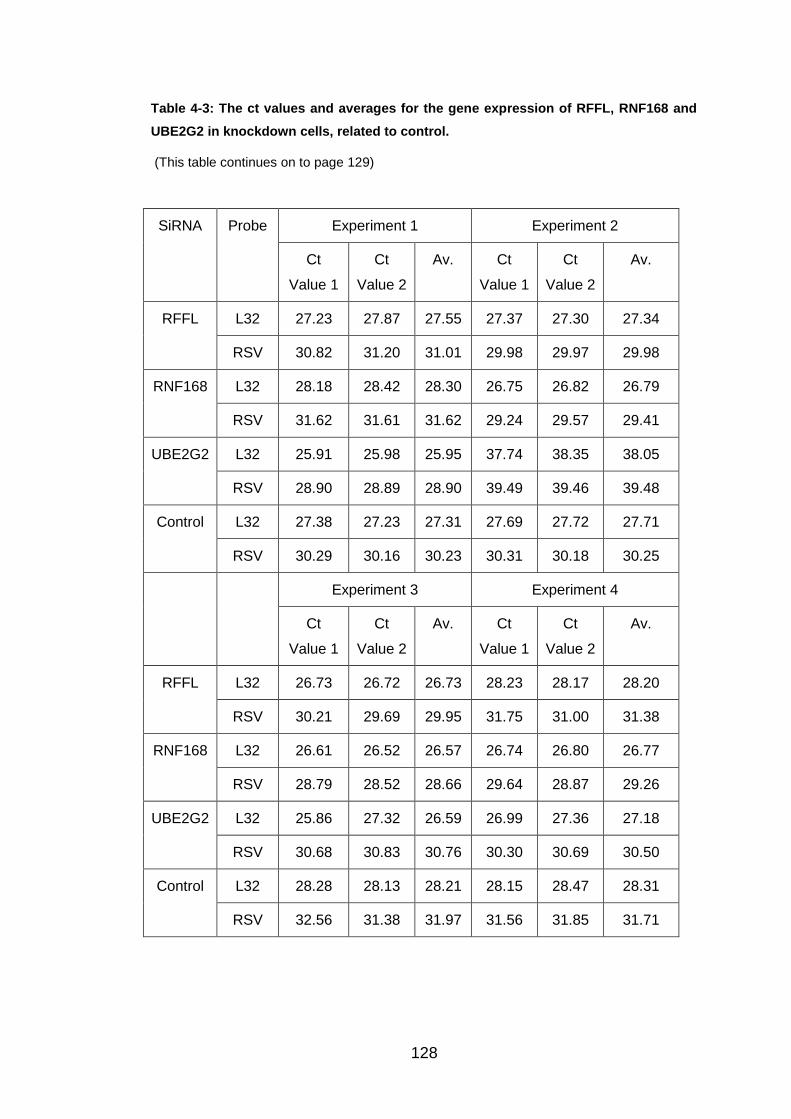
128
Table 4-3: The ct values and averages for the gene expression of RFFL, RNF168 and
UBE2G2 in knockdown cells, related to control.
(This table continues on to page 129)
SiRNA Probe Experiment 1 Experiment 2
Ct
Value 1
Ct
Value 2
Av. Ct
Value 1
Ct
Value 2
Av.
RFFL L32 27.23 27.87 27.55 27.37 27.30 27.34
RSV 30.82 31.20 31.01 29.98 29.97 29.98
RNF168 L32 28.18 28.42 28.30 26.75 26.82 26.79
RSV 31.62 31.61 31.62 29.24 29.57 29.41
UBE2G2 L32 25.91 25.98 25.95 37.74 38.35 38.05
RSV 28.90 28.89 28.90 39.49 39.46 39.48
Control L32 27.38 27.23 27.31 27.69 27.72 27.71
RSV 30.29 30.16 30.23 30.31 30.18 30.25
Experiment 3 Experiment 4
Ct
Value 1
Ct
Value 2
Av. Ct
Value 1
Ct
Value 2
Av.
RFFL L32 26.73 26.72 26.73 28.23 28.17 28.20
RSV 30.21 29.69 29.95 31.75 31.00 31.38
RNF168 L32 26.61 26.52 26.57 26.74 26.80 26.77
RSV 28.79 28.52 28.66 29.64 28.87 29.26
UBE2G2 L32 25.86 27.32 26.59 26.99 27.36 27.18
RSV 30.68 30.83 30.76 30.30 30.69 30.50
Control L32 28.28 28.13 28.21 28.15 28.47 28.31
RSV 32.56 31.38 31.97 31.56 31.85 31.71

129
Table 4-3 continued: The ct values and averages for the gene expression of RFFL,
RNF168 and UBE2G2 in knockdown cells, related to control.
SiRNA Probe Experiment 5 Experiment 6
Ct Value
1
Ct Value
2
Av. Ct
Value 1
Ct Value
2
Av.
RFFL L32 27.33 27.07 27.20 28.13 28.17 28.15
RSV 30.37 31.48 30.93 31.38 31.92 31.65
RNF168 L32 26.85 26.79 26.82 28.53 29.27 28.90
RSV 29.26 28.87 29.07 31.18 31.56 31.37
UBE2G2 L32 29.36 29.72 29.54 28.09 28.02 28.06
RSV 32.86 33.13 33.00 31.21 31.27 31.24
Control L32 29.35 29.26 29.31 27.18 27.09 27.14
RSV 33.77 32.89 33.33 28.83 28.97 28.90

130
Table 4-4: RSV expression for each experiment, after knockdown, and the subsequent
average value.
SiRNA Exp 1
(%)
Exp 2
(%)
Exp 3
(%)
Exp 4
(%)
Exp 5
(%)
Exp 6
(%)
Av. (%)
RFFL 68.78 93.30 145.40 116.47 123.11 30.04 96.20
RNF168 76.05 94.61 319.32 187.90 343.43 61.34 180.44
UBE2G2 97.94 215.85 75.79 105.34 148.45 37.37 113.46
Control 100 100 100 100 100 100 100
Figure 4-2: Average percentage RSV expression, post transfection, after six
experiments.
Control RFFL RNF168 UBE2G20
50
100
150
200
250
SiRNA transfected gene
% R
SV
Exp
ressio
n in
rela
tio
n t
o c
on
tro
l
Mean (SEM) percentage RSV expression, from six experiments, following
transfection of A549 cells.

131
4.4 Discussion
The aim of this chapter was to replicate the effect of RNF168 or RFFL
knockdown on RSV expression seen in Chapter 3. It was also to identify
whether knockdown of UBE2G2, a protein known to be associated with
RNF168 and RFFL using InnateDB, had a similar affect on RSV expression.
Firstly, I showed that RNF168, RFFL and UBE2G2 knockdown by siRNA had
successfully occurred. RFFL was knocked down most effectively (90 (+/-
1.5)%), followed by RNF168 (77 (+/-10)%) and UBE2G2 (73 (+/-4)%).
Expression in these cultures was thus less than 30% for each gene,
matching the knockdown results reported in Chapter 3.
Previously, I showed that RNF168 and RFFL knockdown had a large effect
on RSV replication, increasing RSV N gene expression by 415425% and
588815%, respectively, but with large variation (RNF168, 88-1,245,856%;
RFFL, 124-1,766,125%). In this series of six experiments, these high RSV
expression levels were not replicated. RNF168 knockdown induced an
increase in RSV N gene expression, but by less than two times the control
and RFFL knockdown actually resulted in a slight down-regulation in RSV N
gene expression, compared to the control. The variation over the six
experiments was much less than of those seen previously, suggesting that
these results may be more accurate.
It is not known exactly why there was such a difference in RSV N gene
expression between the previous experiments and the ones undertaken in
this chapter. They may have resulted from the lack of experience in the
laboratory during the initial stages of the year, as I did not have any previous
laboratory skills. The use of different batches of reagents, such as siRNA and
TaqMan® probes, may also have caused inconsistency within the results.
Only a slight increase in RSV N gene expression was seen within cells with
reduced UBE2G2 expression with RSV expression values over the six
experiments being 113% (37-216%). My results do not support the
suggestion of a role for UBE2G2 in inhibiting RSV expression and suggest
that if the E3 ligases, RFFL, RNF168 and TRIM43, do influence RSV
expression, it may be through an alternative E2 ligase.
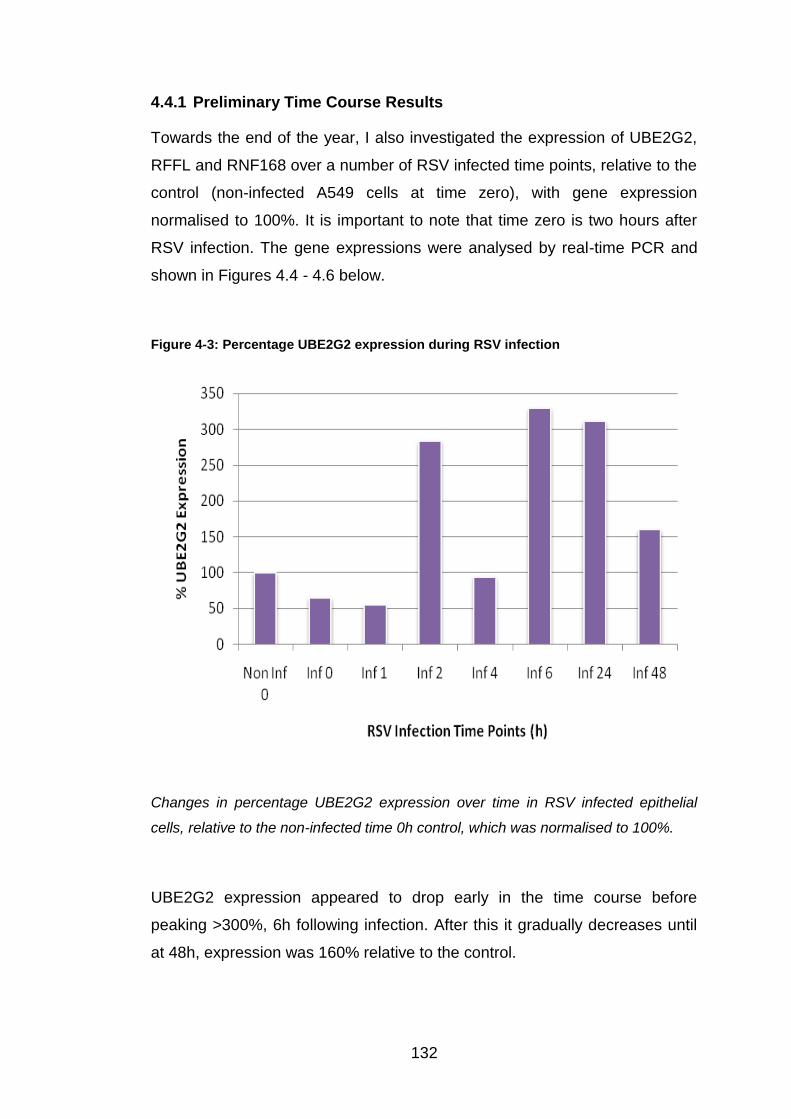
132
4.4.1 Preliminary Time Course Results
Towards the end of the year, I also investigated the expression of UBE2G2,
RFFL and RNF168 over a number of RSV infected time points, relative to the
control (non-infected A549 cells at time zero), with gene expression
normalised to 100%. It is important to note that time zero is two hours after
RSV infection. The gene expressions were analysed by real-time PCR and
shown in Figures 4.4 - 4.6 below.
Figure 4-3: Percentage UBE2G2 expression during RSV infection
Changes in percentage UBE2G2 expression over time in RSV infected epithelial
cells, relative to the non-infected time 0h control, which was normalised to 100%.
UBE2G2 expression appeared to drop early in the time course before
peaking >300%, 6h following infection. After this it gradually decreases until
at 48h, expression was 160% relative to the control.

133
Figure 4.4 shows how the percentage of RFFL changes over time in RSV-
infected A549s, relative to the control of non-infected cells at time 0h.
RFFL expression was lower than the control over the first 24h of infection. It
appeared to decrease with time, reaching 27% of the control expression at
4h following infection. By 48h however, RFFL expression had recovered and
peaked at 206%.
Figure 4-4: Percentage RFFL expression over a RSV time course
These results show the percentage RFFL expression over time in RSV infection. All
expressions relative to the control, non-infected time 0h.
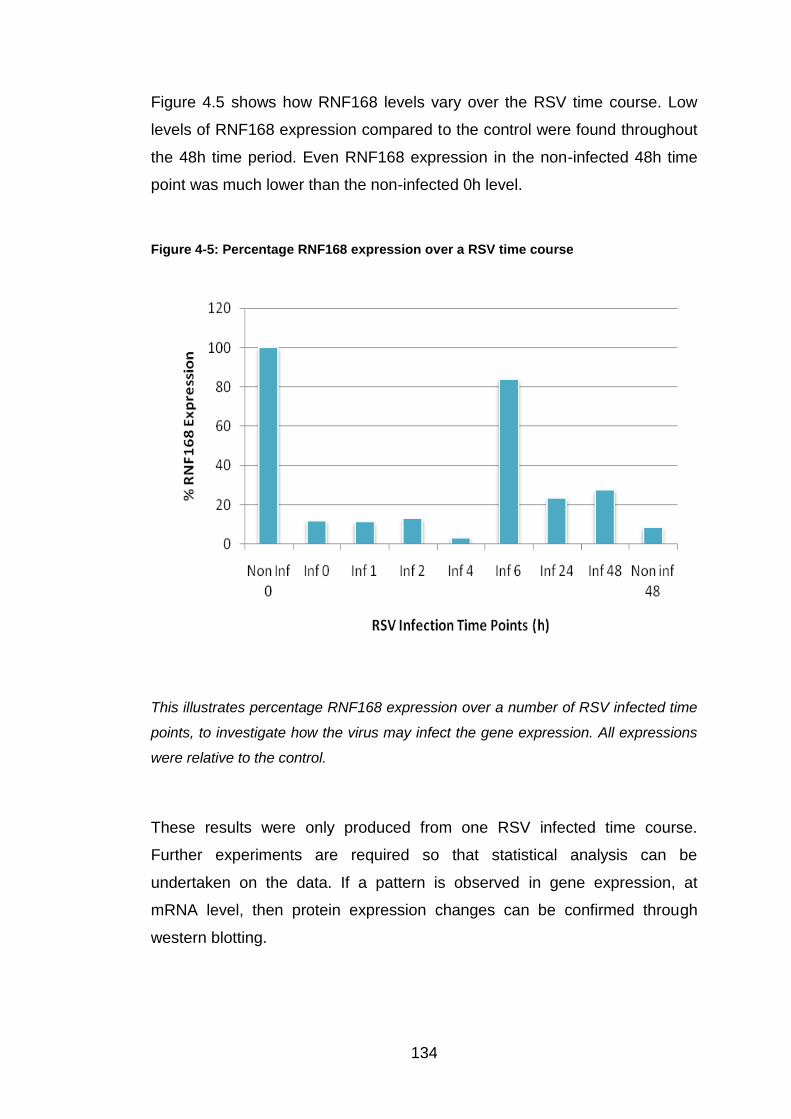
134
Figure 4.5 shows how RNF168 levels vary over the RSV time course. Low
levels of RNF168 expression compared to the control were found throughout
the 48h time period. Even RNF168 expression in the non-infected 48h time
point was much lower than the non-infected 0h level.
Figure 4-5: Percentage RNF168 expression over a RSV time course
This illustrates percentage RNF168 expression over a number of RSV infected time
points, to investigate how the virus may infect the gene expression. All expressions
were relative to the control.
These results were only produced from one RSV infected time course.
Further experiments are required so that statistical analysis can be
undertaken on the data. If a pattern is observed in gene expression, at
mRNA level, then protein expression changes can be confirmed through
western blotting.

135
5 GPR34
5.1 Introduction
GPR34, an orphan receptor in the rhodopsin-like division of GPCR family, is
a membrane protein that activates intracellular signals.
During the knockdown protocol described in Chapter 2, transfected epithelial
cell cultures were examined under the microscope for morphological
changes, whenever cultures were taken out of the incubator. The only
cultures in which morphological changes were seen were in GPR34
knockdown A549 cells.
To investigate this phenomenon further, confocal microscopy, an optical
technique that produces a number of fluorescent images, was used (Section
5.2.4). GPR34 transfected and non-transfected A549 cells were infected with
red fluorescent-labelled RSV, so that the effect of these morphological
changes on RSV infection could be observed. I also investigated where
GPR34 was located in non-transfected A549 cells.
5.2 Methods
5.2.1 Red fluorescent- labelled RSV Infection
GPR34 knockdown (Section 3.2.1) and non-transfected A549 cells were
seeded and cultured in two separate T25 flasks until 90% confluent, usually
48 hours later. Both flasks were washed with PBS. Red fluorescent-labelled
RSV stock (kindly provided by Dr Mark Peeples, Ohio State University) was
snap thawed using a water bath at 37oc. 166μl of RSV (MOI of 1) was added
to 3.834ml of FCS-free medium, and placed into one of the flasks. 4ml of
FCS-free medium alone was added to the other flask. Both were then placed
into the incubator at 37oC and 5% CO2 for two hours.
4ml of supplemented medium was pipetted into each flask, before returning
them to the incubator for another 48 hours.

136
5.2.2 Microscopic Slide Production
The cell pellets of GPR34 knockdown and non-transfected A549 cells were
collected as described in Section 2.1.1 with the cell supernatants collected
and stored at -20oC. The cell pellets were then resuspended in 5ml of PBS.
After being mixed well, 1ml of this solution was removed and placed into a
fresh universal tube with 19mls of PBS.
Using 50µl of this diluted solution for each slide, we obtained cytospins from
these samples using a cytospin machine (Speed five for five minutes). The
slides were then air dried for approximately ten minutes. Each slide was then
dipped in formalin to fix the cells, which was then washed off fifteen minutes
later with PBS, prior to being left to air dry again.
Section 5.2.3 describes the staining procedure followed. Following this,
coverslips were mounted onto each slide using a fluorescent mounting
medium (Vectoshield).
5.2.3 GPR34 Antibody Staining
Once the cells were fixed and dried on their slides, a Dako wax pen was
used to draw a circle around them. This made it easier to find the cells and
prevented reagents from running off the slide. As GPR34 is a
transmembrane protein, the binding surface must be blocked, so that non-
specific binding of the antibody does not occur. For my experiments I used
50μl of goat serum blocker on each slide, which was left in a moist, dark
container for thirty minutes at room temperature. These conditions were
essential to avoid damage to the cells from light, and to prevent the reagents
from drying out.
This blocker was then washed off with PBS twice, before adding 50μl of
0.5mg/mL Human GPR34 Antibody (Monoclonal mouse IgG2A; R&D
Systems), diluted in sterile PBS, to the slide. For each experiment, a negative
control slide was made using 50μl of Human Cytokeratin Monoclonal mouse
IgG2A Antibody (1 in 200 dilution; 0.1 mg/mL; BD Biosciences). These were
left in the same dark, moist container for three hours at 4oC.
137
Slides were then washed twice again with PBS, before adding 50μl of Texas
Red Secondary Antibody (Goat anti-mouse IgG; 1:400 dilution; 0.5mg/mL;
AbCam) for 30 minutes at room temperature in the dark, moist container.
The cells were washed again twice with PBS and 50μl of DAPI, at 1:10,000
dilution (1mg/mL; Sigma), pipetted onto each slide for three minutes before
being quickly washed off twice with PBS.
This same protocol was used for A549 cells transfected with the GPR34
siRNA and for Red RSV infected A549 cells.
5.2.4 Confocal Microscope
Confocal microscopy is an optical technique that uses illumination and
pinhole light sources to remove out-of-focus glare. Using this technique, it is
possible to produce single-, double-, and triple-labelled fluorescent images
using red, green and blue colours. These colours depend on which
fluorescent label has been used on the cells. The colours used during these
experiments were red and blue with a Texas Red Secondary selected to
attach onto the GPR34 antibody, and the blue DAPI stain used to visualise
cell nuclei. Red fluorescent-labelled RSV was also used to show RSV
infection.
5.3 Results
5.3.1 Morphological changes under light microscope
The morphological changes seen under light microscopy in GPR34
transfected A549 cells are shown in Figure 5.1 below.

138
Figure 5-1: Morphological changes in GPR34 knockdown A549 cells on day two
following transfection (200x magnification)
Figure 5.1 continues on to page 139.
A)
B)

139
Figure 5-1 Continued Morphological changes in GPR34 knockdown A549 cells on
day two following transfection (200x magnification)
C)
D)
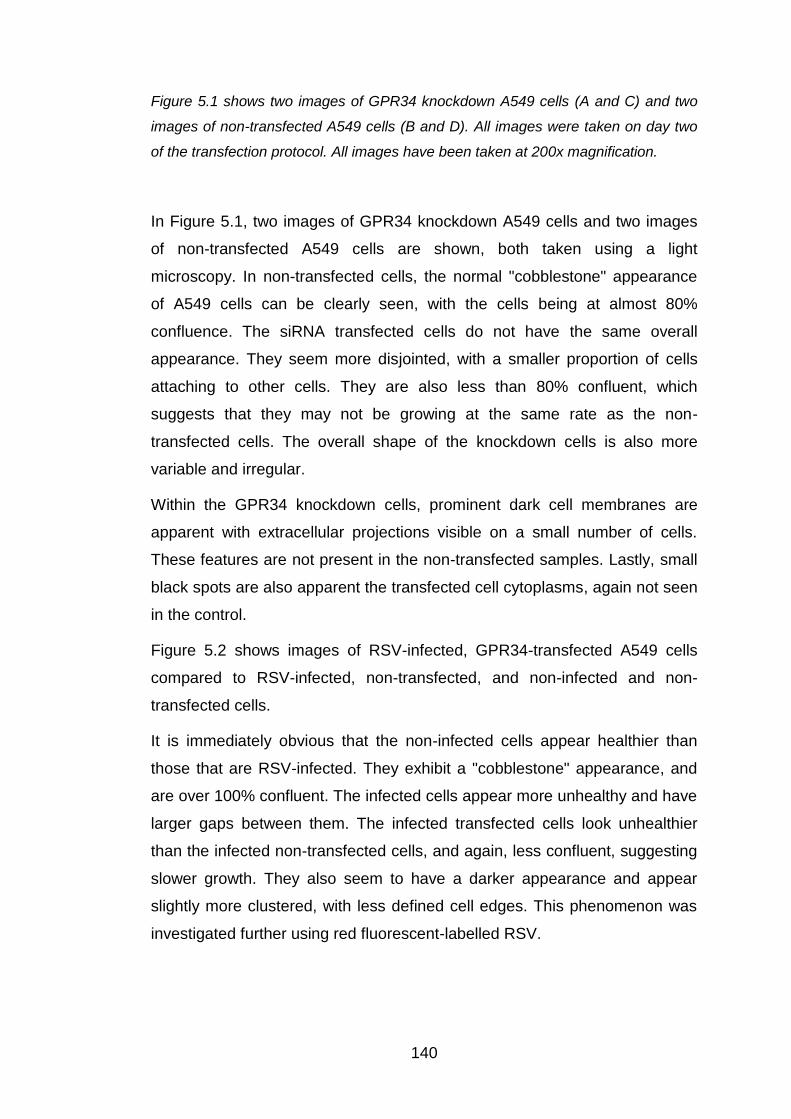
140
Figure 5.1 shows two images of GPR34 knockdown A549 cells (A and C) and two
images of non-transfected A549 cells (B and D). All images were taken on day two
of the transfection protocol. All images have been taken at 200x magnification.
In Figure 5.1, two images of GPR34 knockdown A549 cells and two images
of non-transfected A549 cells are shown, both taken using a light
microscopy. In non-transfected cells, the normal "cobblestone" appearance
of A549 cells can be clearly seen, with the cells being at almost 80%
confluence. The siRNA transfected cells do not have the same overall
appearance. They seem more disjointed, with a smaller proportion of cells
attaching to other cells. They are also less than 80% confluent, which
suggests that they may not be growing at the same rate as the non-
transfected cells. The overall shape of the knockdown cells is also more
variable and irregular.
Within the GPR34 knockdown cells, prominent dark cell membranes are
apparent with extracellular projections visible on a small number of cells.
These features are not present in the non-transfected samples. Lastly, small
black spots are also apparent the transfected cell cytoplasms, again not seen
in the control.
Figure 5.2 shows images of RSV-infected, GPR34-transfected A549 cells
compared to RSV-infected, non-transfected, and non-infected and non-
transfected cells.
It is immediately obvious that the non-infected cells appear healthier than
those that are RSV-infected. They exhibit a "cobblestone" appearance, and
are over 100% confluent. The infected cells appear more unhealthy and have
larger gaps between them. The infected transfected cells look unhealthier
than the infected non-transfected cells, and again, less confluent, suggesting
slower growth. They also seem to have a darker appearance and appear
slightly more clustered, with less defined cell edges. This phenomenon was
investigated further using red fluorescent-labelled RSV.

141
Figure 5-2: Comparison of infected GPR34 knockdown A549 cells, infected non-
transfected A549 cells and non-infected, non-transfected A549 cells on day five.
These images were also taken at 200x magnification on the light microscope, but on
day five of the protocol. The first image is of RSV infected, GPR34 transfected A549
cells. The second image is of RSV infected, non-transfected A549 cells, and the
third image is of non-infected, non-transfected A549 cells.
Infected GPR34
transfected A549 cells
Infected, non-
transfected A549 cells
Non-infected, non-
transfected A549
cells

142
5.3.2 A549 infection with red fluorescent-labelled RSV
Given the morphological changes observed, we used red fluorescent-labelled
RSV to determine whether GPR34 knockdown visibly changed the cellular
response to RSV.
Figure 5.3 again shows morphological differences between GPR34
transfected and non-transfected A549 cells, infected with red RSV. In both
images, it appears that the RSV is located within the cell cytoplasm with the
nuclei appearing RSV free.
Overall, the edges of the transfected cells are less well defined. The red
colour also seems to be less dense at the edges of the transfected cells,
whereas the colour remains consistent throughout the non-transfected cells.
The transfected cells also have a more speckled appearance, with unusual
black spots near the cell membrane. Figure 6.4 shows these changes at
higher magnification. ‘Blebs’ near or within the cell membrane can be clearly
seen.

143
Figure 5-3: Comparison of red RSV infected A549 cells that are transfected or non-
transfected with GPR34 siRNA.
A549 cells transfected with GPR34 siRNA or cultured normally, were infected with
red RSV. After 48 hours, the cells were fixed onto microscopic slides.
Red RSV infected,
GPR34 transfected
A549 cells
Red RSV infected,
non-transfected
A549 cells
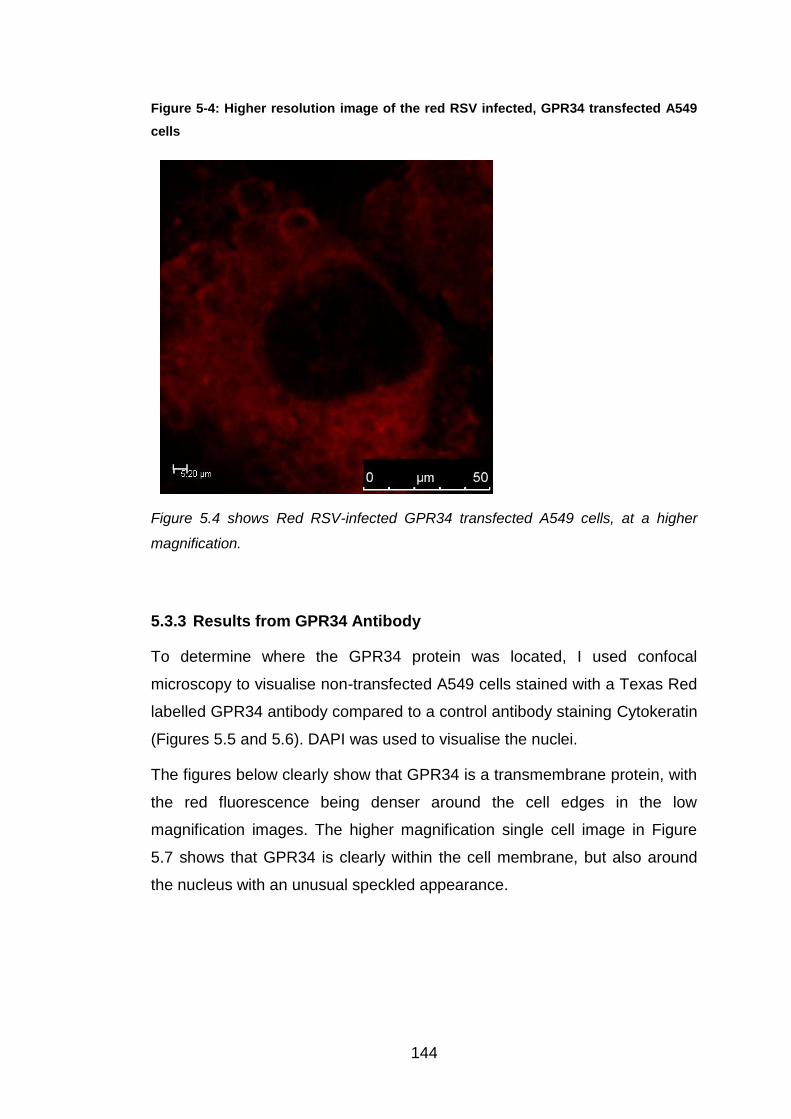
144
Figure 5-4: Higher resolution image of the red RSV infected, GPR34 transfected A549
cells
Figure 5.4 shows Red RSV-infected GPR34 transfected A549 cells, at a higher
magnification.
5.3.3 Results from GPR34 Antibody
To determine where the GPR34 protein was located, I used confocal
microscopy to visualise non-transfected A549 cells stained with a Texas Red
labelled GPR34 antibody compared to a control antibody staining Cytokeratin
(Figures 5.5 and 5.6). DAPI was used to visualise the nuclei.
The figures below clearly show that GPR34 is a transmembrane protein, with
the red fluorescence being denser around the cell edges in the low
magnification images. The higher magnification single cell image in Figure
5.7 shows that GPR34 is clearly within the cell membrane, but also around
the nucleus with an unusual speckled appearance.
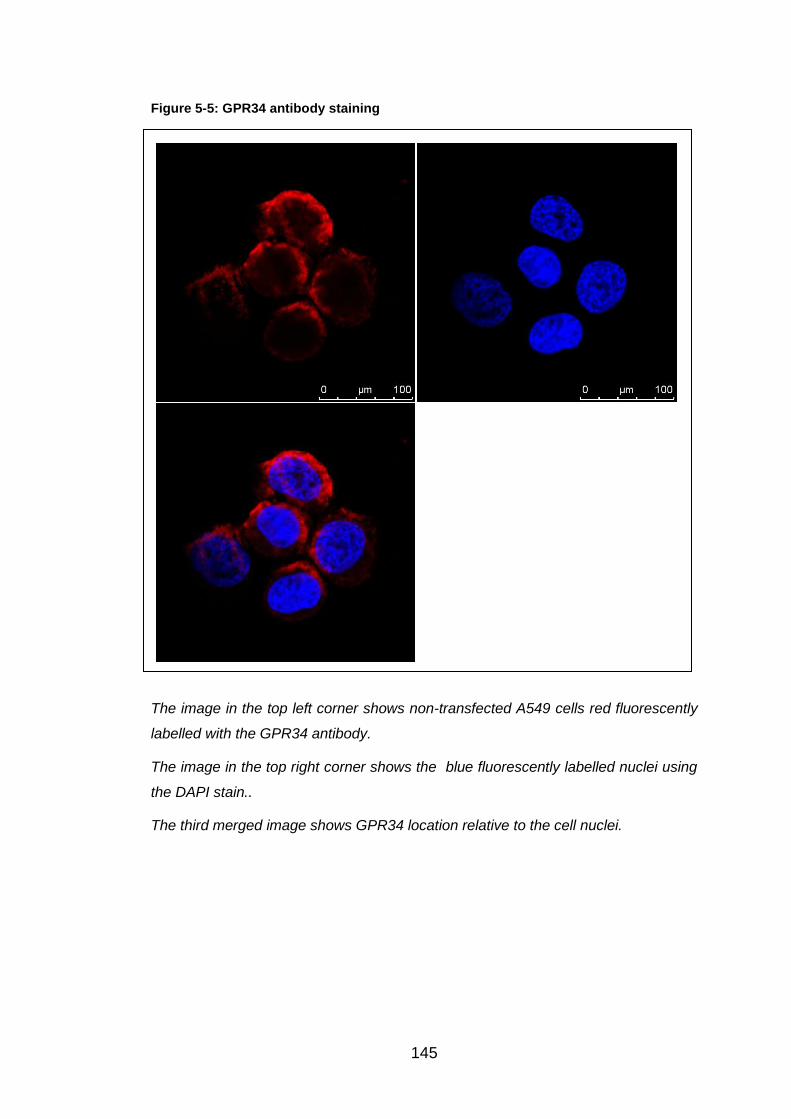
145
Figure 5-5: GPR34 antibody staining
The image in the top left corner shows non-transfected A549 cells red fluorescently
labelled with the GPR34 antibody.
The image in the top right corner shows the blue fluorescently labelled nuclei using
the DAPI stain..
The third merged image shows GPR34 location relative to the cell nuclei.
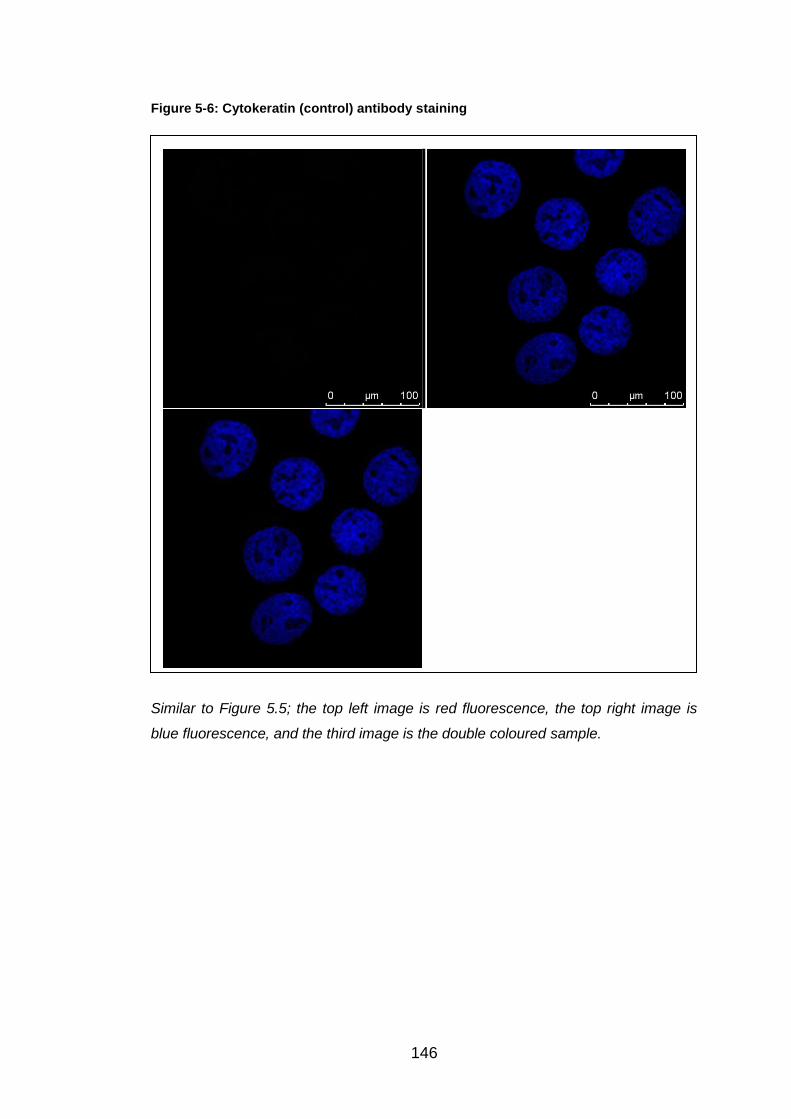
146
Figure 5-6: Cytokeratin (control) antibody staining
Similar to Figure 5.5; the top left image is red fluorescence, the top right image is
blue fluorescence, and the third image is the double coloured sample.

147
Figure 5-7: GPR34 antibody staining within a single cell
This shows an A549 cell stained with GPR34 antibody, Texas red secondary and
DAPI. The image has been produced by the confocal microscope.

148
5.4 Discussion
GPR34 is a membrane protein, which causes a response by triggering
intracellular signals through the stimulation of heterotrimeric G proteins. It
was first discovered in 1999, during a search on GenBank for original GPCR
sequences. GPR34 is located on the X chromosome, and has been
preserved for 450 million years, as it has been identified in every vertebrate
species to date. GPR34 is an orphan receptor in the rhodopsin-like subset of
the GPCR family. To date, no interactions have been found associated with
this gene (113-115).
Under light microscopy, GPR34 transfected A549 cells appeared to lose their
normal 'cobblestone' appearance and were more sparse, suggesting that
they are not able to grow at the same rate. The transfected cells were also
more irregular in shape and varied in size. Individually, the cells had
prominent dark cell membranes, with unusual black spots within the
cytoplasm. RSV infection of both transfected and non-transfected cells
resulted in a similar appearance.
Given this phenomenon, red fluorescent-labelled RSV was used to visualise
these morphological changes better and to see whether GPR34 transfection
affected where RSV was located within the infected cell. The images within
this chapter confirm that RSV infection predominantly occurs within the
cytoplasm. In GPR34 transfected cells, the red RSV fluorescence faded
towards the peripheries of the cell, compared to the well-defined membranes
and consistent red colour observed in the non-transfected cells. The
cytoplasm of the knockdown cells also had a speckled appearance, with
black spherical 'outcrops' from the membrane. These blebs may imply that
GPR34 may have a role in maintaining the internal structure of the cell or in
maintaining its membrane integrity. Blebbing is also associated with cellular
apoptosis, and we could be witnessing an accelerated or abnormal apoptotic
process occurring (170).
A GPR34 antibody was also used to investigate the location of the GPR34
protein within non-transfected cells. The red colour was denser around the
cell edges, suggesting the GPR34 was mainly found within the cell
149
membrane. On imaging a single cell, GPR34 protein was shown within the
cell membrane, but also around the nucleus. These findings require
repeating, as this series of experiments was only performed once due to
pressures of time. Given more time, a Z stack would have been performed on
the confocal microscope to determine in 3D where in the cell GPR34 was
located.
Again, given more time, validation of these results could have been done by
examining how GPR34 protein levels changed in transfected and non-
transfected cells using Western blots. Immunoprecipitation, a technique that
allows the isolation of individual proteins or complexes of attached proteins,
could also have been used to determine whether RSV proteins, such as NS1
and NS2, attach to GPR34 protein during infection.
Further work on this protein might include using techniques to increase
cellular GPR34 protein expression to see how this affects cell morphology
and the response to RSV infection. MG-132, a proteasomal inhibitor, works
by preventing protein degradation. It could be used to investigate whether
GPR34 is degraded through the proteasome or not. If this were to be the
case, then GPR34 protein expression as measured by Western Blot would
increase, allowing GPR34 over-expression to be studied. Transfection of
A549 cells with GPR34 might also allow the influence of higher GPR34
expression on RSV infection to be studied. Future MPhil students may
undertake this over the coming year.

150
6 Final Discussion
The main objective of this MPhil thesis was to determine whether 26 innate
resistant genes, previously shown by Prof. Tripp at University of Georgia to
influence Influenza replication, differentially influenced RSV replication in
airway epithelial cells.
This was done by ensuring gene expression knockdown, using siRNA from
Prof. Tripp, was successful in our hands. Gene expression was successfully
knocked down for eight randomly selected genes by at least 70%. This is
either within, or better than, the predicted range of 60-80%. Based on these
studies, the expression for each of the 26 genes given to us by Prof. Tripp
was knocked down in A549 cells, and then infected by RSV. RSV N gene
expression was measured in these cultures two days following initial
infection. Twenty of the genes were found to up-regulate RSV expression
after knockdown, suggesting that these genes were potentially protective,
whereas six genes reduced RSV activity post siRNA transfection (Figure
3.21).
RFFL and RNF168 were studied further, because knockdown of these genes
caused a many thousand-fold increase in RSV expression. Unfortunately,
when these experiments were repeated (>6 times), these findings could not
be replicated. RNF168 knockdown caused a mean (SEM) RSV N gene
expression of 180 (+/-51)% and RFFL knockdown caused RSV to be similar
to that of the non-transfected control. Using the InnateDB database, UBE2G2
was identified as a common partner for these two E3 ligases and also
TRIM43. UBE2G2 was investigated as it was thought that it might have an
important role in RSV replication by knocking down this gene in epithelial
cells and infecting the subsequent cultures with RSV. To our surprise, this
made little difference to RSV expression, indicating that it probably does not
have a significant role in protecting us against RSV infection.
GPR34 was investigated further because its knockdown caused
morphological changes to occur in epithelial cells that were observable under
the light microscope. Unknown dark membranes and spots within the GPR34
knocked down A549 cells were seen. Red fluorescent-labelled RSV was
151
used to show that blebbing occurred in the siRNA transfected A549 cells, and
a GPR34-antibody showed that this protein was primarily located within the
cell membrane.
Therefore this thesis has succeeded in all of the objectives initially described.
The results, limitations and potential future research ideas for each chapter
are as follows:
6.1 Validation of Innate Resistant Genes in RSV Replication
using SiRNA Transfection
In Chapter 3, the percentage knockdown was shown for a group of randomly
selected genes using siRNA from Prof Tripp. This analysis and calculation
would have to be performed for other genes if future work were to focus on a
particular gene whose knockdown had not been already calculated.
Furthermore, although it is a reasonable presumption that mRNA expression
is a good surrogate for protein expression, given more time, Western blot
analysis could be used to show that protein expression correlated with mRNA
expression.
Chapter 3 also details how the 26 genes that were knocked down influenced
RSV N gene expression following infection. In most of these transfected
RSV-infected cultures, there was considerable variation in RSV expression in
the three experiments undertaken, which made statistical analysis difficult.
Whilst every attempt was made to standardise the reagents and the
knockdown and infection protocol, this variation could have been due to
minor differences between bathes of reagents or virus (although aliquoted).
Minor differences in pipette use or similar technical reasons may also have
contributed. However, also plausible, could be variation in growth rate of
receptor expression, density of cells used or the cell cycle stage of these
cells at either transfection or infection stages of the protocol. Cycle stage is
believed to affect RSV replication and clearly growth rate would influence
viral replication. Similar variability in knockdown levels obtained were seen
using an analogous approach to look at susceptibility to flu virus replication
by R. Tripp (Personal Communicator) who standardised by using a larger
number of replicates.

152
How the results documented in this thesis relate to infants with RSV
bronchiolitis is a reasonable question to ask. These findings further our
understanding of the pathogenesis of RSV disease, and also highlight
avenues for future therapeutic research, which might possibly involve
increasing expression of these ‘innate resistance genes’ in the respiratory
epithelium.
6.2 Further studies of RFFL and RNF168, and identification
of UBE2G2
InnateDB is an online database that demonstrates interactions and pathways
between proteins important in innate immunity. This was used to investigate
possible protein-protein interactions possibly relevant to RSV infection.
UBE2G2, an E2 ligase, was identified as a common partner for RNF168,
RFFL and TRIM43 (Figure 3.22). As RNF168 and RFFL knockdown showed
a high increase in RSV N gene activity, and TRIM43 knockdown up-regulated
the RSV expression by over three times the control, it was decided to
investigate UBE2G2 further. Firstly, efficient knockdown had to be proved
and over six experiments the average gene expression knockdown was
73.40%, easily within the predicted range of 60-80%. Consequently, RSV N
gene expression was analysed, over six experiments, giving an overall
average of 113.46% (Figure 4.2). The variation of this expression was
between 37.37% and 215.85%. Therefore, these results do not support the
suggestion that UBE2G2 could have been a key component of the RSV
pathway. RFFL and RNF168 were also included in these six experiments to
try and prove the high RSV N gene expressions found in the three initial
experiments. Initially knockdown success was proved with the average
knockdown for RNF168 and RFFL being 77.45% and 90.03%, respectively.
After knockdown, neither gene could repeat the previous results. RFFL
knockdown actually caused a slight down-regulation in RSV expression with
an average value of 96.20%, with the value range between 30.04% and
145.40%. Whereas RNF168 knockdown displayed an overall up-regulation in
RSV N gene expression by nearly two fold. Even though this is not close to
the previous result, the result is encouraging and RNF168 has been

153
investigated further (See Section 6.5). Although the experimental number
was increased to n=6 replicates, variability was still observed between the
samples during analysis. As these knockdowns were carried out at the same
time they cannot be as easily explained by differences in reagent stocks or
preparations and the variability seen on different days. The reason for this
remaining variability is difficult to explain unless different number of cells had
perhaps survived transfection and exposure to Dharmafect. There is clearly a
further factor involved. This limitation could be addressed by further
increasing the number of replicated used for each siRNA or protein analysed
giving larger groups for a more robust statistical analysis and/or by employing
a robotic system to ensure standardisation of the time each sample was
exposed to each specific reagent or step during the protocol.
Throughout this MPhil project, A549 cells, an immortalised cell line, were
used to gain results. These are easy to grow, standardised and should
produce results similar to primary cells. Once data has been found though,
the use of A549 cells, bronchial brushings in RSV-infected and healthy
infants should be used to validate the findings. Samples from patients are a
valuable resource, but are not easily accessible in large sample numbers.
6.3 RSV and RNAi
Respiratory viruses have been a popular target for siRNA research, with RSV
being the first of these investigated in this area in 2001.
Reasons why respiratory viruses, especially, are targeted in this up and
coming area of study (105, 106):
1) Many viral sequences have already been identified, easing the
discovery for potential specific sequences.
2) Detailed research has occurred on respiratory viruses and their
optimal conditions for replication are well understood.
3) Unpredictable epidemics can be caused by respiratory viruses, so if
siRNA works therapeutically and the side effects are generally known,
then rapid therapeutic development could occur in emergencies.

154
4) Respiratory viruses are usually targeted by their surface proteins
which are often variable, so specific siRNAs would be much more
reliable.
A common barrier in the production of many medicines, is efficiently and
effectively delivering the agent. As mentioned above, the respiratory
epithelium is the first point of contact for RSV within its host. Inhaled delivery
of siRNA has been a success in targeting this epithelium and then taken up
by the epithelial cells after one dose. Ribavirin is an example of a successful
topically delivered antiviral against RSV (105, 106).
A number of attempts have already been made to find the particular target to
overcome RSV. An intranasal administered siRNA targeting the RSV P gene
was shown to significantly reduce RSV spread within mice models, but
unfortunately this would only defend against one specific strain. When
“knocking out” the RSV NS1 protein the virus is eradicated but mainly by the
immune system and host itself rather than the siRNA. Even though this is
looking promising, it is still unclear about how siRNA could potentially affect
the immune memory response. SiRNAs may also be tolerated by the young,
elderly and immunocompromised, which would be essential for management
against RSV (2, 108).
ALN-RSV01 is another potential siRNA which inhibits RSV N protein
expression. So far in research it has shown encouraging results throughout
murine models with significant lower RSV titres compared to the controls,
and in the 2009 publication DeVincenzo et al announced its safety in healthy
volunteers (105, 106, 171).
6.4 Morphological changes caused by GPR34
Each day of the siRNA transfection protocol the knockdown A549 cells were
inspected under the light microscope. The only gene resulting in
morphological changes after knockdown was GPR34. The images can be
seen, both after transfection, but pre RSV infection in Figure 5.1, and post
RSV infection in Figure 5.2. The morphological changes were more apparent
on day two of the protocol compared to day five. On day two (before RSV
infection), the GPR34 knockdown A549 cells were compared to the non-
155
siRNA transfected A549 cells. The normal "cobblestone" appearance and
efficient growth was shown in the non-transfected A549 cells. The GPR34
knockdown cells had more irregular shapes and sizes than those seen in the
control image. The knockdown cells were not as confluent suggesting that
they were not growing at the same rate to normal. Within the knockdown
cells, dark cell membranes, extracellular projections and black spots could be
seen. On day five (post RSV infection), the GPR34 knockdown cells were
continuing to grow at a slower rate than the non-knockdown cells. They also
appeared darker in colour, more clustered with less defined cellular edges,
compared to the non-transfected cells. The use of red fluorescent-labelled
RSV was utilised to observe these changes further by investigating under the
confocal microscope (Figures 5.3 and 5.4). In the GPR34 knockdown A549
cells, the morphological changes were present as the cells appeared
speckled, with unusual black spots on the membrane, which has been
suggested as blebbing, mainly associated with cellular apoptosis. The RSV
was found within the cell cytoplasm, excluding the nuclei, in A549 cells, but
the red colour became less dense towards the edges of the cells in
knockdown cells, compared to the non-transfected sample. Finally GPR34
was investigated by the use of antibody staining (Figures 5.5 and 5.6).
GPR34 antibody was stained onto A549 cells fixed on microscopic slides.
Cytokeratin antibody was used for the control slide. Cytokeratin is normally
found inside all cells forming a cytoskeleton within the cell, which gives the
cell its shape. Texas red secondary antibody was used, which works by
attaching onto the GPR34 antibody and therefore illustrating the location of
GPR34 in a red colour. This experiment proved that the GPR34 protein is
found mainly in the cell membrane, but occasionally seen within the nuclei.
The results for GPR34 are interesting, but validation of these results and
further techniques are required before it could all be understood.
Whilst focusing on the confocal microscope, a Z stack could be performed
detecting the depth distance that GPR34 is present within A549 cells. Also,
GPR34 knockdown cells could be stained with the GPR34 antibody to prove,
firstly, that the siRNA is knocking out the protein, and secondly, that the
antibody is targeting the correct protein. Western Blot technique could be
156
introduced to focus on protein expression, by confirming that the protein
expression is reduced by siRNA technique and whether there are any normal
changes in GPR34 protein expression over a number of RSV infection time
points. Any up- or down-regulation would be observed at protein level. The
protein is shown up on the Western Blot gel by the use of a GPR34 antibody.
Immunoprecipitation technique may also be used, which is able to isolate
proteins from the cell solution. This would be able to determine whether any
RSV proteins are able to attach onto the GPR34 protein, and are illustrated
through Western Blot. The use of a proteasome inhibitor (MG-132) could also
be utilised. This functions by inhibiting protein degradation to investigate
whether GPR34 is degraded via the proteasome or not. The results are
proven by Western Blot analysis, to show that protein expression has
increased, and should therefore cause a reduction in RSV N gene expression
when analysed by PCR. Another possible way to increase GPR34
expression within the cells is by transfecting GPR34 protein into the cells.
6.5 Further investigations for RNF168
Finally, RNF168 has been investigated further by Dr. B Flanagan (Personal
Communicator) through a number of techniques. The use of Western Blots
have shown that RNF168 protein expression reduces over RSV time points,
and begins to disappear at 24 and 48h post RSV infection. Lilley et al have
investigated the effect of ICP0, a protein of Herpes Simplex Virus Type I, on
RNF168, showing similar results, via Western Blot technique, over an
infection time period. Lilley has also shown that the use of MG-132,
proteasome inhibitor, causes the protein expression of RNF168 to be
increased, resulting in the reappearance of RNF168 on the Western Blot gel
(172, 173). Therefore this suggests that the use of MG-132 may increase
RNF168 expression during RSV infection. Whilst this technique is taking
place, further investigation using the confocal microscope can be done.
Similar to those mentioned for GPR34, a RNF168 antibody could be used to
investigate where RNF168 can be found in the cell, the efficiency of siRNA
knockdown and how RSV infection affects the protein, visibly. SiRNA
knockdown should also be validated through Western Blot to confirm protein
expression is being reduced, and immunoprecipitation could show any

157
association between RNF168 and RSV proteins. Also, through Dr. B
Flanagan, an association between H2A histone and RNF168 has been
found. Through mass spectrometry analysis, H2A histones are shown to be
less ubiquitinated in RSV infection. H2A histones have been found to be
ubiquinated by RNF168 in RSV infection, which induces the recruitment of
DNA repair molecules and enzymes. It is still unclear why this may
advantage RSV infection, as the virus does not enter the nuclei, whereas,
interestingly, ICP0 does (172, 173).
In pharmacology, Bortezomib is the first proteasome inhibitor to become an
intervention available for humans. It is an anti-cancer drug, indicated for
multiple myeloma. This is an interesting concept, because proteasomal
inhibition has been suggested to reduce RSV N gene expression. This
particular intervention would not be suitable obviously due to its cytotoxic
effects and non-specificity, but it is exciting to see an intervention produced
within this area.

158
References
1. González PA, Bueno SM, Riedel CA, Kalergis AM. Impairment of T Cell Immunity by the Respiratory Syncytial Virus: Targeting Virulence Mechanisms for Therapy and Prophylaxis. Current Medicinal Chemistry 2009;16 (34):4609-25.
2. Zhang WL, Tripp RA. RNA Interference Inhibits Respiratory Syncytial Virus Replication and Disease Pathogenesis without Inhibiting Priming of the Memory Immune Response. Journal of Virology 2008;82 (24):12221-31.
3. Zeng RH, Li CX, Li N, Wei L, Cui YX. The role of cytokines and chemokines in severe respiratory syncytial virus infection and subsequent asthma. Cytokine 2011;53 (1):1-7.
4. Habibi MS, Patel S, Openshaw P. Hot topics in the prevention of respiratory syncytial virus disease. Expert Review Of Vaccines 2011;10 (3):291-3.
5. Senft AP, Taylor RH, Lei W, Campbell SA, Tipper JL, Martinez MJ, et al. Respiratory syncytial virus impairs macrophage IFN-alpha/beta- and IFN-gamma-stimulated transcription by distinct mechanisms. American Journal Of Respiratory Cell And Molecular Biology 2010;42 (4):404-14.
6. Graham BS. Biological challenges and technological opportunities for respiratory syncytial virus vaccine development. Immunological Reviews 2011;239 (1):149-66.
7. Barreira ER, Precioso AR, Bousso A. Pulmonary Surfactant in Respiratory Syncytial Virus Bronchiolitis: The Role in Pathogenesis and Clinical Implications. Pediatric Pumonology 2011;46 (5):415-20.
8. Nair H, Verma VR, Theodoratou E, Zgaga L, Huda T, Simões EAF, et al. An evaluation of the emerging interventions against Respiratory Syncytial Virus (RSV)-associated acute lower respiratory infections in children. BMC Public Health 2011;11 Suppl 3:S30-S.
9. Eberle J. A treatise on the diseases and physical education of children. Lippincott. 1857.
10. Adams JM. Primary Virus Pneumonitis with Cytoplasmic Inclusion Bodies. Study of an Epidemic Involving Thirty-Two Infants, with Nine Deaths. Journal of the American Medical Association 1941;116 (10):925-33.
11. Adams J. Primary virus pneumonitisA comparative study of two epidemics. The Journal of Pediatrics (Science Direct) 1942;20 (4):405.
12. Morris JA, Blount RE, Jr, Savage RE. Recovery of Cytopathogenic Agent from Chimpanzees with Coryza. Proceedings of the Society for Experimental Biology and Medicine 1956;92 (3):544-9.

159
13. Chanock R, Roizman B, Myers R. Recovery from infants with respiratory illness of a virus related to Chimpanzee Coryza Agent (CCA). American Journal of Epidemiology 1957;66 (3):281.
14. Chanock RM, Parrott RH, Vargosko AJ, Kapikian AZ, Knight V, Johnson KM. Acute respiratory diseases of viral etiology. IV. Respiratory syncytial virus. American Journal Of Public Health And The Nation's Health 1962;52:918-25.
15. Groothuis JR, Hoopes JM, Jessie VGH. Prevention of serious respiratory syncytial virus-related illness. I: Disease pathogenesis and early attempts at prevention. Advances In Therapy 2011;28 (2):91-109.
16. Oshansky CM, Zhang WL, Moore E, Tripp RA. The host response and molecular pathogenesis associated with respiratory syncytial virus infection. Future Microbiology 2009;4 (3):279-97.
17. Krishnan S, Craven M, Welliver RC, Ahmad N, Halonen M. Differences in Participation of Innate and Adaptive Immunity to Respiratory Syncytial Virus in Adults and Neonates. The Journal of Infectious Diseases 2003;188 (3):433-9.
18. Ruotsalainen M, Piippo-Savolainen E, Hyvärinen MK, Korppi M. Respiratory morbidity in adulthood after respiratory syncytial virus hospitalization in infancy. The Pediatric Infectious Disease Journal 2010;29 (9):872-4.
19. Dawson-Caswell M, Muncie HL, Jr. Respiratory syncytial virus infection in children. American Family Physician 2011;83 (2):141-6.
20. Monick MM, Cameron K, Staber J, Powers LS, Yarovinsky TO, Koland JG, et al. Activation of the epidermal growth factor receptor by respiratory syncytial virus results in increased inflammation and delayed apoptosis. The Journal Of Biological Chemistry 2005;280 (3):2147-58.
21. Villenave R, O'Donoghue D, Thavagnanam S, Touzelet O, Skibinski G, Heaney LG, et al. Differential cytopathogenesis of respiratory syncytial virus prototypic and clinical isolates in primary pediatric bronchial epithelial cells. Virology Journal 2011;8:43-.
22. Johnson TR. Respiratory syncytial virus and innate immunity: a complex interplay of exploitation and subversion. Expert Review of Vaccines 2006;5 (3):371-80.
23. Bersch C. The nose knows: RSV and HRV. MLO: Medical Laboratory Observer 2010;42 (6):10-4.
24. Smyth RL. Innate immunity in respiratory syncytial virus bronchiolitis. Experimental Lung Research 2007;33 (10):543-7.
25. Greenough A. Respiratory syncytial virus infection: clinical features, management, and prophylaxis. Current Opinion In Pulmonary Medicine 2002;8 (3):214-7.
26. Cormier SA, You D, Honnegowda S. The use of a neonatal mouse model to study respiratory syncytial virus infections. Expert Review of Anti-infective Therapy 2010;8 (12):1371-80.
160
27. Crowcroft NS, Zambon M, Harrison TG, Mok Q, Heath P, Miller E. Respiratory syncytial virus infection in infants admitted to paediatric intensive care units in London, and in their families. European Journal Of Pediatrics 2008;167 (4):395-9.
28. Organisation WH. Acute Respiratory Infections - Respiratory syncytial virus and parainfluenza viruses; September 2009; Available from: http://www.who.int/vaccine_research/diseases/ari/en/index2.html.
29. Smyth RL, Openshaw PJM. Bronchiolitis. Lancet 2006;368 (9532):312-22.
30. Collins PL, Melero JA. Progress in understanding and controlling respiratory syncytial virus: Still crazy after all these years. Virus Research 2011;162 (1/2):80-99.
31. Zuccotti G, Dilillo D, Zappa A, Galli E, Amendola A, Martinelli M, et al. Epidemiological and clinical features of respiratory viral infections in hospitalized children during the circulation of influenza virus A (H1N1) 2009. Influenza and Other Respiratory Viruses 2011;5 (6):R528-R34.
32. Manoha C, Espinosa S, Aho S-L, Huet F, Pothier P. Epidemiological and clinical features of hMPV, RSV and RVs infections in young children. Journal Of Clinical Virology: The Official Publication Of The Pan American Society For Clinical Virology 2007;38 (3):221-6.
33. Meqdam MM, Subaih SH. Rapid detection and clinical features of infants and young children with acute lower respiratory tract infection due to respiratory syncytial virus. FEMS Immunology And Medical Microbiology 2006;47 (1):129-33.
34. Flores P, Rebelo-de-Andrade H, Gonçalves P, Guiomar R, Carvalho C, Sousa EN, et al. Bronchiolitis caused by respiratory syncytial virus in an area of portugal: epidemiology, clinical features, and risk factors. European Journal Of Clinical Microbiology & Infectious Diseases: Official Publication Of The European Society Of Clinical Microbiology 2004;23 (1):39-45.
35. Fitzgerald DA. Viral bronchiolitis for the clinician. Journal of Paediatrics & Child Health 2011;47 (4):160-6.
36. Herranz C, Melero JA, Martínez I. Reduced innate immune response, apoptosis, and virus release in cells cured of respiratory syncytial virus persistent infection. Virology 2011;410 (1):56-63.
37. Yasuno T, Shimizu T, Maeda Y, Yamasaki A, Amaya E, Kawakatsu H. Wheezing illness caused by respiratory syncytial virus and other agents. Pediatrics International 2008;50 (4):500-5.
38. Papenburg J, Boivin G. The distinguishing features of human metapneumovirus and respiratory syncytial virus. Reviews In Medical Virology 2010;20 (4):245-60.

161
39. Stein RT, Sherrill D, Morgan WJ, Holberg CJ, Halonen M, Taussig LM, et al. Respiratory syncytial virus in early life and risk of wheeze and allergy by age 13 years. Lancet 1999;354 (9178):541-5.
40. Sigurs N, Gustafsson PM, Bjarnason R, Lundberg F, Schmidt S, Sigurbergsson F, et al. Severe respiratory syncytial virus bronchiolitis in infancy and asthma and allergy at age 13. American Journal of Respiratory & Critical Care Medicine 2005;171 (2):137-41.
41. Feltes TF, Sondheimer HM, Tulloh RMR, Harris BS, Jensen KM, Losonsky GA, et al. A Randomized Controlled Trial of Motavizumab Versus Palivizumab for the Prophylaxis of Serious Respiratory Syncytial Virus Disease in Children With Hemodynamically Significant Congenital Heart Disease. Pediatric Research 2011;70 (2):186-91.
42. Sow FB, Gallup JM, Krishnan S, Patera AC, Suzich J, Ackermann MR. Respiratory syncytial virus infection is associated with an altered innate immunity and a heightened pro-inflammatory response in the lungs of preterm lambs. Respiratory Research 2011;12.
43. Krilov LR, Palazzi DL, Fernandes AW, Klein RW, Mahadevia PJ. Prevalence of respiratory syncytial virus (RSV) risk factors and cost implications of immunoprophylaxis to infants 32 to 35 weeks gestation for health plans in the United States. Value In Health: The Journal Of The International Society For Pharmacoeconomics And Outcomes Research 2010;13 (1):77-86.
44. Weisman LE. Populations at risk for developing respiratory syncytial virus and risk factors for respiratory syncytial virus severity: infants with predisposing conditions. The Pediatric Infectious Disease Journal 2003;22 (2 Suppl):S33.
45. Lanari M, Silvestri M, Rossi GA. Respiratory syncytial virus risk factors in late preterm infants. Journal of Maternal-Fetal & Neonatal Medicine 2009;22:102-7.
46. Groothuis J, Makari D, Hoopes JM. RSV risk: understanding RSV-related hospitalization of high-risk infants. Managed Care 2009;18 (10):1-9.
47. Colin AA, McEvoy C, Castile RG. Respiratory morbidity and lung function in preterm infants of 32 to 36 weeks' gestational age. Pediatrics 2010;126 (1):115-28.
48. Todd FE, Roberg KA, Welliver RC. Preventing RSV Infection in At-risk Infants: Current and Emerging Strategies. Pediatric Nursing 2010:3-14.
49. Kristensen K, Stensballe LG, Bjerre J, Roth D, Fisker N, Kongstad T, et al. Risk factors for respiratory syncytial virus hospitalisation in children with heart disease. Archives of Disease in Childhood 2009;94 (10):785-9.
50. Alexander PMA, Eastaugh L, Royle J, Daley AJ, Shekerdemian LS, Penny DJ. Respiratory syncytial virus immunoprophylaxis in high-

162
risk infants with heart disease. Journal of Paediatrics & Child Health 2012;48 (5):395-401.
51. Bloemers BLP, Broers CJM, Bont L, Weijerman ME, Gemke R, van Furth AM. Increased risk of respiratory tract infections in children with Down syndrome: the consequence of an altered immune system. Microbes and Infection 2010;12 (11):799-808.
52. Giebels K, Marcotte JE, Podoba J, Rousseau C, Denis MH, Fauvel V, et al. Prophylaxis against respiratory syncytial virus in young children with cystic fibrosis. Pediatric Pulmonology 2008;43 (2):169-74.
53. Ebbert JO, Limper AH. Respiratory syncytial virus pneumonitis in immunocompromised adults: clinical features and outcome. Respiration; International Review Of Thoracic Diseases 2005;72 (3):263-9.
54. Zhang L, Mendoza-Sassi RA, Wainwright C, Klassen TR. Nebulized hypertonic saline solution for acute bronchiolitis in infants. Cochrane Database of Systematic Reviews 2008 (4).
55. Gadomski AM, Brower M. Bronchodilators for bronchiolitis. Cochrane Database Of Systematic Reviews (Online) 2010 (12):CD001266.
56. Hartling L, Bialy LM, Vandermeer B, Tjosvold L, Johnson DW, Plint AC, et al. Epinephrine for bronchiolitis. Cochrane Database Of Systematic Reviews (Online) 2011 (6):CD003123.
57. Spurling GK, Doust J, Del Mar CB, Eriksson L. Antibiotics for bronchiolitis in children. Cochrane Database Of Systematic Reviews (Online) 2011 (6):CD005189.
58. Kapikian AZ, Mitchell RH, Chanock RM, Schvedoff RA, Stewart CE. An epidemiologic study of altered clinical reactivity to respiratory syncytial (RS) virus infection in children previously vaccinated with an inactivated RS virus vaccine. American Journal of Epidemiology 1969;89 (4):405-21.
59. Health RCoPaC. SIGN: Bronchiolitis in Children; 2006; Available from: http://www.rcpch.ac.uk/sites/default/files/asset_library/Research/Clinical%20Effectiveness/Endorsed%20guidelines/Bronchiolitis%20in%20Children%20%28SIGN%29/Bronchiolitis%20quick%20reference%20guide.pdf.
60. AAP. Summary of 2009 AAP Recommendations for RSV Prophylaxis of High-Risk Infants and Children. 2009.
61. Martinez I, Lombardia L, Herranz C, Garcia-Barreno B, Dominguez O, Melero JA. Cultures of HEp-2 cells persistently infected by human respiratory syncytial virus differ in chemokine expression and resistance to apoptosis as compared to lytic infections of the same cell type. Virology 2009;388 (1):31-41.
62. Wertz GW, Moudy RM. Antigenic and genetic variation in human respiratory syncytial virus. Pediatric Infectious Disease Journal 2004;23:S19-S24.

163
63. Kumaria R, Iyer LR, Hibberd ML, Simões EAF, Sugrue RJ. Whole genome characterization of non-tissue culture adapted HRSV strains in severely infected children. Virology Journal 2011;8:372-.
64. El Omari K, Dhaliwal B, Ren J, Abrescia NGA, Lockyer M, Powell KL, et al. Structures of respiratory syncytial virus nucleocapsid protein from two crystal forms: details of potential packing interactions in the native helical form. Acta Crystallographica: Section F (International Union of Crystallography - IUCr) 2011;67 (10):1179-83.
65. McNamara PS, Smyth RL. The pathogenesis of respiratory syncytial virus disease in childhood. British Medical Bulletin 2002;61:13-28.
66. Bermingham A, Collins PL. The M2-2 Protein of Human Respiratory Syncytial Virus Is a Regulatory Factor Involved in the Balance between RNA Replication and Transcription. Proceedings of the National Academy of Sciences of the United States of America 1999;96 (20):11259-64.
67. Swedan S, Andrews J, Majumdar T, Musiyenko A, Barik S. Multiple functional domains and complexes of the two nonstructural proteins of human respiratory syncytial virus contribute to interferon suppression and cellular location. Journal Of Virology 2011;85 (19):10090-100.
68. Swedan S, Musiyenko A, Barik S. Respiratory Syncytial Virus Nonstructural Proteins Decrease Levels of Multiple Members of the Cellular Interferon Pathways. Journal of Virology 2009;83 (19):9682-93.
69. Elliott J, Lynch OT, Suessmuth Y, Qian P, Boyd CR, Burrows JF, et al. Respiratory syncytial virus NS1 protein degrades STAT2 by using the elongin-cullin E3 ligase. Journal of Virology 2007;81 (7):3428-36.
70. Ramaswamy M, Shi L, Varga SM, Barik S, Behlke MA, Look DC. Respiratory syncytial virus nonstructural protein 2 specifically inhibits type I interferon signal transduction. Virology 2006;344 (2):328-39.
71. McLellan JS, Yang YP, Graham BS, Kwong PD. Structure of Respiratory Syncytial Virus Fusion Glycoprotein in the Postfusion Conformation Reveals Preservation of Neutralizing Epitopes. Journal of Virology 2011;85 (15):7788-96.
72. Day ND, Branigan PJ, Liu C, Gutshall LL, Luo J, Melero JA, et al. Contribution of cysteine residues in the extracellular domain of the F protein of human respiratory syncytial virus to its function. Virology Journal 2006;3:34-.
73. Minor RAC, Limmon GV, Miller-DeGraff L, Dixon D, Andrews DMK, Kaufman RJ, et al. Double-stranded RNA-activated protein kinase regulates early innate immune responses during respiratory syncytial virus infection. Journal Of Interferon & Cytokine Research: The Official Journal Of The International Society For Interferon And Cytokine Research 2010;30 (4):263-72.
74. Volz T, Kaesler S, Biedermann T. Innate immune sensing 2.0 - from linear activation pathways to fine tuned and regulated innate immune networks. Experimental Dermatology 2012;21 (1):61-9.
164
75. Ciechanover AJ, Sznajder JI. Innate and adaptive immunity: the 2011 Nobel Prize in Physiology or Medicine. American Journal Of Respiratory And Critical Care Medicine 2011;184 (11):i-ii.
76. Cooper MA, Colonna M, Yokoyama WM. Hidden talents of natural killers: NK cells in innate and adaptive immunity. EMBO Reports 2009;10 (10):1103-10.
77. Netea MG, Quintin J, van der Meer JWM. Trained immunity: a memory for innate host defense. Cell Host & Microbe 2011;9 (5):355-61.
78. Valen G. Innate immunity and remodelling. Heart Failure Reviews 2011;16 (1):71-8.
79. Akira S. Innate immunity and adjuvants. Philosophical Transactions Of The Royal Society Of London. Series B, Biological Sciences 2011;366 (1579):2748-55.
80. Van Kaer L, Parekh VV, Wu L. Invariant natural killer T cells: bridging innate and adaptive immunity. Cell And Tissue Research 2011;343 (1):43-55.
81. Paust S, Senman B, von Andrian UH. Adaptive immune responses mediated by natural killer cells. Immunological Reviews 2010;235 (1):286-96.
82. Journo C, Mahieux R. HTLV-1 and Innate Immunity. Viruses (1999-4915) 2011;3 (8):1374-94.
83. Unterholzner L, Bowie AG. The interplay between viruses and innate immune signaling: Recent insights and therapeutic opportunities. Biochemical Pharmacology 2008:589-602.
84. Yoboua F, Martel A, Duval A, Mukawera E, Grandvaux N. Respiratory Syncytial Virus-Mediated NF-kappa B B p65 Phosphorylation at Serine 536 Is Dependent on RIG-I, TRAF6, and IKK beta. Journal of Virology 2010;84 (14):7267-77.
85. Kurt-Jones EA, Popova L, Kwinn L, Haynes LM, Jones LP, Tripp RA, et al. Pattern recognition receptors TLR4 and CD14 mediate response to respiratory syncytial virus. Nature Immunology 2000;1 (5):398-401.
86. Rallabhandi P, Phillips RL, Boukhvalova MS, Pletneva LM, Shirey KA, Gioannini TL, et al. Respiratory Syncytial Virus Fusion Protein-Induced Toll-Like Receptor 4 (TLR4) Signaling Is Inhibited by the TLR4 Antagonists Rhodobacter sphaeroides Lipopolysaccharide and Eritoran (E5564) and Requires Direct Interaction with MD-2. Mbio 2012;3 (4).
87. Rudd BD, Burstein E, Duckett CS, Li X, Lukacs NW. Differential Role for TLR3 in Respiratory Syncytial Virus-Induced Chemokine Expression. Journal of Virology 2005;79 (6):3350-7.
88. Nairn R, Helbert M. Immunology for medical students. 2nd ed. Philadelphia: Mosby; 2007.
89. Mailaparambil B, Jochum J, Forster J, Heinze J, Krueger M, Heinzmann A. Polymorphisms of interferons and their receptors in

165
the genetics of severe RSV-associated diseases. Archives of Virology 2008;153 (11):2133-7.
90. Oshansky CM, Krunkosky TM, Barber J, Jones LP, Tripp RA. Respiratory syncytial virus proteins modulate suppressors of cytokine signaling 1 and 3 and the type I interferon response to infection by a toll-like receptor pathway. Viral Immunology 2009;22 (3):147-61.
91. Rudd BD, Luker GD, Luker KE, Peebles RS, Lukacs NW. Type I interferon regulates respiratory virus infected dendritic cell maturation and cytokine production. Viral Immunology 2007;20 (4):531-40.
92. Krishnan S, Halonen M. Suppression of Innate Immune Cytokines and Interferon Regulatory Factor-1 by Endogenous Interferon-Alpha in Response to Respiratory Syncytial Virus in Neonate Mononuclear Cells. Immunological Investigations 2007;36 (4):441-56.
93. Spann KM, Tran K-C, Bo C, Rabin RL, Collins PL. Suppression of the Induction of Alpha, Beta, and Gamma Interferons by the NS1 and NS2 Proteins of Human Respiratory Syncytial Virus in Human Epithelial Cells and Macrophages. Journal of Virology 2004;78 (8):4363-9.
94. Ling Z, Tran KC, Teng MN. Human respiratory syncytial virus nonstructural protein NS2 antagonizes the activation of beta interferon transcription by interacting with RIG-I. Journal Of Virology 2009;83 (8):3734-42.
95. Bataki EL, Evans GS, Everard ML. Respiratory syncytial virus and neutrophil activation. Clinical & Experimental Immunology 2005;140 (3):470-7.
96. Reed JL, Brewah YA, Delaney T, Welliver T, Burwell T, Benjamin E, et al. Macrophage impairment underlies airway occlusion in primary respiratory syncytial virus bronchiolitis. Journal of Infectious Diseases 2008;198 (12):1783-93.
97. Pribul PK, Harker J, Wang B, Wang H, Tregoning JS, Schwarze J, et al. Alveolar macrophages are a major determinant of early responses to viral lung infection but do not influence subsequent disease development. Journal Of Virology 2008;82 (9):4441-8.
98. Tripp RA, Moore D, Jones L, Sullender W, Winter J, Anderson LJ. Respiratory syncytial virus G and/or SH protein alters Th1 cytokines, natural killer cells, and neutrophils responding to pulmonary infection in BALB/c mice. Journal of Virology 1999;73 (9):7099-107.
99. Jianou Qiao, Ang Li, Xianquia Jin. TSLP from RSV-stimulated rat airway epithelial cells activates myeloid dendritic cells. Immunology & Cell Biology 2011;89 (2)231-238
100. Walsh EE, Falsey AR. Humoral and Mucosal Immunity in Protection from Natural Respiratory Syncytial Virus Infection in Adults. The Journal of Infectious Diseases 2004;190 (2):373-8.
101. Haynes LM, Tonkin J, Anderson LJ, Tripp RA. Neutralizing anti-F glycoprotein and anti-substance P antibody treatment effectively
166
reduces infection and inflammation associated with respiratory syncytial virus infection. Journal of Virology 2002;76 (14):6873-81.
102. Lee FEH, Falsey AR, Halliley JL, Sanz I, Walsh EE. Circulating Antibody-Secreting Cells during Acute Respiratory Syncytial Virus Infection in Adults. Journal of Infectious Diseases 2010;202 (11):1659-66.
103. DiNapoli JM, Murphy BR, Collins PL, Bukreyev A. Impairment of the CD8+ T cell response in lungs following infection with human respiratory syncytial virus is specific to the anatomical site rather than the virus, antigen, or route of infection. Virology Journal 2008;5:105-.
104. Miyairi I, DeVincenzo JP. Human genetic factors and respiratory syncytial virus disease severity. Clinical Microbiology Reviews 2008;21 (4):686-703.
105. DeVincenzo JP. Harnessing RNA interference to develop neonatal therapies: From Nobel Prize winning discovery to proof of concept clinical trials. Early Human Development 2009;85 (10):S31-S5.
106. DeVincenzo JP. RNA interference strategies as therapy for respiratory viral infections. The Pediatric Infectious Disease Journal 2008;27 (10 Suppl):S118-S22.
107. Barik S, Bitko V. Prospects of RNA interference therapy in respiratory viral diseases: update 2006. Expert Opinion On Biological Therapy 2006;6 (11):1151-60.
108. Alvarez R, Elbashir S, Borland T, Toudjarska I, Hadwiger P, John M, et al. RNA Interference-Mediated Silencing of the Respiratory Syncytial Virus Nucleocapsid Defines a Potent Antiviral Strategy. Antimicrobial Agents and Chemotherapy 2009;53 (9):3952-62.
109. Vig K, Lewis N, Moore EG, Pillai S, Dennis VA, Singh SR. Secondary RNA structure and its role in RNA interference to silence the respiratory syncytial virus fusion protein gene. Molecular Biotechnology 2009;43 (3):200-11.
110. Trehan S, Sharma G, Misra A. siRNA: Sojourn from Discovery to Delivery Challenges and Clinics. Systematic Reviews in Pharmacy 2010;1 (1):1-16.
111. Horn T, Sandmann T, Boutros M. Design and evaluation of genome-wide libraries for RNA interference screens. Genome Biology 2010;11 (6).
112. InnateDB. InnateDB: Systems Biology of the Innate Immune Response; 2012 [cited 2012 March].
113. Marchese A, Sawzdargo M, Nguyen T, Cheng R, Heng HHQ, Nowak T, et al. Discovery of three novel orphan G-protein-coupled receptors. Genomics 1999;56 (1):12-21.
114. Liebscher I, Müller U, Teupser D, Engemaier E, Engel KMV, Ritscher L, et al. Altered Immune Response in Mice Deficient for the G Protein-coupled Receptor GPR34. Journal of Biological Chemistry 2011;286 (3):2101-10.

167
115. Engemaier E, Römpler H, Schöneberg T, Schulz A. Genomic and supragenomic structure of the nucleotide-like G-protein-coupled receptor GPR34. Genomics 2006;87 (2):254-64.
116. Sluijs KFvd, Obregon C, Geiser TK, Mühlemann K, Nicod LP. Monocyte differentiation toward regulatory dendritic cells is not affected by respiratory syncytial virus-induced inflammatory mediators. American Journal Of Respiratory Cell And Molecular Biology 2011;44 (5):655-64.
117. Kallal. The Role of CC chemokine Receptors 6 and 7 in the Immune Response to Respiratory Syncytial Virus. 2010-06-03T15:41:41Z; 2010.
118. Booth V, Keizer DW, Kamphuis MB, Clark-Lewis I, Sykes BD. The CXCR3 Binding Chemokine IP-10/CXCL10: Structure and Receptor Interactions. Biochemistry 2002;41 (33):10418.
119. Ramachandran S, Chahwan R, Nepal RM, Frieder D, Panier S, Roa S, et al. The RNF8/RNF168 ubiquitin ligase cascade facilitates class switch recombination. Proceedings of the National Academy of Sciences of the United States of America 2010;107 (2):809-14.
120. Pinato S, Scandiuzzi C, Arnaudo N, Citterio E, Gaudino G, Penengo L. RNF168, a new RING finger, MIU-containing protein that modifies chromatin by ubiquitination of histones H2A and H2AX. BMC Molecular Biology 2009;10:55-.
121. Chaurushiya MS, Lilley CE, Aslanian A, Meisenhelder J, Scott DC, Landry S, et al. Viral E3 ubiquitin ligase-mediated degradation of a cellular E3: viral mimicry of a cellular phosphorylation mark targets the RNF8 FHA domain. Molecular Cell 2012;46 (1):79-90.
122. Dominguez C, Bonvin A, Winkler GS, van Schaik FMA, Timmers HTM, Boelens R. Structural model of the UbcH5B/CNOT4 complex revealed by combining NMR, mutagenesis, and docking approaches. STRUCTURE 2004;12 (4):633-44.
123. Geng L, Huntoon CJ, Karnitz LM. RAD18-mediated ubiquitination of PCNA activates the Fanconi anemia DNA repair network. The Journal Of Cell Biology 2010;191 (2):249-57.
124. Williams SA, Longerich S, Sung P, Vaziri C, Kupfer GM. The E3 ubiquitin ligase RAD18 regulates ubiquitylation and chromatin loading of FANCD2 and FANCI. Blood 2011;117 (19):5078-87.
125. Yang J, Kim O, Wu J, Qiu Y. Interaction between tyrosine kinase Etk and a RUN domain- and FYVE domain-containing protein RUFY1. A possible role of ETK in regulation of vesicle trafficking. The Journal Of Biological Chemistry 2002;277 (33):30219-26.
126. Chakarova CF, Khanna H, Shah AZ, Patil SB, Sedmak T, Murga-Zamalloa CA, et al. TOPORS, implicated in retinal degeneration, is a cilia-centrosomal protein. Human Molecular Genetics 2011;20 (5):975-87.
127. Coumailleau F, Das V, Alcover A, Raposo G, Vandormael-Pournin S, Le Bras S, et al. Over-expression of rififylin, a new RING finger and FYVE-like domain-containing protein, inhibits recycling from the

168
endocytic recycling compartment. Molecular Biology of the Cell 2004;15 (10):4444-56.
128. Johnson NL, Gardner AM, Diener KM, Lange-Carter CA, Gleavy J, Jarpe MB, et al. Signal transduction pathways regulated by mitogen-activated/extracellular response kinase kinase kinase induce cell death. The Journal Of Biological Chemistry 1996;271 (6):3229-37.
129. Li M, Liu J, Zhang CY. Evolutionary History of the Vertebrate Mitogen Activated Protein Kinases Family. PLOS One 2011;6 (10).
130. Pazdrak K, Olszewska-Pazdrak B, Liu TS, Takizawa R, Brasier AR, Garofalo RP, et al. MAPK activation is involved in posttranscriptional regulation of RSV-induced RANTES gene expression. American Journal of Physiology-Lung Cellular and Molecular Physiology 2002;283 (2):L364-L72.
131. Lu G, Wang Y. Functional Diversity of Mammalian Type 2C Protein Phosphatase Isoforms: New Tales from an old family. Clinical & Experimental Pharmacology & Physiology 2008;35 (2):107-12.
132. Dai JF, Zhang JY, Sun YQ, Wu QH, Sun LY, Ji CN, et al. Characterization of a novel human protein phosphatase 2C family member, PP2C kappa. International Journal of Molecular Medicine 2006;17 (6):1117-23.
133. Shreeram S, Bulavin DV. PPM1H--new kid on the block. Cancer Biology & Therapy 2008;7 (2):293-4.
134. Markovic D, Challiss RAJ. Alternative splicing of G protein-coupled receptors: physiology and pathophysiology. Cellular And Molecular Life Sciences: CMLS 2009;66 (20):3337-52.
135. Cobanoglu MC, Saygin Y, Sezerman U. Classification of GPCRs Using Family Specific Motifs. IEEE-ACM Transactions on Computational Biology and Bioinformatics 2011;8 (6):1495-508.
136. Thomas LH, Friedland JS, Sharland M. Chemokines and their receptors in respiratory disease: a therapeutic target for respiratory syncytial virus infection. Expert Review of Anti-Infective Therapy 2007;5 (3):415-25.
137. Wellendorph P, Bräuner-Osborne H. Molecular basis for amino acid sensing by family C G-protein-coupled receptors. British Journal Of Pharmacology 2009;156 (6):869-84.
138. Urwyler S. Allosteric modulation of family C G-protein-coupled receptors: from molecular insights to therapeutic perspectives. Pharmacological Reviews 2011;63 (1):59-126.
139. Schulz A, Schöneberg T. The structural evolution of a P2Y-like G-protein-coupled receptor. The Journal Of Biological Chemistry 2003;278 (37):35531-41.
140. Lim HD, de Graaf C, Jiang W, Sadek P, McGovern PM, Istyastono EP, et al. Molecular determinants of ligand binding to H4R species variants. Molecular Pharmacology 2010;77 (5):734-43.
141. Dunford PJ, O'Donnell N, Riley JP, Williams KN, Karlsson L, Thurmond RL. The histamine H4 receptor mediates allergic airway
169
inflammation by regulating the activation of CD4+ T cells. Journal Of Immunology (Baltimore, Md.: 1950) 2006;176 (11):7062-70.
142. Roe MFE, Bloxham DM, Cowburn AS, O'Donnell DR. Changes in helper lymphocyte chemokine receptor expression and elevation of IP-10 during acute respiratory syncytial virus infection in infants. Pediatric Allergy and Immunology 2011;22 (2):229-34.
143. Liu G-Y, Kulasingam V, Alexander RT, Touret N, Fong AM, Patel DD, et al. Recycling of the membrane-anchored chemokine, CX3CL1. The Journal Of Biological Chemistry 2005;280 (20):19858-66.
144. Zhang YH, Luxon BA, Casola A, Garofalo RP, Jamaluddin M, Brasier AR. Expression of respiratory syncytial virus-induced chemokine gene networks in lower airway epithelial cells revealed by cDNA microarrays. Journal of Virology 2001;75 (19):9044-58.
145. Becker Y. Respiratory syncytial virus (RSV) evades the human adaptive immune system by skewing the Th1/Th2 cytokine balance toward increased levels of Th2 cytokines and IgE, markers of allergy - a review. Virus Genes 2006;33 (2):235-52.
146. Harcourt J, Alvarez R, Jones LP, Henderson C, Anderson LJ, Tripp RA. Respiratory syncytial virus G protein and G protein CX3C motif adversely affect CX3CR1 (+) T cell responses. Journal of Immunology 2006;176 (3):1600-8.
147. Cepika A-M, Gagro A, Bace A, Tjesic-Drinkovic D, Kelecic J, Baricic-Voskresensky T, et al. Expression of chemokine receptor CX3CR1 in infants with respiratory syncytial virus bronchiolitis. Pediatric Allergy And Immunology: Official Publication Of The European Society Of Pediatric Allergy And Immunology 2008;19 (2):148-56.
148. Amanatidou V, Sourvinos G, Apostolakis S, Tsilimigaki A, Spandidos DA. T280M variation of the CX3C receptor gene is associated with increased risk for severe respiratory syncytial virus bronchiolitis. Pediatric Infectious Disease Journal 2006;25 (5):410-4.
149. Tripp RA. Pathogenesis of respiratory syncytial virus infection. Viral Immunology 2004;17 (2):165-81.
150. Tripp RA, Jones LP, Haynes LM, Zheng H, Murphy PM, Anderson LJ. CX3C chemokine mimicry by respiratory syncytial virus G glycoprotein. Nature Immunology 2001;2 (8):732.
151. Tripp RA, Dakhama A, Jones LP, Barskey A, Gelfand EW, Anderson LJ. The G glycoprotein of respiratory syncytial virus depresses respiratory rates through the CX3C motif and substance P. Journal Of Virology 2003;77 (11):6580-4.
152. Harcourt JL, Karron RA, Tripp RA. Anti-G Protein Antibody Responses to Respiratory Syncytial Virus Infection or Vaccination Are Associated with Inhibition of G Protein CX3C-CX3CR1 Binding and Leukocyte Chemotaxis. The Journal of Infectious Diseases 2004;190 (11):1936-40.

170
153. Viswanathan K, Fruh K, DeFilippis V. Viral hijacking of the host ubiquitin system to evade interferon responses. Current Opinion in Microbiology 2010;13 (4):517-23.
154. Spratt DE, Wu K, Kovacev J, Pan Z-Q, Shaw GS. Selective Recruitment of an E2∼Ubiquitin Complex by an E3 Ubiquitin Ligase. Journal of Biological Chemistry 2012;287 (21):17374-85.
155. Komander D, Rape M. The ubiquitin code. Annual Review Of Biochemistry 2012;81:203-29.
156. Özkan E, Yu H, Deisenhofer J. Mechanistic Insight into the Allosteric Activation of a Ubiquitin-Conjugating Enzyme by RING-Type Ubiquitin Ligases. Proceedings of the National Academy of Sciences of the United States of America 2005;102 (52):18890-5.
157. Gao G, Luo H. The ubiquitin–proteasome pathway in viral infections. Canadian Journal of Physiology & Pharmacology 2006;84 (1):5-14.
158. Uchil PD, Quinlan BD, Wai-Tsing C, Luna JM, Mothes W. TRIM E3 Ligases Interfere with Early and Late Stages of the Retroviral Life Cycle. PLoS Pathogens 2008;4 (2):0001-13.
159. McNab FW, Rajsbaum R, Stoye JP, O’Garra A. Tripartite-motif proteins and innate immune regulation. Current Opinion in Immunology 2011;23 (1):46-56.
160. Nisole S, Stoye JP, Saïb A. TRIM family proteins: retroviral restriction and antiviral defence. Nature Reviews. Microbiology 2005;3 (10):799-808.
161. Ozato K, Shin D-M, Chang T-H, Morse HC, 3rd. TRIM family proteins and their emerging roles in innate immunity. Nature Reviews. Immunology 2008;8 (11):849-60.
162. Munir M. TRIM Proteins: Another Class of Viral Victims. Science Signaling 2010;3 (118).
163. Sardiello M, Cairo S, Fontanella B, Ballabio A, Meroni G. Genomic analysis of the TRIM family reveals two groups of genes with distinct evolutionary properties. BMC Evolutionary Biology 2008;8:225-.
164. Towers GJ. The control of viral infection by tripartite motif proteins and cyclophilin A. Retrovirology 2007;4:40-10.
165. Dorak MT. Real-time PCR [electronic book] / M. Tevfik Dorak (ed.): New York : Taylor & Francis, c2006.; 2006. (BIOS advanced methods).
166. Dewhurst-Maridor G, Simonet V, Bornand JE, Nicod LP, Pache JC. Development of a quantitative TaqMan RT-PCR for respiratory syncytial virus. Journal of Virologic Methods 2004;120 (1):41-9.
167. Ju TT, Bocik W, Majumdar A, Tolman JR. Solution structure and dynamics of human ubiquitin conjugating enzyme Ube2g2. Proteins-Structure Function and Bioinformatics 2010;78 (5):1291-301.
168. Bocik WE, Sircar A, Gray JJ, Tolman JR. Mechanism of Polyubiquitin Chain Recognition by the Human Ubiquitin Conjugating Enzyme Ube2g2. Journal of Biological Chemistry 2011;286 (5):3981-91.
169. Arai R, Yoshikawa S, Murayama K, Imai Y, Takahashi R, Shirouzu M, et al. Structure of human ubiquitin-conjugating enzyme E2 G2
171
(UBE2G2/UBC7). Acta Crystallographica. Section F, Structural Biology And Crystallization Communications 2006;62 (Pt 4):330-4.
170. Norman LL, Bruges J, Sengupta K, Sens P, Aranda-Espinoza H. Cell Blebbing and Membrane Area Homeostasis in Spreading and Retracting Cells (Retracted article. See vol. 99, pg. 2715, 2010). Biophysical Journal 2010;99 (6):1726-33.
171. DeVincenzo J, Lambkin-Williams R, Wilkinson T, Cehelsky J, Nochur S, Walsh E, et al. A randomized, double-blind, placebo-controlled study of an RNAi-based therapy directed against respiratory syncytial virus. Proceedings of the National Academy of Sciences of the United States of America 2010;107 (19):8800-5.
172. Lilley CE, Chaurushiya MS, Boutell C, Landry S, Suh J, Panier S, et al. A viral E3 ligase targets RNF8 and RNF168 to control histone ubiquitination and DNA damage responses. The EMBO Journal 2010;29 (5):943-55.
173. Lilley CE, Chaurushiya MS, Boutell C, Everett RD, Weitzman MD. The Intrinsic Antiviral Defense to Incoming HSV-1 Genomes Includes Specific DNA Repair Proteins and Is Counteracted by the Viral Protein ICP0. PLoS Pathogens 2011;7 (6):1-12.