the implications of nclb for gifted education
TRANSCRIPT

THE IMPLICATIONS OF NCLB FOR GIFTED EDUCATION:
ONE DISTRICT’S STORY
By
Amie Beth Ralston
B.S., Ed., Kansas State University, 1992
M.S., Ed., Mid-America Nazarene University, 2003
Submitted to the Department of Educational Leadership and Policy Studies and the
Faculty of the Graduate School of the University of Kansas in partial fulfillment of the
requirements for the degree of Doctor of Education.
Committee:
_______________________________
Dr. Argun Saatcioglu, Chairperson
_______________________________
Dr. Thomas DeLuca
_______________________________
Dr. Howard Ebmeier
_______________________________
Dr. Marc Mahlios
_______________________________
Dr. Perry Perkins
_______________________________
Date Approved
The Dissertation Committee for Amie Ralston certifies
that this is the approved version of the following dissertation:
THE IMPLICATIONS OF NCLB FOR GIFTED EDUCATION:
ONE DISTRICT’S STORY
______________________________________
Dr. Argun Saatcioglu, Chairperson
Date Approved: _________________________

ii
TABLE OF CONTENTS
TABLE OF CONTENTS i
LIST OF TABLES AND FIGURES vv
ACKNOWLEDGEMENTS v
ABSTRACT viii
CHAPTER ONE: INTRODUCTION ......................................................................................... 9
1.0 Purpose .................................................................................................................................. 9
1.1 Research Questions ............................................................................................................. 10
1.2 Data ..................................................................................................................................... 11
1.3 Findings............................................................................................................................... 11
CHAPTER TWO: REVIEW OF LITERATURE ................................................................... 12
2.1 Possible Effects on Gifted Education ................................................................................. 12
2.1.1 Curriculum Narrowing ................................................................................................. 12
2.1.2 High-Stakes Testing & Accountability ........................................................................ 14
2.1.3 Limited Resources ....................................................................................................... 15
2.2 What is Known About Gifted Education? .......................................................................... 17
2. 3 How Does NCLB Work Toward The Original Goal Of Closing The Achievement Gap? 19
2.4 Unintended Negative Consequences of NCLB for Gifted Students ................................... 21
2.4.1 Curriculum Narrowing and Gifted Students ................................................................ 22
2.4.2. High Stakes Testing & Accountability and Gifted Students ...................................... 26

iii
2.4.3 Limited Resources and Gifted Students ....................................................................... 30
CHAPTER THREE: METHODOLOGY AND DATA........................................................... 32
3.0 Research Questions ............................................................................................................. 32
3.1 Empirical Context ............................................................................................................... 32
3.2 Data Collection Process ...................................................................................................... 33
CHAPTER 4: FINDINGS .......................................................................................................... 38
4.1 Overview of Current State of Gifted Education in the District .......................................... 39
4.2 Curriculum Narrowing in the District ................................................................................. 42
4.3 High Stakes Testing & Acccountability in the District ...................................................... 45
4.4 Limited Resources in the District ....................................................................................... 48
CHAPTER 5: Discussion and Conclusion .................................................................................. 52
5.1 Overview ............................................................................................................................. 52
5.2 Implications for K-12 Education ....................................................................................... 53
5.3 Implications for Policy: Correcting Educational Reform Policy Mistakes ....................... 56
5.5 Limitations .......................................................................................................................... 58
5.6 Future Research .................................................................................................................. 60
References .................................................................................................................................... 61
Appendix 1 ................................................................................................................................... 69
Appendix 2 ……………………………………………………………………………………...62
Appendix 3 ................................................................................................................................... 72

iv
Appendix 4 ................................................................................................................................... 74
v
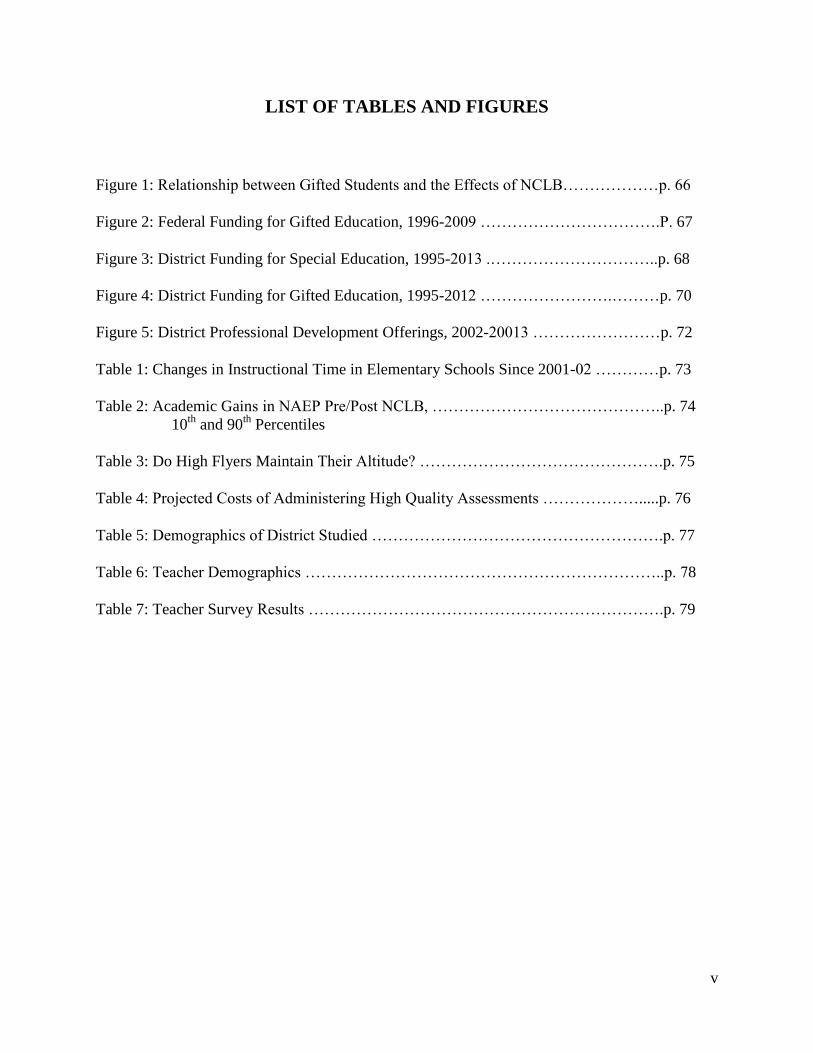
LIST OF TABLES AND FIGURES
Figure 1: Relationship between Gifted Students and the Effects of NCLB………………p. 66
Figure 2: Federal Funding for Gifted Education, 1996-2009 …………………………….P. 67
Figure 3: District Funding for Special Education, 1995-2013 .…………………………..p. 68
Figure 4: District Funding for Gifted Education, 1995-2012 …………………….………p. 70
Figure 5: District Professional Development Offerings, 2002-20013 ……………………p. 72
Table 1: Changes in Instructional Time in Elementary Schools Since 2001-02 …………p. 73
Table 2: Academic Gains in NAEP Pre/Post NCLB, ……………………………………..p. 74
10th
and 90th
Percentiles
Table 3: Do High Flyers Maintain Their Altitude? ……………………………………….p. 75
Table 4: Projected Costs of Administering High Quality Assessments ……………….....p. 76
Table 5: Demographics of District Studied ……………………………………………….p. 77
Table 6: Teacher Demographics …………………………………………………………..p. 78
Table 7: Teacher Survey Results ………………………………………………………….p. 79

vi
ACKNOWLEDGEMENTS
As with any major accomplishment, one never is alone in the journey. I could not have
arrived at this destination without the support and encouragement of the following people. It will
be impossible to adequately repay you for your contributions, and, so to each of you, I simply
say, “Thank you.”
Rebecca and John Fisher- for your continued, unconditional love and support of every
adventure on which your daughter embarked. There are no luckier children and grandchildren in
the world.
Noah and Spencer Ralston- for your patience and encouraging words as your mom spent
many hours studying, writing and preparing for this. I hope I was an example of what it looks
like to set a goal, work hard, and attain it, even when it was difficult to do so.
Jennifer Spencer- my dear friend who was able to push and pull me through this program
at exactly the right times. I could not imagine this as a solo journey, and I am lucky that I didn’t
have to.
Susie Ostmeyer- for your friendship, support, guidance and swift kicks when I needed
them. Your insight and perspective are always something I value.
Cohort Members- for all I learned from being in class and going through most of this
journey with you. I gained insight, ideas and knowledge from each and every one of you. Good
luck in your future endeavors.
Teachers and Administrators – thank you for all the hard work you do for students each
and every day. Each of you have the very best intentions of serving students when you walk
through those doors. Your hard work does not go unnoticed.
Dr. Argun Saatcioglu- for your patience and expertise in guiding me down this road.
Your input, opinion, and insight have proved invaluable to me.
Dr. Ebmeier, Dr. DeLuca, Dr. Mahlios, Dr. Perkins, and Dr. Pierce- for your willingness
to serve as committee members as I proposed my dissertation and/or defended it. Your opinions
and suggestions were much appreciated, as I know your schedules are as busy as ever.
vii
ABSTRACT
This dissertation addresses the question of what implications, if any, has implementing
NCLB as mandated had on gifted students in one district. The purpose of this study is to
determine 1.) How has a district responded to gifted and high-achieving students within the
boundaries of post-NCLB curriculum? 2.) How have teachers responded to gifted and high-
achieving students within the boundaries of the post - NCLB curriculum? Data for this study
comes from one large, Midwestern suburban school district.
Current literature evaluating the success of NCLB legislation has identified unintended
consequences due to implementation: curriculum narrowing, high-stakes testing &
accountability, and reallocation of limited resources. Within the current body of existing
literature is the identification of an excellence gap for gifted and high-achieving students.
Because NCLB mandates yearly assessments in reading and mathematics, there is pressure on
districts to report scores to the public. This pressure inadvertently creates situations in which test
preparation and extra instruction in reading and mathematics are a larger focus than non-tested
subjects; this focus may potentially be narrowing curriculum for gifted students. Additionally,
because assessments are expensive to implement, limited resources must be reallocated in order
to support portions of NCLB requirements.
Using qualitative data from interviews along with quantitative data, this study sheds light on
curriculum narrowing, high-stakes testing & accountability and reallocation of limited resources
and the role of each in gifted education.

viii
Key findings indicate there is no significant effect on gifted students in this district. Though
there is some evidence of curriculum narrowing, high-stakes testing & accountability pressure
and limited resource reallocation, stronger evidence is needed for significant results to surface.

Chapter One
Introduction
1.0 Purpose
The purpose of this study was to investigate the implications, if any, NCLB mandates
have had for gifted education. This paper failed to find three significant effects for gifted
students in one large, Midwestern suburban school district: 1.) curriculum narrowing, 2.)
pressures of high-stakes testing, and 3.) reallocation of limited resources in order to meet NCLB
mandated requirements.
The goal of this paper is to shed light on what current gifted education looks like for
gifted students, when legislative focus, NCLB, was aimed to improve achievement of other
student groups. Much attention has been focused on a gap between performances of minority—
black—students on assessments. This achievement gap is one of the driving forces behind NCLB
legislation. The hope was the gap would close and all students would perform at about the same
level. Recently, there has been a growing acknowledgement of an excellence gap, a gap between
where high achieving students are performing on state assessments in relation to where they
should be performing on state assessments (Xiang, et. al., 2011; Loveless, Farkas & Duffet,
2008).
While it is necessary to implement quality assessments in order to measure student growth as
required by NCLB mandates, it pressures districts to re-allocate resources in order to cover
exorbitant costs of implementation (McCallister & Plourde, 2008). Additionally, pressure from
assessments inadvertently results in curriculum narrowing due to preparation for such
assessments (Peine & Coleman, 2010; Berliner, 2009; Jolly & Kettler, 2008). While one could

10
argue each unintended consequence affects all students, this dissertation seeks to illustrate gifted
students are caught in the middle.
Currently, assumptions of reforming education through the demands of accountability are
being made by politicians and the public, and such accountability is realized in emphases on
assessment scores (McDonnell & Choisser, 1997). This supposition centralizes on beliefs one
assessment score is sufficient to measure academic achievement of children. Supovitz (2009) and
Jacob (2004) shed light on the dangers of this ideology in articles written about high-stakes
testing.
Further magnifying other problems for gifted students, curriculum narrowing as a result of
instructional practices is argued in research by Peine & Coleman (2010) and Jolly & Kettler
(2008). Additionally, Berliner addressed how curricula is being narrowed in a speech delivered
at the 3rd
Redesigning Pedagogy International Conference in Singapore in 2009, while Topol and
Roeber (2010) describe enormous costs associated with implementing high-quality statewide
assessments. The following section briefly discusses the risks facing gifted education under
NCLB which is followed by unintended consequences of NCLB.
There has been growing national concern gifted children are being left behind because of
unintended consequences related to curriculum narrowing, the pressures of high-stakes testing,
and reallocation of limited resources. NCLB may be short-changing gifted education by focusing
too much on struggling students therefore creating aforementioned negative consequences.
1.1 Research Questions
This paper sought to answer these questions:
1. What implications, if any, has implementing NCLB as mandated had for gifted
education?
11
2. How has a district responded to gifted and high-achieving students within the boundaries
of post-NCLB curriculum?
3. How have teachers responded to gifted and high-achieving students within the boundaries
of the post - NCLB curriculum?
1.2 Data
Data for this study came from one large, Midwestern suburban school district situated in the
northeast part of Kansas. District demographics closely mirror state demographics. This district
differs slightly from state percentages in the following ways: a higher graduation percentage rate,
a lower percentage of free and reduced students, and nearly double the state percentage of
students in the “other classification” category of race. Overall, achievement and academic scores
of the district are above state averages at all grade levels in state administered mathematics,
reading, science, history and writing assessments.
This study relied mostly on data from interviews with teachers and district administrators, a
teacher survey, and archival data of staff development catalogs and budgets.
1.3 Findings
Findings from data indicate there are no significant implications for gifted students in a post-
NCLB curriculum in this district. Though there is evidence of curriculum narrowing, high-stakes
testing & accountability pressure, and limited resource reallocation, no significant effects can be
determined from the data.

12
Chapter Two
Review of Literature
2.1 Possible Effects on Gifted Education
The purpose of this study was to examine what has happened to gifted education in an
educational world dominated by NCLB legislation. What were the implications, if any, of NCLB
mandates for gifted education in one large, Midwestern suburban school district. Specifically,
this study sought to answer questions about how a district and its teachers responded to gifted
and high-achieving students within the boundaries of a post-NCLB curriculum.
This study was framed by tensions between excellence and equity. Strike (1985) posed
the question, “Can we have excellence and equity simultaneously?” Of the possible unintended
consequences related to NCLB implementation, three were especially concerning: curriculum
narrowing, high-stakes tests, and re-allocation of limited resources in order to support unfunded
mandates.
-------------------------------------------
Insert Figure 1 here
---------------------------------------------
2.1.1 Curriculum Narrowing
Narrow curriculum is often used in describing the act of placing more focus on tested
material found on high-stakes assessments. As pressure for schools and districts to show
Adequate Yearly Progress (AYP) mounts, curriculum narrowing has been closely associated
with NCLB. However, this author acknowledges curriculum narrowing may possibly be a result

13
of more concentrated focus in choosing priorities in education; curriculum narrowing may even
be the result of a decline in academic rigor. In this paper, curriculum narrowing will be defined
to mean “the core academic subjects of reading, mathematics, and science are given priority at
the expense of the time and resources dedicated to the instruction of other subjects in the
curriculum including social studies, physical education, foreign languages and the arts” (King &
Zucker, 2005).
Regardless of the reason, a curriculum narrowing is harmful to all students, but gifted
students are going to be affected the most. (Peine & Coleman, 2010; Jolly & Kettler, 2008;
Benbow & Stanley, 1996). Gifted students need depth and challenge (Scot, Callahan & Urquhart,
2009; McCallister & Plourde, 2008), and yet curriculum narrowing does not allow for consistent
depth and exploration of learning. Teachers are placed in positions of trying to meet needs of
many different students, especially those with many learning difficulties; it is often difficult to
create learning experiences gifted students need (Scot, Callahan & Urquhart, 2009). Meaning
well, some teachers buy into the oft believed myth gifted students are able to learn on their own
by allowing gifted students to explore learning on their own (Beisser, 2008). Although offering
independent explorations are good ways to challenge a gifted student, they cannot be the only
way (Scot, Callahan & Urquhart, 2009).
Tackling difficult material requires scaffolding for success and mastery (McCallister &
Plourde, 2008). When presented with challenging material, students make choices to work hard
and experience success as a result of hard work. Assumptions are made concerning gifted
students—gifted students will be successful because of inherent intelligence (Berman, Schultz &
Weber, 2012). However, if gifted students have fewer opportunities to learn in incremental steps,
a greater possibility of increased frustration exists when challenges do present in learning

14
(McCallister & Plourde, 2008). Children at and below grade level often have the benefit of a
teacher’s help when trying to tackle newer, difficult material. Teachers are much more apt to
scaffold instruction for low to middle performing students rather than gifted students (McAllister
& Plourde, 2008). Gifted students might be unable to access difficult material because they lack
necessary adaptation skills, thus narrowing what curriculum can be accessed. Over time,
frustration can lead to increased self-esteem issues and an increase of at-risk behaviors for these
high level learners (McAllister & Plourde, 2008).
2.1.2 High-Stakes Testing & Accountability
In “High Stakes Testing and Curricular Control: A Qualitative Metasynthesis” (Au,
2007), Wayne Au conducted a study analyzing 49 qualitative studies to determine how high-
stakes testing affected curriculum. For his purposes, Au defined curriculum to include “content,
pedagogy and knowledge form” (Au, 2007). His principal finding determined “curricular content
is narrowed to tested subjects, subject area knowledge is fragmented into test-related pieces…”
(Au, 2007). With a similar message, Siegel (2004), found high stakes testing and the pressures
associated with testing can lead to a skewed view of what is important for students to learn.
Broadly, curricula addresses various objectives and standards per subject, yet current
assessments used for measuring Adequate Yearly Progress (AYP) are quite narrow in scope.
(Madaus & Russell, 2011; King & Zucker, 2005; Popham, 1999). For some teachers, it becomes
a “best guess” teaching situation based on what items have been released to educators. For
others, what is going to be assessed and how it will be assessed is known (Harrington-Lueker,
2000). In trying to prepare students to perform their best on these state tests, well-intentioned
teachers can use poor judgment. Instead of using released test items as a guide, it becomes
curricula in the classroom (Berliner, 2009; Siegel, 2004; Sloane & Kelly, 2003). Thus, this focus

15
of testing curricula limits time in class for creativity and problem solving, two experiences gifted
students need (Scot, Callahan & Urquhart, 2009; McCallister & Plourde, 2008; Sahlberg, 2008).
Pressure from high-stakes testing can push an educator to blur lines of testing ethics as well. The
well-known case of the school district in Atlanta caught cheating on state assessments only
served to magnify the situation (Koebler, 2011). Any changes made as a result of high-stakes
testing pressure might not be a sustained, positive change. Instead, it might be a change in
defense and response to pressure.
2.1.3 Limited Resources
Though budget cuts are not a direct result of implementing NCLB, this author argues
there is an indirect relationship. Since NCLB is an unfunded mandate, resources such as time and
money must be re-allocated in order to support the requirements of NCLB (McCallister &
Plourde, 2008). Reallocation might include cutting funds for gifted programs because those
programs are not directly tied to the tenets of NCLB.
As Ferguson (1991) wrote in “New Evidence on How and Why Money Matters,”
educational programs and spending in areas which, at first glance (i.e. transportation or
maintenance), did not directly support higher achievement. He found those areas were indeed
important when combined with expenditures with a direct relationship to achievement such as
teachers and curriculum materials (Ferguson, 1991). When budgets are erratic, reductions are
needed and determining which programs to cut becomes a prioritizing nightmare. Programs
serving fewer students or programs seen as less needed were usually first in line for cuts
(Ferguson, 1991; Schacter, 2011). More often than not, gifted programs seem to fall into a “first
cuts” category because gifted students are not typically viewed as students in need (Benbow &
Stanley, 1996). A paradigm shift is required to include those at the higher ends of the learning

16
spectrum as well. Gifted students need just as much help with learning, though help looks much
different for them than help needed for struggling learners (McCallister & Plourde, 2008).
Gifted programs have been taking hits due to changes in state budgets (Johnson, Oliff &
Williams, 2011). Some people object to funding programs for gifted students because: 1.)
investing in those programs might not result in a good return on the investment and 2.) it is hard
to justify spending extra money on a group of learners not appearing to suffer from any social
disadvantages (Merry, 2008) as NCLB focuses on using monies in programs populated with at-
risk students. At last estimates there were a little over 3 million identified gifted children in
American schools (DES, 2008) and close to 7 million served under IDEA. Truly, though both
groups of students may fall under special education budgets in some states, spending is not
equal.
According to the National Association for Gifted Children website, fifteen states do not
offer any funds for gifted education; states funding gifted education vary widely in amount
funded per pupil (nagc.org, 2013). Michigan is the lowest funded state with average spending per
gifted student of $5.40 (Plucker, Burroughs, & Song, 2010). On the other end of the scale, North
Carolina funds gifted education at $3530.00 per student. Additionally, Texas districts spent about
one-third of total budgets on students served under IDEA, but only about 1% of the budget was
dedicated to needs of gifted students (Stanley & Baines, 2002). This example illustrates how
funding programs required by the government such as IDEA and NCLB are expensive for
districts to fund and often in conflict with each other.
Regardless of funding difficulties, it is imperative to continue serving gifted students
well. In the article, Me Behind the Mask, Elizabeth, an 18 year old senior in college, describes
what her life might have been like had she remained in the general education classroom with
17
limited interaction with gifted peers. “I can’t imagine that I would still be me if I had to sit
through that many years of school and still have so many left to go… I think I could have kept
my mind intact, but only with a very small, narrow channel through which my thoughts could be
communicated to the outside world. I was building a veritable fortress around myself and I think
it would have continued growing and growing, setting me further and further apart from the rest
of the world, making the world more and more of a stage for me to watch and try and make my
life alone in the castle…” (Gross, 1998).
2.2 What Is Known About Gifted Education?
Literature about gifted education and characteristics of gifted children started emerging in
the 1920s. Terman and Hollingsworth began focusing the research lens on children with above-
average intelligence. Building upon Galton’s and Binet’s research on heredity and intelligence,
the duo promoted the potential influence of science in education as a way to ensure rigor (Jolly
& Kettler, 2008). Political involvement in curriculum policy reflects current events and concerns
of a nation. It took the launching of Sputnik, however, to generate interest in gifted education.
Because Russia’s launch of Sputnik created a perception of threat, support for developing
programs cultivating academic achievement intensified. Thus began an ebb and flow related to
funding and support for gifted education (Jolly & Kettler, 2008).
After the initial resurgence of interest in educating gifted children in the late 1950s,
interested waned again until the Marland Report was presented to Congress in the early 1970s.
Though originally about 40 years old, his definition of what it means to be a gifted student has
remained mostly intact. Former U.S. Commissioner of Education, Sidney Marland’s 1972 report
to Congress defined gifted children as, “Students, children, or youth who give evidence of high
achievement capability in areas such as intellectual, creative, artistic, or leadership capacity, or in

18
specific academic fields, and who need services and activities not ordinarily provided by the
school in order to fully develop those capabilities” (Marland, 1972).
Kansas’ definition of a gifted student is one who is “performing or demonstrating the
potential for performing at significantly higher levels of accomplishment in one or more
academic fields due to intellectual ability, when compared to others of similar age, experience or
environment” (KSDE, 20??) For the purposes of this paper, the Kansas definition of gifted will
be employed.
In the 1980s A Nation At Risk called attention to American students scoring lower on
assessments than international counterparts, so once again, consideration in how the nation was
educating the brightest children began to materialize. It broadened the debate on the federal role
in education policy. Using ominous and sometimes provocative language, the National
Commission on Excellence in Education (1983) stated U.S. public schools were failing. With
the US becoming a more pluralistic society, pressures of providing a diverse, enriching, and
culturally responsible education weighed heavily. Consequently, the “Age of Standards” was
ushered in to help (Supovitz, 2009)
Gifted and academic high achievers possess many unique qualities—positive and
negative—which can affect learning. Most commonly associated with giftedness is intellectual
ability and academic aptitude well above average IQ ranges, allowing difficult and abstract
concepts to be grasped with less difficulty (ERIC, 1990). Since characteristically, higher level
learners can acquire and retain knowledge rather easily, it can be challenging for gifted students
working with non-gifted peers. French, Walker, & Shore (2011) conducted a study to determine
if gifted students prefer to work alone. There are indeed times in which gifted students prefer to
work alone. Students typically choose to work alone when feeling unsupported in the classroom

19
or working with learners who might slow the learning pace. When inquiry-based learning
activities occurred, gifted students chose working with a group, especially if a task was perceived
as relevant to their individual learning (French, Walker & Shore, 2011). Moreover, gifted
students are apt to question teachers in search of satisfying intellectual curiosity (Gottfried,
Cook, Gottfried, & Morris, 2005). Gifted students usually have high expectations of themselves
and others and lean toward impatience with the slowness of others (Gottfried, Cook, Gottfried, &
Morris, 2005); these high expectations can cause anxiety and stress in a gifted student, who is
most likely hypercritical of their own skills.
In an ideal world, all students, regardless of learning level, would receive assignments
and tasks in the zone of proximal development (Benbow & Stanley, 1996). The zone of
proximal development is defined by Lev Vygotsky as the level of challenge just beyond the
intellectual reach of students but not too difficult. Pacing is also important for optimal learning;
a pace too slow causes boredom, while too fast of a pace can hinder learning and lead to
frustration (Benbow & Stanley, 1996). It is arguably harder to provide differentiated
environments for students who perform at higher levels. Benbow & Stanley (1996) reported
nearly 84% of gifted students’ instructional activities are identical to those students performing
at lower levels.
2. 3 How Does NCLB Work Toward The Original Goal Of Closing The
Achievement Gap?
The presence of the achievement gap is not a new phenomenon in education. The quest to
close the gap is presently the driving force behind current waves of educational reform. Equality
in education has been a long sought after goal since before the landmark case of Brown v.
Topeka Board of Education in 1954. Educational reform has been implemented in various forms

20
throughout the years with the goal of achieving equity. The early 1980s began with A Nation at
Risk (1983) pointing out the level of mediocrity in American education, prompting calls for
change and a push for excellence.
Recommendations made as a result of A Nation At Risk included more stringent
graduation requirements, more time in school, more competitive salaries, and more funding help
from the federal government. However, it brought to light issues in education needing to be
addressed. In the latter half of the 1980s, terms like teacher empowerment, site-based
management and decentralization were floating around on the reform battlefield. John Gardner
wrote Excellence: Can We Be Equal and Excellent Too? (1984) and described two aspirations
driving American society: “individual achievement (or excellence) and equality.” Thus most past
educational reform has focused on correcting either a social inequity or an economical inequity
and was implemented to help further American society. NCLB is the first type of educational
reform trying to correct both social and economic inequities by attempting to raise achievement
levels of low performing students in areas of poverty.
The No Child Left Behind Act (NCLB) signed into law by President George Bush in
2001 was actually a reauthorization of a previous law. The Elementary and Secondary Education
Act (ESEA) of 1965 was passed during President Lyndon B. Johnson’s term amid a national war
on poverty. ESEA perpetuated thoughts of education as a way out of poverty, a pathway to better
economic situations for poor people. In The Great Society scenario, receiving a quality
education meant less chance of remaining in a poverty-riddled situation. ESEA was originally
authorized to last until 1970; in actuality, it has been reauthorized every five years by the federal
government. Funds have been allocated to districts based on numbers of students living in
poverty, and the goal was to improve the quality of education for students in underprivileged

21
schools (Heller, 1968). As a whole, there were six provisions, or titles, outlining guidelines for
improving instruction while accessing monies. Though the ESEA was the predecessor, it is not
nearly as well known as the current version.
NCLB legislation can be divided into four separate and distinct sections, or pillars (Bush,
2001). The first requirement under NCLB mandates is for districts to publicly report test results
for accountability. The act authorizes each state to determine definitions for meeting standards
and proficiency.
Sections two and three of the NCLB act are closely entwined. These pillars affirm the
ability of school districts to spend federal funds where they need it most, allowing for flexibility
never before seen in education. Tied in to receiving those funds, school districts are allowed to
spend federal monies to facilitate implementation of research-based teaching practices and
curriculum in the classroom (Bush, 2001).
Finally, NCLB provides options and choices for clients of failing schools, providing
students with opportunities to attend better performing schools; transportation to schools of
choice must be funded by the district, however (Bush, 2001). The original intent for this pillar
permitted parents to make choices based on academics and assessment scores. Presenting
parents with school choice information in an easy-to-understand format allows parents to
understand the realities and options of school choice opportunities (Petrilli, 2007), and is
mandated by NCLB.
2.4 Unintended Negative Consequences of NCLB for Gifted Students
Though NCLB and school achievement are consistently in the spotlight, there is an
absence of a rich literature regarding the implications of implementing NCLB for gifted
education. Research regarding the effects of curriculum narrowing on gifted education, how re-
22
allocation of limited resources has shifted from gifted education programs to programs focused
on lower achieving students, or identification of the potential effects of high-stakes testing on
gifted students are necessary for full evaluation of NCLB’s success.
2.4.1 Curriculum Narrowing and Gifted Students
One shortcoming of curriculum narrowing for gifted kids is just how much effort is
directed at preparing for state tests. Since the stakes are so high for each assessment, gifted
students may therefore receive less exposure to challenging curriculum than they may normally
receive as a result of the opportunity cost with high-stakes testing (Payne-Tsoupros, 2010; Scot,
Callahan, & Urquhart, 2009). This opportunity cost for gifted students may be seen in
assessment results. Even if gifted students do well on tests, they may not do as well as they could
have were it not for the NCLB (Xiang, Dahlin, Cronin, Theaker & Durant, 2011; Loveless,
Farkas & Duffet, 2008).
One result of A Nation at Risk publication in 1983 was the drive toward standards-based
education. These standards served as a prioritized list of what was deemed important knowledge
for students. Some argued implementing standards-based reforms were necessary in order to
hold schools and educators accountable, because schools and educators were not holding each
other accountable enough through professional accountability (Cox & Witko, 2011). It can be
argued standardized testing is an attempt to exert top-down control over classrooms. With the
passage of NCLB in 2001, standards-based reform became a federal policy (King & Zucker,
2008). In order to accurately measure a student’s mastery of specific standards, it is a logical
conclusion assessments be aligned to state standards. However, where state curricula are
generally very broad in scope, assessments are narrow (Madaus & Russell, 2011; King &
Zucker, 2005; Popham, 1999). In a 1999 Educational Leadership article, “Using Standards and

23
Assessments: Why Standardized Tests Don’t Measure Educational Quality” by W. James
Popham, an analogy of measuring temperature with a tablespoon is described to point out how
using the wrong tool to measure achievement does not portray an accurate picture of growth. “…
There’s an enormous amount of knowledge and/or skills that children at any grade level are
likely to know. The substantial size of the content domain that a standardized achievement test is
supposed to represent poses genuine difficulties for the developers of such tests. If a test actually
covered all the knowledge and skills in the domain, it would be far too long…frequently such
tests try to do their assessment job with only 40 to 50 items in a subject field—sometimes
fewer.” The fundamental nature of standardized testing forces a focus on specific indicators not
necessarily spanning whole curricular areas (Madaus & Russell, 2011; Cox & Witco, 2011;
Popham, 1999).
Formidable pressure from high-stakes testing is a driving force for schools (Goertz &
Duffy, 2003). When undesired accountability results earn harsh penalties, schools respond (Cox
& Witco, 2011). Well-intentioned attempts to capitalize on every learning opportunity have
compelled schools and teachers to make hard decisions about what to teach. In a presentation at
the 3rd
Redesigning Pedagogy International Conference in Singapore, Berliner (2009)
summarized data from the National Clearinghouse of Educational Statistics. According to the
NCES, the average amount of time spent on teaching reading and mathematics has increased
nearly 50% since the 2001-2002 school year. Nonetheless, increased time for teaching
mathematics and reading comes at a price—less instruction time for other subjects (Madaus &
Russell, 2011).
On average, instructional time for social studies, science, music, art, and physical
education has decreased about 30%. In the report from the Center on Educational Policy (CEP)

24
titled, “Instructional Time in Elementary Schools A Closer Look at Changes for Specific
Subjects” (2008), Jennifer McMurrer found 58% of districts surveyed increased instructional
time in English language arts (ELA) by an average of 141 minutes per week. Regarding
mathematics instruction, 45% of districts surveyed increased instructional time an average of 89
minutes per week. In order to support these increases in ELA and mathematics, instructional time
in other subjects decreased. The following table details the decreases.
---------------------------------------------------
Insert Table 1 here
-----------------------------------------------------
One could argue increased time in the tested subject areas is paying off in higher
assessment scores. Previous research indicates when students spend more instruction and
practice time in a specific subject, assessment results are higher (Cox & Witko, 2011). Because
each state is allowed to create and implement a state assessment, trying to compare states is
nearly impossible. The National Assessment of Educational Progress (NAEP) is a nationwide
achievement test administered to students in grades 4, 8 and 12. First administered in 1969, it
represents a sample of students from all 50 states (Plucker, Burroughs, and Song, 2010). Current
NAEP data suggest scores for students in the 90th
percentile or above have remained steady,
without much growth since enacting NCLB requirements. Additionally, the Educational Testing
Service also has data regarding the decreases in reading scores (Berliner, 2009). Data indicates
there are less “proficient” students since implementing NCLB legislation.

25
In 2008, Loveless, Farkas and Duffet published findings related to stagnant growth of
high-achieving students titled “High-Achieving Students in the Era of NCLB.” Findings
indicated a distinct difference in annual point gains between students in the 10th
percentile and
students in the 90th
percentile since the enactment of NCLB. Trends before NCLB indicated
growth for students in both percentiles. One exception was in reading for 4th
graders in the 10th
percentile. That group of students experienced a rather steep drop of 9 points.
Results of post-NCLB scores showed gains for students in the 10th
percentile in every
area except 8th
grade reading. Scores for students in the 90th
percentile remained relatively
steady, with one exception at the 8th
grade level in mathematics. While those authors point to
NCLB as a major contributing factor in this distinct difference, this author acknowledges the
decline may be purely coincidental with NCLB legislation enactment.
-----------------------------------------------------
Insert Table 2 here
------------------------------------------------------
In another study entitled, “Do High Fliers Maintain Their Altitude?” (Xiang et al., 2011)
the authors examined academic progress for groups of students and built upon initial findings in
“High Achieving Students in the Era of NCLB” (Loveless, Duffet, Farkas, 2008). Cohorts of
students were chosen for the Elementary/Middle School Cohort (grades 3-8) and the
Middle/High School Cohort (grades 6-10). The study focused on how many students initially
considered to be high achievers in mathematics or reading maintained high-achiever status. For
this study, students classified as high-achievers if they were in the top 10 percent of their grade

26
and their school in mathematics or reading. This allowed observation of possible school-level
factors on student academic achievement (Xiang et. al., 2011).
According to the findings, high-achieving students grew at comparable rates in
mathematics to students in low and middle achieving categories. Yet, reading growth rates tell a
different story. While the academic progress made by high achievers increased, it was at a slower
rate of progress when compared to low achievers’ rate of progress (Xiang et al., 2011).
Additionally, when examining the outcomes of students who started in the high-achieving
category, the authors found the following results (Xiang et al., 2011):
42.7% of initial high flyers in the Elementary/Middle School Math cohort were no
longer high flyers at the end of 8th
grade.
44.1% of initial high flyers in the Elementary/Middle School Reading cohort were
no longer high flyers at the end of 8th
grade.
30.1% of initial high flyers in the Middle/High School Math cohort were no
longer high flyers at the end of 10th
grade.
47. % of initial high flyers in the Middle/High School Reading cohort were no
longer high flyers at the end of 10th
grade.
Though hesitant to fully blame NCLB legislation and implementation for these decreases
in high achievers, the authors acknowledge NCLB may indeed play a contributing role.
-----------------------------------------
Insert Table 3 here
------------------------------------------
2.4.2. High Stakes Testing & Accountability and Gifted Students
27
A downside of NCLB’s drive toward high stakes testing is seen in extensive test preparation
for academically lower students (Xiang, Dahlin, Cronin, Theaker & Durant, 2011). Therefore,
gifted students may receive less attention than they may normally get in the classroom. If this
happens and even if gifted students do well on state assessments, they may not do as well as they
could have were it not for NCLB. In Do High Flyers Maintain Their Altitude? Performance
Trends of Top Students (Xiang, et. al., 2011), one finding suggested even if students were
initially “high-flyers” at the onset of the study, a considerable number of students were unable to
maintain original achievement status over the period of five academic school years. A more in-
depth analysis of this study can be found at the end of this section. The authors reason it is
because of the intensity of focus on lower performing students in this accountability era (Xiang,
et. al., 2011).
The push for holding schools accountable for student achievement has been gathering
momentum year after year since A Nation at Risk was published in 1983. In the article, “Can
High Stakes Testing Leverage Educational Improvement? Prospects and Implications from the
Last Decade of Testing and Accountability Reform,” Supovitz (2009) addressed major trends in
the testing and accountability movement: the drive toward more authentic forms of assessment,
the “ratcheting up” of testing frequency, consequences attached to testing, and using testing as a
vehicle for systemic educational reform.
Both policy makers and the public made various assumptions regarding test-based
accountability (McDonnell & Choisser, 1997). One such belief was high-stakes testing will
improve education. Another widely held line of thinking involved attaching incentives and
penalties to specific state assessment scores; these incentives and penalties were thought to be
the “missing link” needed for those scores to improve and motivation for teachers to teach

28
differently, thus creating change (McDonnell & Choisser, 1997). The basis for such assumptions
was a belief teachers lack desire to change, when in fact, most likely, teachers lacked capacity, or
ability, to make necessary changes to ultimately affect instruction. Supovitz argued (2009) the
danger of those deductions: the assessment and accountability system itself was not substantial
enough to sustain improvement for long term change. If the purpose of high-stakes assessments
was to transform pedagogy, then the purpose and result were mismatched (Supovitz, 2009). In
the research article, “No Child Left Behind: Disincentives to Focus Instruction on Students
Above the Passing Threshold” (Payne-Tsoupros, 2010) there was a warning against such strong
focus on standardized testing, “When the test carries such high-stakes, there is a risk of the test
becoming the end in itself, instead of a measure or indicator. Passing the test becomes the
definition of quality teaching and learning.” It may be possible chosen proficiency levels have
created a “ceiling effect” on the capabilities of student growth and not allowing all students to
reach their fullest potential (Payne-Tsoupros, 2010; Scot, Callahan, & Urquhart, 2009).
State assessments do not provide the necessary framework for guiding teachers in
changing teaching behaviors; only when strong structures for support accompany assessments,
will results produce an altering of instruction (McDonnell & Choisser, 1997). Changing the
teaching behavior of educators requires building pedagogical knowledge of teachers, and is
transformational change that would take years to realize.
Previous literature regarding high-stakes testing suggests mixed results when trying to
determine positive correlations between high-stakes testing and achievement results. Upon closer
examination, for every study showing positive correlations, there is a study to echo opposite
findings, especially when the controls are tight (Jacob, 2004).
29
Building upon the works of Holmstrom and Milgrom, centered on compensation
programs simultaneously allocating rewards and consequences, Jacob (2004), suggested
economic theory cannot be applied to high stakes testing. He contended high-powered incentives
may actually result in unwanted goal distortion. Additionally, his study of high-stakes testing in
Chicago schools revealed the emergence of three strategic responses as a result of high-pressure
emphasis on testing: increased identification and classification into special education, higher
retention rates, and less instructional time for non-tested subjects such as science and social
studies (Jacob, 2004). In many instances, teachers are faced with maneuvering a tenuous line
between best practices and test preparation, feeling forced to funnel time away from one subject
in order to gain more time for tested subjects. This “funneling” is an example of a strategic
response to a scarce and limited resource—time. Essentially, “funneling” creates opportunity
cost—tested subjects receive more instructional time at the expense of non-tested subjects,
critical problem-solving skills and creativity (Madaus & Russell, 2011; Sahlberg, 2008;
Holmstrom & Milgrom, 1991). Furthermore, in “High Stakes Testing, Educational Aims and
Ideals, and Responsible Assessment,” Siegel (2004) claimed when the aims of education are
purely driven by economic reasons, critical skills such as higher-level thinking, reasoning and
creativity are lost.
Herzberg’s conceptual framework of Two-Factor Theory addressing intrinsic and
extrinsic motivation suggests attaching higher stakes to assessments will indeed motivate
improvement in education. The higher stakes parallel the idea of “action levers” being used to
change a worker’s motivation (Supovitz, 2009). And, though some studies indicate a positive
correlation between higher stakes and improvement, studies also indicate instances in which
higher stakes can actually undermine motivation for improvement (Supovitz, 2009). In fact,

30
when harsh penalties or incentives are attached to the results of high-stakes testing, a potential
for an increase in unethical behavior exists (Nichols & Berliner, 2008). Additionally, Skinner’s
instrumental conditioning in the context of Behaviorism explains why some schools are “gaming
the system,” and how people instinctively respond to punishment and rewards; a person will
modify his or her own behavior based on perceived positive or negative results (Nichols &
Berliner, 2008). The current high-stakes accountability system in education amplifies this
awareness in classrooms across the country. Schools attempt to avoid punishment by: increasing
time of instruction in tested subject areas, “pre-prepping” students in younger grades for future
assessments at the expense of important social developmental skills (Madaus & Russell, 2011),
and excluding certain students from the testing pool (Madaus & Russell, 2011; Jacob, 2004;
Taylor, 2001).
2.4.3 Limited Resources and Gifted Students
Because states bear a majority of the burden related to the costs of administering large
scale assessments, there may be less available resources for sustaining programs in school
districts. Combining decreases in federal funds with increases in costs of yearly testing students,
states find themselves scrambling to cut non-essential programs out of budgets (Ferguson, 1991).
Given the economic crisis in recent years, school districts all over the country have been
forced to pare budgets down to the barest of bones. If NCLB focuses on struggling students, it
stands to reason gifted education programs are more likely to be affected than programs created
for struggling students. Though the federal government’s role in contributing to district monies is
smaller than local contributions, it is still an important piece to providing programs and services
for students.

31
--------------------------------------
Insert figure 2 here
--------------------------------------
No programs are safe from cuts, even education which comprises nearly 60% of a state’s
budget. In his article, New Evidence on How and Why Money Matters (1991), Robert Ferguson
stressed how important money is to student achievement: competitive salaries will attract good
teachers, smaller class sizes contribute to higher student achievement, and districts need to have
flexibility in utilizing resources to meet the needs of their district; it does not help student
achievement if money spent does not match the districts’ needs. In light of these findings, it is
necessary to ask if current processes of testing students yields return on the investment,
Assessing students is an expensive endeavor (Topol & Roeber, 2010); the NCLB
requirement of yearly testing in grades 3-8 for mathematics and reading places hardships on
school districts across the country. Implementing the earliest versions of state assessments cost
states a few million dollars. Recently, in the push for higher-quality assessments, cost is rapidly
increasing. Current costs for implementing newer, higher quality assessments can cost up to
$100 million per year in a larger state (Topol & Roeber, 2010). Because of this increase, states’
roles in providing funding have also increased, yet many states are not in financial positions to
provide adequate funding.
-------------------------------------------------
Insert Table 3 here
---------------------------------------------------
32
Chapter Three
Methodology and Data
3.0 Research Questions
This dissertation sought to answer questions about what effects, if any, has NCLB had on
gifted education in one large, Midwestern suburban school district. Specifically, it sought to
answer questions about how a district and teachers responded to gifted and high-achievers within
the boundaries of a post-NCLB curriculum.
3.1 Empirical Context
Data for this study came from a large, Midwestern suburban district situated within 72
square miles in northeast Kansas. There are 35 K-6 elementary schools, 5 middle schools for
grades 7-8, and 5 high schools for grades 9-12. The average enrollment for the district in the
2011-2012 school year was 27, 876, approximately 5% of the state’s enrollment. The average
attendance rate is 96% which is nearly identical to the state’s average attendance rate. Table 4
displays basic demographics for this district and comparable state demographics.
------------------------------------------------------
Insert Table 4 here
-------------------------------------------------------

33
This district has responded to NCLB mandates by allocating resources to students who
came to school below proficiency levels in reading and/or mathematics. Following Kansas’
model of Multi-Tier Systems of Support, MTSS, struggling students are given extra time through
research-based instructional interventions structured to close gaps in achievement levels, extra
help with classroom instruction, additional materials and learning opportunities in order to help
make academic progress.
3.2 Data Collection Process
Section 1: Curriculum Narrowing, High Stakes Testing, and Reallocation
Of Limited Resources
This dissertation collected information about potential curriculum narrowing, high stakes
testing and re-allocating resources through interviews with general education teachers and gifted
education teachers. It relied on interviews to explore the current state of gifted education and
changes related to curriculum narrowing over time, and to explore impact high-stakes testing has
had on changes in classroom practices related to curriculum narrowing. This information is
relevant because it provides a potential connection between the pressures of high-stakes testing
and subsequent curriculum narrowing as perceived by teachers.
Interviews were conducted with twenty teachers; from this pool of twenty, half are
certified in general education while half hold a certification in gifted education and are teaching
as gifted educators. Each group of teachers was further divided into elementary or secondary.
Furthermore, five of the general education teachers were “new” teachers as defined by a hiring

34
date after enactment of NCLB, while the remaining five general education teachers were
“veteran” teachers as defined by a hiring date before enactment of NCLB.
It was important to interview new and veteran teachers because NCLB, while
unintentional, has potentially impacted curriculum and instruction in schools through a
curriculum narrowing, high-stakes testing, and limited resource reallocation. Because new
teachers only have teaching experience since the enactment of NCLB, it is possible viewpoints
and insights have a different frame of reference than the insights of veteran teachers. Where
possible, veteran teachers interviewed have taught for at least 15 years, allowing for comparison
of resources, curriculum and testing before NCLB as well as after enacting NCLB. (See
Appendix 2 for interview protocols.)
--------------------------------------------
Insert Table 5 here
----------------------------------------------
Using data yielded from teacher interviews, emerging themes were used to create a
survey. The purpose of the survey was to ask general education teachers and gifted education
teachers to rate how aspects of limited resource reallocation, curriculum narrowing, and high-
stakes testing affected gifted students in their classrooms. (See Appendix 3 for a copy of the
survey.) Interview data did produce the foundation for which the surveys were created, and
survey results provided quantifiable data to support the qualitative data for this dissertation.
Section 2: Reallocation of Limited Resources

35
This dissertation collected information about the reallocation of limited resources through
conversations with the Director of Special Education, an interview with the Director of Staff
Development, as well as examination of archival data related to district special education
budgets, and staff development catalogs. Additionally, the Director of Business and Finance
provided separate funding information related to gifted education, as gifted education does not
have a separate line item in this district’s budget.
This information is relevant because it contributes to teacher interview data related to
choices a district must make in reallocating resources through various ways including finances
and staff training in order to uphold NCLB mandates.
3.3 Measures
The data collection measure involved several phases. Phase one included interviews
conducted over a period of several months. The teacher interviews were divided into three
sections: gathering background data about the teacher and experience, describing a “typical”
struggling, low-performing student as well as a “typical” gifted student, and how their personal
teaching has evolved as the pressure of the 2014 NCLB deadline dawns near. The questions most
important to this were ones in which teachers described typical students. From this description,
teachers were prompted with questions about how each student’s needs could be addressed in an
ideal world with no limits.
The questions elicited responses from teachers echoing the findings in the literature
regarding curriculum narrowing and increased pressure from high-stakes testing along with the
reallocation of limited resources. The teachers' responses supported the aforementioned

36
disconnect between research and practice addressed in the literature review regarding gifted
education.
Interview questions for the directors provided a general background picture of where the
district’s focus has been in the past as well as the current focus. These interviews yielded
information supporting teachers’ arguments regarding resources re-allocated from programs,
including those supporting gifted education, in order to meet the requirements mandated by
NCLB. Though teachers did not explicitly tie answers to NCLB mandates per se, there was
mention of 2014. This date aligns with the federal deadline in which all students are to be
proficient in mathematics and reading. Knowing this, one may possibly make a logical inference
teachers were indirectly referring to NCLB when discussing the 2014 deadline.
The survey data was examined in order to determine most concerning issues affecting
gifted students in the teachers’ classrooms.
3.4 Analysis Strategies
Steps were taken to ensure the validity of responses. Using audio recordings, notes and
emails from the interviews, the conversations were categorized into emerging themes: resources,
curriculum, testing and changes. See Appendix 3 for questioning matrix. Specific quotes were
utilized to support research from the literature review as well as data from the teacher surveys.
Staff development catalogs and on-line documents were examined in much the same
way. The staff development offerings for the district were coded according to title and/or session
description. The courses offered and coded as SPED were related to all aspects of special
education. For example, sessions offered on working with children with autism or changes
regarding identifying students for special education would be coded as SPED. Similarly,
37
anything offered toward the goal of making Adequate Yearly Progress (AYP) was coded as
NCLB. Some examples of content include: testing, data collection and analysis, school
improvement, and/or Multi-Tiered Systems of Support (MTSS). Finally, courses coded as gifted
had titles and/or descriptions related to: diverse student needs, gifted education, differentiation,
universal design, and backward design. In this district, principles of differentiation, universal
design and backward design are utilized to meet the needs of all students in a classroom,
however, are mostly associated with meeting needs of gifted students in general education
classroom settings. (See Appendix 4 for archival data).
It was the intention of this study to be as transparent as possible in order to avoid
potential bias. To do so, every effort was taken to ensure the validity of the interview protocol by
conducting pilot interviews with teachers. These pilot interviews allowed determination of
question usefulness, as well as appropriateness of question order. Additionally, pilot interviews
allowed elimination of redundant questions.

38
Chapter 4
Findings
The purpose of this study was to determine what implications, if any, No Child Left
Behind legislation has had for gifted education in one district. The following subsections give an
overview of findings—both expected and unexpected—from interviews, archival data, and
survey data. In order to keep interviews as unbiased as possible, the purpose of this study was
never fully revealed until after interviews were completed. Additionally, in order to paint a clear
picture of characteristics of gifted students, all interviewees were asked to describe general
characteristics of both struggling students and gifted students. This particular question created
the framework for remaining interview questions.
Below is an excerpt from an interview with a general education teacher with over 20
years of experience:
Q: Would you describe those general characteristics of a struggling student?
A: I would say the struggling student can have obviously some behavior issues
sometimes to try to mask the inability to do the work. I think they are overwhelmed
and they don’t know what to do. So their behaviors, if you are looking for behaviors, I
would say different kinds, but one student probably acts out, blurts out, draws
attention to himself in a class-clown type of way. Where underneath, when you sit
with him one on one you realize he doesn’t know how to get started. So, that’s
probably that one type of kid, that struggling kid. You also have the hiders, I think that
try to duck down and avoid eye contact…I really know a kid is struggling when I see
those two extremes.
Q: Now, what about those who are gifted or high-achievers? Would you describe those
general characteristics?
A: I feel bad for those kids sometimes because, I mean, this sounds terrible to say, but I
mean there are days when I even wonder if I said “hi” to them on that day, because
I’m worried about that kid who was acting out….the one that can do it on their own. I
think we don’t pay enough attention to those kids, because as a teacher we only have
so much time in a 45 minute period to make sure everybody’s doing what they’re
supposed to be doing; if the kid is doing what he’s supposed to do, I don’t need to

39
worry about him. Which I hate to admit that…because I try to say hi, I try to say
hey…but you have to force yourself as a teacher to make sure you do acknowledge the
positive behavior. It’s hard.
From each interview, answers were categorized according to broad themes. Those themes
were chunked together to create a foundation for the teacher survey. Additionally, specific
survey questions were created from sub-themes that emerged during the interviews. This process
allowed for easier organization of data in order to attain a more comprehensive picture of
possible implications of NCLB mandates for gifted education.
4.1 Overview of Current State of Gifted Education in the District
There are 18.5 teachers of gifted students in the district; 8.5 at the elementary level, 5.5 at
the middle level and 4.5 at the high school level. The process of identifying students to receive
gifted services is consistent across grade levels. The district begins formally identifying students
eligible for gifted services in first grade, although exceptions are made in certain cases for
students who are younger. An average caseload is about 70 students per grade level.
When teachers have concerns about meeting a higher achieving student’s needs in the
classroom, a process called a General Education Intervention (GEI) is started. This process
documents various academic interventions provided for students in order to determine the needs
of sustained interventions above what general curriculum has to offer. Once students
demonstrate the need for sustained interventions, the process moves to a Level II evaluation. At
this stage, parents are requested to fill out a survey, test scores are evaluated, teachers (past and
present) are asked to add input to the discussion, students are interviewed by teachers of gifted
education, and student-generated products are evaluated according to a district-created rubric.

40
At each stage in the process, various team meetings to evaluate and discuss data. If the
data continues showing sustained need, a Level III meeting is held in which the school
psychologist facilitates a discussion based on collected evidence. Test scores alone are not
enough to identify students to receive gifted services. The team must be able to answer “Yes” to
the following questions:
1. Does the student’s response to general education interventions indicate the need for
intense or sustained resources?
2. Are the resources needed to support the student to participate and progress in the general
education curriculum beyond those available through general education and other
resources?
3. Is there evidence of a pattern of strengths and weaknesses in performance, or (b)
insufficient progress when compared to (i) ability, (ii) peers, or (iii) state-approved grade-
level standards in the area(s) of concern?
4. Is the presence of exceptionality substantiated by data from multiple sources?
At the conclusion of the meeting, the team determines eligibility based on data and begins
services if need is determined. Though the process for determining eligibility is consistent across
all levels in the district, how gifted students are served varies; students in elementary school are
served in vastly different capacities than students at secondary level.
Elementary gifted students are served via a center-based model. One day a week, gifted
students leave their general education classroom and spend the day learning with gifted peers. In
most cases, students are transported to schools in which Enhanced Learning classrooms (EL) are
located.
At the middle and secondary levels, the gifted program becomes a credit hour, usually in
place of an English and/or language arts credit. An average caseload is 14 students per hour, but
students have the option of not enrolling in the credit hour, referred to as SEEK (Students

41
Exploring and Seeking Knowledge). Because there are more options for challenging curriculum
via honors, advanced, IB and AP classes, students may opt out of SEEK enrollment in order to
pursue challenging curricula in areas of personal interest.
The funding for gifted education in the district is included in the special education
budget. Over the last few years, the district has had to make drastic cuts to their budget. Not
many programs were able to escape the hit, and gifted programs were no exception. In 2009-
2020, the middle school SEEK program was cut by 5 teachers (FTE) in order to save
$208,353.00; likewise, all paraprofessionals serving the entire gifted program (elementary,
middle and high school) were eliminated, saving the district $134,872.00. Of the 3.1 billion
dollars spent on in the district for the last 11 years, roughly 3.7 million, or less than 1/10th
of
1% has been earmarked for gifted services compared to 440 million, or 14%, for special
education services.
-------------------------------------------
Insert Figure 3 here
--------------------------------------------
One way a district strengthens teaching and instruction of teachers is to offer professional
development in order to further develop the skills of all teachers. Professional development
catalog course offerings typically reflect a district’s focus. For the last seven years, the district
has offered nearly 3,300 professional development courses, or an average of 464 classes per
42
year. Of those offerings, 110 (average of 16 per year) were specifically related to special
education; 41 (average of 6 per year) were specifically related to gifted education; and 306
(average of 44 per year) were specifically related to testing and assessment. So, though one way
to develop stronger instruction to meet the needs of gifted students is through professional
development, it is worth considering what type of professional development is offered.
--------------------------------------
Insert Figure 4 here
---------------------------------------
4.2 Curriculum Narrowing In The District
As mentioned in the literature, a narrower curriculum is thought to be a by-product of
pressure from high-stakes testing as required by NCLB mandates (Berliner, 2009; Siegel, 2004
; Sloane & Kelly,2003). As instructional time is a limited resource, choices are made regarding
curriculum taught versus curriculum not taught. Since pressure to have districts show 100%
student proficiency in mathematics and reading, teaching curriculum in those subjects is not
sacrificed when time is scarce. As McMurrer (2008) found when comparing instructional time in
elementary classrooms, the amount of time spent teaching English/Language Arts curriculum
increased on average 141 minutes per week during the 2001-02 school year. Mathematics
instructional time increased on average 81 minutes per week during the 2001-02 school year.
Surveyed teachers indicated nearly 85% felt gifted students are affected by less
instructional time in different subjects, while 15% felt gifted students were not at all affected by

43
less instructional time in different subjects. This survey question potentially impacts only
elementary teachers, as elementary teachers teach all subjects and have more flexibility as to
when to teach various subjects; secondary teachers teach specific content during a specific set of
minutes in a day.
From interview data, two questions related to the broader theme of the curriculum in
which respondents think gifted students would be negatively affected surfaced: offering a “one
size fits all” curriculum and fewer opportunities for creative learning experiences in a
curriculum. When asked to rank how much gifted students were affected in the classroom with a
“one size fits all” curriculum, 90% of teachers responding indicated gifted students were indeed
affected—40% indicating “very” affected and 50% indicating “somewhat” affected. The
remaining 10% thought a “one-size-fits-all” curriculum had little to no effect on gifted students
in the classroom. During an interview with an elementary teacher having 23 years of experience
in general and gifted education lamented:
“The way we teach now is not geared toward children developmentally. I feel sorry for
them. Drill and practice is necessary, but testing has taken the soul out of learning. Students are
not allowed to learn at their own paces, but must go to a ‘one-size-fits-all’ model.”
This one-size-fits-all model interpretation may be attributed to findings echoed in
literature: a narrower curriculum for gifted students due to less instructional time in subjects and
pressure from high-stakes testing.
When teachers were asked to determine how much gifted students in the classroom were
affected by fewer opportunities to be creative, similar percentages appeared. 89% of respondents
thought gifted students would be affected by having fewer creative opportunities, 56% indicating
very affected and 33% indicating somewhat affected. Results for those two questions might be

44
similar because “one-size-fits-all” curriculum and fewer creative opportunities are intricately
connected After 18 years in the general education classroom and making the transition to
teaching gifted students in the elementary setting five years ago, one teacher observed,
“I’ve been a teacher for 23 years. I’ve taught 6th
grade for 18 years and this is my 5th
year as
a gifted ed facilitator. What has changed is the degree of creativity I see in some teachers.
Twenty-three years ago we were very aware of what we were teaching and what our students
were learning, but it seems as though we were trusted as professionals to carry out the teaching
of the objectives required for our grade and expected to do so in ways that addressed the needs
of many ability levels, held children’s interest and piqued their curiosity. It was a very exciting
thing to sort your objectives and find new connections between them. It was exhilarating to
confer with peers and thrash out the most focused and stimulating ways to present content and
help students learn the process. We were encouraged to forge new ways to teach our objectives.
Teaching is an art that employs scientific methods and theory on actual human beings, but I
think it is being treated as a science that must be replicable at all cost. The cost is the creativity
of teachers and children.”
One unanticipated topic surfacing during teacher interviews was the support of the
Common Core State Standards (CCSS) recently adopted by 45 states. Fewer standards of the
CCSS will allow freedom for delving deeper in learning once fully implemented. Many contend
since there are fewer standards, school districts can develop curriculum beyond just surface
learning; students will have opportunities for more inquiry and creative explorations, which align
perfectly with the gifted students' needs in general education classrooms ( McCallister &
Plourde, 2008 ).
The Common Core State Standards have been gathering steam since the first draft was
released to the public in the fall of 2009. Since the final publication of the CCSS in the summer
of 2010, 45 states have now adopted these standards. Each state is allowed to include up to 15%

45
of their own standards in addition to the CCSS, and these standards will be used to measure a
student’s growth in the curriculum. In Kansas, these new standards are referred to as the Kansas
College and Career Ready Standards (KSDE, 2013). The premise movement toward common
standards across the United States is to better prepare students for life beyond high school,
regardless of where they reside or where their path may lead: college or a career. What remains
unclear at this point is how student growth in the curriculum will be measured.
When ranking the effect of transitioning to CCSS, nearly 90% answered gifted students
would be affected by this transition, while nearly 12% signified gifted students would not be
affected. Even though teachers showed positive reaction in relation to CCSS during the
interviews, survey results are not conclusive. The survey question did not specify if the transition
to CCSS would have a positive or negative effect on gifted students.
4.3 High Stakes Testing & Accountability In The District
As pressure from district administrators to have high scores is constant, sacrificing
curriculum not tested for specifically aligned, assessed indicators is a popular response by
teachers interviewed. The pressure, though, on district administrators is ceaseless, too. In a letter
from the Kansas State NAEP coordinator to elementary principals, these statements appear:
“I am enlisting your assistance in an attempt to raise the 4th
grade NAEP reading scores in
Kansas on the NAEP 2013 assessment.”
“NAEP is a different type of test from our state assessment, but politically scores have been
compared. The percent of 4th
grade students meeting standard in reading in Kansas in 2012 was
88%, but on the NAEP 2011 assessment the percent of proficient 4th
grade students in reading
was only 36%.”
46
“I ask that as you meet with the 4th
grade students before the NAEP assessment this year you
explain a ‘complete’ response on a constructed response and short answer questions….a few
students moving from partial credit to complete might be enough to increase our state scores.”
“As always, I want to reassure you, your staff and students that NAEP is not a high stakes
assessment…”
Her plea for prepping students before taking the NAEP reflects a result of pressure from
high-stakes testing as found in the literature (Payne-Tsourpos, 2010; Supovitz, 2009; Nichols &
Berliner, 2008; McDonnel & Choisser, 1997).
During the interviews, teachers were initially to describe the criteria used to make curriculum
choices when facing time constraints. The question, “What are some things that cause you stress
in your teaching?” generated answers related to testing including pressures surrounding testing.
From the interview answers, the following survey questions were created:
1. How affected are gifted students by changes in the schedule due to testing practices?
2. How affected are gifted students by too much test prep (focusing heavily on tested
indicators)?
3. How affected are gifted students by tests written at a low level (not a lot of higher level
thinking skills)?
4. How affected are gifted students by pressure to have all students meet standards?
5. How affected are gifted students by too much focus on all types of test scores?
Survey results show 65% of responding teachers felt gifted students were very affected by
too much test preparation for state assessments, and 37% felt gifted students were somewhat

47
affected by too much test preparation for state assessments. 8% of teachers felt gifted students
were not at all affected by too much test preparation for state assessments. Similarly, 67% of
teachers felt gifted students were very affected by pressures related to all students meeting
standards of proficiency, while 25% felt gifted students were only somewhat affected by high-
stakes testing pressure.
When responding to the survey question, “How affected are gifted students by too much
focus on all types of test scores?” 65% of teachers indicated gifted students are very affected and
25% indicated gifted students are somewhat affected; when combined, 90% of teachers stated
there is an effect on gifted students. This corroborates teacher interview data.
As one secondary general education teacher put it so succinctly, “…testing drives
everything.” And, one veteran gifted facilitator at the secondary level described it like this:
“I’ve been teaching for 40 years; the changes are nearly innumerable. The past ten years has
seen the ever-increasing influence that high-stake testing has had on everything we do….high-
stakes testing has focused on the bottom, leaving gifted to achieve only for the benefit of the
school—resources are diverted to the bottom at the expense of gifted students.”
Teachers feel a lot of pressure to get those scores to the highest possible levels. One
secondary general education teacher with over 20 years of both general education and special
education experience said,
“I feel like I will be in trouble if my scores are the lowest of my colleagues.”
Again, describing the amount of testing and its effect in the classrooms, this same teacher said,
“We’ve kind of lost the art of creativity…because of the test. I think it’s the standardized
48
test. I think it’s the, um, data driven society now that’s gotten out of control. Maybe I’m
wrong…We are too focused on numbers, you know, on scores on the paper.”
As the NAEP coordinator pointed out in the letter to principals, one can argue Kansas state
tests are not written at the same levels as the NAEP, the MAP, or other standardized tests. For
example, a proficiency cut score on the NAEP test for 4th
grade readers is a score of 240. In
comparison, Kansas’ proficiency score on the 4th
grade Kansas State Assessment (KSA) in
reading is a score equivalent to NAEP’s score of 185. NAEP considers 185 to be below the basic
level in scoring. Differences in defining proficiency in reading for 4th
grades only serves to
exacerbate the “proficiency illusion,” a phrase coined in the report, ”The Proficiency Illusion”
(Adkins, Kingsbury, Dahlin & Cronin, 2007). While Kansas state assessment scores may
indicate students are proficient in reading and mathematics, this report brings to light glaring
differences in the way standardized tests are written. If the goal is to be proficient by Kansas’
standards, the mark may be missed. And, if teachers continue to feel pressure to meet these
proficiency levels for state tests and tailoring instruction to the specific, tested Kansas indicators,
curriculum will continue to narrow quite considerably, as previously mentioned.
4.4 Limited Resources In The District
The district has been facing increasing financial difficulties over the past several years.
This monetary crisis is attributed to several things: decreasing federal funding, decreasing state
funding to school districts, a state financial formula taking money away from this district and
distributing it to other districts across the state, and a declining enrollment. Combined with these
elements create a “perfect storm” of financial hardships. In trying to ascertain the effect, if any, a
lack of resources has on gifted students, interviews were used to create a foundation from which

49
multiple ideas were generated. From these ideas, a survey was sent out to random teachers across
the district.
This particular district has faced many budget reductions over the last six years, and
teachers are fully aware of how those reductions have impacted students in classrooms. Over the
last 18 years, the district has spent nearly 14% of the total budget each year for special education
services, and less than 1/10th
of 1% for gifted education. However, the district has been
consistent in the percentages. The differences in spending could mean it costs much more to
serve a special education student than it costs to serve a gifted student.
Generally speaking, having more money translates into having more materials and
supplies for instruction. During initial interviews, it was no surprise money was mentioned as a
“roadblock” to meeting the needs of gifted students in the classroom.
Only one question on the teacher survey asked about direct correlations between material
or supplies and gifted students in the classroom. When asked to rank how much gifted students
are affected by lack of money for materials or supplies, nearly 1/3 of respondents agreed gifted
students are very affected by this lack of money and supplies; however, nearly 1/4 of the
respondents indicated gifted students are not affected at all by the lack of materials or supplies.
The remaining four questions on the teacher survey were related to limited resources,
however, do not translate directly into material or supplies. Instead, these questions were related
to human capital and time—things not appearing to directly affect gifted students on the surface.
Having money for providing opportunities for teachers’ staff development was
mentioned as being scarce in the interviews. Teachers voiced needs for staff development
tailored to their own personal growth. One fifth year teacher described how staff development
helps her grow as a teacher in this way:

50
“I don’t want to say more staff development…but, better staff development. Staff
development that actually helps me as a teacher. Right? Because nobody gets into teaching to
just…to not teach. It’s because we care about students.”
When the survey asked teachers to rank how affected are gifted students by not having
enough staff development on how to meet gifted students’ needs in the classroom, 82% of
respondents determined this lack as having a definite effect on gifted students, with 40%
indicating gifted students are very affected by lack of staff development. This lack correlates
with the amount of staff development offerings by the district as well.
Time was another scarce resource mentioned in the interviews, and was divided into the
categories of instructional time and planning time. From the interviews, teachers felt there was
not nearly enough time in a school day to individualize instruction as they preferred, nor was
there enough time in a school year to delve deeper into topics sustaining intellectually gifted
students. Instructional time was a precious resource taken over by preparation for high stakes
testing associated with NCLB legislation.
While decreases in instructional time have been reported by McMurrer (2008), only
elementary teachers spoke to this topic, because elementary classroom teachers are responsible
for teaching all subjects. Additionally, elementary teachers have greater flexibility in classroom
schedules to teach subjects at various times throughout the school day. Secondary level teachers
are responsible for teaching specific content and within a specific time frame each day. Survey
results indicated 87% of teachers believe less instructional time to teach has an effect on gifted
students in their classroom.

51
The survey question asking how affected gifted students were by lack of planning time
was answered “very” by 52% of respondents and “somewhat” by 40% of respondents. Over 80%
of teachers surveyed feel lack of planning times has a definite effect on gifted students.
Interview questions regarding limited resources yielded a surprising answer—lack of adult
help in a classroom. Teachers described benefits of having classroom aides, paraprofessional or
other adults in classrooms. Teachers were very creative in how they would utilize another adult
in the classroom. Instructing small groups, monitoring independent projects, or helping develop
inquiry projects were just a few ways extra personnel could be utilized. According to survey
results, over ¾ of teachers responding indicated lack of paraprofessionals or aides in the
classroom had an effect on gifted students, while nearly ¼ believed there is no effect on gifted
students in the classroom. Again, in 2009, this district cut all paraprofessional services to gifted
programs at all levels. The following quote from a gifted education teacher sums up his feelings
about reallocation of limited resources,
“I’ve been teaching for 40 years; the changes are nearly innumerable. The past ten years has
seen the ever-increasing influence that high-stake testing has had on everything we do….high-
stakes testing has focused on the bottom, leaving gifted to achieve only for the benefit of the
school—resources are diverted to the bottom at the expense of gifted students.”
Because available resources are a direct result of funding, it becomes easier to equate
lack of federal funding of NCLB to the financial woes of a district. While this author feels lack
of federal funding plays a role, she is not able to determine with complete certainty direct
correlations between the two as literature and Jacob Javits’ appropriations data indicate.

52
Chapter 5
Discussion and Conclusion
5.1 Overview
Literature in recent years has suggested reallocation of resources from some academic
programs into those with more focus on increasing academic achievement for those performing
at levels well below proficiency thresholds in mathematics and literacy. While the idea of
increasing the academic performance of those groups is not to be dismissed, it may be at the
expense of other student groups. The combination of a sluggish economy, the unfunded mandate
of NCLB, and the pressure from various political groups for increased test scores has created a
dismal outcome for students who are high academic achievers. Since states are largely
responsible the staggering costs of administering such tests, programs not directly related to
increasing achievement scores on state assessments may be first on the chopping blocks. As
Ferguson (1991) stated in “New Evidence on How and Why Money Matters,” published in the
Harvard Journal on Legislation, states must contend with the decrease in federal funds along
with an increase in the cost of yearly testing students. It’s a mad scramble to cut non-essential
programs out of the budget.
On the surface, it appears as though students who achieve at higher levels are more self-
sufficient and do not require as many resources as those who are low academically. While the
needs of different academic groups may be poles apart in terms of resources needed, each group
still requires resources. There is no literature supporting steady academic growth of any student
when resources are inadequate, in spite of high academic ability. Across the country, states
requiring funding for gifted programs have been whittling away at those funds (Johnson, Oliff &

53
Williams, 2011). Again, these cuts are made with incorrect assumptions gifted students are
capable of making academic gains without resources (Merry, 2008).
Related to a decrease in resources, albeit indirectly, is how narrow curriculum has
become for students coupled with increased pressure for schools to score well on state
assessments. The two are so closely intertwined, it becomes nearly impossible to disentangle
them into separate issues. The relationships between curriculum narrowing and high stakes
testing are directly proportional; the more time spent teaching the assessed state standards, the
higher the state assessment scores. The higher the state scores, there is an appearance of closing
the achievement gap. Conversely, the more time spent teaching the assessed state standards, the
less time there is for curriculum not assessed on those tests. In reality, what occurs is narrowing
what all students are learning in our schools. Both Jonathan Supovitz (2009) and Brian Jacob
(2004) have addressed the consequences of high-stakes testing in their research. Supovitz
addressed the high stakes debate and argued the creation of an accountability system does not
necessarily result in a change in teacher pedagogy, while Jacob focused on results related to
high-stakes testing pressure in Chicago schools. He found three distinct actions related to the
pressure: more special education identification, more student retentions, and less classroom
instruction of non-tested subjects.
5.2 Implications for K-12 Education
The goal of this study was to determine what implications, if any, implementing NCLB
as mandated has had on gifted education in one school district. Previous research indicates
curriculum narrowing, pressure from high-stakes testing and reallocation of limited resources
have emerged as unintended consequences related to the implementation of NCLB mandates (
). Overall, this study discovered no significant effects on gifted students as a result of

54
implementing NCLB. This might mean the district is maximizing resources well in order to
prevent the consequences. It also might mean teachers are working hard to protect the students in
their classrooms from each of these unintended consequences. It could also mean interview data
and survey data were not the correct tools to measure these potential effects on gifted students.
5.2.1 Curriculum Narrowing
While there is evidence to some degree regarding curriculum narrowing, there is no clear-
cut evidence showing curriculum narrowing is happening across multiple grade levels and
multiple schools. What might be more realistic are more opportunities for curriculum narrowing
at the elementary level versus the secondary level. This might be because elementary teachers
are responsible for delivering curriculum in multiple subjects. Even though gifted elementary
students are taught by gifted education teachers one day a week, there are still four days in which
they may be sitting in a general education classroom with a teacher lacking gifted education
certification. However, this district adopted the Multi-Tiered Systems of Support (MTSS) model
in order to respond to the needs of all students. This model of systematic intervention does
address serving students already performing at very high levels. MTSS may potentially help
protect gifted students from feeling the effects of curriculum narrowing in the elementary
classroom.
As students move to secondary levels of middle school and high school, more courses are
available for consumption by gifted students. High schools offer various levels of advanced and
college preparatory classes; it is reasonable to assume these advanced classes are more rigorous.
Because gifted students have more voice in selecting courses, one would think self-selection

55
would be driven by intellectual needs of gifted students. Therefore, it stands to reason gifted
students do not experience as much curriculum narrowing at secondary levels.
As this district transitions to fully implementing the Kansas College and Career Ready
Standards, there is not enough evidence to accurately determine the effect these new standards
will have on gifted students in the classroom. Even though interview data suggest the effect will
be positive, this author is uncomfortable making assumptions in either direction.
5.2.2 High Stakes Testing & Accountability
There is greater evidence to support teachers’ attitudes toward high stakes testing rather
than actual effects on gifted students in their classrooms. According to the interviewees’ answers
and survey data, this author could find no correlations between the focus of testing and success
of high achieving students. Lack of significant findings related to high-stakes testing and
accountability would indicate a different measurement tool may potentially make a difference in
determining how high-stakes testing has affected gifted students. While teachers were able to
express frustration with high-stakes testing in interviews, the frustrations were results of pressure
applied to them and not necessarily students.
5.2.3 Limited Resources
The lack of significance regarding limited resources of time, staff development, money
and adult help may also indicate different measurement tools could yield more measurable
results as to the effects on gifted students in the classroom. Because interview data and survey
data both reflect a strong desire for more adult help in the classroom, it stands to reason teachers
feel this is the most limited resource. Another adult in the classroom would potentially allow

56
teachers to utilize more one-on-one interactions with students and teach small groups more
effectively, as the MTSS model of intervention suggests.
Staff development sessions offered often reflects a focus of a district as well as offering new
learning and/or re-learning for teachers. If there is a lack of staff development in this area, it is
reasonable to think the district may feel other training priorities take precedence. It may even
indicate teachers have received enough training and are expected to continue professional growth
on their own.
5.3 Implications for Policy: Correcting Educational Reform Policy Mistakes
In light of recent studies focusing on excellence gaps, it is likely lessons have been
learned. Education reform history shows attempts to “self-correct.” For just one example, Race
to the Top focused on recruiting and rewarding teachers and administrators for working in the
“hard” schools and districts (Crowe, 2011). This focus of Race to the Top addressed vaguest
tenet of NCLB—highly qualified teachers. Since each state was able to create a definition of
highly qualified, there was not much continuity. According to the legislation of NCLB, a
“Highly Qualified Teacher” is defined as one whom: holds a Bachelor’s Degree, obtains full
state certification and licensure, and proves knowledgeable in the chosen subject area (Blank,
2003). However, meeting the guidelines of a state does not necessarily ensure knowledge of
core content. For example, teachers in Alaska can earn points toward becoming Highly
Qualified if they are fluent in a foreign language (McGrath, 2005). Teachers in Maine can count
sponsoring an academic club toward their Highly Qualified status (McGrath, 2005). For some, it
is just another loophole through which to dive. Race to the Top was a partial attempt to
“correct” the loophole.

57
The “self-correcting” continues. As the year 2014 loomed ahead, the fear of districts being
caught in a losing race toward 100% student proficiency became palpable. Perhaps in an indirect
acknowledgment of shortcomings related to the implementation of NCLB, the federal
government allowed states to apply for a waiver which eases NCLB sanctions related to
accountability. However, in order for a waiver to be issued, a state had to agree to the following
conditions (McNeill, 2011):
1. Adoption of higher standards preparing students for college and/or career readiness after
leaving high school.
2. Principal and teacher evaluation systems overhauled so some student achievement results
are considered in an evaluation.
3. Implement an accountability system differentiated for different populations.
As a result of more states scrambling to be a part of the waiver, the popularity of the
Common Core State Standards Initiative skyrocketed. Some might even argue the creation and
adoption of these more rigorous standards is one of the most promising unintended consequences
of the NCLB legislation. “The Common Core State Standards focus on core conceptual
understandings and procedures starting in the early grades, thus enabling teachers to take the
time needed to teach core concepts and procedures well—and to give students the opportunity to
master them” (National Governors Association Center for Best Practices, Council of Chief State
School Officers, 2010).
In a recent report conducted by The Brown Center on Education Policy and published by the
Brookings Institute, Tom Loveless (2012) summarized the three main arguments for and against
adoption of Common Core State Standards. First, he cited “Quality Theory” as an asset to the
58
CCSS; students will achieve at a higher rate because the curriculum is better. The English
Language Arts (ELA) standards are more rigorous than 37 of the states’ current ELA standards
and the mathematics standards are more rigorous than 39 of the states’ current mathematics
standards. Second, his “Rigorous Performance Standards Theory” states higher expectations in
the newly adopted standards will be higher than the current expectations, and thus students will
rise to the expected level. Thirdly, “Standardization Theory” describes the expectation of
increased efficiency by streamlining resources. With so many states on board with the adoption
of CCSS, there is no need to reinvent the wheel, so to speak (Loveless, 2012).
Those criticizing the CCSS offer counterarguments as well. To rebuke the “Quality Theory”
statement, if the CCSS are superior to 37 of the adopting states’ standards, then it stands to
reason there are states having higher standards than CCSS. Does this mean those states must
lower standards in order to comply? Closely related to this counterargument is the belief one size
in state standards does not fit all. These critics make no mention, however, of the states’ abilities
to include up to 15% of current standards along with the CCSS. And, finally, those against the
adoption of CCSS are quick to negate the intrastate mobility claims of these standards because
each state already has standards, so it is not a large problem within a state (Loveless, 2012).
It remains to be seen if the federal waiver along with the adoption and implementation of
the CCSS will be the last form of “correctional” action ever needed.
5.5 Limitations
As with any study, there are limitations. The first limitation, and perhaps the largest, is
the small sample. The district is one of the largest in the state, yet, it is not feasible to assume
every other district would have the same results if the study were replicated in each one.

59
Another limitation was the inability to follow a cohort of students through grades K-12.
Being able to follow a student through each of these grades through achievement scores would
allow for assessment of academic growth. Adding to this study’s limitations is the change in
assessments over the years. No one consistent test or assessment has been administered for a
long enough time to demonstrate effects, if any, NCLB might have on the academic growth of
gifted students.
Several secondary limitations also affected this study. The first was related to district
budget documents. The actual documents do not reflect the amount spent on gifted education;
rather, gifted education is included in the total special education budget and is not displayed in a
separate line item. The Director of Finance for the district was able to extract line item
information for this study; however, the ability to further delineate funding details would have
provided a much clearer picture as to where re-allocating funds from gifted education budget
cuts were spent.
Another secondary limitation was related to lack of specific numbers of gifted students
enrolled in the district from 1995-2002. The Director of Special Education communicated those
numbers were not kept by the district until 2002. Additionally, there was not budget allocation
for gifted education before 2002.
The third secondary limitation was the lack of consistent coding of staff development
courses. Each presenter created a description of the course offering as well as key words
associated with the course. Determining the number of courses related to gifted education,
special education and high-stakes testing relied upon the subject descriptions submitted by
presenters.

60
5.6 Future Research
The purpose of this study was to determine the implications, if any, implementing NCLB
as mandated has had for gifted education in one school district. This study focused on a very
small sample. Additionally, it mainly relied on interviews, survey data and archival data to
substantiate the research.
Should there be studies related to this topic in the future, one other suggestion would be
to find achievement data in order to add an extra layer of substantive proof regarding specific
amounts of academic achievement of each student. Assessment and/or achievement data would
need to be consistent for a long enough period of time, preferably grades 3-12, in order to show a
pattern in academic growth or decline for gifted students.
Interviews conducted with gifted students and parents of gifted students would yield data
for which to compare to teacher and administrator interview data. This might potentially provide
an unexplored perspective on the effects of NCLB on gifted education.

61
References
Adkins, Deborah, Kingsbury, G. Gage, Dahlin, Michael & Cronin, John. (2007). “The
Proficiency Illusion.” Washington, DC: Thomas Fordham Institute.
Association for Supervision and Curriculum Development (2005) Gifted and Growing.
Clark, Linda. 56-60.
Azzam, Amy, Perkins-Gough, Deborah, Thiers, Naomi. (2006). “The Impact of NCLB.”
Educational Leadership 64 (3), 94-96.
Baker, Bruce D. & Reva Friedman-Nimz. (2004). “State Policies and Equal Opportunity:
The example of gifted education.” Education Evaluation and Policy Analysis. 26(1),
39-64.
Baker, Bruce D. & McIntire, Jay. (2003). “Evaluating State Funding for Gifted Education
Programs.” Roeper Review, 25 (4), 173-179.
Beisser, Sally R. (2008). “Unintended Consequences of No Child Left Behind Mandates
On Gifted Students.” Forum on Public Policy.
Benbow, Camilla & Stanley, Julian. (1996). “Inequity in Equity: How “Equity” Can Lead
to Inequity for High-Potential Students.” Psychology, Public Policy, and Law, 2 (2),
249-292.
Berliner, David. “Rational Responses to High-Stakes Testing and the Special Case of Narrowing
The Curriculum.” Redesigning Pedagogy International Conference, Singapore, June 2009.
Berman, Kimberly, Schultz, Robert & Weber, Christine. (2012). “A Lack of Awareness and
Emphasis in Preservice Teacher Training: Preconceived Beliefs about Gifted and
Talented.” Gifted Child Today, 35 (1), 19-27.
Blank, Rolf. (2003). "Meeting NCLB Goals for Highly Qualified Teachers: Estimates by
State from Survey Data." Retrieved July 25, 2009 from
<http://www.ccsso.org/content/pdfs/HighlyQualifiedTeachers.pdf>
Borkowski, John W. & Sneed, Maree. (2006). “Will NCLB Improve or Harm Public
Education?” Harvard Educational Review. 76(4), 503-527.
Bracey, Gerald W. (2008). “NCLB: Achievement Robin Hood?” Principal Leadership, 9
(3), 47-49.
Brown, Elissa, Avery, Linda, VanTassel-Baska, Joyce, Worley, Bess, & Stambaugh,
Tamra. (2006). “Legislation and Policies: Effects on the Gifted.” Roeper Review, 29
(1), 11-23.

62
Bush, George. (2001). United States. No Child Left Behind. Government Printing Office.
Carmichael, Sheila Byrd, Martino, Gabrielle, Porter-Magee, Kathleen, & Wilson, W. Stephen.
(2010). “The State of State Standards—and the Common Core—in 2010.” Washington,
DC: Thomas Fordham Institute.
Cawelti, Gordon. (2006). “The Side Effects of NCLB.” Educational Leadership, 64 (3),
64-68.
"Characteristics and Behaviors of the Gifted." (n.d.) Rhode Island State Advisory
Committee on Gifted and Talented Education. Retrieved November 24, 2008 from
<http://www.ri.net/gifted_talented/character.html>
Cloud, John. (2007 Aug 27). "Failing Our Geniuses." Time (27), 40-47.
Cox, James & Witko, Christopher. “Accountability and the “Narrowing of the Curriculum.”
State Politics and Policy Conference, Dartmouth University, 2011.
Crowe, Edward. (2011). “Race to the Top and Teacher Preparation.” Center for American
Progress.
David, Jane L. (2011). “High-Stakes Testing Narrows the Curriculum.” Educational Leadership,
68 (6), 78-80.
Department of Education (2003). Choice Provisions in No Child Left Behind.
Government Printing Office.
Department of Education. (2011). Mapping State Proficiency Standards Onto the NAEP Scales:
Variation and Change in State Standards for Reading and Mathematics, 2005-2009.
Government Printing Office.
Digest of Education Statistics 2008
http://nces.ed.gov/Pubsearch/pubsinfo.asp?pubid=2009020
ERIC Clearinghouse on Handicapped and Gifted Children. “Gifted Education Digests.” (1990):
2-9. ERIC Digests. Web. #E476. 02 November 2011.
< http://www.eric.ed.gove/ERICWebPortal/search/detailmini.jsp?_nfpb=true&_ERICExt
Search_SearchValue_0=ED321481&ERICExtSearch_SearchType_0=no&accno=
ED32148>
Ferguson, Robert. (1991). “New Evidence on How and Why Money Matters.” Harvard Journal
on Legislation, 28, 465-498.

63
Finn, Chester E. (2012). “The War Against the Common Core.” Education Next
< http://www.edexcellence.net/commentary/education-gadfly-weekly/2012/march-1/the-
war-against-the-common-core-1.html>
French, Lisa R., Walker, Cheryl L. & Shore, Bruce M. (2011). “Do Gifted Students Really Prefer
To Work Alone?” Roeper Review, 33 (3), 145-159.
Fuller, Bruce, Wright, Joseph, Gesicki, Kathryn & Kang, Erin. (2007). “Gauging Growth:
How to Judge No Child Left Behind?” Educational Researcher, 36, 268-278.
Gay, Geneva. (2007). "The Rhetoric and Reality of NCLB." Race Ethnicity and
Education, 10,279-293.
Gentry, Marcia. (2006). “No Child Left Behind: Neglecting Excellence.” Roeper Review,
29 (1), 24-27.
Giroux, Henry & Schmidt, Michèle. (2004). “Closing the Achievement Gap: A Metaphor
For Children Left Behind.” Journal of Educational Change, 5, 213-228.
Goertz, Margaret & Duffy, Mark. (2003). “Mapping the Landscape of High-Stakes Testing
And Accountability Programs.” Theory into Practice, 42 (1), 4-17.
Gottfredson, Linda. “Realities in Desegregating Gifted Education.” In the Eyes of the
Beholder: Critical Issues for Diversity in Gifted Education. 139-155. 2004.
Gottfried, Allen, Clayton Cook, Adele Gottfried, and Phillip Morris. (2005). "Educational
Characteristics of Adolescents with Gifted Academic Intrinsic Motivation: A
Longitudinal Investigation From School Entry Through Early Adulthood."
Gifted Child Quarterly. 49,172-186.
Gross, Miraca. (1998). “The “Me” Behind the Mask: Intellectually Gifted Students and the
Search for Identity.” Roeper Review. 20 (3), 167-174.
Harrington-Lueker, Donna. (2000). “Perfect Solutions Don’t Exist So Let’s Proceed with
Student Accountability That’s Aligned and Fair.” School Administrator, 57,
(11), 32-29.
Heller, Barbara. "A History and Description of ESEA Title I in New York City.
1965-1968."1968.
Holmstrom, Bengt & Milgrom, Paul. (1991). “Multitask Principal—Agent Analyses:
Incentive Contracts, Asset Ownership, and Job Design.” Journal of Law, Economics,
& Organization, 7, 24-52.

64
Hoyt, Sara. “An Untapped Resource: Middle School Students’ Perceptions of Their
Gifted and Talented Program.
http://www.uwstout.edu/lib/thesis/2002/2002hoyts.pdf.
Jacob, Brian. (2004). “Accountability, Incentives and Behavior: The Impact of
High-Stakes Testing in the Chicago Public Schools.” Journal of Public Economics, 89,
761-796.
Jacob K. Javits Gifted and Talented Students Education Act, P.L. 100-297 1988.
Johnsen, Susan. (2008). "Response to Intervention: Where Does the Gifted Child Fit?."
Gifted Child Today, 5.
Johnson, Lyndon B. ( May 1964). "LBJ's Great Society Speech." CNN Cold War
Historical Documents. Retrieved November 28, 2008 from
http://www.cnn.com/SPECIALS/cold.war/episodes/13/documents/lbj/.
Johnson, Nicholas, Oliff, Phil & Williams, Erica. (2011) “An Update on State Budget Cuts.”
Washington, DC: The Center on Budget and Policy Priorities.
Jolly, Jennifer & Kettler, Todd. (2008). “Gifted Education Research 1994-2003: A Disconnect
Between Priorities and Practice.” Journal of Education for the Gifted, 31 (4), 427-446.
Kim, J., & Sunderman, G. L. (2004). “Does NCLB Provide Good Choices for Students in
Low-Performing Schools?” Cambridge, MA: The Civil Rights Project at Harvard
University.
King, Kelly & Zucker, Sasha. (2005). “Curriculum Narrowing.” Boston, MA: Pearson
Education.
Koebler, Jason. (2011). “Educators Implicated in Atlanta Cheating Scandal.” US News. 7 July
2011: n. page. Web. 2 February 2012.
Koski, William & Reich, Rob. (2006). “When ‘Adequate’ Isn’t: The Retreat from Equity in
Educational Law and Policy and Why It Matters.” Emory Law Journal, 56 (3), 545-617.
Loveless, Tom. (2012). “How Well Are American Students Learning?” Washington, DC:
Thomas Fordham Institute.
Loveless, Tom, Farkas, Steve & Duffet, Ann. (2008). "High-Achieving Students in the Era of
NCLB." Washington, DC: Thomas Fordham Institute.
Madaus, George & Russell, Michael (2010/2011). “Paradoxes of High Stakes Testing.” Journal
of Education, 190, (1/2), 21-30.

65
McCallister, Brooke & Plourde, Lee. (2008). “Enrichment Curriculum: Essential for
Mathematically Gifted Students.” Education, 129 (1), 40-49.
McDonnell, Lorraine & Choisser, Craig. (1997). “Testing and Teaching: Local Implementation
Of New State Assessments.” Los Angeles: University of California, National Center for
Research on Evaluation, Standards, and Student Testing.
McGrath, Anne. (2005). “Can Teachers Measure Up?” U.S. News & World Report, retrieved 16
September 2009 from http://www.usnews.com/usnews/edu/articles/050912/12educate.htm.
McNeill, Michele. (2011). “Waiver Plans Would Scrap Parts of NCLB.” Education Week,
31(13), 2-3.
Merry, Michael S. (2008). “Educational Justice and the Gifted.” Theory and Research in
Education , 6 (1), 47-70.
National Governors Association Center for Best Practices & Council of Chief State School
Officers (2010). Common Core State Standards. Washington D.C.
Neal, Derek & Schanzenbach, Diane Whitmore. (2010). “Left Behind By Design: Proficiency
Counts and Test-Based Accountability.” The Review of Economics and Statistics, 92 (2),
263-283.
Nichols, Sharon L. & Berliner, David C. (2008). “Why Has High-Stakes Testing Slipped So
Easily into Contemporary American Life?” Phi Delta Kappan, 89 (9), 672-676.
Office of Postsecondary Education. (2002). Meeting the Highly Qualified
Teacher's Challenge. Arlington, VA: Education Consumers Foundation.
Payne-Tsoupros, Christina. “No Child Left Behind: Disincentives to Focus Instruction on
Students Above the Passing Threshold.” Journal of Law & Education, 39 (4), 471-501.
Peine, Marie & Coleman, Laurence. (2010). “The Phenomenon of Waiting in Class.” Journal of
Gifted Education, 34 (2), 22-244.
Peterson, Jean. (2006)."Addressing Counseling Needs of Gifted Students." Professional
School Counseling, 10, 43-51.
Peterson, Marshalita S. (2005). “The Ethical Dilemmas of High-Stakes Testing and Issues
For Teacher Preparation Programs.” Journal of College and Character, 6 (7), 1-11.
Petrilli, Michael. (2007)."Testing the Limits of NCLB." Education Next, 4, 52-56.
Popham, W. James. (1999). “Why Standardized Tests Don’t Measure Educational Quality.”
Educational Leadership, 56 (6), 8-15.

66
Plucker, Jonathan, Burroughs, Nathan, & Song, Ruiting. (2010). “Mind the (Other) Gap!”
Center for Evaluation & Education Policy. February 2010.
Ramirez, Eddy. (2007, November 2). "For Talented Students, Challenges to Grow." U.S.
News and World Report. Retrieved November 24, 2008 from
http://www.usnews.com/articles/education/2007/11/02/gifted
students.html.
"Response to Intervention." American Institutes for Research. 30 Nov 2008
<http://www.rti4success.org/index>.
Rossides, Daniel. (2004). “Knee-Jerk Formalism: Reforming American Education.”
The Journal of Higher Education, 75 (6), 667-703.
Rothstein, Richard. (2009). “Getting Accountability Right.” Education Week, 8 (19),
26, 36.
Rothstein, Richard, Jacobsen, Rebecca & Wilder, Tamara. (2006) "’Proficiency for All’
Is an Oxymoron.” Education Week, 26, 32 & 44.
Sahlberg, Pasi. (2008). “Rethinking Accountability in a Knowledge Society.” Journal
Of Educational Change, 11, 45-61.
Schachter, Ron. (2011). “District-level Downsizing.” District Administration, 47 (6), 29-33.
Scot, Tammy Pandina, Callahan, Carolyn, & Urquhart, Jill. (2009). “Paint-by-Number
Teachers and Cookie-Cutter Students: The Unintended Effects of High-Stakes
Testing on the Education of Gifted Students.” Roeper Review, 31 (1), 40-52.
Siegel, Harvey. (2004). “High stakes testing, educational aims and ideals, and responsible
Assessment.” Theory and Research in Education, 2 (3), 219-233.
Siemer, Elizabeth. (2009). “Bored Out of Their Minds: The Detrimental Effects of No Child
Left Behind on Gifted Children.” Journal of Law and Policy, 30, 539-560.
Sloane, F. & Kelly, A. (2003). “Issues in High-Stakes Testing Programs.” Theory Into
Practice, 42 (1), 12-17.
Springer, Matthew. (2008). “Accountability Incentives: Do Schools Practice Educational
Triage?” Education Next, 8 (1), 74-79.
Stanley, Gregory Kent & Baines, Lawrence. (2002). “Celebrating Mediocrity? How
Schools Shortchange Gifted Students.” Roeper Review, 25 (1), 11-13.

67
Stecher, Brian & Klein, Stephen. (1997). “The Cost of Science Performance Assessments
In Large-Scale Testing Programs.” Educational Evaluation and Policy Analysis, 19
(1), 1-14.
Sternberg, Robert J. (1996). “Equal Protection Under the Law: What is Missing in
Education.” Psychology, Public Policy, and Law, 2 (3/4), 575-583.
Stover, Del. (2007). "The Big Fixes Now Needed for "No Child Left Behind."
Education Digest , 7, 4-11.
Strike, Kenneth. (1985). “Is There a Conflict Between Equity and Excellence?”
Educational Evaluation and Policy Analysis, 7 (4), 409-416.
Supovitz, Jonathan. (2009). “Can High Stakes Testing Leverage Educational Improvement?
Prospects from the Last Decade of Testing and Accountability Reform.” Journal of
Educational Change, 10, 211-227.
Taylor, William L. (2001). “Assessment as a Means to a Quality Education.” Georgetown
Journal on Poverty Law & Policy, retrieved on 10/20/2011.
Tomlinson, Carol Ann. (2003). Differentiation in Practice K-5: A Resource Guide for
Differentiating Curriculum. VA: ASCD.
Topol, B., Olson, J., & Roeber, E. (2010). The Cost of New Higher Quality Assessments:
A Comprehensive Analysis of the Potential Costs for Future State Assessments.
Stanford, CA: Stanford University, Stanford Center for Opportunity Policy in Education.
Tuerk, Peter. (2005). “Research in the High-Stakes Era.” Psychological Science, 16, (6),
419-425.
Viadero, Debra. (2007). "Study: Low, High Fliers Gain Less Under NCLB." Education
Week 26, 7.
Viadero, Debra. (2008). “Black-White Gap Widens Faster for High Achievers.”
Education Week 27 (33), 12-13.
Viggiano, Dawn. (2005). "No Child Gets Ahead: The Irony of the No Child Left Behind
Act.” Capital University Law Review, 34, 485-516.
Ward, Cynthia V. (2008). “Giftedness, Disadvantage, and Law.” Journal of Education
Finance, 31 (1), 45-64.
Wyner, Joshua, Bridgeland, John, & Diulio, John. (2007).“Achievement Trap: How America is
Failing Millions of High-Achieving Students from Lower-Income Families.” Jack Kent
Cooke Foundation.

68
Xiang, Yun, Dahlin, Michael, Cronin, John, Theaker, Robert, & Durant, Sarah. (2011). “Do
High Flyers Maintain Their Altitude?” Washington, DC: Thomas Fordham Institute.

69
Appendix 1
District Approval

70
Appendix 2
Interview Protocol
Interview Questions for Teachers
1. What is your teaching background? Would you please describe your teaching
experiences? Currently, what level are you teaching?
2. Imagine if you will two students—one of those students struggles in every element of
classwork, and one of those students seems to have no trouble in any class work. Please
describe each of those students to me.
a. How do you know about the struggles and ease for each of those students?
b. What’s the ideal (no limitations) way to respond to the needs of both students
effectively?
c. What kind of challenges do you think would arise if you were to implement
this/these approach(es)?
d. What choices do you see yourself having to make in teaching? Why? Does that
cause you to feel any sort of stress?
3. You’ve been a teacher for (5, 10, 15, 20) years. What has changed for you in the
profession since you started teaching? Do you view these changes as positive or
negative? Why? Would you please give specific examples?
Interview Questions for Staff Development Director
1. What is the process for determining what professional development courses are offered
each year? District driven? Staff driven? State driven?
2. In a given year, about how many professional development sessions are offered? How
many of those have a gifted education focus?
3. What are the ways the district is able to provide professional development?
4. Are there “trends” or “waves” of staff development offerings? Are there any specific
examples? Based on your experience and the current focuses of the district, are you able
to make predictions about certain topics that will be popular staff development offerings?

71
5. May I have a copy of the records/catalogs of staff development offerings for the district
for the last 20 years?
Interview for Gifted Education Teachers
1. What do Enhanced Learning (EL) and SEEK provide for gifted students?
2. Are there ways in which you collaborate with general education teachers? What are some
specific examples of this?
3. Imagine if you will two a typical gifted student. Please describe that student to me.
a. What’s the ideal (no limitations) way to respond to the needs of that student
effectively?
b. What kind of challenges do you think would arise if you were to implement
this/these approach(es)?
c. What choices do you see yourself having to make in teaching? Why? Does that
cause you to feel any sort of stress?
4. You’ve been a gifted teacher for (5, 10, 15, 20) years. What has changed for you in the
profession since you started teaching? Do you view these changes as positive or
negative? Why? Would you please give specific examples?

72
Appendix 3
Interview Matrices
Interviewees Questions What will be
Addressed
General
Education
Teachers
Imagine if you will two students—one of those students struggles
in every element of classwork, and one of those students seems to
have no trouble in any class work. Please describe each of those
students to me.
How do you know about the struggles and ease for each of those
students?
What’s the ideal (no limitations) way to respond to the needs of
both students effectively?
What kind of challenges do you think would arise if you were to
implement this/these approach(es)?
What choices do you see yourself having to make in teaching?
Why? Does that cause you to feel any sort of stress?
You’ve been a teacher for (5, 10, 15, 20) years. What has changed
for you in the profession since you started teaching? Do you view
these changes as positive or negative? Why? Would you please
give specific examples?
Curriculum
narrowing
High-stakes
testing
Reallocation
of limited
resources
Gifted
Education
Teachers
What does Enhanced Learning (EL), SEEK provide for gifted
students?
Are there ways in which you collaborate with general education
teachers? What are some specific examples of this?
Imagine if you will two a typical gifted student. Please describe
that student to me.
- What’s the ideal (no limitations) way to respond to the needs of
that student effectively?
-What kind of challenges do you think would arise if you were to
implement this/these approach(es)?
-What choices do you see yourself having to make in teaching?
Curriculum
narrowing
High-stakes
testing
Reallocation
of resources

73
Why? Does that cause you to feel any sort of stress?
You’ve been a gifted teacher for (5, 10, 15, 20) years. What has
changed for you in the profession since you started teaching? Do
you view these changes as positive or negative? Why? Would you
please give specific examples?
Director of
Staff
Development
What is the process for determining what professional
development courses are offered each year? District driven? Staff
driven? State driven?
In a given year, about how many professional development
sessions are offered? How many of those have a gifted education
focus?
What are the ways the district is able to provide professional
development?
Are there “trends” or “waves” of staff development offerings? Are
there any specific examples? Based on your experience and the
current focuses of the district, are you able to make predictions
about certain topics that will be popular staff development
offerings?
High-stakes
testing
Reallocation
of resources

74
Appendix 4
Archival Data Matrix
Archival Data Questions Addressed
Current and past budgets for
the district
Has the funding for programs related to gifted education been
cut over time? If so, what programs have been cut? Is there a
simultaneous increase in programs aimed toward under-
performing students?
Staff development catalogs Has the district provided training for working with gifted
students in a general education setting? If so, how many
courses have been offered? How does that compare to staff
development offered to address under-performing students?

75
Figure 1: Relationships between Gifted Students and Effects of NCLB
narrow curriculum
high stakes testing
the gifted student
less resources
Current economic crises in districts
across the country along with NCLB
mandates have forced many districts to
re-allocate resource towards low
performing student groups and away
from high performing students.
Curriculum narrowing is a potentially
negative result of the pressure for high
stakes testing, because the test may not
be written at a level that challenges
gifted students.
Implementing a quality high-stakes assessment costs millions of
dollars. States pick up most of the costs of these assessments which
results in less available money for programs that might otherwise be
funded, such as programs for the gifted.

76
Figure 2: Federal Funding for Gifted Education 1996-2012
Federal Appropriation for Javits Gifted and Talented Education
* Sources: Mind the Other Gap! and ed.gov
0
2
4
6
8
10
12
19
96
19
97
19
98
19
99
20
00
20
01
20
02
20
03
20
05
20
06
20
07
20
08
20
09
20
10
20
11
20
12
Ap
pro
pri
atio
n in
Mill
ion
s o
f D
olla
rs
Years
Proposed by President
AppropriatedN
CL
B E
nac
ted

77
Figure 3: District Funding for Special Education 1995-2012
FY Total
Enrollment
Total
Expend.
Per Pupil
Expend.
Total SPED
Enrollment
%
SPED
SPED
Expend.
% of
Total
Expend.
SPED
Per
Pupil
1995 31,999 $ 186,498,847 $ 5,828 3,504 10.9 $ 23,265,123 12.4 $ 6,640
1996 31,844 $ 189,043,345 $ 5,937 3,350 10.5 $ 24,300,014 12.8 $ 7,254
1997 31,634 $ 189,261,407 $ 5,953 3,267 10.3 $ 24,981,312 13.1 $ 7,647
1998 31,795 $ 200,224,440 $ 6,297 3,442 10.8 $ 25,727,399 12.8 $ 7,475
1999 31,562 $ 208,705,259 $ 6,613 3,241 10.2 $ 27,179,974 13.0 $ 8,386
2000 30,337 $ 216,523,699 $ 7,137 3,204 10.5 $ 29,399,009 13.5 $ 9,176
2001 30,110 $ 220,775,118 $ 7,322 3,274 10.8 $ 30,562,527 13.8 $ 9,335
2002 29,257 $ 229,770,965 $ 7,853 3313 11.3 $ 31,651,675 13.7 $ 9,553
2003 28,734 $ 229,154,970 $ 7,975 3394 11.8 $ 34,502,969 15.0 $ 10,166
2004 28,219 $ 230,721,223 $ 8,176 3379 11.9 $ 35,339,153 15.3 $ 10,458
2005 27,875 $ 249,132,116 $ 8,938 3443 12.3 $ 35,463,391 14.2 $ 13,300
2006 27,421 $ 266,011,553 $ 9,701 3397 12.3 $ 38,480,967 14.4 $ 11,328
2007 27,353 $ 296,187,436 $ 10,828 3311 12 $ 42,195,174 14.2 $ 12,744
2008 27,013 $ 320,436,629 $ 11,862 3120 11.5 $ 45,278,698 14.1 $ 14,512
2009 26,579 $ 323,574,001 $ 12,174 3086 11.6 $ 46,148,281 14.2 $ 14,954
2010 26,548 $ 334,861,743 $ 12,613 3021 11.3 $ 45,629,389 13.6 $ 15,104
2011 26,653 $ 314,962,366 $ 11,817 3003 11.2 $ 44,025,981 13.9 $ 14,661
2012 26,545 $ 328,335,730 $ 12,374 3700 13.9 $ 41,937,588 12.7 $ 11,334

78
Figure 4: District Funding for Gifted Education 1995-2012
* shaded area means district did not keep records of data
FY Total
Enrollment
Total
Expend.
Per Pupil
Expend.
Total Gifted
Enrollment
%
Gifted
Gifted
Expend.
% of
Total
Expend.
Gifted
Per
Pupil
1995 31,999 $ 186,498,847 $ 5,828
1996 31,844 $ 189,043,345 $ 5,937
1997 31,634 $ 189,261,407 $ 5,953
1998 31,795 $ 200,224,440 $ 6,297
1999 31,562 $ 208,705,259 $ 6,613
2000 30,337 $ 216,523,699 $ 7,137
2001 30,110 $ 220,775,118 $ 7,322
2002 29,257 $ 229,770,965 $ 7,853 1639 0.056 $ 1,853,470 0.008 $1,131
2003 28,734 $ 229,154,970 $ 7,975 1595 0.055 $ 1,787,957 0.008 $ 1,121
2004 28,219 $ 230,721,223 $ 8,176 1592 0.056 $ 2,026,915 0.009 $ 1,273
2005 27,875 $ 249,132,116 $ 8,938 1575 0.056 $ 2,038,986 0.008 $ 1,295
2006 27,421 $ 266,011,553 $ 9,701 1505 0.054 $ 2,461,394 0.009 $ 1,635
2007 27,353 $ 296,187,436 $ 10,828 1498 0.054 $ 2,329,715 0.008 $ 1,555
2008 27,013 $ 320,436,629 $ 11,862 1512 0.055 $ 2,465,620 0.008 $ 1,631
2009 26,579 $ 323,574,001 $ 12,174 1527 0.057 $ 2,616,000 0.008 $ 1,713
2010 26,548 $ 334,861,743 $ 12,613 1549 0.058 $ 2, 178,000 0.007 $ 1,406
2011 26,653 $ 314,962,366 $ 11,817 1557 0.058 $ 2,109,000 0.007 $ 1,355
2012 26,545 $ 328,335,730 $ 12,374 1600 0.06 $ 1,623,000 0.005 $ 1,014

79
0
1
2
3
4
5
6
7
2005-6 2006-7 2007-8 2008-9 2009-10 2010-11 2011-12
Nu
mb
er
of
Off
eri
ngs
in t
he
Hu
nd
red
s
School Year
Total
SPED
Gifted
Testing
Figure 5: District Professional Development Offerings 2005-2013

80
Table 1: Changes in Instructional Time in Elementary Schools Since 2001-02
*sample size too small Table adapted from Instructional Time in Elementary Schools A Closer Look at Changes for Specific Subjects (McMurrer, 2008)
Subject or Period
Percentage of
All Districts
that Increased
Time
Percentage of
All Districts
that Decreased
Time
Average
Increase
(Minutes per
Week)
Average
Decrease
(Minutes per
Week)
English Language Arts 58% 141
Mathematics 45% 89
Social Studies 36% 76
Science 28% 75
Art and Music 16% 57
Recess 20% 50
Physical Education 9% 40
Lunch 5% *

81
Table 2: Academic Gains in NAEP Pre/Post NCLB, 10th
and 90th
Percentiles
Annual Point Gains by the 10th
percentile Annual Point Gains by the 90th
percentile
Grade/Subject Pre-NCLB Post-NCLB Grade/Subject Pre-NCLB Post-NCLB
Math- 4th
grade 1.3 2.6
Math- 4th
grade 1.2 1.4
Reading- 4th
grade -1.4 2.3
Reading- 4th
grade 0.1 0.4
Math- 8th
grade 0.7 1.9
Math- 8th
grade 1.3 0.7
Reading- 8th
grade 0.8 -0.6
Reading- 8th
grade 0.1 0.0
Average of
grade/subjects
combined
0.35 1.55
Average of
grade/subjects
combined
0.675 0.625
*source: High Achieving Students in the Era of NCLB (Loveless, Farkas & Duffet, 2008)

82
Table 3: Do High Flyers Maintain Their Altitude?
*Source: Do High Flyers Maintain Their Altitude? (Xiang et al, 2011)
42.7 44.1
30.1
47.6
57.3 55.9
69.9
52.4
0
10
20
30
40
50
60
70
80
90
100
Elementary/MiddleSchool Math
Elementary/MiddleSchool Reading
Middle/High SchoolMath
Middle/High SchoolReading
Pe
rce
nta
ge o
f St
ud
en
ts
Cohort
High Flyers
Descenders

83
Table 4: Projected Costs of Administering High Quality Assessments
* Table adapted from The Cost of New Higher Quality Assessments (Topol & Roeber, 2010)
Assessment Type Year 0 Year 1 Year 2 Year 3 Total
Cost per
pupil
Cost per
State
Single-state cost
(standard
assessment)
$3,936,258 $16,633,386 $15,566,449 $16,189,107 $52,325,199 $19.93
Single-state cost
(high-quality
assessment)
$7,813,641 $45,562,943 $45,473,513 $47,292,454 146,142,551 $55.67
10-state assessment $7,255,524 $220,534,504 $127,580,504 $236,68,724 $692,054,256
$42.41
$69,205,426
20-state $10,865,234 $422,821,426 $438,008,219 $455,528,548 $1,327,223,427
$40.;66
$66,361,171
30-state $14,109,627 $605,517,274 $628,080,944 $653,204,182 $1,900,912,027
$38.33
$63,363,734

84
Table 5: Demographics of District Studied
District State
Enrollment 27,876 511,258
Average Attendance Rate 96% 95%
Demographics District State
White Students 67% 69%
Hispanic Students 15% 16%
African-American
Students 8% 7%
Other Classification 9% 4%
Free/Reduced Status 33% 47%
Students with Disabilities 10% 14%
Graduation Rate 88% 81%
Drop Out Rate 1% 1%

85
Table 6: Teacher Demographics
Shaded areas represent a “new” teacher with a hiring date after NCLB enactment
Teachers Years of Experience
Teacher A- Elementary General Education 23
Teacher B- Elementary General Education 10
Teacher C- Elementary General Education 11
Teacher D- Elementary General Education 12
Teacher E- Elementary General Education 29
Teacher F- Secondary General Education 10
Teacher G- Secondary General Education 5
Teacher H- Secondary General Education 30
Teacher I- Secondary General Education 21
Teacher J- Secondary General Education 14
Teacher K- Elementary Gifted Education 35
Teacher M- Elementary Gifted Education 23
Teacher N- Elementary Gifted Education 15
Teacher O- Elementary Gifted Education 10
Teacher P- Elementary Gifted Education 40
Teacher Q- Secondary Gifted Education 40
Teacher R- Secondary Gifted Education 10
Teacher S- Secondary Gifted Education 12
Teacher T- Secondary Gifted Education 33
Teacher U- Secondary Gifted Education 8
86
Table 7: Teacher Survey Results
Q1. Please rank the following choices (1=very, 3= somewhat, 5=not at all) about resources and
how gifted children are affected in your classroom:
1=very 3=somewhat 5=very little/not at all
not enough instructional
time to teach 26.92% 59.62% 13.46%
not enough money for
supplies and materials 29.41% 45.1% 25.49%
not enough staff
development on how to
meet needs of gifted
students in the general
classroom
40.38% 42.31% 17.31%
not enough
paraprofessional/aide
support
43.14% 33.33% 23.53%
not enough planning
time 51.92% 40.38% 7.69%
Q2. Please rank the following choices (1=very, 3= somewhat, 5=not at all) about curriculum and
how gifted children are affected in your classroom:
1=very 3=somewhat 5=very little/not at all
less instructional time
in "non-tested" subjects 29.41% 54.09% 15.69%
traditional curriculum
(pre-Common Core) is
an "inch wide and a
mile deep"
41.18% 47.06% 11.76%
traditional curriculum
(pre-Common Core) is
a "one size fits all" with
not enough
differentiation
40.38% 50.0% 9.62%
less creative learning
opportunities in which
students participate
55.77% 32.69% 11.54%
transition to Common
Core standards 19.23% 69.23% 11.54%
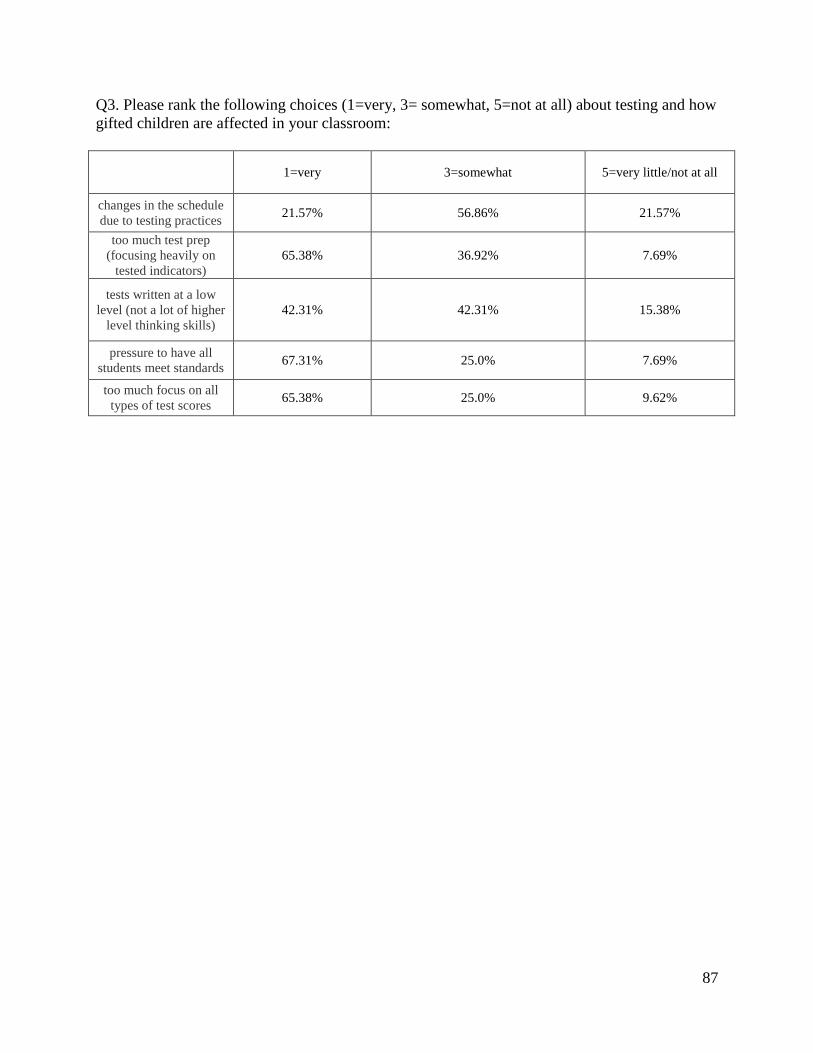
87
Q3. Please rank the following choices (1=very, 3= somewhat, 5=not at all) about testing and how
gifted children are affected in your classroom:
1=very 3=somewhat 5=very little/not at all
changes in the schedule
due to testing practices 21.57% 56.86% 21.57%
too much test prep
(focusing heavily on
tested indicators)
65.38% 36.92% 7.69%
tests written at a low
level (not a lot of higher
level thinking skills)
42.31% 42.31% 15.38%
pressure to have all
students meet standards 67.31% 25.0% 7.69%
too much focus on all
types of test scores 65.38% 25.0% 9.62%
