the implications for the real sector and the long-run growth prospects of see francesco contesso...
TRANSCRIPT

The implications for the real The implications for the real
sector and the long-run sector and the long-run
growth prospects of SEEgrowth prospects of SEEFrancesco CONTESSOFrancesco CONTESSO
AdvisorAdvisor
European CommissionEuropean CommissionDG Economic and Financial AffairsDG Economic and Financial Affairs
Directorate D: International economic and financial relations, global governanceDirectorate D: International economic and financial relations, global governance
33rdrd Bank of Greece Workshop on the Economies of Bank of Greece Workshop on the Economies of Eastern European and Mediterranean Countries Eastern European and Mediterranean Countries
Athens, 18 May 2012
11

OutlineOutline1. WB’s recovery from the 2008 financial crisis
2. The importance of the EU market for the WB
3. The impact of the euro-area sovereign debt crisis
4. Prospects and conclusions
2
1. WB’s recovery from the 2008 financial crisis
3

Pre-crisis growthpatterns (2000-2008)
1. High real GDP growth (5-7% on average)…2. …boosted by strong credit growth and domestic
demand as well as pro-cyclical fiscal policies…3. …with strong reliance on external public and
private financing, both in the form of FDI and foreign debt...
4. …leading to high domestic and external imbalances (large trade and current account deficits)…
5. …and strong investment growth in the non-tradable sectors rather than in tradables.
4
Vulnerabilities and crisis impact High dependence on foreign financing made
countries vulnerable to risk of reversal crisis led to lower capital inflows and
slowing credit activity and deleveraging Foreign savings were mainly used to finance
domestic consumption smoothing crisis led to sharp falls in domestic
demand Capital allocation biased towards non-tradable
sector (construction, retail, financial sector) crisis led to sharp real sector adjustments
and output losses
5
Impact of 2008 crisis and recoveryImpact of 2008 crisis and recovery……
Uneven impact across the countries…
Three main channels:
Trade External financing Remittances
Relevance of EU integration?
GDP (annual growth rates)
-6
-2
2
6
10
14
2006 2007 2008 2009 2010 2011
HR FYROM ME SR
%
GDP (annual growth rates)
-3
0
3
6
9
2006 2007 2008 2009 2010 2011
AL BH KS
%
6
Economic linkages of WB with EU (1)Economic linkages of WB with EU (1)
High degree of trade integration, but differences across countries
Remittances play a particular role in many countries
International trade in goods with the EU, 2010(% share in total country exports and imports)
0
20
40
60
80
AL BH FYROM HR KS ME SR
Exports Imports
%
Remittances, 2010(in per cent of GDP)
0
5
10
15
20
AL BH FYROM HR KS ME SR
%
7

Economic linkages of WB with EU (2)Economic linkages of WB with EU (2)
Strong financial integration
Foreign ownership Important for stable
financial sectorBut potential funding
risks (not part of this presentation)
Share of EU in total FDI stock(2007-2010)
0
20
40
60
80
100
AL FYROM HR KS ME SR
%
8

3. The impact of the euro-area sovereign debt crisis
9

First signs of adverse impact on real output…First signs of adverse impact on real output…
Deceleration of growth since the second half of 2011
Croatia remains in recession
GDP growth (% change, yoy)
-10
-5
0
5
10
2008 2009 2010 2011
HR FYROM SR EA
%
10

……exports on a downward trend…exports on a downward trend…
All countries in the region experience drop in exports
Clearly indicating loss in external demand
Only partly “price”-driven
Exports of goods (Jan 2008=100 index)
50
75
100
125
150
2008 2009 2010 2011 2012
0
100
200
300
400HR FYROMSR ME, r.sc.
Exports of goods (Jan 2008=100 index)
30
65
100
135
170
205
2008 2009 2010 2011 2012
AL BH KS
11

……imports still not affected much…imports still not affected much…
Imports have been stable throughout 2011
Partly driven by peaks in commodity prices in the first half
…and domestic demand
Imports of goods (Jan 2008=100 index)
20
60
100
140
2008 2009 2010 2011 2012
HR FYROM SR ME
Imports of goods (Jan 2008=100 index)
50
75
100
2008 2009 2010 2011 2012
AL BH KS
12

……industrial production is falling …industrial production is falling …Industrial Production (Jan 2008=100 index)
40
70
100
130
2008 2009 2010 2011 2012
HR FYROM ME*
* Only manufacturing
Industrial Production (Jan 2008=100 index)
70
85
100
115
2008 2009 2010 2011 2012
BH SR
Sharp drop of industrial production by the end of 2011
Most affected countries:BH, FYROM, SR
HR rather stable In all countries,
industrial production is below pre-crisis levels
13

……employment growth turns negative in employment growth turns negative in some countries…some countries…
Employment growth (% change, yoy)
-10
-5
0
5
10
2008 2009 2010 2011
AL BH SR
%
Employment growth (% change, yoy)
-12
-8
-4
0
4
8
2008 2009 2010 2011
FYROM ME HR
%
In HR and SR, employment declines since 2009
In most other countries, employment declines in 2009-2010
Temporary recovery in 2011
Again deterioration in late 2011 and 2012
14

4. Prospects and conclusions
15
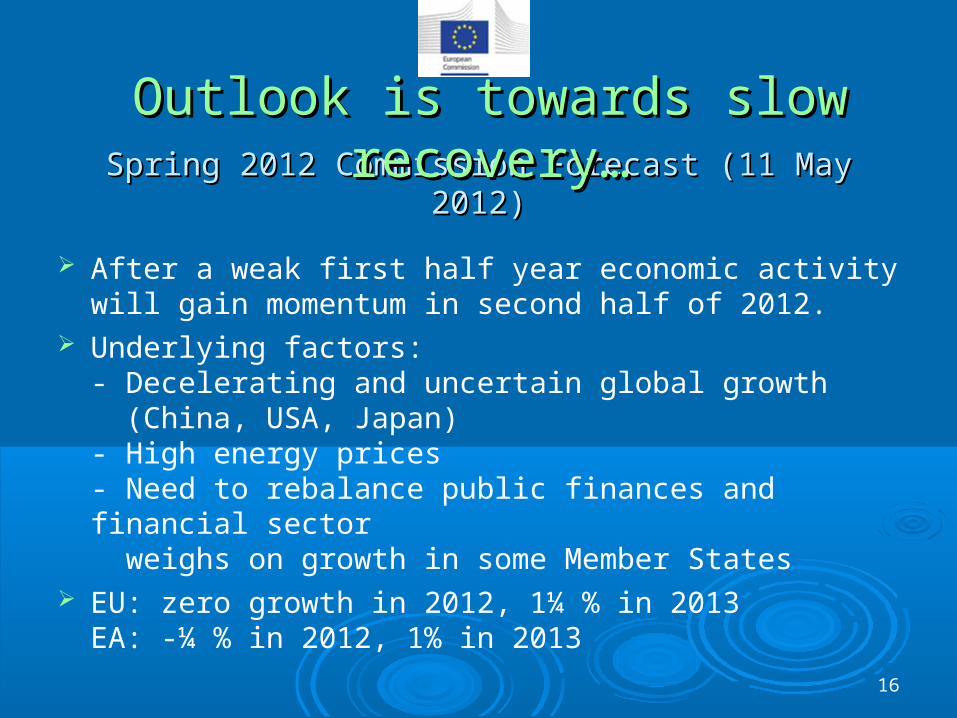
Spring 2012 Commission Forecast (11 May 2012)Spring 2012 Commission Forecast (11 May 2012)
Outlook is towards slow recovery…Outlook is towards slow recovery…
After a weak first half year economic activity will gain momentum in second half of 2012.
Underlying factors: - Decelerating and uncertain global growth (China, USA, Japan)- High energy prices- Need to rebalance public finances and financial sector weighs on growth in some Member States
EU: zero growth in 2012, 1¼ % in 2013EA: -¼ % in 2012, 1% in 2013
16
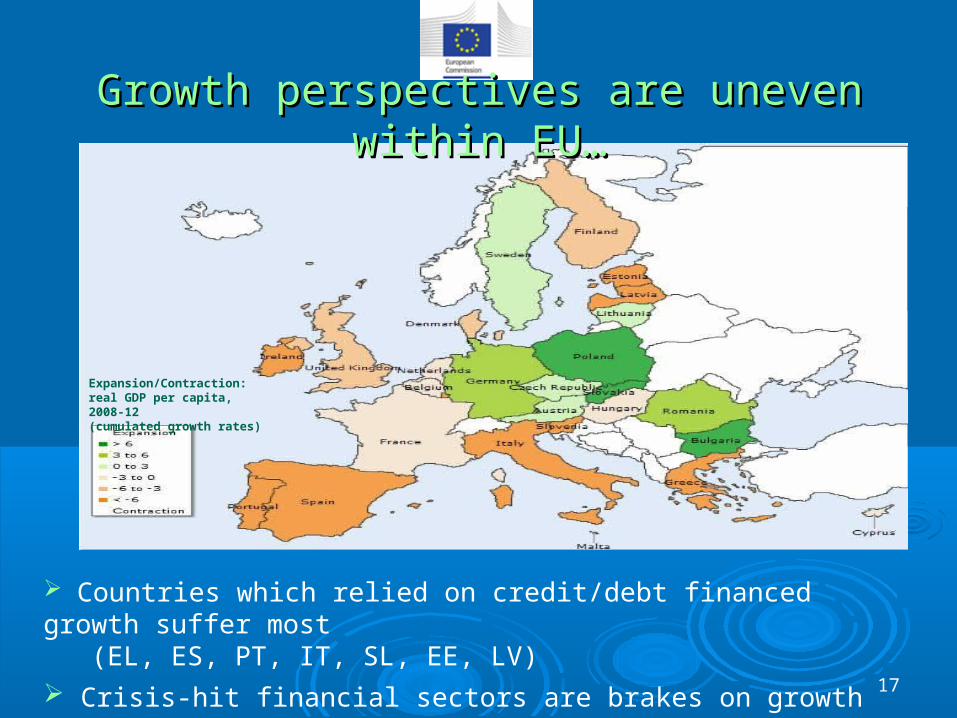
Growth perspectives are uneven within EU…Growth perspectives are uneven within EU…
Countries which relied on credit/debt financed growth suffer most (EL, ES, PT, IT, SL, EE, LV) Crisis-hit financial sectors are brakes on growth (IR, UK, FI)
17
Expansion/Contraction:real GDP per capita, 2008-12(cumulated growth rates)

EU as trend setter for Western BalkanEU as trend setter for Western Balkan
In general, the Western Balkan countries follow growth profile of their main trading partner, the EU.
Main transmission mechanism: external demand, international (and domestic) financing conditions
Outlook for HR and SR is more pessimistic than for FYROM and ME
HR and SR have higher exposure to trading partners with low growth, are more dependant on foreign financing and suffer from delayed reforms
18
Unemployment rates
10.0
15.0
20.0
25.0
30.0
35.0
2010 2011 2012 2013
% of GDP
Croatia
The former Yugos lav Republ ic of Macedonia
Montenegro
Serbia
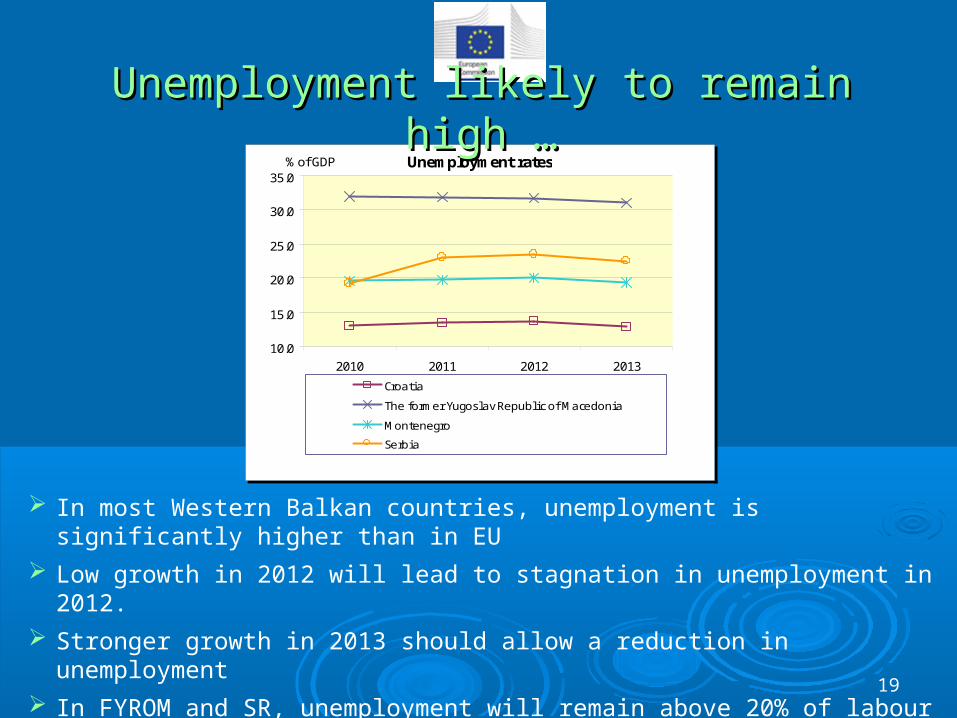
Unemployment likely to remain high …Unemployment likely to remain high …
In most Western Balkan countries, unemployment is significantly higher than in EU
Low growth in 2012 will lead to stagnation in unemployment in 2012.
Stronger growth in 2013 should allow a reduction in unemployment
In FYROM and SR, unemployment will remain above 20% of labour force
High unemployment reflects structural weaknesses and high informal sector19

External imbalances persist …External imbalances persist …
Overall, external imbalances are likely to remain. Lower export growth is largely offset by lower domestic demand (low wage growth, restrained investment)
In ME and Serbia, current account deficits are expected to remain high Financing depends largely on FDI inflows and transfers
In FYROM and HR, current account deficits are likely to increase slightly, but will remain below 5% of GDP
Current Account Balances
-30.0
-25.0
-20.0
-15.0
-10.0
-5.0
0.0
2010 2011 2012 2013
% of GDP
Croatia
The former Yugos lav Republ ic of Macedonia
Montenegro
Serbia
20
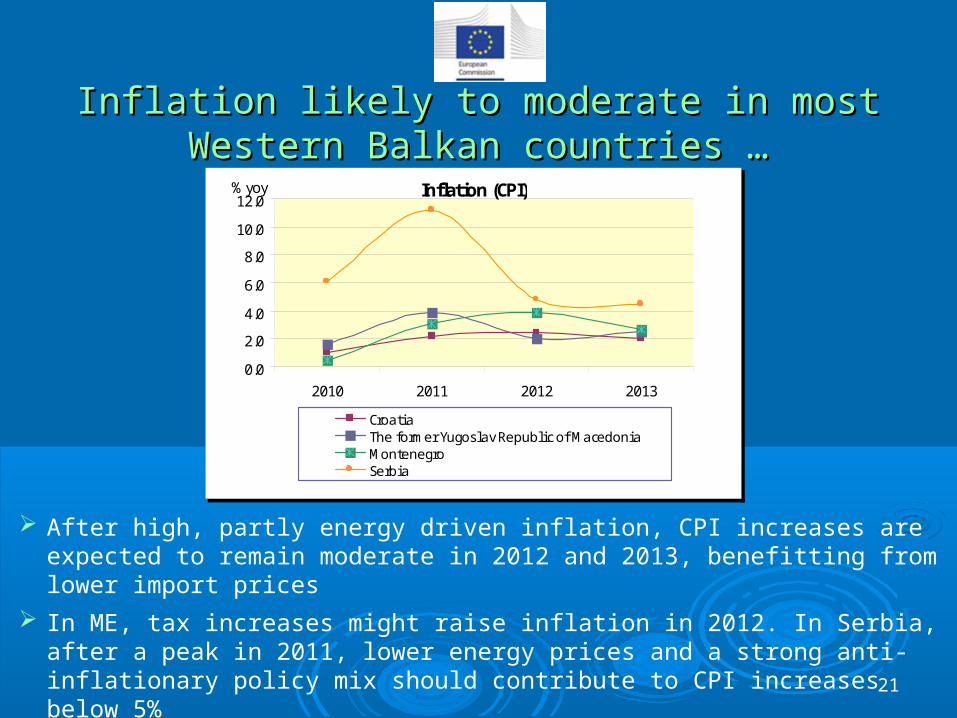
Inflation likely to moderate in most Western Balkan Inflation likely to moderate in most Western Balkan countries …countries …
After high, partly energy driven inflation, CPI increases are expected to remain moderate in 2012 and 2013, benefitting from lower import prices
In ME, tax increases might raise inflation in 2012. In Serbia, after a peak in 2011, lower energy prices and a strong anti-inflationary policy mix should contribute to CPI increases below 5%
Inflation (CPI)
0.0
2.0
4.0
6.0
8.0
10.0
12.0
2010 2011 2012 2013
% yoy
CroatiaThe former Yugos lav Republ ic of MacedoniaMontenegroSerbia
21

Public finances under pressure …Public finances under pressure …
In HR and SR, weak economic growth and a rigid spending structure are likely to keep deficits close to -5% of GDP.
In FYROM, the government is expected to maintain its low deficit approach.
In ME, the authorities have announced a deficit reduction strategy, which should bring the deficit below 2% in 2013.
Public Sector Deficits
-6.0
-5.0
-4.0
-3.0
-2.0
-1.0
0.0
2010 2011 2012 2013
% yoy
CroatiaThe former Yugos lav Republ ic of MacedoniaMontenegroSerbia
22

Public debt likely to increase …Public debt likely to increase …
Low growth and persistent deficits are likely to raise debt levels.
In HR and SR, debt levels are approaching the 60% mark.
In ME, the policy of decreasing deficits should lead to a reduction in the debt ratio by 2013.
In FYROM, increased reliance on foreign credits will lead to a continued increse in the debt level.
Public Sector Debt
20.0
25.0
30.0
35.0
40.0
45.0
50.0
55.0
60.0
2010 2011 2012 2013
% of GDP
Croatia
The former Yugos lav Republ ic of MacedoniaMontenegro
Serbia
23

Prospects and conclusionsProspects and conclusions Main transmission mechanism of sovereign-debt crisis to Main transmission mechanism of sovereign-debt crisis to
the Western Balkan are lower exports and in particular the Western Balkan are lower exports and in particular more constrained access to (foreign) financing.more constrained access to (foreign) financing.
This puts in question the Western Balkan growth model, This puts in question the Western Balkan growth model, which strongly relied on foreign sources. which strongly relied on foreign sources.
The region’s growth potential is impeded by structural The region’s growth potential is impeded by structural weaknesses (labour market rigidities, low institutional weaknesses (labour market rigidities, low institutional capacities, weak rule-of-law, etc. negatively affecting capacities, weak rule-of-law, etc. negatively affecting business environment)business environment)
24
Prospects and conclusions (cont.)Prospects and conclusions (cont.)
Quality and sustainability of convergence requiresQuality and sustainability of convergence requiresSupply side structural reforms to attract (foreign) Supply side structural reforms to attract (foreign)
investment and increase productivityinvestment and increase productivityShift from non-tradable to tradable sectorsShift from non-tradable to tradable sectorsImprovement of public finances' qualityImprovement of public finances' quality
25

Thank you for your attentionThank you for your attention
26