the implementation of the ec water framework directive in norway eva skarbøvik and stig a. borgvang...
TRANSCRIPT
The implementation of the EC Water Framework Directive
in Norway
Eva Skarbøvik and Stig A. Borgvang
Norwegian Institute for Water Research (NIVA)
with contributions by Anne LycheSolheimed. Birger Bjerkeng )
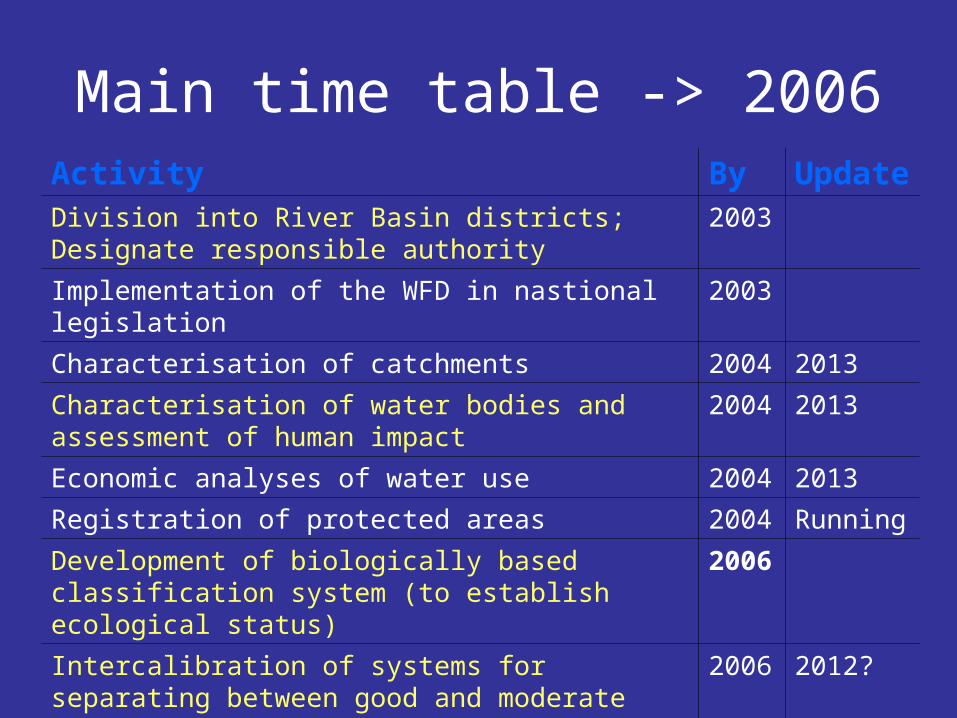
Activity By Update
Division into River Basin districts; Designate responsible authority
2003
Implementation of the WFD in nastional legislation
2003
Characterisation of catchments 2004
2013
Characterisation of water bodies and assessment of human impact
2004
2013
Economic analyses of water use 2004
2013
Registration of protected areas 2004
Running
Development of biologically based classification system (to establish ecological status)
2006
Intercalibration of systems for separating between good and moderate status
2006
2012?
Main time table -> 2006

Norwegian progress
• Designate responsible national authority – Ministry of Environment, 2004
• Division into river basin districts and regional river basin authorities, autumn 2005
• Characterise the water bodies of each river basin, good progress
• Find reference conditions,currently being done
• Surveillance programmes• Develop plans to achieve the good status
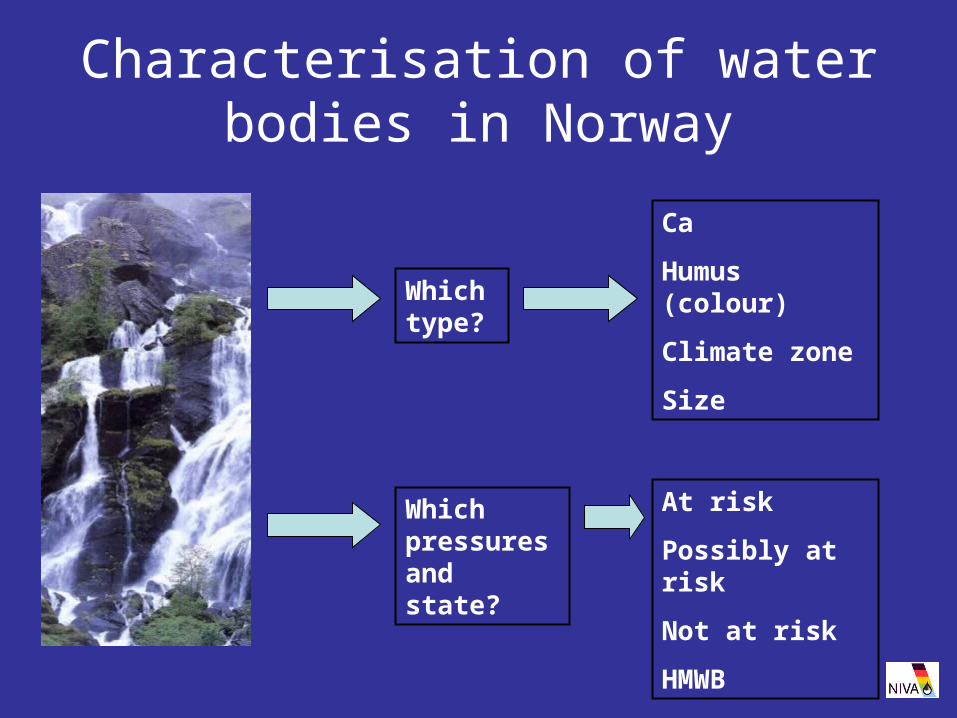
Characterisation of water bodies in Norway
Which type?
Ca
Humus (colour)
Climate zone
Size
Which pressures and state?
At risk
Possibly at risk
Not at risk
HMWB
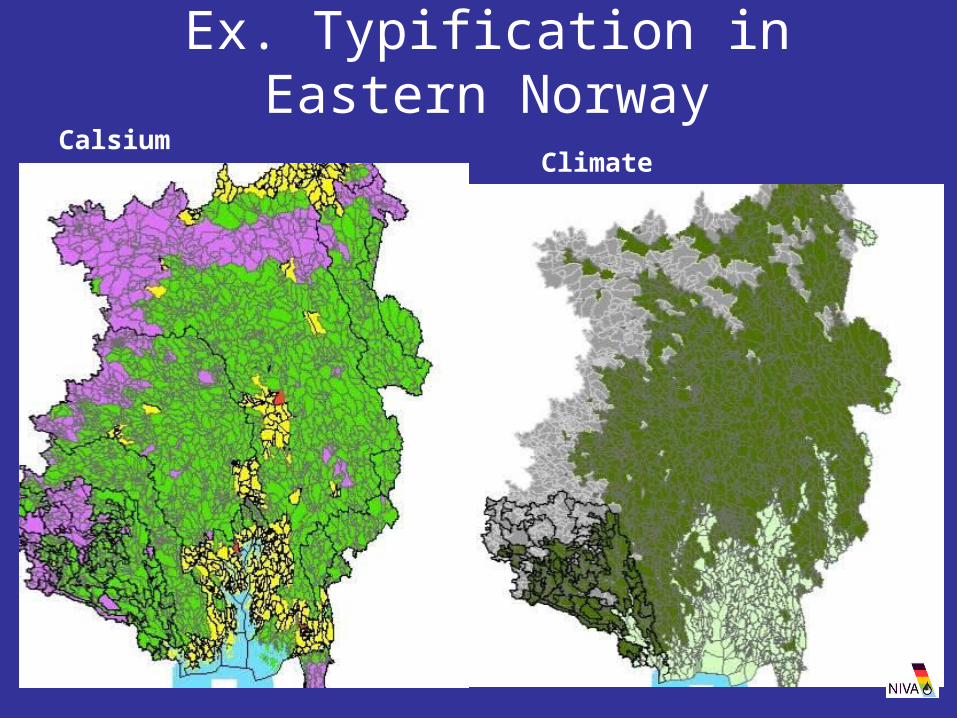
Ex. Typification in Eastern NorwayCalsium
Climate

HIGHHIGH
GOODGOOD
MODERATEMODERATE
POORPOOR
BADBAD
Ecological status is divided into
By 2015, all water bodies should have a ”good” status.
These will be water bodies AT RISK of not achieving a good status.
Norway has also made a group ”Possibly at risk”

Criteria for risk assessment
• Measurement data whenever they exist
• Otherwise pressure is used: – Extent of agricultural land– Urban areas– Industry, Mining activities– Sewage treatment plants and settlements not
covered by STP– Introduction of new species and loss of others
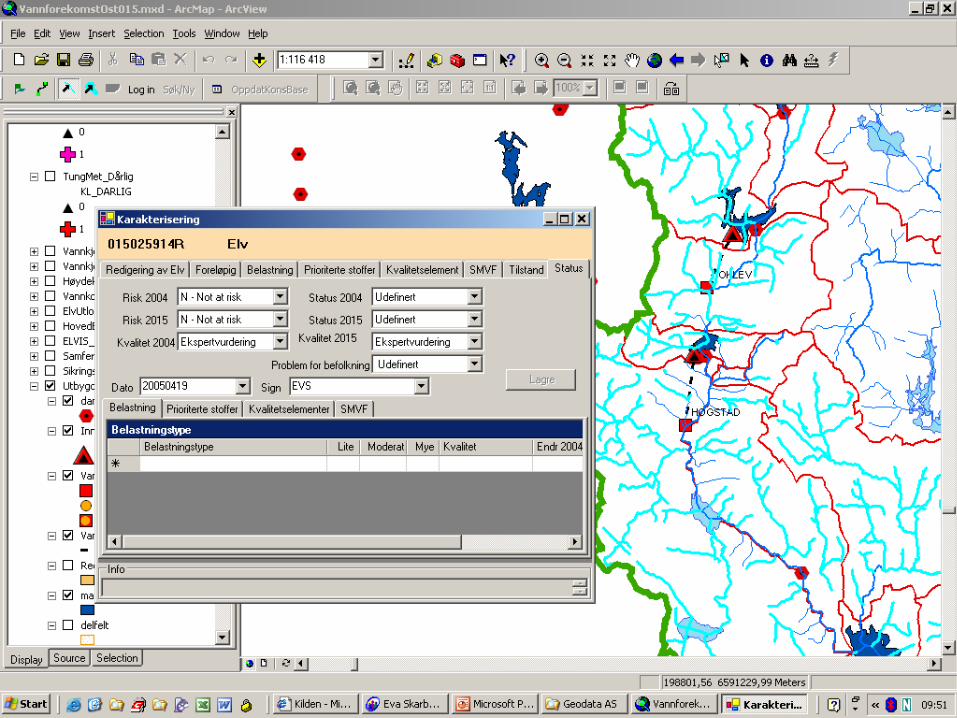
Development of a GIS-tool
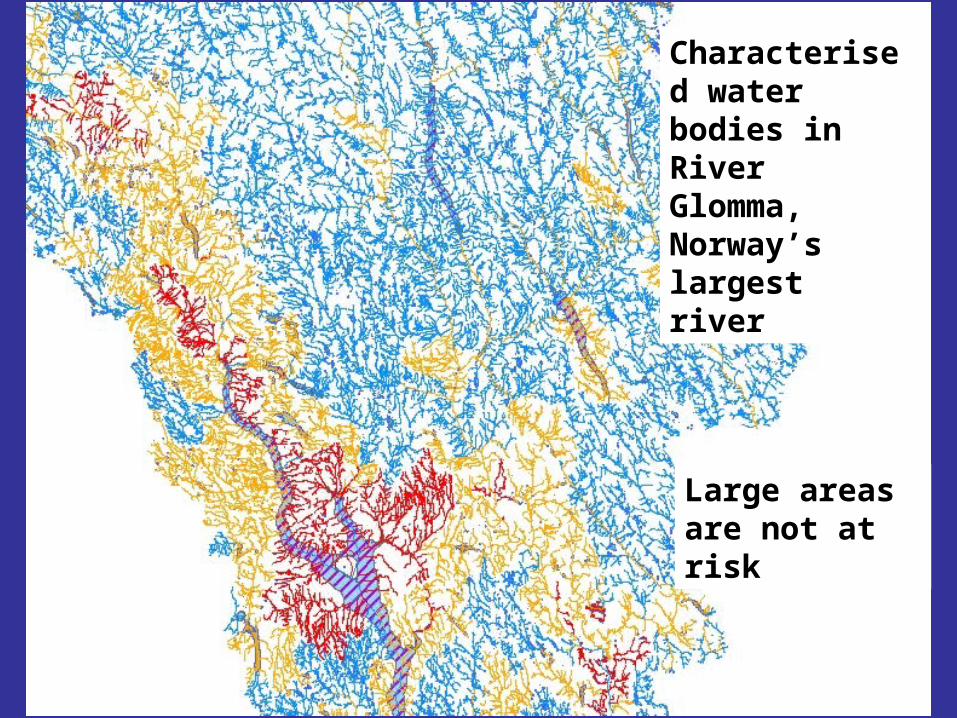
Characterised water bodies in River Glomma, Norway’s largest river
Large areas are not at risk
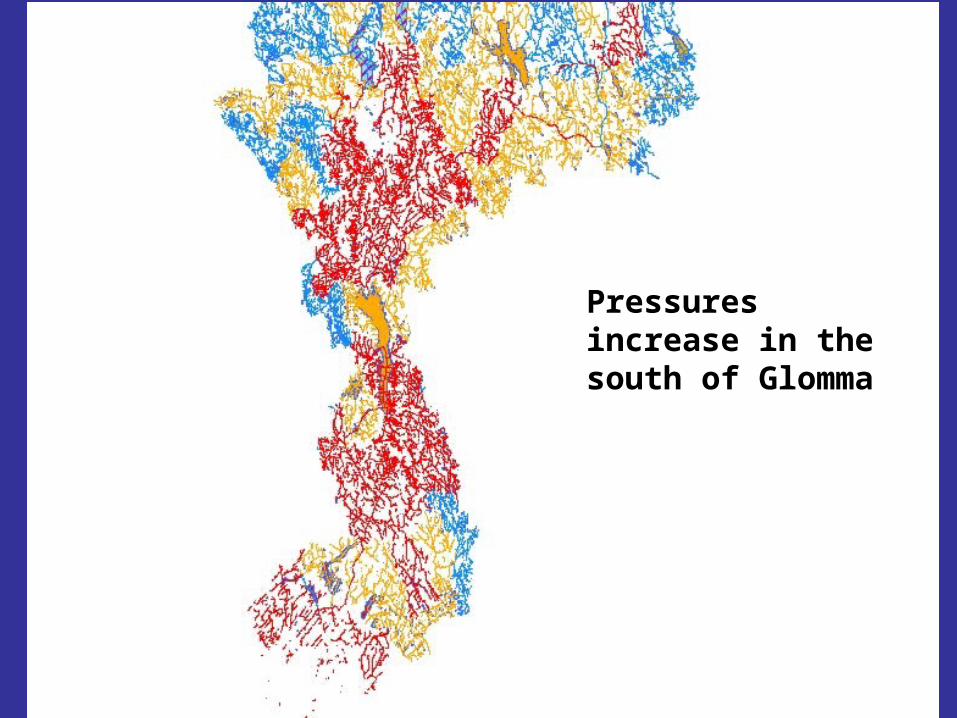
Pressures increase in the south of Glomma
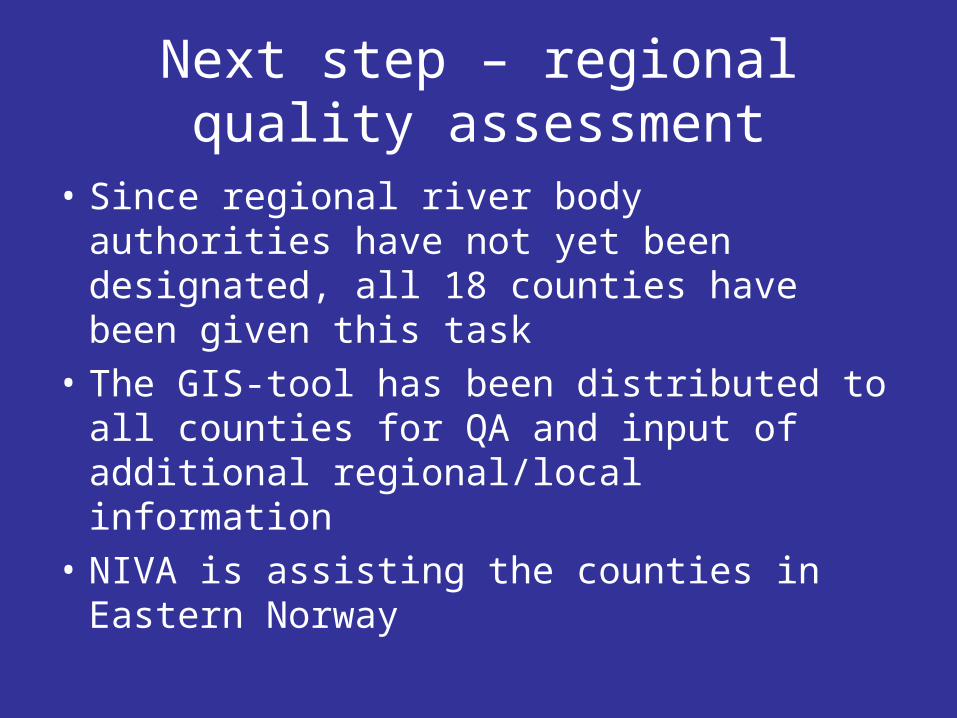
Next step – regional quality assessment
• Since regional river body authorities have not yet been designated, all 18 counties have been given this task
• The GIS-tool has been distributed to all counties for QA and input of additional regional/local information
• NIVA is assisting the counties in Eastern Norway
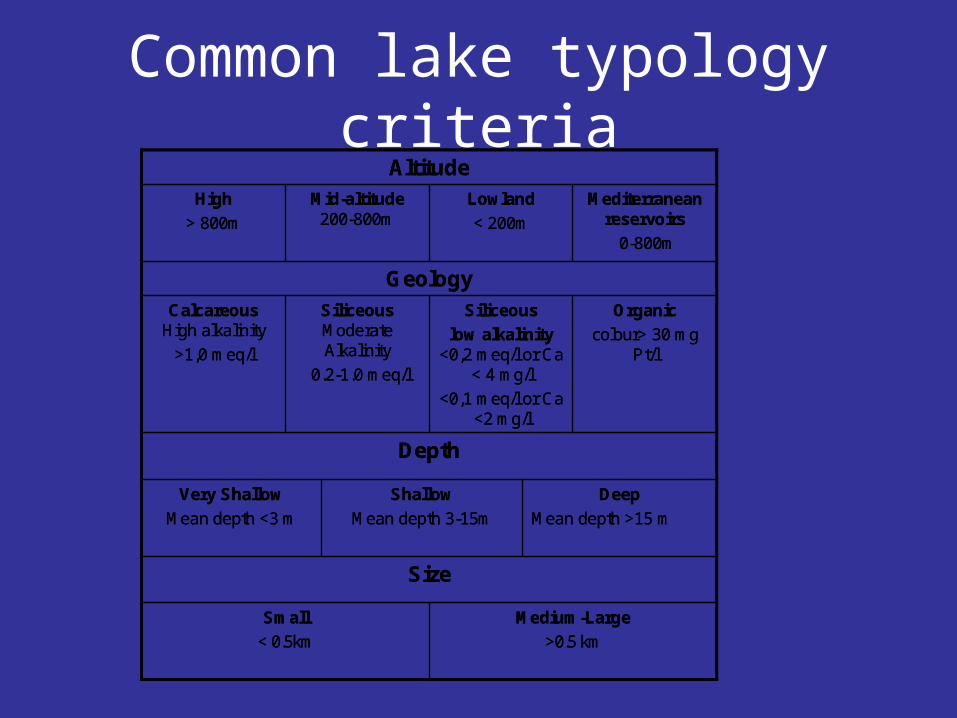
Common lake typology criteria
Medium-Large
>0.5 km
Small
< 0.5km
Size
Deep
Mean depth >15 m
Shallow
Mean depth 3-15m
Very Shallow
Mean depth <3 m
Depth
Organic
colour> 30 mg Pt/l
Siliceous
low alkalinity <0,2 meq/l or Ca
< 4 mg/l
<0,1 meq/l or Ca <2 mg/l
Siliceous Moderate Alkalinity
0.2-1.0 meq/l
Calcareous High alkalinity
>1,0 meq/l
Geology
Mediterranean reservoirs
0-800m
Lowland
< 200m
Mid-altitude 200-800m
High
> 800m
Altitude
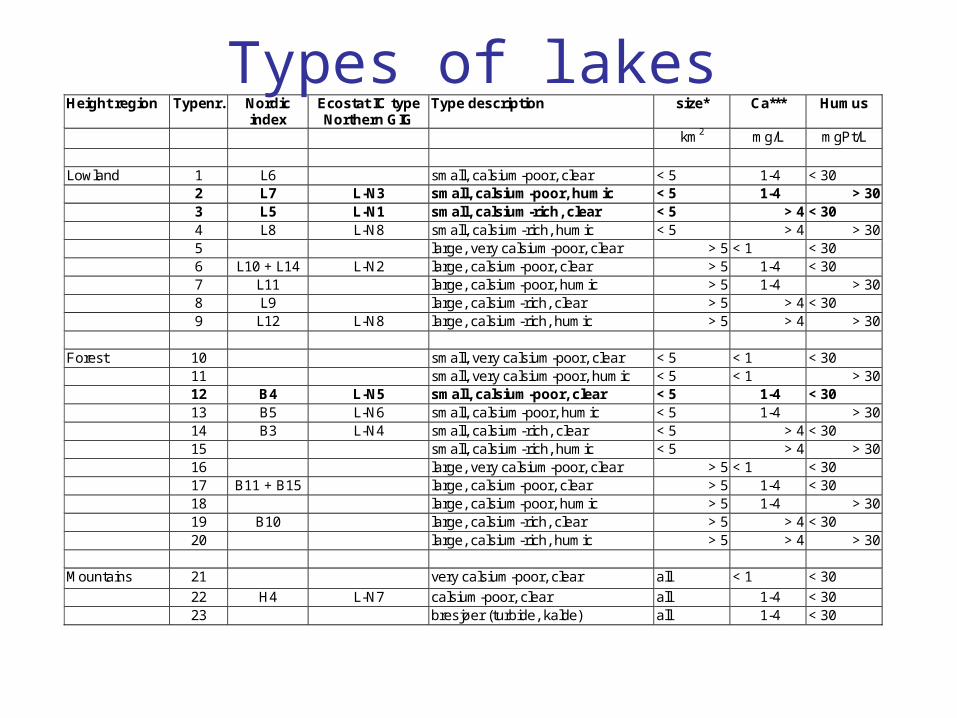
Height region Typenr. Nordic index
Ecostat IC type Northern GIG
Type description size* Ca*** Humus
km2 mg/L mgPt/L
Lowland 1 L6 small, calsium-poor, clear < 5 1-4 < 30
2 L7 L-N3 small, calsium-poor, humic < 5 1-4 > 30 3 L5 L-N1 small, calsium-rich, clear < 5 > 4 < 30 4 L8 L-N8 small, calsium-rich, humic < 5 > 4 > 30 5 large, very calsium-poor, clear > 5 < 1 < 30 6 L10 + L14 L-N2 large, calsium-poor, clear > 5 1-4 < 30 7 L11 large, calsium-poor, humic > 5 1-4 > 30 8 L9 large, calsium-rich, clear > 5 > 4 < 30 9 L12 L-N8 large, calsium-rich, humic > 5 > 4 > 30
Forest 10 small, very calsium-poor, clear < 5 < 1 < 30 11 small, very calsium-poor, humic < 5 < 1 > 30 12 B4 L-N5 small, calsium-poor, clear < 5 1-4 < 30 13 B5 L-N6 small, calsium-poor, humic < 5 1-4 > 30 14 B3 L-N4 small, calsium-rich, clear < 5 > 4 < 30 15 small, calsium-rich, humic < 5 > 4 > 30 16 large, very calsium-poor, clear > 5 < 1 < 30 17 B11 + B15 large, calsium-poor, clear > 5 1-4 < 30 18 large, calsium-poor, humic > 5 1-4 > 30 19 B10 large, calsium-rich, clear > 5 > 4 < 30 20 large, calsium-rich, humic > 5 > 4 > 30
Mountains 21 very calsium-poor, clear all < 1 < 30
22 H4 L-N7 calsium-poor, clear all 1-4 < 30 23 bresjøer (turbide, kalde) all 1-4 < 30
Types of lakes
Monitoring network for Nitrogen in Norwegian freshwaters
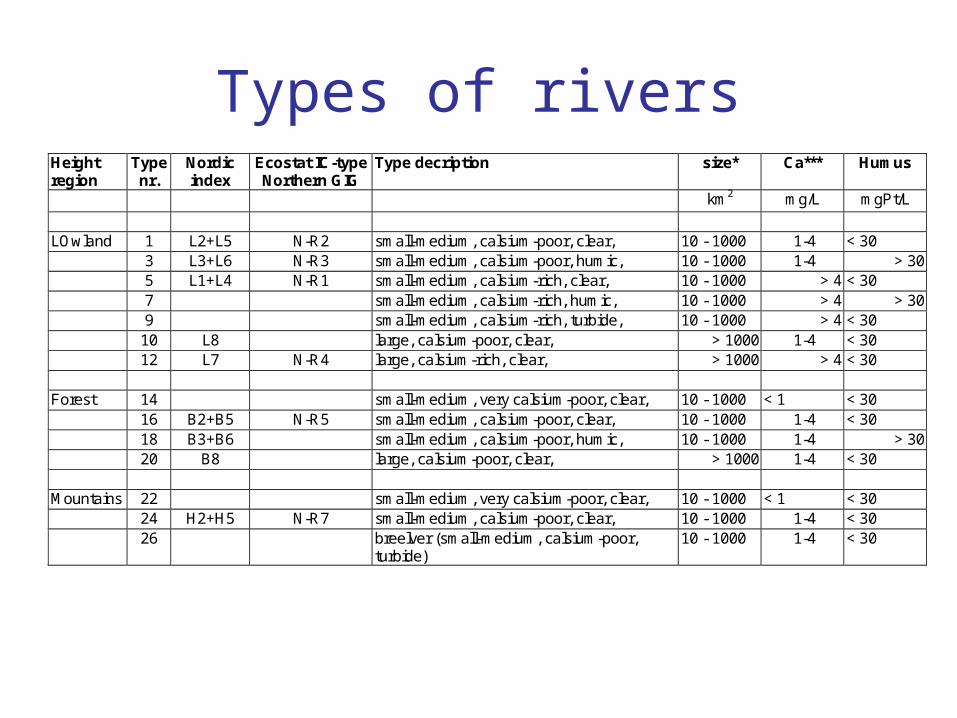
Types of riversHeight region
Type nr.
Nordic index
Ecostat IC-type Northern GIG
Type decription size* Ca*** Humus
km2 mg/L mgPt/L
LOwland 1 L2+L5 N-R2 small-medium, calsium-poor, clear, 10 - 1000 1-4 < 30
3 L3+L6 N-R3 small-medium, calsium-poor, humic, 10 - 1000 1-4 > 30 5 L1+L4 N-R1 small-medium, calsium-rich, clear, 10 - 1000 > 4 < 30 7 small-medium, calsium-rich, humic, 10 - 1000 > 4 > 30 9 small-medium, calsium-rich, turbide, 10 - 1000 > 4 < 30 10 L8 large, calsium-poor, clear, > 1000 1-4 < 30 12 L7 N-R4 large, calsium-rich, clear, > 1000 > 4 < 30
Forest 14 small-medium, very calsium-poor, clear, 10 - 1000 < 1 < 30 16 B2+B5 N-R5 small-medium, calsium-poor, clear, 10 - 1000 1-4 < 30 18 B3+B6 small-medium, calsium-poor, humic, 10 - 1000 1-4 > 30 20 B8 large, calsium-poor, clear, > 1000 1-4 < 30
Mountains 22 small-medium, very calsium-poor, clear, 10 - 1000 < 1 < 30 24 H2+H5 N-R7 small-medium, calsium-poor, clear, 10 - 1000 1-4 < 30 26 breelver (small-medium, calsium-poor,
turbide) 10 - 1000 1-4 < 30
RID/KYO/JAMP stations#Y
#Y
#Y
#Y#Y
#Y
#Y#Y
#Y#Y#Y
#Y#Y
#Y#Y
#Y#Y
#Y
#Y#Y
#Y#Y#Y
#Y#Y #Y
#Y
#Y#Y
#Y#Y #Y#Y
#Y
#Y
#Y
#Y
#Y
#Y
#Y
#Y
#Y
#Y
#Y
#Y #Y
$T
$T
$T
$T$T$T$T$T$T
$T$T$T$T
$T
$T
$T$T
$T
$T
$T
$T$T$T$T$T$T
$T$T$T$T
$T
$T
$T$T
$T
$T
$T
$T$T$T$T$T$T
$T$T$T$T
$T
$T
$T$T
'W
'W'W
'W
'W
'W
'W
'W
'W
'W
'W
'W
'W
#S
#S
#S
#S
#S
#S
#S
#S#S
#S
#S
#S
#S
#S
#S#S
#S
#S
#S#S
#S
#S
#S #S
#S
#S
#S
#S
#S
#S
#S
#S
#S
#S #S
#S#S#S
#S
#S#S#S
#S#S#S#S#S#S
#S
#S#S#S
#S#S
#S#S#S
#S#S#S#S
#S#S#S
#S#S#S
#S#S#S#S
#S#S
#S
#S#S#S#S
#S
#S
#S #S
#S
#S
#S
&V
&V
&V&V
&V
&V
&V
&V
&V
&V
&V&V
&V&V
&V
&V&V
&V
&V&V
&V&V
%U%U%U%U
%U%U%U%U%U%U%U%U
%U%U
%U%U%U%U
%U%U
%U%U%U
Focusing on transport loads to the sea.
Co-operation with NVE
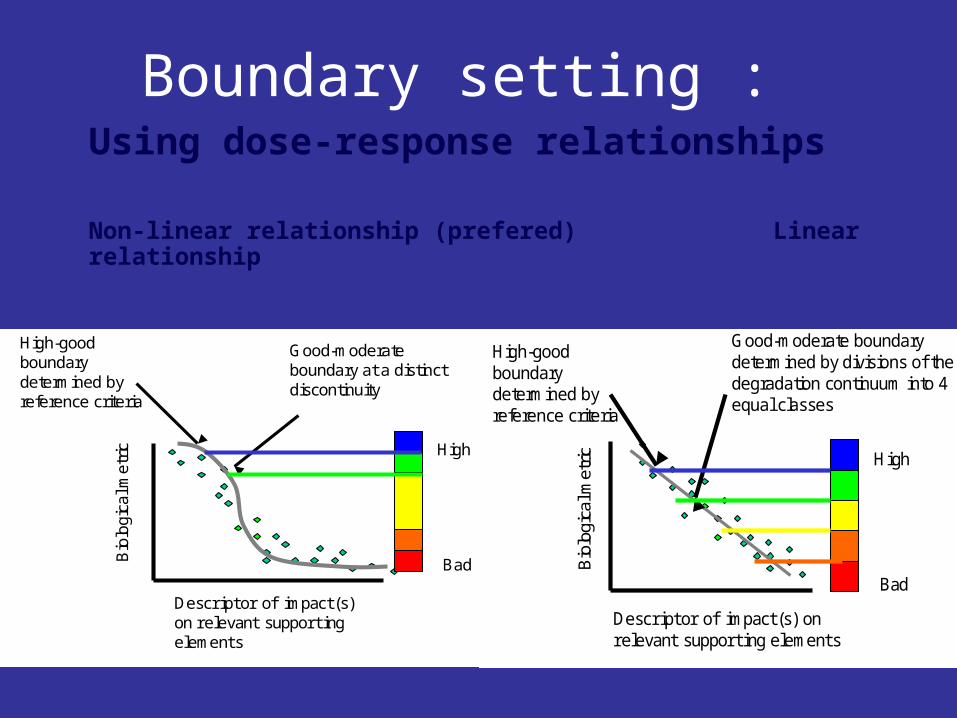
Boundary setting :
Bio
logi
cal m
etric High
Bad
Descriptor of impact(s) on relevant supporting elements
High-good boundary determined by reference criteria
Good-moderate boundary determined by divisions of the degradation continuum into 4 equal classes
Bio
logi
cal m
etr
ic
Descriptor of impact(s) on relevant supporting elements
High
Bad
High-good boundary determined by reference criteria
Good-moderate boundary at a distinct discontinuity
Using dose-response relationships
Non-linear relationship (prefered) Linear relationship
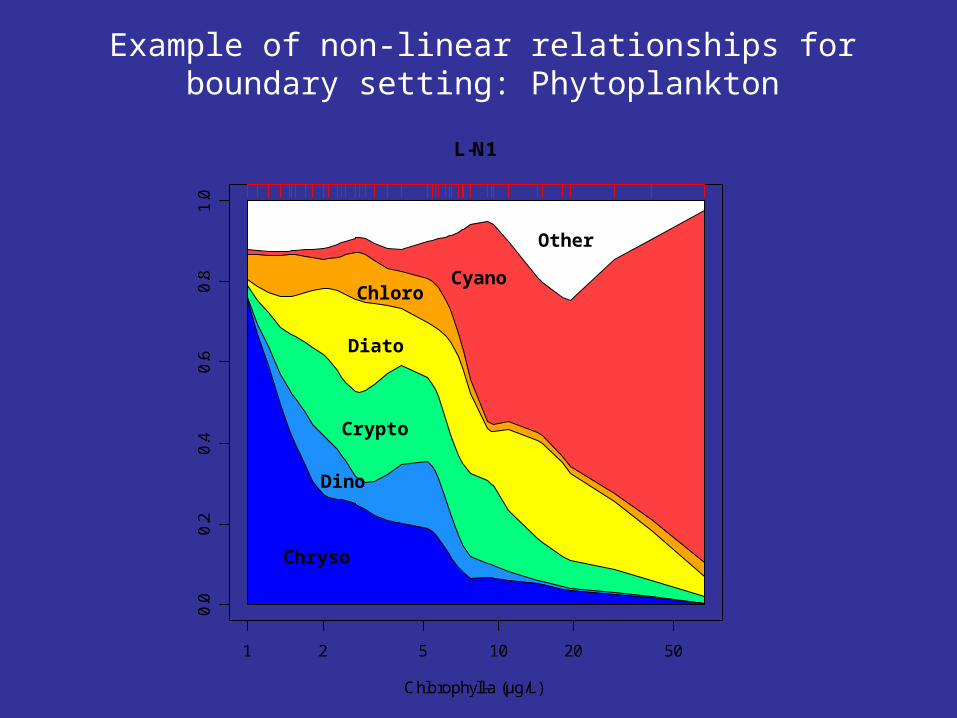
1 2 5 10 20 50
0.0
0.2
0.4
0.6
0.8
1.0
L-N1
Chlorophyll-a (µg/L)
Chryso
Dino
Crypto
Diato
ChloroCyano
Other
Example of non-linear relationships for boundary setting: Phytoplankton
Isoetes lacustris Soft-water lakes (<20 mg Ca/l)
0
1
2
3
4
5
6
1 10 100 1000
total phosphorus
abu
nd
ance
Chara sp.Calcium-rich lakes (> 20 mg Ca/l)
0
2
4
6
8
10
12
14
1 10 100 1000
total phosphorus
sum
ab
un
dan
ce
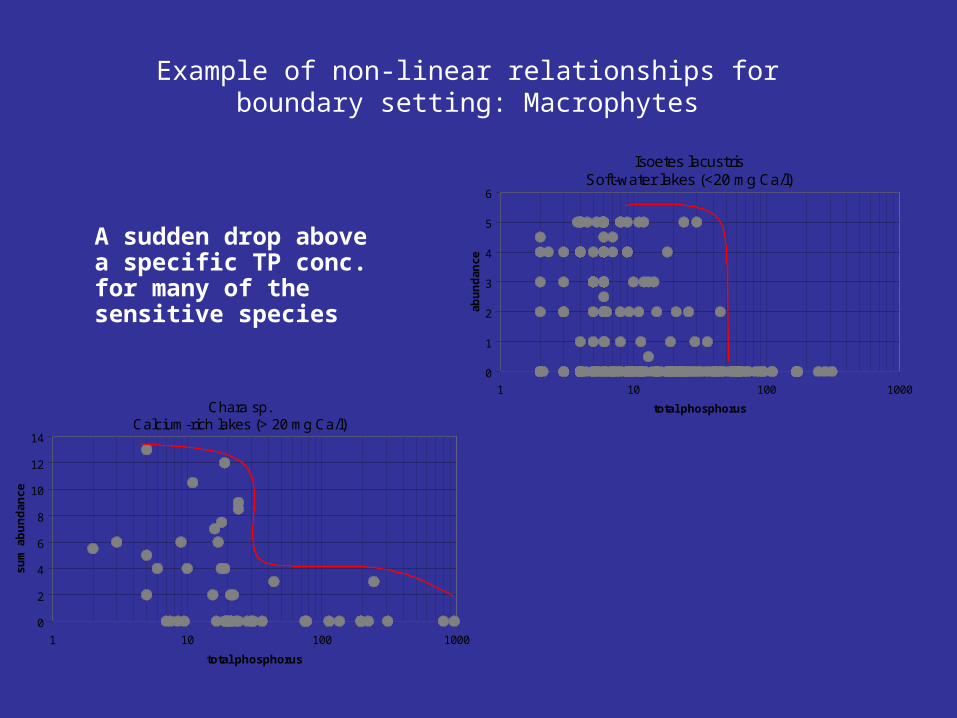
A sudden drop above a specific TP conc. for many of the sensitive species
Example of non-linear relationships for boundary setting: Macrophytes
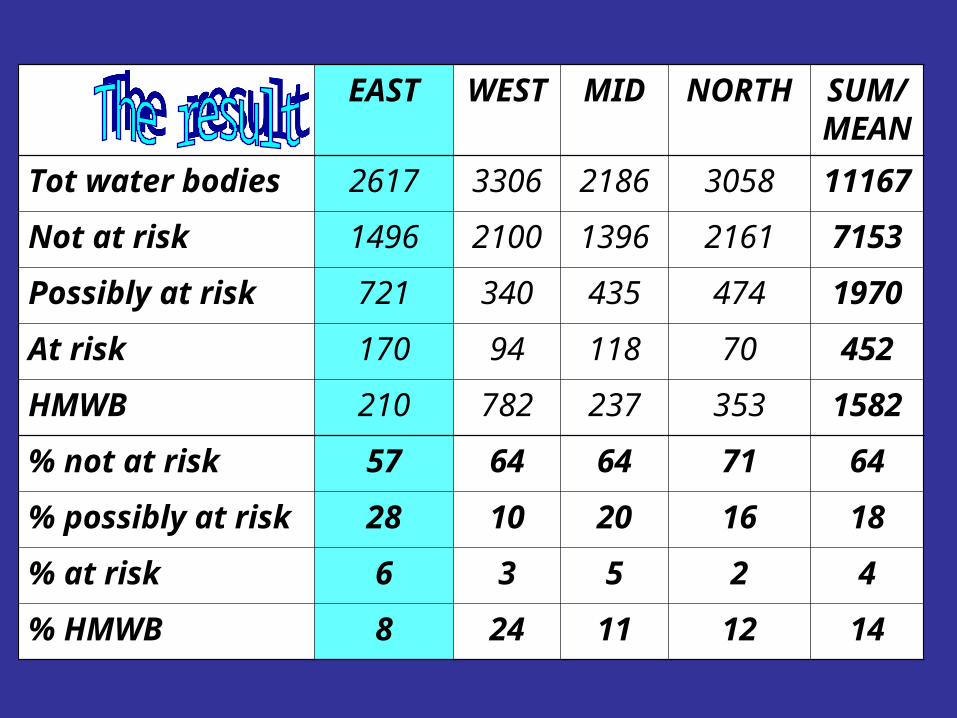
EAST WEST MID NORTH SUM/MEAN
Tot water bodies 2617 3306 2186 3058 11167
Not at risk 1496 2100 1396 2161 7153
Possibly at risk 721 340 435 474 1970
At risk 170 94 118 70 452
HMWB 210 782 237 353 1582
% not at risk 57 64 64 71 64
% possibly at risk 28 10 20 16 18
% at risk 6 3 5 2 4
% HMWB 8 24 11 12 14
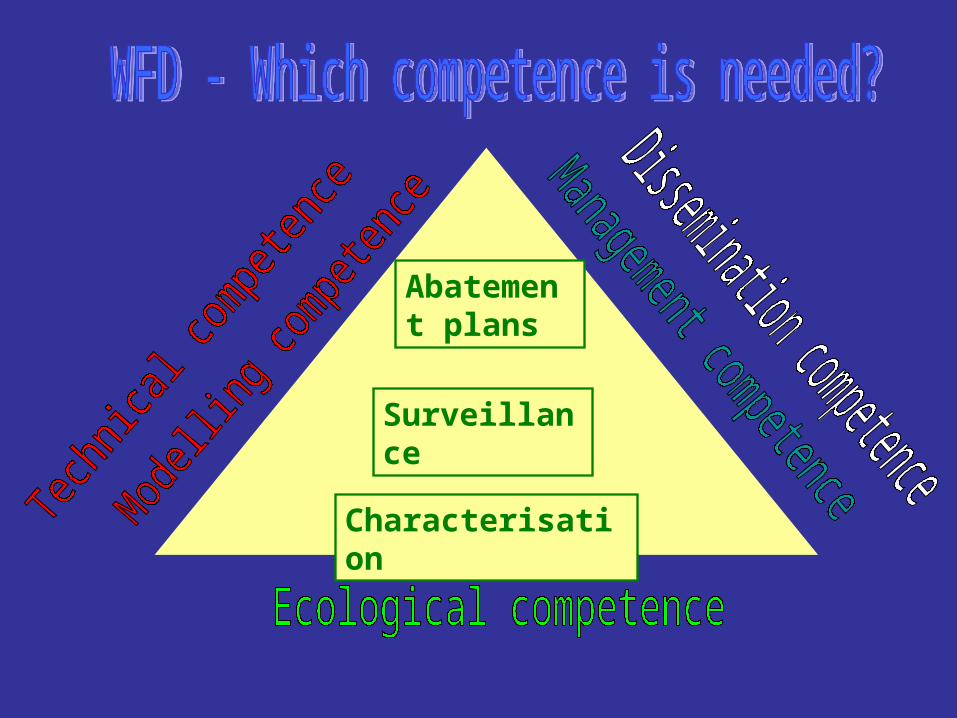
Abatement plans
Surveillance
Characterisation

WFD – spin-off effects
• Increased co-operation between Directorates dealing with water
• Increased co-operation between science/monitoring institutes (water quality – quantity)
• Increased co-operation between regional management?