the impact of urban areas on great lakes water quality · 20 appendix 1 the impact of urban areas...
TRANSCRIPT

20
Appendix 1
The Impact of Urban Areas on Great Lakes Water Quality -Final Report
Ray Tomalty, PhD
(Co-operative Research and Policy Services)
With the assistance of Dan Casey, MUP
July, 2008
(Please note that this report draws some of its content from subsequent appendices)
Outline of this Report
This report is organized in the following manner:
Section 2 addresses urbanization trends in the Great Lakes Basin, focusing on
population and employment growth within urban regions and decentralization from
cores to peripheral areas, the concomitant rise in car usage and distances travelled, the
resulting air emissions and health impacts, and the consumption of agricultural land.
Section 3 examines in some detail the impacts of the urbanization trends noted in
Section 2 on water quality in the Great Lakes Basin. It covers stormwater runoff,
municipal water use, wastewater, groundwater, wetland and riparian zone
degradation, and deposition of air pollutants.
Section 4 reviews the responses that have been mounted in the basin to address the
effects identified in Section 3. Both structural and planning responses are reviewed.
Structural responses are found to be important but inadequate on their own and the
concept of smart growth is introduced as an integrated planning response.
Section 5 considers the forces and factors that are driving sprawl and car-dependency
in the basin and posing barriers to smart growth. Cultural, governance, political,
financial and regulatory factors are covered in some detail.
Section 6 offers our recommendations on how governments and other actors in the
basin can move beyond the barriers identified in Section 5 to implement smart growth
solutions on the ground.
Introduction
The Great Lakes are the largest lake group in the world, a unique and extraordinary fresh
water resource that has nourished the development of urban environments in both Canada
and the US. In the early years of European settlement, the lakes provided an important
transportation network for trade and commerce, served as an important fishery, and
supported the region‘s burgeoning agricultural economy. With time, the lakes have
become an important resource for a broader industrial base, for navigation, and for
recreation. They are an integral part of the history and culture of the two nations that
straddle the lakes, and are likely to continue as a focus of development over the next
century.
Threats to the Great Lakes environment are numerous and increasingly diverse, including
the widespread toxic contamination of surface and ground water, over-taxed aquifers,
habitat degradation, and invasions by alien species. While some improvements are
apparent – bald eagles now nest again along the shores of the Great Lakes, for instance –
21
many of these problems continue to undermine the ecological integrity of the basin and to
put the health of the human population at risk.
One of the driving forces behind these environmental changes is the advancing
urbanization of the Great Lakes Basin. Today, over 33 million people live in the basin,
two-thirds of whom are settled in urban areas with populations larger 250,000. Although
the urbanized areas of the basin occupy only 3 to 4 percent of the total land surface, how
and where these communities grow has enormous implications for the health of the basin
and its residents (USEPA and EC, 2005). In some Great Lakes cities, it is predicted that
urban population may grow by 20 percent or more over the next decade, with most
growth occurring at the urban fringe. This means that population of low-density suburban
and rural areas around the Great Lakes is increasing, while the population in many
higher-density urban cores is shrinking. The urban footprint is spreading and
infrastructure to support it is weaving its way further out from city centres into what was
formerly countryside.
What do these changes mean for the Great Lakes environment? While our understanding
of the environmental and health implications of these changes remains incomplete, much
good work has been done, and a consensus is beginning to emerge. This purpose of the
present report is to compile the evidence gleaned from studies conducted by the
Commission, researchers, academicians, policy analysts, and others on this important
topic, and proposes a set of policy responses to encourage forms of urban development
that mitigate impacts on the Great Lakes environment.
An important insight behind this report is that the health of the Great Lakes and the health
of the cities growing in its basin are intimately connected. Cities depend on the health of
the Great Lakes for part of their economic activity, for the ways in which their natural
amenities contribute to the quality of life among urban residents, for the provision of
basic environmental services such as drinking water and wastewater sink, and in some
locations, even the weather. Conversely, the health of the Great Lakes depends in part on
how well cities in its basin manage the challenges associated with their development - the
consumption of land and habitat, the production of wastewater, the generation of air
pollution, and so on. This approach dovetails with that of progressive urban leaders in the
GLB who form the foundation of a growing movement to establish urban sustainability
as the central organizing principle for addressing environmental issues in the Great Lakes
Basin. Sustainability means a form of development that simultaneously boosts economic
opportunity and reduces government spending, builds social equity, and enhances, rather
than steadily degrades, the natural environment. Throughout this report, we will use this
"triple bottom line" view to assess problems and propose solutions.
Urbanization Trends in the Great Lakes Basin
The Great Lakes Basin is 766,000 square kilometres (296,000 square miles) in size,
encompassing the watersheds of the rivers that drain into the largest cluster of freshwater
lakes in the world. The region‘s economy formed the heart of continental trade in the
middle of the 20th
century, as the ores and raw materials of Minnesota and Ontario could
be shipped south and processed into metals in Chicago and Cleveland, which in turn went

22
to the factories of Detroit and Milwaukee to be fashioned into consumer goods and
especially automobiles. While maritime traffic on the Lakes has been a part of life in the
basin since the earliest days of European settlement, and the construction of the Erie
Canal linked the seaport of New York to the vast US Midwest, the heavy industrial base
of the region and the opening of the Saint Lawrence Seaway in 1958 finally connected
the inland ports directly to the rest of the world.
Figure 1: The Great Lakes Basin and the surrounding area
Source: atlas.nrcan.gc.ca/.../referencemap_image_view
Based on the natural resources of the region and its advantageous location at the heart of
the continent, this industrial strength has given rise to a ring of heavily urbanized areas
around the lakeshore. Milwaukee, Chicago, Detroit, Toronto, Hamilton and Buffalo are
the main cities of the Great Lakes; other significant urban centres include Duluth in
Minnesota, Green Bay and Racine in Wisconsin, Gary in Indiana, Toledo in Ohio,
Windsor and Kingston in Ontario, and Rochester in New York. Industrial development in
these and innumerable other urban areas around the lakes historically provided jobs and
attracted millions of immigrants. In the period after World War Two, many of the central
cities of the region went into a steep decline as their populations headed for the jobs and
housing available in automobile-oriented suburbs. As a result, urbanized areas are
expanding into the farmland and forests that make up most of the basin, placing
additional pressure on unique and highly sensitive freshwater ecosystems.

23
Figure 2: Land cover in the Great Lakes Basin
Source: University of Wisconsin Sea Grant Institute
Population Trends
The most important and fundamental force driving environmental change in the basin is
population growth, with most of that growth focused in urban areas. It may seem
surprising to allude to population growth in the so-called ―rust belt‖, the older
industrialized regions of the basin where industrial activity is now in decline and many
factories are now abandoned. In fact, the population of the Great Lakes Basin has been
growing steadily over the past 20 years, and will continue to do so over the next 20-30
years.
However, population growth around the basin is far from uniform. Overall, Great Lakes
states on the US side of the basin are growing at only half the national rate, while Ontario
has grown at a rate that is one-third higher than the national average (Tables 1 and 2)
Population growth was slower than the US national average in all Great Lakes states up
to 1990. In the 1980s Minnesota post the highest growth rate of 7.4, athough this was still
less than the national growth rate of 9.8 percent. The relatively slow rate of growth in the
Great Lakes states may be reflective of the economic uncertainty characteristic of the
1980s, with slower rates of natural increase (births minus deaths), and less in-migration.
The economic recession hit the states of the mid-west and north-east particularly hard and
much of the inter-state migration was into the ―sunbelt‖ states of the west and south. In
the 1990s, growth rates in all eight Great Lakes states have been higher, although, once

24
again, no Great Lake state reached the national average growth rate from 1990-2000.
2000-2006 figures show the Great Lakes states to be on track for somewhat more modest
population growth than seen in the 1990s, with Minnesota again showing the highest
figures.
Table 1: Population change in the US Great Lakes States, 1980-2006
1980 1990 2000 2006 %
change
1980-
1990
%
change
1990-
2000
%
change
2000-
2006
New York 17,558,000 17,991,000 18,976,000 19,306,000 2.5 5.5 1.7
Penna. 11,864,000 11,883,000 12,281,000 12,441,000 0.2 3.4 1.3
Illinois 11,427,000 11,431,000 12,419,000 12,832,000 0.05 8.6 3.3
Ohio 10,798,000 10,847,000 11,353,000 11,478,000 0.5 4.7 1.1
Michigan 9,262,000 9,295,000 9,938,000 10,096,000 0.4 6.9 1.6
Indiana 5,490,000 5,544,000 6,080,000 6,314,000 1.0 9.7 3.8
Wisconsin 4,706,000 4,892,000 5,364,000 5,557,000 4.0 9.6 3.6
Minnesota 4,076,000 4,375,000 4,919,000 5,167,000 7.4 12.4 5.0
US 226,546,000 248,791,000 281,422,000 298,755,000 9.8 13.1 6.2
Source: US Census Bureau
Table 1: Population change in Ontario, 1981-2001
1981 1991 2001 2006 %
change
1981-
1991
%
change
1991-
2001
%
change
2001-
2006
Ontario 8,745,308 10,084,885 11,410,046 12,160,282 13 12 6.6
Canada 24,516,278 27,296,859 30,007,094 31,612,897 10 9 5.4
Source: Statistics Canada
Ontario‘s strong pattern of growth is reflective of its position as the ―economic engine‖ of
Canada. Despite the recession of the 1980s, Ontario‘s population grew by 13 percent,
higher than the national rate of 10 percent, fuelled in large part by immigration and
internal migration from the rest of Canada. This rate of growth has continued throughout
the 1990s and 2000s, and is expected to continue over the next two decades. According to
Statistics Canada, Canada‘s population is projected to reach 34,149,000 in 2025, having
grown by 12 percent since 2001. Ontario‘s population is expected to reach 13,929,000,
representing an 18 percent increase over the same time period.
Within the Great Lakes Basin there are 10 Census Metropolitan Areas (CMAs) in Ontario
and 24 Metropolitan Statistical Areas (MSAs) in the United States. From Table 2, we see
that some MSAs on the US side register negative or slow growth (as in the case of
Buffalo, Cleveland , Erie, Flint, Akron, and Detroit), while others such as Chicago and

25
some smaller centres (Ann Arbor, Grand Rapids) exhibit population growth that is above
the average for the basin.
Table 2: Population in Metropolitan Statistical Areas on the US side of the Great Lakes
Basin
SMA 1980 1990 2000 2005 %
change
Akron, OH 660,328 658,654 695,986 701,435 -5.8
Ann Arbor, MI 264,400 283,987 324,294 342,124 22.7
Buffalo-Niagara Falls,
NY
1,241,275 1,190,943 1,169,013 1,144,796 -8.4
Chicago-Naperville-
Joliet, IL, IN, WI
8,052,943 8,203,210 9,120,782 9,446,565 14.8
Cleveland-Elyria-
Mentor, OH
2,172,438 2,104,288 2,148,238 2,125,138 -2.2
Detroit-Warren-
Livonia, MI
4,339,778 4,250,986 4,458,636 4,479,254 3.1
Erie, PA 279,780 275,911 280,729 280,184 0
Flint, MI 450,449 430,938 437,021 442,732 -1.7
Fort Wayne, IN 444,722 355,358 391,138 404,182 -10.0
Grand Rapids-
Wyoming, MI
578,283 648,377 742,944 770,171 24.9
Kalamazoo-Portage, MI 279,626 294,251 315,236 318,836 12.3
Lansing-East Lansing,
MI
419,750 433,414 448,374 454,668 7.7
Rochester, NY 972,728 1,004,989 1,038,521 1,036,890 6.2
Source: 1990 and 2000 US Census
Metropolitan growth rates on the Canadian side of the Great Lakes Basin tend to be
higher than those on the US side. For example, between 1990 and 2000 Chicago grew by
11.2 percent, while Toronto grew by 20.1 percent over roughly the same period (1991-
2001). In fact, about half the demographic expansion of Canada between 2001 and 2006
was concentrated in southern Ontario, especially in and around the Greater Toronto Area.
In large part, the strong economic performance of the Toronto census metropolitan area
and its surroundings is a consequence of the multiple roles this region plays in the
Canadian economy: as a financial centre, the media and cultural centre of English
Canada, an air traffic hub, and manufacturing centre (Toronto, 2000). Over half the new
immigrants to Canada choose to settle in the Toronto CMA (Bourne and Rose, 2001;
McDonald, 2004). However, as for the US side, population growth in the Canadian
portion of the basin is not uniform. Although most metropolitan areas in the Ontario part
of the basin are growing at above the national average, several centres outside the Golden
Horseshoe (such as Kingston) are growing more slowly and others (like Thunder Bay)
have declined in population (see Table 3).

26
Table 3: Population in Census Metropolitan Areas on the Canadian side of the Great
Lakes Basin
CMA 1981 1991 2001 2006 %
change
1981-
1991
%
change
1991-
2001
%
change
2001-
2006
Hamilton 542,000 599,760 662,401 692,911 9.6 10.4 4.6
Kingston - 136,401 146,838 152,358 - 7.7 3.8
Kitchener 268,000 356,421 414,284 451,235 24.8 16.2 8.9
London 284,000 381,522 432,451 457,720 25.6 13.4 5.8
Oshawa 154,000 240,104 296,298 330,594 35.9 23.4 11.6
St.
Catharines-
Niagara
304,000 364,552 377,009 390,317 16.6 3.4 3.5
Thunder Bay 121,379 124,925 121,986 122,907 2.8 -2.4 0.8
Toronto 2,999,000 3,898,933 4,682,897 5,113,149 23.1 20.1 9.2
Windsor 246,000 262,075 307,877 323,342 6.1 17.5 5.0
Source: 1981, 1991, 2001 and 2006 Canadian census
Over the next 20 to 30 years, population growth in the US will continue to be strongest in
the South and West of the country. However, the Great Lakes states will also see their
populations increase, with the highest growth rate projected for Illinois. Much of the
growth in population will be as a result of natural population increase rather than
immigration or internal migration (US Bureau of the Census, 2007). In Chicago itself,
growth is expected to continue steadily at approximately 7 percent between 2000 and
2010, slowing to 4 percent between 2010 and the end of 2020. This slowdown is
indicative of a slowing birthrate as a result of an aging population. By 2020, the
metropolitan region is expected to have a population of over 9 million.
In Canada, the rate of population growth in the Western provinces is also expected to be
strong, but Ontario's growth in terms of absolute numbers will outstrip growth in BC and
Alberta (Statistics Canada, 2005). Strong growth is expected to continue in the Greater
Golden Horseshoe, which is expected to grow by over 3.7 million people over the next 25
years (Hemson Consulting, 2005).
Just as population growth is not evenly distributed among metro regions in the Great
Lakes Basin, neither is it homogenously distributed within metropolitan regions. Over the
last several decades, most growth in metro regions within the Great Lakes Basin has
occurred at the urban fringe. Thus, we find that population densities are increasing in
suburban and rural areas on the periphery of urban regions, while the population in core
cities grows more slowly or stagnates.

27
Table 4: Core and metropolitan area (CMA) populations of major Great Lakes cities,
1980-2005
1980 1990 2000 2005
Core %
Metro
% Core %
Metro
% Core %
Metro
% Core %
Metro
%
Milwaukee 40.5 59.5 39.1 60.9 35.3 64.7 33.7 66.3
Chicago 37.0 63.0 33.8 66.2 31.6 68.4 29.9 70.1
Detroit 22.7 77.3 19.8 80.2 17.4 82.6 16.0 84.0
Cleveland 19.5 80.5 17.7 82.3 16.2 83.8 15.2 84.8
Buffalo 28.8 71.2 27.6 72.4 25.0 75.0 24.3 75.7
Hamilton* 56.5 43.5 53.1 46.9 49.9 50.1 47.6 52.4
Toronto* 20.0 80.0 15.6 84.4 14.4 85.6 - -
*Core population is defined using the pre-amalgamation borders of Toronto and
Hamilton. Population counts for the old City of Toronto are not yet available. Population
data for Canadian cities is from 1981, 1991, 2001, and 2006.
Source: US Census & Statistics Canada
This trend is borne out across all types of major urban regions in the basin: in areas such
as Buffalo experiencing general population decline; in areas like Cleveland, with stable
populations; and in those like Chicago or Toronto that show robust metropolitan
population growth. Even in instances where the core city population has increased during
certain periods, as in Chicago or Toronto, growth in suburban areas outstrips growth in
the core areas. Thus, the demographic weight of central cities is declining relative to the
growth in their surrounding urban regions.
Economic Trends
The economy of the Great Lakes Basin has also changed in important ways over the last
two decades. The most dramatic and important shift has been the movement away from
reliance on agriculture, resource extraction, and manufacturing as the principal economic
forces in the basin, and toward an economy in which an increasingly large proportion of
the workers are engaged in the creation of knowledge (for instance, through science,
technology, and education), or the delivery of services. Even traditional manufacturing
activities rely increasingly on the products of knowledge (e.g., robotics) rather than
manual labour. These changes are occurring in the context of an increasingly global
economy, in which information technology, enhanced ―connectivity‖, and global political
forces facilitate the trading of goods and service on a global scale and ratchet up
competitive pressures for low costs and high productivity. As an indicator of the
difficulty of this transition, a recent report form the Brookings Institution reveals that
nearly 40 percent of the weakest US metropolitan markets for employment, wages and
gross product are located in the eight Great Lakes states (Austin and Affolter-Caine,
2006). The continuing consolidation of American auto companies, whose operations are
centred in the region, will only exacerbate this weakness.
Table 5: Employment in major US Great Lakes metropolitan areas, 1980-2004

28
1980 1990 2000 2004
Milwaukee 867,139 978,672 1,106,260 1,081,865
Chicago 4,158,518 4,786,539 5,541,156 5,945,612
Detroit 2,353,806 2,764,800 3,152,211 3,031,020
Cleveland 1,478,696 1,596,076 1,800,800 1,757,826
Buffalo 585,131 635,721 648,001 644,089
Source: US Census USA Counties database
Despite these changes in the structure of the economy, employment in some Great Lakes
metropolitan areas has continued to grow. The economic shifts of the 1980s were
wrenching for the industrial economies of urban areas, but robust growth in service
industries led to an increase in overall employment for the five largest cities on the US
side of the basin, which can be seen in Table 6. This growth accelerated in larger centres,
such as Chicago, during the 1990s and 2000s; elsewhere, the 1990s increase has given
way to a downturn in total employment.
Table 6: Employment distribution in major Great Lakes metropolitan areas, 1980-2004
1980 1990 2000 2004
Core
county
%
Metro
area %
Core
county
%
Metro
area %
Core
county
%
Metro
area %
Core
county
%
Metro
area %
Milwaukee 68 32 63 37 57 43 55 45
Chicago 70 30 65 35 60 40 54 46
Detroit 46 54 38 62 31 69 32 68
Cleveland 60 40 57 43 54 46 52 48
Buffalo 83 17 84 16 85 15 86 14
Source: US Census USA Counties database
As with population growth, the growth in employment has not been evenly distributed
throughout metropolitan regions in the Great Lakes Basin. Table Table 6 shows that the
spreading out of urban populations has been followed by the decentralization of
employment from the centre to the periphery. The data used is county-based, meaning
that expansive Erie County, around Buffalo, and Cuyahoga County, around Cleveland,
cover large amounts of suburban and even rural land to which jobs have moved from the
central cities. The phenomenon of decentralizing employment (such as in big box
retailing and suburban office parks) is clearly visible, however, in most urban areas. The
Detroit area is becoming radically decentralized, as industrial decline in central Wayne
County (including the City of Detroit) contrasts with booming service sectors in the
metropolitan fringe, shifting nearly 70 percent of all Detroit-area jobs to the more distant
suburb and counties.
Urban Sprawl

29
The population and employment trends discussed in the previous sections have major
implications for the changing form of cities in the Great Lakes Basin. Until the 20th
century, most cities were built around a single core in a relatively compact fashion, based
on rail access for goods, and transit and walking for people. The separation between city
and country was clearly demarcated. Over the last 100 years, but especially since the
Second World War, these traditional patterns were abandoned in favour of a more spread
out urban form. Instead of having a centralized downtown-focus, most urban regions now
have a much more irregular configuration (Fishman, 1987; Garreau, 1991). This new
urban form is characterized by a weaker core (i.e., lower population and employment
densities than in the past and a declining portion of the regional population and
employment base), surrounded by layers of municipally-serviced suburbanization at
gradually decreasing densities, with an outer ring of exurban development in (formerly)
rural areas, based on septic systems. (Up to 50% of new residential constructions in many
Basin jurisdictions have on-site wastewater systems). As large cities have grown in this
fashion, they have engulfed many smaller communities, whose historic downtowns may
now serve as regional sub-centres. In some areas, urban areas have joined into a
continuous urbanized corridor along major transportation routes (Lang, 2003). The new
urban form that dominates the North American landscape has been variously labelled
―multi-nuclear‖, ―scattered‖, ―galactic‖ and ―dispersed‖ (Berry and Kim 1993; Filion,
Bunting and Warriner, 1999; Fujii and Hartshorn, 1995; Gottdiener and Klephart, 1991;
Lewis, 1983). In this report, we will use the term ―urban sprawl‖.
A DEFINITION OF SPRAWL: Sprawl is development characterized by the conversion
of natural or agricultural land to low-density residential suburbs, commercial centres, and
business parks, all separated from one another by roads and parking lots. The low
densities and separation of land uses (residential, commercial, recreational, institutional
and industrial) into separate precincts increases distances between homes and daily
destinations (e.g., work or shopping) and promotes heavy reliance on roads and
automobiles (Adapted from: The Biodiversity Project. 2000).
There are many factors contributing to the transformation of the urban landscape over the
last half century: housing was often cheaper in the suburbs and suburban areas were
perceived as safer and more congenial places to raise a family. The building of freeways
through metropolitan areas and the low price of liquid fuels facilitated the emergence of
the automobile as the transportation mode of choice. This freed city dwellers to live in
"bedroom communities" and commute to the central city for employment. Eventually, the
jobs themselves followed the population to the urban fringe and now much metropolitan
commuting is actually suburb to suburb rather than centred on the urban core. (An even
newer phenomenon is the reverse commute, where people living in the core drive to jobs
in the suburbs. See Amy Brown-Bowers. 2007. ―Reverse commuters reflect shift in land
use‖ Globe and Mail, December 11). The relationship between a sprawling urban form
and increased automobile use is a mutually-reinforcing one: just as widespread
automobile use, allied with massive investments in arterial and expressway networks,
encouraged urban dispersion, advancing dispersion contributed to rising reliance on the
car (Cao, Mokhtarian and Handy, 2006; Giuliano and Small, 1993).

30
The spreading out of urban areas is reflected statistically in a number of ways. One way
to look at this is through the geographical "footprint" of the urban region as it expands,
compared to the rise in population level. In some regions, particularly on the US side of
the border, dramatic patterns are emerging. For example, Chicago‘s land area grew by
25.5 percent between 1982 and 1997, whereas its census population increased by only 9.6
percent over the same time period. Most worrying are cities where the urbanized area is
growing even though the population is shrinking. The city of Duluth, Minnesota,
experienced a 30.7 percent increase in urbanized area from 1982 to 1997, while its
population shrank by 7.5 percent (Fulton et al., 2001). The result is a much larger urban
―footprint‖, with urban and urbanizing areas now covering a much larger land area than
they did 30 years ago. This finding implies that the per capita consumption of urban land
is increasing dramatically in cities around the Great Lakes. A study on urban sprawl in
the 100 largest cities across the US concluded that cities in the Great Lakes region led the
country in terms of their contribution of per capita land consumption (as opposed to
population growth) to the spread of the urban fabric (Kolankiewicz and Beck, 2001).
Indeed, in the major cities of the Great Lakes Basin, only Toronto and to a lesser extent
Chicago are now experiencing any intensification of development. Even those cities,
however, are affected by outward spread – sprawl – that far exceeds demographic
growth. What differentiates these two urban areas from others in the Great Lakes Basin is
that they contain zones of more intensive development, but at a scale insufficient to
counter the dominant trend towards reduced overall density (Haider and Miller, 2004). It
is noteworthy that even in the midst of a condominium development boom, which is
largely concentrated in the inner city and has now lasted more than five years, the
population of the City of Toronto increased less than 1 percent between 2001 and 2006,
while the suburbs have been growing at an accelerated pace (10.7, 17.1, 17.2 and 22.4
percent growth for the regional municipalities of Durham, Halton, Peel and York
respectively). In part, this is because much of the urban core condominium development
is aimed at double-income families without children. So as the size of households shrinks
in the central city, developers must create new housing units just to maintain the city‘s
population at its existing level. Suburbs, by contrast, experience both a far higher rate of
housing development, and a higher average household size.
The spreading out of urban populations over larger geographical areas is also reflected in
falling metropolitan density figures. As one can see from the graphs in Table 7, some
major cities of the Great Lakes Basin – including Cleveland, Milwaukee, Buffalo, Detroit
and Chicago – have all experienced major declines in their population densities over the
last 50 years. The density of the Milwaukee urbanized area, for example, declined
precipitously from over 8,000 people per square mile in 1950 to less than 3,000 per
square mile in 2000. Likewise, Buffalo's average density went from over 7,000 people
per square mile in 1950 to under 3,000 in 2000. Detroit's density drop was almost as
steep, whereas Cleveland's was somewhat more moderate. These density trends were by
no means the norm throughout North America, as many cities in the west and south of the
US – including Houston, Tampa, Los Angeles, San Jose, Miami, and Sand Diego –
increased their average densities over this 50-year period. Chicago is the only urbanized

31
area on the US side of the Great Lakes to have a density substantially above 3,000 people
per square mile in 2000.
Table 7: Metropolitan Area Densities, 1950-2000 (people per square mile)
SMA 1950 2000
Milwaukee 8,000 3,000
Buffalo 7,000 3,000
Detroit 6,500 3,000
Cleveland 4,800 2,800
Chicago 7,000 4,000
(Bruegmann, 2005)
Some Impacts of Urban Sprawl
The decentralization of population and employment has major implications for how
urban systems function, how they affect regional and global environments, and how they
affect human health. This form of urbanization consumes large quantities of land,
multiplies the infrastructure required to support it, and increases the use of personal
vehicles as the feasibility of alternate transportation declines. Vehicle traffic, in turn,
increases air emissions, both pollutants and greenhouse gases. These emissions in turn
may have serious implications for human health. Sprawl partially results from and then
works to increase demand for roads and highways, which in turn, produce more urban
sprawl. The increased coverage of the landscape by parking lots, driveways, roads and
highways reduces permeable surfaces and increases run-off from urban areas. This erodes
stream banks and destroys wetlands downstream. Run-off is increasingly laced with toxic
residues from lawn care products and car usage. When sprawl encroaches on
groundwater recharge areas, it can stress groundwater quality and quantity. In this section
we will briefly explore some of these impacts, reserving detailed examination of
urbanization and sprawl on water quality for the next section.
Among the most important repercussions of urban sprawl is the impact that this evolving
urban form has on travel behaviour and the design of transportation systems. For
example, low densities undermine the use of transit, which is only economically feasible
at minimum density thresholds, and leads to greater reliance on automobiles for personal
transportation. The rule of thumb that is widely accepted in the planning community is
that residential densities of seven to 15 units per acre are needed to support moderately
convenient transit service. These net densities are equivalent to regional densities of
5,600 to 12,000 person per square mile (assuming 50 percent of all land is used for
housing) (Downs, 1994). Of the regions shown in the table above, only one (Cleveland)
fell below the minimum density to support transit services in 1950. By 2000, none of the
regions achieved that threshold.
Not surprisingly, the decline in metropolitan densities has been accompanied by a secular
decline in transit use and a rise in car ownership and use throughout the US and Canada.
In fact, the distance travelled in vehicles has risen at a more rapid rate than population

32
levels. In the US, the population increased by 1 percent annually on average between
1980 and 1996, while vehicle miles travelled (VMT) increased by 3.1 percent annually
over the same period. In some metropolitan areas in the Great Lakes Basin, the trends are
even more pronounced. In Chicago, for example, where population grew by 11 percent
between 1982 and 1996, VMT grew by 79 percent (USEPA, 2001). As pointed out
above, Chicago‘s urban land consumption increased by 25 percent over a similar period
(1982 to 1997), implying that land consumption has grown more rapidly than population,
while VMT has grown at an even greater rate. Even in the Toronto Region, where urban
land consumption increased at a slightly slower rate than population between 1992 and
1998, projections to 2031 show vehicle kilometres travelled will increase by 68 percent
from 1996 levels while transit will grow by only 34 percent. Over this time, population is
projected to increase by approximately 55 percent (GHK Canada, 2002).
Table 8 reflects trends in travel patterns in metro areas of the Great Lakes region. In US
cities such as Milwaukee, Chicago, Detroit, Cleveland, and Buffalo, travel times
increased between 1990 and 2006 from 22.4 to 24.3 minutes on average and the modal
share of car travel increased on average from 87.7 to 91.1 percent, while transit dropped
from 5.9 to 5.1 percent on average and walking from 6.3 to 3.8 percent. In Toronto and
Hamilton, the situation was somewhat different, with the modal share for cars dropping
slightly in both cases, and transit and walking increasing from 1996-2006.
Table 8: Travel Mode in Selected Metro Areas in the Great Lakes Basin
Metro Area 1990 in US, 1996 in Canada 2006 in US and Canada
Commute
length % Car %Transit
%
Walk/bike/
other
Commute
length % Car %Transit
%
Walk/bike/
other
Milwaukee 20.0 min 88.1 4.8 7.1 21.8 min 91.3 4.5 4.3
Chicago 27.9 min 79.6 13.4 7.0 30.7 min 84.1 11.5 4.5
Detroit 23.1 min 92.9 2.1 4.9 25.2 min 96.1 1.4 2.5
Cleveland 21.9 min 89.8 4.4 5.7 23.5 min 92.3 4.1 3.6
Buffalo 19.4 min 88.3 4.7 7.0 20.5 min 91.7 4.3 4.0
Hamilton 85.4 8.0 6.6 84.6 8.7 6.7
Toronto 71.9 22.0 6.1 71.1 22.1 6.7
Sources: US Federal Highway Administration, Census Transportation Planning Package;
Statistics Canada
According to the State of the Great Lakes 2007 report, population growth and urban
sprawl in the basin have led to an increase in the number of vehicles on the region‘s
roads, fuel consumption, and kilometres/miles travelled. Over a ten-year period (1994-
2004) fuel consumption increased by 17 percent in the US states bordering the Great
Lakes and by 24 percent in the Province of Ontario. Kilometres/miles travelled within the
same areas increased 20 percent for the US states and 56 percent for Ontario. The
increase in registered vehicles continues to outpace the increase in licensed drivers.
Population growth and urban sprawl are expected to challenge the current and future
transportation systems and infrastructures in the Great Lakes Basin (USEPA and EC,
2007).

33
Increasing urbanization, particularly urbanization that is dominated by decentralized,
automobile-dependent development, has the potential to increase driving, congestion, and
the health effects associated with automobile emissions. The higher concentration of
vehicles, congestion and air-borne pollutants in densely settled areas have led some to
conclude that concentrated development worsens air quality. This conclusion may be
valid on a local basis, but not on a wider scale of analysis. The best way to view air
pollution is not on a city-versus-suburban basis, but to look at the region as a whole.
Mobile sources of pollution are caused by the existence of auto-dependent development
outside dense cities. Without low-density suburban development, many of the auto trips
causing congestion and pollution would not be necessary and travel demand would shift
dramatically to less polluting modes, such as transit, biking and walking. Although great
strides have been made in vehicle fuel efficiency and improvements in air pollution
control technology, those advances are offset by more people driving (and often driving
larger vehicles like SUVs and small trucks) and larger populations exposed to air
pollutants. In fact, the EPA has stated that although technological improvements have
reduced per mile emissions compared to the 1970s, growth in the number of cars, the size
of vehicles, and distances travelled has offset progress in reducing air emissions, causing
an overall increase in emissions from vehicles (Gilham, 2002).
Interestingly, many air quality parameters have improved in the Great Lakes Basin (and
elsewhere in Canada and the US) in recent decades. A 2002 Fraser Institute report
demonstrated that average ambient levels of sulphur dioxide decreased by 61.4 percent in
Canada between 1974 and 1999 (Fredricksen et al, 2002). Some major cities experienced
even greater improvements, including a 66 percent reduction in Toronto and 77 percent
reduction in Montreal. Annual mean levels of nitrogen dioxide level also declined
between 1974 and 1999. Toronto‘s reduction of 12 percent was less than the national
average of 28 percent, although Hamilton, Ontario, experienced a 50 percent decrease in
this air quality parameter. Finally, carbon monoxide levels also declined significantly
between 1974 and 1999, with an average national reduction of 76 percent.
But not all the trends are positive: Although total suspended particulate matter declined
from the early 1970s until the mid-1990s in most Canadian cities (with parallel trends in
both PM10 and PM2.5.), there has been a troubling upswing since the mid-1990s, clearly a
matter of concern. Ground-level ozone increased in the1980s and 1990s and the most
recent evidence from Environment Canada suggests a continuation of this trend into the
2000s, with a national increase of 12 percent from 1990 to 2005. The national trend was
entirely attributable to increased ozone concentrations in the Great Lakes-St Lawrence
region (which already had the highest levels in the country): levels rose by 17 percent in
southern Ontario and by 15 percent in southern Quebec, while in other regions, the ozone
exposure indicator showed no increase (EC, 2007). One of the primary contributors to
ground-level ozone is the transportation sector (through emissions of NOx and VOC, two
ozone precursors). Similar air pollution trends have been noted in the US, although
oxides of nitrogen there have increased (in contrast to trends in Canada) by 17 percent
from the 1970s to the end of the 1990s, due in part to an increase in vehicle use (USEPA,
34
2000).
Even if some urban air quality indicators are showing recent improvement, it does not
follow that vehicle emissions are no longer an environmental or health problem. Cars and
trucks produce half of all toxic air pollution emitted in the US. A typical car in the US
emits five tons of carbon dioxide a year (Environmental Defense, Undated). Cars and
light trucks emit 20 percent of the nation‘s greenhouse gas emissions, more than two-
thirds of the carbon monoxide, a third of the nitrogen oxides, and a quarter of the
hydrocarbons (Surface Transportation Policy Project, Undated). And although declining
heavy industry and more stringent regulations of point-sources are reducing the number
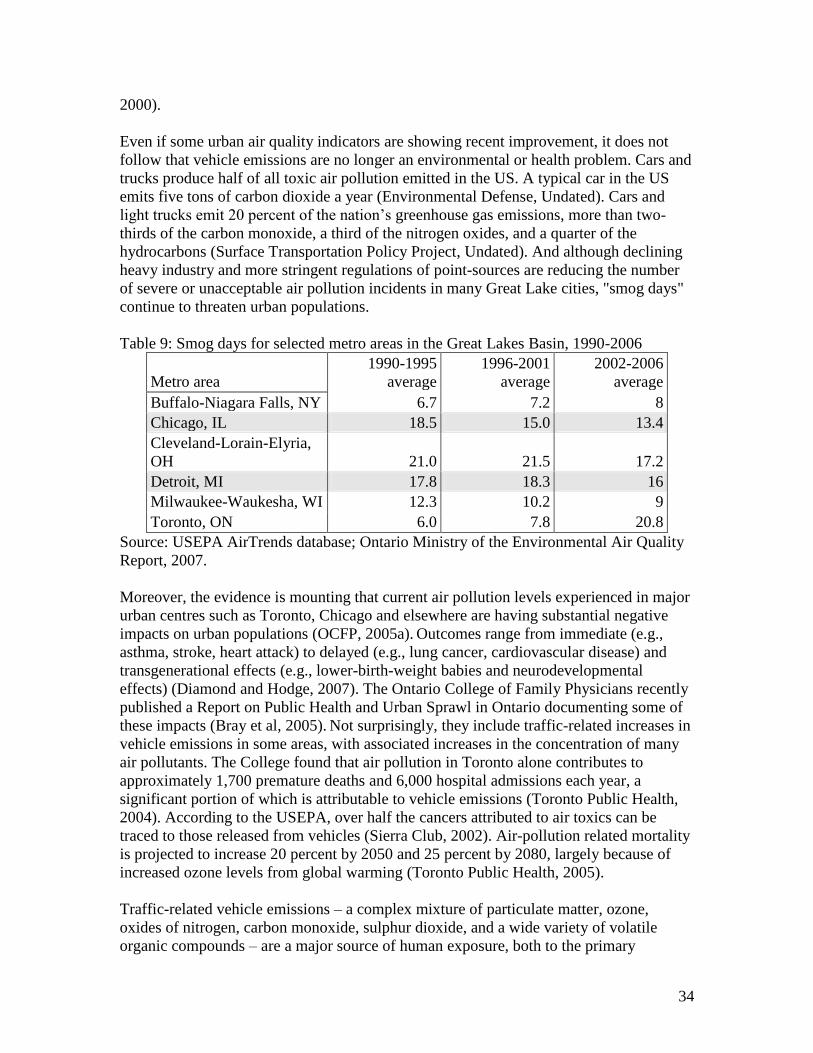
of severe or unacceptable air pollution incidents in many Great Lake cities, "smog days"
continue to threaten urban populations.
Table 9: Smog days for selected metro areas in the Great Lakes Basin, 1990-2006
Metro area
1990-1995
average
1996-2001
average
2002-2006
average
Buffalo-Niagara Falls, NY 6.7 7.2 8
Chicago, IL 18.5 15.0 13.4
Cleveland-Lorain-Elyria,
OH 21.0 21.5 17.2
Detroit, MI 17.8 18.3 16
Milwaukee-Waukesha, WI 12.3 10.2 9
Toronto, ON 6.0 7.8 20.8
Source: USEPA AirTrends database; Ontario Ministry of the Environmental Air Quality
Report, 2007.
Moreover, the evidence is mounting that current air pollution levels experienced in major
urban centres such as Toronto, Chicago and elsewhere are having substantial negative
impacts on urban populations (OCFP, 2005a). Outcomes range from immediate (e.g.,
asthma, stroke, heart attack) to delayed (e.g., lung cancer, cardiovascular disease) and
transgenerational effects (e.g., lower-birth-weight babies and neurodevelopmental
effects) (Diamond and Hodge, 2007). The Ontario College of Family Physicians recently
published a Report on Public Health and Urban Sprawl in Ontario documenting some of
these impacts (Bray et al, 2005). Not surprisingly, they include traffic-related increases in
vehicle emissions in some areas, with associated increases in the concentration of many
air pollutants. The College found that air pollution in Toronto alone contributes to
approximately 1,700 premature deaths and 6,000 hospital admissions each year, a
significant portion of which is attributable to vehicle emissions (Toronto Public Health,
2004). According to the USEPA, over half the cancers attributed to air toxics can be
traced to those released from vehicles (Sierra Club, 2002). Air-pollution related mortality
is projected to increase 20 percent by 2050 and 25 percent by 2080, largely because of
increased ozone levels from global warming (Toronto Public Health, 2005).
Traffic-related vehicle emissions – a complex mixture of particulate matter, ozone,
oxides of nitrogen, carbon monoxide, sulphur dioxide, and a wide variety of volatile
organic compounds – are a major source of human exposure, both to the primary

35
pollutants emitted and secondary compounds. Exposure studies show that concentrations
of air pollutants such as coarse particulate matter (PM10) can be much higher along busy
roadways than in other parts of a community. Health studies directed at traffic corridors
suggest that populations living, working and/or going to school in close proximity to busy
roads are at greater risk for adverse health outcomes than others in the community.
Studies suggest that the health risk can be 50 percent greater for those who live or work
near busy traffic corridors (World Health Organization, 2000; OCFP 2005c). People are
also exposed to air pollutants while in their cars. A recent City of Toronto report showed
in-vehicle daytime concentrations of fine particulates to be consistently higher than 24-
hour provincial air standards and that curb lane measurements for cyclists and sidewalk
measurements for pedestrians were even higher (Toronto Public Health, 2006).
Subsequent reports from Toronto‘s Department of Public Health continued to press this
point: A report published in July of 2004 set as its first priority for action on emission
sources the need to reduce emissions from the transportation sector (Toronto Public
Health, 2004). In this respect, it claimed that the ―two goals deemed most significant for
air quality are: Increasing ridership on public transit within the Greater Toronto Area and
curbing urban sprawl, and integrating land-use and transportation planning to both
decrease dependence upon cars and trucks and encourage the use of alternative modes of
transportation.‖
Sprawl can also have negative health impacts through its effects on human activity levels.
Many recent studies demonstrate that increased sprawl is associated with higher rates of
obesity, greater risk of physical inactivity and increased risk of other chronic diseases,
including cancer, and even reproductive impacts (Lopez 2004; Sturm 2004; Vandergrift
2004; Pearson et al 2000; Perera et al. 2005; Perera et al., 2006). People who live in car-
dependent communities walk and ride bicycles less, weigh more and are more likely to
suffer chronic morbidity related to lack of physical activity and obesity. These conditions
include high blood pressure, diabetes, and cardio-vascular disease (OCFP, 2005b).
Urban sprawl also has major repercussions on rural landscapes. Virtually all old growth
forest in the Great Lakes Basin has been logged, so most forests are relatively young.
Habitat fragmentation is a major problem in remaining forest tracts near urban areas,
which may be entirely isolated or linked only by narrow corridors. Agricultural lands are
also heavily impacted by sprawl. Topography, climate and good soils have combined to
make the Great Lakes region the most diverse and productive rain-fed agricultural area in
North America. About 35 percent of the land area of the Great Lakes Basin is
agricultural. As shown in Table 11, conversion of this land to urban uses is widespread.
Between 1982 and 1997 the Great Lakes Basin lost more than 5.5 million acres
(22,454.448 sq km) of farmland, an area greater in size than Lake Ontario, most of it to
dispersed residential development(Great Lakes Commission, 2001).
Table 11: Farmland loss in the Great Lakes Basin by state/province, 1982-1997
State/Province Loss (acres) % of total
Illinois 55,283 1.00

36
Indiana 214,084 3.86
Michigan 1,069,360 19.27
Minnesota 133,311 2.40
New York 1,157,034 20.85
Ohio 427,284 7.70
Pennsylvania 95,745 1.73
Wisconsin 900,914 16.24
Ontario (1981-
1996)
1,495,600 26.95
Total 5,548,615 100.00
Source: US Census of Agriculture (1997) Canadian Census of Agriculture (1996)
Table 12 shows population and farmland changes for selected metropolitan areas in the
Great Lakes states. Those metropolitan areas that are growing had a proportionately large
loss of farmland. Although much smaller, farmland loss also occurred in those regions
with low or negative growth, such as Akron, OH, and Buffalo-Niagara Falls, NY.
Table 10: Farmland changes and population growth in selected Great Lakes metropolitan
areas
Metropolitan area Net farmland
loss 1992-1997
(acres)
Percentage
population
growth 1990 -
2000
Chicago-Gary-Kenosha, IL-IN-WI (13 counties) 119,963 11.1
Indianapolis, IN (9 counties) 71,945 16.4
Ann Arbor, MI (3 counties) 29,007 18.1
Grand Rapids, MI (4 counties) 19,946 16.1
Minneapolis-St. Paul, MN (13 counties, including
2 in Wisconsin)
100,653 16.9
Buffalo-Niagara Falls, NY (2 counties) 10,584 -1.6
Akron, OH (2 counties) 10,693 5.7
Source: US Census of Agriculture (1997), US Population Census (2000)
The dispersal of the population and employment also has implications for public
finances. On the growing fringe, public infrastructure such as roads, sewer pipes, and
water mains have to be extended to serve newly developed areas while treatment and
pumping stations have to be added. Schools, hospitals and other public services must also
be provided to serve residents and workers in the new areas. Not only is it more
expensive, in general, to provide infrastructure for spread out populations than for more
compact communities, but the demands for investment in growing areas on the fringe
draws down infrastructure budgets at all levels of government and reduces the funds
available for investment in existing urban areas, investment that is sorely needed
(Gilham, 2002). In older parts of the basin and especially in the oldest inner city areas,
public infrastructure is aging and beginning to fail, creating huge costs in areas where the

37
tax base to support them has been hollowed out by the relocation of commercial
activities. A recent UpJohn Institute study reveals that the Great Lakes region suffers
from above average ―place costs‖ – the costs associated with older housing and
infrastructure, more generous public services, and resulting higher tax rates (Eberts,
Erickcek and Kleinheiz, 2006).
An impact related to the decentralization of urban employment in the basin is the
abandonment of industrial sites in core areas. These now obsolete industrial lands must
be decommissioned and contaminated lands (brownfields) reclaimed, imposing additional
costs and also constraints on both public and private stakeholders. While many
brownfields are in choice sites in central areas or near transportation infrastructure,
remediating them is a risky and expensive endeavour. Remediating soil in situ can be a
long, slow process, while removing and processing contaminated soil raises issues of
safety and long-term storage. Estimates of the total amount of urban land falling within a
brownfield area in Great Lakes cities range from 4% in Milwaukee to 11% in Buffalo and
15% in Detroit (Great Lakes Commission, 2001).
In the next section, we will examine in some detail the impacts of urban sprawl and car
dependency on issues more directly related to Great Lakes water quality.
Summary
The post-war era has seen the Great Lakes‘ most dramatic highs and lows. The
development of the region‘s industrial economy attracted new residents and drove
continental economic integration, as the rise of the automobile sparked changes that are
still being felt around the world. Yet as the automobile sector began to undergo decline
and transformation, along with other manufacturing and metals industries, the population
of Great Lakes cities spread out further and further into metropolitan areas and became
more and more dependent on the very same cars that were the region‘s hallmark product.
This process was frequently accompanied by social unrest and regrettable divisiveness –
at least on the US side. More measured policy responses and a different social climate
maintained steadier and more orderly urban growth in Ontario, but no region has been
immune to the forces of urban sprawl and car dependency: Great Lakes cities are
expanding geographically at a greater rate than they are demographically and car use is
climbing faster than both. Continuing automobile-centred urban sprawl has stifled the
recovery of central cities, eaten away at farmland, limited the viability of public transit,
and generated air pollution that threatens public health.
The Effects of Urban Sprawl on Water Quality in the Great Lakes Basin
Metropolitan development and transportation activity affect the environment in countless
small ways. The city draws in resources such as raw materials and industrial components,
food, energy, fresh air and fresh water and sends out manufactured products along with a
variety of contaminants: contaminated air, contaminated stormwater and sewage, and
solid waste, which also contaminate the environment. The sources of these contaminates
may be large and originate from point sources (such as power plants or sewage plants), or

38
they may be dispersed over larger areas, such as vehicle emissions along roadways, or
stormwater runoff. In the past, most research and regulation focused on point sources of
pollution, such as industrial discharges. With the loss of heavy industry from many cities
and the trend towards low-density growth with greater urban coverage and more vehicle
emissions, attention has begun to shift to non-point sources and the cumulative impacts of
urban development on the natural environment. These sources are more difficult to
characterize scientifically and subject to regulatory control (Diamond and Hodge, 2007).
This section is focused on the impacts of urban development on water quality in the Great
Lakes Basin. Although the evidence is rarely one-sided, on balance, the research
presented here suggests that sprawling, automobile development aggravates the impacts
of urban development, when compared to compact, transit-friendly development.
Stormwater Runoff
One of the most important consequences of urbanization is the conversion of soft,
pervious land surfaces (fields, forests, and so on) to hard, impervious surfaces (roads,
parking lots, and roofs). On average, about 25 percent of a typical community in Canada
or the US is comprised of impervious areas, but this figure may include rural areas with
5-10 percent impervious coverage and central cities, with 70 percent or more impervious
cover.
Although central cities have a higher proportion of impervious coverage than do
suburban areas, low-density suburbs cover by far most of the territory in the basin‘s
metropolitan areas and therefore contribute disproportionately to the impervious coverage
of urbanized areas (Gilham, 2002). And although suburban areas may appear green, the
compacted turf found in many suburban parks and lawns have sharply different properties
than the forests and farmlands they replace, i.e., they tend to produce high rates of runoff
with a high concentration of pollutants from the application of insecticides, herbicides
and fertilizers (Centre for Watershed Protection, 2002).
A recent report prepared for the IJC by concluded that per capita discharges decrease
with increasing population density. According to the authors:
This point bears emphasis because it implies that lower density
development with less impervious surface coverage yields greater rates of
runoff on a per capita basis than dense urban development that consists of
mostly impervious surface coverage. Thus, whereas contaminated runoff
from areas with high impervious surface coverage contains high
concentrations of contaminants, the high population over which the
discharge is averaged reduces the per capita discharge rate. Conversely,
lower concentrations in stormwater runoff from low-density developments
are achieved by dilution…. One key point to this discussion is that lower
density developments require more impervious surface coverage for
roadways than high-density developments and emissions from the

39
transportation sector decrease as a function of higher population density
(GHK International Canada, 2003).
Impervious surfaces cause rain and melting snow to flow over warm, often polluted
surfaces and be diverted into storm and combined sewer systems. The water flow is then
conveyed into receiving waters, often with minimal or no treatment. This process changes
natural hydrologic systems in urban areas, by changing the timing and volume of flows. It
also creates new point sources of pollution at storm sewer outfall points, and increases
the loadings of nonpoint source pollutants associated with automobile traffic. These
include road salt, particulates, the various metals and organic pollutants associated with
road wash-off.
In general, the changes to the hydrological cycle in urbanized areas are proportionate to
the amount of paved area. Changes in urban hydrology are area noticeable when as little
as 10 percent of the watershed land surface is impervious, as might be found in a rural
area with 2-acre lots (Schueler, 2004). At higher levels of imperviousness, more
significant alteration of stream characteristics may occur. Typical suburban development
has 10-25 percent impervious cover, and exhibits significant alteration in the timing and
duration of stream flows. When a watershed‘s impervious cover exceeds 25 percent,
more significant changes in stream function take hold; streams in such regions usually
cannot support beneficial uses such as fishing and swimming or serve as a reliable source
of drinking water.
In rural areas with little impervious cover, stream flows rise slowly during and after a
rainfall event, except in agricultural areas that are extensively tile drained, and gradually
return to pre-storm levels again. The hydrograph (plot of stream flow versus time) in
these systems is low and wide. By contrast, stream flows in urban centres exhibit much
higher peak flows (two to three times higher than in the undisturbed state), a much faster
rise to peak flows, and demonstrate lower base flows. Total flow volume increases in
urbanized areas, because up to 90 percent of water is diverted into lakes and streams
through storm sewers, rather than infiltrating into soils as would be the case in an
undisturbed landscape. As a result, a fully developed watershed can generate fifteen to
twenty times more runoff than an undeveloped area (Centre for Watershed Protection,
2002). For example, a one-acre parking lot generates about sixteen times the run off
volume compared to an undeveloped meadow (Schueler, 1995).
The increased volumes and spikes in flow that characterize urban areas lead to more
frequent flooding of rivers and lower stream levels between storm events. Lower flows
during periods between storms may affect the aquatic habitat and the ability of a stream
to dilute toxic spills. Higher flows often result in stream bank erosion and decreased
stability. Streams may widen to two to four times their predevelopment width if
stormwater from developed areas is uncontrolled (USEPA, 2001). As a result, many
urban streams have been transformed into hardened channels designed to conduct
stormwater as quickly as possible to receiving water bodies.

40
Urban development causes a variety of other water quality impairments in urban streams,
all of which vary in severity and duration depending on the proportion of impervious
cover. One such impairment is the elevation of summer stream temperatures (up to 8
degrees Fahrenheit or 4.5 degrees Celsius higher than would be observed in a comparable
shaded rural stream) due to the warming of runoff as it travels over heated urban surfaces.
High volumes of warmed runoff increase temperatures in receiving water bodies, thus
potentially harming cold water fish species and other aquatic life.
Urbanization can also contribute to the acidification of regional water bodies. High levels
of airborne SO2 and NOx (from industrial activities and transportation sources) in large
urbanized areas increase the acidity of the rainfall to levels above those typically found in
the region. Runoff from paved surfaces and other impervious surfaces may have little or
no opportunity to contact soils that could buffer the acidity of the rainfall. Thus, greater
impervious coverage can increase the acidity of receiving streams rapidly and lead to
high peak acidity levels (USEPA, 2001).
Other impairments result from the contaminants from vehicles washed off roads, parking
lots and driveways, including metals such as copper, lead, zinc and cadmium, oils and
grease, anti freeze, and PAHs. In regions with cold winters, such as in the GLB,
roadways and parking lots require large quantities of salt, which is also eventually
released into the watershed. Also of concern are the variety of pesticides, nutrients and
other lawn care products, as well as bacteria from pet waste, washed off suburban lawns
and sidewalks. Ironically, these contaminants are similar in nature to those found in the
runoff from agricultural areas displaced by suburban development.
Stormwater runoff is rarely treated in the Great Lakes Basin (as elsewhere) and therefore
delivers its contaminate load directly to receiving water bodies. On the Canadian side of
Great Lakes Basin alone, annual discharges from urban runoff are in the order of 105
tonnes of suspended solids, 104 tonnes of chloride, 10
3 tonnes of oil and grease, and 10
2
to 103 tonnes of trace metals (Marsalek and Schroeter, 1989). This undermines the ability
of streams, rivers and lakes to support aquatic life or recreational uses such as swimming,
boating or fishing.
The health impacts of some of these contaminants are well established. The organic
compound Alachlor, which can lead to eye, kidney, brain, spleen, heart, prostate and
ovary problems, is an herbicide that occurs in runoff (USEPA, IRIS 1987). Herbicides
also can contain endothall, which is linked to stomach problems, brain and skeletal
malformations, weight loss, and kidney and adrenal discoloration (USEPA, IRIS, 1987).
Runoff from paint and batteries sends cadmium, which is linked to kidney damage and
cancer, into surface waters (Occupational Safety and Health Standards, 2000). A
significant public health issue associated with runoff is the addition of pathogens to
receiving waters. When stormwater scours pollutants off pavement it can transport to
receiving waters protozoa such as Cryptosporidium and Giardia, which lead to
gastrointestinal illnesses and other health problems associated with animal fecal waste.
Further, the increased levels of disinfection required to combat the increased levels of
pathogens magnify the risk of haloacetic acids, which are disinfection byproducts linked

41
to an increased risk of cancer and may cause pregnant women to miscarry (US
Department of the Interior, 2003).
Apart from increasing the impervious surface area, suburban development also affects
water quality during the construction phase. When construction activities remove
vegetation, exposed soils are no longer held in place. Construction site runoff can erode
exposed soils and transport sediment to receiving waters. The US Environmental
Protection Agency reports that ―erosion rates from construction sites are typically an
order of magnitude larger than row crops and several orders of magnitude greater than
rates from well-vegetated areas, such as forests or pastures (USEPA, 2007).‖ Unless
erosion controls are in place, construction sites can discharge more than 1,000 tons of
sediment per acre per year. In contrast, forested lands contribute on average only 1 ton of
sediment, or 0.1 percent of the amount from construction site runoff. Concentrations of
suspended sediment from residential construction sites can average 40 times greater than
from already-developed areas (USEPA, Undated).
Sediment loads created by increased erosion can cause a broad range of impacts in
receiving waters, including reduced water storage capacity, impaired dissolved oxygen
for aquatic organisms, decreased light penetration, increased need for dredging, increased
costs for water treatment, and adverse effects on fish and shellfish.
Suspended sediment in aquatic systems degrades aquatic habitat and damages
commercial and recreational fisheries. Siltation, or the process of depositing sediment, is
the leading cause of impaired water quality in streams. Streams more than 5 km
downstream from construction activities can be impacted. Construction site runoff in
receiving waters increases turbidity, which reduces light penetration, smothers benthic
(aquatic insects) communities, causes injury to gilled organisms, and reduces dissolved
oxygen concentrations by filling in the interstitial spaces in streambeds. These processes
impair the functions of aquatic ecosystems, which results in degraded water quality and
loss of aquatic habitat. Sedimentation also alters streambed conditions, which reduce fish
spawning habitat, and spawning/reproductive success therefore declines. The result is a
loss in fish diversity, with particular stress on cold water fish species like salmon and
trout, which are intolerant of the high temperatures and low oxygen concentrations
typical of many urban streams.
As a result of these impacts, water quality in many rivers, lakes, and estuaries in urban
areas across the US and Canada, including the Great Lakes Basin, is degraded to a point
where those water bodies can no longer support basic uses such as fishing and swimming,
and cannot be relied on as sources of clean drinking water. According to the EPA‘s most
recent National Water Quality Inventory, approximately 40 percent of surveyed bodies of
water in 1996 were too polluted for basic uses. In general, the USEPA ranks urban runoff
as the second most prevalent source of water quality impairment in the US for estuaries,
and the third most important source for river and lake impairment (USEPA, 1998). In the
Great Lakes states, contaminated sediments and urban runoff are the primary sources of
the pollutants impairing water quality.

42
Municipal Water Use
Urbanization trends create the condition for very high rates of potable water use. Recent
data show that the US ranks first in the world in per-capita water consumption, and
Canada is second, with consumption rates of 1800 and 1600 cubic metres of water per
person per year, respectively. These consumption rates are twice those in France, three
times those in Germany, four times those in Sweden, and eight times those in Denmark.
Overall, our consumption is at least 65 percent higher than the OECD average (OECD,
2000). Canada has been particularly criticized for its steady rise in consumption rates – a
25.7 percent increase between 1980 and 1998 (University of Victoria Eco-Research Chair
of Environmental Law and Policy, 2001).
Water use can be measured in terms of total withdrawals or consumption. Water
withdrawals in the GLB come from three sources: the lakes themselves, the tributaries to
the Great Lakes, and groundwater. As Figure 4 shows, the vast majority of withdrawals
are from the Great Lakes. Although the amount of surface water in the basin exceeds that
found anywhere else in the world, it does not follow that there are no threats to water
supply from these sources. Proposals to divert water from the GLB to more arid areas of
the US, climate change (which may lower lake levels while raising water withdrawals)
and future needs for agricultural, municipal and industrial purposes that are difficult to
predict all create uncertainty about the ability of the Great Lakes system to meet human
uses and maintain ecological processes while responding to environmental change (IJC,
2000). This is a powerful argument in favour of greater conservation efforts and for
building cities that put less of a burden on surface water bodies.
Figure 4: Sources of water withdrawals in the Great Lakes Basin
NB: Figures exclude hydroelectric uses.
Source: Great Lakes Commission, Annual Report of the Great Lakes Regional Water Use
Database Repository, 2006.

43
Consumption refers to the net loss of water due to evaporation, transpiration, losses
during conveyance, incorporation into products and crops, or consumption by people or
livestock. As shown in Figure 5, from a water consumption point of view, the three
largest users are agriculture (livestock and irrigation, 22 percent), public and domestic
water supply (34 percent) and industry (20 percent). Given the focus of this report on
urban development trends, most of this sub-section will focus on municipal (i.e., public
and domestic) use.
Figure.5: Consumption of water in the Great Lakes Basin by type of use
NB: Figures exclude hydroelectric uses.
Source: Great Lakes Commission, Annual Report of the Great Lakes Regional Water Use
Database Repository, 2006.
From 1950 to 2000, the population served by public water systems in the US grew 159
percent, from 93.4 million to 242 million people. During the same time, public water
use—primarily household, government, and commercial uses—grew 207 percent, from
14 billion to 43 billion gallons per day. Over the same period, total per capita water use
has grown from 149 to 179 gallons per day. Per capita water use did not change from
1995 to 2000, but it declined slightly from 184 gallons per day in 1990 to 179 in 1995,
perhaps due to conservation efforts that have since been overtaken by other factors
(USEPA, 2006).
Environment Canada data show a national average per-capita consumption rate of about
638 litres (169 gallons) per person per day, very similar to US levels. Yet, only a small
proportion of this municipally treated water – less than 3 percent - is actually used for
drinking. As much as 65 percent is used for bathing and toilet flushing, and in some
regions up to three-quarters of the total residential water demand is for lawn and garden
watering and car washing. There is, therefore, good potential for water conservation,

44
although apparently little inclination – or perhaps incentive – to embark on such
programs, possibly because of the perception of unlimited water available in the Great
Lakes and the lack of water pricing mechanisms in many jurisdictions.
Cities and towns in the arid West of the United States have long faced water scarcity;
now cities across the US and Canada are facing water shortages. Even states and
provinces along the Great Lakes are taking measures to promote water efficiency and
prevent the export of water outside the watershed. Although the Great Lakes are the
largest reservoir of fresh water in the world (containing 20 percent of the world‘s fresh
surface water), water experts warn that changes in policies and practices are necessary to
preserve the lakes‘ contribution to the region‘s quality of life and economic growth
(Michigan Land Use Institute, 2005).
The population and economic growth that is forecasted for the GLB will inevitably create
more demand for water. How that growth takes place affects how much additional water
will be needed. High levels of water use cause both environmental and economic
problems. On the environmental side, high consumption places stress on lakes, tributaries
and groundwater. As well, the discharge of contaminated water once it has been used
damages aquatic ecosystems. On the economic side, high levels of water use require
expensive investments in water system infrastructure needed to gather, deliver and
dispose of water (dams, reservoirs, water treatment facilities, distribution networks and
sewage treatment). Increasing costs is a crucial issue in urban sustainability because
higher infrastructure costs make urban regions less economically efficient and mop up
(mostly public) money that could be used to otherwise enhance quality of life and social
equity.
The most common characteristics of suburban growth—large lots, low density, and
dispersed development—all increase the cost of delivering water. Large lots are a major
contributor to residential water use as they tend to increase water use for lawn care, car
washing, swimming pools, and other outdoor uses, which together can account for up to
70 percent of household water use. In general, areas with low density, large lots, and
large lawns require more water than areas with high density, small lots, and small lawns.
For example, a study of Seattle-area households found that reducing densities from 12
dwelling units per acre to four units per acre increases water use for landscaping by 158
percent per household (USEPA, 2006).
Lot size also increases the length of the pipes serving households and commercial
buildings, entailing higher costs. A study in the Journal of the American Planning
Association used an engineering cost model to assess the influence of lot size and
location on the cost of water distribution and sewer services. The study estimated
infrastructure costs at $143 per year for a household located on a 0.25-acre lot in a
compact development near the treatment facilities. If the same household moved to a 1-
acre lot in a similar location, its annual infrastructure cost would be $272, even if it did
not increase its water use. If that household used the same amount of water on a 1-acre
site in a dispersed development far from the treatment facilities, its water and sewer
infrastructure would cost $388 annually (Speir and Stephenson, 2002). When existing
45
systems pay to extend service to new, large-lot, dispersed developments, they generally
raise all water rates, effectively forcing existing users, including those on small lots in
central areas, to pay for service to new users.
Water systems in sprawling developments may also be more susceptible to leaks and
breaks, through which up to 30 percent of potable water can be lost. This treated water
may find its way into the sewer system, adding to strains on that infrastructure, or into
groundwater, contributing to contaminant loads. Systems in low-density areas must use
higher pressures to push water through longer mains to meet higher household demand,
all of which tends to increase losses. Consequently, water systems in lower density
suburban developments will tend to leak more than systems serving compact
development. This poses a significant financial burden for system operators, and
ultimately, taxpayers (Kenny, 1999).
Many water systems throughout the GLB – as elsewhere in the US and Canada – face
maintenance backlogs and looming replacement costs. In many municipalities of the
GLB, the water infrastructure system contains pipes laid more than a century ago.
Demand for new water systems in developing areas may lead communities to lay new
pipes rather than fix old ones. As a result, the leakage and breaks common to older
systems grow, and the cost of operating an increasingly inefficient system grows with
them. For example, water losses from aging water infrastructure in Detroit are 17.2%,
while in Toronto the figure is 10%. In Montreal water losses amount to a staggering 40%.
Water availability and cost are related to the water quality issues discussed in the last
section. Water system operators must use more chemicals and other treatment methods to
bring contaminated water up to public standards for drinking water, thus increasing its
cost. As we saw in the last section, the quality of source waters depends in part on the
proportion of impervious surfaces in the watershed. Preserving undeveloped land by
focusing development in appropriate areas is emerging as a key strategy for maintaining
water quality and reducing costs for municipal water treatment.
Wastewater
With rising water consumption comes a parallel need to convey, treat, and dispose of
wastewater. Sewage treatment plants (STPs) are a key source of pollution as they gather
contaminants from numerous diffuse sources, most with trace emissions, and emit them
into surface water bodies. STP discharges into aquatic systems are important sources of
PCBs and other persistent compounds originating from urban areas. Sewage collection
and discharge also funnel into surface waters less persistent but potentially highly
biologically active contaminants, such as human pharmaceuticals, cosmetics and other
personal care products. Even modern STPs do not remove these pollutants and they are
routinely discharged to receiving water bodies. These contaminants can also find their
way into groundwater if sludge from STPs is used to fertilize farmers‘ fields in the city's
hinterland, or from malfunctioning on-site wastewater systems.
In older cities, such as those found around the Great Lakes, sanitary and stormwater

46
collection systems are often combined. During storm events, the combined volume of
sewage and stormwater may overwhelm the capacity of STPs, spilling untreated sewage
and stormwater into receiving water bodies. In these situations, the chemical
contaminants mentioned above are joined by discharges of nutrients (phosphorus and
nitrogen) and microorganisms (bacteria, viruses, encysted parasitic organisms). The EPA
estimates that 1.3 trillion gallons of raw sewage are dumped by CSOs each year, and that
these municipal point sources are the most important cause of impairment to the nation‘s
estuaries (USEPA, 2001; USEPA, 1998). In 2002, CSOs‘ discharges of inadequately
treated sewage from treatment plants were responsible for 25 percent of closing and
advisory days at US beaches where information on known sources of beach water
contamination were provided (Dorfman, 2004). According to a Canadian study, discharge
volumes from sewage treatment plants are similar to those from industrial sources and
also pose a significant threat to receiving water bodies (Chambers et al, 1997).
In the past three decades, multi-billion dollar investments to upgrade municipal sewage
treatment systems in the Great Lakes Basin have abated some of the worst pollution
problems, such as the extreme eutrophication of Lake Erie and Lake Ontario. However,
despite these advances, the fact remains that much of the surface waters surrounding
large urban areas are often unsafe for bathing, lack biological diversity, and the local fish
are unsafe to eat (IJC, 2004). This is largely due to contamination caused by the sewage
dumped directly into local waters.
Combined sewer overflows are a major threat to water quality in the Great Lakes states—
which are home to 43 percent of the US‘s 828 CSO communities—making water unsafe
for swimming, boating or fishing during the worst events (Environmental Integrity
Project, 2005). A report card on sewage in the Great Lakes Basin conducted by Sierra
Legal found that Cleveland and Detroit report CSO overflows that exceeded five percent
of the total sewage flow. Other cities with major CSO problems are Windsor, Syracuse,
Toronto, Hamilton and Milwaukee. Overall of the 20 cities examined in this report their
combined CSOs add up over 92 billion litres in one year, the contents of more than
37,000 Olympic size swimming pools.
Some CSO impacts are well documented. For example, information developed from the
Great Lakes Water Quality Agreement links CSOs to many ―Areas of Concern.‖
Indiana‘s Area of Concern, the Grand Calumet River, receives the discharge from 15
CSO outfalls, which release untreated municipal waste (USEPA, 2003). Annually, these
outfalls discharge an estimated 11 billion gallons of raw wastewater into the Grand
Calumet River and Indiana Harbor. Approximately 57 percent of the annual CSO volume
is discharged within 8 miles of Lake Michigan, resulting in nearshore fecal coliform
contamination. For two weeks in October 2001, the Detroit Wastewater Treatment Plant
spewed approximately 5.2 billion gallons of ―diluted raw sewage,‖ ―partially treated
sewage‖ and other ―unspecified discharge‖ into the Detroit and Rouge Rivers, which
empty into Lake Erie (MDEQ, 2001). This massive discharge was caused by
approximately three inches of rain. Similar discharge events occur in CSO communities
throughout the Great Lakes Basin.
47
When humans are exposed to microbial pathogens in surface waters that have been
contaminated with raw or inadequately treated sewage, they can contract illnesses
ranging from temporary stomach cramps to life-threatening conditions, such as
inflammation of the heart. While in a healthy population most of the illnesses resulting
from exposure to inadequately treated sewage are relatively minor, they can become
serious in more vulnerable populations, including pregnant women, young children, the
elderly, and people with suppressed immune systems (such as people with HIV,
transplant recipients, and cancer patients). This group accounts for 20 to 25 percent of the
U.S. population and is rapidly growing in number (Gerba et al, 1996).
Untreated or inadequately treated sewage also has significant impacts on the ecology of
receiving water bodies. When enough sewage is discharged, microorganisms in fecal
matter deplete the oxygen of the receiving waters. Hypoxic conditions causes fish kills,
noxious odours, and habitat loss, leading to decreased tourism and recreational water use
(USEPA, 2000). According to the EPA's most recent national water quality assessment,
low dissolved oxygen is the third most frequent pollution problem in impaired estuaries
and the largest known pollution sources in this regard are municipal sewage treatment
plant discharges (USEPA, 2000). Dissolved oxygen levels in Lake Erie, whose
revitalization has often been trumpeted as one of the great success stories of the 1972
Clean Water Act, remains "a persistent problem," according to the EPA (USEPA, 2001).
In municipalities served by STPs, increasing development usually results in an increased
volume of flow to treatment plants. When development is spread out, sewage collection
is more expensive, system breakage is more likely, breaks can be more difficult to locate,
and repairs can take longer than in densely populated areas. Hundreds of water main and
sewer line breaks are reported each year in Basin municipalities and conveyance losses
per cent are common. In cases where the proposed development would exceed the
treatment capacity of the system, new facilities must be built and pipes extended before
additional users can be added to the system. By diverting public money from separating
combined sewers and upgrading existing treatment plants, sprawl contributes to the
pollution loads on receiving bodies of water.
With exurban sprawl beyond the urban fringe, a larger proportion of the population is
being served by private on-site septic systems, which are of variable age, treatment
capacity, maintenance-level and effectiveness. Incompletely treated effluent from these
systems often enters aquifers and receiving waters. Regulatory controls on private septic
systems are weak or even absent in some jurisdictions. Even where such controls are in
place, considerable staff and fiscal resources are required to inspect thousands of private
systems regularly and enforce available laws. It is therefore difficult to locate and correct
aging and failing systems, with the result that some areas experience very high rates of
nutrient and microbiological pollution, largely from inadequate septic system
performance.
Additionally, raw septage pumped from these septic systems is often hauled by ―honey-
wagons‖ and then spread on agricultural land. Each year, 60 million gallons of septage is
land-applied in Michigan alone and this amount is increasing because 50 percent of new

48
homes in the Great Lakes states have an on-site wastewater system. Some smaller peri-
urban municipalities are now served by communal septic systems, treating wastes from
several hundred homes; here again, system age and effectiveness can vary widely and the
cost per household to hook-up to one of these systems in often prohibitive.
As with water distribution, the available evidence indicates that the cost of wastewater
collection and treatment in municipalities served by centralized sewage treatment
facilities rises as densities fall. A study by the Water Pollution Control Federation noted
the importance of spatial features in influencing costs of wastewater services. It identified
total land area and density as being important factors that influence wastewater
infrastructure costs. According to the WPCF, total land area is "a major determinant of
the level of capital costs experienced by a wastewater utility and to a lesser extent
operating cost (Water Pollution Control Federation, 1984)."
But a report done for the Natural Resources Defence Council found that even operating
costs could be substantially affected by service densities. The report analyzed wastewater
collection systems in the Chicago and Cleveland areas, and found that operation and
maintenance costs increase significantly – in some cases more than twice as high – as the
density of development decreases. This study also suggested that in municipalities that
charge uniform rates for service across areas with different densities, residents and
businesses in more compact neighbourhoods are likely to be subsidizing those in more
sprawling ones, for both water supply and wastewater management facilities. The authors
concluded that "If local governments can significantly reduce O&M costs by growing
smarter, they can increase levels of public services and/or reduce costs, thereby reducing
financial burdens and increasing the quality of life for their citizens (Natural Resources
Defence Council, 1998)."
Groundwater
Urbanization in the Great Lakes Basin has also raised concerns related to groundwater.
Groundwater is important to the Great Lakes ecosystem because it provides a reservoir
for storing water and for slowly replenishing the Great Lakes through base flows in the
tributaries and through direct inflow to the lakes. Groundwater also provides moisture
and sustenance to plants and other biota. Most important for our purposes, groundwater
serves as a source of potable water for many communities in the basin, comprising up to
20 percent of the basin‘s population. The USGS estimates that over 8 million people on
the US side of the border rely on groundwater as their source of drinking water and in
some parts of southern and south-western Ontario; a large proportion of the population is
entirely or heavily reliant on groundwater supplies for potable water. In Ontario, 1.3
million people are directly dependent on groundwater for their potable water supply,
most of them in communities located within the Great Lakes Basin (Nowlan, 2005).
Withdrawals for human use represent only about 5 percent of the total withdrawals from
the Great Lakes Basin. Although there is no evidence that these withdrawals affect Great
Lakes water levels, as the IJC's report to the Parties on water quality in the basin makes
clear: "The effects of groundwater withdrawal may… be of concern on a local or

49
subregional basis, particularly with respect to urban sprawl, even if withdrawals do not
have a major impact on the overall water budget of the basin (IJC, 2000)."
Sprawl can affect both the quantity and quality of groundwater. In areas reliant on
groundwater supplies, heavy water use and rapid urbanization are drawing down aquifers
at an unprecedented rate. According to the United States Global Change Research
Program, US groundwater levels are predicted to decline over the next 100 years as a
result of climate change (US Global Change Research Program, 2000). The greatest
impacts of this decline would be felt during the dry summer season when wetlands and
streams are dependent on groundwater for base flow. Even in areas with plentiful rain,
potable water resources can dry up because sprawl development replaces wetlands and
forests while paving over natural recharge areas with impermeable parking areas, roads,
and buildings. As described in the last section, this redirects rainwater directly into lakes,
rivers and streams instead of contributing to the replenishment of underground aquifers.
A recent study conducted by Smart Growth America, the Natural Resources Defence
Council and American Rivers measured the average yearly loss of stormwater infiltration
due to the increase in impervious surfaces associated with urban development for a
number of metropolitan areas in the US. Two metropolitan areas in the Great Lakes Basin
were included in the study, ranking among the top 20 metro areas with the greatest land
conversion rates (i.e., from non-urban to urban) from 1982 to 1997. For Chicago, the
average yearly infiltration loss from 1982 to 1997 was estimated to be between 10.2 and
23.7 billion gallons of water, enough water to supply the average daily household needs
of 270,000 to 680,000 people per year. In Detroit, the comparable figures were between
7.8 and 18.2 billion gallons per year (American Rivers et al, 2002).
In some regions of the basin that are dependent on groundwater, water consumption rates
are rapidly outstripping available supplies. Some of these areas are under considerable
development pressure, however, because of their convenient location close to
employment markets and pleasant lifestyle away from major urban centres. The
conjunction of heavy development pressure with limited water supplies is therefore
placing critical strains on groundwater in those regions. On the US side of the border, for
example, the Chicago–Milwaukee metropolitan region began experiencing groundwater
shortages in the 1970s. After lowering pumping rates, groundwater levels started to
recover in the 1980s, but some in some districts, they continue to decline (Visocky,
1997).
On the Ontario side of the border, the Kitchener-Waterloo area has been experiencing
groundwater shortages since the 1990s. Some demand-side responses (such as water
conservation programs and outside water use restrictions) have been implemented, but
much thought has been devoted to expanding supply, including the building of costly
pipelines to lakes Erie or Huron, hundreds of kilometres away from the municipal users.
Such proposals clearly have major energy implications, in addition to any concerns about
disruption of the local or regional environment and security in an age of international
terrorism.

50
On-site septic systems have been identified as a major threat to groundwater and near
shore water quality in the Great Lakes Basin. Pollutants in runoff from encroaching
suburban sprawl undermines groundwater quality by introducing new sources and more
intensive concentrations of contaminants, e.g., pesticides from lawns, de-icing salts from
roads, spills from gas stations, toxic contaminants from waste disposal sites, and so on.
Moreover, as aquifers are depleted, the increasing pollutant loadings are being
concentrated in a smaller volume of groundwater. The experience of Kitchener, Ontario
shows what happens when a well becomes contaminated by run-off from encroaching
urban areas. The Greenbrook well field was formerly located in a rural area but is now
within the urbanized area. The increased load of de-icing salt from the street network
resulted in a steady increase in chloride concentrations in the wells. When industrial
chemicals were found in the supply water in 2004, the wells were closed (Crowe et al,
2002).
Wetland and Riparian Zone Degradation
The extensive freshwater marshes of the Great Lakes coasts are unique in ecological
character, size and variety. They range from small wetlands nestled in scattered bays to
extensive shoreline wetlands such as those of southwestern Lake Erie, freshwater
estuaries such as the Kakagon Sloughs of northern Wisconsin and the enormous
freshwater delta marshes of the St. Clair River (GLIN, 2006).
Wetlands in the Great Lakes Basin provide habitats for many kinds of plants and animals,
some of which are found nowhere else. For ducks, geese and other migratory birds,
wetlands are the most important part of the migratory cycle, providing food, resting
places and seasonal habitats. Wetlands also play an essential role in sustaining a
productive fishery, with many species of Great Lakes fish depending on coastal wetlands
for successful reproduction.
Wetlands are also vital for protecting the quality of both surface and ground water.
Wetlands are called nature's kidneys because they act as a natural filtering system and act
as buffers between open waters and uplands sources of contamination. Near urban and
agricultural areas, wetlands play an important role in water purification. They trap,
uptake and transform harmful nutrients, heavy metals, pesticides, bacteria and organic
pollutants from stormwater runoff and sewage outfalls before they can flow into
downstream water bodies. They also recharge groundwater aquifers and absorb
floodwaters, protecting shores and coasts from floods and reducing erosion and
sedimentation of surface waters. Plants also slow down flowing water and thereby cause
silt to settle out. Finally, wetlands often are the headwaters that contribute to baseflow of
tributaries, streams, rivers, and reservoirs (USEPA, 2002).
Sprawl is a significant factor contributing to the rapid loss of critical wetland areas.
Wetlands often are ditched and drained in order to accommodate new building or to
provide alleged mosquito control. Stormwater run-off from encroaching urban
development deliver pollutants loads from vehicles, house and lawn chemicals, factories
and power plants. Runoff loads of nutrients and organic matter typically exceed the

51
assimilative capacity of wetlands and contain persistent compounds that are not subject to
degradation but accumulate in the system. In such cases, wildlife at the wetland is
exposed to elevated concentrations of these persistent compounds (Helfield and
Diamond, 1997). Creation of more impervious surfaces allows more pollutants to be
more quickly carried into wetlands at volumes and velocities that can destroy vegetation
in wetlands. Native wetland vegetation can be replaced by nonnative, invasive plant
species that are aesthetically pleasing, but do not provide equivalent wetland functions
for water quality. Sedimentation from construction activities can contribute to the
choking off of wetlands.
Wetland degradation can be as devastating as complete wetland loss because degraded
wetlands lose their ability to perform their valuable functions. When development
projects disturb wetland areas, they often are required to mitigate losses by creating
artificial wetlands in another location. However, successful creation of equivalent
wetland functions is rarely accomplished (Zedler et al, 2001). Remediation of existing
wetlands is also challenging: It is questionable that wetlands within highly urbanized
areas can be remediated fully due to heavy sediment and chemical loadings from runoff
and atmospheric deposition (Helfield and Diamond, 1997).
Prior to European settlement, there were wetlands stretching from the western edge of
Lake Erie across Ohio into Indiana, and covering the southern edge of Ontario. Although
data are lacking for some areas in the Great Lakes region, we know that damage to these
wetlands has been extensive in the last century, at least partly due to urbanization
(SOLEC, 1996). For instance, it is estimated that from 73-95 percent of the original
marshlands in the coastal marsh area stretching from Toronto to the Niagara River have
been destroyed since the late 1800s (Whillans, 1982). Overall, about 70 percent of the
original wetlands in the Great Lakes have now been drained or otherwise modified from
their natural condition. Many are much reduced in area, with the result that plant diversity
has declined. Vertebrate and invertebrate organisms dependent on these habitats therefore
have also declined, including the northern cricket frog and the small-mouthed
salamander.
Data from 1992 and 2002 indicate that forested land covered 70 percent of the land
immediately buffering surface waters, known as riparian zones. These zones play a
critical role in regulating water temperatures, limiting excessive nutrient and sediment
loadings to the waterways, mitigating flood damage, and preserving biodiversity. Like
wetlands, riparian lands are affected by sprawling urban development. Riparian buffers
may be completely eliminated in some areas or disconnected strands of vegetation may
remain after development near a stream. Under these conditions, riparian lands remaining
in urban areas may not fully function to maintain water quality (GHK International
Canada, 2003).
Deposition of Air Pollutants
A sprawling, car-dependent urban form and transportation system affects Great Lakes
water quality indirectly through impacts on air quality and subsequent deposition of
52
contaminants on water bodies. Atmospheric deposition of airborne contaminants from
urban areas represents an important source of contaminants to the Great Lakes (Simcik et
al, 1996; Zhang et al, 1999). Contaminant deposition to water is linked to urban form in
three distinct ways: first, the increase in vehicle usage associated with urban sprawl leads
to higher emissions of combustion products, and secondly, more vehicles and vehicle use
results in contaminant deposition to impervious surfaces, which then enter the
atmosphere through volatilization, and finally, sprawling residential and commercial
precincts consume more electricity and other energy sources for heating and cooling,
resulting higher non-point air emissions from home and commercial furnaces and point-
source air discharges from generating stations.
In effect, urban areas act as large point sources of contaminants to the Great Lakes via
atmospheric deposition, and water quality near large urban centres reflects the influence
of urban emissions (Green et al, 2000). Atmospheric deposition is recognized as one of
the principal mechanisms by which sprawl-related emissions make their way into lake
water. This can happen through different pathways: dry deposition, in which particles
settle directly onto the surface of the water from the air; wet deposition, in which
particles and vapours get trapped in clouds, snowflakes or raindrops over the water; or by
settling onto surfaces before being washed into the lake (Blumberg et al, 2000).
Polycyclic aromatic hydrocarbons (PAHs) are generated by the incomplete combustion of
fuel, and are emitted directly by rubber, volatile fuels and oils as both particles and
vapour. Direct deposition from the atmosphere is a major or possibly the major source of
PAHs in the Great Lakes (Franz et al, 1998; Kelly et al, 1991). Among sources of
atmospheric PAHs found in Lake Michigan off the coast of Chicago, burning coal
accounts for 48 percent, natural gas 26 percent, coke ovens 14 percent, and vehicle
emissions 9 percent (Simcik et al, 1999). More recent research has shown a larger
contribution of 45 percent from vehicle emissions in total PAH in Lake Michigan
sediments, while coking accounted for 35 percent and wood burning 20 percent
(Christensen and Arora, 2007).
The lower-temperature combustion of fossil fuels in vehicle engines leaves a distinct
PAH signature. Van Metre and colleagues used this to measure PAH levels in nearby
lake sediments. Their results show that while PAH concentrations in sediments declined
in the 1970s and the 1980s due to improvements in vehicle and stationary combustion
technologies, in the 1990s PAH concentrations in sediments increased and these increases
are proportional to the increase in vehicle miles travelled over time (Van Metre et al,
2000). While these studies examined PAH, similar trends are documented for other
vehicle-related contaminants, and form a record of recent urban travel behaviour in local
waters (Sheesley et al, 2004). The data demonstrate that urban sprawl results in increased
vehicle use and emissions, and hence increased surface water contamination, despite
decreases in per vehicle/kilometre emission rates.
The short-range transport of PAH from urban activities contributes to the "halo" of
contamination that surrounds cities. At long-term collection sites close to Buffalo and
Chicago, atmospheric concentrations of PAH tripled when the wind was blowing directly

53
from the metropolitan region (Buehler and Hites. 2002; Buehler, et al. 2001; USEPA, EC,
and Cortes et al. 2000). Particles contaminated with PAH often settle on surfaces close to
where they are generated, and so make up a major contaminant in urban runoff (Van
Metre and Mahler, 2003; Hoffman, et al. 1984; Hwang and Foster. 2006). Samples taken
from Lake Michigan near Chicago showed PAH loadings 20 to 200 percent higher than
those taken from elsewhere in the lake, through both direct atmospheric deposition and
wet deposition in runoff (Buehler et al, 2001). As winds blow PAHs offshore, heavier
particles settle into the lakes within 15 kilometres of the source (Holsen and Noll, 1992;
Franz, et al. 1998). Atmospheric concentrations of PAHs over the lakes decline sharply
outside of urban areas, to the point that they are often at background levels 20 kilometres
from a city (Simcik et al. 2003; Offenberg and Baker. 2000; Simcik et al, 2006).
A slow long-term decline in atmospheric PAHs concentration is a positive sign, but their
presence in the water and sediments of the Great Lakes extends their impact (Sun et al,
2006). As vapour or particles, PAHs remain in the lake once deposited, and levels of
PAH in water increase during the winter when sediments are re-suspended in the water
(Offenberg and Baker, 2000). In lakebed silts, the presence of soot, which absorbs PAH
and is generated by many of the same processes, is also higher near urban areas (Simcik
et al, 2003). While lakebed silt cores show a gradual decline in PAH, particles
contaminated with PAH continues to settle locally and vehicle emissions make up a
growing proportion of the total PAH load (Drouillard, et al. 2006; Simcik, et al. 1996;
Helfrich and Armstrong. 1986).
The effects of PAHs are significant for human and animal health, and can be detected
among terrestrial, amphibious, and aquatic species alike (Fox, 2001; Newman and
Schreiber, 1984). PAHs work as endocrine disruptors to cause organ cancers in fish,
particularly in the native brown freshwater catfish that feed in lake and pond bottoms in
the Great Lakes states (Pinkney et al. 2004; Arcand-Hoy and Metcalfe, 1999). These
cancers have been shown to decline rapidly after emissions stop and PAH levels drop
(Baumann and Harshbarger. 1995). The same substances have definite effects on the
human body, but the exact way in which they work at low exposures over a long period
of time is troublingly unclear (Kavlock et al, 1996; Tremblay and Gilman, 1995).
Research has shown, however, that recreational use of Great Lakes waters increased
health risks from PAH exposure through dermal absorption, as measured at lakeside
beaches around lakes Erie and Michigan, and that bathers should shower after taking the
plunge (Hussain et al, 1998; Moody and Chu, 1995).
Summary
Development and transportation decisions have both direct and indirect impacts on water
quality. The built environment directly affects the quality of stormwater runoff through
replacement of natural cover with impervious surfaces (largely roofs and paved areas),
which alters the natural flow of water within a watershed. Impervious surfaces prevent
stormwater from entering the ground and replenishing groundwater. They also contribute
to flooding and erosion, which can reduce water quality. Moreover, runoff from urban
areas carries contaminants such as pesticides and heavy metals from car batteries.
54
Contaminated runoff in turn impacts the quality of water in receiving water bodies, both
on and below the surface. Thus, the amount of impervious surface as a percentage of land
area in a watershed can be correlated to the health of an area‘s streams, rivers, lakes, and
its groundwater.
Urban development also directly affects water quality by increasing the demand for
treated water. High levels of water consumption may stress lakes, tributaries and
groundwater. Higher water consumption also entails more wastewater production. The
discharge of contaminated water once it has been used may damage aquatic ecosystems.
Water use and wastewater discharge also have indirect effects on water quality. High
levels of water use require expensive investments in the water system infrastructure
needed to gather, deliver and dispose of water (dams, reservoirs, water treatment
facilities, distribution networks and sewage treatment). This has an indirect impact on
water quality in that higher infrastructure costs reduce the amount of public money that
would otherwise be available to enhance environmental protection programs.
Groundwater is affected by urban development in that rapid urbanization can draw down
aquifers through direct withdrawals or by redirecting precipitation to surface water bodies
instead of permitting infiltration to the ground. Moreover, pollutants in runoff from
encroaching urbanization can threaten the quality of ground water near urban areas.
These pollutants can also undermine wetlands in and around urban areas, destroying
habitat and crippling the ability of these natural areas to perform their ecological
functions.
Urban development and transportation decisions also have indirect impacts on water
quality by affecting air quality. The distribution of employment opportunities and the
location and design of residential precincts influence household travel behaviour,
including trip frequency, trip lengths, and mode of choice. Vehicle travel, in turn,
generates air pollution, in addition to consuming fossil fuels and producing greenhouse
gas emissions, and this in turn contributes to the deposition of contaminants onto the
Great Lakes.
Responses
Urbanization in the Great Lakes Basin, as elsewhere, is a complex phenomenon with
many causes and effects. Urban growth itself places stress on underlying ecological
processes and infrastructural systems, but we have argued that the particular form that
urbanization has taken over the last 50 years or so in the Great Lakes Basin has
aggravated these stresses. While we do not ascribe to the theory that governments can
significantly reduce the pace of urban growth, we believe it is possible for public policies
to shape development such that the ecological impacts are reduced to a minimum while
still meeting social and economic goals. Essentially, the challenges are as follows:
reduce vehicle emissions
reduce urban stormwater runoff volumes and toxicity
reduce sedimentation from construction sites

55
reduce demand for potable water and improve system efficiency
reduce groundwater withdrawals and pollution of groundwater
reduce sewage volumes and toxicity.
Two general responses are available to mitigate or reverse the impacts: structural
techniques or planning approaches.
Structural Responses
Structural responses include initiatives that mitigate site level problems and reduce
environmental impacts through the implementation of new technology or development or
fixed infrastructure.
Vehicle Emissions
While technological advances in vehicle technologies and fuels are expected to reduce
emissions from vehicles in the coming years, it is generally recognized that these
advances will not be sufficient to protect human health, given the growing volume of
traffic on roadways, particularly in large urban centres. Organizations such as the World
Health Organization have concluded that policy efforts must also be directed at
controlling the growth of traffic volume (World Health Organization, 2000).
Similarly, air pollution control technology is available and continually improving, but is
not a preventive solution. When pollutants are removed from vehicle exhaust, industrial
emissions, or ambient air, those materials must be disposed of, creating a further
environmental challenge and the potential for other kinds of environmental degradation.
One response to the challenge of commuter traffic congestion and associated air pollution
is to construct new roads or widen existing ones, especially in areas that have
experienced rapid growth; indeed, this has been the dominant transportation development
strategy of the last half-century. Evidence is mounting, however, that building our way
out of congestion is no longer feasible, not only because it is increasingly expensive but
because new roads tend to induce more traffic and quickly become congested again.
Commuters quickly shift their routes, timing and modes of travel, which brings
congestion back, again to its pre-expansion peak level. Moreover, the new capacity may
attract new businesses or residents to the region or encourage them to locate in areas
newly served by the expanded road network, fuelling sprawl and contributing to the
resumption of pre-expansion congestion levels (Downs, 1992).
Another potential structural solution is to create new high-occupancy vehicle lanes. HOV
priority lanes can be justified as a more efficient and equitable allocation of road space
(travellers who share a vehicle and therefore impose less congestion on other road users,
are rewarded by bearing less congestion delay), an efficient use of road capacity (they
can carry more people than a general use lane), and as an incentive to shift to more
efficient modes. HOV lanes usually carry fewer vehicles than other lanes but they often
carry more people. However, such lanes only reduce congestion when created through the

56
addition of lanes to existing highways, and therefore have the same problems associated
with them as described for roadway expansion.
Certainly, as we begin to re-think the movement of people and materials through the
basin, it would be possible to shift the focus to the strategic planning and development of
better light rail and public transit systems, and to couple that planning with long-term
planning for residential and industrial, commercial, and industrial development. This
potential response will be examined in the next section.
Sewage collection and treatment
Municipal sewage treatment technology is also evolving, although more slowly than in
the air domain. The challenge for sanitary sewage treatment is the expanding
―sewershed‖ due to sprawl (and corresponding increases in conveyance losses), and the
sheer volume of flows as the basin population increases. Many sewage treatment plants in
the region are already at or near capacity, so the structural response available here is to
build more plants and/or extend the capacity of existing facilities, an expensive
proposition.
As mentioned above, spread out development creates a more expensive and brittle
sewage collection system: pipes are longer and breakages are more plentiful. One
solution is to decentralize sewage treatment rather than rely on a central, monolithic
system. This notion is gaining acceptance throughout the basin, with growing interest in
community-level wastewater treatment systems. Nevertheless, most urban centres in the
basin continue to rely on highly centralized sanitation systems and thus must pay the high
costs of infrastructure to serve development on the distant urban fringe.
Stormwater management
Urban stormwater management is another key challenge. Cost is a major obstacle in the
treatment of urban stormwater, because of the large volumes and wide areas involved.
While it would be possible to treat all stormwater to the level of tertiary municipal
sewage treatment, the costs would be huge. Instead, most municipalities rely on so-called
―best management practices‖ (BMPs) such as stormwater detention ponds and infiltration
trenches. While these structures are not expensive on an individual basis, the large
number needed to serve a municipal area means that the cumulative costs can be very
large. There are more than 700 stormwater ponds in the Toronto region alone. Many
municipalities have allowed their storm ponds to fall into disrepair simply because of the
costs required to maintain them properly. The Town of Richmond Hill, just north of
Toronto (population of 163,000 in 2006) has 40 detention ponds requiring regular
maintenance dredging. In addition to the various permits, assessments and approvals
required from senior government, the estimated dredging and spoil–disposal cost is about
$4 million for just one of these 40 ponds in this relatively small community. Few
municipalities are budgeting for the capital and operating costs associated with this
maintenance. Yet such maintenance is essential for good environmental performance: as

57
these ponds become filled with contaminated sediment, their impact on underlying and
down-gradient groundwater quality increases significantly.
In fact, the performance of these ponds is rarely monitored or regulated, and varies
hugely from site to site depending on factors such as the age and maintenance condition
of the structure, proximity of other structures, water table depth, the character and depth
of underlying surficial and bedrock geology, slope, and soil cover. In an ideal site, a new,
well-maintained stormwater detention pond can remove up to 55 percent or more of total
phosphorus in stormwater, but an older structure, poorly maintained, may remove less
than 5 percent (ASCE, 2001). Similarly, a single stormwater detention pond in the lower
reaches of a stream may be effective in reducing the impact of the highest flows on
downstream systems, without impinging on base flow levels. But sited in a headwater
region, in close proximity to similar structures, the same pond may contribute to
fundamental alteration of downstream base flows. The selection of urban stormwater
treatment measures must therefore be tailored to individual site conditions, including
soils and slope, and may require planning tools (e.g., dynamic continuous modelling of
surface and groundwater flows) not available to all but the largest municipalities.
In inner city areas, the space available for traditional ―best management practices‖ like
stormwater detention ponds is extremely limited, and property costs are very high. Much
stormwater in these areas is therefore untreated, or is combined with sanitary flows in a
combined sewer system. Cities like Toronto, Hamilton, Chicago, and Milwaukee have
responded to this challenge by building major stormwater or combined sewage storage
tanks or tunnels, in which flows can be held until the storm event has passed and flows
can be released gradually into treatment facilities or directly into watercourses. These
facilities, while effective, are extremely expensive to construct and unless thoroughly
grouted and sealed, can be adversely affected by groundwater surcharge which
significantly diminishes the retention capacity of these structures. This problem has
recently been recognized in the Milwaukee deep-tunnel. Toronto‘s four-kilometre
Western Beaches Storage Tunnel, completed in 2002, is designed to contain
approximately 2.9 million cubic metres of untreated stormwater and sanitary sewage a
year into the lake, cost $52-million and yet serves only a fraction of the city‘s total land
area. Other major Great Lakes cities, including Chicago, also have tunnels designed to
capture runoff from heavy rain storms in underground tunnels, funded through federal
infrastructure grants.
Lot-level controls are also possible, and in a few locations these ―low-impact
development‖ practices, such as rain gardens, downspout disconnections, and rainwater
collection systems, are already actively encouraged. In Minneapolis, for example, a new
program couples new water user fees with incentives and discounts for homeowners who
adopt rain water detention tools like rain barrels and rain gardens. Those participating
receive credit on their water bills.
Other structural responses to excessive stormwater run-off quantities include permeable
paving, which allows water to permeate through paved surfaces or at joints between
paving blocks. Once touted as a promising method of reducing run-off volumes in urban

58
areas, permeable paving has proved to be much less effective than anticipated, largely
because of frost heave and clogging problems. Regular jet washing of permeable systems
can be used to keep voids clear, but is an expensive and labour intensive operation
(McCormack, Undated).
Limitations of Structural Responses
Although large scale structural options can certainly help to mitigate some of the stresses
associated with urbanization in the Great Lakes Basin, the above discussion suggests that
they often tend to be costly to build and operate, and thus require a substantial tax base to
be sustainable. In urban areas with declining population, or those with very low-density
development, the necessary fiscal capacity may not be available and such options may
therefore be of limited use. Moreover, many of the structural options that are affordable
have already been implemented in the Great Lakes Basin, but their effectiveness is being
overrun as watersheds develop, populations‘ increase and non-point pollution sources
multiply. Under these conditions, even well-informed managers are finding it difficult to
hold the line on environmental impacts.
Under these conditions, a shift in perspective may be needed. Structural solutions are
most often based on so-called ―supply-side management.‖ This approach takes existing
growth trends (including population growth, development patterns, and consumption
trends) as a given. Existing trends are used as a basis for projecting future demand and
negative impacts of growth are addressed by putting in place the technology and
structures needed to increase capacity or the efficiency of existing capacity. More
treatment plants, detention ponds, pipelines and groundwater pumping stations are
installed based on the belief that demand is insensitive to policy and with little regard for
local ecological limits.
However, given the increasingly stringent financial realities faced by governments in the
basin, the mounting unintended impacts of supply-side approaches to ensuring water
quality are increasingly at odds with a transition to a sustainable society. The perspective
that appears to be emerging is that more strategic approaches are needed that are aimed at
managing the scope of human demands placed on ecosystem services. This approach
casts large scale structural approaches as a ―last line of defence‖ after other smaller scale
(i.e., lot level) and demand management techniques have been put in place to minimize
the need for large scale solutions.
This is the approach that is being used in Ontario, where the Ministry of the
Environment‘s stormwater design manual refers to a ―treatment train.‖ As a first line of
defence, municipalities and developers/builders are encouraged to use lot-level controls
such as green roofs or swales to reduce runoff and improve quality. Redesigning streets
and parking lots to minimize impervious cover works on a large scale to reduce runoff
and contamination. Only after several layers of such controls at ever larger scales are in
place, are municipalities encouraged to plan for large-scale structural solutions.
Meanwhile, other provincial ministries are encouraging regional cooperation, compact
urban growth, preservation of open space, and even a mega-scale greenbelt in the Golden

59
Horseshoe, along with other planning principles to reduce water-related problems at their
source. While we shall not ignore the small-scale interventions, it is the strategic planning
issues that interest us most here: i.e., reducing the need for large-scale structural
interventions by linking water planning to the wider issues of urban form, transportation
systems and development practices in order to mitigate environmental pressures at their
source (IJC, 2000). This is the topic of the next section.
Planning Responses
We have argued above that the car-dependent, sprawling nature of urban development in
the GLB is a major factor in undermining the environmental integrity of the basin. In
reaction to these unsustainable trends a broad movement is emerging that addresses
pressures of growth and sprawl, and engages citizens in envisioning new approaches to
planning and development that are more sustainable and protective of our quality of life.
Smart growth, a term that is becoming widely used to describe this movement, addresses
the importance of development patterns to environmental sustainability, while linking
with and addressing broader social and economic issues within our communities. It was
defined by the City of Austin Texas – one of the first cities in the US to draft and adopt a
smart growth initiative – as "an effort to reshape urban and suburban growth to enhance
our communities, strength the economy, and protect the environment."
The assumption behind smart growth is that with the right land use, transportation,
environmental and public finance strategies, we can enhance the quality of life in
communities, preserve ecological integrity, and save infrastructure and other costs over
the longer-term. The smart growth movement has captured the middle ground between
the ―any growth is good growth‖ mentality that was presiding over the creation of
sprawling, car-dependent cities, and the ―no growth is good growth‖ reflex of some
resident associations and environmental groups trying to stop the growth bulldozer. The
smart growth movement endorses growth as vector of change and improvement, but
aspires to channel or direct growth to achieve environmental and social goals.
The smart growth movement also represents a compromise between those who advocate
a low-density decentralized urban form in order to reduce the concentration of human
activities and associated ecological impacts (e.g., impervious surfaces, traffic, and air
pollution) and those advocating compaction of settlements to minimize travel, land
consumption and infrastructure costs. The consensus that has emerged is a vision of a
hybrid urban form that favours an urban structure based on high-density, mixed use
activity areas linked by good quality transit surrounded by lower-density but walkable
neighbourhoods equipped with local services and shops. A key part of the vision is that
all urban areas should deploy green technology (e.g., green roofs) and site design (e.g.,
maximum pervious surfaces) to minimize ecological impacts (Newman and Kenworthy,
1999).
Although the components of the smart growth vision vary depending on the author, certain
key elements are common throughout this literature:

60
preserve agricultural and other non-urbanized land outside the urban area and
direct new development towards existing communities
make more efficient use of existing infrastructure before extending services to
new areas
preserve and link green spaces into a green network
encourage site design techniques that reduce run-off and other environmental
impacts of development
promote mixed-use development and walkable neighbourhoods
achieve more compact urban patterns through higher density new development
and more efficient use of already-urbanized areas, including brownfields
redevelopment
promote a clear urban structure through creation or strengthening of mixed-use
sub-centres (so called ―nodal‖ development)
provide viable alternatives to single-occupancy automobile use, including transit,
walking and biking
create a range of housing opportunities and choices
promote collaboration among neighbouring communities to develop regional
growth strategies and address common issues.
With its focused, practical agenda, smart growth has attracted a wide range of allies
among the U.S. financial institutions; for instance, those that want to preserve their prior
investments in city centres by preventing further flight to the suburbs. Labour unions see
that sprawl is dispersing employers into low-wage and non-unionized shops on the edges
of cities. Developers want to save money by forcing municipalities to let them build
housing on smaller lots with narrower streets. Residents‘ associations are tired of
subsidizing new growth in sprawling areas through their property taxes; they want to see
mechanisms put in place to ensure that the cost of growth is borne by those who benefit
from it. Environmentalists aim to reduce automobile dependence and the associated
energy use and air pollution, while minimizing the footprint of the city in terms of land
consumption.
Thus, for the first time, advocates of local economic development, environmental
preservation, fiscal accountability, and healthy communities advocates are all speaking of
a package of policy measures that has many common themes. This package is also
characterized by a wide diversity of means, including growth management plans and
zoning bylaws to encourage compact growth, financial incentives to attract development
to designated growth centres, public-private partnerships on smart growth projects, public
education programs, voluntary measures by businesses, and so on (Campsie, 2001).
Smart Growth at the Provincial/State Level
The smart growth movement is gaining momentum across North America.
A review of the one Canadian province and eight US states bordering the Great Lakes
reveals a diversity of smart growth legislation and programs (Great Lakes Commission,
2006; American Planning Association, 2002).

61
Ontario
Ontario has attempted to manage growth via planning policy statements and municipal
reorganization (creation of regional municipalities and amalgamations) for decades. By
the end of the 1990s, however, traffic congestion and other problems associated with
growth and urban sprawl had reached such a pitch in the province (especially in the
rapidly growing urban centres in the Golden Horseshoe) that the Conservative
government was forced to launch a Smart Growth Agenda, including the creation of a
Smart Growth Secretariat and a series of regional panels charged with recommending
smart growth solutions. However, one of the government‘s first initiatives under the
program was to announce a massive expansion of the province‘s highway-building
program, estimated at $10 billion, not a typical plank in the smart growth platform.
With the election of the Liberals in 2003, some of this confusion was cleared up and the
province began pursuing a more ―conventional‖ smart growth agenda. On the regional
planning front, the province created Places to Grow, a long-term metropolitan land use
and transportation plan for managing growth in the Greater Golden Horseshoe, and set up
the Green Belt, a protected greenbelt stretching around the Golden Horseshoe from
Niagara Falls to Lake Scugog. In terms of providing guidance to municipal planning, the
province has made changes to the Planning Act that gives municipalities more authority
to manage growth sustainably, and adopted a stronger provincial Policy Statement that
includes many smart growth elements. Other initiatives include the allocation of two
cents per litre of the provincial gas tax revenues to municipalities for public transit, and
brownfield standards and redevelopment assistance (Winfield, 2005). To address the
infrastructure deficit in smaller centres, which was laid bare by the Walkerton tragedy,
the province is offering large scale funding to municipalities to improve their water and
sewage infrastructure. The province also passed a Clean Water Act in 2006 that requires
source water protection linked to development plans.
Wisconsin
Wisconsin overhauled its land use planning system in 1999, requiring all counties,
municipalities, Native American tribes and (advisory) regional planning commissions to
adopt a comprehensive plan. Municipalities and counties retain final authority over
development, but must bring their zoning, subdivision and official map ordinances into
compliance with their comprehensive plans by 2010. The state makes comprehensive
planning grants available to local governments each year, and communities that receive
the grant must coordinate their planning process with the local MPO and relevant state
agencies. Local governments can collaborate on joint comprehensive plans, but all must
be developed with public participation, and include nine elements to address a wide
gamut of issues including land use, transportation, green space, and agriculture. State
legislation has set up innovative infrastructure financing programs, allowing local
governments to use tax increment financing (TIF) to support brownfield redevelopment
and open space. In 2005, the state expanded its brownfield remediation and
redevelopment efforts.

62
Minnesota
Minnesota passed a state Community-Based Planning Act in 1997, which offered
planning grants for communities developing comprehensive plans and directed the
Minnesota Planning Office to review local plans for conformity with eleven statewide
smart growth goals. The Act lapsed in 2001, and parallel initiatives to create a more
rigorous EIS process and draw a statewide development plan disappeared around the
same time due to changing political priorities. The Planning Office continued to provide
technical support to local planning processes until it was closed in 2005. In 2002, the
state added smart growth elements to the criteria that must be addressed when evaluating
proposed bond issues, including whether the project is located in an urban area, whether
it is on a brownfield site, or whether it has previously incurred administrative sanctions or
penalties from the state Pollution Control Agency.
Illinois
Illinois experienced a period of intense political interest in smart growth in the late 1990s
and early 2000s, but repeated attempts to pass legislation to encourage more robust local
land-use planning requirements and deepen regional coordination were defeated. A Local
Planning Technical Assistance Act that requires local governments to develop
comprehensive plans was passed in 2002, but has not been funded by the legislature. The
governor created an interagency Affordable Housing Task Force by executive order in
2003, which offers housing planning grants to interested municipalities, but has done
little to significantly expand financial resources for affordable housing. In 2004,
agreement between the governor and legislature was finally achieved when the Local
Legacy Act was passed. Under the Act, counties may voluntarily create joint
county/municipal plans to preserve natural areas, agricultural land and cultural assets, and
a multi-agency board provides technical assistance and coordination with state
government. The Illinois Office of Brownfields Assistance offers redevelopment grants
for municipally owned brownfield sites, and low-interest redevelopment loans to
municipalities and the private sector.
Indiana
Indiana has only minimally pursued statewide smart growth planning initiatives, and has
generally focused on voluntary efforts. In 1999, the governor created the Land Resources
Council to advise local governments on growth management. Though the Council
brought together representatives from multiple sectors and levels of government, it was
considered ineffective and underfunded, and was dissolved by a new governor in 2005
only to be reinstated in 2006. The Indiana Land Use Forum was created in 2001 to
suggest new ways for the state to collaborate with local governments, but it is unclear if
its recommendations were implemented. Legislation in 2005 created a Regional
Development Authority to develop and fund transportation facilities and other projects
for Indiana‘s second-largest metropolitan area, around Gary in the northwest corner of
the state. The Indiana Brownfields Program is centred on easing the financial burden of

63
brownfield remediation, offering state assistance to local governments to buy and
remediate contaminated sites.
Ohio
Ohio requires its counties and townships to develop comprehensive plans and use them as
a basis for zoning, though the requirement is only marginally enforced. A bond measure
in 2000 led the way for a Clean Ohio fund that was created in 2004. The fund dedicated
$100 million a year for four years to conserve green space, buy agricultural conservation
easements, support recreational trail networks, and redevelop brownfield sites. The state
program was successful, frequently attracting local matching funds well in excess of the
required 25% minimum, and its funding was extended into 2007. Efforts are currently
underway to renew Clean Ohio in the next budget cycle. With its creation in 2005, the
Lake Erie Balanced Growth Program introduced voluntary watershed-based growth
planning and offered funding for planning and executing ―balanced growth‖ plans. Three
pilot watershed planning projects are currently underway, along with efforts to develop
and track indicators for the success of the growth plans and the state of the lake and its
tributaries.
Pennsylvania
Pennsylvania passed the Growing Greener initiative in 1999 to provide $650 million in
funding for agricultural land preservation, drinking and wastewater infrastructure, state
and local recreation areas, and watershed projects. Growing Greener II was approved in
early 2005, offering another $625 million and expanding the program‘s remit to include
mine remediation, green energy, natural and open space preservation, conservation
easements, urban redevelopment, and related projects. In 2000, the Growing Smarter
legislation reinforced the legal authority of local land use plans and set up a committee to
coordinate the land use decisions of state agencies. Growing Smarter offers incentives to
municipalities that join to develop intermunicipal comprehensive plans; if they do so,
they will have priority for state funding and permits, and be permitted to transfer
development rights and share revenues between municipalities. Pennsylvania‘s Land
Recycling Program offers liability relief and voluntary standards for brownfield cleanup
projects by private landowners, and the Brownfield Action Team acts as a central state-
level coordinating body for more ambitious municipally-led remediation projects. The
current governor as well as the previous officeholder both implemented policies directing
state agencies to apply smart growth criteria in administrative decision-making and in
dealing with counties and municipalities, such as denying applications for state
environmental permits if the proposed facilities or services are in conflict with local
comprehensive plans. A 2004 bill created Transit Revitalization Improvement Districts to
encourage TOD, and provided for funds to support planning and implementing
development and redevelopment near transit.
New York

64
New York introduced a state smart growth policy as the Quality Communities Initiative
in 2000. An interagency working group evaluates and reports on how state agencies
follow eight Quality Community Principles that include basic smart growth concerns
such as sustainable development, urban revitalization and transportation choice. Dual
brownfields remediation programs persisted during the 1990‘s: a Voluntary Cleanup
Program that assisted private owners in restoring brownfield properties using internally-
developed standards, and a more stringent Brownfields Program that applied more
stringent Superfund standards to municipally-owned brownfields. Both were replaced by
a consolidated Brownfields Cleanup Program, using the Superfund criteria, in 2003. The
ongoing Open Space Protection Plan process reviews the condition and outlook for open
spaces in the state, and guides continuing state investment in open space. The acquisition
of open space, along with natural and cultural lands, are funded through an annual
appropriation to the state (currently $225 million) Environmental Protection Fund. A bill
to allow municipalities to create their own conservation funds with revenue from a real
estate transfer tax is currently stalled in the state Senate, as is a Smart Growth
Infrastructure Policy Act requiring state agencies to evaluate infrastructure projects in
light of smart growth criteria.
Michigan
In February 2003, the Governor of Michigan created the Michigan Land Use Leadership
Council (MLULC). The 26-member council, representing public and private interests,
was charged with identifying the causes and trends of unmanaged growth in Michigan
and providing policy recommendations that would enable local governments to better
manage land uses. The Council submitted its final report and accompanying
recommendations to the Governor in August 2003. The report identified inherent flaws
with the land use decision-making structure and also attributed sprawling patterns of
development in the state to outdated planning processes and zoning ordinances. The
report presents over 200 recommendations, including investing more state and federal
money in urban infrastructure and transportation, with a focus on cities, towns and
counties seeking regional cooperation; encouraging denser development, including small-
lot zoning and multifamily housing; and spurring purchases of farmer developments
rights (PDR) by issuing agricultural conservation bonds. Since the release of the report,
the state has passed legislation to implement some of the key recommendations,
including amendments to the Joint Municipal Planning Act that enables local government
to undertake multi-jurisdictional planning and urban revitalization. Michigan has had
Brownfield Redevelopment Policy since 2001. The policy includes liability exemptions,
cleanup-related financing, redevelopment-related financing (e.g., for infrastructure), and
tax incentives (Great Lakes Commission, 2006).
Smart Growth at the Metropolitan Level
While we clearly cannot review smart growth initiatives in the 34 metropolitan areas
found in the Great Lakes Basin, we can describe two representative metropolitan-level
visions for altering the course of urbanization in the Great Lakes Basin: Toronto and
Chicago.

65
Toronto
After a 2003 election voted out a government hostile to growth controls, the new Ontario
provincial government announced a series of initiatives to create a new land-use and
transportation framework for the wider Toronto metropolitan region known as the
―Greater Golden Horseshoe‖. A new metropolitan land-use plan set out the basic
metropolitan structure, while a plan for a new Greenbelt, incorporating strict
development controls for ecologically important conservation lands and somewhat looser
controls on development in rural areas, is an attempt to set a more general boundary for
urbanization. More recently, a package of transit investments has been announced that
promises to dramatically expand the regional network of transit corridors.
Places to Grow
Called Places to Grow (PtG), the 2006 land use plan mandates that at least 40 percent of
the annual residential growth occur in existing built-up areas. A series of high-density
urban growth centres, located in the existing downtowns of suburban and satellite cities
as well as emerging urban nodes in and around the core city of Toronto, will serve as
focal points for public and institutional investment. New, existing and improved higher-
order transit is to connect the urban centres with a series of intensification corridors. The
plan does still permit greenfield development in designated areas, but Places to Grow sets
a minimum density of 50 residents or jobs per hectare, along with transit-supportive
urban form and mixed land uses, for new greenfield development. Existing municipal
land-use plans, some of which approve significant low-density greenfield development,
are grandfathered into the Places to Grow plan. The plan projects three major new
highway corridors through undeveloped land and areas that the Greenbelt Plan (see
below) protects from major new development: a highway linking the northern fringe of
Brampton to the city of Guelph; an extension of the 407 eastward along the rural northern
tier of suburban Pickering, Whitby, and Oshawa; and a corridor running from the US
border crossing near Niagara Falls and up the centre of the agricultural areas of the
Niagara Peninsula to the outskirts of Hamilton (Ministry of Public Infrastructure
Renewal, 2006).
Greenbelt Plan
The 2005 Greenbelt Plan is centred on two protected natural corridors: the north-south
Niagara Escarpment that runs along the western edge of the Toronto region, and the Oak
Ridges Moraine that runs east-west through the suburban regions north of the City of
Toronto. Both corridors are home to unusual glacial landforms that are highly
ecologically sensitive, and that extend far beyond the boundaries of the region to lakes,
wilderness areas, and other rural regions. Beyond these special areas, the Greenbelt area
consists of ―protected countryside‖ interspersed with ―natural heritage systems‖; the
natural heritage areas, along with the core of the Escarpment and Moraine areas, are
subject to the strictest controls on new development. While the Plan sets up a detailed
hierarchy of areas with varying permitted development densities and impacts, it generally

66
allows new construction to continue in most of the Greenbelt, though subject to stringent
conditions to minimize impacts on water resources, core natural areas and specialized
agriculture (Ministry of Municipal Affairs and Housing, 2005).
MoveOntario and Metrolinx
After the Greenbelt and Places to Grow plans were released in 2005 and 2006, the
government announced MoveOntario in 2007. This initiative is not a transportation plan
in itself, but an omnibus funding effort that promises to complete nearly all of the transit
plans drawn up by Toronto-area transit operating agencies and municipalities – 52
projects in total. These include large-scale capacity expansions, corridor extensions, and
capital projects along the region‘s commuter train lines; bus rapid transit projects along
major regional highway corridors as well as local arterial streets; suburban rapid transit
lines whose technology is to be determined; extensions bringing the Toronto subway
deeper into suburban areas; and a network of priority LRT corridors in Toronto itself
(Government of Ontario, 2007). The Ontario government has committed funding for two-
thirds of the estimated $17.5 billion cost, and is asking the federal government to fund the
remaining third. Recently, the MoveOntario initiative has fallen under the umbrella of the
new metropolitan transportation authority for the Toronto and Hamilton metropolitan
area, Metrolinx. The agency is currently preparing a Regional Transportation Plan, the
final version of which is due in the fall of 2008.
Chicago
The Northeastern Illinois Planning Commission was appointed by the governor, the
mayors of Chicago and the suburban cities, the suburban counties, and local
intergovernmental agencies. NIPC, which dealt with land use planning, would set
regional projections and growth plans to guide the Chicago Area Transportation Study
that made long-range transportation plans (in collaboration with the Illinois Department
of Transportation and the Regional Transportation Authority that manages funding and
coordinates between Chicago‘s transit operators). The two agencies were merged into the
Chicago Metropolitan Agency for Planning (CMAP) over 2006-2007.
2040 Regional Framework Plan
The 2040 Plan is arranged around five regional themes that closely mirror smart growth
prescriptions. Livable communities are to offer range of housing and transportation
choices, supported by local services and incorporating local employment areas to achieve
a jobs/housing balance. Diversity emphasizes inclusive communities and equity in access
to opportunities and resources. The natural environment is to be preserved by compact
development patterns that spare agricultural land and protect natural areas. Global
competitiveness is to be pursued in part by reducing infrastructure costs through
redeveloping and revitalizing built-up areas. Collaborative governance will set regional
goals and coordinate between regional stakeholders to achieve them.

67
Action in the five theme areas is to be exercised through 17 strategies, intended to create
a regional geography built around centres, corridors and green areas. The global centre of
Downtown Chicago stands at the apex, followed by a hierarchy of metropolitan centres,
community centres, and town centres spread through the central city and the suburbs –
most in existing built-up areas, but some in emerging areas in the low-density suburbs
and at the urban fringe. The 2040 Plan holds that all centres should have balanced, mixed
uses, a sense of place, and affordable housing, and encourage transit-oriented
development. Corridors include major rail and roadway connections, highway extensions
throughout the region, including several new highways connecting a proposed airport on
agricultural land in Chicago‘s southern suburbs to the regional highway system. The
Plan‘s green areas include agricultural areas, major parks, and water resource areas, such
as wetlands, that are to be brought into state and local government ownership. A wide
fringe of existing agricultural land at the edge of the present built-up area is slated for
development in the Plan, while certain agricultural areas are to be preserved in parts of all
six regional counties (NIPC, 2006).
2030 Regional Transportation Plan
The 2030 Plan is organized around three broad goals of maintaining the existing regional
transportation system, improving its performance, and using it to sustain the region‘s
vision and values. Maintaining the system is to be pursued largely through addressing
highway congestion, using transit and information technology to free up highway
capacity and use it more intelligently. Improving the system will address interactions
between transportation and land use (as laid out in the 2040 Plan), increasing modal
choice, and smoothing commercial goods movement. The transportation system is to
support the regional vision and values by incorporating objectives related to the natural
environment, economic development, social equity, community development, public
health and safety, and security.
The Plan proposes $65 billion in capital spending, breaking the cost of its
recommendations down by time scale and project and not by mode. However, the sheer
number and length of highway projects dwarfs that of the proposed subway and
commuter rail improvements, and are prominent in less-developed areas at the urban
fringe. The Plan‘s proposals for networks of city and suburban bus rapid transit lines, and
other improved services, on regional arterials are as vague on funding and technology as
its recommended highway extensions are specific in where and how they will be built.
Smart growth features such as supporting the regional land use plan, promoting
jobs/housing balance, mandating transit-centred development patterns, and increasing
non-auto mode share are frequently mentioned, but the plan does not specify how to limit
the land use impacts of its many proposed highways, beyond calling for increased use of
road tolls (Chicago Metropolitan Agency for Planning, 2007).
Summary
Smart growth is on the political agenda throughout the Great Lakes states, in Ontario, and
well beyond, as the perception that more action is needed to rein in urban growth has

68
become a widespread public concern. Existing state legislation to support smart growth
are largely oriented at funding municipal planning efforts, supplemented in some cases
by administrative policy (set by state governors as executive directives) that instructs
state agencies to incorporate smart growth concerns into their decision-making.
Chicago‘s extensive and technically thorough regional plans for growth and
transportation build on a long history of ambitious urban development and renewal
efforts that have defined the city‘s urban landscape, for good or ill. Like other regional
plans on the US side of the Great Lakes, however, it has not served as a definitive or
binding guide for lower-level governments. The difficult political balancing act between
rural and urban interests that prevails on the US side has led states (such as Indiana and
Illinois) to act in a relatively constrained way. Efforts to force municipalities to plan more
effectively have been rare, with Pennsylvania and Wisconsin being the exceptions.
Historically, the Ontario government has been more directive vis-à-vis municipal and
regional governments, imposing or prohibiting tighter municipal land use controls as
political winds have shifted.
Some encouraging signs can be seen, forming potential building blocks for better growth
patterns. Recent heavy rail subways in Chicago and Toronto show the power of transit to
revitalize corridors and change the pattern of development. The commuter rail systems of
both cities continue to help maintain suburban downtowns as well as core urban centres,
providing living examples of the desirability of density and public amenities in
stimulating urban life. New cultural centres in downtown Milwaukee, Racine and
Cleveland have spurred national and international interest and helped bolster the health of
their downtown areas – in Cleveland, the success of the waterfront in the past fifteen
years testifies to the viability of urban redevelopment, even on some of the most polluted
land in the US. Public and private money has come together to help relaunch and
rehabilitate downtown Detroit, which was previously a symbol of the deep social and
economic barriers that divide urban communities. The challenge of smart growth is to
turn these exceptional successes into business as usual, and for citizens to make the
decisive choice to opt for development that furthers the long-term social, ecological and
economic health of their metropolitan regions.
The Barriers to Smart Growth
Smart growth is a planning concept and movement that is vying to replace conventional
planning approaches. At present, many governments are incorporating smart growth
provisions into regional planning documents, community plans and neighbourhood
designs. However positive this appears, the reality is that the current system, although
showing signs of fatigue, still has considerable momentum in the form of long-shaped
expectations and cultural attitudes, government organization, political forces, government
financial practices, and entrenched business interests. Thus, there is a wide gap between
planning visions and realization of tangible changes ―on the ground.‖
Before proceeding with our recommendations on measures that could help stem urban
sprawl and implement a smart growth vision in the Great Lakes Basin, it is important that
we understand the factors that are driving sprawl in the region and that may stand in the

69
way of implementing smart growth solutions. In this section, we review some of the
frequently cited causes of sprawl and relate them where possible to trends in the Great
Lakes Basin.
Disjointed Land Use and Transportation Planning
In this paper, we have pointed out the importance of the link between land use and
transportation systems. Unfortunately, many land use decisions are made without
properly considering the implications for transportation issues and vice versa and both are
made without full consideration of environmental impacts. The type of planning that
facilitates car-dependent urban sprawl can be characterized as ―disjointed‖ at several
levels: among departments within individual municipalities, among municipalities in the
same metropolitan region and between municipalities and senior levels of government
(Gilbert, 2003).
Municipal governments are directly concerned with both land-use and transportation
planning, but transportation and land use planners tend to work in separate departments,
with limited communication between them. Transportation engineers design road systems
to maximize the efficiency and safety of vehicle circulation and give little thought to the
impacts that wide roads with rapid vehicle movement have on surrounding communities.
Municipal planning has historically promoted the separation of land uses into distinct
districts for shopping, living, working and playing, without taking into account how this
would undermine the feasibility of public transit and the walkability of our communities.
When planners want to innovate and introduce more compact, transit- and walking-
friendly development patterns, transportation engineers steeped in conventional
standards, tend to resist.
Highway planning is carried on by transportation agencies in provincial governments that
pay little heed to municipal land use objectives. In Ontario, for example, the provincial
government is planning a major new highway through the Niagara Region without
considering the impact it will have on residential and business location decisions. These
large-scale highway projects are often justified by the need to address congestion or
move cargo more efficiently, but may inadvertently have but major impacts on land use
patterns, contributing to urban sprawl (Winfield, 2006). Recent research in the US has
shown that highway construction in or near urban regions often triggers urbanization of
previously undeveloped areas by improving their accessibility. Over time, these land-use
changes lead to more car travel, a vicious circle. Thus, although the short-term impact of
road construction may be to reduce trip lengths and congestion, the long-term impacts
can be the opposite if people relocate their homes or work to more distant areas newly
served by highways (Heavner, 2000).
Public transit agencies usually have little influence over the land use patterns that
determine demand for their services. Municipalities often plan new low-density
subdivisions or office parks without thinking about how residents or workers can gain
convenient access to transit services. Moreover, transit provision to new communities -
where it is provided - is usually delayed until sufficient build-out has been achieved to

70
justify a new route. This delay allows incoming households to establish car-oriented
behaviour patterns and makes the shift to transit use more difficult. Older industrial sites
are frequently located in close proximity to existing transit infrastructure, but financial,
legal and technical hurdles are a barrier to the redevelopment of these well-positioned
brownfield sites. In terms of municipal efforts to create higher-density suburban nodes,
developers are reluctant to proceed with investments in such areas based solely on the
promise of good quality transit service sometime in the future (Blais, 2003).
Disjointed planning creates a situation in which sprawl and the associated car-
dependency emerge by default, if only because there is no agency with the responsibility
and authority to manage growth in an integrated way throughout the whole urban region.
Officials in each agency work in isolation to solve problems that are in fact intimately
connected. The result is that each agency seeks solutions on its own terms, solutions that
offer short term relief, but that aggravate the underlying problems in the long term.
Whereas this may be an effective way to manage issues when they can be neatly
contained within one department's purview, it is not effective when complex, multi-
faceted and mutually reinforcing problems arise with multiple external repercussions.
Urban sprawl is one such complex of problems and requires better coordination between
land use and transportation planning at all levels in order to be effectively addressed.
Environmental Issues Not Integrated Into the Mainstream of Municipal Planning
In the past, environmental issues were not considered part of mainstream community
planning. Instead planners focused on the city's physical systems, short-term economic
considerations and the interests of the development community. Environmental concerns,
to the extent they were considered, were neatly contained in one municipal "silo".
Typically, municipal planners would concern themselves with the protection of sensitive
environmental lands from encroaching residential or industrial development, adopt
regulations to prevent development on hazardous lands such as slopes and floodplains,
and sometimes, such as during energy crises of the 1970s and 80s, promulgate planning
guidelines to reduce energy consumption.
Where they were considered in development decisions, environmental issues were often
addressed in a piecemeal fashion that was blind to overall impacts. Aggregate extraction
for urban infrastructure is a good example. While an individual mine site rarely poses a
serious ecological threat, several operations within an area can have a significant
cumulative environmental impact. Large-scale mining of sand and gravel deposits can
affect groundwater storage and flow regimes. However, state and provincial legislation
regulating aggregate mining do not look at these issues in a holistic manner, leading to
the ―death of the thousand cuts‖ (Baker and Shoemaker, 1995). The multitude of
abandoned gravel pits along the Oak Ridges Moraine north of Toronto is an example of
this phenomenon – groundwater quality, quantity and recharge are all affected. A similar
situation exists with respect to septic systems, which are often approved on a one-by-one
basis according to site level parameters while overall impacts are ignored. Some
jurisdictions in the basin (e.g., Michigan) have no septic system approval regulations.

71
Even those jurisdictions that have regulations have little or no monitoring and
enforcement capability.
Today, this piecemeal approach is no longer appropriate. Growing concerns with water
and air quality, energy depletion, climate change, toxic contamination from persistent
organic pollutants, public health disasters, declining biodiversity, and loss of natural
features like wetlands and woodlands, have all conspired to put environmental issues into
the mainstream of planning practice, not only in the Great Lakes Basin but elsewhere in
Canada and the US. Such issues are seen to have complex causes that relate to the form
of economic development, institutional decision making processes, lifestyle habits, and
technological choice. There is a general consensus now that they cannot be managed in
isolation and that a new, holistic approach to community planning with environmental
issues at its core is urgently needed.
Inefficient Development and Building Standards
Development standards refer to the rules developed by provinces and municipalities to
govern the layout of urban space. They are meant to ensure ―quality‖ development,
protect public health and safety, and avoid future problems with maintenance. They relate
to issues such as the width of roads, turning radii, whether laneways will be permitted,
the placement of utilities in the ground, the size of storm or sanitary sewers needed to
serve a new development, the presence of sidewalks, the shape of curbs, and so on.
Development standards have been continuously ratcheted up over time and current
standards are very generous in their use of space (Tomalty, 2001). To a large degree, the
current standards guiding development have their origin in the values and imperatives of
the 1950s to the 1970s, a time of massive public expenditures, relatively low costs and
limited environmental awareness. Not surprisingly then, current development and
building standards are very generous in their use of space. Each public agency has set its
standards in isolation, and the overall result has been a highly land-consumptive
development pattern that no single agency would have wanted or required.
Now that urban sprawl has become a public issue, we are rethinking the spatial aspect of
these standards and alternative standards are being proposed by progressive developers
and by planners. However, proposals for alternative development standards are often met
with severe resistance from fire, public works, and transportation departments within
municipal bureaucracies, in some cases completely derailing or distorting what would
have been a smart growth development.
The issue of streets widths is a good example. Streets in conventionally designed areas
usually abide by some minimum width, as guided by engineering standards found in a
publication commonly known as the ―Green Book (The American Association of State
Highway Officials, Undated). The document dictates street widths based on the expected
traffic generation from different land uses served by the street. The narrow streets that are
a key feature of many alternative development proposals typically raise objections from
fire officials and other emergency departments, who assert that narrow streets hamper
access by fire trucks and ambulances and endanger public safety (Steuteville, 2001).
72
They also claim that narrow streets slow traffic and thereby lengthen emergency vehicle
response time. Public works officials complain that snow removal becomes problematic
because there is no place for snow to accumulate and plows may damage cars parked on
the street (WCEL, 2002).
Any number of examples from either side of the border could show how these objections
can undermine the achievement of smart growth goals in specific development situations.
In the East Riverside Community in Windsor, for instance, the comprehensive plan
explicitly supported compact development principles. However, the City's engineering
department refused to alter development standards to allow narrower streets and
laneways, producing a streetscape of narrow lots dominated by garage doors. Many other
key elements such as a fine grain of residential mixes and uses, were also missing, in part
because the lack of support for smart growth development principles in the zoning bylaw
(Caruso and Sands, 2001).
Conventional Zoning Practices
Most zoning ordinances require separation of uses and impose a variety of constraints
(e.g., lot coverage restrictions, minimum parking requirements, and so on), that are
intended to avoid overcrowding, maintain aesthetics, ensure adequate drainage and
sanitation, and so on. In the past (and indeed elsewhere in the world today), absent or
inadequate planning restrictions allowed the mixing of incompatible uses, for instance the
juxtaposition of heavy industrial and residential uses. Separation of uses ensures that
residential development will be protected from industrial pollution sources, noise, dust,
and other nuisances. However, such ordinances also create obstacles to mixed-use urban
forms (which can encourage pedestrian traffic and foster a sense of community) and
increase the distance between any two points in a community, both of which promote the
use of automobiles. In many cases, zoning prohibits even smaller businesses in residential
areas and actively encourages big box retailers and regional shopping malls to locate near
freeways. Zoning regulations also often prohibit innovative compact development forms,
such as residential units over garages, secondary suites in basements or annexed to the
rear of a dwelling, or apartments over stores. Cities often encompass excess industrial
land, dating back to earlier periods of industrial success, or have a large inventory of
smaller industrial sites that are poorly situated to serve current demand for industrial
parcels. Maintaining industrial zoning, with its stringent conditions, on such land can
obscure the potential value of brownfield sites for compatible residential, commercial or
mixed use.
Conventional zoning also imposes large buffers between different land uses or building
types (e.g., if a multi-family building abuts a single-family zone), which increases land
consumption and contributes to the spread of urban areas. Furthermore, zoning is often
used to maintain social homogeneity by dictating large lot sizes (which also increase
distances between destinations), limiting the areas where medium and higher-density
housing can be built, and by requiring buildings with different densities to reside in
separate zones rather than mixing different building types on the same block (Downs,
2005).

73
Constraints on lot coverage, setback, minimum parking requirements, and so on similarly
limit the range of options available for low-impact development. Rigid land use
specialization fosters heavy reliance on the automobile, with which comes the need to
allocate a substantial amount of space to roads and parking. This has the unintended
consequences of increasing impervious surfaces and the associated stormwater run-off.
Zoning in rural areas tends to favour large lot isolated development, the proliferation of
on-site wastewater systems that threaten groundwater quality and the drilling of
thousands of new water wells every year that threaten both groundwater and surface
water quality.
Excessive parking requirements are considered by many to be a major impediment to
achieving more compact urban form (Jakle and Sculle, 2004). In non-residential zones,
buildings are surrounded by sufficient parking so as to accommodate a theoretical
maximum number of customers that is reached one or two days per year if at all. In
residential areas, most municipalities have minimum parking requirements that do not
take into account the nature of the proposed development and the potential for reduced
parking needs (e.g., a senior‘s apartment building, or development near a transit station).
Excess parking not only contributes to the physical spread of the city by taking up surface
space and increasing travel distance between any two destinations, it tends to be unsightly
and produces environments that are inimical to pedestrians (Shoup, 1999). Underground
parking does not take up surface space but is expensive and can make construction less
profitable and therefore less attractive to developers. Finally, many smart growth
development proposals – especially in infill situations or adaptive reuse of existing
buildings – are only technically or financially feasible if parking requirements are
reduced. And as one observer has pointed out: "Often, common building forms, such as
multi-storey office buildings, could be considered smart development – if only they did
not come with such vast areas of surface parking." Many municipalities, however, are not
willing to consider lower parking standards (Blais, 2003).
Even in jurisdictions that are committed to compact development on paper (i.e., in
official plans and other policy documents), these regulatory barriers, and others like
them, can have the effect of preventing smart growth projects from being built without
significant and costly delays. Developers are forced to apply for rezoning or variances,
which are costly and time consuming. One US observer has noted that in jurisdictions
where conventional zoning is in place, thirty or more variances might be required to
allow a project with smart growth characteristics to move forward. These variances can
be exceedingly cumbersome to arrange, depending upon the regulatory body‘s familiarity
with alternatives to conventional development. This has the effect of stymieing attempts
to deviate from conventional norms (Steuteville, 2001).
Alternatively, developers may be given the opportunity to negotiate a development
package with tailored zoning parameters. However, the outcome of such negotiation is
often unpredictable from the developer's point of view, and the final package may be
subject to public consultation and council approval, and is therefore considered risky. In

74
the absence of clear rules that permit smart growth designs, many developers will fall
back and build what is already familiar, i.e., low-density, segregated-use neighbourhoods.
Ineffective Municipal Planning
Population, economic, and land use trends combine to create development pressures in
the basin. This puts demands on the land use planning system, much of which is based in
local governments. Individual municipalities in the basin, some of them very small, must
make land use decisions quickly, often in the absence of adequate information about the
environmental context for and implications of development. Available guidance is often
vague and not tailored to local conditions.
Furthermore, as noted in the previous section, many municipalities rely on general
guidance about ―best‖ management practices for the control and treatment of stormwater,
when a given measure may in fact work as intended only in certain regions of a river
basin (for example, in middle or lower reaches) or where specific slope or soil conditions,
or both, exist. In other areas, especially headwater reaches, a carelessly placed ―best‖
management practice may in fact do more harm than good, by altering surface and
groundwater hydrology, and thus downstream flows, in fundamental and possibly
irreversible ways.
Population growth, high-capacity centralized potable water and wastewater infrastructure
(―Big Pipes‖) and good road networks therefore create development pressures, which in
turn create new demands for environmental information and decision-making tools that
may tax the knowledge and skills of local authorities. Management of urban stormwater
flows is a case in point. Many municipal engineers and planners lack the time, tools and
training to undertake the detailed, three-dimensional and time-variable analysis of soil
type, infiltration potential and natural flow characteristics necessary to manage urban
hydrology effectively.
Moreover, the appropriate action in a particular situation may not be that obvious or may
require delicate tradeoffs. For example, there is considerable disagreement among
researchers about the goal of urban stormwater management. Is it to attenuate high flows
and protect property from flooding? Is it to preserve downstream base flows for the
protection of sensitive aquatic life? Or is it to maintain water supplies for industrial,
residential, or agricultural use? While the simple answer is ―all of the above‖, the reality
is that different stormwater management strategies have different impacts on urban
hydrology, and a scheme intended to reduce flooding risk may have very detrimental
effects on downstream fisheries. Some municipalities may lack the technical expertise or
financial resources needed to examine these issues adequately and make the best
decisions.
Another dynamic that may undermine the effectiveness of local planning regimes is the
sometimes inordinate power of developers in municipal decisions where their interests
are in play. Research in the Toronto area has shown that developers are often among the
major contributors to municipal election campaigns (MacDermid, 2006). Under these

75
circumstances, municipal councillors who want to show that they are "open for business"
may be persuaded to override good planning principles in order to permit development to
go ahead. This dynamic is seen at work when developers purchase low cost land beyond
the urban envelope and then apply for a rezoning of the land from agricultural to urban
uses, which would dramatically increase the value of the land. In some municipalities
developers have persuaded councils to make hundreds of such amendments to their
community plans, extending the urban envelope to allow development on rural land.
Municipalities are also tempted to ―give in‖ to developers because of the prospect of
increased revenues from residential and commercial property taxes. The result of these
incremental decisions is unplanned growth of the urban area and less incentive to
accommodate population growth through infill and redevelopment within the existing
urban area (Sewell, 2003).
Inadequate Regional Coordination
Most land use planning and zoning decisions occur at the local level. There are good
reasons for this, in that such decisions must be made in the context of local values,
geographic and economic conditions, and other social-cultural factors. But local
responsibility also allows inconsistencies in environmental standards to arise across a
region and may fail to give adequate consideration to regional impacts of local land use
and planning decisions. Likewise, without regional coordination municipal efforts to
protect open space may result in a patchwork of green areas with little ecological
integrity. In some jurisdictions, state or provincial oversight is intended to counter these
tendencies, although this may not be invoked in practice. The lack of substantive
interagency coordination or regional governance is an obstacle to the coordination of
sustainable land use practices across a region.
Municipalities in metropolitan regions without a common economic strategy often
compete against each other to attract development, fuelling outward growth. Municipal
governments need tax revenue, and they can generate that revenue through development
of land uses that generate more revenue (taxes and development charges) than expenses
(infrastructures and services) (Burchell, 1978; Mills and Oates, 1975; Windsor, 1979). If
they can achieve this objective, they can provide high-quality services and infrastructure
while keeping taxes low, to the satisfaction of their residents and businesses. Indeed, it
was the combination of high quality services, especially good schools, and lower costs
compared to the central city, that has made the suburbs so attractive to the middle class
over the last 60 years (Madden, 2003; Stanback, 1991). Many urban centres therefore
began a downward spiral of diminishing tax revenues, aging and depreciating
infrastructure, and the need to provide services to an increasingly poor population who
generated lower tax revenues. Thus, municipal fragmentation within metropolitan regions
has fostered urban sprawl, a suburbanization of the middle class, and in some cities, a
concentration of poverty and urban problems in the inner cities. Some authors argue that
regional coordination of land use planning could be helpful in slowing or reversing this
cycle.

76
In the absence of strong metropolitan-level coordination to achieve growth management
goals, efforts to achieve more compact development patterns at the neighbourhood level
are likely to be of limited effectiveness. Several studies have shown that isolated smart
growth developments in urban regions otherwise characterized by conventional suburban
development will not be able to alter transportation behaviour significantly (Belzer and
Autler, 2002). These studies indicate the need for complementary metropolitan-wide
strategies so that neighbourhood-level efforts can fully reach their smart growth
objectives (Cervero and Gorham, 1995; McNally, 1993). As one observer has noted:
Without strategies that unfold with consistency over a long period and that
cover a metropolitan region (or large portions thereof), it is unlikely that
smart growth efforts will be successful in changing the course of urban
development. Episodic and localised interventions are incapable of
achieving the desired environmental objectives, in large part because they
are unable to reshape behaviours in a way that conforms to these goals.
For example, for car users to shift to transit, transit-conducive conditions
must be present at both points of origin and destination (Filion, 2003).
These considerations point to the conclusion that in urban regions, environmental and
growth management issues are best addressed on a regional scale. Unfortunately,
government powers are not always matched to the scale of the problems—sprawl, its
attendant problems and the potential solutions are regional in scope but modes of
governance often are not. Indeed, an earlier report commissioned by the IJC concluded
that the absence of regional coordination in the Great Lakes Basin has ―hampered efforts
to address sprawl, link transportation and land use planning and plan to encourage transit
use (GHK International Canada, 2003).‖
On the US side, federal transportation funding legislation has required since the 1970s
that large metropolitan areas set up Metropolitan Planning Organizations (MPOs) that
channel federal transportation funding to transportation authorities in the region. The
federal government assigns the MPO role to regional bodies of various types, created
thorough intermunicipal compacts or state legislation. While all MPOs make short- and
long-term regional transportation plans as part of their federal mandate, the other
activities carried out by MPOs vary from region to region. Some, such as Buffalo
(Greater Buffalo-Niagara Regional Transportation Council), act exclusively or primarily
as the federally designated MPO and have few or no other functions. MPOs in Detroit
(Southeast Michigan Council of Governments) and Cleveland (Northeast Ohio Areawide
Coordinating Agency) are also designated as metropolitan air and water quality agencies
by separate federal legislation. Only two MPOs are constituted as multi-functional
regional planning bodies: Milwaukee's Southeastern Wisconsin Regional Planning
Commission and Chicago's Metropolitan Agency for Planning. Thus, metropolitan areas
on the US side of the basin do have regional bodies, but these entities often have limited
authority for specific functions (transportation, sewers, etc.).
Moreover, the institutional effectiveness of MPOs has often been weak, regardless of
their other responsibilities or integrated multi-sectoral purview, and has seen limited

77
impact from their efforts. Chicago‘s Metropolitan Agency for Planning (CMAP)
inherited regional growth planning responsibilities from a predecessor organization (the
Northern Illinois Planning Commission - NIPC), set up in 1957 to provide local counties
with data and expertise on growth policy. NIPC‘s land use policies were not binding on
counties or municipalities, except with regards to the regional transportation plan
developed by a then-separate MPO. This left individual counties to plan for themselves,
and left a substantial portion of unincorporated land subject to broad-based county plans
that still permit large-scale residential development over broad areas. Municipalities in
the Chicago region continue to be responsible for zoning and development control
decisions, with CMAP having advisory powers only (Will County, 2002). The same is
true of Milwaukee's Southeastern Wisconsin Regional Planning Commission. In
metropolitan Detroit, the Southeast Michigan Council of Governments functions as a
voluntary regional intermunicipal organization. The region‘s seven counties, but not all
of their constituent municipalities, are members. SEMCOG produces only short-term and
long-term transportation studies, not a regional land use plan.
MPOs have had difficulty exercising a powerful regional role. State governments
perceive that MPOs have usurped their role in channelling federal transportation funding
to cities, and have sought to control or marginalize rival regional bodies imposed by
federal legislation (Goetz et al, 2002). In addition to these problematic vertical
relationships, MPOs face divisions between constituencies that have hindered effective
horizontal cooperation. Most have appointed boards that give undue influence to
suburban and rural counties over central cities (Sanchez and Wolf, 2005). Leadership and
political will, engendered by a sense of common regional goals, are key ingredients in
MPO success, but are challenging to achieve giving the existing tensions between
regional jurisdictions and interest groups (Wolf and Farquhar, 2005; Vogel and
Nezelkewicz, 2002).
In Ontario, the Province has always played a role in local planning through approvals of
official plans and subdivisions (although that role has been diminishing over the last ten
years or so), directing local governments to consider provincial policies, and the
influence of the provincially-appointed Ontario Municipal Board, a tribunal that decides
on controversial planning and development issues. For some areas, such as the Niagara
Escarpment and the Oak Ridges Moraine, provincial plans have been adopted that
override municipal ones. In the vast metropolitan area centred on Toronto, the province‘s
role has been significantly strengthened in the last few years, in an attempt to better
manage regional growth.
Regional governments have existed in Ontario since the creation in 1953 of Metropolitan
Toronto, an ―upper-tier‖ municipality encompassing a number of ―lower-tier‖ municipal
governments. By 1974, Ontario had 13 regional governments with a wide range of
responsibilities, including land use and transportation planning authority, most of them in
the Great Lakes Basin. During the 1990s, the structure of many municipal governments
was changed, with a move to consolidate governance at a single tier and eliminate local
municipal governments, such as occurred in Hamilton and in Metro Toronto. However,
some two-tier government structures remain elsewhere in the Golden Horseshoe. Because

78
upper-tier councils are made up of representatives from lower-tier councils who are
responsible to a local electorate, these governments rarely have a strong vision for the
entire jurisdiction. They create plans, but the political will to rein in local councils that
make planning and development decisions that work counter to regional goals is
sometimes lacking (Tomalty and Alexander, 2005).
From a regional planning point of view, the major weakness in Ontario has always been
the lack of a legislated multi-purpose planning body in the Toronto region. Instead, the
region has been poorly served by weak agencies relying on voluntary inter-municipal
cooperation (such as the Office of the Greater Toronto Area, which was in existence from
1989 to 2000), or special purpose agencies dedicated to particular functions, especially
transportation planning (such as the Greater Toronto Services Board, which lasted from
1998 to 2001, and Metrolinx, created in 2006). This mismatch between governance
powers and the scale of land use problems has resulted in land-use decision making that
is often cumbersome, duplicative and inefficient. As mentioned above and described in
more detail below, the province has stepped in to help remedy this situation in the last
few years.
In southern Ontario, some aspects of planning related to water management are the
responsibility of watershed-based Conservation Authorities, which are inter-municipal
agencies that oversee flood control, forestry operations, and fisheries management within
the watershed boundaries. As well, the province is introducing regional watershed-based
source water protection planning that will be implemented through modifications to local
plans and zoning.
Lack of Agricultural Land Protection
Jurisdictions in the Great Lakes Basin lack the kind of comprehensive agricultural land
protection that controls development on farmland seen in British Columbia and Quebec.
In those provinces, where some of the most fertile and economically productive
agricultural land is immediately adjacent to fast-growing cities, a quasi-judicial
commission reviews applications to develop agricultural land across the entire province.
The Ontario provincial government has recently implemented a large-scale development
control and conservation system in the Greater Golden Horseshoe. The 1.8-million-acre
Greenbelt encompasses a broad arc of agricultural lands and rural areas in addition to the
sensitive landforms of the Oak Ridges Moraine and Niagara Escarpment. Each protected
area is subject to a particular land use regulation framework that governs the permitted
location and intensity of agriculture and other land uses (MPIR 2006). Outside of these
areas, however, farmland protection is weak in the Ontario portion of the Great Lakes
Basin. The Provincial Policy Statement issued pursuant to the Ontario Planning Act sets
the ground rules for planning in Ontario. Although the statement says ―prime agricultural
areas shall be protected for long-term use for agriculture,‖ there are no formal programs
in place to implement this policy outside of the protection zones mentioned above.
Official plans, which are required of each municipality, must ―be consistent with‖ the
Provincial Policy Statement but how to implement this prescription is left up to local

79
authorities. Agricultural lands in Ontario are also protected by favourable tax rates and
right to farm legislation.
Protection appears to be somewhat stronger on the US side, where some direct statutory
development protections for agricultural land exist, in the form of agricultural zoning
legislation that lets local municipalities restrict non-agricultural land uses. Pennsylvania
was one of the first states to establish nonexclusive agricultural zoning, which permits
some non-farm uses. Wisconsin permits localities to set exclusively agricultural zones,
but local enforcement has been weak and compliance with agricultural land use plans
inconsistent (Jackson-Smith, 2002).
A more popular approach, used in Illinois, Minnesota, New York, Ohio and
Pennsylvania, has been to establish agricultural security areas or special districts. Within
these districts, agricultural land is subject to extra protection, eminent domain is
restricted, and some kinds of special tax assessments are waived (American Farmland
Trust, 2006). Some states (such as Minnesota and Pennsylvania) employ a broader range
of incentives and restrictions, while others (Illinois and Ohio) offer relatively few. Some
states have pursued an agricultural preservation strategy that uses state funds to obtain
agricultural conservation easements or transfer of development rights (TDR) agreements
from landholders, and federal matching funds. By agreeing to an easement or TDR, the
landowner sells the development rights, but not the title, to his or her land, retaining
ownership and receiving a fair price in exchange for removing the right to develop the
property (American Farmland Trust, 2003). Ongoing federal matching funds have been
made available to help states buy development rights; Pennsylvania has aggressively
pursued this approach, while Indiana has seen little such activity from public or private
farmland trusts. Even when conservation easement funds are available, local concerns
about growth may motivate state or local officials to buy development rights for open
space areas that are politically sensitive rather than agriculturally or ecologically
important. While development rights and open space acquisitions may be expensive
undertakings for state and local governments, the scale, pace, and financial heft of new
development outstrips smaller, slower, and more modest government programs.
Some approaches permit development, while directing it to specific areas of a site in
order to maintain contiguity of agricultural parcels. Cluster zoning allows a portion of an
agricultural plot to be developed for non-agricultural use, while preserving agriculture on
the remainder through a conservation easement (Nelson et al 2007). All the Great Lakes
states permit some form of cluster zoning, but implementation varies widely among the
various municipalities and counties that employ it. Open space and greenway zoning use
similar tools to direct development to a single portion of a larger site, but their goal is to
preserve the contiguity of open space and natural features as such, rather than merely
maintaining agricultural use on farm lands. Thus, these zoning approaches may permit
some compatible non-agricultural uses, such as parks, on open agricultural land (Wells,
2002). More robust open space preservation efforts dedicate public funds for acquiring
agricultural land outright (i.e., purchasing the land itself and not just the development
rights) and preserving it as greenfields. While attractive, statewide initiatives to fund
open space preservation are typically too small to have significant impacts in any one

80
location. County or municipal open space purchases are financially challenging, and may
only be an option for more affluent communities (Nelson et al 2007).
Tax-based approaches seek to lessen the financial burden to farmers of escalating land
values due to development pressure. Illinois and Indiana allow preferential assessment,
where property taxes for farmland are based on its agricultural productivity and not on its
potential development value; there are no restrictions placed on the sale or use of the
land, however. Deferred taxation, employed in Minnesota, New York, Pennsylvania and
Ohio, also calculates property taxes for agricultural land based on its agricultural use.
However if the property is sold for development, the landholder is required to forfeit his
or her previous tax savings. As used in Michigan and Wisconsin, circuit breaker tax
credits offer rebates on income taxes for farm owners that are in certain high-priority
agricultural areas or who have signed fixed-term restrictive covenants preventing
development. In New York, the state offers farm households credits on their local school
taxes (Libby, 2003; Blewett and Lane, 1988). Tax credits are perceived as a more market-
friendly method of limiting agricultural land loss, but the predominant model of state
offsets for municipal taxes places a heavy and ongoing impact on state budgets. The
credits that states and municipalities are fiscally capable of offering may not be sufficient
to offset the potential for windfall profits from development.
Imbalanced Investment in Highways and Transit
Transportation investment is not only an amenity but may in itself be an important driver
of environmental change. On the one hand, a good quality transit system that connects
higher-density employment nodes and higher-density residential areas is needed to
support smart growth strategies at the regional level. At the local level, smart growth
proposals rely heavily on the availability of good quality transit to complement urban
design and land use policies that discourage car use. Policies such as promoting higher
density, mixed-use development, attractive pedestrian streetscapes, or revitalized main
streets, won't do much to alleviate the impacts of suburbanization unless adequate transit
service is in place to offer a real alternative to car use. On the other hand, investment in
highways may help promote decentralization of population and employment.
The fiscal and political priorities of governments in the US and Canada have historically
favoured highway over transit investment. By the middle of the 20th
century, the number
of automobiles on the road was sufficient to justify the establishment of major provincial,
state, and inter-state/national highway systems. The US 1956 Federal Highway Act was
an important example of this, creating a nationwide network of interstate divided four-
lane highways with controlled access points. Originally conceived as a self-financing toll
system, the US interstate highways soon became heavily subsidized by the federal
government. In 1958, Congress passed legislation under which the federal government
paid 90 percent of the cost of new interstate highways, with the remaining 10 percent
paid by the state.
The large federal subsidy for new roads made the building of new highways, and the
extension of existing ones, very attractive to states and local governments. Coupled with

81
development pressures created by the baby boom, the result was the rapid growth of
suburbs and associated services in outlying areas. In the suburbs, land prices and property
taxes were lower, development constraints fewer, and public infrastructure was newer
and more reliable. Thus, highway investments were politically popular and economically
viable, at least in the short term.
In Ontario, highway spending has traditionally outstripped transit spending by a wide
margin. A highway-friendly government in the late 1990s and early 2000s established a
policy goal that 90 percent of the province‘s population live within 10 kilometres of a
major highway (Winfield, 2003). The government only directed resources to transit in its
last two years in office; of the $2.6 billion of transportation capital investments it
approved, only 27 percent went to transit (Winfield, 2006). Though transit has received a
greater share of funding under the current Ontario government, the 2007-08 provincial
budget contains $1.7 billion of highway construction funding, an all-time high (Winfield,
2007).
In the US, Congress began to consolidate highway and transit funding directed to the
states in 1991. The Intermodal Surface Transportation Efficiency Act (ISTEA)
legislation, passed that year, permitted states to divert highway funding to transit projects,
in addition to ongoing federal support for more specific transit needs (paratransit,
research on new technologies, etc.). ISTEA was succeeded by TEA-21 in 1998, and
SAFETEA-LU in 2004, each of which retained the overall flexible approach. These
frameworks have relied on thorough and transparent application processes for new
projects, and transit proposals are evaluated on their ability to deliver improved
congestion and air quality outcomes.
Despite this rigorous approach to evaluating investments, the US federal funding
environment remains highly complex, and is influenced by widely criticized
Congressional ―earmarks‖ that fund specific programs in a representative‘s home district.
Federal support for transportation infrastructure increased throughout the 1990s, and the
TEA-21 increases in transit funding outstripped the increases in highway spending
(Sierra Club, 2001). However, overall funding is still heavily skewed towards highways
under TEA-21 and SAFETEA-LU, and while transit investment is slated to increase,
highway funding remains four times higher than transit funding over the life of both Acts.
Figure 6: Highway and transit funding (nominal US $) under TEA-21 and SAFETEA-
LU, 1998-2009

82
Source: Metropolitan Transportation Commission, 2005
Transportation spending by senior governments represents a major opportunity to
leverage regional and local policies to support smart growth outcomes. The US has,
overall, been more successful than the Canadian federal government in leveraging its
capital funding power to support outcomes-based approaches. Under the Clean Air Act,
the EPA can withhold various kinds of federal funds from regions that fail to plan for air
quality improvements and act on their plans; this ―big stick‖ approach has been used
relatively rarely, but is an effective deterrent for regions that might otherwise be tempted
to neglect federal air quality directives. The Congestion Management Air Quality
(CMAQ) program directs funding to metropolitan areas that exceed permissible levels of
ozone and carbon monoxide. Once those ―nonattainment areas‖ have improved their
pollutant levels to meet the federal standard, they continue to receive preference for
continued funding as ―maintenance areas‖. Beyond this geographical priority, different
types of projects are prioritized as well: projects such as diesel engine retrofits and other
technical efforts to reduce emissions are considered first, and projects that cost-
effectively reduce congestion and improve air quality are considered second. While some
CMAQ funds are flexible, and can be directed to transit or highway projects statewide,
others are not and are assigned specifically to MPOs in nonattainment or maintenance
areas. A tight focus on measurable outcomes helps the federal government ensure state
accountability for concrete results; however, limiting the outcomes under scrutiny to
roadway congestion and air quality exclude potentially beneficial land use impacts from
consideration. Leveraging for air quality and congestion does not decisively shift
resources to transit, nor specifically target urban form.
The Canadian government's Gas Tax Fund, established in 2003, is the first federal effort
to leverage access to funding with better smart growth planning. The Fund is used to help
finance infrastructure across the country, and requires that recipient municipalities
prepare an Integrated Community Sustainability Plan (ICSP), defined as: ―A long-term
plan, developed in consultation with community members that provides direction for the
community to realize sustainability objectives it has for the environmental, cultural,
83
social and economic dimensions of its identity‖(Infrastructure Canada, 2006). Eligible
projects include transit corridors, transit equipment, and roads. To date, numerous
municipalities across the country have embarked on sustainability plans, including the
City of Hamilton in Ontario. However, no smart growth standards are used to measure
the adequacy of these plans and no mechanisms are in place to ensure that sustainability
plans are carried out.
Infrastructure Financing Mechanisms and Taxation Policies
The growth of a city or town requires large scale investments in urban infrastructure,
including roads, bridges, transit facilities, water and sewage treatment, schools, hospitals,
fire and police stations, recreational facilities and so on. These investments are paid for,
in part, by municipal governments who raise money according to the rules set down by
state/provincial legislation.
Unfortunately, these rules usually don‘t take into account the impact of revenue raising
mechanisms on urban form. In fact, these mechanisms often militate against more
efficient land use patterns. For instance, property taxes on apartment buildings are
sometimes three or four times the rate of taxes on low-density detached houses.
Moreover, residential properties closer to the city core are usually more expensive and
carry higher assessed values. Thus, they carry higher effective rates of property taxation
than similar properties in the suburbs. At the same time, the costs of providing municipal
services and infrastructure to suburban properties are arguably higher (Vander Ploeg,
2004). This has led to a system of cross-subsidization where those living close in are
covering the costs for those living far out. Lower property taxes combined with other
forms of taxation may allow such issues of cross-subsidization to be better managed
(Slack, 2002).
Development charges (in Ontario) or impact fees (in the US) are collected from
developers to pay for the infrastructure required to support new growth. These levies vary
dramatically in amounts, from the $3000 per detached unit charge in Wisconsin to more
than $20,000 per unit in some Ontario municipalities. The charges are often based on a
flat-rate (or average cost) approach, which ignores the fact that some developments are
more efficient in terms of land use and infrastructure requirements than others. Thus,
high-density residential growth filling in vacant parcels in the already-urbanized area will
pay the same development charge per capita as a large-lot detached house at the urban
fringe, despite the obvious difference in new infrastructure requirements. Furthermore,
charges are calculated to make growth pay its way only from the perspective of municipal
financial responsibilities; they do not take into account the social and environmental costs
of different development patterns (Tomalty, 2001).
Income taxation policies are some of the most important drivers of current development
practice. For example, in the United States, mortgage payments are allowable deductions
from income tax, creating a significant financial incentive to buy and build more and
bigger structures rather than favouring renovation or redevelopment. Similarly, economic
development policies that offer a tax advantage for new construction will encourage the

84
building of new structures and the use of more land rather than renovation of existing
structures. Past and present tax and permit advantages on both sides of the border have
also had modest success in encouraging renovation and energy conservation, although
some such programs have been short-lived and subject to political whim.
All of these financing mechanisms reinforce sprawl (Slack, 2002). Together, they create a
situation in which housing prices, property taxes, development charges, and other fees
and revenue sources do not accurately reflect differential costs incurred by different
development patterns. As a result, efficient users of land who incur lower per unit
infrastructure costs pay higher housing costs, taxes and other charges that subsidize
inefficient users of land, who generate relatively higher per unit costs. This provides no
incentive to the efficient use of land and development-related infrastructure. Moreover, it
distorts the urban housing and land markets, resulting in the inefficient allocation of
resources. Ultimately it perpetuates more costly, sprawling urban development patterns
(Blais, 1996).
Federal and state/provincial subsidies for infrastructure pose another economic incentive
to sprawl. In many cases, property taxes, development charges and user fees do not
convey the full, true cost of development choices to municipalities, developers, and
consumers. In particular, the full costs of water supply, sewerage, and management of
deferred public infrastructure maintenance are rarely visible to the consumer. On average,
only about two-thirds of these costs appear on the consumer‘s utility bill or in the cost of
a new home; the remainder is made up by public grants and subsidies. Without full cost
accounting, there is no direct economic incentive to make sustainable choices. To put this
another way, if the federal government will pay 90 percent of the cost of a new highway,
there is little incentive for metropolitan regions to assess the real need for (or costs and
benefits of) further highway infrastructure (Boarnet and Haughwout, 2000).
Empirical evidence for the link between federal subsidies and sprawl comes from a recent
satellite-based study on the factors contributed to sprawl in the US. The study concluded
that cities that received more transfers from the federal and state governments – often
used to subsidize highways, sewers or other infrastructure – experienced the most sprawl.
The authors noted that "Local taxpayers who otherwise would have to help pay for the
infrastructure underlying such development no longer must do so when taxpayers
elsewhere foot the bill. Hence, local voters are less inclined to object to such
development. The result is more sprawl" (Burchfield et al, 2005).
Risk-Adverse Private Financing
The fact that many smart growth projects have unique design elements runs counter to the
trend of product standardization in the real estate industry. The vast majority of
development projects fall into one of nineteen classes of real estate that are easily
understood by investors. Traditional sources of real estate financing, such as commercial
banks and development companies, have tended to focus on a single building class.
Financiers look at how closely a project proposal conforms to a standardized product type
when evaluating risk. Innovative projects such as mixed use projects or compact

85
greenfield development that do not fit into the standard building classes are assigned a
higher risk factor which increases the cost of capital and places pressure on the project to
generate a sizeable cash flow in the near term. Financiers expect higher risk projects to
generate higher returns. Without the promise of a greater return on investment, the
financier has no incentive to stray from safe, standard real estate investments that
characterize conventional development (Moan, 2002). In general, most smart growth
projects do not generate greater returns than conventional projects and thus may not
attract financing. During interviews for a research study conducted a few years ago, many
financiers explicitly state that they would not consider investing in more compact or
mixed-use development project in greenfield locations (Gyourko and Rybczynski, 2000).
Infill, brownfield and greyfield projects are also difficult to finance because of the
uncertainty associated with remediation of soil and compliance with other environmental
regulation
While developers may be dealing with risk-adverse financial sources on the one hand
they may also have to handle cautious planning approval officials on the other hand.
Local planning authorities may contribute to the ―dictatorship of the familiar‖ by
approving only projects that ―fit in‖ with existing development and do not challenge
norms of size, lot coverage, style, or building material. The combination of financial and
planning resistance to innovative development proposals can make it very difficult for a
progressive developer to obtain approval for novel ―green‖ development projects such as
non-traditional lot or street layouts, and site-specific measures such as green roofs, grey
water recirculation systems, porous pavements, or non-traditional landscaping.
Decentralization of Retail and Employment
As residential suburbanization occurred, many retailers followed consumers out to the
suburbs to be closer to their markets. This first spawned enclosed malls that drew
consumers away from old central business districts but allowed one-stop shopping. With
time, the evolution of the retail industry has produced clusters of semi-detached ―big
box‖ stores, which have taken advantage of high levels of automobile accessibility to tap
large catchment areas and thereby generate economies of scale (Duerksen, 1996; Evans-
Cowley, 2006; Jones and Doucet, 2000). Adverse environmental consequences of such
stores stem from their large parking lots and the fact that they are important generators of
automobile journeys. Big box development on the urban periphery draws customers from
downtown retail establishments and weakens core economies (Lorch, 2005).
Big box stores in suburban locations also make it difficult to realize smart growth goals
related to concentrating growth in mixed-use, walkable sub-centres that are well served
by transit. Such stores do not create ideal pedestrian environment. In fact, not only are
consumers more likely to drive to reach these facilities than they would to access smaller
stores, but they will also typically drive from one big box store to another.
This difficulty in achieving mixed use sub-centres is compounded by the competition for
office development posed by business parks, which are usually located in dispersed
suburban locales that offer easy access to expressways, abundant surface parking and the

86
availability of land for future expansion (Filion, 2007).
Another factor driving the decentralization of employment is the desire of firms to be
near a suitable labour force. Because firms draw employees from the entire metropolitan
area, they need to locate in an area accessible from all points in the region. In the
streetcar city, the city centre was the most accessible location. In the modern automobile
city, firms are often drawn to locations with excellent car access, such as along a
suburban beltway (Burchell, 1996).
Appeal of Suburban Landscapes and Car Usage
Another barrier to smart growth can be found in the cultural normalization of suburban
landscapes. People are drawn to the suburbs for a variety of reasons: they value the
availability of green spaces, the privacy that the single family home offers, the social
homogeneity of most conventional suburbs, quiet streets on which their children can play,
large backyards for leisure time and so on (Green, 2000). Homes are in general priced
lower the further one goes from the urban core. Over half the population of the US and
Canada has been raised or currently live in suburban landscapes and this shapes their
future expectations and housing preferences (Filion et al, 1999). The development
industry responds to these preferences by reproducing and marketing these environments,
maintaining and expanding their ―market share‖. The urbanity that smart growth
neighbourhoods offer is gaining in popularity in many cities but is still considered a niche
market. The challenge to smart growth is how to reconcile the desire for the attributes of
suburban living with smart growth goals, a challenge that smart growth advocates have
not squarely met.
Of course landscapes are only one side of the suburban coin. The other side, automobile
dependence, has also been fully normalized in our culture. Suburbanites seem to accept
reliance on the car as an inescapable dimension of suburban life. Rates of car ownership
in the US Canada are still increasing, and car use shows no sign of decreasing. Transit
systems have improved in recent years, but people continue to find cars convenient and
symbolically significant. Efforts to change regulations to limit the impact of front-
attached garages run into entrenched cultural values:
Canadians find the attached garage convenient in our winter climate:
it makes for easy grocery handling, workshop activities, safe play
space for kids, and a barbequing venue in the rain. While planners
and architects dismiss the front garages, suburbanites do not find
them ugly (Grant, 2001).
The third element of the suburban model that links housing type and automobile use is
street design. The street layout of the typical postwar suburb is well adapted to the
prevalence of detached homes with front-facing garages and the need to allow automobile
access wile maintaining tranquillity. As one analyst points out "fashioned with curving
streets, cul-de-sacs, loops and segregated land uses, the conventional suburb, contains
and controls the car while it invites nature in" (Tasker-Brown, 2000). Through-traffic is

87
excluded from local streets and shunted to arterials roads, which often take the form of
commercial strips. Research on this topic suggest that suburbanites appreciate the street
layouts they are familiar with and do not want to live on the grid street patterns favoured
by smart growth advocates (Perks, 1994).
Public Resistance to Smart Growth Proposals
High-density living is often associated – even in the minds of some environmentalists –
with crowding, social malaise, congestion and pollution. Few existing residents of urban
areas want to see their neighbourhoods intensified through infill development on vacant
lands, or to see the redevelopment of low-density areas into high-rise apartment
buildings. Thus, neighbourhood groups form a potent force opposing many
intensification proposals. Such opposition creates political and financial uncertainty for
developers, some of whom are dissuaded from seeing through their proposals (Poulton,
1995).
Of course, Not In My Back Yard (NIMBY) opposition is not always effective and many
intensification projects do go ahead in spite of local resistance. However, NIMBYism
introduces a wild card into the planning process by making it difficult to carry through
with a coherent plan linking intensification to transit improvements and other smart
growth goals. For example, key areas near transit stations targeted for intensification may
for whatever reason be heavily defended by local NIMBY groups, derailing the smart
growth plan. As one observer has noted in the Toronto context:
The impact of NIMBY reactions has taken two forms. In some
instances, they have halted redevelopment, as around many suburban
stations and in inner-city neighbourhoods. Elsewhere, their effect has
been more subtle. In their effort to attenuate the impact of high-density
residential developments on nearby low-density neighbourhoods,
NIMBY movements have contributed to scale back the size of such
developments. At an aggregate level, these restrictions have contributed
to a scattering of pockets of high density… The resulting ‗spotty‘
density profile is wasteful for public transit operators, forced to run
services through large expanses of low density before reaching islands
of high density (Filion and McSpurren, 2007).
NIMBY resistance also challenges the realization of other smart growth goals, such as the
desire to reduce parking requirements. As mentioned above, surface parking can
contribute to the spread of the urban fabric and create urban environments that are
inimical to pedestrians. Parking requirements can also add to the cost of intensification
projects and reduce their attractiveness to developers. Finally, some smart growth
projects, such as building residential units over shops on arterial roads, are financially
and technically feasible only if parking requirements are reduced. Many smart growth
proposals include parking provisions that are lower than conventional standards on the
grounds that they will house people less likely to own or use a car due to neighbourhood
design or the availability of transportation alternatives. However, neighbourhood groups

88
typically oppose any such reduction in standards on the grounds that the proposed
development may add to parking problems in the neighbourhood if the promised smart
growth benefits are not realized in practice. Municipal councils are usually responsive to
these concerns because they are aware of how seriously residents take issues related to
local parking.
Neighbourhood groups also often resist proposals for mixed land uses. Developer plans
to include neighbourhood retail services are sometimes opposed by incoming residents in
neighbourhoods designed with smart growth features. Introducing residential uses into
commercial and industrial districts can also be controversial - nuisance complaints from
the incoming residents quickly follow and industry is driven out, a process that facilitates
the conversion of inner city employment areas to zones for the affluent (Grant, 2002).
Finally, NIMBY reactions to affordable housing are also considered to be a significant
barrier to achieving smart growth goals in many cities in the US and Canada.
Neighbouring residents are often reluctant to have any (or any additional) affordable
housing in their neighbourhoods. Public hearings concerning proposed affordable
housing projects bring forward a wide range of objections, mostly from neighbours who
cite poor housing design, absentee landlords, and the supposed adverse effects on traffic,
infrastructure, public services, schools, properly values, and crime rates. Perhaps the most
controversial development is multi-family rental housing, although there is often
opposition to affordable owner housing as well. Frequently unstated is the desire to
maintain a neighbourhood‘s socioeconomic homogeneity and exclusivity. Opposition to
affordable housing can result in significant time delays, additional costs and frustration
on the part of project proponents, sometimes resulting in the cancellation of a project. A
survey conducted in 2002 among 110 municipalities in Canada identified NIMBYism as
the most important obstacle to addressing the supply of affordable housing (Spurr
Research Associates et al, 2001).
Summary
This review presented the key barriers to implementing smart growth policies in the US
and Canadian contexts. The barriers were organized into four categories: governance,
regulatory, political/cultural, and financial issues. It is important to note, however, that
the barriers to smart growth are not as neatly segregated as the presentation format would
suggest. In order to see the main interactions among the various barriers, it helps to
consider the obstacles from the point of view of three key actors in smart growth
implementation: the producer of urban space, the consumer, and the regulator:
Developers
From a developer‘s or builder's point of view, smart growth is challenging to implement
because it involves a dramatic change to conventional development designs in an industry
that is quite standardized and conservative. Lending institutions are reluctant to risk
capital on innovative designs that are unproven while consumers have entrenched
preferences for conventional suburban designs. As transit is usually not provided in the

89
early stages of development, it is risky to push ahead with smart growth project designs
on the mere promise that good quality transit will eventually be forthcoming. NIMBY
resistance and a range of other challenges make higher density and infill development
more time consuming and costly and tempt even innovative developers to revert to old
formulas. Municipal regulations make innovative development proposals trickier to
obtain approval, entailing expensive delays. Because of distortions in the municipal fiscal
system, it may be cheaper to build conventional than smart growth designs.
Consumers
Housing consumers are familiar with conventional suburban designs and find that they
meet most of their needs. They defend discontinuous street patterns, large lots, socially
segregated neighbourhoods and support limitations on land use mixing. They often do not
identify strongly with the central city upon which they depend for employment and
higher-order services (like government services, cultural events, sporting events) and see
no reason to make sacrifices in service of the improved functioning of the urban region.
They identify more closely with their neighbourhood or local municipality, and expect
political representatives to defend their interests. Consumers fear that dramatic changes to
the suburban "formula" will affect property values and bring unwanted social
consequences. They either accept the role of the automobile in drawing together the
spatially disparate strings of their dispersed community or simply find it difficult to get
by without it as transit service is poor and distances are great.
Regulators
A lack of cooperation from other municipal departments and senior levels of government
frustrates planning officials who work towards smart growth. Public works,
transportation, fire, police and parks officials may support established standards (which
are tried and true) and resist changes based on unproven designs. Provincial governments
make highway expansion, transit and other spending decisions without an eye for smart
growth goals. Developers often resist pressures from planners to alter designs along smart
growth lines, implementing only superficial changes. More aggressive developers and
builders can go over the heads of planners and appeal directly to municipal councillors,
with whom they often have financial relationships through the election finance system.
Innovative designs involving green site design, mixed uses, a variety of housing types
and densities, intensification or affordable housing proposals are likely to be vigorously
opposed by community groups and may entail confrontation between planners that
support innovation and conservative political masters. Political commitment to smart
growth is uneven - usually strong policy statements are not backed up when difficult
decisions have to be made that influence development outcomes. Regional planning
frameworks are often weak and the consequences for approval developments that violate
regional plans are limited.
Recommendations: Implementing Smarter Growth

90
The review of obstacles to smart growth raises the question: are the barriers to smart
growth surmountable? There is, of course, no unambiguous, objective answer to this
question. Advocates of smart growth tend to favour the view that most barriers can be
addressed through regional cooperation, integrated planning, getting price signals right
and public education, while detractors take the opposite view, arguing that smart growth
violates basic political and cultural realities, property rights, economic forces, and the
trajectory of history itself (Bruegmann, 2005). Canadian researchers tend to believe that
smart growth has a better chance of successful implementation in Canada than in the US
due to factors such as the weaker influence of property rights, the more readily accepted
role of planning agencies in controlling growth, the wider prevalence of regional
planning agencies, the higher urban and suburban densities, higher gas prices and higher
levels of transit and bicycle use (Grant, 2006). But US observers point to the instances of
strong smart growth legislation that has been passed at the state level, robust federal
funding for transit and air quality regulations that are shifting regional development
priorities, and to their smart growth jewel, Portland, OR, which has blazed a path
showing how an urban region can grow in an environmentally responsible fashion while
maintaining a strong economy and a very high quality of life. In both countries, soaring
gas prices are putting considerable pressure on all levels of government to reduce sprawl
and invest in public transit. We conclude that smart growth has a fighting chance in both
countries.
The question, of course, is where to channel government policy energy and discretionary
spending. Academic researchers on both sides of the border have posed this question and
the answers offered can help guide our recommendations (Downs, 2005; Filion, 2003):
use a combination of carrots and sticks, i.e., regulatory and incentive-based
approaches
emphasize that developers, service users and polluters should pay the full cost of their
activities while avoiding the creation of inequities in the pricing of urban services
put energy into addressing issues that are susceptible to improvement (e.g., making
neighbourhoods more walkable) and avoid expending resources attempting to alter
conditions that are not likely to change (dramatic density increases in established
neighbourhoods)
work together with other governments at the same jurisdictional level and among
levels to achieve common goals, reduce inefficiency and spill-over effects
break down bureaucratic walls in order to bring all relevant perspectives to the table
when making development decisions
work with communities to build on local strengths, make trade-offs clear, and gather
information on the best way to move forward
learn from mistakes (e.g., by sponsoring research) and avoid repeating them (e.g., by
effectively communicating results).
Each level or order of government has a role to play in implementing smart growth and
realizing more sustainable cities. That role differs depending on the level/order and in
some cases the particular agency or jurisdiction. The following paragraphs present some
recommended strategies.

91
Federal Governments
The two federal governments that share jurisdiction in the Great Lakes Basin have major
impacts on urban growth and development patterns through their taxing policies and
spending programs (especially in the area of infrastructure expenditures), their ownership
of buildings and developable land, their purchasing power and procurement policies, and
their role in information collection and dissemination.
Leverage federal water infrastructure grants and loans
Federal governments are major sources of funding for urban infrastructure such as water
and wastewater treatment facilities. For example, the Toronto Western Beaches Storage
Tunnel was funded through the former Canada/Ontario Infrastructure Works program
under which federal, provincial and municipal governments share project costs.
Similarly, during the 1970s and 1980s, the Construction Grants program was a major
source of US federal funds to communities, providing more than $60 billion for the
construction of publicly owned wastewater treatment facilities. These projects, which
constituted a significant contribution to the nation's water infrastructure, included sewage
treatment plants, pumping stations, and collection and interceptor sewers; rehabilitation
of sewer systems; and the control of combined sewer overflows (CSO), and led to the
improvement of water quality in thousands of municipalities nationwide. With the 1987
amendments to the US Clean Water Act, Congress set 1990 as the last year that grant
funds would be appropriated for the Construction Grants program, thus shifting the
method of municipal financial assistance from grants to loans provided by Clean Water
State Revolving Fund (CWSRF).
It would certainly be possible for senior governments to impose conditions on major
infrastructure funding programs such as these. Federal governments could, and should,
require that appropriate planning be in place before infrastructure funding is transferred.
For example, water infrastructure funding should not be allocated until and unless the
recipient is able to demonstrate comprehensive water conservation planning.
Better balance transportation spending and improve leveraging
Transit spending has been increasing since the early 1990s in the US and since 2000 in
Ontario, but the investment is not sufficient to effect a shift in travel patterns. More
money is still being spent on highway expansion than on transit, on both sides of the
border. The US federal government has seen some success in tying transportation
infrastructure to air pollution indicators; new transportation capital funding could
influence urban growth patterns more emphatically if it was leveraged to achieve
measurable land-use outcomes such as transit-supportive densities and increased transit
ridership. The sustainability plans mandated by the Canadian federal Gas Tax Fund could
make use of this kind of leveraging to require that sustainability plans be workable and
meaningful, and evaluate projects based on smart growth performance standards. The
American model of consistent and flexible annual funding for transportation
infrastructure provides a more reliable and transparent way of making federal funds

92
available to states, in contrast to Canada‘s more ad-hoc, project-by-project approach to
funding the transit capital projects that are developed by provincial governments. As
Ontario‘s mixed record in funding transit demonstrates, it will take more than an
increased commitment to transit to make up for years of underinvestment.
Simultaneously continuing to expand highways with state, provincial and federal dollars
will only serve to create greater environmental challenges down the line. Both Canada
and the US will have to seek a more balanced approach to funding roadways and transit.
Lead by example
Federal governments are huge organizations with hundreds of thousands of employees,
thousands of buildings across the nation, and enormous ―buying power‖. They are in a
position to influence the actions of lower levels of government simply by exerting that
buying power. For example, if a federal government decrees that all new government
buildings would be equipped with green roofs to reduce energy use and stormwater
runoff, or greywater recycling systems for toilet flushing and lawn watering, that decision
would quickly force changes to local ordinances to accommodate those practices. The
federal governments are also in a position to locate their buildings and workforce close to
public transportation corridors to enhance mass transit investments and use. Government
vehicle fleets should be using clean, fuel-efficient vehicles, such as hybrids, high-
efficiency small diesel cars, or even natural gas vehicle. Finally, federal governments are
among the largest landowners in their respective countries. Some of this land is inevitably
considered surplus and is sold for development to private firms, or in Canada, to a federal
crown corporation, the Canada Lands Company. Any federally owned surplus land that is
sold for development should have conditions attached to it constraining the developer to
smart growth guidelines. Other levels of government should also adopt a lead-by-
example approach.
Technical support and guidelines
Federal governments are uniquely positioned to offer technical support and guidance in a
non-regulatory role. This, indeed, was the role of the Pollution from Land Use Activities
Reference Group (PLUARG), mentioned in Section 1. Many other examples exist. For
example, Health Canada is currently developing an Air Quality Benefits Assessment Tool
(AQBAT) to assess the health impacts and the economic costs associated with air
pollution from traffic in Toronto. In a similar vein, and in keeping with PLUARG
activities, federal governments could develop performance standards for sustainable
urban development, including guidance on the siting and performance of stormwater
treatment facilities; the wastewater and air quality implications of alternative urban
forms; and emerging vehicle emissions control technology and fuel economy standards
similar to those in California. Such guidance should be more than a list of best practices;
it should incorporate explicit performance expectations of individual practices and
technologies.
The two federal governments should lead a round table initiative, including
state/provincial governments and local authorities, to establish a common set of

93
guidelines on protecting wetlands, waters, and natural heritage from development. The
guidelines should include minimum setbacks from streams, wetlands, and shores; targets
and guidelines for natural area protection; land use targets for minimizing urban
footprints and protecting farmland.
Research and technological innovation
Federal governments, working in partnership with state and provincial governments,
should encourage the research, development and implementation of alternative
technologies for water treatment, sewage treatment, and stormwater management that
may prove to be more cost effective or efficient than conventional approaches. Research
into the impacts of different urban forms and development practices is also needed.
Fiscal policies
Federal fiscal policies can have important impacts on transportation and urban
development. Fiscal rules can be powerful tools in educating the public and shifting
consumer behaviour. Through this role, federal governments are able to encourage and
discourage specific practices, for instance by imposing higher taxes on technologies that
are not seen as sustainable, while granting tax relief to those, such as light rail transit, that
are more desirable. Unfortunately, fiscal policies are seldom structured with
environmental impacts in mind and therefore have inadvertent effects. Redesigning fiscal
instruments with smart growth goals in sight can help communities develop in more
sustainable ways. For example, federal sales taxes could be rebated for expenditures by
municipalities and municipal agencies on infrastructure that improves urban
environmental quality. Infrastructure expenditures eligible for a rebate could include
investments in transit vehicles, water and wastewater infrastructure, renewable energy
infrastructure (e.g., wind power), and community energy systems.
Law reform and enforcement
In the United States, discharges to surface waters from sewage treatment plants are
regulated under the Federal Water Pollution Control Act, commonly referred to as the
Clean Water Act. Regulations under the act specifically target sewage treatment, control
of combined sewer overflows, reporting requirements and beach protection. The
Canadian Fisheries Act and the Ontario Water Resources Act require that effluent from
sewage treatment plants must not degrade or impair the quality of the receiving waters
and the natural environment. However, neither Canada nor the province of Ontario has
laws especially regarding sewage management issues. Such standards should be adopted
and enforced consistently and equitably throughout the country.
While the United States has such a standard under the Clean Water Act, the government
often fails to enforce the standard against municipalities and local governments. This may
be due to the fact that higher levels of government would be implicated if the problems
have arisen because adequate infrastructure funding has not been made available to the
local governments.

94
The Great Lakes WQA primarily focuses on open lake waters and specific contaminated
areas of concern within the lakes, but not near shore waters. Yet the near shore waters are
the most accessible to the public and the most impacted by sewage pollution. The Great
Lakes WQA led to improvements in wastewater treatment in its early years and needs to
be amended to emphasis near shore areas of the lakes and the need to control sewage
pollution, particularly from CSOs.
State/Provincial Governments
Like federal governments, state and provincial governments have an important role in the
financing and oversight of major infrastructure projects, and are well positioned to
impose conditions and constraints on funding. Also, like federal governments, state and
provincial governments have the power to impose taxes and to spend the revenues from
those taxes as they see fit. State and provincial governments also influence municipal
planning and investment decisions through their legislative and regulatory frameworks,
and their ability to offer training and technical support.
Improve regional coordination
Many medium and large size city-regions in the basin are composed of several
municipalities that compete with each other to attract development while regional bodies
are often limited in scope or of an advisory nature. This means that few regions are
equipped to handle the macro-scale environmental issues that cross municipal borders or
to manage growth on a regional level. To address this issue, new forms of regional
cooperation need to be introduced, such as regional transportation and land use agencies.
State and provincial governments should lead the effort to bring different local groups
together so that a more effective regional, watershed approach can be taken to planning.
Such coordination will be critical as the basin‘s population continues to expand. Ontario
has demonstrated leadership in this regard by creating a coordinated greenbelt strategy
and encouraging a large portion of regional growth to be accommodated through
intensification rather than greenfield development. This impressive plan did, however,
require the adoption of enabling legislation and strong support on the part of regional and
local governments for the plan, and would not likely have succeeded in the absence of
those supports. Indeed, earlier attempts at metropolitan planning within the Greater
Toronto Area that have failed to alter conventional suburban and automobile oriented
development. Similar efforts are possible elsewhere in the Great Lakes Basin but, as this
example shows, leadership of senior governments may be a critical factor in changing
public attitudes and expectations about desirable urban form.
Also needed is some mechanism to strengthen the sense of shared destiny within each
region as a way to address the sometimes-debilitating struggle between suburban and
central city jurisdictions. From an economic point of view, this could be addressed
through the creation of regional development agencies that represent each region to the
world and attract investment that brings benefits to all sectors. Also needed are
mechanisms to reduce economic disparities among jurisdictions within each region and

95
short-circuit the sometime ruinous competition to attract land development projects, a
process that also fuels sprawl. Tax-base sharing (redistributing the tax-base increase due
to growth anywhere in the region), such as practiced in Minneapolis, is one mechanism
that could help address this dynamic in the basin.
Link land use and environmental issues in planning frameworks
Municipalities in the basin (as elsewhere) rarely link land use planning to environmental
considerations such as water extractions and disposal, waste disposal, air quality
impairment, and greenhouse gas emissions. Yet such a linkage would require only
modest regulatory reform and could a significant impact on environmental outcomes of
municipal decision making across the full range of departments that affect the
environment. Water use and watershed master planning is a particularly important
linkage here; there is no reason that, in their oversight capacity, state and provincial
governments could not require that demand management options be fully developed as a
requirement of land use planning approval. As for land use planning, the province of
British Columbia is blazing a trail by introducing legislation (Bill 27) that will require
local governments to include greenhouse gas emission targets, policies and actions in
their Official Community Plans and Regional Growth Strategies. They will also be able
to use development permits as a lever to promote energy and water conservation and the
reduction of greenhouse gases, and encourage alternative transportation options for off-
street parking.
Revise building codes
Typically, building codes are enacted at the state/provincial level, and historically have
contained some obstacles to sustainable building practices. For example, some building
codes have required installation of 5 gallon (20 litres) flush toilets, and in doing so
blocked implementation of newer technology with the potential to reduce water use to 3
litres per flush or less. Other examples are restrictions to on-site wastewater reuse
systems, green roofs, minimum road widths, building-lot minimum areas and parking
space requirements. Building codes should be revised to encourage energy efficiency
practices and impose strict operational and maintenance standards for septic system.
Provide technical support to municipalities
Most smaller municipalities lack adequate technical expertise to predict the local and
regional environmental impacts of the decisions they take or to take advantage of
innovations in management techniques or technology that can reduce the environmental
impacts of development. Guidance from state/provincial governments would help to fill
this gap. Assistance could come in the form of a guidebook for municipalities on
implementing green infrastructure, such as green roofs, trees and tree boxes,
rain gardens, vegetated swales, pocket wetlands, infiltration planters, porous and
permeable pavements, vegetated median strips, reforestation/revegetation, and protection
and enhancement of riparian buffers and floodplains. Such a guidebook could include a
decision-tree for selecting green infrastructure approaches for new development,

96
redevelopment and retrofits (including performance and cost factors), site planning and
design review specifications, operation and maintenance requirements, model codes and
ordinances/bylaws, incentives and funding options, tracking and evaluation protocols,
and marketing information. State/provincial governments could also provide technical
assistance, training, and outreach to municipalities on how to implement green
infrastructure programs.
Protect coast lines
Another area of environmental concern has been the build-up of development along the
coasts, one of the most fragile, vital areas of the Great Lakes‘ region. Because of the need
for consistent intervention along a continuous geographical entity, state and provincial
governments are better positioned than individual municipalities to take action on this
issue. Some states are already trying to preserve lakeshores through various conservation
programs. In Ohio, for example, the state has partnered with the federal government to
conserve 67,000 acres of stream corridors in northwest Ohio. The project‘s goal is to
improve water quality in Lake Erie by reducing sediment pollution and field runoff
through the installation of filter strips, wetlands, hardwood trees and wildlife habitat. In
Minnesota, state legislators have appropriated money for the purchase of undeveloped
shore land from owners with property near the state‘s lakes and rivers.
Fiscal policies
State and provincial governments can also modify their taxation regimes and other fiscal
policies to promote smart growth. For example, Michigan has created incentives for
brownfield redevelopment, something that should be done in all jurisdictions, as should
natural heritage conservation. Ontario has allocated two cents per litre of the provincial
gas tax revenues to municipalities for public transit, a model that could be imitated in
jurisdictions south of the border. Some jurisdictions have lower tax rates for agricultural
land, which helps support the farm economy and preserve land in agricultural use.
Law reform
State/provincial legislation governs the ability of municipalities to impose development
charges/impact fees. These statutes should be reviewed to ensure that local authorities
have the ability to structure infrastructure levies in ways that promote compact
development, minimize disturbance to natural areas, and takes advantage of existing
municipal infrastructure. British Columbia‘s Bill 27 will exempt developers who are
building small housing units (29 square metres or less) from paying Development Cost
Charges. Local governments will have the ability to waive or reduce these charges for
green development including small lot subdivisions and affordable rental housing.
State and provincial governments should also review legislation to remove constraints or
disincentives on brownfield redevelopment such as onerous liability rules. Legislation
governing property taxation should be reviewed to ensure that it does not pose barriers to

97
municipalities that want to reduce taxes on rental buildings or compact developments, or
who would like to move to a land value taxation system.
Local Governments
Local governments carry out the vast majority of land use planning decisions, and impose
a variety of ordinances and tax structures designed to advance community values.
Through these tools, they are able to influence the direction, flow, and timing of traffic;
the location, style, and size of residential, commercial, and industrial development; the
width and construction of roads; the use of municipal sewer systems; and the
redevelopment of brownfield sites. Municipalities, in other words, can directly control
urban form and density and through those controls have a direct and immediate impact on
environmental degradation and human health.
Re-orient municipal investment decisions
Investment decisions are powerful levers with which to achieve integrated planning
goals. When a municipality adopts a policy that says it will not invest in infrastructure
(roads, water, sewer, etc.) to support growth outside a certain boundary, as was the case
in Ottawa‘s recent master plan, it sends a clear message to developers about where
growth will be supported. This reduces speculation outside the current urban envelope
and redirects development energy into existing areas. Shifting municipal spending from
road expansion to developing transit facilities linked to land use planning goals is another
way to move towards smart growth. In Calgary, for example, a municipal policy requires
the transportation budget be divided equally between road and transit spending. The
result has been a dramatic improvement in the transit system and buoyant ridership as the
city undergoes rapid growth.
Link fiscal instruments to growth management plans
Fiscal instruments such as development charges, property taxes, parking rates, and other
user fees are usually shaped by factors unrelated to the municipality‘s growth
management goals. For example, infrastructure charges (called development charges in
Canada and impact fees in the US), which are collected from developers to help pay for
municipal infrastructure needed to support growth, are usually calculated in a way that
inadvertently subsidizes growth on the fringe and penalizes infill development.
State/provincial framing legislation and municipal ordinances should be revised to
encourage fee regimes that reduce fees on higher density development in infill areas at
the expense of low-density fringe development (as in Kelowna, BC). Charges for
transportation infrastructure could be scaled (as they are in Orlando, FL) such that car-
oriented developments pay higher fees than transit-oriented ones.
Likewise, property taxes often treat rental apartment buildings like businesses and
therefore apply a much higher tax rate on them than for low-density detached dwellings.
These instruments need to be rethought from a growth management point of view and
revised to avoid biasing development against compact and affordable housing (as is being

98
done in many jurisdictions in Ontario following the introduction of an enabling
legislation by the province). Like infrastructure charges, property taxes could be more
widely used to promote infill development. In some cities, for example, property tax rates
are keyed to the distance the dwelling is away from service centres such as police and fire
stations. The message is that if people want to spread out, the resulting stress on
municipal budgets should be reflected in their tax rates. In other cities, such as
Harrisburg, tax rates are set to reflect land values rather than the value of the
improvements or buildings on the land. This ―land value‖ approach to taxation helps
promote infill development and undermines land speculation.
Other means to integrate revenue raising mechanisms and smart growth goals are in use
in scattered jurisdictions across Canada and the US. Taxes on parking lots can be used to
raise money for transit investment (as is done in Vancouver) or a special charge may be
placed on automobile registration for the same purpose (as is done in Montreal). In
Minneapolis, the water utility imposed a separate charge on property owners for
stormwater management and provides credits for owners who reduce impervious cover or
install best management practices such as green roofs, rain gardens, or vegetated swales.
Commuter taxes are payroll taxes that are applied by a municipality to people employed
but not residing in that jurisdiction. This mechanism, which is in use US cities such as
Pittsburgh and Scranton in Pennsylvania, allows central cities to raise money from
suburbanites who commute to the city and use city services but pay no property taxes to
the city. This helps to address some of the fiscal disparities commonly found in
metropolitan regions and strengthens core areas.
Integrate land use and transportation planning
One of the key barriers to smart growth is the separation of land use and transportation
planning into separate administrative structures. These municipal agencies should be re-
organized so that land use and transportation (including roadways, transit, pedestrian and
bike) planning are under a single administrative structure. Where it has been tried, such
reorganization has been found to reduce conflict between land use planners and
transportation engineers and increases the opportunity for linking land use and
transportation planning.
In addition, municipalities should reform their development approval procedures to
empower transit agencies to intervene substantially in the design of new developments
(as is done in Brampton). They can do this by providing transit agencies with the
resources and mandate to be full partners in the review of development applications and
by creating transit-supportive planning guidelines endorsed by council, and use them as a
basis for approving development applications. Municipalities should also explore the
feasibility of introducing flexible transit services (such as bus shuttles used in Calgary) at
an early stage in the development of new communities, before households are locked into
car-dependent investments and habits.
Another way to link transportation and land use planning is to focus development near
transit stations. The premise of transit-oriented development (TOD) is that locating

99
residential development and employment near transit stations increases the market for
transit services and yields greater ridership than is achieved at stations (or bus stops)
surrounded by low-density development. Transit-oriented communities often include
mixed-use clusters of housing, office, and retail. By bringing these activities closer
together, these developments also reduce the need to own a private vehicle and stem the
demand for greenfield development on the urban fringe. Arlington County, Virginia, is
recognized for its work on building TODs around existing metro stations.
Address resident opposition to compact housing
Local resistance to higher-density housing or affordable housing limits the potential for
achieving more compact neighbourhoods. Not in My Back Yard (NIMBY) can result in
significant time delays, additional costs and frustration on the part of project proponents,
and may result in the cancellation of projects.
There are two general approaches to dealing with NIMBY: communication and conflict
resolution strategies. Communication strategies can attempt to build community
understanding and acceptance of more compact housing in general or may be oriented to
information sharing on particular housing project. The former would be designed to keep
the public and council informed on the need for more compact housing in the community
(e.g., to house workers in the services industry), and the real impacts of compact housing
in an existing neighbourhood (e.g., on property values and crime rates).
Conflict resolution strategies (such as those used in Edmonton) build acceptance of the
particular project by supplying information that all interested parties could use. This
includes proactive measures like transparent communications with the community on
development proposals and planning deliberations, pre-application meetings between the
proponent and the community, and visualization techniques that allow local planners to
work with neighbours to show how proposed projects will look. Conflict resolution
strategies are more reactive than proactive in nature. They are designed to help resolve
concerns and fears over specific projects that have, or threaten to, become controversial.
It may involve a dispute resolution procedure involving all parties involved in the
development and facilitated by city planners or by professional mediators working for the
City. While it is unlikely that any strategy will eliminate opposition entirely,
communication and mediation techniques can help build community support for compact
housing and turn the scales in favour of specific projects.
Promote creative design
One way to improve acceptance of higher-density housing projects in an existing
neighbourhood is to focus on good design. Research consistently shows that when
projects are well designed, neighbours will accept higher-density housing than would
otherwise raise strong objections. Municipalities can encourage good design by adopting
guidelines laying out architectural and site planning options that will allow the project to
fit more smoothly into the existing neighbourhood. Such design guidelines have been
adopted in Guelph for integrated secondary suites into the existing neighbourhood, and in
100
London for accommodating buildings of significant density in low-density residential
neighbourhoods. In new subdivisions, innovative design guidelines can help provide clear
signals to developers as to what the municipality is aspiring to and reduce the
misunderstanding and delays that often plague the approval process when a developer
moves off the beaten track. In Stratford, Ontario, the concept of the ―fused grid‖, which
responds to the demand for privacy, public open space, and calm streets that have
traditionally drawn people to the suburbs, while promoting more efficient land use and
walkability, is being employed to shape greenfield development.
Identify and exploit development opportunities within the urbanized area
One way to meet smart growth goals is to make full use of the development opportunities
within the already urbanized area. Many of these opportunities – such as large parcels of
land formerly used for industrial or commercial purposes – are suitable for the creation of
compact housing within the context of socially diverse, mixed-use communities. On a
smaller scale, infill development within existing neighbourhoods may be possible
through the subdivision of large lots into two more modest lots or by building on parking
lots, especially along transit routes. If sensitively carried out, this type of intensification
can add to the vitality of an area while generating the ridership to create a more efficient
transit system. Local governments should systematically inventory land available to
accommodate development (as Halifax and Ottawa have done) and adopt the appropriate
zoning to encourage compact development without disrupting existing communities.
Promote green development
Municipalities can promote green development practices by creating guidelines and
targets for developers and builders to follow. These guidelines can be incorporated into
the approvals process as voluntary or mandatory criteria. For example, the Toronto Green
Standard, which was adopted in 2006, sets out building and construction criteria for
energy efficiency, reuse of materials, transportation options, better stormwater
management, less waste production, and creation of green spaces that are aesthetic and
provide habitat for local fauna. The standard is used internally to guide building practices
for the city‘s own facilities and is presented to developers when they come in for site
plan, official plan, zoning bylaw and subdivision applications. Most developers are taking
the green checklist into account. The city is considering making the guidelines
mandatory. Municipalities could also offer more tangible rewards to green developers,
such as reduced development charges/impact fees, waived planning fees, property tax
abatements, or the sale of public land at reduced costs, all techniques that are already in
sporadic use around the basin. The level of financial incentives offered could be scaled to
the degree that the proposal meets the objectives of the grading system.
Revise zoning codes to be more flexible
Zoning bylaws regulate the use of land by specifying densities, building types, location of
uses on the land and within the structures, lot sizes, set-backs, and so on for each zoning
category. Zoning practices have evolved over many years and may not reflect current
101
market opportunities or policy considerations such as the desire to increase densities,
achieve a mix of land uses and reduce housing costs. Current zoning practices often
strictly limit the range of lot sizes, land uses and housing types permitted in any given
area and fail to make the most efficient use of the land base.
These restrictions can be used to prohibit innovative infill projects in mature areas and to
enforce social homogeneity in suburban areas. This can force lower income households
into enclaves that are not only stigmatized but are far from employment sources, reducing
their employment opportunities or increasing commuting distances and associated
personal and environmental costs. Rigid zoning in situations where innovation in building
form, the mix of uses or design is desired can force developers into time-consuming
negotiations with municipal authorities in order to secure exceptions, minor variances or
amendments to existing zoning bylaws, all of which have uncertain outcomes and add to
the cost of development.
More flexible zoning can create conditions for increased density and mixed use, improve
the quality of urban design and sensitivity to the development context, and facilitate
innovative projects that would otherwise be stalled by the rigidities of conventional
zoning. Flexible zoning practices include:
Smaller lots and setbacks – Zoning that is flexible enough to permit smaller lot
sizes (width, depth and area), lot frontages and setbacks (front, interior and corner
side, rear yards).
Fewer zoning categories permitting a wide range of housing types – Zoning for
new development that allows a high-degree of mixing of housing types and land
uses.
Lower-density zones that permit medium density infill development – Zoning
regulations that allow medium-density housing forms on infill lots in low-density
areas.
Relaxed zoning in mixed-use areas – Elimination of any zoning requirements
(such as density standards, parking requirements, land use restrictions) that are
posing obstacles to the revitalization of mixed-use areas.
Markham, ON adopted such zoning practices to allow Cornell, a New Urbanist
development, to go ahead in the 1990s. In Toronto, zoning codes were relaxed to allow
the revitalization of two warehouse neighbourhoods on King St. near the downtown (the
―Two Kings‖).
Adopt alternative development standards
Transportation facilities (including roads, parking lots, bridges, driveways, etc.) account
for much of the impervious surfaces found in urban areas. Development standards govern
the physical sizing of roads, sidewalks, parking areas, and street landscaping. Standards
are set so as to protect public safety and to prevent the need for costly maintenance down
the road. However, it may be possible to reduce road standards (without compromising
their utility or safety) in order to reduce impervious coverage and the associated urban
runoff. Narrow roads also reduce development costs, contribute to housing affordability,

102
calm traffic and reduce land consumption, allowing for more compact development.
Portland, Oregon, for example, implemented its Skinny Streets Program in 1991 to
reduce street widths and calm traffic.
Another way to reduce impervious cover is modifying or downsizing parking areas. The
requirement that residential developers provide a minimum of on-site parking to
accommodate residents‘ and visitors‘ parking needs often serves as a stumbling block to
infill development where land values are high and land scarce. The requirements are
usually applied in an inflexible manner and do not take into account local factors such as
the level of car ownership and use of residents, accessibility to transit and proximity of
employment, or provision of transportation alternatives as part of a development. The
result is that parking requirements are sometimes in excess of actual need for both
residential and commercial development. This unnecessarily adds to the extent of
impervious surfaces.
Municipalities control the supply of parking spaces through zoning bylaws. Zoning
bylaws can reduce or even eliminate parking requirements in specific locations (as in St.
John‘s downtown), or can be used to impose maximum instead of minimum requirements
(as in Calgary‘s downtown area). Innovations such as shared parking facilities (e.g.,
allowing Church parking to be used during the work week as employee parking for
nearby businesses) can reduce parking requirements in neighbourhoods with
complementary land uses. On-street parking and structured parking are other options.
Municipalities can also implement policies that offer developers alternatives to parking
provision. For example, developers could be given the option of providing a reduced
numbers of parking spaces if they accommodate a car co-op (as is done in Vancouver) or
if they provide bicycle parking or transit facilities (e.g., bus shelters, as has been done in
Richmond Hill, ON, since 1997).
Many municipalities in the US and Canada are experimenting with alternative
development standards. Innovation in this respect is often carried out under the banner of
New Urbanism, a planning movement that originated in the US and is inspired by the
desire to create more compact, convivial and aesthetically attractive communities that
provide a choice among transportation modes. There are over 400 New Urbanist projects
in the US and over 40 in Canada using some combination of alternative development
standards.
Manage transportation demand
A combination of public education, incentives and regulations can be used to moderate
car use and traffic. A combination of marketing campaigns promoting transit use (e.g.,
―Ride the Rocket‖ in Toronto) and user fees (e.g., toll roads, fees to enter central city
areas, or high parking charges, all of which are likely to be introduced in Montreal in the
near future) can be highly effective in reducing traffic volumes and encouraging a shift
toward public transit usage, with associated benefits for human and ecosystem health.

103
The best-known example of the use of tolls to ease central city congestion is in London,
UK. Since 2003, Transport for London, has required the payment of a ―Congestion
Charge‖ by motorists entering the central London area. The fee was originally set at £5,
and was raised to £8 in 2005. The owner of any vehicle that enters, leaves or moves
within the congestion charge zone between 7 am and 6:30 pm, Monday to Friday, must
pay the charge. Hefty fines are imposed on those who fail to pay the charge. Copenhagen,
Denmark, uses a system of zoned parking charges that discourage commuting to the
central areas where there are good-quality transit alternatives; parking charges are
extremely high in the centre core, but decline in outer areas.
Facilitate redevelopment of brownfield sites
Promoting higher densities and a mix of uses on brownfield sites can increase the
potential economic return on major remediation investments while encouraging more
compact development. The redevelopment of brownfield sites for residential or mixed
use is proceeding in many communities throughout the basin, especially in well-situated
areas that can attract developer interest, but barriers to the full-scale redevelopment of
such site remain. Municipalities such as Cambridge, ON are attempting to address these
barriers by tipping the playing field in favour of redevelopment. Measures could take the
form of:
identification and mapping of brownfield sites within the municipality;
grants to help clean-up sites and prepare them for redevelopment;
property tax rebates to promote brownfield redevelopment;
waiving permit and other municipal fees and charges;
using innovative urban designs and development standards that promote the retention
of existing structures and allow the area to be better incorporated into the existing
urban fabric;
building public acceptance and industry capacity to undertake brownfield
redevelopment projects;
facilitating the demonstration of innovative environmental technologies and
remediation processes;
upgrading public infrastructure to support redevelopment;
encouraging partnerships among site designers and contaminated soil specialists in
order to create plans that minimize the need for cleanup.
Firm development controls on greenfield sites across an urban region, coupled with
flexible zoning for brownfield areas, can direct new construction away from marginal
areas and encourage mixed-use development. Permission to develop on greenfield sites
could be linked to investment in brownfield areas, making a limited amount of new
development at the urban fringe conditional on more extensive redevelopment in the
urban core.
Reduce stormwater flows
Minimizing the amount of stormwater that enters sanitary and combined sewer systems is
critical to reducing the amount of raw and partially treated sewage entering the Great

104
Lakes. To accomplish this, cities need programs to encourage the disconnection of
residential downspouts and footing drains connected to municipal sewer systems.
Milwaukee has programs to encourage the use of rain barrels, rain gardens, green roofs,
and porous pavement to improve the management of rainwater. Rain barrels that collect
rainwater from downspouts for use in the garden are an excellent example of an easy
investment that can both conserve water and decrease sewage and stormwater flows.
Although it carries a high up-front cost, physically separating stormwater and sewage
streams in combined sewer systems also greatly reduces overflows and the overall
volumes flowing to the wastewater treatment plant. Infiltration of groundwater into sewer
pipes through cracks adds unnecessary flow volumes. This can be reduced through
regular sewer pipe repair programs or the installation of linings in pipes.
Reuse wastewater
Across the globe in areas where clean freshwater is in short supply, wastewater is often
reclaimed and reused. Advances in water reclamation technology can turn wastewater
into a viable resource and reduce overall water consumption rates. When efficiently
managed, reclaimed wastewater can be used in irrigation, industrial use, surface water
replenishment and groundwater recharge. In Canada, water reuse has been implemented
in select developments, such as Quayside Village in Vancouver, where grey water is used
for toilet flushing. In the US, St. Petersburg, Florida is doing water reuse on a municipal
scale. There four water reclamation treatment plants recover 140 million litres of
wastewater daily from over 10,000 homes and businesses. The water is used for non-
household purposes such landscape irrigation and industrial cooling.
Some concerns regarding the potential health effects of reclaimed water have slowed the
expansion of reuse beyond irrigation, groundwater recharge, and non-potable industrial
uses. Given that climate change is and will continue to have a big impact throughout the
world, freshwater will become an increasingly valuable and scarce resource. In the future,
wastewater reuse and reclamation will become increasingly important tools globally and
in vital freshwater ecosystems such as the Great Lakes Basin.
Manage water demand
As mentioned above, Americans and Canadians are the world‘s most profligate water
consumers. Yet, only a small proportion of municipally treated water – less than 3
percent - is actually used for drinking. As much as 65 percent is used for bathing and
toilet flushing, and in some regions up to three-quarters of the total residential water
demand is for lawn and garden watering and car washing. Environment Canada estimates
that a household water efficiency program can reduce water use by 40 percent or more.
Therefore, there is good potential for water conservation in the many cities around the
Great Lakes that have not implemented water efficiency programs. Smart growth
responses can include public outreach and education initiatives, including programs to

105
promote water conservation through leafleting households or placing prominent signs on
roadways leading into the city.
Public education campaigns work best when they are backed up by financial incentives
and regulations that are strictly enforced. Some municipalities, including Kitchener-
Waterloo, have been successful in introducing aggressive water conservation programs,
including incentives for the installation of water saving appliances (low-flow toilets and
shower heads, tap aerators, and front-loading washing machines) to reduce consumption.
Other municipalities encourage the use of untreated water for gardening and other
purposes by subsidizing the purchase of rain barrels and cisterns. Still others restrict the
use of water, especially during summer months, for outdoor purposes (e.g., lawn
watering, car washing). While these measures often meet with some initial resistance,
over time they can result in significant decreases in residential water use.
Central to the concept of demand management is the setting of prices in such a way that
the amount of water used by any activity is a function of price. Increasingly, water
managers recognize the validity of pricing water at its true value, making it far more cost
effective to increase the available supply of water by using existing supplies more
efficiently. Much can be done in many areas of the basin to use water more efficiently by
such measures as adopting metering of all water facilities and moving more assertively to
recovering the full costs of providing water services (IJC, 2000).
Preserve agricultural land
State- or province-wide agricultural zoning, with a supporting commission to oversee
implementation (as exists in BC and Quebec), would permit the identification and
preservation of the most economically important agricultural land. The use of extensive
greenbelts around specific urban regions, such as currently being implemented in the
Greater Golden Horseshoe, could work to preserve farmland in the city‘s hinterland and
redirect growth into the already urbanized area. More rigorous application of existing
tools such as cluster zoning, permanent conservation easements, and open-space
purchases could ensure the maintenance of viable, contiguous agricultural areas without
undue financial penalty for landowners. Tax credits may help lessen the advantage to
local authorities from the development of farmland, but require administrative capacity
and strict conditions to be effective.
Adopt more stringent policies for conservation of ecologically sensitive lands
Hydrological functions in urban areas are heavily impacted by human activities. To
maintain ecologically sensitive areas that cleanse run-off and recharge groundwater,
state/provincial and municipal governments need to adopt more stringent regulations
supported by monitoring and enforcement programs. Wetlands, riparian zones, and
forested areas need to be protected from encroaching development. Through the planning
process, municipalities such as the Region of Waterloo, the City of Guelph and the
County of Wellington have taken steps to protect watershed functions. These initiatives
include limiting the amount of impervious cover in sensitive areas and redirecting

106
development to landscapes that are not as sensitive. Municipal governments should also
require developers to conduct hydrogeological assessments and explicitly provide for the
protection groundwater recharge areas, wetlands and other ecological features that are
essential to a healthy water cycle in their development plans and as a condition of
development approval.
Promote urban agriculture
There is a world-wide movement to bring agriculture back into urban areas, including
rooftops, back yard gardens, community gardens on public land or vacant private land,
and even vertical greenhouses in dense urban settings. Urban agriculture can not only
enhance food security for urban populations and build community cohesion, but it can
help with stormwater management and water quality if otherwise impervious areas are
converted to vegetated surfaces. Within the Great Lakes Basin, Detroit and Toronto have
extensive community gardening programs and Chicago has the most elaborate green
roofs program, some of which is used for food production. Municipalities can promote
urban agriculture by working in partnership with community groups to provide public
land, supplies (gardening tools and seeds), and training. Green roofs are expensive to
build and require incentives such as direct subsidies, density bonuses, or reductions on
stormwater charges.
Conduct watershed planning
Watershed planning is a decision-making framework that considers water resources and
land uses within an entire watershed area (defined by hydrological boundaries) when
planning for growth and development. This type of planning allows stakeholders in each
watershed to identify specific assets, goals, challenges, and needs that affect the area, yet
cross jurisdictional lines. By identifying priority areas for preservation and development
at the watershed level, watershed planning helps communities develop policies and
incentives to accommodate growth while minimizing impact on water resources.
Watershed planning requires cooperation from a variety of stakeholders, such as state and
local governments, homeowners, environmental organizations, and industry. In some
cases, the best solution might be to create a new watershed planning entity to coordinate,
manage, and/or enforce the policies generated by the watershed coalition of localities.
Ontario‘s Conservation Authorities could serve as a successful model for this purpose.
Coordinate development and conservation plans
Protecting critical natural resources and planning for future development are often
handled as two separate planning processes. For example, a regional environmental
authority might be responsible for designating areas for preservation and establishing a
plan that reflects those priorities. As a separate effort, a local planning authority might
create a plan that describes where and what type of future development will take place.
The existence of the two planning systems in separate ―silos‖ can create conflicts when
development plans contradict conservation plans, and controversy erupts. Coordinating
these two types of efforts can help protect critical water resources such as wetlands and

107
riparian barriers. By ensuring land use planning and conservation authorities are sharing
information and working together to identify potential conflicts before they erupt into
polarized positions, communities can improve the preservation of sensitive lands and
increase predictability within the development process.
Coordinate development planning with sewer and water authorities
Sewer and water departments can play a major role in directing a region‘s growth by
determining when and where new infrastructure investment will occur. These authorities
can help reduce the impacts of development by directing growth to areas least likely to
impact water resources. Planning/infrastructure coordination is easier if extensions of
existing facility planning areas require the approval of the regional or state environmental
agency or planning agency. In this way, facility planning areas can be a strong tool to
determine how and where a community will grow. For example, the state of Wisconsin
uses planned sewer service areas as a tool to integrate wastewater infrastructure and local
planning efforts. As a rule, Wisconsin automatically excludes environmentally sensitive
areas such as wetlands, steep slopes, and floodplains from consideration for current or
future service extensions. The development of these areas must correspond with the goals
of the local comprehensive plan, and not depart from any other ordinances directing
growth and resource protection. The state estimates that these efforts to protect natural
areas and incorporate land use planning have helped prevent the destruction of habitats
and impairment of water quality, and avoided the need for cleanup associated with failing
wastewater treatment methods.
References
American Association of State Highway Officials Green Book. 2004. A policy on
Geometric Design of Highways and Streets, 5th
Edition
American Farmland Trust. 2006. ―Fact sheet: Agricultural district programs.‖ Available
at: http://www.farmlandinfo.org/documents/27763/Ag_Districts_11-06.pdf.
American Farmland Trust. 2003. ―A national view of agricultural easement programs:
Profiles and maps – Report 1.‖ Available at:
http://www.aftresearch.org/research/publications/detail.php?id=d72dd282ec8bff1b153c1
7fc3ca602ab.
American Planning Association. 2002. Planning for smart growth: 2002 State of the
States. Available at: http://www.planning.org/growingsmart/states2002.htm.
American Rivers, the Natural Resources Defense Council, and Smart Growth America.
2002. Paving Our Way to Water Shortages: How Sprawl Aggravates the Effects of
Drought. Available at: http://www.smartgrowthamerica.org/DroughtSprawlReport09.pdf.
American Society of Civil Engineers, 2001. Standard Guidelines for Artificial Recharge
of Groundwater. ASCE 34-01.

108
Austin, John C. and Britany Affolter-Caine, 2006. The Vital Center: A Federal-State
Compact to Renew the Great Lakes Region. Available at:
http://www.brookings.edu/reports/2006/10metropolitanpolicy_austin.aspx.
Arcand-Hoy, L. and Chris Metcalfe. 1999. ―Biomarkers of exposure of brown bullheads
(ameirurus nebulosus) to contaminants in the lower Great Lakes, North America.‖
Environmental Toxicology and Chemistry 18(4): 740-749.
Baker, D. and D. Shoemaker. 1995. Environmental assessment and aggregate extraction
in Southern Ontario: the Puslinch case. University of Waterloo: Department of
Environment and Resource Studies.
Baumann, Paul C. and John C. Harshbarger. 1995. ―Decline in liver neoplasms in wild
brown bullhead catfish after coking plants closes and environmental PAHs plummet.‖
Environmental Health Perspectives 103(2): 168-170.
Belzer, D. and G. Autler. 2002. Transit oriented development: moving from rhetoric to
reality. Center for Urban and Metropolitan Policy, Brookings Institution, Washington,
DC.
Berry B. J. L., and H. M. Kim, 1993, ―Challenges to the monocentric model‖
Geographical Analysis 25 1-4
Blais, Pamela. 2003. Smart Development for Smart Growth. Issue Paper No.6. Toronto:
Neptis Foundation.
Blais, Pamela.1996. The Economics of Urban Form. Prepared for the GTA Task Force,
Toronto.
Blewett, Robert A. and Julia I. Lane. 1988. ―Development rights and the differential
assessment of agricultural land: Fractional value of farmland is ineffective for preserving
open space and subsidizes speculation.‖ American Journal of Economics and Sociology
47(2): 195-205.
Blumberg et al. 2000. Atmospheric deposition of toxics to the Great Lakes: Integrating
science and policy. Chicago: Delta Institute.
Biodiversity Project (The) (adapted from). 2000. Making the Biodiversity-Sprawl
Connection. Madison, WI.
Boarnet, M.G. and Andrew F. Haughwout. 2000. Do Highways Matter? Evidence and
Policy Implications of Highways’ Influence on Metropolitan Development. Prepared for
The Brookings Institution Center on Urban and Metropolitan Policy.

109
Bourne, L.S. and D. Rose. 2001. The Changing Face of Canada: the Uneven
Geographies of Population and Social Change, The Canadian Geographer 45 (1), 2001,
105-19.
Bray R., Vakil C., and Elliot D. 2005. Report on Public Health and Urban Sprawl in
Ontario. Ontario College of Family Physicians. Accessed 19 June 2008 at
http://www.ocfp.on.ca/English/OCFP/Urban-Sprawl/
Bruegmann, Robert. 2005. Sprawl: A Compact History. University of Chicago Press:
Chicago.
Buehler, S. and Ron Hites. 2002. ―The Great Lakes‘ Integrated Atmospheric Deposition
Network.‖ Environmental Science and Technology, 36: 355A-9A.
Buehler, et al. 2001. Atmospheric Deposition of Toxic Substances to the Great Lakes:
IADN Results Through 1998.
Burchell, R.W. 1978. The Fiscal Impact Handbook. The Center for Urban Policy
Research: New Brunswick, NJ.
Burchell, R. 1996. Understanding Sprawl. On the Ground. 2(2).
Burchfield, Marcy, Henry G. Overman, Diego Puga, and Matthew A. Turner. 2005.
"Causes of sprawl: A portrait from space." Quarterly Journal of Economics (May): 587–
633. Available at: http://diegopuga.org/papers/sprawl.pdf.
Campsie, P. 2001. Smart Growth in Canada. Toronto: Canadian Urban Institute.
Cao, X., P. Mokhtarian, and S. Handy. 2006. (Published online February 2008)
Differentiating the influence of accessibility, attitudes, and demographics on stop
participation and frequency during the evening commute Environment and Planning B:
Planning and Design 35(3) 431 – 442. Available at:
http://www.envplan.com/abstract.cgi?id=b32056
Caruso, D. and G. Sands. ―Problems in Implementing New Urbanism.‖ Proceedings of
the 2001 American Planning Association National Conference. 12 March, 2001.
Centre for Watershed Protection. 2002. The Impacts of Urbanization. Available at:
www.cwp.org.
Cervero, R. and R. Gorham. 1995. ―Commuting in transit versus automobile
neighbourhoods.‖ Journal of the American Planning Association 61: 210–225.
Chambers, P.A., M. Allard, S.L. Walker, J. Marsalek, J. Lawrence, M. Servos, J.
Busnarda, K.S. Munger, K. Adare, C. Jefferson, R.A. Kent, M.P. Wong. 1997. ―Impacts

110
of municipal wastewater effluents on Canadian waters: a review.‖ Water Quality
Research Journal of Canada 32: 659-713.
Chicago Metropolitan Agency for Planning. 2007. 2030 regional transportation plan for
Northeastern Illinois. Chicago: CMAP.
Christensen, E.R.and Sidharta Arora. 2007. ―Source apportionment of PAHs in sediments
using factor analysis by time records: Application to Lake Michigan, USA.‖ Water
Research 41: 168-176.
Cortes et al. 2000 ―Temporal trends in and influence of wind on PAH concentrations
measured near the Great Lakes.‖ Environmental Science and Technology, 34: 356-360.
Crowe et al. (editors). 2002. Linking Water Science to Policy: Groundwater Quality. A
CCME sponsored workshop. March, 2002, Toronto.
Diamond, Miriam and Erin Hodge. 2007. "Urban Contaminant Dynamics: From Source
to Effect." Environmental Science & Technology, June 1: 3796-3805.
Dorfman, Mark. 2004. Testing the Waters: A Guide to Water Quality at Vacation
Beaches. Prepared for the Natural Resources Defense Council. Available at:
http://nrdc.org/water/oceans/ttw/ttw2004.pdf.
Downs, A. 2005. ―Smart growth - why we discuss it more than we do it.‖ Journal of the
American Planning Association 71(4), 367-378.
Downs, A. 1994. New Visions for Metropolitan America. The Brookings Institute:
Washington, DC.
Downs, A. 1992. Stuck in Traffic: Coping with Peak-Hour Traffic Congestion.
Washington, DC: The Brookings Institute.
Drouillard, et al. 2006. ―A river-wide survey of polychlorinated biphenyls, polycyclic
aromatic hydrocarbons, and selected organochlorine pesticide residues in sediments of
the Detroit River.‖ Journal of Great Lakes Research, 32:209-226.
Duerksen, C. (1996) Site Planning for Large-scale Retail Stores. Chicago, IL: American
Planning Association, Planning Advisory Service Memo, April, p. 4.
Eberts, R.W., G. Erickcek, and J. Kleinheinz. 2006. Development of a Regional
Economic Dashboard, Upjohn Institute Employment Research.
Environment Canada. 2007. Canadian Environmental Sustainability Indicators:
Highlights 2007. Catalogue no. 16-252-XIE.
Environmental Defense. Fact Sheet: Cars and the Environment. Available at
http://www.environmentaldefense.org/system/templates/page/subissue.cfm?subissue=7

111
Environmental Integrity Project. 2005. Backed Up: Cleaning Up Combined Sewer
Systems in the Great Lakes. Available at:
http://www.environmentalintegrity.org/pubs/EIP_BackedUp_fnl.pdf.
Evans-Cowley, J. 2006 Sidewalk Planning and Policies in Small Cities. Urban Plng. and
Devel., Volume 132, Issue 2, pp. 71-75
Filion, P. and K. McSpurren. 2007. "Smart Growth and Development Reality: The
Difficult Co-ordination of Land Use and Transport Objectives." Urban Studies (44) 3:
501-524.
Filion, Pierre. 2003. "Towards Smart Growth? The Difficult Implementation of
Alternatives to Urban Dispersion." Canadian Journal of Urban Research 12 (1): 48-71.
Filion, P., T.E. Bunting and K. Warriner. 1999. "The Entrenchment of Urban Dispersion:
Residential Location Patterns and Preferences in the Dispersed City." Urban Studies 36:
1317-1347.
Filion, P. 2007. The Urban Growth Centres Strategy in The Greater Golden Horseshoe:
Lessons From Downtowns, Nodes, And Corridors. Prepared for the Neptis Foundation,
Toronto, ON.
Fishman, R. 1987. Bourgeois Utopias: The Rise and Fall of Suburbia. Basic Books, New
York.
Fox, G.A. 2001. ―Wildlife as sentinels of human health effects in the Great Lakes-St.
Lawrence Basin.‖ Environmental Health Perspectives 109(S6): 853-861.
Franz, et al. 1998. ―Dry deposition of particulate polychlorinated biphenyls and
polycyclic aromatic hydrocarbons to Lake Michigan.‖ Environmental Science and
Technology, 32: 3681-3688.
Fredricksen, L., L. Jones, and T. Wates. 2002. Environmental Indicators (5th
edition).
Fraser Institute Critical Issues Bulletin.
Fujii, T. and T.A. Hartshorn (1995) ―The changing metropolitan structure of Atlanta,
Georgia: Locations of functions and regional structure in a multinucleated urban area‖,
Urban Geography 16: 680-707.
Fulton, W., Pendall R., Nguyen, Mai and Harrison, A. 2001. Who Sprawls Most? How
Growth Patterns Differ Across the U.S. Centre on Urban and Metropolitan Policy. The
Brookings Institution Survey Series. July.
Garreau, J. (1991) Edge City: Life and the New Frontier. New York: Doubleday.

112
Gerba, C.P., J.P. Rose, C.N. Hass. 1996. "Sensitive Populations: Who is at the Greatest
Risk?" International Journal of Food Microbiology, 30(2): 113-23.
GHK International (Canada). 2003. Forecast & Analysis of Urban Development in the
Great Lakes Basin. Prepared for the Great Lakes Regional Office - International Joint
Commission.
GHK International (Canada). 2002. Growing Together: Prospects for Renewal in the
Toronto Region. A report prepared for the City of Toronto
Gilbert, Richard. 2003. ―Integrity of land-use and transportation planning in the Greater
Toronto Area.‖ In Eugene Lee and Anthony Perl, eds. The Integrity Gap: Canada’s
Environmental Policy and Institutions. University of British Columbia Press, Vancouver,
BC: 192-217.
Gillham, Oliver 2002. The Limitless City. Washington: Island Press.
Centre for Watershed Protection. 2002. Is Impervious Cover Still Important? Available
at: http://www.cwp.org/workshops/hudson/Impervious_Cover_Article%20_PartsI&2.pdf.
Giuliano, G. and K.H. Small (1993) ―Is the journey to work explained by urban
structure‖, Urban Studies 30: 1485-1500.
Goetz, et al. 2002. ―Metropolitan Planning Organizations: Findings and recommendations
for improving transportation planning.‖ Publius: The Journal of Federalism 32(1): 87-
105.
Gottdiener, M. and G. Klephart (1991) ―The multinucleated metropolitan region: A
comparative analysis‖, in R. Kling, S. Olin and M. Poster (Eds) Postsuburban California:
The Transformation of Orange County Since World War II. Berkeley, CA: University of
California Press, 31-54.
Government of Ontario. 2007. ―Backgrounders – MoveOntario 2020‖
http://www.premier.gov.on.ca/news/Product.asp?ProductID=1384, accessed January 16,
2008.
Grant, Jill. 2006. Planning the Good Community. Routledge: London.
Grant, Jill. 2002. "Mixed use in theory and practice: Canadian experience with
implementing a planning principle." Journal of the American Planning Association 68
(1): 71-84.
Grant, Jill. 2001. "Canada‘s Experience in Planning for Sustainable Development." Paper
presented at the International Workshop ―New Approaches to Land Management for
Sustainable Urban Regions.‖ Department of Urban Engineering, University of Tokyo:
29-31.

113
Great Lakes Commission. 2006. State smart growth policy profiles. Available at:
http://www.glc.org/meeting/sgprofiles.html, accessed January 16, 2008.
Great Lakes Commission. 2001. Linking Brownfields Redevelopment and Greenfields
Protection for Sustainable Development. Available at: http://www.glc.org/bridges/9-
01BridgesI.pdf. Chicago, GLC.
Great Lakes Information Network (GLIN). 2006. Wetlands in the Great Lakes Region.
Available at: http://www.great-lakes.net/envt/air-land/wetlands.html#overview.
Green, R. 2000. Nine Causes of Sprawl. Illinois Real Estate Letter, 1-13.
Green, M.L., J.V. Depinto, C. Sweet, K.C. Hornbuckle. 2000. ―Regional spatial and
temporal interpolation of atmospheric PCBs: interpretation of Lake Michigan mass
balance data.‖ Environmental Science and Technology. 34: 1833 - 1841.
Gyourko, J.E. and W. Rybczynski. 2000. ―Financing New Urbanism Projects: Obstacles
and Solutions.‖ Housing Policy Debate 11 (3): 733-750.
Haider, M. and E.J. Miller (2004) ―Modeling location choices of housing builders in the
Greater Toronto Area, Canada‖, Transportation Research Record 1898: 148-156.
Heavner, Brad. 2000. Paving the Way How Highway Construction Has Contributed to
Sprawl in Maryland. MaryPIRG Foundation. Page 9.
Helfield, J.M. and M.L. Diamond. 1997. ―Use of constructed wetlands for urban stream
restoration: a critical analysis.‖ Environmental Management, 21: 329 – 341.
Helfrich, J. and David Armstrong. 1986. ―Polycyclic aromatic hydrocarbons in sediments
in the southern basin of Lake Michigan.‖ Journal of Great Lakes Research 12(3): 192-
199.
Hemson Consulting. The growth outlook for the Greater Golden Horseshoe. Available at:
<http://www.hemson.com/news/GrowthOutlookForGGH%2017Jan2005a.pdf>.
Hoffman et al. 1984. ―Urban runoff as a source of polycyclic aromatic hydrocarbons to
coastal waters.‖ Environmental Science and Technology, 18: 580-587.
Holsen, T.M. and Kenneth E. Noll. 1992. ―Dry deposition of atmospheric particles:
Application of current models to ambient data.‖ Environmental Science and Technology,
26: 1807-1815.

114
Hussain, et al. 1998. ―Lifetime health risk assessment from exposure of recreational users
to polycyclic aromatic hydrocarbons.‖ Archives of Environmental Contamination and
Toxicology 35(3): 527-531.
Hwang, Hyun-Min and Gregory D. Foster. 2006. ―Characterization of polycyclic
aromatic hydrocarbons in urban stormwater runoff flowing into the tidal Anacostia River,
Washington DC.‖ Environmental Pollution 140: 416-426.
Infrastructure Canada, Research and Analysis Division. 2006 The Path Towards
Sustainability: An Evaluation of the ―Sustainability-ness‖ of Selected Municipal Plans in
Canada. Available at: < http://www.infrastructure.gc.ca/research-
recherche/alt_formats/pdf/rn08_e.pdf>
International Joint Commission. 2000. Protection of the Waters of the Great Lakes. Final
Report to the Governments of Canada and the United States. Available at:
<http://www.ijc.org/php/publications/html/finalreport.html>.
Jackson-Smith, Douglas. 2002. Planning for agriculture in Wisconsin: A guide for
communities. Madison: UW Cooperative Extension and Wisconsin Department of
Agriculture, Trade, and Consumer Protection.
Jakle, John A. and Keith A. Sculle. 2004. Lots of Parking: Land Use in a Car Culture.
University of Virginia Press: Charlottesville, VA.
Jones, K. and M. Doucet (2000) ―Big-box retailing and the urban retail structure: The
case of the Toronto area‖, Journal of Retailing and Consumer Services 7: 233-24.
Kavlock, et al. 1996. ―Research needs for the risk assessment of health and
environmental effects of endocrine disruptors: A report of the US EPA-sponsored
workshop.‖ Environmental Health Perspectives 104(S4): 715-740.
Kelly, et al. 1991. ―Atmospheric and tributary inputs of toxic substances to Lake Erie.‖
Journal of Great Lakes Research 17(4): 504-516.
Kenny, Joan. 1999. Water Loss Determination: For What It’s Worth. The Kansas
Lifeline. Available at: <http://ks.water.usgs.gov/Kansas/pubs/reports/water.loss.html>.
Kolankiewicz, Leon and Roy Beck. 2001. Weighing Sprawl Factors in Large U.S. Cities.
Available at <http://sprawlcity.com/studyUSA/USAsprawlz.pdf>.
Lang, R.E. (2003) Edgeless Cities: Exploring the Elusive Metropolis. Washington, DC:
Brookings Institution Press.
Lewis, P.F. (1983) ―The galactic metropolis‖, in R.H. Platt and G. Macinko (Eds) Beyond
the Urban Fringe. Minneapolis, MN: University of Minnesota Press, 23-49.

115
Libby, L.W. 2003. ―Reducing impacts of development on water quality: Policy directions
for guiding urban growth.‖ Presented at the Workshop on urban land-use impacts of
Great Lakes water quality, Toronto, January 8, 2003.
Lopez R. 2004. Urban sprawl and the risk for being overweight or obese. American
Journal of Public Health. 94(9): 1574-1579
Lorch, B. (2005) ―Auto-dependent induced shopping: Exploring the relationship between
power centre morphology and consumer spatial behaviour‖, Canadian Journal of Urban
Research 14: 364-383.
MacDermid, R. 2006. Funding Municipal Elections in the Toronto Region. A paper
presented at the Annual General Meetings of the Canadian Political Science Association,
Toronto.
Madden, J.F. (2003) ―The changing spatial concentration of income and poverty among
suburbs of large US metropolitan areas‖, Urban Studies 40: 481-503.
Marsalek, Jiri, and Harold Schroeter. 1989. "Annual loadings of toxic contaminants in
urban runoff from Canadian Great Lakes basin." Water Quality Research Journal of
Canada 23 (3): 360-378.
McCormack, A.J. A Guide to Paving. Available at:
http://www.pavingexpert.com/permabl1.html viewed June 18, 2008.
McDonald, J.T. (2004) ―Toronto and Vancouver bound: The location choice of new
Canadian immigrants‖, Canadian Journal of Urban Research 13: 85-101.
McNally, M.G. 1993. Regional impacts of neotraditional neighborhood development.
Working Paper No. 172, University of California Transportation Center, Berkeley, CA.
Metropolitan Transportation Commission. 2005. SAFETEA (TEA 21 Reauthorization
Update). Available at:
http://apps.mtc.ca.gov/meeting_packet_documents/agenda_527/TEA21-RR.doc.
Michigan Department of Environmental Quality. 2001. Combined Sewer Overflow (CSO)
& Sanitary Sewer Overflow (SSO) Annual Report (July 2000—December 2001).
Available at: http://www.deq.state.mi.us/documents/deq-swq-csossoreport01.pdf.
Michigan Land Use Institute. 2005. ―Water Works: Growing Michigan‘s Great Lakes
Opportunities.‖p.6. Available at: http://www.mlui.org/downloads/waterworks.pdf.
Mills, E.S. and W.E. Oates (1975) Fiscal Zoning and Land Use Controls: The Economic
Issues. Lexington, MA: Lexington Books.

116
Ministry of Municipal Affairs and Housing. 2005. Greenbelt Plan. Toronto: MMAH.
Ministry of Public Infrastructure Renewal. 2006. Places to Grow: Growth plan for the
Greater Golden Horseshoe. Toronto: MPIR.
Moan, P.C. 2002. On the Ground: Removing Barriers to Smart Growth Development at
the Local Level. Master's Thesis submitted to the School of Planning, Dalhousie
University, Halifax, NS.
Moody, R.P. and Ih Chu. 1995. ―Dermal exposure to environmental contaminants in the
Great Lakes.‖ Environmental Health Perspectives 103(S9): 103-114.
Natural Resources Defense Council. 1998. Another Cost of Sprawl: The Effects of Land
Use on Wastewater Utility Costs. Available at:
http://www.nrdc.org/cities/smartGrowth/cost/costinx.asp.
Nelson et al. 2007. ―Voting on open space: What explains the appearance and support of
municipal-level open space conservation referenda in the United States?.‖ Ecological
Economics 62: 580-593.
Newman, P. and J. Kenworthy. 1999. Sustainability and Cities: Overcoming Automobile
Dependence. Island Press: Washington, DC, Chapter 5.
Newman, J.R. and R. Kent Schreiber, 1984. ―Animals as indicators of ecosystem
responses to air emissions.‖ Environmental Management 8(4): 309-324.
Northeastern Illinois Planning Commission. 2006. 2040 regional framework plan.
Chicago: NIPC.
Nowlan, Linda. 2005. Buried Treasure: Groundwater Permitting and Pricing in Canada.
Walter and Duncan Gordon Foundation in cooperation with the Geological Survey of
Canada, West Coast Environmental Law, and Sierra Legal Defence Fund.
Occupational Safety and Health Standards: Purpose and Scope, 29 C.F.R. § 1910.1. 2000.
Offenberg, John H. and Joel E. Baker. 2000. ―PCBs and PAHs in southern Lake
Michigan in 1994 and 1995: Urban atmospheric influences and long-term declines.‖
Journal of Great Lakes Research, 26(2): 196-208.
Ontario College of Family Physicians (OCFP). 2005a The Health Impacts of Urban
Sprawl: Air Pollution. Ontario College of Family Physicians. Toronto, ON
Ontario College of Family Physicians (OCFP). 2005b. The Health Impacts of Urban
Sprawl: Obesity. Ontario College of Family Physicians. Toronto, ON

117
Ontario College of Family Physicians (OCFP). 2005c. The Health Impacts of Urban
Sprawl: Road Injuries & Fatalities. Ontario College of Family Physicians. Toronto, ON
Ontario College of Family Physicians (OCFP). 2005d. The Health Impacts of Urban
Sprawl: Ontario College of Family Physicians. Toronto, ON
Organization for Economic Cooperation and Development. Economic Survey of Canada,
2000. Available at <www.oecd.org>; Organization for Economic Cooperation and
Development.1995. Canada: Environmental Performance Review. Paris: OECD.
Pearson RT, Wachtel H, Ebi KL. 2000. ―Distance Weighted Traffic Density in Proximity
to a Home is a Risk Factor for Leukemia and other Childhood Cancers.‖ Journal of Air
and Waste Management Association 50:175-180.
Perera FP, Rauh V, Whyatt RM, Tsai W, Tang D, Diaz D, et al. 2006. Effect of prenatal
exposure to airborne polycyclic aromatic hydrocarbons on neurodevelopment in the first
3 years of life among inner-city children. Environ Health Perspect 114:1287-1292.
Perera FP, Tang D, Whyatt R, Lederman SA, Jedrychowski W. 2005. DNA damage from
polycyclic aromatic hydrocarbons measured by bezo[a]pyrene-DNA adducts in mothers
and newborns from Northern Manhattan, the World Trade Center Area, Poland, and
China. Cancer Epidemiol Biomark 14:709-714.
Perks, William T. 1994. Consumer Receptivity to Sustainable Community Design.
Ottawa: CMHC.
Pinkney, et al. 2004. ―Tumor prevalence and biomarkers of exposure and response in
brown bullhead from the Anacostia River, Washington, DC and Tuckahoe River,
Maryland, USA.‖ Environmental Toxicology and Chemistry 23(3): 638-647.
Poulton, M. 1995. ―Affordable homes at an affordable (social) price,‖ in G. Fallis, M.
Poulton, L. B. Smith, J. Seelig, M. Seelig and J. Sewell (eds.) Home remedies:
Rethinking Canadian housing policies. Toronto: CD Howe Institute.
Sanchez, T.W. and James F. Wolf. 2005. ―Environmental justice and transportation
equity: A review of Metropolitan Planning Organizations.‖ Presented at Racial equity in
transportation: Establishing priorities for research and policy, Harvard University,
January 13, 2005.
Schueler, T. 2004. An Integrated Framework to Restore Small Urban Watersheds:
Version 1.0 Manual 1. March 2004. Center for Watershed Protection. Ellicott City, MD
Schueler, Tom. 1995. Environmental Land Planning Series: Site Planning for Urban
Stream Protection. Centre for Watershed Protection.

118
Sewell, J. 2003. Breaking the Suburban Habit. Alternatives Journal (29 (3): 22-29.
Sheesley et al. 2004. ―Toxicity of ambient atmospheric particulate matter from the Lake
Michigan (USA) airshed to aquatic organisms.‖ Environmental Toxicology and
Chemistry, 23(1):133-140.
Shoup, D.W. 1999. ―The trouble with minimum parking requirements.‖ Transportation
Research Part A 33: 549-574.
Sierra Club. 2002. Smart Choices, Less Traffic: Sierra Club Takes A Critical Look At 49
Transportation Projects. Available at
<http://www.sierraclub.org/sprawl/report02/transportation_choices.asp#highway>.
Sierra Club. 2001. Clearing the air with transit spending: Sierra Club grades America’s
fifty largest cities. Available at: <http://www.sierraclub.org/sprawl/report01/>.
Simcik, et al. 2006. ―Urban contamination of the Chicago/coastal Lake Michigan
atmosphere by PCBs and PAHs during AEOLOS.‖ Environmental Science and
Technology 31: 2141-2147.
Simcik, et al. 2003. ―Enhanced removal of hydrophobic organic contaminants by settling
sediments in western Lake Superior.‖ Journal of Great Lakes Research, 29: 41-53.
Simcik, et al. 1999. ―Source apportionment and source/sink relationships of PAHs in the
coastal atmosphere of Chicago and Lake Michigan.‖ Atmospheric Environment 33: 5071-
5079.
Simcik, M.F., S.J. Eisenreich, K.A. Golden, S.-P. Liu, E. Lipiatou, D.L. Swackhamer,
and D.T. Long. 1996. ―Atmospheric Loadings of PAHs to Lake Michigan as recorded in
the sediments.‖ Environmental Science and Technology, 30: 3039 – 3046.
Slack, Enid. 2002. Municipal Finance and the Pattern of Urban Growth. Prepared for
the CD Howe Institute. Toronto, Ontario. Available at:
http://www.urbancenter.utoronot.ca/pdfs/elibrary/Slack_Mun-Finance-Urb-Growth.pdf.
Speir, Cameron and Kurt Stephenson. 2002. ―Does Sprawl Cost Us All? Isolating the
Effects of Housing Patterns on Public Water and Sewer Costs.‖ Journal of the American
Planning Association 68(1): 56-70.
Spurr Research Associates et al. 2001. Survey of Canadian Municipalities: Regulatory
Measures for Housing Affordability and Choice. Ottawa: CMHC.
State of the Lakes Ecosystem Conference, 1996. Available at:
http://www.on.ec.gc.ca/solec/solec96-e.html. Accessed on July 21, 2008.

119
Stanback, T.M. (1991) The New Suburbanization: Challenge to the Central City.
Boulder, CO: Westview Press.
Statistics Canada. 2005. Population projections for Canada, provinces and territories,
2005-2031. Ottawa: Statistics Canada.
Steuteville, R. 2001. Ed. New Urbanism: Comprehensive Report and Best Practices
Guide. Ithaca: New Urban Publications.
Sturm R, Cohen D. 2004. Suburban sprawl and physical and mental health. Public
Health. 118(7):488-496
Sun, et al. 2006. ―Trends in polycyclic aromatic hydrocarbon concentrations in the Great
Lakes atmosphere.‖ Environmental Science and Technology 40:6221-6227.
Surface Transportation Policy Project. Fact Sheet: Transportation and the Environment.
Available at
http://www.transact.org/library/factsheets/transportation%20and%20the%20environment.
doc
Tasker-Brown, J. 2000. Learning from Suburbia: Residential Street Pattern Design.
Ottawa: CMHC: 28.
Tomalty, R. 2001. The Effects of Development Charges on Urban Form. Ottawa: CMHC.
Tomalty, R. and D. Alexander. 2005. Smart Growth in Canada: Implementation of a
Planning Concept. Ottawa: CMHC.
Toronto Public Health. March 2006. The Impacts of Traffic on Health. City of Toronto.
http://www.toronto.ca/health/hphe/pdf/boh_mar06_impacts_of_traffic.pdf
Toronto Public Health. May 2005. Combined Impact of Extreme Heat and Air Pollution
on Premature Mortality. Submitted to Toronto Board of Health. Toronto: Canada.
http://www.toronto.ca/health/hphe/weather_air_pollution_research.htm
Toronto Public Health. July 2004. Air Pollution Burden of Illness in Toronto: 2004
Summary. City of Toronto. www.toronto/health/hphe/pubs.htm
Toronto Public Health. 2004. Agenda for Action on Air and Health. Toronto. Prepared by
Kim Perrotta, Monica Campbell, Angela Li-Muller, Ronald Macfarlane & Sarah
Gingrich.
Toronto (City of, Economic Development) (2000) Toronto Economic Strategy. Toronto:
City of Toronto.

120
Tremblay, Neil W. and Andrew P. Gilman. 1995. ―Human health, the Great Lakes, and
environmental pollution: A 1994 perspective.‖ Environmental Health Perspectives
103(Supp 9): 3-5.
US Bureau of the Census. 2007. State Interim Population Projections by Age and Sex:
2004 – 2030. Available at:
<http://www.census.gov/population/www/projections/projectionsagesex.html>.
US Department of the Interior, Bureau of Reclamation. 2003. DBP: Haloacetic Acid Fact
Sheet. Available at: http://www.usbr.gov/pmts/water/media/pdfs/DBP%20HAAs.pdf
United States Environmental Protection Agency and Environment Canada. 2007. State of
the Great Lakes 2007. Available at: <
http://binational.net/solec/English/sogl2007highlights_en.pdf>.
United States Environmental Protection Agency. 2006. Growing Toward More Efficient
Water Use: Linking Development, Infrastructure, and Drinking Water Policies.
Washington, DC: EPA. Available at: <www.epa.gov/smartgrowth>.
United States Environmental Protection Agency and Environment Canada. 2005. State of
the Great Lakes 2005: Land Cover/Land Conversion. Available at:
<http://binational.net/solec/English/SOLEC%202004/Tagged%20PDFs/SOGL%202005
%20Report/English%20Version/Individual%20Indicators/7002_Land_Cover-
Land_Conversion.pdf>.
United States Environmental Protection Agency 2003. ―Grand Calumet Area of
Concern,‖ Available at: <http://www.epa.gov/glnpo/aoc/grandcal.html>.
United States Environmental Protection Agency 2002. Functions and Values of
Wetlands. Available at: <http://www.epa.gov/owow/wetlands/facts/fun_val_pr.pdf>.
United States Environmental Protection Agency. 2001. National Coastal Condition
Report: 158.
United States Environmental Protection Agency. 2001. Our Built and Natural
Environments—A Technical Review of the Interactions Between Land Use,
Transportation and Environmental Quality.
United States Environmental Protection Agency. 2001. Report to Congress:
Implementation and Enforcement of the Combined Sewer Overflow Control Policy.
United States Environmental Protection Agency, Office of Air Quality Planning and
Standards. 2000. Latest findings on National Air Quality: 1999 Status and Trends.
Research Triangle Park, NC: EPA): 2.

121
United States Environmental Protection Agency. 2000. Progress in Water Quality: An
Evaluation of the National Investment in Municipal Wastewater Treatment.
United States Environmental Protection Agency. 2000. National Water Quality
Inventory: 2000 Report.
United States Environmental Protection Agency. IRIS: Integrated Risk Information
System for Alachlor. Available at: <http://www.epa.gov/iriswebp/iris/subst/0129.htm>.
United States Environmental Protection Agency. IRIS: Integrated Risk Information
System for Endothall. Available at: <http://www.epa.gov/iriswebp/iris/subst/0155.htm>.
United States Environmental Protection Agency. 1972. National Pollutant Discharge
Elimination System— Regulations For Revision of the Water Pollution Control Program
Addressing Storm Water Discharges, 40 C.F.R. pts. 9, 122, 123, and 124, Final Rule, 1.
Available at: http://cfpub.epa.gov/npdes/
United States Environmental Protection Agency. Construction Site Management Measure
- Iii. Construction Activities. Available at:
<http://www.epa.gov/OWOW/NPS/MMGI/Chapter4/ch4-3a.html>.
United States Environmental Protection Agency. 1998. National Water Quality
Inventory: 1998 Report to Congress. Washington, DC: EPA: 62, 88, 108.
University of Victoria Eco-Research Chair of Environmental Law and Policy. 2001.
Canada vs. the OECD: An Environmental Comparison. Victoria: University of Victoria.
Vandergrift D, Yoked T. 2004. Obesity rates, income and suburban sprawl: an analysis
of US states. Health and Place. 10:221-229
Vander Ploeg, Casey G. 2004. No Time to be Timid: Addressing Infrastructure Deficits
in the Western Big Six. Prepared for the Canada West Foundation. Calgary, Alberta.
Van Metre et al. 2000. ―Urban sprawl leaves its PAH signature.‖ Environmental Science
and Technology, 34: 4064-4070.
Van Metre, P.C. and B.J. Mahler. 2003. ―The contribution of particles washed from
rooftops to contaminant loading to urban streams.‖ Chemosphere 52: 1727-1741.
Visocky, A.P. 1997. ―Water-Level Trends and Pumpage in the Deep Bedrock Aquifers in
the Chicago Region, 1991B1995.‖ Illinois State Water Survey Circular 182.
Vogel, R.K. and Norman Nezelkewicz. 2002. ―Metropolitan Planning Organizations and
the new regionalism: The case of Louisville.‖ Publius: The Journal of Federalism 32(1):
107-129.

122
Water Pollution Control Federation. 1984. Financing and Charges for Wastewater
Systems. p. 44.
Wells, Barbara. 2002. Smart growth at the frontier: Strategies and resources for rural
communities. Prepared for the Northeast/Midwest Institute, Washington, DC.
West Coast Environmental Law (WCEL). 2002. Cutting Green Tape: An Action Plan for
Removing Regulatory Barriers to Green Innovations. Victoria, BC: WCEL.
Whillans, T.H. 1982. "Changes in marsh area along the Canadian shore of Lake Ontario."
Journal of Great Lakes Research 8, 570-577.
Windsor, D. 1979. Fiscal Zoning in Suburban Communities. Lexington, MA: Lexington
Books.
Winfield, Mark S. 2007. The 2007 Ontario Budget. Pembina Analysis. Toronto Pembina
Institute.
Winfield, M. 2006. Building Sustainable Urban Communities in Ontario: A Provincial
Progress Report. Toronto: Pembina Institute.
Winfield, Mark. 2005. Building Sustainable Urban Communities in Ontario: A
Provincial Progress Report. Prepared for the Pembina Institute, Toronto, ON.
Winfield, Mark S. 2003. Ontario Environment Handbook. Toronto Pembina Institute.
Will County (IL). 2002. ―Will County land resource management plan‖. Available at:
<http://www.willcountylanduse.com/LRMP/index.html>.
Wolf, J.F. and Mary Beth Farquhar. 2005. ―Assessing progress: The state of Metropolitan
Planning Organizations under ISTEA and TEA-21.‖ International Journal of Public
Administration 28: 1057-1079.
World Health Organization. 2000. Transport, Environment and Health. Eds. Dora c,
Phillips M. WHO Regional Publications, European Series, No. 89.
Zedler et al. 2001. "Compensating For Wetland Losses Under The Clean Water Act."
National Academy Of Science, 28.
Zhang, H.X., S.J. Eisenreich, T.R. Franz, J.E. Baker, and J.H. Offenberg. 1999.―Evidence
for increased gaseous PCB fluxes to Lake Michigan from Chicago.‖ Environmental
Science and Technology, 33: 2129 – 2137.