the impact of trade liberalization on export performance
TRANSCRIPT

The Impact of Trade Liberalization on Export Performance:
Evidence from OECD Countries
By
Yuliya Vassilyeva
Submitted to
Central European University
Department of Economics
In partial fulfillment of the requirements for the degree of
Master of Arts in Economic Policy in Global Markets
Supervisor: Professor Ugo Pagano
Budapest, Hungary
2017
CE
UeT
DC
olle
ctio
n

i
Abstract
This paper employs panel data methodologies to examine the impact of trade liberalization and
trade openness on export performance for a sample of 28 both developed and developing OECD
economies from 1980 to 2015. The study is based on the export supply side approach derived
from Heckscher-Ohlin-Samuelson model of international trade. The research applies both static
and dynamic panel data models based on fixed effects and generalized methods of moments by
Arellano and Bond estimators. The main findings are that trade liberalization is a significant
determinant of export performance, though the impact is relatively small.
CE
UeT
DC
olle
ctio
n

ii
Table of Contents
Introduction ..................................................................................................................................... 1
Chapter 1 – Theoretical Framework ................................................................................................ 3
Chapter 2 – Literature Review......................................................................................................... 7
2.1 Panel Data Studies with Significant Positive Relationship ....................................................... 7
2.2 Time Series Studies with Significant Positive Relationship ...................................................... 9
2.3 Mixed Data Studies with Little or No Evidence of the Relationship ....................................... 11
Chapter 3 – Data and Methodology ............................................................................................... 12
3.1 Sample ..................................................................................................................................... 12
3.2 Hypotheses ............................................................................................................................... 12
3.3 Models ..................................................................................................................................... 16
Chapter 4 – Estimation Methods and Results ................................................................................ 17
4.1 Static Panel .............................................................................................................................. 17
4.1.1 Specification ......................................................................................................................... 17
4.1.2 Results .................................................................................................................................. 17
4.2 Dynamic Panel ........................................................................................................................ 19
4.2.1 Specification ......................................................................................................................... 19
4.2.2 Results .................................................................................................................................. 20
Conclusion ..................................................................................................................................... 22
Appendix I ..................................................................................................................................... 23
Appendix II .................................................................................................................................... 27
References ..................................................................................................................................... 28
CE
UeT
DC
olle
ctio
n

1
Introduction
One of the most significant events in the international trade was the Uruguay Round in 1986-
1994 when 123 countries took part in the creation of the World Trade Organization (WTO) for
monitoring and enforcing international trade commitments and the overall reduction in average
tariffs by one-third. The WTO ensured a constant drive towards the implementation of liberal
trade policies from the 1940s onwards. Given those policies were aimed at improving countries’
trade performance, it is worth to analyze whether they indeed yielded some positive results.
The organizations like World Bank, International Monetary Fund (IMF), and the Organization
for Economic Cooperation and Development (OECD) always advocate liberal trade as positive
for trade performance and, as a consequence, growth. A report by the OECD (1998) states:
“More open and outward-oriented economies consistently outperform countries with restrictive
trade and investment regimes.” The IMF (1997) claims: “Policies toward foreign trade are
among the more important factors promoting economic growth and convergence in developing
countries.” In spite of widespread acceptance of a positive relationship between trade policies
and trade performance, the empirical researches that support this relationship are criticized on
some issues. For example, the absence of a consistent theoretical framework, as well as some
matters related to the methodology, sample bias, and set of variables.
This study investigates the effect that trade liberalization might have on the export performance
using a supply side approach that arises from the comparative advantage theory and the
Heckscher-Ohlin-Samuelson model. According to the model, liberal trade policies and the high
levels of trade are expected to encourage the reallocation of resources, which would then
improve the competitiveness and output of domestic industries. This theoretical approach will
address a critical issue of the studies with models including both supply and demand sides’
variables to test general mechanisms without any relevance to any particular theoretical
framework. Five hypotheses represent the expected relationships.
CE
UeT
DC
olle
ctio
n
2
The research contributes to the literature by employing a sample of 28 countries from the OECD
over the period 1980-2015, which consists of both developing and developed countries. It will
help to draw a conclusion on whether trade liberalization has a consistent impact on export
performance across different countries.
Rodriguez and Rodrik (2001) stated that the majority of traditional trade policy indices used in
most of the studies appeared to be ineffective. As such, this study uses applied, weighted mean
tariff barriers to proxy country’s tariff policy. Also, this study tries to capture country’s openness
to trade by a separate Freedom to Trade Internationally indicator. It is a component of the
Economic Freedom of the World index, which accounts for black market premium and
regulatory trade barriers (Gwartney et al., 2016). Capturing two important aspects, trade policy
and trade openness allow another contribution to the literature as so far the studies either focused
on only one element or treated the two interchangeably (Subasat, 2008).
The final contribution is that the study looks at static as well as transitional effects of trade
policies by estimating dynamic panel data model based on the generalized method of moments
(GMM), given that implemented liberal policies might affect domestic competitiveness and
exports only in the long-run.
The thesis is organized as follows: Chapter 1 starts with a theoretical analysis of trade
liberalization-export performance relationship. Chapter 2 offers a review of literature available in
the field, which is classified according to the findings. Next, Chapter 3 discusses the sample of
the countries used for analysis, draws expected relationships between variables analyzed and
presents the equations used for regressions. Further, Chapter 4 argues for the estimation
techniques used and provides the discussion of the obtained results. The following section
concludes the thesis.
CE
UeT
DC
olle
ctio
n
3
Chapter 1 – Theoretical Framework
One of the main criticisms surrounding the empirical studies is the lack of a consistent
theoretical approach linking trade policies with export performance. This chapter will focus on
reviewing some of the theoretical arguments that can be used to predict and explain the
relationship between liberal trade policies and export performance.
One of the central issues among economists and policy makers in the global arena is
liberalization and its impact on trade, particularly exports. Countries around the world started to
focus on exports performance right after it became an important determinant of the economic
growth. Since the 1980s, it has served as the initial step for countries to shift from adopting
import substitution trade strategy to export promotion strategy. This change has caused world
wave of liberalization reforms built on the expectation of higher employment and total output
through mobilizing all available domestic resources.
Some scholars believe that a country reduces its tariff and non-tariff barriers due to participating
in international trade. As a result of policies liberalization, the performance of business
communities improves, and a country's economy grows. However, there is no obvious or
established theoretical link between decreasing trade barriers and export performance with the
findings in the literature being diverse and appearing to depend on the authors' interpretation of a
set of core economic arguments. For example, some authors have stressed the beneficial
characteristics of trade liberalization using arguments of resource reallocation (Bhagwati, 2004,
Krueger, 1998, Papageorgiou et al. 1991). Others, such as Chang (2005) and Lall (2003) have
stressed the infant industry argument when liberal trade policies repress beneficial structural
change and therefore have a negative long-term effect on export and, as a consequence, growth.
According to those for trade liberalization, trade triggers economic growth via export growth of
the comparative advantages products that improves the overall financial performance. There is
evidence that open developing economies grew faster than closed economies, open developed
economies also grew faster than closed developed economies, and the rapid growth is found in
CE
UeT
DC
olle
ctio
n

4
developing economies (Paudel 2014). The supportive argument on liberalization says that
disciplined liberal economic policy contributes to the improvement of export performance by
creating a more competitive domestic environment, increasing saving and attracting foreign
capital to improve the export performance.
The supportive argument mentioned above can be derived with the help of Heckscher-Ohlin-
Samuelson (H-O-S) model of international trade. Originally developed by Eli Heckscher and
Bertil Ohlin in the 1920s with some significant contributions by Paul Samuelson, the H-O-S
model expands on the Ricardian model of comparative advantage. Specifically, H-O-S model
introduces the second factor of production, capital, which is assumed to be homogenous in a two
country-two product world. The model assumes immobility between countries for both factors of
production since the model rests on the assumption of variable factor proportions between
countries, which if mobile could converge. The model also assumes constant returns to scale to
homogeneous factors of production and unchanged identical technology. This assumption
implies that if both capital and labor inputs doubled then the output would also double. In
addition to this, the model assumes perfect competition and free markets with no barriers to trade
and no transportation costs allowing the exchange of goods for others. The model also assumes
that all identical goods would have one price in all the countries due to an efficient market in
which there are no other costs such as transportation costs. Furthermore, the model assumes a
state of perfect competition in which neither labor nor capital can affect prices. The more
developed country is expected to have a higher ratio of capital to labor compared to the
developing and less developed countries. Consequently, the factor proportions, which determine
the comparative advantage of each country, are allocated to the industries that would intensively
use them.
The main implication of the model is that it attempts to predict the pattern of trade between
countries based on relative factor proportions. Since the model assumes free markets and no
barriers to trade, it already assumes that the states would have allocated resources to the most
CE
UeT
DC
olle
ctio
n

5
efficient industries, which intensively use the abundant factor. However, in reality, moving from
a position of where trade has been controlled and influenced adversely by trade barriers such as
tariffs and non-tariff barriers, to an increasingly liberalized economic environment allows
efficiency improvements and reallocation of resources which will enable all the countries to
reach the production possibility frontier (PPF).
Following the laws of comparative advantage, countries will benefit from trade by exporting
goods which they have produced using the abundant factors which have given those industries a
comparative advantage in exchange for the goods which have been made from scarce factors of
production. As a result, the introduction of foreign competitors into the market is expected to
encourage reallocation and efficiency of domestic industries and drive uncompetitive firms out
of the market. Though the assumptions are not entirely realistic, it does allow some predictions
to be made as to the patterns of trade that can be expected to arise out of factor proportions.
According to the model, every country exhibits benefits of international trade when it focuses on
exporting resources that are abundant. It becomes even more beneficial, if each country imports
the resources it does not have. A country can enjoy the more elastic demand as it will not be
selling just internally.
The criticism against international trade theory arises from the validity of some of the
assumptions made by the proponents of the theory. For example, immobility of two factors of
production is not possible given the liberalization of capital controls allowing increased capital
flows across countries. Also, the formation of single markets such as the European Union leads
to the complete elimination of labor controls allowing the full mobility of labor across countries.
This substantially reduces the differences in the factor abundances between countries. Further, it
is not evident that all productive resources have same quality within and across the trading
countries. For example, the technology of production is not always similar, so that the realized
benefits from trade may be different compared to the expected benefits.
CE
UeT
DC
olle
ctio
n

6
To sum up, according to the H-O-S model, trade is driven by differences in the resource
allocation across countries. These differences determine the comparative advantage of a country.
Trade in this model then serves to encourage states to reallocate resources and specialize in the
production of goods that intensively use the abundant factor of production. These goods are then
exported, while the products that use the scarcer factor of production are imported. As a result,
according to the model, differences in factor proportions or factor abundances between countries
form a sound basis for trade, export, and import. Besides liberalization and policy reforms, there
are various additional aspects to determine the export performance. Those can be classified as
supply-side and demand-side factors. The most crucial supply side determinants include
domestic resources, labor costs, and foreign market accessibility, while international market
situation plays a vital role from the demand side. However, the biggest concern arises in regards
to whether the liberalization is one of major determinant of export performance and how
liberalization impacts export performance. So, using the theoretical arguments and conclusions
made in this chapter, this thesis attempts to investigate the relationships between liberal trade
policies and export performance empirically.
CE
UeT
DC
olle
ctio
n

7
Chapter 2 – Literature Review
2.1 Panel Data Studies with Significant Positive Relationship
A significant liberalization which has been undertaken by countries brings up interest in
exploring its consequences. Can a change in trade policy in the form of liberalization be
expected to lead to a change in exports? Early studies in the 1980s and 1990s had mostly
consisted of cross-country studies, which had focused on exports as a proportion of GDP as an
indicator of openness, had found convincing evidence of a positive linkage of international trade
with export growth. For instance, the cross-country studies of Harrigan and Mosley (1991) and
Papageorgiou et al. (1991) all offer some support for the view that liberalization and exports are
related.
However, several aspects of some of these studies and in particular, their general methodological
frameworks were questioned by some authors such as Nye et al. (2002), Srinivasan and
Bhagwati (1999) and Rodriguez and Rodrik (2001). A central argument that is common from
these criticisms is that the cross country methodology is unsuitable for capturing the relationship
between trade policy and economic growth. The criticisms in particular points at the inability of
the technique to take into account important country-specific characteristics which presumably
could have a significant role in determining the relationship between trade policy and export
growth.
More recently, there has been a shift in emphasis towards panel data and time series studies on
the relationship between trade policy and export performance within specific countries or groups
of countries. However, the results have not appeared to be confident of the relationship between
trade liberalization and trade performance as the cross-country studies.
Kassim (2013) concludes that trade liberalization increases the growth of exports by 3.32
percentage points (FE) and by 2.67 percentage points in the short run and 3.22 percentage points
in the long term (GMM) in 28 Sub-Sharan African countries from 1981 to 2010. Kassim (2013)
measures free trade by the liberalization dummy, one from the year trade reforms began and 0
CE
UeT
DC
olle
ctio
n

8
before that year, and interaction between the rate of change of the terms of trade and trade
liberalization dummy. By these, the author captures a potential positive effect of free trade on the
income and price elasticity of demand for exports. Also, there is empirical evidence that imports
grow faster by approximately two percentage points resulting in a negative trade balance in the
region after trade liberalization. Moreover, the author states that trade liberalization significantly
raises the price elasticity of demand for exports.
Santos-Paulino (2002) and Santos-Paulino and Thirlwall (2004) analyzed panel data for the
1972-1997 period by employing Fixed Effects (FE) and Generalized Methods of Moments
(GMM). They find a significant positive relationship between trade liberalization and export
performance for a sample of 22 developing countries in which trade policies were liberalized in
the mid-1970s. Santos-Paulino (2002) and Santos-Paulino and Thirlwall (2004) claim that trade
liberalization raises export growth, on average, by 0.85-1.91 percentage points applying FE and
1.56-1.94 percentage points using GMM. Also, the results show that one percentage point
decrease in export duties leads to 0.05-0.19 percentage points increase in export growth. Santos-
Paulino (2002) also shows that exports react negatively to an increase in relative prices, and
positively to world income growth. Furthermore, export duties as a measure of trade distortions
have a significant, but small, negative effect on export growth. Both Santos-Paulino (2002) and
Santos-Paulino and Thirlwall (2004) measure trade liberalization by the reduction in export
duties, dummy for the year of significant trade liberalization and two slope dummy variables to
capture the effect of free trade on price and income elasticities.
Seker (2011) uses the trade tariff restrictiveness index and trade tariff restrictiveness index to
evaluate the impact of trade restrictions on export performance. The author finds that restrictions
on foreign market access and domestic tariff policies have an adverse impact on export
performance in a sample of 137 countries during 2005-2007 applying pooled Ordinary Least
Squares (OLS) as a primary method and feasible generalized least squares (FGLS) method later
in the analysis. At the same time, the author lists other several reasons like regulatory quality,
CE
Ue
TD
Co
llect
ion
9
customs efficiency, quality of infrastructure, and access to finance that possibly prevent
convergence of countries in export performance even with no trade barriers.
Cestepe et al. (2014) find that trade liberalization through free trade agreements has a positive
impact on the export of 13 the Middle East and North Africa (MENA) countries to 30 OECD
trading partners. This study employed panel gravity model and analyzed the data for the 2000-
2009 period.
Damijan et al. (2006) find that while bilateral tariffs are decreasing, exports are increasing in 7
manufactured industries (food, textile, wood and paper, chemical, construction, basic metal and
metal products) across 6 Balkan countries (Bosnia-Herzegovina, Bulgaria, Croatia, Macedonia,
Romania and Slovenia) in the period of 1996-2000. Conducting OLS regression, the authors
state that 1 point lower bilateral tariffs lead to export increase from 2.2% to 8.6% in the sectors.
To measure trade liberalization, Damijan et al. (2006) use bilateral sector-level tariff barriers on
exports and frequency index of bilateral nontariff barriers on exports from one country to
another.
Dollar (1992) claims that outward orientation of an economy results in a more rapid growth of
export in 95 developing countries during 1976-1985 using pooled OLS method. Due to the
potential externalities associated with exporting, open economies tend to grow faster over long
periods of time. The author measures the outward orientation of the economy based on the
international comparisons of price levels for 121 countries taken from Summers and Heston
dataset who price the same basket of consumption goods in domestic currency in different
countries and then convert the measure into US dollars using the official exchange rate.
2.2 Time Series Studies with Significant Positive Relationship
Ahmed (2000) concludes that liberalization policy has significant positive effect on export
expansion conducting co-integration and error correction (ECM) analysis of merchandise export
in Bangladesh in 1974-1995. The author states that relative export price (lagged two-quarter),
real effective exchange rate, predicted values of real GDP (lagged one-quarter) and a dummy
CE
UeT
DC
olle
ctio
n

10
variable capturing the effects of trade liberalization program are important determinants of an
aggregate export in Bangladesh.
After employing on autoregressive distributed lag (ARDL) and ECM, Pacheco-López (2005)
arrives at the conclusion that trade liberalization happened in the mid-1980s in Mexico has a
significant positive effect on export and import, where the latter responds earlier to the trade
policies. Later in the paper, the author claims that Mexican import grows faster than its export,
which in turn puts an adverse effect on Mexican balance of trade.
Santos-Paulino (2006) proves that the process of liberalization has positively affected export and
import growth in the Dominican Republic during 1960-200 applying a co-integration test and
ECM. The trade account shows a one percentage point positive reaction to trade liberalization,
meaning that trade liberalization drives higher export growth than to import growth. The author
uses the identification of the year(s) of liberalization as a measure of trade openness.
Paudel (2014) claims that trade liberalization reforms have a positive impact on India’s
manufacturing export performance, while relationship does not hold for merchandised export
performance. The author estimates an export demand-supply model, applying ARDL approach to
cointegration for the annual data of 1975-2008. Along with this result, Paudel (2014) does not
find a significant negative relationship between trade protection and export performance.
Zakaria (2014) analyses quarterly time series data for Pakistan for the period 1981/1982-
2007/2008 and finds that trade liberalization stimulates both exports and imports. However,
similar to other researchers, Zakaria (2014) indicates that imports grow at a faster rate than
exports driving the balance of payments down. The author follows the approach used by Sachs
and Warner (1995) and Wacziarg and Welch (2003) and measures liberalization by a dummy
variable that takes the value of 1 for the period of liberalization and after that and 0 otherwise.
CE
UeT
DC
olle
ctio
n
11
2.3 Mixed Data Studies with Little or No Evidence of the Relationship
Greenaway and Sapsford (1994) look at the relationship between exports and growth, as well as
the way liberalization influence this relationship through exports. Using production function
approach and Feder-Falvey-Gemmell test specification, almost no support for a positive impact
of liberalization on exports/growth relationship in Papageorgiou et al. (1991) sample of 12
counties is found. In 8 out of the 12 cases there is no impact, in 3 cases (Turkey, Columbia, and
Spain) there is a significant positive relationship, and in 1 case (New Zealand) a significant
adverse change is present.
Clarke and Kirkpatrick (1992) and Agosin (1991) find almost no evidence of a positive
relationship between free trade and export growth in developing countries.
Shafaeddin (1994) finds no clear evidence of the association between trade liberalization and
exports in the least developed African countries. The main reason behind the failure is the design
of trade policy reforms.
Jenkins (1996) concludes that Bolivian export performance increased mainly due to the more
stable real exchange rate after 1985 rather than trade liberalization policies. There is no evidence
that the Bolivian trade reforms have led to improved productivity performance.
Ratnaike (2012) states that internal tariff barriers and trade openness do not show any significant
influence on export performance in selected OECD countries over 1980-2010 period.
Subasat (2008) in a panel data study of 120 countries over six years, developed a framework to
study the impact that trade liberalization has on total trade flows to find that there was, in fact, a
little correlation between the two variables. However, his model was based on general
mechanisms with both supply and demand side elements, which could confuse the underlying
relationship being investigated. Additionally, Subasat (2008) employed total trade performance
consisting of both exports and imports, which would not distinguish whether the weight of the
impact of trade policies was on exports or import performance.
CE
UeT
DC
olle
ctio
n

12
Chapter 3 – Data and Methodology
3.1 Sample
The analyzed sample consists of 28 developed and developing OECD countries. It includes
Australia, Austria, Belgium, Canada, Chile, Denmark, Finland, France, Germany, Greece,
Iceland, Ireland, Israel, Italy, Japan, South Korea, Luxembourg, Mexico, Netherlands, New
Zealand, Norway, Portugal, Spain, Sweden, Switzerland, Turkey, United Kingdom, and United
States. The sample excludes six post-soviet countries (Czech Republic, Estonia, Hungary,
Latvia, Slovak Republic and Slovakia) mainly due to the data unavailability. The study
incorporates the sample period of 35 years from 1980 to 2015. The period of 35 years allows
capturing long run relationships between trade liberalization and trade performance. The OECD
countries selection is justified by a crucial role they play in world trade accounting for more than
40% of the total global trade since 1984 (OECD, 2016). Also, OECD countries have consistently
available data set for all of the variables analyzed in this study. Also, the analysis of OECD
countries will add to the literature, which predominantly focuses on developing and less
developed countries.
3.2 Hypotheses
According to the theoretical framework, trade liberalization encourages economic growth in
countries through the supply side variables. In particular, liberal trade policies tend to increase
exports and imports performance. If a full employment of resources is assumed, higher trade
flow is expected to encourage domestic firms to focus on those activities in which it has a
comparative advantage. Switching to more advantageous activities will later result in the
reallocation of resources and increase in productivity implying that the use of resources in
relatively unproductive sectors will decrease. The final set of variables includes export
performance indicator, a measure of the domestic trade openness, national trade liberalization,
the total output of the local and global economies and the real effective exchange rate. All the
CE
UeT
DC
olle
ctio
n

13
variables are transferred to logarithms due to the skewed distribution of the values as well as the
opportunity for a clear interpretation of the obtained results.
Export Performance
The dependent variable is the export of goods and services as a share of a country's gross
domestic product (GDP). According to the resource reallocation theory introduced by the H-O
model, export is the most relevant component of total trade performance that is expected to be
affected by trade liberalization policies. The data is obtained from the OECD Main Indicators
database along with World Development Indicators database of the World Bank.
Domestic Trade Openness
As stated by the H-O-S international trade model, decreased trade protection within local market
encourages reallocation of resources from unproductive import substituting activities to more
productive export promoting activities in which country has a comparative advantage. The
increased competitiveness of local companies allows deeper penetration into foreign markets,
resulting in higher exports values. In this study, the domestic trade policy is measured by the
Freedom to Trade Internationally index component of the World Economic Freedom Index
obtained from Gwartney et al. (2016). Freedom to Trade Internationally index captures country's
general openness to trade by accounting for the aspects listed in Table 1. The index component is
based on a score from 0 to 10 to reflect country's general openness to trade taking into the
account five categories each of which represent a different form of a barrier to trade. To note,
this index takes into account the impact of non-tariff barriers, which other indicators do not
necessarily consider. For instance, Sachs and Warner’s index does not incorporate this aspect of
trade (Sachs & Warner, 1995). Also, the index accounts for international capital market controls
which can have an indirect impact on the international trade in the economy as opposed to once
popular Leamer’s Openness index (Gwartney et al., 2016).
The graphs in Appendix I support a positive relationship between export performance and
Freedom to Trade Internationally index. There was a gradual move towards a positive correlation
CE
UeT
DC
olle
ctio
n

14
between the two variables for the majority of the sample countries in 1980, 1985, 1990, 1995,
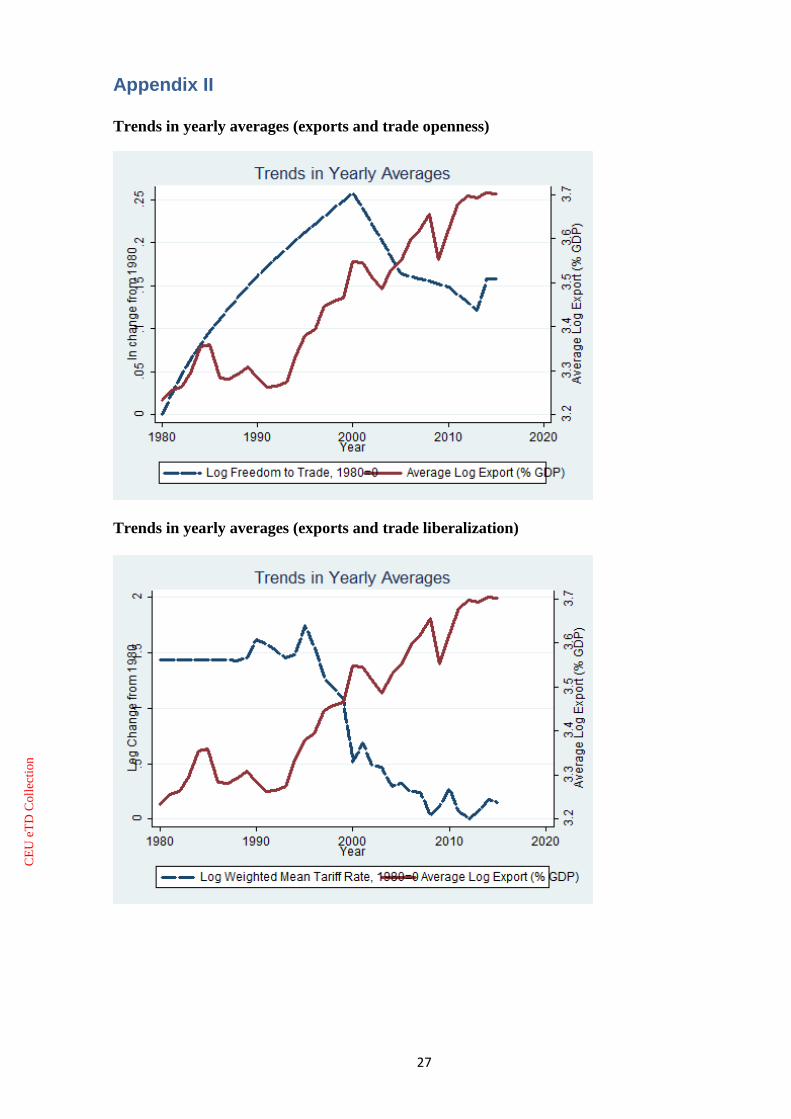
2000, 2005, 2010 and 2015. Also, the graph in Appendix II shows somewhat a positive
correlation between the yearly averages of exports and Freedom to Trade Internationally index.
H1: Domestic trade openness has a positive impact on the export performance of a country.
Table 1. Freedom to Trade Internationally Component
Domestic Trade Liberalization
This study uses internal tariff barriers to proxy domestic trade liberalization in response to
Rodriguez and Rodrik (2001) criticism of traditional trade policy indices employed in similar
researches. In turn, tariff barriers are measured by the applied, weighted mean tariff rates.
Weighted mean applied tariff rates are the average of effectively applied rates weighted by the
product import shares corresponding to each partner country (World Bank 2017). Based on the
theory involved in this study, reduced internal tariff barriers are going to stimulate domestic
productivity and competitiveness of local producers leading to potential exports increase. The
data is taken from the World Bank's World Development Indicators database.
The graph in Appendix II supports an expected negative sign between exports and mean tariff
rates. It represents sample wide trends of exports and applied tariff rates for balanced panel. The
numbers are normalized by subtracting 1980 values. There is negative and approximately linear
trend in yearly averages.
CE
UeT
DC
olle
ctio
n

15
H2: Lower internal trade barriers have a positive effect on the export performance of a
country.
Total Output for the Domestic Economy
The GDP variable serves as a control variable to capture the productivity of an economy.
Increased productivity is stemming from the more competitive local companies after successful
resource reallocation results in higher amounts of goods and services exported. The data is
obtained from OECD Main Indicators and World Bank Development Indicators databases and
measured in constant 2010 US dollars.
H3: Total output for the domestic economy has a positive effect on the export performance of
a country.
Total Output for the World Economy
Following the same logic, the world GDP attempts to control for the whole firm competitiveness
trend around the world. The data is taken from World Bank Development Indicators and OECD
Main Indicators databases and measured in constant 2010 US dollars.
H4: Total world output has a positive impact on the export performance of a country.
Real Effective Exchange Rate
The real effective exchange rate (REER) is a control variable that depicts the units of domestic
currency necessary to return for a single unit of the foreign money. It indicates the
competitiveness of local goods compared to the international ones. REER with a positive sign,
depreciating otherwise, represents an increase in the price competitiveness of the local industries
compared to foreign firms. REER is obtained from World Bank Development Indicators
database and measured as an index with the year 2000 at 100.
H5: Depreciating REER has a positive influence on the export performance of a country.
CE
UeT
DC
olle
ctio
n
16
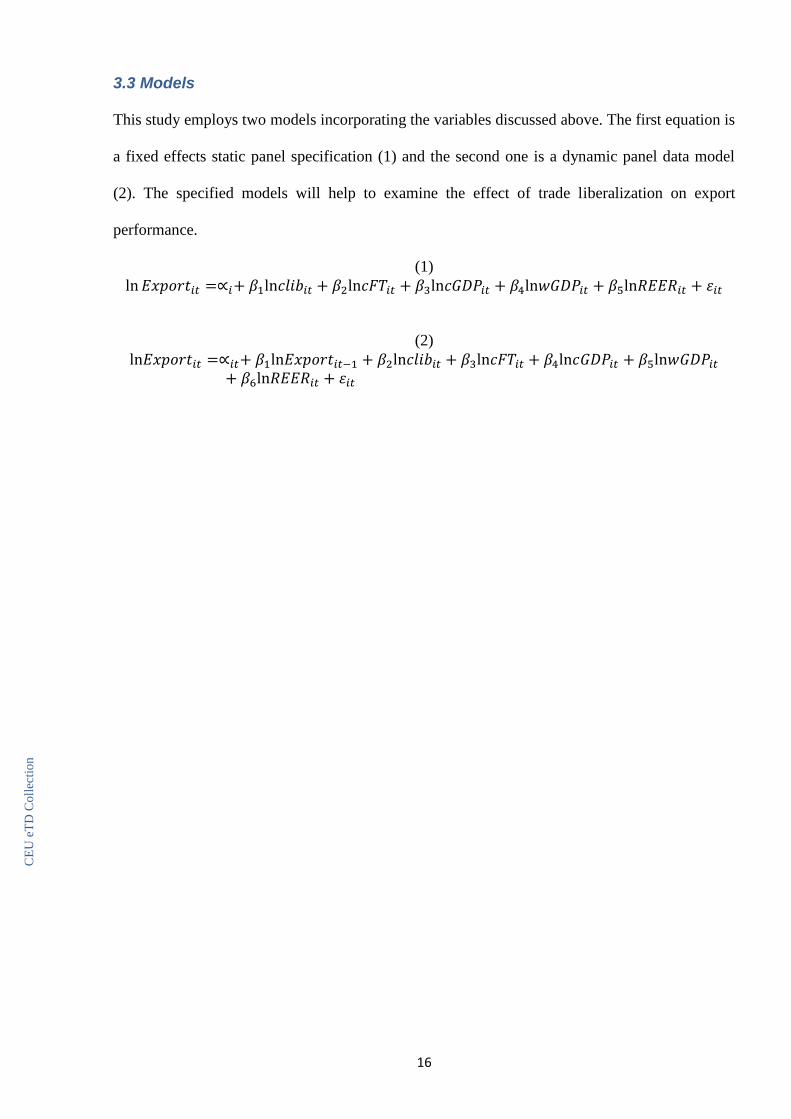
3.3 Models
This study employs two models incorporating the variables discussed above. The first equation is
a fixed effects static panel specification (1) and the second one is a dynamic panel data model
(2). The specified models will help to examine the effect of trade liberalization on export
performance.
(1)
ln 𝐸𝑥𝑝𝑜𝑟𝑡𝑖𝑡 =∝𝑖+ 𝛽1ln𝑐𝑙𝑖𝑏𝑖𝑡 + 𝛽2ln𝑐𝐹𝑇𝑖𝑡 + 𝛽3ln𝑐𝐺𝐷𝑃𝑖𝑡 + 𝛽4ln𝑤𝐺𝐷𝑃𝑖𝑡 + 𝛽5ln𝑅𝐸𝐸𝑅𝑖𝑡 + 𝜀𝑖𝑡
(2)
ln𝐸𝑥𝑝𝑜𝑟𝑡𝑖𝑡 =∝𝑖𝑡+ 𝛽1ln𝐸𝑥𝑝𝑜𝑟𝑡𝑖𝑡−1 + 𝛽2ln𝑐𝑙𝑖𝑏𝑖𝑡 + 𝛽3ln𝑐𝐹𝑇𝑖𝑡 + 𝛽4ln𝑐𝐺𝐷𝑃𝑖𝑡 + 𝛽5ln𝑤𝐺𝐷𝑃𝑖𝑡+ 𝛽6ln𝑅𝐸𝐸𝑅𝑖𝑡 + 𝜀𝑖𝑡
CE
UeT
DC
olle
ctio
n

17
Chapter 4 – Estimation Methods and Results
4.1 Static Panel
4.1.1 Specification
Fixed and random effects estimator are applied to equation (1) stated above. The fixed effects
(FE) or within estimator assumes a correlation between the time-invariant component of the error
term and the regressors. In turn, it implies some form of endogeneity. This endogeneity bias is
solved by mean-differencing the model. Since all observations of the mean difference of a time-
invariant variable are zero, the FE cannot estimate the coefficient on a time-invariant variable.
The random effects (RE), on the other hand, assume that error term is independent and
identically distributed (i.i.d.). It uses a feasible generalized least squares method to estimate the
coefficients of variables including those that are time-invariant. If FE is the appropriate
estimator, the estimated coefficients of RE are inconsistent. Therefore, a Hausman test is used to
decide the appropriate estimator for the model between FE and RE.
4.1.2 Results
Table 2. FE and RE results
FE RE
Log cFT 0.34 0.36 (S.E) (0.16)* (0.16)* Log clib -0.03 -0.03 (S.E) (0.01)* (0.01)* Log cGDP -0.05 -0.11 (S.E) (0.13) (0.08) Log wGDP 0.22 0.24 (S.E) (0.05)** (0.04)** Log REER -0.51 -0.51 (S.E) (0.12)** (0.13)**
Constant (S.E)
Country FE
Year FE
SE estimation
-0.25 (2.74)
YES
YES
Cluster
0.52 (2.39)
YES
YES
Cluster R2 0.46 0.47
Observations
Countries
Hausman (p-value)
1,008
28
0.0009
1,008
28
* p<0.05; ** p<0.01
CE
UeT
DC
olle
ctio
n
18
All the obtained results from FE and RE estimations are presented in Table 2. We concentrate on
the FE results as the Hausman test shows that there is no systematic difference between FE and
RE coefficients. Compare two countries that are the same in everything that does change in time
but are different in weighted mean tariffs. In a country where weighted mean tariffs are 1%
higher, export performance tends to decrease by 0.03%, significant at 5% significance level.
Although the magnitude of the coefficient is small, this finding supports the H2 hypothesis stated
earlier. Next, the results confirm the H1 and prove the importance of the domestic market trade
openness leading to 0.34% increase in exports. Further, it is surprising that total domestic output
has a negative, although statistically insignificant, relationship with export performance. It is
most likely that local producers divert resources to satisfy a rising domestic demand rather than
meeting the one coming from the foreign markets. In contrast, 1% higher world total output leads
to 0.22% higher exports of goods and services confirming H4. At last, REER coefficient is
statistically significant at 1% level, and draws an interesting relationship: export performance is
expected to be 0.51% lower given that REER increases by 1%. Probably, this reflects a change in
perceptions in the type of goods typically exported by these countries following decreasing
prices. However, it should be noted that any variations in the prices of the products would need
time to be transmitted to the buyers in foreign countries and may not be particularly significant
in the short run or accurate in reflecting the effects of changes in price on the competitiveness of
exports.
CE
UeT
DC
olle
ctio
n

19
4.2 Dynamic Panel
4.2.1 Specification
The dynamic panel-data model (DPM) has several problems that should be addressed to get the
most efficient estimates. First, the model includes lags of the dependent variable that correlate
with panel-level fixed and random effects leading to unobserved heterogeneity as well as
heteroskedasticity. Second, there is a chance of having endogenous independent variables, such
as the assumption of strict exogeneity of the right-hand variables might weaken. Besides,
dynamic panel-data model might lead to autocorrelation within individual units' errors.
However, Arellano and Bond (1991) derived a consistent generalized method of moments
(GMM) estimator that can tackle the problems described above. This approach takes potential
orthogonality conditions into account based on the assumption that the necessary instruments are
internal and based on lagged values of the instrumented variables. The Arellano-Bond GMM
approach deals with inherent endogeneity by first difference transformation of the data to remove
the fixed effects.
Arellano and Bond (1991) recommend against using the two-step nonrobust results for inference
on the coefficients because the standard errors tend to be biased downward. In the analysis, we
use the Windmeijer bias-corrected (WC) robust variance estimators.
Based on the diagnostic statistics, linear DPM Arellano-Bond GMM assumptions are satisfied.
After conducting two-step Arellano-Bond GMM, the Sargan test of overidentifying restrictions
is applied. It shows that instruments used for the model are accurate. We fail to reject the null
hypothesis "instruments are valid" given that Sargan statistics of 0.3672 is higher that the p-value
of 0.05.
Also, Arellano-Bond GMM estimator requires no autocorrelation in the idiosyncratic errors.
When the idiosyncratic errors are independently and identically distributed (i.i.d.), the first
differenced errors are serially correlated at order one (Arellano & Bond, 1991). So, as expected,
we reject the null hypothesis of no first-order serial correlation at order one with its statistics
CE
UeT
DC
olle
ctio
n
20
(0.0001) being less than the p-value of 0.05. In turn, the output above presents no significant
evidence of serial correlation in the first-differenced errors at the second order.
Given that the reported Wald statistics of 0.0000 is less than the criterion of 0.05, it allows us to
reject the null hypothesis that all coefficients are simultaneously equal to zero due to the absence
of constant in the model. So, it can be concluded that included variables result in a statistically
significant improvement in the fit of the model.
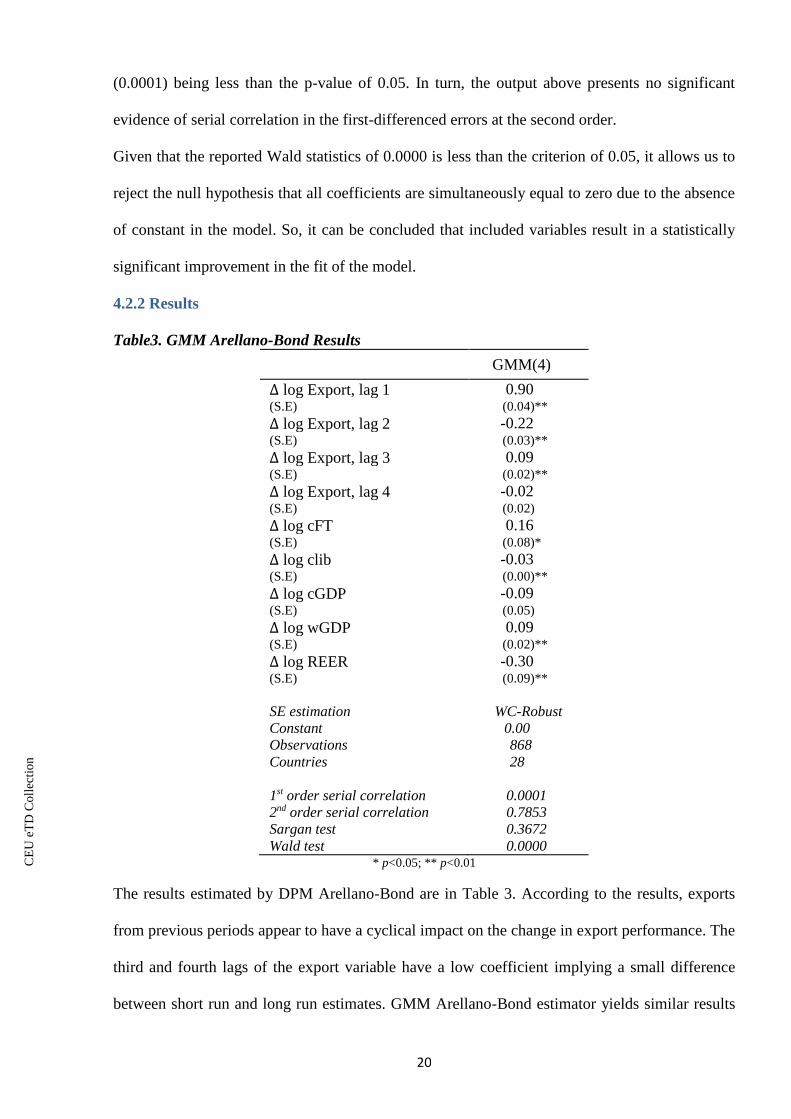
4.2.2 Results
Table3. GMM Arellano-Bond Results
GMM(4)
Δ log Export, lag 1 0.90 (S.E) (0.04)**
Δ log Export, lag 2 -0.22 (S.E) (0.03)**
Δ log Export, lag 3 0.09 (S.E) (0.02)**
Δ log Export, lag 4 -0.02 (S.E) (0.02)
Δ log cFT 0.16 (S.E) (0.08)*
Δ log clib -0.03 (S.E) (0.00)**
Δ log cGDP -0.09 (S.E) (0.05)
Δ log wGDP 0.09 (S.E) (0.02)**
Δ log REER -0.30 (S.E) (0.09)**
SE estimation
Constant
Observations
Countries
1st order serial correlation
2nd order serial correlation
Sargan test
Wald test
WC-Robust
0.00
868 28
0.0001
0.7853
0.3672
0.0000 * p<0.05; ** p<0.01
The results estimated by DPM Arellano-Bond are in Table 3. According to the results, exports
from previous periods appear to have a cyclical impact on the change in export performance. The
third and fourth lags of the export variable have a low coefficient implying a small difference
between short run and long run estimates. GMM Arellano-Bond estimator yields similar results
CE
UeT
DC
olle
ctio
n

21
to those of FE estimator. In a country where weighted mean tariffs are 1% higher, export
performance is expected to decrease by 0.03%, which is significant at 1% significance level and
supports the H2. The DPM also finds that domestic market trade openness tends to improve
exports performance by 0.16%, statistically significant at 1% level. The negative coefficient for
the domestic output is still unexpected and likely to be driven by the local producers trying to
satisfy a rising domestic demand rather than fulfilling the foreign demand for goods and services.
Static model's findings are supported further by DPM with total world output having a positive
and significant impact on exports and REER having a negative relationship with the export.
CE
UeT
DC
olle
ctio
n

22
Conclusion
Many researchers are in the debate regarding the impact of trade liberalization on export
performance. There are various studies conducted by adopting different econometric techniques.
Some studies conclude that trade liberalization has a positive impact on export while other
studies do not find any significant empirical evidence.
This paper has investigated the impact of trade liberalization on export performance in 28
selected OECD countries over the period 1980-2015 using a supply side approach that arises
from the comparative advantage theory and the Heckscher-Ohlin-Samuelson model. The study
used two primary independent variables to measure trade liberalization and trade openness –
applied weighted mean tariff rate and Freedom to Trade Internationally index, respectively,
while dependent variable was the exports as a percentage share of GDP. The thesis adopted static
panel data estimation, namely, FE, and dynamic panel data model – GMM Arellano and Bond.
Based on the results obtained, the conclusion is that trade liberalization raises the export
performance in the sample of OECD countries used for analysis. Also, the results confirm the
importance of the domestic market trade openness leading to improved export performance
within 28 OECD countries. These findings are robust to the estimation techniques used and
consistent with other studies showing a positive relationship between two variables.
Policy makers should consider more complex trade policies that will not be focused only on
eliminating trade barriers. The countries should concentrate on improving the business
environment that would help to promote trade. The policies to be implemented should focus on
improvement of infrastructure services and customs facilities, as well as the reduction in
transportation costs. Also, it is important to ensure that domestic firms have access to external
financing as it will likely lead to increasing of companies’ competitiveness. This, in turn, will
create a solid ground for trade liberalization policies and ensure success in international markets.
CE
UeT
DC
olle
ctio
n

23
Appendix I
Scatter plots of exports and trade openness (Freedom to Trade Internationally index):
Year 1980
Year 1985
CE
UeT
DC
olle
ctio
n

24
Year 1990
Year 1995
CE
UeT
DC
olle
ctio
n

25
Year 2000
Year 2005
CE
UeT
DC
olle
ctio
n

26
Year 2010
Year 2015
CE
UeT
DC
olle
ctio
n
27
Appendix II
Trends in yearly averages (exports and trade openness)
Trends in yearly averages (exports and trade liberalization)
CE
UeT
DC
olle
ctio
n

28
References
Agosin, M.R. (1991). Trade Policy Reform and Economic Performance: A Review of the Issues
and Some Preliminary Evidence, UNCTAD Discussion Papers, No. 41.
Ahmed, N. (2000). Export response to trade liberalization in Bangladesh: a cointegration
analysis. Applied Economics, 32:8, 1077-1084.
Arellano, M., & Bond, S. (1991). Some tests of specification for panel data: Monte Carlo
evidence and an application to employment equations. The Review of Economic Studies, 58:2,
277-297.
Bhagwati, J. (2004) Anti-globalisation: Why? Journal of Policy Modeling, 26, 439-463.
Cestepe, H., Yildirim, E., Bahtiyar, B. (2015). The impact of trade liberalisation on the export of
MENA countries to OECD trade partners, Procedia Economics and Finance, 23, 1440-1445.
Chang, H.-J. (2005) Why Developing Countries Need Tariffs? How WTO NAMA Negotiations
Could Deny Developing Countries' Right to a Future. South Centre.
Clarke, R. and C. Kirkpatrick (1992). Trade policy reform and economic performance in
developing countries: assessing the empirical evidence. Industrial and Trade Policy Reform in
Developing Countries, Manchester University Press.
Damijan, J.P., De Sousa, J., Lamotte, O. (2006). The effect of trade liberalisation in South-East
European countries, The wiiw Balkan Observatory, Working Papers, 070, 1-80. Accessible
under:
https://wiiw.ac.at/the-effect-of-trade-liberalization-in-south-eastern-european-countries-dlp-
3233.pdf (last access: 4.6.2017).
Dollar, D. (1992). Outward-oriented developing economies really do grow more rapidly:
Evidence from 95 LDCs, 1976-1985. Economic Development and Cultural Change, 40:3, 523-
544.
Harrigan, J. & Mosley, P. (1991) Evaluating the Impact of World Bank Structural Adjustment
Lending: 1980-87. Journal of Development Studies, 27, 63-94.
IMF (1997). World Economic Outlook.
Jenkins, R. (1996). Trade Liberalisation and Export Performance in Bolivia. Development and
Change, 27:4, 693 – 716.
Greenaway, D., & Sapsford, D. (1994). What does liberalisation do for exports and growth?
Weltwirtschaftliches Archiv, 130:1, 152-174.
Gwartney, J., Lawson, R., Hall, J. (2016). Economic Freedom of the World: 2016 Annual
Report, Fraser Institute, accessible under:
https://iea.org.uk/wp-content/uploads/2016/09/EFW_2016.pdf (last access: 4.7.2017).
Kassim, L. (2013). The impact of trade liberalisation on export growth and import growth in
Sub-Saharan Africa. University of Kent - School of Economics Discussion Papers, KDPE 1310,
1-41.
CE
UeT
DC
olle
ctio
n

29
Krueger, A. O. (1998) Why Trade Liberalisation is Good for Growth. The Economic Journal,
108, 1513-1522.
Lall, S. (2003) Reinventing industrial strategy: The role of government policy in building
competitiveness. Queen Elizabeth House Working Paper, No.111, 1-34.
Nye, H.J., Reddy, S.G., Watkins, K. (2002). Dollar and Kraay on “Trade, Growth, and Poverty”:
A Critique, accessible under:
http://people.umass.edu/econ797f/Syllabus%20and%20Readings/Readings/reddy.critique.dollar
kraay.pdf (last access: 4.7.2017).
OECD (1998). Open Markets Matters. The Benefits of Trade and Investment Liberalisation.
Pacheco-López, P. (2005). The effect of trade liberalization on exports, imports, the balance of
trade, and growth: the case of Mexico. Journal of Post Keynesian Economics, 27:4, 595-619.
Papageorgiou, D., Michaely, M. & Choksi, A. (1991) Liberalising Foreign Trade, Oxford,
Blackwell.
Paudel, R.C. (2014). Liberalisation reform and export performance in India. ASARC Working
Paper 2014/03, 1-24, accessible under:
https://crawford.anu.edu.au/acde/asarc/pdf/papers/2014/WP2014_03.pdf (last access: 4.6.2017).
Ratnaike, Y.C. (2012). Is there an empirical between Trade Liberalisation and Export
Performance, Economic Letters, 117, 375 – 378.
Rodriguez, F., & Rodrik, D. (2001). Trade policy and economic growth: A skeptic’s guide to the
cross-national evidence. In B.S. Bernanke & K. Rogoff (eds.). NBER Macroecnomics Annual
2000, 15, MIT press, 261-338.
Sachs, J.D., & Warner, A. (1995). Economic reform and the process of global integration.
Brookings Papers on Economic Activity, 26:1, 1-118.
Santos-Paulino, A.U. (2006). Trade liberalisation and trade performance in the Dominican
Republic. Journal of International Development, 18:7, 925-944.
Santos-Paulino, A.U. (2002). Trade liberalisation and export performance in selected developing
countries. The Journal of Development Studies, 39:1, 140-164.
Santos-Paulino, A., & Thirlwall, A.P. (2004). The impact of trade liberalisation on exports,
imports and the balance of payments of developing countries. The Economic Journal, 114:493,
F50-F72.
Seker, M. (2011). Trade policies, investment climate, and exports. MPRA Paper, 29905, 1-23,
accessible under:
https://mpra.ub.uni-muenchen.de/29905/1/tradepolicies_MuratSeker.pdf (last access:
04.07.2017).
Shafaeddin, M. (1994). The impact of trade liberalization on exports and GDP growth in least
developed countries, UNCTAD Review, 1-16.
CE
UeT
DC
olle
ctio
n

30
Srinivasan, T. N. & Bhagwati, J. (1999) Outward-Orientation and Development: Are
Revisionists Right? Economic Growth Centre, Yale University Working Papers, No.806.
Subasat, T. (2008) Do liberal trade policies promote trade openness? International Review of
Applied Economics, 22, 45-61.
Wacziarg, R., & Welch, K.H. (2003). Trade liberalization and growth: new evidence. NBER
working paper, 10152, 1-89.
Zakaria, M. (2014). Effects of trade liberalization on exports, imports and trade balance in
Pakistan: A time series analysis. Prague Economic Papers, 1, 121-139.
CE
UeT
DC
olle
ctio
n