the impact of total quality management implementation on
TRANSCRIPT

Draft Awal: 26 Agustus 2017; Direvisi: 26 Februari 2018; Diterima: 20 Maret 2018http://journal.uinjkt.ac.id/index.php/esensi DOI: 10.15408/ess.v8i1.5852
Esensi: Jurnal Bisnis dan ManajemenVolume 8 (1), 2018
P-ISSN: 2087-2038; E-ISSN:2461-1182Halaman 67 - 78
Ratna Purwita Sari1, Achmad Firdaus2
STEI [email protected], [email protected]
AbstrakThis study aims to analyze the influence of Total Quality Management (TQM) implementation to competitive advantage and company’s performance, especially to small and medium manufacturing company. Using Partial Least Square (PLS) tested the hypothesis of Structural Equation Modelling (SEM). There is significant influence between TQM implementation to competitive advantage. Likewise with a competitive advantage to the company’s performance there is significant influence. But there is no significant influence directly between TQM to the company’s performance. The study discusses about the implementation of TQM in small and medium manufacturing companies. In the practice, implementation of TQM in small and medium manufacturing companies are not as smooth as the large manufacturing company.Keywords: total quality management, competitive advantage, small medium enterprise
AbstrakPenelitian bertujuan untuk menganalisis pengaruh penerapan TQM terhadap keunggulan bersaing dan kinerja perusahaan, khususnya pada perusahaan pabrikasi kecil dan menengah.. Model hipotesis dari Structural Equation (SEM) diuji dengan menggunakan Partial Least Square (PLS). Terdapat pengaruh yang signifikan antara penerapan TQM terhadap keunggulan bersaing. Begitu juga dengan keunggulan bersaing terhadap kinerja perusahaan, terdapat pengaruh yang signifikan. Tetapi tidak ada pengaruh yang signifikan secara langsung antara penerapan TQM terhadap kinerja perusahaaan. Penelitian membahas penerapan TQM pada perusahaan pabrikasi kecil dan menengah. Ternyata dalam prakteknya penerapan TQM pada perusahaan pabrikasi kecil dan menengah tidak semulus pada perusahaan pabrikasi yang besar. Kata Kunci: total quality management, keunggulan bersaing, perusahaan kecil menengah.
Cara Mengutip:Sari, R. P., & Firdaus, A. (2018). Analyzing The Impact of Total Quality Management Implementation on Small and Medium Manufacturing Companies. Esensi: Jurnal Bisnis dan Manajemen. Vol. 8 (1): 67 – 78. doi: 10.15408/ess.v8i1.5852.
The Impact of Total Quality Management Implementationon Small and Medium Manufacturing Companies

68 http://journal.uinjkt.ac.id/index.php/esensiDOI: 10.15408/ess.v8i1.5852
Vol. 8, No.1, 2018Esensi: Jurnal Bisnis dan Manajemen
INTRODUCTIONGlobal competition is stronger and tighter. Companies must be able to take advantage
of the capabilities in order to compete and to gain as much as possible. Organizations should pay more attention to develope and to optimize their management practices. One form of management practices is Total Quality Management (TQM) (Madanat & Khasawneh, 2017). In facing competition, a company seeks to improve and to enhance quality and productivity. Improving productivity and quality can be implemented on resources, products, manufacturing processes, etc. By improving quality and productivity, the performance will increase, of course it will increase profit. To improve quality, one way to do is to implement total quality management (TQM). TQM is an approach to maximize organizational compatitiveness.
The main characteristics of TQM (Goetsch & Davis, 2013) is customer focus, obsession on quality, scientific approach, long-term commitment, teamwork, improvement of the system on an ongoing basis, education and training, controlled freedom, unity of purpose, as well as the involvement and empowerment of employees. By implementing the ten components of TQM, the company can obtain the profit, good operational management, and good competitiveness.
Competitive advantage according to Li et al (2006) has indicators such as price, quality, delivery dependability, product innovation and time to market. Indicators that will be used in this study are price, quality, and product innovation. Price is the sum of the values that consumers redeem to get the benefits of owning or using a product or service (Kotler & Armstrong, 2012). Li et al (2006) states that the company can fight competitors by setting lower prices or lower the costs as low as possible.
Performance is the appearance of the work, both quantity and quality within an organization. The company’s performance is most often used in the study is the financial performance, the operational performance, and the performance of a market-based. Financial performance measured by using a measurement based accounting data. According to Carton (2004), the main advantage of using operational measurements as compared to the financial measurement is when the available information related to the opportunities that already exist, but have not been realized financially.
Central Agency Statisctics or Badan Pusat Statistik (BPS) (2017) noted that Indonesia’s manufacturing industry in 2017 experienced a remarkable increase, both large & medium industry and small & micro industry. Growth of large and medium manufacturing industry in 2017 rose by 4.74% from 2016. Growth was triggered by the growth of metal goods industry, not machinery and equipment, which rose 6.39%, while basic metal industry, up 6.09%. The growth of micro & small manufacturing industry in 2017 increased by 4.74% from 2016. The growth was triggered by the growth of computer industry, electronics and optical goods by 35.25%, chemical and chemical goods industry, up 18.66% , paper and paper products industry, up 17.91%, and basic metal industry, up 11.67%.
The growth of manufacturing industry, both large & medium industry and micro & small industry become interesting object to be studied. The research on TQM implementation to small and medium manufacturing industry did by Prayhoego (2013).

69
Analyzing the Impact of TQM….Ratna Purwita Sari
http://journal.uinjkt.ac.id/index.php/esensiDOI: 10.15408/ess.v8i1.5852
They found that TQM implementation in small & medium enterprises in Surabaya can increase the company’s competitive advantage. TQM Implementation is directly also affects company performance. While, Yulliani & Sunarni (2008) found that TQM implementation affects return on assets (ROA) in manufacturing company in Surakarta region.
Mustapha et.al (2011) conducted a research on the level of awareness and TQM implementation in small and medium sized manufacturing companies in Malaysia. They found that the successful TQM implementation in the SMMEs depends on a long-term perspective. Deros et al (2009) conducts research on the important role of senior managers in Small & Medium Enterprises (automotive components manufacturing sector) in Malaysia. Deros et al (2009) gained important roles that the senior managers must undertake is perception and practice in setting realistic TQM objectives, providing TQM related trainings to their employees, making decision based on facts, enhancing teamwork effort, giving priority and attention to the internal and external customer. Comparing the perceptions of importance and actual practices between SMEs senior management’s perception of importance and actual practices on TQM. This study aims to analyze the influence of TQM implementation to competitive advantage and performance, especially to small and medium manufacturing company (SMMC) in Bekasi West Java and Jakarta.
METHODThe population are employees of PT. Reka Indonesia Services (RIS). RIS is
manufacturing company which produces marine diesel generator, also serves the maintenance and repair of diesel generator. The company is located in Bekasi. The second company is PT. MHI Engine System Indonesia (MHI). MHI is a manufacturing company that produces waste processing machine which was established in 2010 in Bekasi.
Sample size is number of indicators multiplied by 5-10 (Ferdinand in Susilowati, 2009). There are 15 indicators. Then, samples size: 15 indicators x 5 = 75 samples. Questionnaires have been distributed to respondent at amount 80 pcs. It consist of 22% RIS and 78% MHI. The detail of respondent in RIS is: 17% Manager and 83% staff. The respondent for MHI is 3% Manager and 97% Staff. Respondents from RIS, consisted of 50% of employees who have worked for 1-5 years, 37% worked for 6-10 years, 6% worked for 11-15 years, 5% worked for 21-25 years and 2% worked for 15-20 years. Respondent from MHI, 100% of respondents have work experience less than 5 years old.
The research variables measured by using a five-level of Likert scale. The whole question represents ten components of TQM, competitive advantage, and companies’s performance with ratings as follows: strongly agree 5, agreed 4, 3 neutral, disagree 2 and strongly disagree 1. Comparing r_count with r_table at the level of α performed validity testing = 0:05. Result of validity tests is as follows: If r_count positive or r_count > r_table, then the question is valid. If r_count negative or r_count < r_table, then the question is not valid. Reliable testing was performed by assesing Cronbach’s Alpha. The instrument is declared reliable if the Cronbach’s Alpha value ≥ 0.60. Hypothesis testing use PLS-SEM analysis and software SmartPLS Version 2.0 M3. PLS-SEM analysis consists

70 http://journal.uinjkt.ac.id/index.php/esensiDOI: 10.15408/ess.v8i1.5852
Vol. 8, No.1, 2018Esensi: Jurnal Bisnis dan Manajemen
of two sub-models, outer model and the structural model or commonly called inner models.
Figure 1. Structural Equation Modeling
X : TQM X_1 : Customer FocusX_2 : Obsession on QualityX_3 : Scientific ApproachX_4 : Long Term CommitmentX_5 : TeamworkX_6 : Continuous ImprovementX_7 : Education and TrainingX_8 : Controlled FreedomX_9 : Unity of PurposeX_10 : Employee engagement and Empowerment
Z : Competitive AdvantageZ_1 : PriceZ_2 : QualityZ_3 : Product InnovationY : PerformanceY_1 : FinancialY_2 : Operation
RESULT AND DISCUSSIONVariable of TQM implementation (X) explained with 10 indicators. Respondents
assess the implementation of TQM in each of indicator as Table 1. We can see that all of indicators for TQM implementation are good and very good category. From the result, we can state that the implementation of TQM for those companies is good.

71
Analyzing the Impact of TQM….Ratna Purwita Sari
http://journal.uinjkt.ac.id/index.php/esensiDOI: 10.15408/ess.v8i1.5852
Table 1. Analysis of Total Quality Management (TQM) Implementation
No Indicator Value Category
1 Customer Focus 4.31 Very Good
2 Obsession on the Quality 4.51 Very Good
3 Scientific Approach 3.93 Good
4 Long-Term Commitment 4.53 Good
5 Teamwork 4.38 Good
6 Continuous Improvement 4.27 Very Good
7 Education and Training. 4.11 Good
8 Controlled Freedom 4.23 Very Good
9 Unity in Purpose 4.44 Very Good
10 Employee engagement and Employee Empowerment 4.45 Very Good
Variable of competitive advantage (Z) explained by three indicators. Respondents assess competitive advantage in each of the indicators as Table 2. Table 2 shows that all of the indicators for competitive advantage are good and very good.
Table 2. Analysis of Competitive Advantage
Indicator Value Category
Price 3.88 Good
Quality 4.23 Very Good
Product Innovation 4.48 Very Good
Variable of company’s performance (Y) described with two indicators. Respondents assess company’s performance on each of indicator as Table 3. Table 3 shows that the company’s performance is good.
Table 3. Analysis of Company’s Performance
Indicator Value Category
Financial Performance 4.11 Good
Operational Performance 3.88 Good
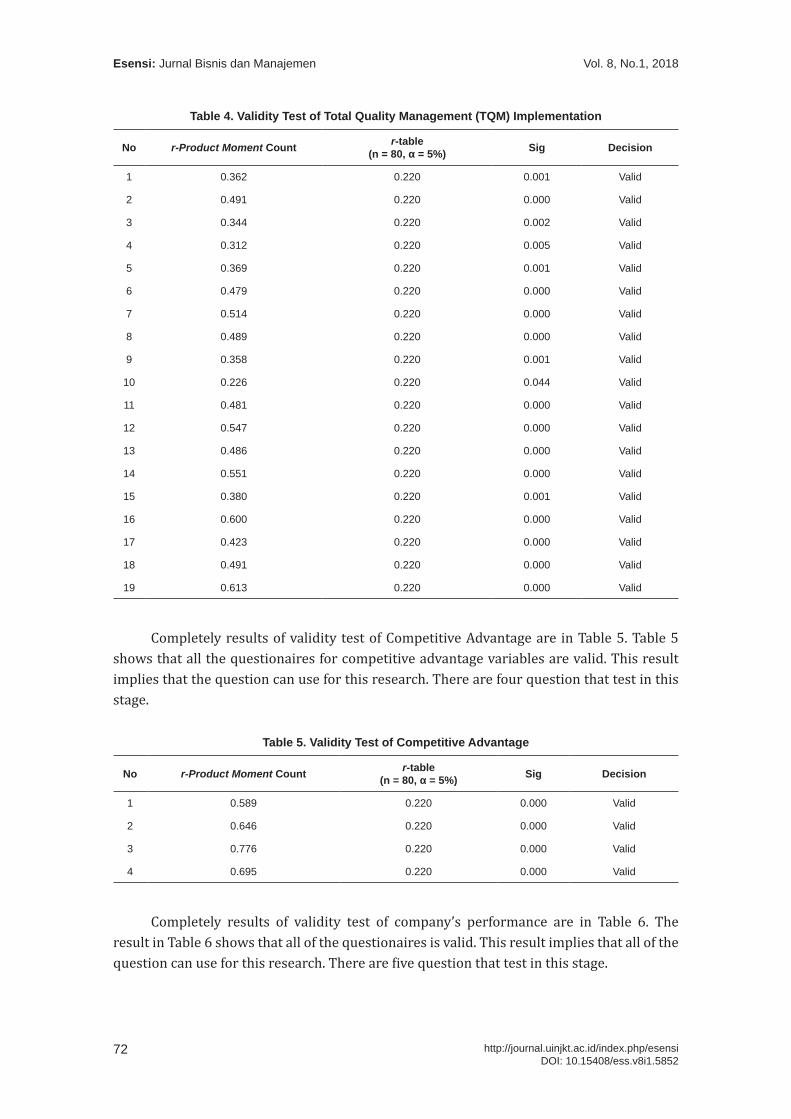
Comparing r_count to r_table does validity test. R_count invalid if it has a value ˃ r_table at the level of α = 0.05. Completely results of validity test of TQM implementation is in Table 4. Table 4 shows that all of the questioners that distributed to respondents for TQM implementation is valid. This result implies that the questionaires can be used for the next analysis for this research. There are 19 questions that had passed the validity test.
72 http://journal.uinjkt.ac.id/index.php/esensiDOI: 10.15408/ess.v8i1.5852
Vol. 8, No.1, 2018Esensi: Jurnal Bisnis dan Manajemen
Table 4. Validity Test of Total Quality Management (TQM) Implementation
No r-Product Moment Count r-table (n = 80, α = 5%) Sig Decision
1 0.362 0.220 0.001 Valid
2 0.491 0.220 0.000 Valid
3 0.344 0.220 0.002 Valid
4 0.312 0.220 0.005 Valid
5 0.369 0.220 0.001 Valid
6 0.479 0.220 0.000 Valid
7 0.514 0.220 0.000 Valid
8 0.489 0.220 0.000 Valid
9 0.358 0.220 0.001 Valid
10 0.226 0.220 0.044 Valid
11 0.481 0.220 0.000 Valid
12 0.547 0.220 0.000 Valid
13 0.486 0.220 0.000 Valid
14 0.551 0.220 0.000 Valid
15 0.380 0.220 0.001 Valid
16 0.600 0.220 0.000 Valid
17 0.423 0.220 0.000 Valid
18 0.491 0.220 0.000 Valid
19 0.613 0.220 0.000 Valid
Completely results of validity test of Competitive Advantage are in Table 5. Table 5 shows that all the questionaires for competitive advantage variables are valid. This result implies that the question can use for this research. There are four question that test in this stage.
Table 5. Validity Test of Competitive Advantage
No r-Product Moment Count r-table (n = 80, α = 5%) Sig Decision
1 0.589 0.220 0.000 Valid
2 0.646 0.220 0.000 Valid
3 0.776 0.220 0.000 Valid
4 0.695 0.220 0.000 Valid
Completely results of validity test of company’s performance are in Table 6. The result in Table 6 shows that all of the questionaires is valid. This result implies that all of the question can use for this research. There are five question that test in this stage.

73
Analyzing the Impact of TQM….Ratna Purwita Sari
http://journal.uinjkt.ac.id/index.php/esensiDOI: 10.15408/ess.v8i1.5852
Table 6. Validity Tes of Company’s Performance
No r-Product Moment Count r-table (n = 80, α = 5%) Sig Decision
1 0.672 0.220 0,000 Valid
2 0,528 0,220 0,000 Valid
3 0,911 0,220 0,000 Valid
4 0,911 0,220 0,000 Valid
5 0,888 0,220 0,000 Valid
Calculating the Cronbach’s Alpha performs a reliability test. If the value of Cronbach’s Alpha ≥ 0.60, then we can say that the instrument is reliable. Cronbach’s Alpha value of Total Quality Management (TQM) is 0.775 (reliable). Cronbach’s Alpha value of competitive advantage is 0.600 (reliable). Cronbach’s Alpha value of the company’s performance is 0844 (reliable). Outer measurement model was evaluated with convergent and discriminant validity of the indicators and composite reliability for the block indicator.
Figure 2. Results Output Model
Customer focus (X1) has loading value at amount 0.283. Obsession on quality (X2) has -0.250. Controlled freedom (X8) has 0288. Involvement and empowerment (X10) has 0192 (See Figure 2). They are excluded from model because has a loading less than 0.50. Re-estimation models made by throwing some indicators, such as: of X1 (customer focus), X2 (obsession with quality), X8 (freedom controlled), and X10 (the involvement and empowerment of employees). The result is shown in Figure 3.

74 http://journal.uinjkt.ac.id/index.php/esensiDOI: 10.15408/ess.v8i1.5852
Vol. 8, No.1, 2018Esensi: Jurnal Bisnis dan Manajemen
Figure 3. Results Output of Model II
We can see that the indicators have a factor loading value over 0.50. For more details, the output is shown in Table 7.
Table 7. Outer Loadings (Mean, STDEV, t-Values)
Original Sample (O) t Statistics (O/STERR)
X3 <- Total Quality Management 0.665766 4.688847
X4 <- Total Quality Management 0.561251 4.173224
X5 <- Total Quality Management 0.612247 4.747259
X6 <- Total Quality Management 0.721466 4.134072
X7 <- Total Quality Management 0.619910 3.714824
X9 <- Total Quality Management 0.587128 3.489597
Y1 <- Company’s Performane 0.822879 7.319459
Y2 <- Company’s Performane 0.846162 9.886500
Z1 <- Competitive Advantage 0.754268 6.731533
Z2 <- Competitive Advantage 0.614750 3.772039
Z3 <- Competitive Advantage 0.723066 5.672071
By disposing the indicators of X1, X2, X8, and X10. The original sample (O)) had loading value ≥ 0.50. Likewise, the t-statistic has a value greater than 1.96. Then each indicator is valid and significant. Discriminant validity can be analyzed in cross-loading between the indicator and its construct. Result of cross-loading is in Table 8.

75
Analyzing the Impact of TQM….Ratna Purwita Sari
http://journal.uinjkt.ac.id/index.php/esensiDOI: 10.15408/ess.v8i1.5852
Table 8 Cross Loadings
Competitive Advantage Company’s Performance TQM
X3 0.340873 0.056480 0.665766
X4 0.161936 0.255951 0.561251
X5 0.276759 0.297288 0.612247
X6 0.442510 0.162864 0.721466
X7 0.220565 0.046592 0.619910
X9 0.176109 0.147591 0.587128
Y1 0.430378 0.822879 0.331846
Y2 0.469417 0.846162 0.120669
Z1 0.754268 0.459950 0.415663
Z2 0.614750 0.383883 0.133779
Z3 0.723066 0.271327 0.363505
Correlation of TQM (X3=0.665766, X4=0.561251, X5=0.612247, X6=0.721466, X7=0.619910, X9=0.587128) has higher value than other correlation of competitive advantage (Z) or correlation of company’s performance (Y). This also applies to correlation of Competitive Advantage (Z). Competitive Advantage construct (Z1=0.754268, Z2=0.614750, Z3=0.723066) has higher correlation value than other constructs (Competitive Advantage, Z and Company’s Performance, Y). Company’s Performance construct (Y1=0.822879, Y2=0.846162) has higher correlation value than other constructs (Competitive Advantage, Z and TQM, X). It shows that the latent construct is better predicting indicators than other. Composite Reliability. The result of reliability test shows in Table 9.
Table 9. Composite Reliability
Composite Reliability
Competitive Advantage 0.740935
Company’s Performance 0.821116
Total Quality Management 0.796930
The output of composite reliability for each variable (cronbachs alpha) has value ≥ 0.60. It can be concluded that the construct is reliable. TQM to competitive advantage has R-square value is 0.211390. It is mean that competitive advantage can be explained by TQM at 21.14%. While, 78.86% is explained by other variables. TQM to performance has R-square value is 0.291637. It is mean that performance can be explained by TQM at 29.16%. While, 70.84% is explained by other variables.
There is a positive effect of competitive advantage to performance (coefficients: 0.529). The higher competitiveness will be higher performance of the company. T-statistic value of 5,007 is significant (t-table significance 5% = 1.96). There is a positive effect of TQM t o competitive advantage (coefficient: 0.460). The higher TQM will be higher

76 http://journal.uinjkt.ac.id/index.php/esensiDOI: 10.15408/ess.v8i1.5852
Vol. 8, No.1, 2018Esensi: Jurnal Bisnis dan Manajemen
competitiveness. The value of t-statistic is 3.543, it means the variables is significant. TQM implementation has t-statistics value at 0.177. It means that t-statistics value of 0.177 is ≤ 1,96. So, TQM implementation has no influence directly to company’s performance. Convergent validity test showed that all indicators on variables of competitive advantage and performance are worthy to consider in the model. While other indicators developed in this study is an indicator that deserves to be included in the analysis because it has qualified on testing composite convergent validity and reliability.
After testing the hypothesis, the results show that the hypothesis developed in this research that H1 and H3 demonstrates the value and significance because of the value t count > t-table value. While H2 not demonstrate significant value. TQM is significantly positive impact on competitive advantage. By applying the components of TQM, competitiveness of SMMC for the better. It can be concluded that good in implementing TQM, will increase the level of competitiveness.
TQM is not significant and positive effect directly to company performance. TQM in SMMC has been good and the company’s performance also looks good, but related to the application of TQM with a performance that is not yet engage and empower employees to participate directly in any case. Competitive advantage has significant positive effect on company performance. The better the competitiveness of the company, the better the performance of the company. With a good level of competitiveness, it is very good for the company’s revenue and the level will reach the targeted opinion.
The overall analysis found that TQM (Goetsch & Davis, 2013) has 10 characteristics are: customer focus, obsession on quality, scientific approach, long-term commitment, team work, continuous improvement, education and training, controlled freedom, unity in purpose, and employee engagement and employee empowerment.. In case SMMC in Jakarta dan Bekasi, components of TQM are customer focus, obsession on quality, controlled freedom, employee engagement and employee empowerment hava not implemented properly. The both of customer focus and obsession on quality are components that affect each other. They have not been an important concern at SMCC. Positive impact of them has not been felt. This is due to employee engagement and employee empowerment is not managed properly.
Employee engagement and employee empowerment are very essential in TQM. Employee engagement in production process provides a huge benefit for the company. The employees need to be creative in the workplace. Employees become accustomed to make decisions in accordance with his authority work. The employees used to do work the best. Therefore, TQM implemented by SMCC did not have a direct impact on company performance. Financial performance and process performance are achieved by SMCC not from TQM implementation directly.
On the other hand, SMCC customer who is a major manufacturing company requires SMCC to implement the principles of TQM, as implemented by them. SMCC apply a scientific approach in production process. The scientific approach is needed in designing work and decision-making process. SMCC become familiar with running continuous improvement. The system used to improve quality continuously. Although components of an obsession to quality are low enough. But customer demand becomes a way for SMCC to start education and training system. Everyone is encouraged to learn. By learning, everyone in the company can improve

77
Analyzing the Impact of TQM….Ratna Purwita Sari
http://journal.uinjkt.ac.id/index.php/esensiDOI: 10.15408/ess.v8i1.5852
technical skills and professional expertise. The above conditions can improve innovation process. Accumulation of innovation process makes the quality of products becomes better. The implementation of TQM in SMMC has been very good, so that its effect on competitive advantage has been good. The implementation of TQM should be retained.
The result is in line with Prayhoego (2013). TQM implementation in small & medium enterprises in Surabaya can increase the company’s competitive advantage. The application of TQM can reduce production cost and operation costs so that product prices can be cheaper. TQM implementation can also improve innovation process in the workplace. The quality becomes more better. Ultimately the application of TQM directly affects the company’s performance.
The research is also in line with Yulliani & Sunarni (2008). The application of TQM affects the company’s financial performance in Surakarta and Bandung. Yuliani and Sunarni (2008) used return on assets (ROA) as the company’s financial performance parameters in their research. The results of this study differ from the findings of Mustapha et.al (2011) in Malaysia. Mustapha et al (2011) that 31.3% of SMEs in Malaysia implement TQM. Mustapha et al (2011) mentioned that the successful implementation of TQM in the SMEs depends on a long-term perspective that is continuous improvement.
The results support the findings of Deros et al (2009). Deros et al (2009) mentioned the important role of senior managers in the Small And Medium Enterprises (automotive components manufacturing sector) in Malaysia. The scientific research findings, teamwork and education & training are very important in the application of TQM.
CONCLUSIONThe research concludes that TQM implementation can improve the competitive
advantage of SME. SMEs in Bekasi and Jakarta apply TQM in the form of scientific approach, long-term commitment, teamwork, continuous improvement, education & training and unity of purpose. These parameters are an essential part of top management job. Thus the successful implementation of TQM in SMEs in Bekasi and Jakarta is strongly influenced by the awareness of top management to TQM. TQM implementation has a direct impact on SME performance, both financial performance and operational performance. TQM in SMMC has been very good, but the implementation has not been able to improve performance
REFERENCESCarton, R. B. (2004). Measuring Organizational Performance: An Exploratory Study.
(Unpublished Dissertation). Georgia: The University of Georgia.Deros, B. Md., Rahman, M. N. A., Ghani, J. A., Wahab, D. A., Hashim, M. H., & Khamis, N. K.
(2009). Role Of Senior Management In Tqm Implementation In Malaysian Small And Medium Enterprises. Journal - The Institution of Engineers. Vol. 72 (3): 15-20.
Goetsch, D. L., & Davis, S. (2013). Quality Management for Organizational Excellence: Introduction to Total Quality, 7th Edition. New Jersey: Pearson.
Kotler, P., & Amstrong, G. (2012). Principles of Marketing, 14th Edition. New Jersey: Pearson Education..
78 http://journal.uinjkt.ac.id/index.php/esensiDOI: 10.15408/ess.v8i1.5852
Vol. 8, No.1, 2018Esensi: Jurnal Bisnis dan Manajemen
Li, S., Ragu-Nathan, B., Ragu-Nathan, T. S., Rao, S. S. (2006). The Impact of Supply Chain Management Practices On Competitive Advantage And Organizational Performance. Omega: The International Journal of Management Science. 34: 107-124.
Madanat, H. G., & Khasawneh, A. S. (2017). Impact Of Total Quality Management Implementation On Effectiveness Of Human Resource Management In The Jordanian Banking Sector From Employees’ Perspective. Academy Of Strategic Management Journal. Vol. 16 (1): 21-30.
Mustapha, M. R., Muda, M. S., & Hasan, F. A. (2011). A Survey of Total Quality Management in the Malaysian Small and Medium Sized Manufacturing Companies. International Journal of Humanities and Social Science. Vol. 1 No. 2: 118-122.
Prayhoego, C. A. (2013). Analisa Pengaruh Total Quality Management Terhadap Keunggulan Bersaing dan Kinerja Perusahaan. Business Accounting Review. Vol. 1: 121-130.
Susilowati, L. (2009). Membangun Daya Tarik Jasa dan Reputasi Merek Melalui Kualitas Layanan dan Aliansi Pasar pada Perusahaan EMKL. Jurnal Riset Ekonomi dan Bisnis. Vol. 9 (1): 51-60.
Yulliani, D., & Sunarni, C. W. (2008). Pengaruh Penerapan Total Quality Management (TQM) Terhadap Return on Assets Pada Perusahaan Manufakur di Surakarta dan Sekitarnya. Modus. Vol. 20 (1): 65-76.