the impact of the uk’s public investments in ukaea fusion
TRANSCRIPT

January 2020
The impact of the UK’s public investments in UKAEA fusion research Final report

A report for the Department for Business, Energy & Industrial Strategy (BEIS) by London Economics
Acknowledgements
This independent research report was produced by Daniel Herr, Charlotte Duke, Moritz Godel, Wouter Landzaat, Ryan Perkins, and Carolyn Visser from London Economics.
The views expressed in this report are those of the authors, not necessarily those of the Department for Business, Energy & Industrial Strategy or the UK Atomic Energy Authority (UKAEA), nor do they reflect Government policy.
We are grateful to all stakeholders for their time and insights. We would also like to acknowledge the support provided by BEIS, UKAEA and the Department for International Trade (DIT).
Finally, we would like to acknowledge the peer reviewers for the time and effort invested into reviewing the final report of this study and would like to thank them for their valuable comments and feedback.
© Crown copyright 2020
This publication is licensed under the terms of the Open Government Licence v3.0 except where otherwise stated. To view this licence, visit nationalarchives.gov.uk/doc/open-government-licence/version/3 or write to the Information Policy Team, The National Archives, Kew, London TW9 4DU, or email: [email protected].
Where we have identified any third-party copyright information you will need to obtain permission from the copyright holders concerned.
Any enquiries regarding this publication should be sent to us at: [email protected]
The impact of the UK’s investments in UKAEA fusion research
3
Contents Executive summary _________________________________________________________ 5
1 Introduction ____________________________________________________________ 9
1.1 Study objectives and scope ___________________________________________ 12
1.2 Approach and methodology ___________________________________________ 12
1.3 Baseline and counterfactual ___________________________________________ 13
1.4 Caveats and limitations _______________________________________________ 14
1.5 Structure of report ___________________________________________________ 15
2 Fusion research in the UK ________________________________________________ 17
2.1 Early period (50s/60s) ________________________________________________ 17
2.2 70s-early 2000s ____________________________________________________ 19
2.3 Current and planned future developments ________________________________ 21
3 Income and expenditure on UKAEA fusion research ___________________________ 23
4 Impact of UKAEA’s fusion programme ______________________________________ 28
4.1 Scientific impact ____________________________________________________ 28
Development of adjacent technologies ______________________________________ 30
4.2 Industrial impact ____________________________________________________ 32
4.3 Impact on skills _____________________________________________________ 35
4.4 International leadership _______________________________________________ 38
4.5 Other impacts ______________________________________________________ 40
5 Economic Impact ______________________________________________________ 42
5.1 Impact of UKAEA contract expenditure ___________________________________ 44
Estimating direct, indirect and induced effects of UKAEA contract expenditure _______ 44
Direct impact of UKAEA contract expenditure _________________________________ 45
Indirect and induced impact of UKAEA contract expenditure _____________________ 47
Geographical distribution of UKAEA contract expenditure _______________________ 49
5.2 Impact of UKAEA staff expenditure ______________________________________ 50
Estimating direct, indirect and induced effects of UKAEA staff expenditure __________ 50
Direct job creation by UKAEA _____________________________________________ 52
Direct, indirect and induced effects of UKAEA staff expenditure ___________________ 53
5.3 Impact of other UKAEA expenditure on raw materials and consumables, and other external expenses _______________________________________________________ 54
5.4 Impact of ITER contract expenditure _____________________________________ 55
Direct impact of ITER contract expenditure ___________________________________ 56
Indirect and induced impact of ITER contract expenditure _______________________ 59

The impact of the UK’s investments in UKAEA fusion research
4
Scale of underestimation of ITER impacts ___________________________________ 62
Potential additional impact from spin-offs ____________________________________ 62
5.5 Total economic impact _______________________________________________ 64
6 Additionality of impacts __________________________________________________ 67
6.1 Additionality of UKAEA staff expenditure _________________________________ 67
6.2 Additionality of UKAEA contract expenditure ______________________________ 68
6.3 Additionality of ITER contract contracts to UK companies ____________________ 68
Net impacts of ITER ____________________________________________________ 69
6.4 Tipping point analysis ________________________________________________ 69
7 Impact of the “no UKAEA” counterfactual scenario on the UK ____________________ 72
7.1 Impact on fusion-related research and skills _______________________________ 72
7.2 Impact on industry ___________________________________________________ 74
7.3 Alternative uses of the Culham site ______________________________________ 75
The fate of other WWII airfields ____________________________________________ 75
7.4 Focus of government investment in absence of the UKAEA ___________________ 76
8 Environmental impact ___________________________________________________ 77
9 Future opportunities for fusion energy ______________________________________ 79
10 Conclusions _________________________________________________________ 81
References _______________________________________________________________ 82
Index of Tables and Figures __________________________________________________ 87
Tables _________________________________________________________________ 87
Figures ________________________________________________________________ 87
Annexes _________________________________________________________________ 89
Annex 1: Logic map ______________________________________________________ 89
Annex 2: Methodological annex _____________________________________________ 91
Overview of methodology ________________________________________________ 91
Rationale for the chosen modelling approach _________________________________ 95
Caveats and Limitations _________________________________________________ 95
Annex 3: Survey _________________________________________________________ 98
Compilation of sampling frame ____________________________________________ 99
Survey questionnaire __________________________________________________ 100
Annex 4: Scientific impact of Fusion Research in Culham – Bibliometric analysis ______ 109
SCIENTIFIC IMPACT OF FUSION RESEARCH IN CULHAM _______________________ 110
Introduction ____________________________________________________________ 113
Overview of research activities in the Culham Science Centre _____________________ 113
Comparison with Max Planck Institute for Plasma Physics ________________________ 116
Trends in Nuclear Fusion Research _________________________________________ 117

The impact of the UK’s investments in UKAEA fusion research
5
Executive summary Fusion produces energy by emulating the process that powers the sun and stars in experimental fusion devices such as tokamaks. Fusion energy has vast potential, offering the promise of a safe, green, and abundant power source. Nevertheless, substantial challenges remain to harnessing fusion as an energy source, with fully operational commercial fusion reactors not expected for the next 30-50 years.
This study by London Economics for the Department of Business Energy and Industrial Strategy (BEIS) assesses the costs and benefits of the UK’s investments in UKAEA fusion research to date. It does not consider the sizable future benefits of fusion research to the UK as this was out of scope for this present study.
UKAEA is a world leading facility for the advancement of fusion energy. Located at the Culham Science Centre in Oxfordshire, it is home to the Joint European Torus (JET) tokamak which currently holds the world record for fusion energy output. The location also supports a range of advanced technology research operations including the Remote Applications in Challenging Environments Centre (RACE), connected and autonomous vehicles research (Pit Lane), and the Hydrogen-3 Advanced Technology (H3AT) centre of excellence. The Culham site is also home to over 20 diverse businesses including stored energy solutions, architectural services, healthcare equipment, aerospace engine technology and software consultancy.
Economic impact
UKAEA’s economic impact includes the creation of direct employment such as researchers and other highly skilled staff as well as direct contract and materials spend in the UK. In addition, UKAEA brings commercial benefits to UK industry from working with, or being supported by, UKAEA. UKAEA’s world leading knowledge in fusion helps to attract foreign investment, such as contracts related to ITER - a worldwide collaboration intended to provide a technical demonstration of large-scale fusion power - to the UK and generates spin-offs in the form of new technologies and firms.
The total economic impact of UKAEA to the UK economy is estimated to be between £1.3 billion and £1.4 billion in Gross Value Added (GVA), for the period 2009/10 to 2018/19. In terms of employment, it is estimated that UKAEA activities and ITER-related investments support between 34,880 and just over 36,900 job years1. (Figure 1)
These benefits compare to total UKAEA funding from UK Government sources of approximately £346.7 million over the same period.
The return on the UK Government’s investments in UKAEA is therefore estimated to be between £3.7 million and £4.1 million of Gross Value Added to the UK economy and between 100 and 106 job years supported for every £1 million invested in UKAEA by the UK Government.
Figure 1 provides a breakdown of the total economic impact of UKAEA to the UK economy by strand.
1 A job year refers to a job being provided for one year. If the job continues for another year, it is counted as two job years.

The impact of the UK’s investments in UKAEA fusion research
6
Figure 1: Total direct, indirect and induced impacts of UKAEA, by strand (2009/10 – 2018/19)
Note: Figures are in real terms (2019 Q1 prices), deflated using ONS GDP deflators. Figures may not sum up due to rounding. Source: London Economics
Impacts arising from UKAEA’s own activities (i.e. excluding ITER) are estimated to have added approximately £1 billion in Gross Value Added to the UK economy, between 2009/10 and 2018/19, supporting approximately 29,100 job years.
Impacts arising from UKAEA expenditure on contracts, raw materials and consumables, and other external expense account for approximately three-fifths (£587 million) of GVA to the UK economy, and approximately two-fifths (12,264 job years) of employment supported by UKAEA’s own activities.
£163 m -
£104 m
£31 m -
£1,299 m -
£413 m
£198 m
£390 m
£1,000 m
£260 m
£43 m
£1,407 m
£500 m £1,000 m £1,500 m £2,000 m
UKAEA staff expenditure
UKAEA contract expenditure
Other UKAEA expenditure on raw materials…
Total (excluding ITER)
F4E ITER contract expenditure
IO contract expenditure
Potential additional impact by spinoffs (ITER)
Total (including ITER)
GVA, £m
3,004 -
2,061
700 -
34,881 -
10,516
6,336
3,593
8,671
29,116
4,786
946
36,909
0 10,000 20,000 30,000 40,000
Staff employed by UKAEA (incl. hired staff)
UKAEA staff expenditure
UKAEA contract expenditure
Other UKAEA expenditure on raw materials…
Total (excluding ITER)
F4E ITER contract expenditure
IO contract expenditure
Potential additional impact by spinoffs (ITER)
Total (including ITER)
Employment, job years

The impact of the UK’s investments in UKAEA fusion research
7
Direct employment by UKAEA and hired staff accounts for a further 36% (10,516 job years) of employment supported by UKAEA’s own activities.
Finally, expenditure by UKAEA staff, accounts for approximately £413 million in GVA (41% of impacts arising from UKAEA’s own activities), supporting more than 6,300 job years (22%).
Additional impacts arising from contracts directly won by UK organisations for ITER, originally known as the International Thermonuclear Experimental Reactor, are estimated to be between £267.1 million and £363.7 million in Gross Valued Added to the UK economy, supporting between 5,065 and 6,846 job years.
Moreover, additional potential benefits of ITER spending, arising from spinoffs, are estimated to be between £31.3 million and £42.6 million in GVA, supporting between 700 to 946 job years.
Note that these figures only capture impacts arising from UKAEA and ITER UK contract (direct win) expenditures. Other non-monetised impacts are expected to bring significant additional value to the UK economy. For example, due to data limitations, the estimates do not capture contracts with other international fusion authorities (e.g. the US and India), ITER consortia contracts involving the UK and subcontracting opportunities.
Importantly, the figures also do not capture the significant contribution UKAEA has made to fusion research and adjacent technologies, which are very difficult to measure. As the scope of the study focused on benefits that have already materialised, the substantial potential future impact arising from working commercial fusion reactors is also not captured by the analysis.
Accounting for additionality – net economic impacts
Parts of the estimated benefits would likely have occurred even under a counterfactual scenario where UKAEA did not exist. In particular, UKAEA staff would likely have found employment elsewhere, public and private investment would have gone elsewhere, and UK companies may still have been awarded some ITER-related contracts.
There are good reasons to believe that the GVA with UKAEA would be greater than in a counterfactual scenario where UKAEA did not exist. These relate to market failures that UKAEA would have contributed to correcting. For example, investment in fusion power research would be subject to positive externalities leading to greater GVA in other sectors; and there may be skills mismatches in the counterfactual leading to a ‘productivity premium’ from working in/with UKAEA. However, the exact degree of additionality (percentage of gross GVA that would not have occurred in the counterfactual) is highly uncertain. As an illustration, assuming a 10% level of additionality, one million pounds of public investment in UKAEA would lead to a gross economic benefit of £0.4 million in GVA, indicating a net economic cost of £0.6m for every £1m invested by the UK Government. Note that this is simply a comparison of costs compared to economic returns to date from UKAEA fusion research. Much greater benefits from that research are expected to occur in the future, through further spillovers, and a contribution to the development and commercialisation of fusion power with its potentially transformative long-term public benefits of ‘de-carbonisation’ and energy security. A tipping point analysis shows an assumed additionality of around 30% is needed for the benefits to date to be greater than costs.
The impact of the UK’s investments in UKAEA fusion research
8
Scientific impact
UKAEA’s contribution to the understanding of fusion energy was identified to be significant, with UKAEA having increased the volume, quality and reputation of UK fusion and related research.
Among respondents to a survey undertaken for this study, 83% of respondents rated UKAEA’s contribution as very important; and 91% believed that UKAEA had a strong or very strong international standing. UKAEA published 2,590 fusion research papers in 2009-2018, contributing to 75% of the UK fusion research outputs2 in the same period. Moreover, UKAEA ranked as the third top institution in the world on the number of fusion research outputs and its fusion publications are 60% more likely to be cited than average in the same field, with the second highest field weighted citation impact score (1.6) only after ITER (1.7) in the world (see Annex 4: Scientific impact of Fusion Research in Culham – Bibliometric analysis).
UKAEA’s reputation within the fusion field is highlighted by Culham, in the late 70s, having been selected to host and operate the Joint European Torus (JET), which is still operating at Culham today. Over its lifetime, JET has significantly advanced fusion research in Europe and laid the groundwork for the next phase of European fusion experiments, the International Thermonuclear Experimental Reactor (ITER). JET was thus a key step towards large scale, commercially viable fusion power.
UKAEA also made significant contributions to the field of fusion research via its Small Tight Aspect Ratio Tokamak (START) and Mega Ampere Spherical Tokamak (MAST) projects, which were the first tokamak based fusion reactors to utilise a spherical tokamak design.
Indeed, stakeholders consulted for this study felt that, without UKAEA, the field of fusion research in the UK would likely be heavily fragmented with universities focusing on small scale experiments and with far less cooperation.
In addition to UKAEA’s contribution to fusion research, UKAEA’s impact also includes advances to “fusion-adjacent” technologies, such as the advancement of robotics and remote handling, the development of new materials and contributions to computing and artificial intelligence, among others.
Other unmonetised impacts
Other benefits identified in this study include, among others:
• improvements in skills leading to a higher skilled workforce; • knowledge transfer between UKAEA and UK Industry as well as academia; • improved fusion reactor designs, and the creation of regulatory standards for
fusion; • contributions to UK public policy and strategy; and, • contributions to public awareness of fusion, and attracting new talent to the fusion sector
via UKAEA’s outreach and public engagement activities.
2 This analysis used a predefined topic cluster ‘Magnetoplasma; Tokamak Devices; Plasmas’ in the Scopus database to capture various aspects of nuclear fusion research. This Topic Cluster is made up of 80 topics/key-phrases which were grouped by strong citation links.
The impact of the UK’s investments in UKAEA fusion research
9
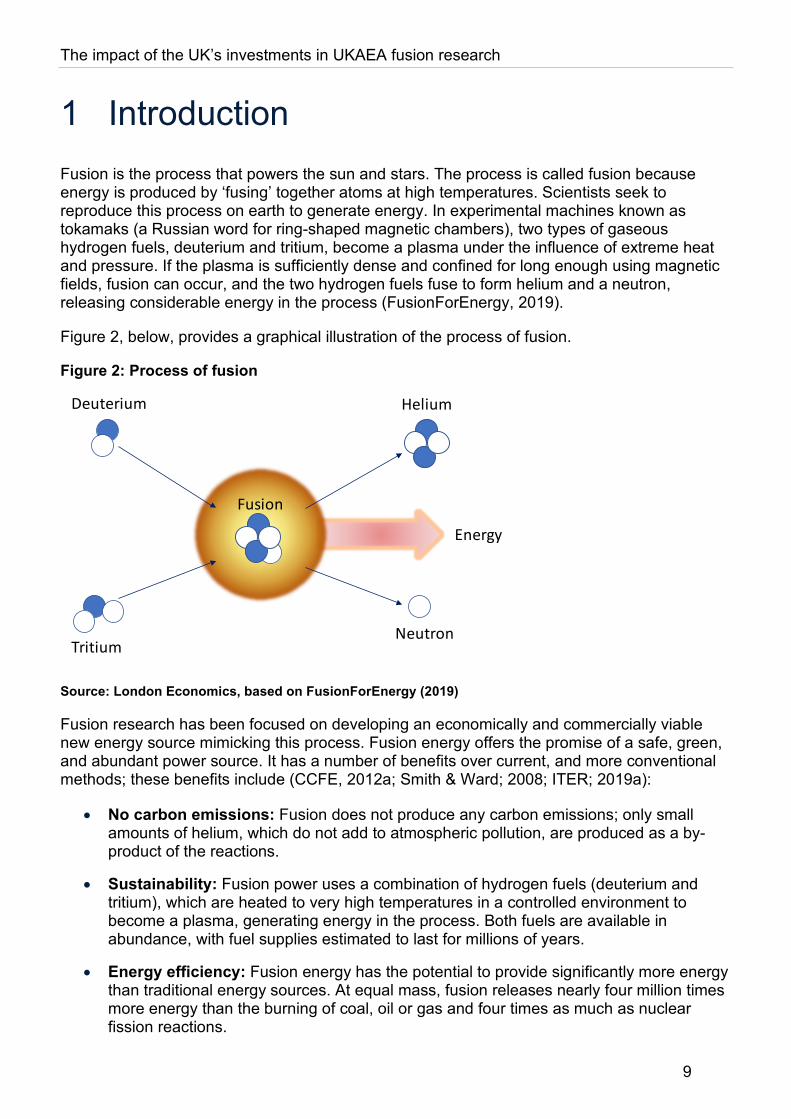
1 Introduction Fusion is the process that powers the sun and stars. The process is called fusion because energy is produced by ‘fusing’ together atoms at high temperatures. Scientists seek to reproduce this process on earth to generate energy. In experimental machines known as tokamaks (a Russian word for ring-shaped magnetic chambers), two types of gaseous hydrogen fuels, deuterium and tritium, become a plasma under the influence of extreme heat and pressure. If the plasma is sufficiently dense and confined for long enough using magnetic fields, fusion can occur, and the two hydrogen fuels fuse to form helium and a neutron, releasing considerable energy in the process (FusionForEnergy, 2019).
Figure 2, below, provides a graphical illustration of the process of fusion.
Figure 2: Process of fusion
Source: London Economics, based on FusionForEnergy (2019)
Fusion research has been focused on developing an economically and commercially viable new energy source mimicking this process. Fusion energy offers the promise of a safe, green, and abundant power source. It has a number of benefits over current, and more conventional methods; these benefits include (CCFE, 2012a; Smith & Ward; 2008; ITER; 2019a):
• No carbon emissions: Fusion does not produce any carbon emissions; only small amounts of helium, which do not add to atmospheric pollution, are produced as a by-product of the reactions.
• Sustainability: Fusion power uses a combination of hydrogen fuels (deuterium and tritium), which are heated to very high temperatures in a controlled environment to become a plasma, generating energy in the process. Both fuels are available in abundance, with fuel supplies estimated to last for millions of years.
• Energy efficiency: Fusion energy has the potential to provide significantly more energy than traditional energy sources. At equal mass, fusion releases nearly four million times more energy than the burning of coal, oil or gas and four times as much as nuclear fission reactions.
Fusion
Helium
Neutron
Energy
Deuterium
Tritium

The impact of the UK’s investments in UKAEA fusion research
10
• No long-lived radioactive waste: In contrast to nuclear fission, fusion does not produce long-lived radioactive waste, with radioactive materials safe to be recycled or disposed of within 100 years.
• Safety: Fusion does not require a chain reaction that is at the heart of safety concerns associated with nuclear fission. As such, large scale nuclear accidents are not possible.
• Reliability: Fusion power could provide a baseload energy supply at similar costs to that of a fission reactor.
However, substantial challenges remain to harnessing fusion as an energy source. In all experiments to date the amount of energy required to set off and sustain the reaction was larger than the amount of energy generated. The world’s largest tokamak ITER, currently being built in Southern France by 35 cooperating nations, including the UK, is set to be the first fusion experiment to produce a net energy gain. The breakthrough, expected in 2035, should pave the way for the first demonstration fusion power plant DEMO to produce electric power in 2050 (ITER, 2019b; European Commission, 2017).
Despite these challenges, UK investments in fusion research are expected to already be linked to several positive economic benefits. These include the creation of direct employment such as researchers and other staff; direct commercial benefits to UK industry deriving from working with, or being supported by, UKAEA; an increase in the volume and quality of UK fusion and related research; improvements in skills leading to a higher skilled workforce; as well as, improved fusion reactor designs; and the creation of regulatory standards for fusion.
In addition to these direct benefits, fusion research is expected to deliver spillover economic impacts, which arise when economic activities in one part of a market have effects elsewhere in the market. These spillovers can include market, network and knowledge spillovers (Choi et al, 2017; Bednyagin, 2007):
• Market spillovers refer to an increase in consumers’ welfare due to the reduction of costs of intermediate inputs or investment goods or the release of new, enhanced, or lower-cost technology (Gnansounou & Bebnyagin, 2007); an increase in innovation or competition can provide better prices and services for consumers (thereby increasing welfare).
• A network spillover refers to a situation where major innovation in one sector spurs growth, and consequently, innovation in a related sector. An example would be businesses related in fusion research expanding into adjacent industries such as manufacture of related materials.
• Knowledge spillovers refer to an increase in knowledge stock (such as publications and patents) and an increase in human capital (through PhD training or attracting skilled researchers for collaborations).
A recent study (Choi et al., 2017) examining the effects that the KSTAR (Korea Superconducting Tokamak Advanced Research) and ITER3 fusion projects had on participating enterprises provide examples of these effects. The study found that, for the 24 enterprises contributing towards these two projects, there was evidence of market spillovers in the form of a 19.1% average increase in sales; knowledge spillovers in the form of the
3 ITER was initially an acronym that stood for ‘International Thermonuclear Experimental Reactor’ but now means the Latin word for “the way”.

The impact of the UK’s investments in UKAEA fusion research
11
creation of 238 new jobs; and network spillovers with 62% of enterprises extending their businesses to other relevant technological fields. This suggests that participation in fusion-related projects can provide benefits beyond the benefits which fusion energy itself can provide.
Figure 3 provides an overview of the expected costs and benefits of the UK’s investments in UKAEA’s fusion programme. These will be explored in further detail during the course of this study. A more traditional logic map is provided in Annex 1: Logic map
Figure 3: Expected costs and benefits of UK investments in UKAEA's fusion programme
Note: (*) There is not a linear relationship between investments and impacts. Indeed, realised impacts may lead to further costs. Source: London Economics.

The impact of the UK’s investments in UKAEA fusion research
12
1.1 Study objectives and scope
The objective of this study is to provide an independent impact evaluation of the UK’s investment in UKAEA fusion research. The study looks at the costs and benefits of the UK government investment to date, as specified by BEIS.
Specifically, the study sought to:
• assess how fusion research and its associated infrastructure has benefited the UK, with a focus on scientific progress, scientific impacts, industry collaborations, and short-term economic impacts;
• provide case studies of direct and indirect impacts and spill overs from UK fusion research; and,
• identify the financial costs of UK fusion research and associated infrastructure.
Fusion research will lead to potential future benefits of improvements in technology readiness levels, and the associated transformative long-term public benefits of ‘de-carbonisation’ and energy security. These will be assessed by BEIS in future work. This evaluation alongside other evidence will inform future UK government policy relating to fusion research.
1.2 Approach and methodology
The study approach was based on a number of strands of research, summarised in Figure 4, and detailed below.
Figure 4: Overview of study approach
Source: London Economics.
First, a systematic scoping and mapping of the flow of costs and benefits of the UK’s investments in UKAEA fusion research was carried out.
In parallel to the identification and scoping and mapping of costs and benefits, a review of existing literature and datasets was carried out. This desk-based research focused on
Identification of costs and scoping and mapping of benefits
Map costs and benefits, over relevant time- period, for base-
case and counterfactual scenarios.
Online survey
Online survey with key stakeholders including industry experts, academics, businesses,
and other stakeholders.Quantitative assessment of socio-
economic benefits
Compare base-case and counterfactuals, estimate benefits, and sensitivity
analysis.
Results
Overall economic impact, scientific
impact and progress, and
environmental impacts.
Qualitative assessment of socio-economic benefits
Evaluation of benefits, which cannot be quantified.
Desk research and review of data
Identification and review of existing l iterature and datasets
on funding as well as background papers, reports and
other evidence on the socio-economic benefits and
economic impacts of nuclear fusion research on the UK.
Inception
Defining base-case and counterfactual scenarios, agreeing comparators, and
project management relationships
Focus groups and depth interviews
Focus groups and depth interviews with stakeholders
from UKAEA, industry, and academia.
Case studies
Case studies in the form of semi-structured interviews with
spin-offs/firms supported by CCFE
The impact of the UK’s investments in UKAEA fusion research
13
identifying data on funding as well as background papers, reports and other evidence on the socio-economic benefits and economic impacts of fusion research on the UK.
Third, an online survey to collect data and evidence from key stakeholders including industry experts, academics, businesses supported by UKAEA, and other key stakeholders was carried out. A total of 43 responses were received, including 13 from industry and 26 from academia (see Annex 3: Survey for further details).
Fourth, consultations with stakeholders were undertaken. These consultations were used to supplement, follow up on, and refine the information gathered in the online survey. The stakeholder consultations consisted of three parts:
• a focus group with stakeholders from UKAEA (4 participants from UKAEA); • a focus group with stakeholders from academia (3 participants from academia); • 9 depth interviews with stakeholders from industry, and 1 depth interview with UKAEA.
In addition to evidence gathering via the survey and stakeholder consultations, case studies highlighting UKAEA impact were developed. The aim of the case studies was to identify specific examples of spillover benefits to UK companies as well as UKAEA’s role in supporting these companies.
The final strand of the study synthesised the collected information and data to assess the costs and benefits of the UK’s investments in fusion research. This assessment included a quantitative assessment of UKAEA’s impact as well as a qualitative assessment of benefits.
1.3 Baseline and counterfactual
A key first step is to define the ‘baseline’ and ‘counterfactual’ scenarios which form the basis of the analysis. The socio-economic benefits and costs of the baseline scenario are assessed relative to the counterfactual.
The aim of the study was to understand the public and private financial costs and benefits of UKAEA’s fusion research programme. These costs and benefits form the baseline scenario. Benefits derived under the baseline scenario constitute the gross economic impact of the UK’s investments in UKAEA fusion research. To arrive at the net economic impact of the UK’s investments in UKAEA fusion research, the socio-economic benefits and costs of the baseline scenario are assessed relative to the counterfactual.
There are a range of potential alternatives that could be used as a counterfactual, however the Treasury’s ‘Green Book’ (HM Treasury, 2018) guidance suggests that a ‘do nothing’ option or a ‘do minimum’ option is used as a basis for judging other options.
The counterfactual scenario adopted in this study is a ‘do-nothing’ scenario. Under this scenario, the UK would not have invested in UKAEA fusion research at all:
• There is no UK Government money spent on UKAEA fusion research. • Services that rely on UK Government investment in UKAEA fusion or on the outputs of
fusion research that received this money are not provided. • In particular, the Culham centre would not have been opened, and UKAEA fusion
research at Harwell/Culham would not have taken place.

The impact of the UK’s investments in UKAEA fusion research
14
Even though this ‘no UKAEA’ scenario may not be realistic in practice (the implications of this counterfactual are explored in more detail in Section 7), it allows valuation of all benefits of the UK’s investments in UKAEA fusion research. The choice of the second option, where UKAEA provides a minimal set of core fusion services, would mean that the minimal set of core services would not have a value associated with them – only the services that are additional to that core would be valued. Moreover, given the high capital and operational costs of fusion research, even providing such a minimal set of core services would likely be associated with relatively high costs.
Other counterfactuals could have been considered. These could have included, for example, investment in alternative fusion technologies, or investing in alternative adjacent technologies such as robotics. These alternative counterfactuals were not used, as establishing robust estimates of these alternatives would have added significant complexity to the estimation. These complexities would have required harder to defend assumptions and would have been less robust than the simpler no UKAEA assumption.
1.4 Caveats and limitations
When undertaking impact evaluations of R&D investments, a range of challenges arise. As with all evaluations it is important to clearly state the limitations of the analysis. The analysis has been conducted using best practice methods, and where necessary best judgement to provide the most robust and fair estimates of benefits. Nevertheless, limitations exist and in this section the caveats and limitations of the analysis are set out.
The methodological annex describes in detail the overarching approach and rationale for the chosen methodology (Annex 2: Methodological annex).
• Pre-existing data on the benefits from fusion research were limited. To overcome this problem the study relies on primary data collection through an online survey, focus groups and interviews. These methods do suffer from issues such a non-representativeness (particularly when the sample size is small) and self-selection bias.
• The online survey received 43 responses in total, including 13 responses from industry. This is slightly more than the previous EPSRC Independent Review of Fission and Fusion (EPSRC, 2016), which received 41 responses. The online survey was also supplemented by focus groups and depth interviews. Nevertheless, due to the small sample size the estimates from the survey will necessarily have a degree of uncertainty.
• In accordance with the Terms of Reference for this study, the analysis of economic benefits was exclusively backward looking. Future potential benefits were not monetised. Most importantly, the study does not monetise the future potential benefits of improvements in technology readiness levels and potentially transformative long-term public benefits of ‘de-carbonisation’ and energy security. Further, given that commercially viable fusion power will not exist until the middle of this century at the earliest, it’d be very difficult to quantify the size of long-term fusion benefits.
• The study also did not monetise the significant contribution UKAEA has made to fusion research and adjacent technologies, which are very difficult to measure, but no less important. Benefits monetised in this study are therefore low when compared to the potentially significant benefits of increases in scientific knowledge and improvements in fusion technology readiness.

The impact of the UK’s investments in UKAEA fusion research
15
• Due to the data limitations, the study results should not be interpreted as a fully comprehensive assessment of the ROI on UK public investments in fusion. Rather, the results should be interpreted as providing confidence that public money invested in fusion has been well spent and has generated a wide range of benefits to the UK.
• Monetised benefits are based on input-output analysis using derived economic multipliers for ten high level sectors4. The analysis therefore assumes that supply chain patterns of UKAEA and ITER suppliers follow the same, or at least broadly similar, patterns as those for the high-level sectors. However, fusion supply chains may be different and these differences can reduce the robustness of the estimates for fusion specifically.
• The alternative was to use multipliers for more disaggregated sector definitions. However, this brought with it its own difficulties. First, high-level sector definitions for output had to be used in order to calculate multipliers for employment effects. This is because Office of National Statistics employment data is only available at the high-level sector definition. Further, allocating fusion firms to more disaggregated classifications with confidence would have been difficult and would have introduced further error. Therefore, on balance it was decided to undertake the analysis on the 10 high-level sector multipliers, Annex 2: Methodological annex. Therefore, provided benefit figures should be seen as best estimates acknowledging the uncertainties present in the analysis.
• Data on contract expenditure from UKAEA’s business ERP system only accounted for 40% of the reported spend in UKAEA annual accounts. This difference meant that only accounting for the impacts derived from the spend reported in the ERP system would underestimate the benefits of UKAEA’s contract spend. To overcome this problem, the analysis used economic multipliers for the general government, health & education sector to account for spending effects of UKAEA expenditure which were not accounted for in UKAEA’s business ERP system. While this is a pragmatic solution it does mean that the analysis assumes that the spending patterns of this expenditure follow the spending patterns of the government, health & education sector overall.
• The impact of ITER spend is most likely an underestimate of the true impact. This is due to a number of reasons including that data available on ITER contracts was only available for prime contractors and not for firms forming part of a consortia or sub-contractors. Therefore, the ITER impacts derived in this analysis should be seen as conservative estimates. A fuller discussion on this issue is provided in Section 5.4.
1.5 Structure of report
The remainder of this report is structured as follows:
• Section 2 outlines the key milestones of UK fusion research.
• Section 3 provides an overview of UKAEA income and expenditure data.
4 This choice was made for simplicity as well as to provide consistency between the output and employment estimates, for which data to derive multipliers did not exist at a very granular level. The ten aggregate sectors are: Agriculture; Production; Construction; Distribution, transport, hotels and restaurants; Information and communication; Financial and insurance; Real estate; Professional and support activities; Government, health & education; and, Other services.

The impact of the UK’s investments in UKAEA fusion research
16
• Section 4 discusses the main benefits of UKAEA’s fusion programme.
• Section 5 provides an analysis of the economic impact of UKAEA’s fusion programme.
• Section 6 provides a discussion of additionality and tipping point analysis.
• Section 7 discusses the implications of the “no UKAEA” counterfactual scenario.
• Section 8 provides an overview of UKAEA’s environmental impacts.
• Section 9 provides a forward-looking discussion of the opportunities for fusion energy.
• Section 10 provides concluding remarks and suggestions for further research.
Four annexes provide additional details:
• Annex 1: Logic map contains a logic map showing a graphical representation of the relationship between inputs, outputs and goals of UKAEA’s fusion programme.
• Annex 2: Methodological annex provides an overview of the methodology used in this study, and a discussion on the rationale for adopting this methodology and potential errors.
• Annex 3: Survey contains a copy of the survey questionnaire and a high level-analysis of the number of survey responses, as well as information on the compilation of the survey sampling frame.
• Annex 4: Scientific impact of Fusion Research in Culham – provides the bibliometric analysis on the scientific impact of UKAEA, carried out by BEIS.

The impact of the UK’s investments in UKAEA fusion research
17
2 Fusion research in the UK This chapter outlines the key milestones of UK fusion research, as well as economic benefits of fusion projects, to the local economy or UK businesses, that have been identified. Key milestones are summarised graphically in Figure 5. Additional benefits of UKAEA’s activities, identified so far, are discussed in Section 4.
Figure 5: UK fusion research: key milestones
Source: London Economics
2.1 Early period (50s/60s)
In 1946, the Atomic Energy Research Establishment (AERE) was established near Harwell to serve as the centre of UK Atomic research. Research at Harwell focused around nuclear fission technologies and included the establishment of new fission reactors such as GLEEP (Graphite Low Energy Experimental Pile) in 1947, as well as a pair of larger reactors DIDO & PLUTO.
Nevertheless, atomic research at Harwell also included the UK’s initial foray into fusion, though, from 1950, this research was kept secret (Carruthers, 1988). As a result, little evidence of the UK’s fusion programme at the time is available in the public domain. The classification of fusion research also meant that the possibility of collaboration between the UK, USA and USSR was minimised, with each nation working on their own, separate fusion research.5
The Harwell laboratory was home to the Zero Energy Thermonuclear Assembly (ZETA) experiment, which was the first large-scale fusion reactor established in the UK. ZETA was
5 This classification has made it difficult to source documents from this era.
c
UK Experiments
START
UK Construction
ZETA Operation
EU Experiments
EU Construction JET
JET Operation (Still operating)
MAST Operation
ITER
1954 1958 1968 1978 1983 1991 1997 1999 2013 2016
Early period (50s/60s) 70s to early 2000s Current and planned future
developments
MAST Construction
2024
DEMO
ITER Operation
2025
MAST - U Operation
2019
Comm
ercial Power Plant
STEP
ZETA MAST-U

The impact of the UK’s investments in UKAEA fusion research
18
also the largest and most powerful fusion reactor in the world (Braams & Stott, 2002, p. 50), and cost about US$1 million to construct (Seife, 2008). Due to the classification of fusion research, the project was classified from 1954 (when construction began) until its reveal in 1958. ZETA served as an important testing device for future developments in fusion until its decommissioning in 1968.
The establishment of AERE at Harwell had significant spillovers on the local community in the form of housing and employment. In the two decades following AERE’s inception in 1946, many residents coming to live in Harwell did so because of an association with the Harwell Laboratory, causing the local population to grow significantly (Hughes, 2003). By 1957, AERE’s workforce at Harwell totalled over 6,000 workers spread over nearly 100 buildings (Harwell Parish Council, 2019).
In 1954 the UK Atomic Energy Authority (UKAEA) was formed via royal assent of the Atomic Energy Bill, AERE was incorporated within UKAEA (National Archives, 1999). The Culham Centre for Fusion Energy (CCFE) was officially opened in 1965, by UKAEA, to serve as the new UK centre for fusion research, with research operations moving from Harwell (CCFE, 2012b).
Figure 6: Culham Science Centre
Source: © OpenStreetMap contributors; map licensed under the Open Data Commons Open Database License; cartography licensed under Creative Commons Attribution-Share-A-like 2.0. For more information see: https://www.openstreetmap.org/copyright
In 1969, researchers from Culham verified new Russian tokamak-based experiment results; this led to worldwide adoption of the tokamak into future fusion developments and experiments (CCFE, 2012c). The Culham site, pictured in Figure 6, remains the official site of public UK fusion research to the present day.

The impact of the UK’s investments in UKAEA fusion research
19
2.2 70s-early 2000s
Culham is currently home to the Joint European Torus (JET), a tokamak-based fusion reactor. JET was constructed between 1978 and 1983 and is still active today. At the time of construction, JET was the largest single project undertaken by the European Atomic Energy Community (EURATOM) and currently holds the world record for fusion output (Rebut et al, 1985).
Figure 7: Internal view of JET Figure 8: External view of MAST
Source: EUROfusion: CC BY 4.0 license Source: UKAEA © CCFE
A 1995 assessment of the impact of JET (Glasson et al., 1995) found that JET has provided a significant number of economic benefits and spillovers to the local Oxfordshire community. Specifically, as of 1994, JET provided a total of 875 jobs directly, constituting 7.7% of employment within the immediate OX14 postal area at the time. The majority of these were full-time, highly skilled jobs with salary levels well above average.
The assessment further found that JET households in the local area contributed greatly to the local economy, with total expenditure in Oxfordshire estimated to be between £17 million and £21 million per annum. In addition, annual project expenditure on contracts and orders was in the region of £30 million. Around £6 million of which was spent within Oxfordshire, bringing further benefits to local businesses and contractors.
Today, around 500 people are still employed at JET facilities. Moreover, around 350 European scientists, as well as many scientists from outside Europe, visit each year to conduct research (CCFE, 2012b). Total employment at Culham in 2018 stood at 1,130, accounting for approximately 5% of all employees within the OX14 postal area6, where Culham is located. Of the 1,130 staff at Culham, 787 were directly employed by Culham. The remainder are hired staff, the majority of which are used to carry out specialist work in UKAEA’s scientific facilities (UKAEA, 2018).
6 Based on ONS - 2011 Census data, obtained from www.nomisweb.co.uk. Includes the parishes of Abingdon, Radley, Culham, Clifton Hampden, Long Wittenham, Drayton, Sutton Courtenay, Milton, Appleford-on-Thames, and Little Wittenham.

The impact of the UK’s investments in UKAEA fusion research
20
Case study: Oxford Technologies
Oxford Technologies (OT), now part of Veolia Nuclear Solutions, are experts in remote handling for hostile environments. OT has its roots as contractors for the remote handling on the Joint European Torus (JET). The aim of JET was to assess the viability of fusion as a future energy source. Due to the hostile conditions inside the reactor, human access must be extremely limited and work is carried out using remote handling robotic systems wherever possible. OT’s founding members were contractors in the remote handling group at JET, which contributed significantly to their expertise in this area. In 2000, OT was registered as an independent limited company focusing on remote handling in hazardous environments. The knowledge and experience developed at JET meant that OT were able to quickly acquire new clients, at first mainly in fusion, followed by work in other related nuclear fields.
Today, OT- operate as ‘Veolia Nuclear Solutions (UK)’ and operate in three main markets: fusion, high energy physics, and nuclear decommissioning. Fusion work has remained a strength of OT since its foundation. For example, OT has been involved in the remote handling of ITER, the next large scale European fusion experiment, since its inception. Through this and other fusion contract work, OT have been able to feed their expertise back into the nuclear industry. Their work with fusion has also been instrumental in informing their work with high energy physics and decommissioning, demonstrated by OTL’s contribution in projects such as the Belgian Nuclear Research Centres’ MYRRHA project, a prototype nuclear reactor looking into the transmutation of nuclear waste.
In late 2015, OT started working with Japanese industry on the investigation and decommissioning of the damaged reactors at Fukushima Daiichi.
After the 2011 tsunami badly damaged the nuclear reactors, Japan began the extensive clean-up process. A particular challenge is the safe removal of the melted fuel from inside the reactors. OT’s ‘Robotic Boom’ technology, developed during its work in fusion remote handling, proved essential to provide a means to access the stricken reactor melted core through a 600mm port. The 18 degree-of-freedom robotic Boom has to reach almost 22m to supply tooling and sensors in the pitch black environment and so relies on the use of an advanced virtual reality simulation and scanners to plot a route.
OT’s work on the decommissioning of Fukushima is an important example of collaboration between UKAEA and the private sector. UKAEA’s remote handling and robotics test facility is hosting the full scale mock-up tests of the robotic Boom system, Dexter Manipulator and suit of tooling developed by OT prior to shipment of the system to Japan.
OT’s work at Fukushima further illustrates the leading role UK firms have in international challenges for remote applications in hostile environments.
Source: London Economics based on interview with Veolia (formerly Oxford Technologies)

The impact of the UK’s investments in UKAEA fusion research
21
In 1991, Culham became the centre of the innovative Small Tight Aspect Ratio Tokamak (START) project. START was the first tokamak based fusion reactor to utilise a spherical tokamak design (see Figure 9), which subsequently became the core tokamak design within the UK’s fusion strategy. Despite being a relatively low-cost device, mostly constructed from existing equipment, results from START surpassed expectations and confirmed the potential of spherical tokamaks (CCFE, 2012d).
Following the success of START, the Mega Ampere Spherical Tokamak (MAST) project was established. Similar to START, MAST was designed as a spherical tokamak-based reactor. Since becoming operational in 1999, MAST has provided a wealth of data and enabled many advances in key research areas such as plasma instabilities and start-up methods (CCFE, 2012e). Currently, there are 150 employees working on the MAST project, which has recently undergone a £50 million five-year upgrade. The upgraded MAST device is expected to begin the next round of operations in 2019 (CCFE, 2018; BIS, 2015, p. 10).
Figure 9: Spherical vs conventional tokamak
Source: UKAEA © CCFE
2.3 Current and planned future developments
Following on from the successful experiments at JET, the ITER project was developed. ITER is a worldwide collaboration between 35 different nations, including the UK, and will be based at Cadarache in France. ITER began construction in 2013 and is planned to produce 500 MW of power for 50 MW of inputted power. For comparison, the current world record, held by JET, is a production of 16 MW for 24 MW of injected power (ITER, 2019c).
ITER already provides significant economic benefits to the UK. Direct economic benefits for UK industry, in the form of contracts attributed to UK companies and institutions, totalled around €500 million7 (including F4E and IO contracts), with the possibility of additional business to the UK of up to €1 billion (HM Government, 2013, p. 65). The impact of ITER is explored in further detail in Section 5.4.
ITER is also a key step to Europe’s fusion roadmap towards large scale, commercially available fusion power. ITER is intended to provide a technical demonstration of large-scale fusion power. The outcomes and learnings from the ITER project will then feed into ITER’s planned successor the DEMOnstration Power Station (DEMO). The production and delivery of fusion electricity into the grid forms a key criterion for the DEMO project. Though DEMO will
7 Figure provided by BEIS based on data Townsend (2019) and data collected by DIT.

The impact of the UK’s investments in UKAEA fusion research
22
not yet reach the price of generation and output of commercial power plants, it is expected to form a major step towards the first commercial fusion power plants (EUROfusion, 2019a).
In October 2019, the UK Government officially announced its commitment of £220 million for the Spherical Tokamak for Energy Production (STEP) project8. STEP will be developing a plan for a commercially viable fusion power station in the UK. STEP’s aims include exploiting fusion energy beyond electricity production, delivering predictable net electricity greater than 100 MW, and ensuring tritium self-sufficiency.
8 The press release can be found here: <https://www.gov.uk/government/news/uk-to-take-a-big-step-to-fusion-electricity>
The impact of the UK’s investments in UKAEA fusion research
23
3 Income and expenditure on UKAEA fusion research
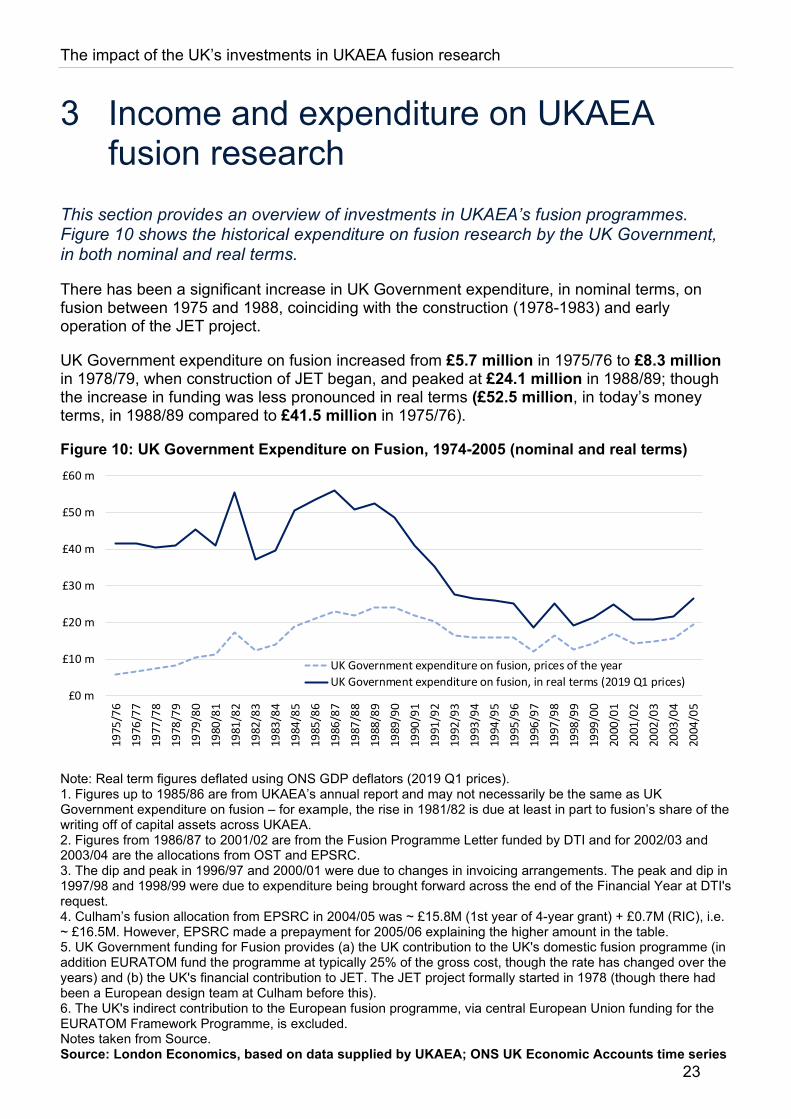
This section provides an overview of investments in UKAEA’s fusion programmes. Figure 10 shows the historical expenditure on fusion research by the UK Government, in both nominal and real terms.
There has been a significant increase in UK Government expenditure, in nominal terms, on fusion between 1975 and 1988, coinciding with the construction (1978-1983) and early operation of the JET project.
UK Government expenditure on fusion increased from £5.7 million in 1975/76 to £8.3 million in 1978/79, when construction of JET began, and peaked at £24.1 million in 1988/89; though the increase in funding was less pronounced in real terms (£52.5 million, in today’s money terms, in 1988/89 compared to £41.5 million in 1975/76).
Figure 10: UK Government Expenditure on Fusion, 1974-2005 (nominal and real terms)
Note: Real term figures deflated using ONS GDP deflators (2019 Q1 prices). 1. Figures up to 1985/86 are from UKAEA’s annual report and may not necessarily be the same as UK Government expenditure on fusion – for example, the rise in 1981/82 is due at least in part to fusion’s share of the writing off of capital assets across UKAEA. 2. Figures from 1986/87 to 2001/02 are from the Fusion Programme Letter funded by DTI and for 2002/03 and 2003/04 are the allocations from OST and EPSRC. 3. The dip and peak in 1996/97 and 2000/01 were due to changes in invoicing arrangements. The peak and dip in 1997/98 and 1998/99 were due to expenditure being brought forward across the end of the Financial Year at DTI's request. 4. Culham’s fusion allocation from EPSRC in 2004/05 was ~ £15.8M (1st year of 4-year grant) + £0.7M (RIC), i.e. ~ £16.5M. However, EPSRC made a prepayment for 2005/06 explaining the higher amount in the table. 5. UK Government funding for Fusion provides (a) the UK contribution to the UK's domestic fusion programme (in addition EURATOM fund the programme at typically 25% of the gross cost, though the rate has changed over the years) and (b) the UK's financial contribution to JET. The JET project formally started in 1978 (though there had been a European design team at Culham before this). 6. The UK's indirect contribution to the European fusion programme, via central European Union funding for the EURATOM Framework Programme, is excluded. Notes taken from Source. Source: London Economics, based on data supplied by UKAEA; ONS UK Economic Accounts time series
£0 m
£10 m
£20 m
£30 m
£40 m
£50 m
£60 m
1975
/76
1976
/77
1977
/78
1978
/79
1979
/80
1980
/81
1981
/82
1982
/83
1983
/84
1984
/85
1985
/86
1986
/87
1987
/88
1988
/89
1989
/90
1990
/91
1991
/92
1992
/93
1993
/94
1994
/95
1995
/96
1996
/97
1997
/98
1998
/99
1999
/00
2000
/01
2001
/02
2002
/03
2003
/04
2004
/05
UK Government expenditure on fusion, prices of the yearUK Government expenditure on fusion, in real terms (2019 Q1 prices)
The impact of the UK’s investments in UKAEA fusion research
24
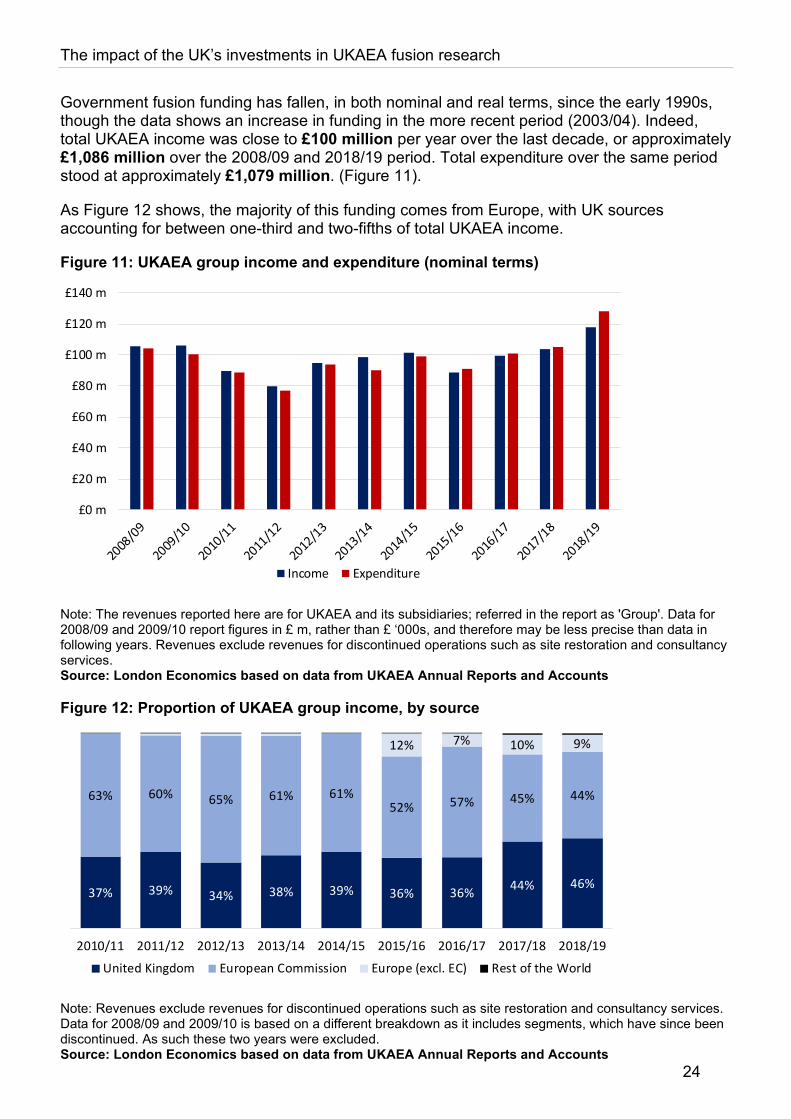
Government fusion funding has fallen, in both nominal and real terms, since the early 1990s, though the data shows an increase in funding in the more recent period (2003/04). Indeed, total UKAEA income was close to £100 million per year over the last decade, or approximately £1,086 million over the 2008/09 and 2018/19 period. Total expenditure over the same period stood at approximately £1,079 million. (Figure 11).
As Figure 12 shows, the majority of this funding comes from Europe, with UK sources accounting for between one-third and two-fifths of total UKAEA income.
Figure 11: UKAEA group income and expenditure (nominal terms)
Note: The revenues reported here are for UKAEA and its subsidiaries; referred in the report as 'Group'. Data for 2008/09 and 2009/10 report figures in £ m, rather than £ ‘000s, and therefore may be less precise than data in following years. Revenues exclude revenues for discontinued operations such as site restoration and consultancy services. Source: London Economics based on data from UKAEA Annual Reports and Accounts
Figure 12: Proportion of UKAEA group income, by source
Note: Revenues exclude revenues for discontinued operations such as site restoration and consultancy services. Data for 2008/09 and 2009/10 is based on a different breakdown as it includes segments, which have since been discontinued. As such these two years were excluded. Source: London Economics based on data from UKAEA Annual Reports and Accounts
£0 m
£20 m
£40 m
£60 m
£80 m
£100 m
£120 m
£140 m
Income Expenditure
37% 39% 34% 38% 39% 36% 36% 44% 46%
63% 60% 65% 61% 61%52% 57% 45% 44%
12% 7% 10% 9%
2010/11 2011/12 2012/13 2013/14 2014/15 2015/16 2016/17 2017/18 2018/19
United Kingdom European Commission Europe (excl. EC) Rest of the World

The impact of the UK’s investments in UKAEA fusion research
25
UK Government income accounted for approximately 83% of total UK income, on average over the last three financial years. (Figure 13)
Figure 13: Proportion of UKAEA UK income from UK Government (2016/17-2018/19 average)
Note: Records on UK Government income are only readily available from the implementation of UKAEA’s current ERP system (01/04/2016). Source: London Economics based on data from UKAEA
In terms of expenditure, staff costs accounted for more than half of expenditure, on average, between 2010/11 and 2018/19, followed by other external expenses (approximately 22% on average) and expenses on raw materials (approximately 19% on average). (Figure 14)
Figure 14: Proportion of UKAEA group expenditure, by source
Note: Excludes costs charged to provisions, revaluation adjustments and costs capitalised. (*) Excludes, in addition, other expenses as a small profit was reported. Data for 2009 and 2010 is based on a different breakdown as it includes segments, which have since been discontinued. As such these two years were excluded. Source: London Economics based on data from UKAEA Annual Reports and Accounts
Fusion research accounted for the almost all (90%) of UKAEA’s revenues and expenditures between 2010/11 and 2018/19. Property management accounted for approximately 4.8% of revenues and 3.7% of expenditure, on average, while other segments such as grant-in-aid
83%(£38m)
17%(£7m)
UK income from UK government UK income from other sources
54% 55%46% 51% 53% 53% 57% 58% 54%
19% 16%18%
18% 22% 18%21% 20%
18%
17% 22%22% 20%
22% 26%22% 21% 27%
10% 6% 13% 11% 4% 3%
2010/11 2011/12 2012/13 2013/14 2014/15 2015/16 2016/17* 2017/18 2018/19Staff costs Raw materials and consumables Other external expense Other expense

The impact of the UK’s investments in UKAEA fusion research
26
funding and insurance accounted for approximately 5.3% of revenues and 6.1% of expenditure, on average. (Figure 15 and Figure 16).
Figure 15: UKAEA revenue by segment, 2010/11-2018/19 average
Figure 16: UKAEA expenditure by revenue, 2010/11-2018/19 average
Note: Other segments include grant-in-aid funding and insurance. Data for 2009 and 2010 is based on a different breakdown as it includes segments, which have since been discontinued. As such these two years were excluded. Source: London Economics based on data from UKAEA Annual Reports and Accounts
Note: Other segments include grant-in-aid funding and insurance. Data for 2009 and 2010 is based on a different breakdown as it includes segments, which have since been discontinued. As such these two years were excluded. Source: London Economics based on data from UKAEA Annual Reports and Accounts
Furthermore, the UKAEA has also recently increased its expenditure in skills and talent investment, as shown in Figure 17. Over 2017-2019, this expenditure increased by 126% from £1.1 million to £2.4 million.
Figure 17: UKAEA expenditure in skills and talent investment, 2017-2019
Note: Data is only readily available from 01/04/2016, following the implementation of a new ERP system. Source: London Economics based on data from UKAEA Annual Reports and Accounts
Figure 18 provides a breakdown of UKAEA’s assets. Most of these represent investment properties in Harwell (almost £34 million, or 41% of all assets) and Culham (approximately £17 million, or 20% of all assets). UKAEA’s land and specialised buildings assets each represent 14% and 13% of all assets and are valued at £11 million each. Owner occupied
90%(£87m)
5%(£5m)
5%(£5m)
Fusion Research Property Management Other
90%(£88m)
4%(£4m)
6%(£6m)
Fusion Research Property Management Other
£0.0 m
£0.5 m
£1.0 m
£1.5 m
£2.0 m
£2.5 m
£3.0 m
2016/17 2017/18 2018/19
Expe
nditu
re in
£ m
illio
n
Skills and talent investment

The impact of the UK’s investments in UKAEA fusion research
27
buildings, plant & machinery and other assets also represent nearly 13% of all assets with a value of £11 million.
Figure 18: UKAEA Asset breakdown
Note: The category “Other” includes computer equipment, vehicles, furniture and fittings and infrastructure assets. Source: London Economics based on data from UKAEA Annual Reports and Accounts
Finally, Table 1 provides an overview of UKAEA JET-related income and expenditure over the 63-month period between January 2014 and March 2019.
Table 1: UKAEA JET-related income and expenditure, 01/01/14 to 31/03/19 Expenditure / income type Expenditure Income
Direct mission and employee salary costs £0.5 m
Direct staff costs £159.2 m
Other direct costs £92.0 m
Indirect costs £32.4 m
Radwaste construction, processing, and disposal costs
£14.2 m
Contribution by EC £315.0 m
Use of EFDA closing Funds 31/12/13 £6.2 m
Other sources of income £2.6 m
Total £298.4 m £323.8 m
Note: Other direct costs include Secondment Allowances (1st half 2014 only), Engineering departments (not including Electrical Eng.), Power Supplies & RF Heating Systems department, Tokamak & Neutral Beam Operations department, Electricity supply contracts, JET Diagnostics and plasma control, Computing + Integrated Modelling, Active Operations department , R/W Processing & Disposal, Assurance department, Admin Support, Refurbishments , D/T Preparations, JET Exploitation Unit Support. Indirect costs include Utilities, Site & Building Services, Overhead, Total Indirect Costs. Source: London Economics based on data supplied by UKAEA
£0 m
£5 m
£10 m
£15 m
£20 m
£25 m
£30 m
£35 m
£40 m
Investmentproperties in
Harwell
Investmentproperties in
Culham
Land Specialisedbuildings
Owneroccupiedbuildings
Plant &machinery
Other
Asse
t val
ue in
£ m
illio
n
Asset class
The impact of the UK’s investments in UKAEA fusion research
28
4 Impact of UKAEA’s fusion programme This section details impacts of UKAEA’s fusion programme that stretch beyond direct impacts on Oxfordshire’s economy or UKAEA’s income and expenditure. Among other things, this section looks at the impact of UKAEA’s programme on academia, industry and skills.
Section 2 and Section 5 highlight the benefits that UKAEA, the Culham Centre for Fusion Energy, the JET tokamak and ITER have brought to the Oxfordshire and wider UK economy. In addition to these benefits to the local community and businesses, the fusion programme encompasses a range of other activities, bringing significant additional impacts to the UK. UKAEA’s fusion programme has benefitted, among others, the science behind fusion, UK-wide industry, skill acquisition and the UK’s international standing in the field of fusion. These impacts are highlighted in more detail below.
4.1 Scientific impact
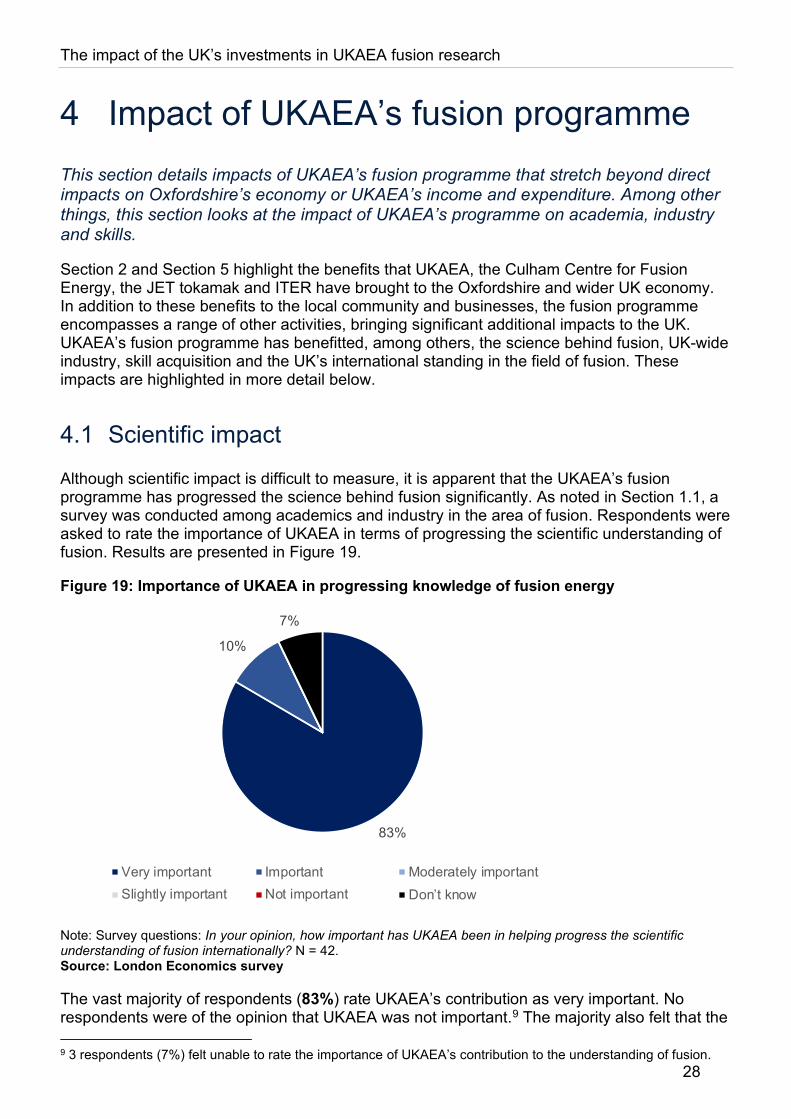
Although scientific impact is difficult to measure, it is apparent that the UKAEA’s fusion programme has progressed the science behind fusion significantly. As noted in Section 1.1, a survey was conducted among academics and industry in the area of fusion. Respondents were asked to rate the importance of UKAEA in terms of progressing the scientific understanding of fusion. Results are presented in Figure 19.
Figure 19: Importance of UKAEA in progressing knowledge of fusion energy
Note: Survey questions: In your opinion, how important has UKAEA been in helping progress the scientific understanding of fusion internationally? N = 42. Source: London Economics survey
The vast majority of respondents (83%) rate UKAEA’s contribution as very important. No respondents were of the opinion that UKAEA was not important.9 The majority also felt that the
9 3 respondents (7%) felt unable to rate the importance of UKAEA’s contribution to the understanding of fusion.
83%
10%
7%
Very important Important Moderately importantSlightly important Not important Don’t know

The impact of the UK’s investments in UKAEA fusion research
29
UKAEA has a strong standing in the international community, which will be discussed in more detail in Section 4.4.
A number of reasons were given as to why UKAEA is considered to have made an important contribution. Firstly, UKAEA hosts and operates the JET and MAST/MAST-U tokamaks, which have made important contributions to the understanding of fusion energy. Beyond that, it is recognised that the UKAEA and the Culham Centre for Fusion Energy (CCFE) are at the forefront of development of new and “fusion-adjacent” technologies. Examples include the advancement of robotics and remote handling, the development of new materials and contributions to computing and artificial intelligence. UKAEA’s contribution to these fields are discussed later in this section.
Less well known are procedural contributions of UKAEA to the scientific community. An example is the procedures developed by the UKAEA regarding waste resulting from fusion; this is important given that JET is currently the only tritium-fuelled tokamak in the world.
An analysis of the scientific output of UKAEA and CCFE provides a different perspective on the impact of the UK’s fusion programme. Table 2 shows impact measures for publications originating from the Culham Science Centre. This table is partially reproduced from BEIS (2019). It shows, for Culham’s largest five topic clusters, the number of publications in the last ten years and a measure for publication impact; the Field Weighted Citation Impact. The Field Weighted Citation Impact (FWCI) is calculated as the average number of citations for each publication, normalised to the world-wide average. Therefore, a FWCI of 1 indicates that publications are cited at the world average in the field. A FWCI larger than 1 denotes that publications are cited more than average.
Table 2: Culham Science Centre research activities by top five Topic Clusters, 2009-2018 (reproduced; partial)
Topic cluster Number of
publications % of Culham publications
Field Weighted Citation Impact
Magnetoplasma; Tokamak Devices; Plasmas
2,590 79 1.6
Microstructure; Steel; Austenite
99 3 2.3
Discharge; Plasma Applications; Plasma Jets
40 1 2.1
Magnetic Fields; Ionospheres; Sunspots
35 1 1.3
Secondary Batteries; Electric Batteries; Lithium Alloys
30 1 2.3
Note: FWCI for fewer than 100 publications is only indicative. Source: BEIS analysis of Scopus Database, Elsevier (2019)

The impact of the UK’s investments in UKAEA fusion research
30
Across its largest topic areas, the Culham Science Centre shows an above average impact on research. Publications stemming from its top fusion research cluster (Magnetoplasma; Tokamak Devices; Plasmas) are cited 60% more than the world-wide average in this field, only second to ITER research publications’ field weighted citation impact (1.7). The Culham Science Centre ranked third in terms of the number of fusion research outputs in the world. Culham Science Centre publications also show a strong standing internationally. This is discussed in more detail in Section 4.4 and Annex 4.
Given the scientific importance of the UKAEA, it should be noted that a minority of survey respondents (< 10%) feel that the CCFE has a too narrow focus. These respondents feel that the UKAEA focuses too much on tokamak-based technology at the cost of alternative or emerging technologies such as laser-based technology.
Development of adjacent technologies
As noted above, the scientific impact of UKAEA and CCFE reaches beyond fusion. For instance, fusion research has overlaps with materials research. In particular, there are overlaps between materials requirements for fission and fusion, with the 2018 EPSRC (2016) Independent Review of Fission and Fusion finding evidence that those synergies are already being recognised and exploited.
This overlap with materials research has also been recognised by the establishment of the Materials Research Facility (MRF), built in 2015 and part of the National Nuclear User Facility (NNUF) initiative, launched by the UK Government and funded by EPSRC. The MRF was established to analyse material properties in support of both fission and fusion research (CCFE, 2012f) as part of the National Nuclear User Facility (NNUF), an EPSRC-funded collaboration launched in line with the Government’s 2013 Nuclear Industrial Strategy (NNUF, n.d.).
Other adjacent technologies developed alongside fusion are robotics and remote handling. Development of these technologies is fostered by the Remote Applications in Challenging Environments (RACE) centre in Culham. This centre builds on the UKAEA’s expertise in remote handling experience of JET. RACE specialises in providing R&D in Robotics and Autonomous Systems (RAS). RACE’s initial developments involved development of robotic tools allowing JET operators to perform maintenance inside the reactor. RACE has since branched out into adjacent fields such as driverless vehicles, intelligent mobility, smart infrastructure and asset integrity management, advanced control systems, augmented reality and autonomous systems (Culham Science Centre, n.d.; RACE, 2018a).
RACE has grown rapidly since its initial announcement in 2014 and the opening of the facility in 2016, from approximately 40 to 160 robotics engineers with an operational budget of approximately £15 million per annum. Other areas of impacts stemming from RACE include a number of national and international collaborations including 13 university partners and 100 industry partners through UKRI-IUK collaborative R&D; as well as helping UK companies win international contracts including: partnering with UK companies in a number of multi annual F4E frameworks, worth approximately £210 million.10
10 Based on information obtained from UKAEA which is not publicly available.

The impact of the UK’s investments in UKAEA fusion research
31
Case study: Oxbotica and CAV research at Culham
Culham Science Centre is home to a newly constructed research facility, known as ‘Pit Lane’, for the research and development of connected and autonomous vehicles (CAV). This facility has been developed by RACE (Remote Applications in Challenging Environments), a UKAEA research centre for the development of robotics and autonomous systems.
Oxbotica is a robotics firm which was spun out from Oxford University in 2014. Oxbotica focuses on two pieces of software developed for autonomous driving. The first, titled Selenium, is referred to as the ‘brain’ of an autonomous vehicle. This software uses data from vehicle sensors to answer questions such as ‘where am I?’, ‘what’s around me?’ and ‘what do I do?’. The second software, Caesium, is a ‘cloud-based fleet management system’ used to coordinate multiple vehicles without human interaction.
Selenium and Caesium comprise Oxbotica’s software suite, which they market and deliver to provide autonomy for several different industries; this including air, land, sea and industrial purposes.
Prior to the construction of Pit Lane, the People in Autonomous Vehicles in Urban Environments (PAVE) consortium was established, in 2016, to determine the suitability of the Culham Science Centre as a test location for driverless vehicles and to assess public perception on driverless cars and autonomous vehicles. PAVE was comprised of Oxbotica, Amey, RACE, Siemens and Westbourne, and received £190,000 in funding from Innovate UK.
The addition of the Pit Lane facility builds upon Culham’s history and experience with robotic remote applications. Autonomous and driverless vehicles provide a route for RACE to provide a commercial and significant impact into the marketplace. Oxbotica, who have a base at RACE, now carry out their autonomous car testing on the Culham site. With RACE, firms such as Oxbotica and the introduction of the Pit Lane facility, the Culham centre has continued to cement itself as a hub for advanced technologies, especially regarding CAV.
Sources: London Economics based on: (1) Culham Science Centre (2019), Culham Science Centre unveils new facility to support driverless
car technology, viewed 13th August 2019, <http://www.culham.org.uk/new-facility-to-support-driverless-car-technology/>.
(2) RACE (2016), What is Pave?, viewed 13th August 2019, <http://www.race.ukaea.uk/projects/pave-autonomous-vehicles/#1467126452564-188c641d-bee7/>.
(3) UKRI (2016), PAVE: Gateway to research: People in Autonomous Vehicles in Urban Environments: Culham City (Grant details), viewed 13th August 2019, <https://gtr.ukri.org/projects?ref=132276/>.
(4) Hull, L (2013), The car that drives itself…using an iPad! Oxford University unveils robot car, mailOnline, viewed 13th August 2019, <https://www.dailymail.co.uk/sciencetech/article-2278725/The-car-drives--using-iPad-Oxford-University-unveils-robot-car.html#ixzz2KtzUvWhy/>.
(5) Innovate UK, UKRI, CCAV (2019), Oxbotica: AI firm develops ‘brain’ for autonomous vehicles, viewed 13th August 2019, <https://www.gov.uk/government/case-studies/oxbotica-ai-firm-develops-brain-for-autonomous-vehicles/>.
(6) Oxbotica, What We Can Do, viewed 13th August 2019, <https://www.oxbotica.com/what-we-can-do/>.

The impact of the UK’s investments in UKAEA fusion research
32
Related to robotics are Artificial Intelligence (AI) and Computing. With regards to AI, the Robotics and AI in Nuclear (RAIN) hub was created with the purpose of utilising adjacent technologies to solve nuclear problems. RAIN is a collaborative project between seven universities and RACE, funded by the Industrial Strategy Challenge Fund (ISCF), part of the government’s modern Industrial Strategy. Although it is focused on nuclear applications of robotics, it is expected that developments will have applications in other fields, such space exploration, mining and healthcare, local transport, housing, and many other fields.
Computing is driven forward by UKAEA and CCFE due to the computational requirements for theoretical simulations of plasma and data analysis. The UKAEA is a partner in a European consortium to develop so-called exascale computing (European Commission, 2018). This refers to computing systems that can handle at least a trillion calculations per second and can analyse exabytes of data11.
The UKAEA has also made substantial contributions to scientific engineering through its Special Techniques Group (STG). The STG, established in the 1970s, specialises in joining materials. The STG has been instrumental in building the JET and MAST/MAST-U tokamaks and are also involved in developing diagnostic windows for ITER.12
Lastly, the new Hydrogen-3 Advanced Technology (H3AT) centre of excellence will drive further developments in the processing and storage of tritium, while the new Fusion Technology Facilities (FTF) will provide equipment to perform mechanical, hydraulic and electromagnetic tests on prototype components under the conditions experienced inside fusion reactors. Together these facilities are expected to create around 100 jobs at Culham as well as further jobs in the wider nuclear industry supply chain (CCFE, 2017).
4.2 Industrial impact
Beyond the scientific impact, UKAEA and CCFE have generated substantial benefits for the UK’s industry. Some of the industrial impact directly relates to fusion energy, but – as Section 4.1 above highlights – the UKAEA and CCFE’s reach extends beyond that into adjacent technologies.
The industrial impact of UKAEA’s fusion programme can be broadly grouped as follows:
• spinouts from fusion research;
• companies located on the Culham campus using its infrastructure and/or knowledge base; and,
• UKAEA support to industry to win contracts.
11 One exabyte is the equal to 11.8 billion DVDs. 12 Based on information obtained from the UKAEA which is not publicly accessible.
Source: UKAEA © CCFE
Figure 20: Remote Handling Control Room at JET

The impact of the UK’s investments in UKAEA fusion research
33
These are addressed in turn below.
A spinout is a company that has split off from another organisation. In the context of fusion research, this typically refers to organisations set up to commercialise academically developed technology, for instance at universities or the Culham Centre for Fusion Energy.
An example of a fusion-focused spinout is Tokamak Energy. Tokamak Energy grew out of Culham in 2009 with the aim of designing and developing small spherical tokamaks, intended to deliver electricity into the grid by 2030 (Tokamak Energy, 2019).
First Light Fusion provides another example of a private company working on fusion research. First light fusion spun out from the University of Oxford in 2011, exploring different and innovative approaches to delivering fusion power (First Light Fusion, 2019a, b).
Case study: First Light Fusion
First Light Fusion spun out from the University of Oxford in 2011. First Light’s goal is to attain affordable electricity production through the process of Inertial Confinement Fusion. Inertial Confinement is an alternative approach to Magnetic Confinement Fusion, the approach pursued by UKAEA and ITER.
Inertial confinement is pursued by many laboratories worldwide, perhaps most notably in the National Ignition Facility in the US.1 In contrast to magnetic confinement, inertial confinement does not use a magnetic field for confinement of the plasma. Rather inertial confinement is a pulsed process usually using a laser as the main driver for fusion. First Light is pursuing a unique approach to inertial confinement, utilising high-powered projectiles instead of lasers. First Light believe that their unique approach will be a thousand times cheaper, per joule of delivered energy, and a hundred times more energy efficient, when compared to using lasers.
The focus and main business model of First Light is on the development, marketing and distribution of the high velocity projectile delivery used in their inertial confinement experiments, and the fuel pellets which the projectile impact. Given their unique approach, First Light has so far been able to acquire around £25 million pounds of private equity investments2.
Despite the different approaches to fusion, work undertaken by First Light and UKAEA have many complementarities, which result in knowledge and research spillovers from UKAEA’s broad range of activities; for example:
• One source of spillovers are projects such as the H3AT (Hydrogen-3 Advanced Technology) centre. This Culham-based centre provides a location with advanced tritium infrastructure allowing for the advancement of tritium-related technology as well as providing facilities for the feed, recovery, storage and recycling of tritium.3 As both inertial and magnetic confinement require tritium, any advances in tritium science benefit both First Light and UKAEA, as well as the wider fusion community.
• First Light are also directly collaborating with UKAEA and a major engineering company on the development of a ‘fusion island’. The fusion island concept refers to a sub-

The impact of the UK’s investments in UKAEA fusion research
34
system which would convert fusion energy to heat, as well as manage fuel supply in a fusion power plant.4 This sub-system is required for a commercially viable fusion power plant to function and is therefore an important step towards commercialisation. The UKAEA part of this project is funded by the BEIS Energy Entrepreneurs Fund and provides another example of complementarities between UKAEA and private fusion research.
Recently, First Light have finished the construction and testing of their pulsed power device, Machine 3 (pictured above). Machine 3 is the largest pulsed power machine of its kind in the world. This machine will be used for the delivery of high velocity projectiles used in First Light’s inertial confinement experiments and marks an important step towards a commercial inertial fusion reactor.
Sources: London Economics based on interview with First Light Fusion, and (1) First Light Fusion, viewed 12th August 2019, <https://firstlightfusion.com/> (2) Crunchbase, First Light Fusion, viewed 12th August 2019,
<https://www.crunchbase.com/organization/first-light-fusion#section-overview/> (3) UKAEA (2017), H3AT – a world leader in tritium innovation, UKAEA (4) World Nuclear News (2018), Fusion reactions project attracts UK funding, viewed 12th August
2019, <http://world-nuclear-news.org/Articles/Fusion-reactions-into-energy-project-attracts-UK-f/>
OC Robotics is a spinout focused on snake-arm robots for use in hazardous and confined spaces in the nuclear sector as well as in aerospace, construction and petrochemicals. OC Robotics was established by Rob Buckingham, who had initially started his career at Culham. In 2014, Rob returned to Culham as director of the newly established RACE centre. This spinoff is evidence of technology originally used for nuclear applications, spilling over and benefiting other industries. (OC Robotics, 2014; RACE, 2018b)
Another impact of the UKAEA on businesses is through its Culham campus. The site is home to over 20 businesses providing services as diverse as stored energy solutions, architectural services, healthcare equipment, aerospace engine technology, software consultancy and weight loss.13 In addition, the site houses the Culham Innovation Centre - providing workspace, laboratory space and business advice and support to entrepreneurs - the national nuclear laboratory, as well as a nursery and preschool.
An example of business located on the Culham site is Reaction Engines. Reaction Engines is a British aerospace company developing the so-called Synergetic Air-Breathing Rocket Engine, or SABRE. This engine attempts to combine the capabilities of jet and rocket engines. The company is based at the Culham Science Centre. (Reaction Engines, 2018)
An example of a company using the infrastructure of the Culham campus is Latent Logic in cooperation with, among others, RACE and the Ordinance Survey (OS). The project team is building a digital model of real-world roads in Culham. This model will be used to simulate the behaviour of Connected and Autonomous Vehicles (CAV). Learnings from simulations will then be used in real-world CAV testing. Latent Logic chose Culham since the site is compact and already used for trials with CAV. As such, the infrastructure at Culham provides a suitable testing ground for UK industry.14
13 See Culham Business Directory for an overview of companies located at the site: <http://www.culham.org.uk/directory/> 14 Based on information obtained from the UKAEA which is not publicly accessible.

The impact of the UK’s investments in UKAEA fusion research
35
Lastly, the UKAEA’s fusion programme helps UK industry win international contracts related to fusion energy. For example, the UKAEA has helped UK companies win contracts to work on ITER.
Survey respondents also provided a number of examples of the UKAEA fusion programme helping them win contracts. UKAEA has made available its expertise to industries, for instance by providing engineers during contract bidding, or by reviewing and providing inputs to bids. It has facilitated contact between UK industry and fusion research bodies in need of services. Lastly, attaching the reputation of UKAEA and CCFE to a bid, for instance through recommendation letters, increases the bid’s credibility and with that increases the chance of winning the contract.
It should be noted, however, that the relationship between UKAEA and industry may at times be difficult. One interviewee highlighted that the UKAEA is not always willing to share their knowledge. The interviewee observed that trust and confidence need to be built first.
4.3 Impact on skills
The UKAEA’s fusion programme has had a significant impact on skills in the UK. Through its training programmes, its reputation and its outreach, it has managed to train and attract many skilled scientists and engineers. These impacts are detailed below.
UKAEA’s teaching programmes can be grouped into academic training and apprenticeships. These training programmes form part of UKAEA’s commitment to train and develop a strong fusion-related skills base.
UKAEA currently contributes to funding for key professorships and PhD studentships at 16 UK universities, with 18 new PhD students who started in 2017/18 (UKAEA, 2018). Funding for PhD students is especially vital. Survey respondents appreciated the fact that the UKAEA and CCFE host PhD students, and that some positions could not be offered without collaboration with the CCFE.
UKAEA also provides placements, ranging from a few months to a year. In 2017, UKAEA provided placements for 42 undergraduate and masters students from 19 universities. Placement areas include tokamak science projects as well as projects linked to RACE, Tritium Science and Engineering and the Power Academy, an Institution of Engineering and Technology (IET) scholarship programme aimed at helping industry meet needs for electrical and power engineering graduates, in which UKAEA is a partner (UKAEA, 2018).
UKAEA has relationships with several doctoral training centres, most importantly the Fusion Centre for Doctoral Training (Fusion CDT). Fusion CDT is a doctoral training centre, formed via a collaboration between five universities Durham, Liverpool, Manchester, Oxford & York, and located at the York Plasma Institute. Between 2014 and 2018, Fusion CDT will have trained at least 77 PhD students, over 5 intakes, in disciplines related to fusion energy (Fusion CDT, 2019). In addition to access to Culham, students also have access to facilities such as the Central Laser Facility at the Rutherford Appleton Laboratory, and facilities in areas ranging from advanced materials to high performance computing. EUROfusion rated the UK fusion education programme, and particularly the CDT, as the best in Europe in 2016 (Fusion CDT, 2016), although its funding has since been ceased.
“Several of our PhD projects are collaboratory with CCFE. Without this support it is likely that we [would] not be in a position to offer these projects, or attract 'first class' candidates to them.”
– Survey respondent

The impact of the UK’s investments in UKAEA fusion research
36
The case study below provides further information on the synergies between fusion research, advanced manufacturing, and spacecraft propulsion highlighted via research undertaken at the York Plasma Institute.
Case study: Negative ion plasma research at York Plasma Institute: From fusion heating systems, through advanced manufacturing, to spacecraft propulsion
At first sight it is difficult to see the link between the systems that heat fusion plasmas to ten times the temperature at the centre of the sun; the development of next-generation semiconductor devices – a multi-billion pound industry, and propulsion systems for spacecraft. The answer is to be found in research being performed by the Low Temperature Plasma group of the York Plasma Institute at the University of York – the physics of negative ions in plasmas, which spans all three of these high impact sectors for the UK economy and society.
• The next generation of fusion devices, including ITER, require efficient negative ion plasma sources to seed the high energy particle beams that will heat the fusion fuel to over one hundred million degrees centigrade. Understanding the production processes of negative ions for such extreme heating systems is key to optimising their design, supporting a pathway to the commercial viability of fusion energy.
• In advanced manufacturing, the development of next-generation semiconductor devices relies upon the precise control of low-temperature plasma chemical kinetics, including negative ions. The application of advanced low-temperature plasma diagnostic instruments to measure the production of important species, including negative hydrogen ions, is critical for validating numerical simulations. These simulations can, in turn, guide the design of advanced plasma sources to optimise modern manufacturing processes with huge societal and economic impact.
• Turning to spacecraft, electric propulsion has been identified by the UK Government as an important growth area, contributing to its goal of reaching 10% of the global space economy by 20301. Ion thrusters are an established method for the electric propulsion of satellites. Our research into negative ion sources, important for developing next-generation concepts including those that leverage alternative propellants, is based on a low temperature plasma which shares strong similarities (plasma production and ion extraction) with that of the anticipated ion source for the ITER neutral beam heating systems.
The EPSRC Centre for Doctoral Training in the Science and Technology of Fusion Energy (Fusion CDT), led by York Plasma Institute, is a key driver for enabling our exploitation of these synergies.
Source: York Plasma Institute, University of York; (1) “Government Response to the UK Space Innovation and Growth Strategy 2014-2030 Space Growth Action Plan” (2014) https://www.ukspace.org/wp-content/uploads/2019/04/Government-Response-Space-Growth-Action-Plan.pdf For more details please contact: Dr James Dedrick: [email protected] Prof Timo Gans: [email protected] Website of the York Plasma Institute: https://www.york.ac.uk/physics/ypi/ Website of the Low Temperature Plasma research strand: https://www.york.ac.uk/physics/ypi/research/ltp/ Website of the Fusion CDT: www.fusion-cdt.ac.uk

The impact of the UK’s investments in UKAEA fusion research
37
UKAEA also runs a two-week summer school providing an introduction to plasma physics through lectures and visits to the Culham and Harwell site.15 The summer school is aimed at students finishing their bachelor or starting their master’s degree.
UKAEA’s apprenticeship programme is noteworthy. Since 2005, the scheme has trained over 70 technical and support staff, with close to 100% of apprentices converting to employment at Culham. A small number of technical apprentices were also trained for industry. 16 The scheme allows UKAEA to recruit into generalist fusion engineering roles, which were previously difficult to fill (BIS, 2015) and thus allow UKAEA to address a critical skills need. In September 2017, a record number of 15 apprentices started on the UKAEA Apprenticeship Scheme (UKAEA, 2018).
More recently, UKAEA has introduced a new apprenticeship scheme, the Oxfordshire Advanced Skills (OAS) training centre, which offers training for both UKAEA as well as apprentices working for businesses in the local area in fusion and other high-tech sectors. Phase 1 of the OAS project was completed in 2016, with the facility training 32 apprentices in 2017. Phase 2 of the project is expected to be completed in September 2019, with the new facility expected to train up to 125 apprentices per year. (UKAEA, 2018; OAS, 2019)
Both the UKAEA apprenticeship and the OAS training centre are of great value. Survey respondents clearly valued their existence stating that UKAEA is training future engineers which are highly needed, not only for fusion technology but also beyond.
Beyond its teaching and training programmes, the UKAEA attracts and develops skills through its reputation. Fusion energy research in and of itself already draws in skills. It provides a “noble mission” in the form of creating an abundant, clean and safe energy source. This noble
mission draws in talented people with a strong will to help humanity.
UKAEA in particular is able to leverage this attraction of the “noble goal” based on its reputation. As Section 4.4 below reveals, the UK fusion energy research programme is well regarded internationally. This reputation allows the UK to draw on international scientists and students. International students may decide to stay in the UK after the completion of their degree, increasing the pool of skills and knowledge in the country. Indeed, one survey respondent reported that without UKAEA, they – and many others – would not have found their way to the UK.
Lastly, UKAEA impacts the UK skill level through its outreach programmes. As discussed in more detail in Section 4.5, the UKAEA organises outreach activities for secondary school students. One goal of this programme is to enthuse children into moving into STEM (Science, Technology, Engineering and Mathematics) fields. According to focus group participants, the UKAEA and CCFE is particularly well suited for this as they have the facilities that can be used for “show and tell”.
15 https://culhamsummerschool.org.uk/ 16 Based on information obtained from UKAEA which is not publicly available.
In response to a question asking about a scenario in which fusion research is not funded and the UKAEA would not exist:
“As I came to the UK specifically to conduct research in this field after earning my PhD […], in all likelihood I would not have moved here. Since the same can be said for a large number of some of the best international scientists in the field, the UK would not be nearly as attractive for highly skilled researcher or academic workers […].”
– Survey respondent

The impact of the UK’s investments in UKAEA fusion research
38
4.4 International leadership
As noted previously, the UKAEA has a strong international standing. Figure 21 shows the opinions of the survey respondents regarding UKAEA’s international standing. The vast majority (91%) of respondents believe that UKAEA has a strong or very strong international standing. Only 7% feel that its standing is only average, and no respondents feel that the UKAEA has a weak standing.17
Figure 21: Standing of UKAEA in fusion research relative to other key fusion countries
Note: Survey question: How would you rate UKAEA’s standing in fusion research relative to other key fusion countries? N = 42. Source: London Economics survey
As noted in the previous section, the international reputation of the UKAEA has been a draw for scientists and students to come to the UK. This is a testament to its reputation in international academia. The UKAEA’s international reputation is further demonstrated by analysing its publication output. Table 3 partially reproduces a comparison between the Culham Science Centre and the German Max Planck Institute for Plasma Physics (IPP) from a study conducted by BEIS. IPP is the closest comparator with Culham on the international stage.
Table 3: Impact and publications by IPP and Culham, 1996-May 2019
Number of publications
Field Weighted Citation Impact
Number of publications per £m Govt funding
Culham Science Centre 6,303 1.79 5.7
Max Planck Institute for Plasma Physics (IPP)
9,173 1.76 4.7
Note: data for 2019 is incomplete in Scopus (note as in the original report) Source: BEIS analysis of Scopus database, Elsevier (2019), BEIS/EPSRC funding (excl. Industrial Strategy Challenge Fund) and IPP published funding sources for 2018
17 1 respondent (2%) felt unable to rate the UKAEA’s international standing.
81%
10%
7% 2%
Very strong Strong Average Weak Very weak Don’t know
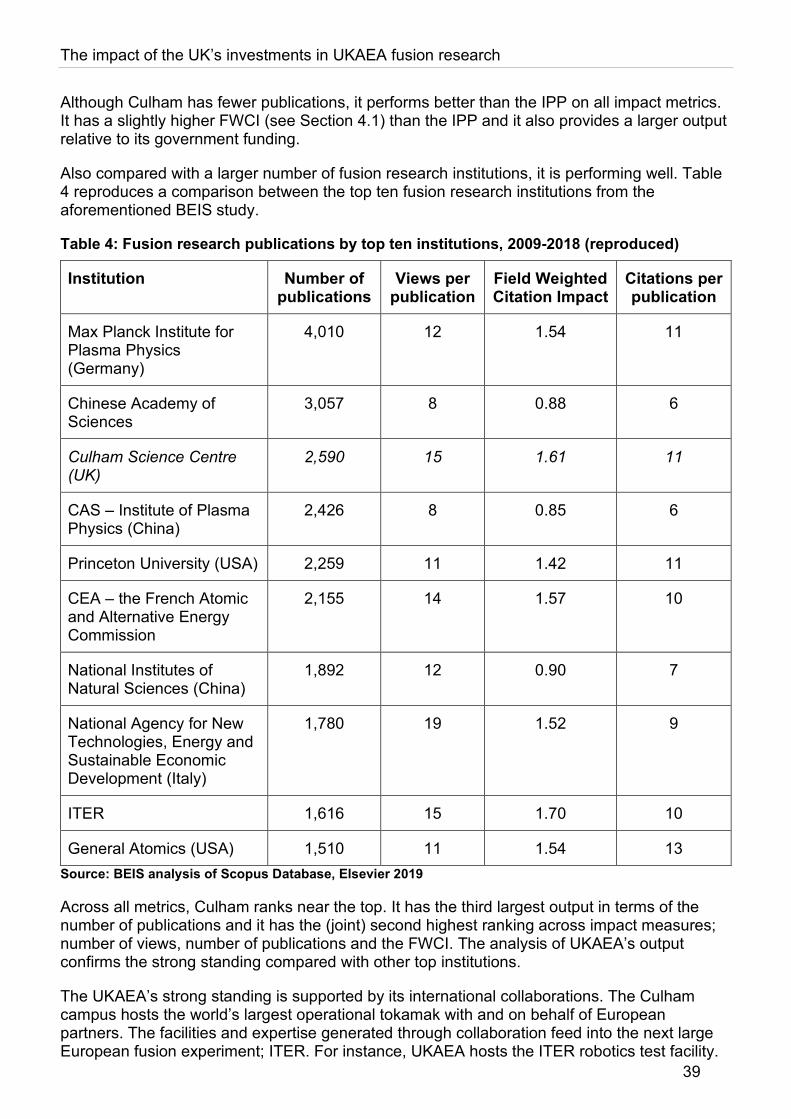
The impact of the UK’s investments in UKAEA fusion research
39
Although Culham has fewer publications, it performs better than the IPP on all impact metrics. It has a slightly higher FWCI (see Section 4.1) than the IPP and it also provides a larger output relative to its government funding.
Also compared with a larger number of fusion research institutions, it is performing well. Table 4 reproduces a comparison between the top ten fusion research institutions from the aforementioned BEIS study.
Table 4: Fusion research publications by top ten institutions, 2009-2018 (reproduced)
Institution Number of publications
Views per publication
Field Weighted Citation Impact
Citations per publication
Max Planck Institute for Plasma Physics (Germany)
4,010 12 1.54 11
Chinese Academy of Sciences
3,057 8 0.88 6
Culham Science Centre (UK)
2,590 15 1.61 11
CAS – Institute of Plasma Physics (China)
2,426 8 0.85 6
Princeton University (USA) 2,259 11 1.42 11
CEA – the French Atomic and Alternative Energy Commission
2,155 14 1.57 10
National Institutes of Natural Sciences (China)
1,892 12 0.90 7
National Agency for New Technologies, Energy and Sustainable Economic Development (Italy)
1,780 19 1.52 9
ITER 1,616 15 1.70 10
General Atomics (USA) 1,510 11 1.54 13 Source: BEIS analysis of Scopus Database, Elsevier 2019
Across all metrics, Culham ranks near the top. It has the third largest output in terms of the number of publications and it has the (joint) second highest ranking across impact measures; number of views, number of publications and the FWCI. The analysis of UKAEA’s output confirms the strong standing compared with other top institutions.
The UKAEA’s strong standing is supported by its international collaborations. The Culham campus hosts the world’s largest operational tokamak with and on behalf of European partners. The facilities and expertise generated through collaboration feed into the next large European fusion experiment; ITER. For instance, UKAEA hosts the ITER robotics test facility.

The impact of the UK’s investments in UKAEA fusion research
40
The international focus through collaborations is also confirmed by the analysis of research output conducted by BEIS (2019). More than 80% of the publication output of the Culham Science Centre is though international collaborations. This internationally collaborative output attracts more citations and has a higher FWCI than any other class of publications by the Culham Science Centre.
Despite its international standing, one interviewee noted a lack of coordinated effort among top fusion countries, possibly leading to duplicated research in fusion-related technology.
4.5 Other impacts
The UKAEA’s fusion programme has impacts that do not fit comfortably in the previous sections. This section highlights some impacts in terms of attracting funding, regulation, outreach and access to expertise generated by UKAEA.
The UKAEA manages to attract funding for fusion research that otherwise would not have gone to the UK. Focus group participants noted, for instance, that UK Government funding of the UKAEA has been leveraged to obtain more funding from Europe. Indeed, more than half of UKAEA’s funding comes from Europe and in particular the European Commission (Figure 12 in Section 3)18. Universities also benefit. Collaboration between universities and the UKAEA allow universities to leverage EUROfusion funding for enabling research, including research on JET and medium sized tokamaks, educational support and post-doctoral fellowships.
The UKAEA is also helping to define regulatory standards for fusion energy. Unlike fission, no UK or international regulatory framework currently exist for fusion power plants. In order to change this, UKAEA is committed to working with regulatory bodies over the next two years to develop a strategy for fusion regulation. (UKAEA, 2019) This would, for instance, include developing licencing regulation and agreements for commercially exploited fusion reactors.
As mentioned previously, UKAEA undertakes a number of outreach and public engagement activities. Outreach programmes to connect with the general public include visits to science festivals, Open Days and Open Evenings, as well as UKAEA’s Sun Dome project. The Sun Dome project is a science roadshow aimed at students in Years 5 and 6. It shows how scientists at Culham are using the fusion processes occurring on the Sun to generate electricity on earth. The roadshow uses movies, interactive role play and an inflatable dome. As noted before, one aim of this programme is to enthuse school children to fusion. In 2017/18, almost 3,000 young people either saw fusion research at Culham or took part in a Sun Dome school workshop, with over 10,000 children having visited the Sun Dome since its launch in 2007. (CCFE, 2012h; UKAEA, 2019)
UKAEA also conducts public engagement with politics. A current key priority is ensuring that UKAEA’s activities can continue when the UK leaves Euratom. UKAEA also worked on increasing awareness of fusion among politicians more generally, with the formation of an All-Party Parliamentary Group on fusion in October 2017, which was instigated by UKAEA. Furthermore, it has hosted a number of visits to Culham by politicians. UKAEA also hosted visits for civil servants, funding agencies, industrial partners and collaborators. (UKAEA, 2019)
18 Note, that it could be argued that the UK indirectly pays for EU funding of UKAEA through its European Contributions. However, it should be noted that even in the absence of UKAEA, the UK would still have to make the same contributions to the EU budget. EU funding to UKAEA is therefore additional under the ‘no-UKAEA’ counterfactual.

The impact of the UK’s investments in UKAEA fusion research
41
Other examples of UKAEA’s impact on UK public policy and strategy include RACE’s contribution to the RAS 2020 strategy (RAS, 2014), for which Rob Buckingham, the UKAEA director and head of RACE, was lead author. Within the industrial strategy, RAS feeds directly into a number of fields such as AI and data, future of mobility, clean energy as well as indirectly into aging population. Moreover, RACE provides high level input to UKRI on future investment themes and has fed into the Oxfordshire SIA (Oxfordshire SIA, 2017)19.
Lastly, the UKAEA serves as a “store of knowledge” about fusion energy research that can be tapped into by government and the public sector. Examples of this are the director of RACE, Rob Buckingham, providing oral evidence to two Select Committee and him being a member of the National Quantum Computing Centre Technical Advisory Board. This store of knowledge can be used by government to make informed decisions about fusion research taking account of existing expertise in the field.
19 Based on information obtained from UKAEA which is not publicly available.

The impact of the UK’s investments in UKAEA fusion research
42
5 Economic Impact This section provides estimates of economic impacts of UKAEA’s fusion programme. Specifically, this section examines the impact of UKAEA expenditure on goods and services as well as the benefits expenditure by UKAEA staff bring to the Oxfordshire economy, by purchasing goods and services from local businesses. The section further considers benefits, on the UK economy, of ITER contracts awarded to UK businesses. A methodological annex to this study provides further details on the adopted methodology, including a diagrammatic overview of the different strands examined (Figure 22).
In addition to the direct generation of jobs and scientific activity that UKAEA brings to Oxfordshire, UKAEA also spends money on goods and services such as raw materials, construction services and supplies, etc. These expenditures bring additional benefits to the UK and the local Oxfordshire economy, and in turn further support jobs among UKAEA’s suppliers and the wider UK economy.
The presence of UKAEA also helps bring further investment to the UK, for example, in the form of contracts associated with the construction and manufacture of ITER-related materials. Having these contracts in the UK brings further direct economic benefits for UK industry, as well as their suppliers and the wider UK economy.
To estimate the total economic impact of UKAEA and ITER-related contract spending, the analysis considers the direct, indirect and induced effects on the UK economy generated by UKAEA’s expenditures. These effects are commonly measured in terms of Gross Value Added20 and employment, and are defined as follows:
• Direct effects consider the direct economic impact generated by contract spending through purchasing goods and services (including labour) from the UK economy. For example, contracting a construction firm.
• Indirect effects result from contractors demanding more from their suppliers. This results in a chain reaction of subsequent rounds of spending across industries, often referred to as the ‘ripple effect’. For example, a construction firm demands more construction materials from its suppliers in order to meet the contract requirements, the suppliers demand more from their suppliers, and so on.
• Finally, induced effects account for the change in household spending resulting from a change in the income of employees throughout the supply chain. For example, a construction worker that receives a higher income will spend a proportion of that increased income on final goods and services. This generates wage income for employees within the industries producing these goods and services, who then spend
20 According to the Office for National Statistics (2006), ‘Gross Value Added (GVA) measures the contribution to the economy of each individual producer, industry or sector in the United Kingdom. The GVA generated by any unit engaged in production activity can be calculated as the residual of the units’ total output less intermediate consumption (that is, goods and services used up in the process of producing the output)’. In other words, GVA is a measure of the value of goods and services produced by a particular organisation or industry minus the cost of inputs used in the production process. In accounting terms, Gross Value Added is calculated as [Gross Operating Surplus + compensation of employees + taxes on production – subsidies on production].

The impact of the UK’s investments in UKAEA fusion research
43
their own income on their needs. Again, this leads to subsequent rounds of wage income spending, i.e. a ‘ripple effect’ across the economy as a whole.
In analysing the total direct, indirect and induced effects of UKAEA and ITER contract expenditures on the UK economy, it is important to adjust for two additional factors potentially reducing the size of any of the above effects. These include:
• Leakage into other geographical areas, by taking account of how much of the additional economic activity actually occurs in the area of consideration. In this instance, UKAEA purchases a share of its inputs from overseas suppliers, thus reducing the economic impact which it has on the UK. Contracts awarded to overseas suppliers are thus excluded from the analysis. Similarly, only ITER contracts awarded to UK suppliers are considered in the analysis.
• Displacement of economic activity within the region of analysis, i.e. taking account of the possibility that the economic activity generated by UKAEA might result in the reduction of activity elsewhere within the UK economy. However, since fusion is a high capital, long term investment it is unlikely that Government investment in fusion research would result in displacement of private investment.
Figure 22 provides a graphical presentation of these concepts. The remainder of this section outlines our methodological approach to estimating the direct, indirect and induced impacts generated by UKAEA’s contract expenditures as well as contract spending on ITER in the UK.
Figure 22: Overview of direct, indirect and induced impacts
Source: London Economics
Direct impactExpenditure on
products, services and wages
Indirect impactSuppliers spending their
income on inputs
Induced impactEmployees spending their wages on consumer goods and services
Displacement-
Leakage-

The impact of the UK’s investments in UKAEA fusion research
44
5.1 Impact of UKAEA contract expenditure
Estimating direct, indirect and induced effects of UKAEA contract expenditure
The direct effects were calculated using data from UK Input-Output tables (for 2015)21 produced by the Office for National Statistics (2019), measuring the total production output of each industry in the UK economy, and the inter-industry (and intra-industry) flows of goods and services consumed and produced by each of these sectors. While the original tables were provided separately for 129 sub-sectors, for the purpose of the analysis, we aggregated these tables into ten (more high-level) industries22. The Input-Output tables were then used to generate measures of GVA per output and employment per output for each of the ten industries; these are shown in Table 5. UKAEA supplied data on all UKAEA contracts held within their business ERP system. Each contract was assigned to one of the ten sectors, using the Nomenclature of Economic Activities (NACE) code of the firm that won each contract. Total contract spend in each sector was then multiplied by the average ratio of GVA-to-output and employment-to-output in the sector, giving an estimate of the direct GVA and employment generated.
The Input-Output tables were also used to calculate estimates of indirect and induced effects. Specifically, multipliers capturing the total direct, indirect and induced effects of output spending by sector (shown in Table 5) were derived from the Input-Output tables. The derived multipliers were then applied to the total contract spending by sector, providing an estimate of the total direct, indirect and induced output generated. This figure was then multiplied by the ratio of GVA-to-output and employment-to-output in the corresponding sectors, giving an estimate of the direct, indirect and induced effects GVA and employment generated.
The analysis focused on the financial years of 2009/10 – 2018/19.
Table 5: Procurement expenditure multipliers, by sector GVA per output Employment per
£m output Output multipliers
Agriculture 0.39 19.82 2.42
Production 0.35 4.38 2.38
Construction 0.39 5.09 2.66
Distribution, transport, hotels and restaurants
0.50 13.78 2.52
21 Given the complexity involved in the collation of national Input-Output tables, there is a significant delay in the publication of Input-Output analytical tables for any given year. At the time of writing, 2015 was the latest year for which these tables were available. 22 This was necessary to be able to calculate multipliers in terms of employment, since the corresponding employment data required for this calculation (again for 2015, sourced from the Office for National Statistics (2017)) were not available at the very granular (i.e. 129-sector) level. For simplicity as well as to provide consistency between the output and employment estimates, but also to avoid further uncertainties around classification of firms into granular sectors (discussed in further detail in Annex 2: Methodological annex), it was decided against using more granular data to calculate output multipliers.

The impact of the UK’s investments in UKAEA fusion research
45
Information and communication
0.59 6.21 2.31
Financial and insurance 0.46 4.35 2.42
Real estate 0.77 1.73 1.61
Professional and support activities
0.58 13.02 2.41
Government, health & education
0.62 13.88 2.45
Other services 0.64 12.83 2.22
Note: Other services include creative, arts and entertainment services; libraries, archives, museums and other cultural services; gambling and betting services; sports services and amusement and recreation services; services furnished by membership organisations; repair services of computers and personal and household goods; other personal services; services of households as employers of domestic personnel. Source: London Economics analysis of 2015 UK input-output tables obtained from the ONS
Direct impact of UKAEA contract expenditure
Over the period of the 2009/10 and 2018/19 financial years, UKAEA awarded £176.5 million (in 2019 Q1 prices) to UK and non-UK suppliers. Of this total, 92.6% (£163.5 million) were awarded to UK companies. This includes £29.6 million awarded to UK companies for products and services related to JET. (Figure 23)
Figure 23: UKAEA contract expenditure, 2009/10 – 2018/19
Note: Figures are in real terms (2019 Q1 prices), deflated using ONS GDP deflators. Source: London Economics analysis based on contract data supplied by UKAEA
76%
17%
7% 1%
UK excluding JET UK JETNon-UK excluding JET Non-UK JET

The impact of the UK’s investments in UKAEA fusion research
46
The majority of spending was in the professional and support activities and the production sectors, accounting for £65.7 million (40.2%) and £40.2 million (24.6%) of total UK spend respectively. (Table 6)
The total direct Gross Value Added generated by UKAEA contract expenditure is estimated to be approximately £82.6 million over the 2009/10 and 2018/19 financial years. Of this total, £38.4 million (46.4%) was generated in the professional and support activities sector, £14.2 million (17.1%) was generated in the production sector, £9.3 million (11.2%) in the other services sector, £8.0 million (9.6%) in the construction sector, £5.9 million (7.2%) in the information and communications sector, and £7.0 million (8.4%) in other industries.
In terms of employment, UKAEA contract expenditure supported a total of 1,496 job years23, consisting of 855 job years (57.1%) in the professional and support activities sector, 186 job years (12.4%) in the other services sector, 176 job years (11.8%) in the production sector, 103 job years (6.9%) in the construction sector, and the remaining 176 job years (11.8%) from other sectors.
Table 6: Direct impact of UKAEA contract spending, by sector (UK only, including JET) Sector Expenditure (£m) Gross Value Added
(£m) Employment (job
years)
Agriculture - - -
Production £40.2 m £14.2 m 176
Construction £20.2 m £8.0 m 103
Distribution, transport, hotels and restaurants
£5.0 m £2.5 m 69
Information and communication
£10.1 m £5.9 m 63
Financial and insurance
£4.3 m £2.0 m 19
Real estate £1.9 m £1.5 m 3
Professional and support activities
£65.7 m £38.4 m 855
Government, health & education
£1.6 m £1.0 m 23
Other services £14.5 m £9.3 m 186
Total £163.5 m £82.6 m 1,496
Note: Figures are in real terms (2019 Q1 prices), deflated using ONS GDP deflators. Due to rounding figures may not sum up to totals. Other services include creative, arts and entertainment services; libraries, archives, museums and other cultural services; gambling and betting services; sports services and amusement and
23 A job year refers to a job being provided for one year. If the job continues for another year, it is counted as two job years.

The impact of the UK’s investments in UKAEA fusion research
47
recreation services; services furnished by membership organisations; repair services of computers and personal and household goods; other personal services; services of households as employers of domestic personnel. Source: London Economics analysis based on contract data supplied by UKAEA
Indirect and induced impact of UKAEA contract expenditure
The analysis indicates that, in addition to direct impacts, UKAEA expenditure on goods and services generated a further £115.0 million in Gross Value Added and supported 2,097 additional job years throughout the UK economy over the 2009/10-2018/19 financial years.
The total direct, indirect and induced impact of UKAEA contract expenditure is thus estimated to be approximately £197.7 million in Gross Value Added generated and 3,593 job years supported.
Figure 24 and Table 7 present the aggregate direct, indirect and induced Gross Value Added and employment generated by UKAEA’s contract expenditures.
Figure 24: Total direct, indirect and induced impact of UKAEA contract spending (UK only, including JET)
Note: Figures are in real terms (2019 Q1), deflated using ONS GDP deflators. Source: London Economics analysis based on contract data supplied by UKAEA
£198 m
£50 m £100 m £150 m £200 m £250 m
GVA, £m
Direct Indirect and induced
3,593
0 500 1,000 1,500 2,000 2,500 3,000 3,500 4,000 4,500
Employment, job years
Direct Indirect and induced

The impact of the UK’s investments in UKAEA fusion research
48
Table 7: Direct, indirect and induced impact of UKAEA contract spending, by sector (UK only, including JET) Sector Gross Value Added (£m) Employment (job years)
Direct impact Indirect and induced impact
Total impact Direct impact Indirect and induced impact
Total impact
Agriculture - - - - - -
Production £14.2 m £19.5 m £33.7 m 176 242 418
Construction £8.0 m £13.2 m £21.1 m 103 170 273
Distribution, transport, hotels and restaurants
£2.5 m £3.8 m £6.3 m 69 104 173
Information and communication
£5.9 m £7.8 m £13.7 m 63 83 146
Financial and insurance £2.0 m £2.8 m £4.8 m 19 27 45
Real estate £1.5 m £0.9 m £2.3 m 3 2 5
Professional and support activities
£38.4 m £54.2 m £92.6 m 855 1,209 2,064
Government, health & education
£1.0 m £1.5 m £2.5 m 23 33 56
Other services £9.3 m £11.3 m £20.6 m 186 227 413
Total £82.6 m £115.0 m £197.7 m 1,496 2,097 3,593
Note: Figures are in real terms (2019 Q1 prices), deflated using ONS GDP deflators. Due to rounding figures may not sum up to totals. Other services include creative, arts and entertainment services; libraries, archives, museums and other cultural services; gambling and betting services; sports services and amusement and recreation services; services furnished by membership organisations; repair services of computers and personal and household goods; other personal services; services of households as employers of domestic personnel. Source: London Economics analysis based on contract data supplied by UKAEA

The impact of the UK’s investments in UKAEA fusion research
49
Geographical distribution of UKAEA contract expenditure
In addition to these aggregate values, it is useful to examine the geographical distribution of impacts. Unfortunately, the ONS do not produce sub-national input-output tables. Methods to allocate impacts to sub-national units often suffer from low reliability and are therefore not used in this analysis. Nevertheless, an analysis of UKAEA’s expenditure by geographical breakdown provides insights into the reach of UKAEA across all regions of the United Kingdom.
Figure 25: UK contract expenditure by local authority, 2009/10 – 2018/19 (including JET)
Note:
1. Figures are in real terms (2019 Q1 prices), deflated using ONS GDP deflators.
2. We received UK contract expenditure data provided by UKAEA totalling £163.5 million over the 2009/10-2018/19 financial years. Of this total, £1.5 million could not be matched to the ONS postcode directory and was thus excluded from the analysis.
Source: London Economics’ analysis based on UKAEA data and Office for National Statistics data. Contains National Statistics data, NISRA data, NRS data and Ordnance Survey data © Crown copyright and database right 2018.

The impact of the UK’s investments in UKAEA fusion research
50
Figure 25 and Table 8 clearly demonstrate the value that UKAEA brings to the local economy, with 20.6% (£33.6 million) of UKAEA contract expenditure concentrated in the South East of England, and particularly around the Culham area.
However, UKAEA’s impact is not restricted to the South East, with the South West (20.6%, or £33.8 million), North West (17.4%, or £28.4 million), West Midlands (14.5%, or £23.7 million), London (10.5%, or £17.2 million) and East Midlands (7.8%, or £12.7 million) also accounting for large proportions of UKAEA expenditure.
Table 8: Direct, indirect and induced impact of UKAEA contract spending, by region (UK only, including JET) Region Expenditure Proportion
South West (England) £33.8 m 20.6%
South East (England) £33.6 m 20.5%
North West (England) £28.4 m 17.4%
West Midlands (England) £23.7 m 14.5%
London £17.2 m 10.5%
East Midlands (England) £12.7 m 7.8%
Yorkshire and The Humber £5.6 m 3.4%
East of England £4.0 m 2.4%
Scotland £1.5 m 0.9%
Northern Ireland £1.1 m 0.7%
Wales £0.4 m 0.3%
North East (England) £0.0 m 0.0%
Unknown £1.5 m 0.9%
Total £163.5 m 100.0%
Note: Figures are in real terms (2019 Q1 prices), deflated using ONS GDP deflators. Due to rounding figures may not sum up to totals. Source: London Economics analysis based on contract data supplied by UKAEA
5.2 Impact of UKAEA staff expenditure
Estimating direct, indirect and induced effects of UKAEA staff expenditure
Staff directly employed by UKAEA and those contracted to UKAEA bring further benefits to the Oxfordshire economy by purchasing goods and services from local businesses. Similarly, to income generated by UKAEA contracts, this spending generates ‘ripple effects’ throughout the economy.

The impact of the UK’s investments in UKAEA fusion research
51
To estimate expenditure on goods and services by UKAEA staff, the analysis considered the total UKAEA staff expenditure and the total number of UKAEA staff (both directly employed by UKAEA and hired staff). Staff expenditure was then adjusted to take account of employer and employee national insurance contributions and income tax24, to derive an estimate of the average net salary of UKAEA employees. Net salary was further adjusted by the household savings ratio25, to derive an estimate of staff expenditure on goods and services.
To estimate the direct, indirect and induced impacts of UKAEA staff expenditure, the analysis again made use of UK Input-Output tables (for 2015)26 produced by the Office for National Statistics (2019).
Specifically, the analysis considered household expenditure across the ten high level sectors to derive a weighted average household expenditure multiplier, by weighting the sector level output multipliers derived previously (Table 5) by the proportion of household expenditure in each sector27 (see Table 9, below).
Note that the Input-Output tables account for imports of goods and services as well as taxes and subsidies on products. Therefore, spending data does not need to be further adjusted for leakage outside of the UK.
Table 9: Weighted average output multiplier Output multipliers Proportion of
household expenditure in
sector
Weighted average household
expenditure multiplier
Agriculture 2.42 0.9% 2.27
Production 2.38 13.7%
Construction 2.66 3.9%
Distribution, transport, hotels and restaurants
2.52 29.6%
Information and communication
2.31 4.9%
Financial and insurance 2.42 8.9%
24 The analysis assumes that staff expenditure - employer NICS = gross salary. This is an approximation as it treats bonuses, overtime, and other non-salary staff costs as salary. 25 The analysis uses the Households' & NPISH saving ratio published by the Office for National statistics. Therefore, the analysis implicitly assumes that the savings rate of UKAEA staff is similar to the national savings rate of UK Households overall. 26 Given the complexity involved in the collation of national Input-Output tables, there is a significant delay in the publication of Input-Output analytical tables for any given year. At the time of writing, 2015 was the latest year for which these tables were available. 27 Note, the analysis therefore implicitly assumes that spending by UKAEA staff follows a similar pattern as spending by UK households overall.

The impact of the UK’s investments in UKAEA fusion research
52
Real estate 1.61 20.5%
Professional and support activities
2.41 8.9%
Government, health & education
2.45 4.4%
Other services 2.22 4.3%
Note: Other services include creative, arts and entertainment services; libraries, archives, museums and other cultural services; gambling and betting services; sports services and amusement and recreation services; services furnished by membership organisations; repair services of computers and personal and household goods; other personal services; services of households as employers of domestic personnel. Source: London Economics analysis of 2015 UK input-output tables obtained from the ONS
Applying the same weights to the previously derived estimates for GVA per output and employment per £m output, yields the weighted average estimates shown in Table 10, below.
Table 10: Weighted average multipliers GVA per output Employment per
£m output Output multiplier
Weighted average household expenditure multiplier
0.55 8.42 2.27
Source: London Economics analysis of 2015 UK input-output tables obtained from the ONS
Direct job creation by UKAEA
UKAEA employed approximately 1,052 staff, on average, between 2009/10 and 2018/2019. Of these, 62% (653 staff) were directly employed by UKAEA, with the remainder (38%, or 399 staff) being hired staff. (Figure 26)
Figure 26: UKAEA employment, 2009/10 – 2018/19
Note: Other staff are hired staff, the majority of which are used to carry out specialist work in UKAEA’s scientific facilities (UKAEA, 2018). Source: London Economics based on data from UKAEA Annual Reports and Accounts
1,044 1,035 937 907
998 1,090 1,080 1,046
1,130 1,249
-
200
400
600
800
1,000
1,200
1,400
Directly employed Other staff

The impact of the UK’s investments in UKAEA fusion research
53
Summing up the number of staff employed by UKAEA in each financial year, implies that UKAEA directly supported 10,516 job years over the period 2009/10 to 2018/19. (Figure 27)
Figure 27: Total employment supported directly by UKAEA
Note: Other staff are hired staff, the majority of which are used to carry out specialist work in UKAEA’s scientific facilities (UKAEA, 2018). Source: London Economics based on data from UKAEA Annual Reports and Accounts
Direct, indirect and induced effects of UKAEA staff expenditure
Staff employed by UKAEA further spend money on goods and services, thus bringing additional benefits to the local Oxfordshire economy.
Combining UKAEA staff expenditure (see Figure 14 in Section 3) with the total number of staff employed by UKAEA (Figure 26, above), and adjusting for national insurance contributions, income tax and the household savings rate, indicates that expenditure by UKAEA staff on goods and services totalled £330.8 million (in 2019 prices) over the period of 2010 and 2019.28
Combining this spend with the household expenditure multipliers derived previously (see Table 10 in Section 5.2), indicates that expenditure by UKAEA staff generated total Gross Value Added of approximately £412.8 million and supported approximately 6,336 job years (in addition to staff employed by UKAEA) in total across the UK economy. (Figure 28)
Figure 28: Total direct, indirect and induced impact of UKAEA staff expenditure
Note: Figures are in real terms (2019 Q1 prices), deflated using ONS GDP deflators. Source: London Economics analysis based on contract data supplied by UKAEA
28 The analysis assumes that staff expenditure - employer NICS = gross salary. This is an approximation as it treats bonuses, overtime, and other non-salary staff costs as salary.
10,516
0 2,000 4,000 6,000 8,000 10,000 12,000
Employment, job years
Directly employed Other staff
£413 m
£100 m £200 m £300 m £400 m £500 m
GVA, £m
Direct Indirect and induced
6,336
0 2,500 5,000 7,500
Employment, job years
Direct Indirect and induced

The impact of the UK’s investments in UKAEA fusion research
54
5.3 Impact of other UKAEA expenditure on raw materials and consumables, and other external expenses
Contract expenditure data held within UKAEA’s business ERP system only accounted for approximately 40% of UKAEA spend on raw materials and consumables, and other external expenses reported in UKAEA’s annual reports. As such, only accounting for impacts derived from UKAEA contract expenditure data would significantly underestimate the overall impact of UKAEA.
To address this issue, the analysis considers the discrepancy between UKAEA annual accounts data on spending on raw materials and consumables, and other external expenses and UKAEA contract data between 2009/10 and 2018/19. To account for leakage, the analysis adjusts the total expenditure on raw materials, consumables and other external expenses from UKAEA’s annual accounts by the proportion of UKAEA contract expenditure taking place in the UK29. The calculation is provided in Table 11, for reference.
Table 11: Discrepancy between UKAEA annual accounts and UKAEA contract data Expenditure (2009/10 – 2018/19) Value
Expenditure on raw materials and consumables (annual accounts
£207.8 m
Expenditure on other external expenses (annual accounts) £244.5 m
Total expenditure on raw materials, consumables and other external expenses (annual accounts)
£452.3 m
Proportion of UK spend in UKAEA contract data (leakage adjustment)
92.6%
Adjusted expenditure on raw materials, consumables and other external expenses (annual accounts)
£418.8 m
UKAEA UK contract expenditure (UKAEA contract data) £163.5 m
Discrepancy between annual accounts and UKAEA contract data
£255.3 m
Note: Figures are in real terms (2019 Q1 prices), deflated using ONS GDP deflators. Source: London Economics analysis of UKAEA contract data provided by UKAEA and UKAEA annual reports
To calculate the direct, indirect and induced impacts of unaccounted UKAEA expenditure on raw materials, consumables and other external expenses, the analysis applies the multipliers for the general government, health and education sector as a whole to this expenditure30. (Table 12)
29 The analysis therefore assumes that the proportion of UK to non-UK spend is comparable across the two datasets. 30 This is because the analysis cannot distinguish the industries this expenditure flows to.
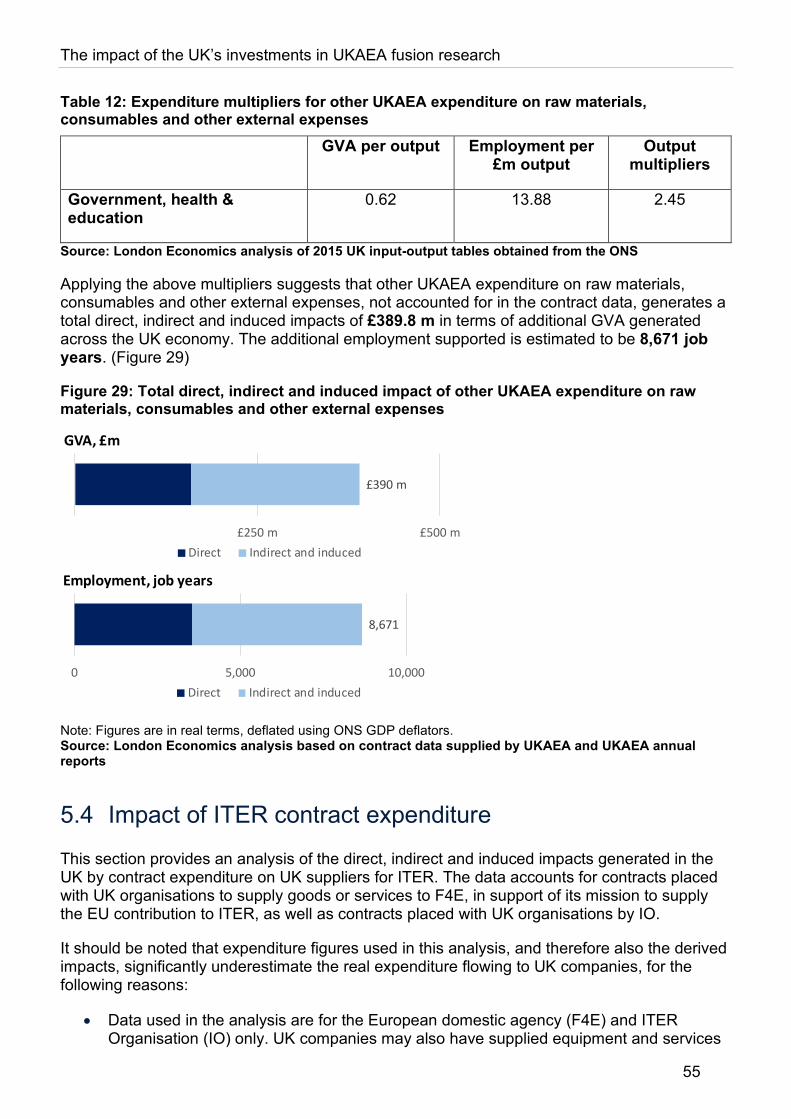
The impact of the UK’s investments in UKAEA fusion research
55
Table 12: Expenditure multipliers for other UKAEA expenditure on raw materials, consumables and other external expenses GVA per output Employment per
£m output Output
multipliers
Government, health & education
0.62 13.88 2.45
Source: London Economics analysis of 2015 UK input-output tables obtained from the ONS
Applying the above multipliers suggests that other UKAEA expenditure on raw materials, consumables and other external expenses, not accounted for in the contract data, generates a total direct, indirect and induced impacts of £389.8 m in terms of additional GVA generated across the UK economy. The additional employment supported is estimated to be 8,671 job years. (Figure 29)
Figure 29: Total direct, indirect and induced impact of other UKAEA expenditure on raw materials, consumables and other external expenses
Note: Figures are in real terms, deflated using ONS GDP deflators. Source: London Economics analysis based on contract data supplied by UKAEA and UKAEA annual reports
5.4 Impact of ITER contract expenditure
This section provides an analysis of the direct, indirect and induced impacts generated in the UK by contract expenditure on UK suppliers for ITER. The data accounts for contracts placed with UK organisations to supply goods or services to F4E, in support of its mission to supply the EU contribution to ITER, as well as contracts placed with UK organisations by IO.
It should be noted that expenditure figures used in this analysis, and therefore also the derived impacts, significantly underestimate the real expenditure flowing to UK companies, for the following reasons:
• Data used in the analysis are for the European domestic agency (F4E) and ITER Organisation (IO) only. UK companies may also have supplied equipment and services
£390 m
£250 m £500 m
GVA, £m
Direct Indirect and induced
8,671
0 5,000 10,000
Employment, job years
Direct Indirect and induced

The impact of the UK’s investments in UKAEA fusion research
56
to other authorities (e.g. the US and India), bringing further benefits to the UK. These contracts are therefore not accounted for in the analysis.
• F4E data is for prime contractors only. Where a UK business is subcontracting to a European based prime, the data is unfortunately not captured by any F4E reporting process.
• Where UK companies have entered into consortiums with European partners, they may have submitted the proposal via France or Spain and hence are also not captured by the data.
• Based on data collected by DIT/UKAEA, the total F4E/IO consortia contract value involving the UK is at least €720 million since 2009, but we don’t know the UK’s share of this total consortia value so the consortia contracts were not included in this analysis.
• The level of activity and type of business wins is also gated by the phase of the ITER project. From 2009 through to 2012 F4E were mainly buying technical engineering support and analysis. From 2013 the prime contracts placed were for Superconductor, Superconducting magnets, Vacuum vessels and the nuclear bunker. From 2020 F4E will start to procure the next phase of remote handling, diagnostic systems, heating systems, tritium plant, hot cell, etc., which have the potential for further UK business involvement..
• IO does not formally report the data. Data on IO contracts was obtained via a firm level dataset collected by the Department for International Trade (DIT), which captured data for prime contractors only.
• Neither of the F4E and IO datasets used in this analysis capture subcontracting contracts won by the UK. A discussion on the scale of the underestimation issue is provided following the presentation of estimated impacts of ITER expenditure.
To estimate direct, indirect and induced impacts of ITER contract spend, the same methodology as for UKAEA contract expenditure (described in Section 5.1) was applied.
Direct impact of ITER contract expenditure
In addition to contracts awarded by UKAEA itself, UK businesses derive significant economic benefits from F4E and IO contract expenditure for the ITER project.
Direct impact of F4E ITER-related contract expenditure Between 2009/10 and 2018/19 F4E awarded a total of £132.2 million (in 2019 Q1 prices) of ITER related contracts to UK firms31. The vast majority of this spending was concentrated in the professional and support activities, and construction sectors, which received a combined total of 95.7% (£126.5 million) of ITER contract expenditure. (Table 13)
F4E ITER contract spending generated a total of £65.1 million in direct Gross Value Added. Of this total, £37.3 million (57.3%) was generated in the professional and support activities, £24.7 million (37.9%) was in the construction sector, and £3.1 million (4.7%) was generated in other industries.
31 Note that this excludes £2.0 million (in 2019 Q1 prices) in contracts awarded to UKAEA.

The impact of the UK’s investments in UKAEA fusion research
57
In terms of employment, F4E ITER contracting directly supported a total of 1,212 job years, consisting of 831 job years (68.6%) in professional and support activities, 319 job years (26.3%) in the construction sector, and 62 job years (5.1%) in other industries.
In addition to ITER related F4E expenditure, IO contracts to UK firms accounted for approximately £80.7 million between 2009/10 and 2018/1932. IO contract spending generated a total of £42.2 million in direct Gross Value Added, supporting a total of 842 job-years.
Similarly to F4E ITER expenditure, the vast majority of IO expenditure was in the professional and support activities, and construction sectors, together accounting for 95.8% (£77.3 million) of total IO spend; 96.5% (£40.7 million) of GVA generated; and 97.6% (822 job years) of employment supported.
32 Note that this excludes £16.5 million (in 2019 Q1 prices) in contracts awarded to UKAEA.
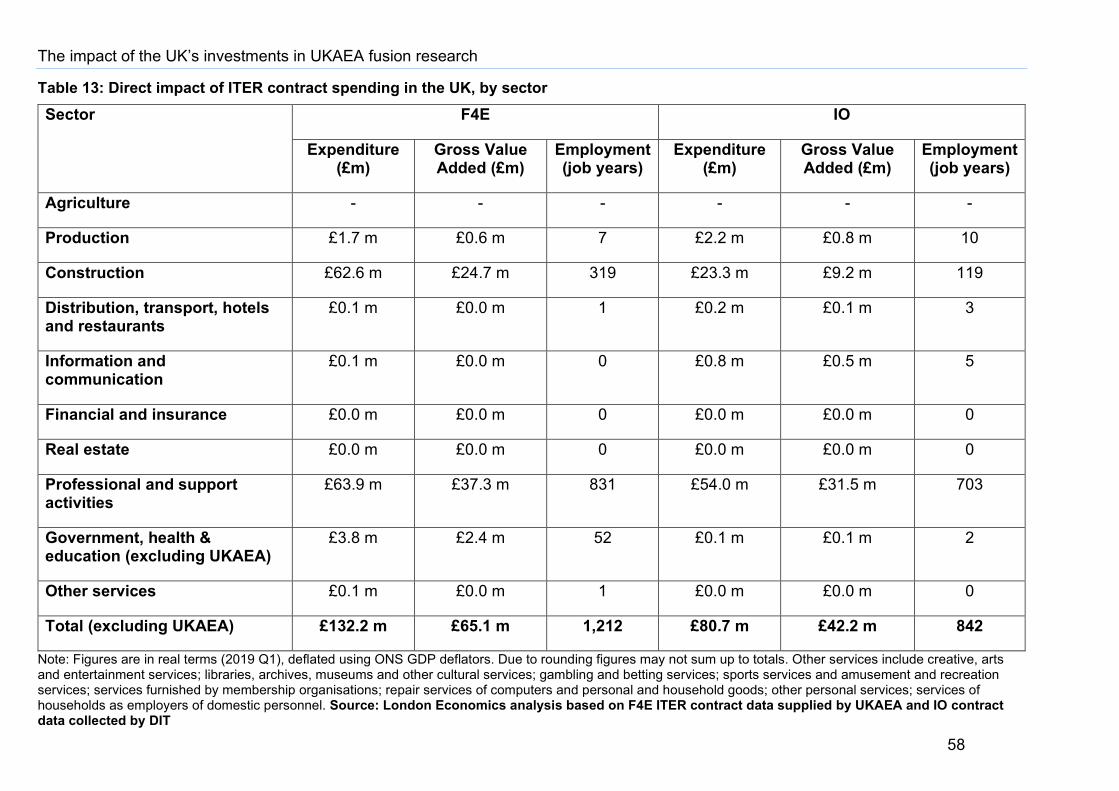
The impact of the UK’s investments in UKAEA fusion research
58
Table 13: Direct impact of ITER contract spending in the UK, by sector Sector F4E IO
Expenditure (£m)
Gross Value Added (£m)
Employment (job years)
Expenditure (£m)
Gross Value Added (£m)
Employment (job years)
Agriculture - - - - - -
Production £1.7 m £0.6 m 7 £2.2 m £0.8 m 10
Construction £62.6 m £24.7 m 319 £23.3 m £9.2 m 119
Distribution, transport, hotels and restaurants
£0.1 m £0.0 m 1 £0.2 m £0.1 m 3
Information and communication
£0.1 m £0.0 m 0 £0.8 m £0.5 m 5
Financial and insurance £0.0 m £0.0 m 0 £0.0 m £0.0 m 0
Real estate £0.0 m £0.0 m 0 £0.0 m £0.0 m 0
Professional and support activities
£63.9 m £37.3 m 831 £54.0 m £31.5 m 703
Government, health & education (excluding UKAEA)
£3.8 m £2.4 m 52 £0.1 m £0.1 m 2
Other services £0.1 m £0.0 m 1 £0.0 m £0.0 m 0
Total (excluding UKAEA) £132.2 m £65.1 m 1,212 £80.7 m £42.2 m 842
Note: Figures are in real terms (2019 Q1), deflated using ONS GDP deflators. Due to rounding figures may not sum up to totals. Other services include creative, arts and entertainment services; libraries, archives, museums and other cultural services; gambling and betting services; sports services and amusement and recreation services; services furnished by membership organisations; repair services of computers and personal and household goods; other personal services; services of households as employers of domestic personnel. Source: London Economics analysis based on F4E ITER contract data supplied by UKAEA and IO contract data collected by DIT

The impact of the UK’s investments in UKAEA fusion research
59
Indirect and induced impact of ITER contract expenditure
In addition to direct impacts, F4E and IO ITER expenditure generated a further £98.0 million and £61.8 million in Gross Value Added, respectively, and supported 1,792 and 1,219 additional job years, respectively, throughout the UK economy.
The total direct, indirect and induced impact of F4E and IO ITER contract expenditure is thus estimated to be approximately £163.1 million and £104.0 million, respectively, in Gross Value Added generated and 3,004 and 2,061 job years supported, respectively.
Aggregate estimates of the direct, indirect and induced Gross Value Added and employment generated are presented in Figure 30 and Figure 31. Table 14 and Table 15 further present direct, indirect and induced impact estimates at the sector level.
Figure 30: Total direct, indirect and induced impact of F4E ITER contract spending in the UK
Note: Figures are in real terms, deflated using ONS GDP deflators. Source: London Economics analysis based on F4E contract data supplied by UKAEA
Figure 31: Total direct, indirect and induced impact of IO contract spending in the UK
Note: Figures are in real terms, deflated using ONS GDP deflators. Source: London Economics analysis based on IO contract data collected by DIT
£163 m
£50 m £100 m £150 m £200 m
GVA, £m
Direct Indirect and induced
3,004
0 500 1,000 1,500 2,000 2,500 3,000 3,500
Employment, job years
Direct Indirect and induced
£104 m
£50 m £100 m £150 m £200 m
GVA, £m
Direct Indirect and induced
2,061
0 500 1,000 1,500 2,000 2,500 3,000 3,500
Employment, job years
Direct Indirect and induced

The impact of the UK’s investments in UKAEA fusion research
60
Table 14: Direct, indirect and induced impact of F4E ITER contract spending in the UK, by sector Sector Gross Value Added (£m) Employment (job years)
Direct impact Indirect and induced impact
Total impact Direct impact Indirect and induced impact
Total impact
Agriculture - - - - - -
Production £0.6 m £0.8 m £1.4 m 7 10 18
Construction £24.7 m £40.9 m £65.6 m 319 528 846
Distribution, transport, hotels and restaurants
£0.0 m £0.0 m £0.1 m 1 1 2
Information and communication
£0.0 m £0.1 m £0.1 m 0 1 1
Financial and insurance £0.0 m £0.0 m £0.0 m 0 0 0
Real estate £0.0 m £0.0 m £0.0 m 0 0 0
Professional and support activities
£37.3 m £52.7 m £90.0 m 831 1,176 2,007
Government, health & education (excluding UKAEA)
£2.4 m £3.4 m £5.8 m 52 76 128
Other services £0.0 m £0.0 m £0.1 m 1 1 1
Total (excluding UKAEA) £65.1 m £98.0 m £163.1 m 1,212 1,792 3,004
Note: Figures are in real terms (2019 Q1), deflated using ONS GDP deflators. Due to rounding figures may not sum up to totals. Other services include creative, arts and entertainment services; libraries, archives, museums and other cultural services; gambling and betting services; sports services and amusement and recreation services; services furnished by membership organisations; repair services of computers and personal and household goods; other personal services; services of households as employers of domestic personnel. Source: London Economics analysis based on F4E contract data supplied by UKAEA

The impact of the UK’s investments in UKAEA fusion research
61
Table 15: Direct, indirect and induced impact of IO contract spending in the UK, by sector Sector Gross Value Added (£m) Employment (job years)
Direct impact Indirect and induced impact
Total impact Direct impact Indirect and induced impact
Total impact
Agriculture - - - - - -
Production £0.8 m £1.1 m £1.9 m 10 13 23
Construction £9.2 m £15.2 m £24.4 m 119 197 315
Distribution, transport, hotels and restaurants
£0.1 m £0.2 m £0.3 m 3 5 8
Information and communication
£0.5 m £0.6 m £1.1 m 5 6 11
Financial and insurance £0.0 m £0.0 m £0.0 m 0 0 0
Real estate £0.0 m £0.0 m £0.0 m 0 0 0
Professional and support activities
£31.5 m £44.6 m £76.1 m 703 994 1,698
Government, health & education (excluding UKAEA)
£0.1 m £0.1 m £0.2 m 2 3 5
Other services £0.0 m £0.0 m £0.0 m 0 0 0
Total (excluding UKAEA) £42.2 m £61.8 m £104.0 m 842 1,219 2,061
Note: Figures are in real terms (2019 Q1), deflated using ONS GDP deflators. Due to rounding figures may not sum up to totals. Other services include creative, arts and entertainment services; libraries, archives, museums and other cultural services; gambling and betting services; sports services and amusement and recreation services; services furnished by membership organisations; repair services of computers and personal and household goods; other personal services; services of households as employers of domestic personnel. Source: London Economics analysis based on IO contract data collected by DIT

The impact of the UK’s investments in UKAEA fusion research
62
Scale of underestimation of ITER impacts
As discussed at the beginning of this section, expenditure figures used in the analysis potentially significantly underestimate the real expenditure flowing to UK companies. Therefore, the impacts derived here should be seen as conservative estimates.
Indeed, a recent presentation on behalf of ITER (Townsend, 2019) suggests that F4E contracts to UK firms and institutions account for approximately £210 million (€238 million)33 compared to £132.2 m suggested by the data used in this analysis.
Regarding IO contracts with UK companies, Townsend (2019) indicates that these account for approximately £53 million (€ 60 million)34, compared to £80.7 million used in this analysis, though this data is somewhat out of date.
Moreover, the Government (HM Government, 2013, p. 65) estimated that the potential business that ITER will bring to UK industry is up to £950 million (€1 billion)35 in the next decades.
Applying the weighted average impact multipliers based on the above analysis to the higher estimates of F4E ITER spend36 suggests that the direct, indirect and induced GVA impacts of F4E ITER contracts is approximately £259.7 million and supporting approximately 4,786 job years. This suggests that the preceding analysis, using firm level F4E contract expenditure data, captures only around 60% (£163.0 million GVA and 3,004 job years) of the impact of F4E ITER spend with UK companies.
Combining this higher estimate of the impact of F4E ITER spend with the IO impacts of the previous analysis indicates that the total direct, indirect and induced impacts of ITER UK contract expenditure is approximately £363.7 million in GVA, supporting approximately 6,846 job years.
Moreover, applying the multipliers to the Government’s estimate of potential business brought to the UK by ITER suggests that the impact could be as high as £1.2 billion in GVA added to the UK economy
Potential additional impact from spin-offs
For comparison with Trinomics (2018), the analysis also considers the impact of potential spin-offs. Trinomics’ analysis of the potential additional benefits from spin-offs was based on a combination of a survey undertaken for their study and modelling using the E3ME model. Their
33 Original values reported in Euro, converted to Sterling using the Bank of England average annual exchange rate for 2018. 34 Original values reported in Euro, converted to Sterling using the Bank of England average annual exchange rate for 2018. 35 Original value reported in Euro, converted to Sterling using the Bank of England average annual exchange rate for 2013, and converted to 2019 prices using ONS GDP deflators. 36 Weighted average output multiplier = 2.53; weighted average GVA to output ratio = 0.49. Assumes that total ITER spending follows the same pattern as the ITER contract expenditure used in this analysis. Estimates of ITER expenditure estimate of £210 million from the presentation, and IO expenditure of £80.7 million from the IO data collected by DIT are used to derive this estimate.

The impact of the UK’s investments in UKAEA fusion research
63
methodology is provided in Annex D of Trinomics (2018), and briefly reproduced here for completeness:
• Based on 35% of survey respondents who confirmed they had developed new cutting-edge technologies, Trinomics assumed that 35% of the additional GVA generated by sectors directly affected by ITER investment can be attributed to spin offs. Trinomics further made the assumption that half of this percentage (17.5%) of the additional GVA generated by sectors indirectly affected by ITER investment can be attributed to spin offs.
• Trinomics argues that firms will use part of this increase in GVA to make additional investment. Conversely, should the scenario result in a reduction in GVA, Trinomics assumed that this lost GVA could have been used to make further investments.
• Trinomics further makes the assumption that this potential investment may be 50% higher than usual GVA/ investment ratios since investment in new spin-off companies or techniques is likely to be higher than standard investments.
• Finally, the increase/decrease in GVA, and the likely investments this would have generated is used as an input to the E3ME model in order to assess the potential impact of spill-overs on jobs and further GVA.
To calculate the potential additional benefit from spin-offs, based on the UK-specific data used in this study, the ratios of estimated benefits to potential additional benefit from spin-offs from the Trinomics report are applied to ITER data used in this report37. These ratios are reported in Table 16, below.
Table 16: Ratios cumulative ITER impact to potential additional impact of spin-offs Indicator GVA (£m) Employment (job
years)
Cumulative impact (2008-2017) of ITER spend from Trinomics (2018)
£4,786.0 m 34,000
Potential additional impact of spin-offs from Trinomics (2018)
£561.0 m 4,700
Ratio 8.53 7.23
Source: London Economics analysis of Trinomics (2018)
Applying these ratios to the estimates derived in this report (see Table 14 and Table 15), suggests that the potential additional benefit of spin-offs could be between £31.3 million and £42.6 million in GVA generated and between 700 and 946 job-years supported.
37 The analysis therefore implicitly assumes that the EU survey data collected for the Trinomics ITER report also holds for the UK. This specifically applies to the 35% of survey respondents who confirmed they had developed new cutting-edge technologies (see Annex D of Trinomics (2018)).

The impact of the UK’s investments in UKAEA fusion research
64
5.5 Total gross economic impact
Aggregating across all strands of impacts, the total economic value to the UK economy, over the 2009/10 – 2018/19 period, associated with UKAEA’s activities is estimated to be £1.0 billion in Gross Value Added (GVA), supporting a total of 29,116 job years38. (see Figure 32)
In addition to impacts arising from UKAEA’s activities, UK companies also benefit from contracts for ITER awarded to UK companies by F4E and IO. Impacts arising from ITER’s UK contract expenditure are estimated to be between £267.1 million and £363.7 million in Gross Valued Added to the UK economy, supporting between 5,065 and 6,846 job years.
In addition, potential further impacts arising from spinoffs are estimated to be between £31.3 million and £42.6 million in Gross Value Added to the UK economy, supporting between 700 to 946 job years.
This compares to total UKAEA funding from UK Government sources of approximately £346.7 million over the same period. (Figure 33)39.
The return on the UK Government’s investments in UKAEA is thus estimated to be approximately £2.9 million of Gross Value Added to the UK economy and 84 job years supported for every £1 million invested in UKAEA by the UK Government, counting only the impacts arising from UKAEA’s activities.
Counting also the additional impacts arising from ITER spending and potential spinoffs, the return rises to between £3.7 million and £4.1 million of Gross Value Added to the UK economy and between 100 and 106 job years supported for every £1 million invested in UKAEA by the UK Government.
Note, that these figures only capture impacts arising from UKAEA and ITER UK contract expenditures. Other non-monetised impacts are expected to bring significant additional value to the UK economy. For example, the estimates do not capture contracts with other international fusion authorities (e.g. the US and India). Importantly, the figures also do not capture the significant contribution UKAEA has made to fusion research and adjacent technologies or the substantial future impact arising from working commercial fusion reactors.
38 A job year refers to a job being provided for one year. If the job continues for another year, it is counted as two job years. 39 These mean that the estimated net benefits in GVA are between £1.0bn and £1.1bn from the public spending of £347m in the past 10 years (before additionality adjustments). For comparison with other evaluations, the discounted net benefit (NPV) is estimated to be between £0.8bn and £0.9bn (2009/10 as base year) from the discounted public spending of £297m in the past 10 years.

The impact of the UK’s investments in UKAEA fusion research
65
Figure 32: Total direct, indirect and induced impacts of UKAEA, by strand (2009/10 – 2018/19)
Note: Figures are in real terms (2019 Q1 prices), deflated using ONS GDP deflators. Figures may not sum up due to rounding. Source: London Economics
£163 m -
£104 m
£31 m -
£1,299 m -
£413 m
£198 m
£390 m
£1,000 m
£260 m
£43 m
£1,407 m
£500 m £1,000 m £1,500 m £2,000 m
UKAEA staff expenditure
UKAEA contract expenditure
Other UKAEA expenditure on raw materials…
Total (excluding ITER)
F4E ITER contract expenditure
IO contract expenditure
Potential additional impact by spinoffs (ITER)
Total (including ITER)
GVA, £m
3,004 -
2,061
700 -
34,881 -
10,516
6,336
3,593
8,671
29,116
4,786
946
36,909
0 10,000 20,000 30,000 40,000
Staff employed by UKAEA (incl. hired staff)
UKAEA staff expenditure
UKAEA contract expenditure
Other UKAEA expenditure on raw materials…
Total (excluding ITER)
F4E ITER contract expenditure
IO contract expenditure
Potential additional impact by spinoffs (ITER)
Total (including ITER)
Employment, job years

The impact of the UK’s investments in UKAEA fusion research
66
Figure 33: UKAEA UK Government income (2009/10 – 2018/19)
Note: Figures are in real terms (2019 Q1 prices), deflated using ONS GDP deflators. (*) Records on UK Government income are only readily available from the implementation of UKAEA’s current ERP system (01/04/2016). As such, figures for 2009/10 – 2015/16 were estimated using the average ratio of UK Government income to total UK income for the period 2016/17-2018/19 (83%, see Figure 13 in Section 3). Source: London Economics analysis based on data supplied by UKAEA
£41 m
£32 m £30 m £30 m£34 m £36 m
£29 m £27 m
£41 m
£48 m
£10 m
£20 m
£30 m
£40 m
£50 m
£60 m

The impact of the UK’s investments in UKAEA fusion research
67
6 Additionality of impacts This section provides a discussion on the additionality of the economic impacts of UKAEA’s fusion programme; that is, the proportion of benefits that would not have occurred without the existence of UKAEA.
When assessing the economic benefits of any investment, it is important to also consider additionality of impacts; that is, the proportion of benefits that are additional compared to the counterfactual scenario.
The counterfactual scenario adopted in this study is a ‘do-nothing’ scenario (the “no-UKAEA” counterfactual scenario discussed in Section 1.3). Under this scenario, the UK would not have invested in UKAEA fusion research at all, and the Culham centre would not have been opened.
Nevertheless, parts of the benefits discussed in the previous chapters would likely have occurred even under a scenario where UKAEA did not exist; in particular:
• UKAEA staff are highly skilled and would likely have found employment elsewhere relatively easily if UKAEA had not existed. Some staff, however, may have found employment elsewhere in Europe, or may not have come to the UK in the first place.
• While stakeholders stressed the direct and indirect benefits of UKAEA in winning international contracts; some ITER-related contracts may nevertheless have been awarded to UK companies under the “no-UKAEA” scenario.
A precise estimation of additionality of the discussed impacts is difficult given the data limitations and uncertainty faced in this study (see Section 1.3). Therefore, the following sections provide qualitative evidence on the additionality of each estimated impact.
6.1 Additionality of UKAEA staff expenditure
Additionality of UKAEA staff expenditure is expected to be low. UKAEA staff are highly skilled and would likely have found employment elsewhere relatively easily if UKAEA had not existed. Therefore, while expenditure by these staff may be additional to the local Oxfordshire economy, it is very likely that their spending would have occurred elsewhere in the UK in the absence of UKAEA.
It is true that some staff may have found employment elsewhere in Europe, or may not have come to the UK in the first place. This indicates some additionality of UKAEA staff expenditure. While the number of staff potentially affected cannot be precisely examined without further information, e.g. via a staff survey, it is unlikely that a large enough number of UKAEA staff would have left the country or not come to the UK in the first place in order to make a significant difference to additionality. Therefore, overall additionality of UKAEA staff expenditure, on a UK wide level, is expected to be low.

The impact of the UK’s investments in UKAEA fusion research
68
6.2 Additionality of UKAEA contract expenditure
Under the chosen counterfactual, contract expenditure and other expenditure on raw materials and consumables, and other external expenses by UKAEA would not have taken place.
Given the high capital and operational costs of fusion research, the long timescales, and uncertain returns, it is unlikely that private companies would have made these investments had UKAEA not existed. This is highlighted by the small number of private companies in the UK that are working on developing their own fusion reactors. Moreover, our stakeholder consultations indicate that without Government investment in fusion, a fusion industry may not have developed in the UK. Therefore, activity by UKAEA is likely to have enhanced UK activity and not displaced it.
It should further be noted that only costs accruing to the UK public purse were included in the calculation of costs. Figure 12 in Section 3 shows that approximately half of UKAEA funding was obtained from the European Commission. EU funding was judged as a benefit of UKAEA, by allowing UK Government funding in fusion research to be leveraged by further funding from EU sources. EU funding of UKAEA was therefore excluded from the costs calculation. Note, that it could be argued that the UK indirectly pays for EU funding of UKAEA through its European contributions and therefore the benefits should be adjusted in light of this. However, it should be noted that even in the absence of UKAEA, the UK would still have to make the same contributions to the EU budget. EU funding to UKAEA is therefore additional under the ‘no-UKAEA’ counterfactual.
Additionally, Figure 12 and Figure 13 in Section 3 show that approximately 17% of UKAEA income from UK sources comes from other sources than the UK Government, approximately 10% of overall UKAEA income comes from European sources other than the EC, and a small proportion of UKAEA income comes from outside the UK and Europe. Therefore, it is important to consider to what extent these investments, and the resulting benefits to the UK, are additional under the counterfactual. That is, to what extent these investments would still have occurred in the UK in the absence of UKAEA. Moreover, for investments that are not additional, consideration needs to be given to the magnitude of the benefits resulting from these alternative investments under the counterfactual.
Assessing these considerations quantitatively is difficult and surrounded by considerable uncertainty. However, the fact that the majority of UKAEA income comes from UK Government or EC sources suggests that the overall impact under the counterfactual would be relatively small.
6.3 Additionality of ITER contract contracts to UK companies
Many stakeholders felt that UKAEA’s presence in the UK made a significant contribution to UK businesses securing international fusion contracts. Several industry stakeholders consulted for this study felt that without UKAEA it would be much harder for UK businesses to secure ITER contracts.
UKAEA provides direct support to UK companies in winning international contracts. This support is an important contributor to bringing international contracts to the UK. The majority of industry respondents that had been supported by UKAEA in winning contracts reported that it would have been unlikely or not likely that they would have won the contracts without UKAEA’s support.

The impact of the UK’s investments in UKAEA fusion research
69
While the number of respondents to this question is small, these findings suggest at the very least that UKAEA’s help can make a significant contribution to UK firms winning international contracts.
Moreover, in addition to direct support provided, UKAEA’s world leading fusion expertise and reputation raises the UK’s profile and credibility in fusion energy (see Section 4.4). This world leading role further helps UK companies secure contracts. Indeed, without UKAEA, the UK would likely lack a substantial amount of expertise. In the absence of this expertise knowledge transfer from UKAEA to UK companies would not have happened. Without UKAEA, UK businesses may never have developed the necessary expertise in fusion energy to bid for ITER contracts.
Therefore, while a precise additionality figure for ITER contracts won cannot be drawn with a high degree of certainty, the analysis shows that UKAEA does make an important contribution, whether directly or indirectly, to attracting these contracts to the UK.
Net impacts of ITER
Impacts of ITER contract expenditure derived in this study are gross impacts and do not take account of UKAEA’s monetary contributions to ITER. That said, it should be noted that member states monetary contribution to ITER is very small, with the vast majority of ITER budget coming centrally from the EU.
One way to approximate the UK’s share of ITER costs would be to take the total EU contributions to ITER and apply the share of the UK’s contribution to the EU relative to the total EU budget.
However, as a member of the EU, the UK would still have to make these contributions under the ‘no-UKAEA’ counterfactual. As such, the UK’s contribution to the ITER budget are not additional costs under the baseline scenario relative to the counterfactual scenario.
6.4 Net economic impacts and tipping point analysis
Parts of the estimated benefits would likely have occurred even under a counterfactual scenario where UKAEA did not exist. In particular, UKAEA staff would likely have found employment elsewhere, public and private investment would have gone elsewhere and UK companies may still have been awarded some ITER-related contracts.
There are good reasons to believe that the GVA with UKAEA would be greater than in a counterfactual scenario where UKAEA did not exist. These relate to market failures that UKAEA would have contributed to correcting. For example, investment in fusion power research would be subject to positive externalities leading to greater GVA in other sectors; and there may be skills mismatches in the counterfactual leading to a ‘productivity premium’ from working in/with UKAEA. However, the exact degree of additionality (percentage of gross GVA that would not have occurred in the counterfactual) is highly uncertain.
Table shows the estimated benefits at an illustrative additionality assumption of 10% and at the tipping point percentage where costs equal benefits to date (under different assumptions

The impact of the UK’s investments in UKAEA fusion research
70
for ITER). For each level of additionality, the table presents the implied net benefits – that is additionality adjusted benefits net of costs – and the corresponding benefit cost ratios.
As the analysis shows, an assumed level of additionality of around 30% (25-35%) is needed to reach the breakeven point.
It is important to be clear that the analysis has not taken into account the significant future potential and unmonetized benefits such as future potential benefits of improvements in technology readiness levels and potentially transformative long-term public benefits of ‘de-carbonisation’ and energy security, as well as, the significant contribution UKAEA has made to fusion research and adjacent technologies. These potential benefits are expected to be sizeable but very difficult to estimate due to data availability and high uncertainty.
Table 7: Tipping point analysis of UKAEA benefits Additionality Net benefits Benefit: Cost ratio
Excluding ITER
Using lower ITER
estimates
Using higher ITER
estimates
Excluding ITER
Using lower ITER
estimates
Using higher ITER
estimates
0% -£346.7 m -£346.7 m -£346.7 m - - -
10% -£246.7 m -£216.8 m -£206.0 m 0.3 0.4 0.4
20% -£146.6 m -£87.0 m -£65.4 m 0.6 0.7 0.8
30% -£46.6 m £42.9 m £75.3 m 0.9 1.1 1.2
40% £53.4 m £172.8 m £216.0 m 1.2 1.5 1.6
50% £153.4 m £302.6 m £356.6 m 1.4 1.9 2.0
60% £253.5 m £432.5 m £497.3 m 1.7 2.2 2.4
70% £353.5 m £562.4 m £638.0 m 2.0 2.6 2.8
80% £453.5 m £692.2 m £778.6 m 2.3 3.0 3.2
90% £553.6 m £822.1 m £919.3 m 2.6 3.4 3.7
100% £653.6 m £951.9 m £1,060.0 m 2.9 3.7 4.1
Breakeven 35% 27% 25% 1.0 1.0 1.0
Note: Net benefits show additionality adjusted benefits less UK Government investment in fusion. “Breakeven” shows the additionality assumption needed in order for benefits to equal costs.
Source: London Economics

The impact of the UK’s investments in UKAEA fusion research
71

The impact of the UK’s investments in UKAEA fusion research
72
7 Impact of the “no UKAEA” counterfactual scenario on the UK
This section provides a thought experiment of a scenario in which the UKAEA never existed. It assesses how this would have impacted the UK.
The impacts of the UKAEA described in the previous sections can be appreciated by imagining a scenario where UKAEA’s fusion programme did not exist. In this scenario, the UK would not have invested in fusion research and the UKAEA would never have existed (see Section 1.3 for details of this ‘counterfactual’ scenario). It is likely that the scientific, industrial and skills landscape would have looked markedly different.
Findings in this section are drawn to a large extent, from the online survey, focus groups and depth interviews. The online survey received 43 responses in total, including 13 responses from industry. This is slightly more than the previous EPSRC Independent Review of Fission and Fusion (EPSRC, 2016), which received 41 responses. Nevertheless, the total number of responses is comparatively small. This small sample size leads to some uncertainty surrounding the findings.
Despite these uncertainties, the qualitative evidence presented in this section highlights the importance of UKAEA to the UK.
7.1 Impact on fusion-related research and skills
The scientific impact of a “no UKAEA” counterfactual scenario is likely to be large. Between 2009 and 2018 75% (2,590 out of 3,455) of UK fusion publications can be attributed to the Culham Science Centre40, highlighting the important role that UKAEA plays in UK fusion research.
Knowledge generated at Culham in turn benefits the wider fusion research community as this knowledge is diffused more widely through interactions between Culham and researchers at other UK institutions and publications in academic journals. Figure 34 shows the assessment of academic respondents in relation to the counterfactual. All academics working in fusion would at least be somewhat impacted if the UKAEA did not exist and a majority would feel a major impact.
In addition to direct research output produced by Culham, UK researchers also benefit from the UK’s reputation in fusion research and Culham’s facilities. Indeed, the capital-intensive nature of fusion research further highlights the important role that UKAEA plays. Having a central fusion institution in the UK allows targeted investments for the acquisition and operation of expensive fusion facilities such as the MAST and START tokamaks. Given the high capital costs of fusion reactors, these investments are unlikely to be made by individual research institutions in the absence of UKAEA.
40 This analysis used a predefined topic cluster ‘Magnetoplasma; Tokamak Devices; Plasmas’ in the Scopus database to capture various aspects of nuclear fusion research. This Topic Cluster is made up of 80 topics/key-phrases which were grouped by strong citation links. See Annex 4: Scientific impact of Fusion Research in Culham – Bibliometric analysis.

The impact of the UK’s investments in UKAEA fusion research
73
Figure 34: Impact of "no UKAEA" scenario on academics and universities
Note: Survey questions: When assessing the costs and benefits of investment it is important to consider what would have happened if the UK had not invested in fusion research. In this scenario, UKAEA would not have existed. What impact would this scenario have on you / your organisation …? Graph only shows responses from academic respondents not employed by Culham or UKAEA. N = 25. Source: London Economics survey
These considerations suggest that without UKAEA the UK fusion research base would likely be smaller and less able to undertake cutting edge fusion research due to a potential lack of state-of-the-art fusion facilities.
This assessment is mirrored by qualitative comments of focus group participants and survey respondents. They agree that much less work on fusion research would have been done in the UK if the UKAEA had not existed. The field of fusion research would likely be fragmented, with universities focusing on small scale experiments with far less cooperation.
In contrast, UKAEA and the CCFE are able to take a holistic approach to fusion energy and are able to coordinate and collaborate with universities. UKAEA, at present, collaborates with over 25 UK universities in areas including plasma physics, materials science, advanced computing, technology and engineering. Collaborations with UKAEA give universities access to Culham facilities such as the Materials Research Facility, RACE as well as the ADRIANA (Advanced Digital Radiometric Instrumentation for Applied Nuclear Activities) nuclear instrumentation project. (UKAEA, 2018)
A comparison with fission research is useful. The UK was at the forefront of fission research as early as the 1930s until its funding was ended in the 1980s. Since then, the knowledge base and expertise on fission has reduced significantly in the UK. Currently, the UK only plays a marginal role in fission research and needs to import its knowledge and materials. It is likely that a similar fate would befall fusion research had the UKAEA not been funded.
The skill level in the UK would also be impacted. As noted in Section 4.3, the UKAEA has been an important factor in developing fusion-related skills in the UK through, among others, hosting JET, providing doctoral training through funding PhDs and training high-skilled engineers through its apprenticeship programmes.
52%48%
Major impact Some impact Negligible impact No impact Don’t know

The impact of the UK’s investments in UKAEA fusion research
74
The UK’s skill set would have looked considerably differently had fusion research not been funded. Some professorships and PhD positions would not have existed. The impact, however, reaches further. Section 4.1 shows that fusion research is highly related to other fields, such as robotics, material research and AI. It can, therefore, be expected that – had the UKAEA not existed – the skill sets related to these fields would also have been less developed in the UK.
7.2 Impact on industry
The impact of the counterfactual scenario on industry would have been less severe than on academia. As Figure 36 shows, industry believes the impact of not having the UKAEA to be less impactful, compared with Figure 34. Still 92% of respondents feel that their organisation would at least be somewhat impacted had the UKAEA not existed.
Figure 36: Impact of "no UKAEA" scenario on industry
Note: Survey questions: When assessing the costs and benefits of investment it is important to consider what would have happened if the UK had not invested in fusion research. In this scenario, UKAEA would not have existed. What impact would this scenario have on you / your organisation …? Graph only shows responses from industry respondents. N = 12. Source: London Economics survey
It is likely that many of the industrial impacts described in Section 4.2 would not have happened without the UKAEA. Spinouts from technologies developed at Culham would not exist (although spinouts from universities may still have), the Culham site could not have been exploited as it is now, and the UK would lack a substantial amount of expertise with which to win contracts related to fusion energy.
Part of the reason why the impact is expected to be smaller is that UK businesses focusing only on fusion are a small minority. Rather, many industry stakeholders working on fusion have
17%
75%
8%
Major impact Some impact Negligible impact No impact Don’t know
Figure 35: Apprentice training at Culham
Source: UKAEA © CCFE

The impact of the UK’s investments in UKAEA fusion research
75
long standing experience in related sectors such as fission, remote handling, etc. and are expanding into the fusion sector. As such, the impact of the no UKAEA scenario may have significant impacts on the fusion part of these businesses, but not necessarily on the wider business as a whole. Nevertheless, without UKAEA, private businesses focusing on fusion, such as Tokamak Energy, may not have existed in the UK.
7.3 Alternative uses of the Culham site
Without the UKAEA, the Culham Centre for Fusion Energy (CCFE) would also not have existed in its present form; the land on which it is built would have been used for other purposes. The current site for the CCFE was originally HMS Hornbill, a WWII airfield opened in 1944 as an Aircraft Receipt and Despatch unit for the Royal Navy41. It was operational until 1953 before being converted into a purpose-built fusion laboratory from 1960 to 196542. It is, therefore, useful to see what happened to similar WWII airfields to understand what would have happened to the Culham site in the counterfactual scenario.
The fate of other WWII airfields
Prior to WWII as tensions grew across the continent, the UK engaged in a large-scale effort to match Germany’s Air Force. This construction spree continued throughout the war. Francis et al. (2016) report that in 1939, the UK had a stock of 270 airfields available for military use, a figure rising to 720 by 1945. Once the war was over, most airfields were derequisitioned and either converted for specific or agricultural use. Other fields either continued to be used for military purposes or were left derelict. In particular, Francis et al. (2016) – citing the Aeroplane Directory – note that from 1945
to 1965 the number of operational service airfields in the UK decreased from 720 to 150.
Some of the specific use for decommissioned WWII airfields are listed below (Francis et al., 2016):
• prisons were established in some airfields, such as Acklington, Eastchurch, Ford, Market Harborough and Millom;
• Home Office depots were set up in Dunkeswell and Milfield; • the Composite Signals Organisation Stations for GCHQ was established at Culmhead; • industrial reconversions include Ashbourne, Hixon and Hethel; • motor racing circuits replaced airfields in Castle Combe, Croft, Silverstone, Snetterton
Heath and Thruxton; and,
41 Further information on UK airfields is available here: <http://www.controltowers.co.uk/C/Culham.htm> 42 Further information on Culham’s Centre for Fusion Energy is available here: <http://www.ccfe.ac.uk/CCFE.aspx>
Source: UKAEA © CCFE
Figure 37: Culham Science Centre site

The impact of the UK’s investments in UKAEA fusion research
76
• one of the Cardington’s shed is used for films studios and as a rehearsal space43.
Three airfields – Aldermaston, Bradwell and Harwell – were proposed for nuclear research. Two of these – Aldermaston and Harwell – currently host nuclear research related activities, while the Bradwell site was reconverted for agricultural purposes44.
Many airfields were reemployed in agriculture; notably in factory farming where the large expanses of concrete serve as the foundation for other buildings, such as poultry units (Halesworth, North Pickenham). Others were recently transformed into solar farms, as in Boxted and Gosfield, Wroughton and Wymeswold. Finally, a third group of airfields were left derelict after the war.
7.4 Focus of government investment in absence of the UKAEA
As highlighted above, fusion research is highly related to a number of adjacent technologies. In the absence of UKAEA and fusion research funding, it is plausible that government would have instead invested into these adjacent technologies directly. This would have advanced these technologies. There may, however have been fewer spill-overs, if any at all, from this investment to other sectors and technologies.
Fusion research provides a platform that binds the development of a wide array of technologies and capabilities. Technological development often occurs with direction and purpose. Fusion energy research provides this purpose and provides a long-term goal that may sustain prolonged development. Moreover, fusion research feeds into the development of adjacent technologies such as, among others, robotics, AI and material research.
As noted above, adjacent technologies could be developed and funded separately from fusion. However, several stakeholders consulted for this study highlighted that this would not guarantee the same level of technological advancement. Spending money directly on an adjacent technology, such as robotics, would have led to advances in this field, but would have been less likely to drive innovation in other fields.
Another alternative scenario would have been for the Government to continue investing in fission technology. The knowledge base and expertise in fission research has reduced significantly since fission research funding was ended in the 1980s. The UK currently only plays a marginal role in fission research and imports fission technology from other countries. Had the Government kept investing in fission, the UK may have been able to remain at the forefront of fission research, with the UK potentially having its own fission technology that could be used for domestic reactors as well as exported. However, stakeholders have reported that it is unlikely that a reallocation of fusion funding to fission would have taken place in the absence of UKAEA and fusion.
43 Further information on this airfield and examples of other airfield reconversions are available here: <https://www.bbc.co.uk/news/uk-england-28674396> 44 Further information on Bradwell’s airfield is available here: <http://www.controltowers.co.uk/B/Bradwell_Bay.htm>

The impact of the UK’s investments in UKAEA fusion research
77
8 Environmental impact Unsurprisingly, a site of Culham’s size may have a significant environmental impact. UKAEA is committed to monitoring and reporting on their carbon footprint, implementing good environmental practices into existing systems and improving their carbon footprint. This section provides an overview of UKAEA’s environmental impact, based on data provided by UKAEA in their annual reports.
Figure 38 to Figure 40 suggest that UKAEA has made significant improvements to their environmental footprint in recent years. Specifically, UKAEA’s greenhouse gas emissions and waste disposal have reduced significantly in recent years.
However, it should be noted that UKAEA’s environmental footprint is in large parts due to running and operating machines such as JET and MAST. As a result, greenhouse emissions, energy use and waste production vary depending on how long these machines were operational in a given year. This makes comparison of environmental indicators between years difficult. In particular, greenhouse gas emissions, as well as electricity and water increase during operation of machines, while waste production and staff numbers increase when the machines are shutdown. For example, JET was shut down during the period of 2017/18, resulting in a reduction of UKAEA’s annual carbon footprint compared to the previous year.
Despite these complications, UKAEA’s environmental impact has decreased beyond the reduction caused by shutdowns in machines, due to a number of initiatives by UKAEA; these include:
• UKAEA has implemented a program to reduce the use of fluorinated gases, which was a major driver of the reduction in UKAEA’s carbon footprint in 2015/16 and 2016/17.
• UKAEA has also implemented a number of improvements to reduce their electricity consumption. These include installation of fan controls (in 2014/15) and upgrades to boilers and control systems (2016/17).
• UKAEA encourages staff to use environmentally friendly modes of transport where possible. For example, UKAEA runs a Cycle to Work day annually in summer and operates a car sharing scheme (Culham CarShare lift) . UKAEA also works with local public transport providers to improve public transport to and from the site.
• In 2016/17 UKAEA converted their Environmental Awareness staff training to a computer-based course, resulting in an increase in the proportion of staff trained.
• UKAEA instructs staff to reuse items where possible to minimise waste sent for disposal.
• Compliance with all relevant waste management and environmental permitting legislation is written into contracts of tenants at the Culham site. Moreover, sustainable procurement standards are incorporated into Pre-Qualification Questionnaires and Tender Documents.
UKAEA also has a strong record of recycling, with 74% of non-hazardous waste recycled, reused or composted, on average, between 2011/12 and 2018/19.

The impact of the UK’s investments in UKAEA fusion research
78
Figure 38: UKAEA greenhouse gas emissions (1,000 tCO2e)
Note: Scope 1 emissions represents emissions from activities directly controlled by UKAEA such as from operations of machines or vehicles owned by UKAEA. Scope 2 and 3 emissions includes emissions from consumption of electricity and gas use (Scope 2) and business travel mileage (Scope 3). Source: UKAEA Annual Reports and Accounts
Figure 39: UKAEA water, electricity and gas consumption
Source: UKAEA Annual Reports and Accounts
Figure 40: UKAEA waste disposal
Note: (*) Out of Scope of Regulations (OSR) waste is material where the activity is low enough to fall below the threshold set by the Environmental Permitting Regulations to be classified as radioactive waste. Source: UKAEA Annual Reports and Accounts
8369
100111
80
98
63
98
56
4054
4654 53
30
45
10 15 13 14 12 7 6 5
2011/12 2012/13 2013/14 2014/15 2015/16 2016/17 2017/18 2018/19
Water consumption ('000 m^3) Electricity consumption (million kWh) Gas consumption (million kWh)
796858
802693 694
626
503
659
2011/12 2012/13 2013/14 2014/15 2015/16 2016/17 2017/18 2018/19Total non-hazardous waste Hazardous Waste Total Radioactive / OSR* waste

The impact of the UK’s investments in UKAEA fusion research
79
9 Future opportunities for fusion energy JET is nearing the end of its operational lifespan. Although the project is funded until the end of 2020 (HM Government, 2019), successors are being planned and built. As highlighted in Section 2, the ITER and DEMO projects have been developed, and ITER is currently being built as the next generation tokamak in Europe’s fusion energy research programme. In the UK, the STEP project will be the next step towards developing a commercially-viable fusion power station.
STEP, ITER and DEMO are the next steps in the ultimate goal of creating a viable fusion enery power plant able to deliver abundant, safe and zero-carbon electricity to the grid. Reaching this goal will take a long time; it is estimated that fully operational fusion reactors are 30-50 years removed from now (EUROfusion, 2019b). One condition for such reactors – as noted by one of our interviewees – is that commercial viability needs to be taken into account during the 30-50 year period development period. Without due regard for commercial viability of a fusion reactor, private companies involved in energy generation may not wish to use fusion energy.
It is expected that over the timescale required to mature fusion technology, renewable technology will be able to sustain large parts of energy and electricity demand. This does not, however, mean that there is no space for fusion in the energy mix. Fusion can be part of a balanced mix which minimises the reliance on a single source of energy (EUROfusion, 2019b). Furthermore, it is unlikely that wind and solar energy on their own can support fully decarbonised energy generation in the future (SystemIQ, 2019). This would require the installation of an extra (?) 2,000 TWh of renewable energy capacity (excluding hydropower) to be installed every year, for the next 20 years; current capacity is 2,500 TWh per year.
Fusion will be able to provide baseload electricity production that renewable energy may not be able to produce. Baseload refers to an unchanging minimum level of energy supply provided into the grid. Although some argue that baseload is not an essential feature of a power grid system (e.g. Elliott, 2018; McMahon, 2018), politically the argument in favour of baseload is made (Carrington, 2015).
Fusion energy may take over the role of nuclear fission in providing baseload generation. Nuclear energy accounts for 21% of current UK electricity generation but this is expected to decline due to imminent decommissioning of the current generation of nuclear reactors (World Nuclear Association, 2019). Currently, only one new generation nuclear reactor is being built, but this is subjected to great controversy (Watt, 2017).
Future fusion reactors also present significant commercial opportunities for the UK. This includes benefits to businesses in the form of commercial contracts – for example, for the construction of the facility and manufacture of related materials – as well as opportunities for the wider supply chain; opportunities for future inwards investment; continued benefits from training of highly skilled people in fusion and adjacent technologies; and the opportunity for the UK to be a world leader in the field of Fusion power. (EPSRC, 2015)
The potential future opportunities of commercially viable fusion energy are investigated by Anyaeji (2017). He adapts the UK’s 2050 Energy Calculator model to include commercially viable fusion power from 2045 onwards. The 2050 Energy Calculator has been developed to analyse pathways of future energy consumption and supply in light of the UK’s decarbonisation targets.

The impact of the UK’s investments in UKAEA fusion research
80
Anyaeji (2017)45 shows that a fuel mix that includes commercially viable fusion energy from 2045 onwards can deliver on the government’s emission reduction targets by 2050, while alleviating the pressure to develop technologies for which it is uncertain whether high-volume generation is feasible (e.g. tidal electricity generation). Furthermore, employment of fusion energy may be a relatively economical way of decarbonising electricity generation. This is especially true if infrastructure currently used for fission energy can be re-utilised for fusion reactors (SystemIQ, 2019).
In summary, if the vision of commercially viable fusion power is achieved, the benefits to the UK and other nations in the form of meeting the need of sustainable, low-carbon, reliable and predictable electricity generation could be immense. Fusion is one of the few technologies that could meet this need (EUROfusion, 2018). The UK has an early comparative advantage in fusion energy which can be capitalised on with current and future investment to ensure the UK is a key part of the fusion market in the future (BIS, 2015).
45 See Chapter 4.

The impact of the UK’s investments in UKAEA fusion research
81
10 Conclusions The findings of this study provide a clear evidence base of the value of UK Government investments in UKAEA fusion research. In particular this study has highlighted:
• UKAEA’s significant contributions to the understanding of fusion energy; • advances to “fusion-adjacent” technologies, such as the advancement of robotics
and remote handling, the development of new materials and contributions to computing and artificial intelligence, among others
• improvements in skills leading to a higher skilled workforce; • knowledge transfer between UKAEA and UK Industry as well as academia; • improved fusion reactor designs, and the creation of regulatory standards for
fusion; • contributions to UK public policy and strategy; and, • contributions to public awareness of fusion, and attracting new talent to the fusion sector
via UKAEA’s outreach and public engagement activities.
The economic assessment of benefits provides further evidence of the value of UKAEA fusion research to the UK economy. However, as is the case with any evaluation of big science and R&D investments, estimation of benefits provided significant challenges and uncertainties. As a result, the benefits this study was able to monetise are very small when compared to the significant contribution UKAEA has made to fusion research and adjacent technologies and the potentially transformative long-term public benefits of ‘de-carbonisation’ and energy security of fusion technology. It is vital that these non-monetised, but very important, benefits are considered alongside any economic cost-benefit analysis when making decisions on future investments in fusion research.
Economic benefits assessed in this study should therefore not be seen as a comprehensive estimation of the value of UKAEA and fusion research to the UK but, rather, as evidence that, despite the uncertainties present in the analysis. The UK Government investment in UKAEA has led to significant benefits for the UK.
Given the Terms of Reference for this study, the very long-term ‘option-value’ of fusion energy was not considered in this study. This is an area where future research could investigate.
Future research would benefit from a more in-depth comparison of UK fusion investment with other countries, the different approaches taken to supporting nuclear fusion research internationally and any potential lessons for the UK.

The impact of the UK’s investments in UKAEA fusion research
82
References Anyaji, E. (2017). The Economic Impact of Fusion Power in the UK’s 2050 Energy Mix.
Doctoral Thesis submitted to the University of Reading. Retrieved from http://centaur.reading.ac.uk/72459/1/228364609_Anyaeji_thesis.pdf
Bednyagin, D. (2007). Estimating spillover benefits of Fusion energy research, development demonstration and deployment program. Poster for PhD thesis. École Polytechnique Fédérale de Lausanne.
Braams, C.M. & Stott, P.E. (2002) Nuclear Fusion: half century of magnetic confinement research. Institute of Physics Publishing, Bristol and Philadelphia.
Carrington, D. (2015, July 21). New onshore windfarms still possible without subsidies, says Amber Rudd. The Guardian. Retrieved August 12, 2019, from https://www.theguardian.com/environment/2015/jul/21/new-onshore-wind-farms-still-possible-without-subsidies-says-amber-rudd
Carruthers, R. (1988). The beginning of fusion at Harwell. Plasma Physics and Controlled Fusion, 30(14). DOI: 10.1088/0741-3335/30/14/003
Choi, W., Tho, H., Kim, T., Hwang, S. & Kang., D. (2017). The economic benefits of big science R&D: With a focus on fusion R&D program in Korea. Fusion Engineering and Design, 124, pp. 1263-1268. DOI: 10.1016/j.fusengdes.2017.02.063
Culham Centre for Fusion Energy [CCFE] (2012a). Introduction to fusion. Retrieved June 10, 2019, from http://www.ccfe.ac.uk/introduction.aspx
Culham Centre for Fusion Energy [CCFE] (2012b). Culham Centre for Fusion Energy. Retrieved June 6, 2019, from http://www.ccfe.ac.uk/CCFE.aspx
Culham Centre for Fusion Energy [CCFE] (2012c). The tokamak. Retrieved June 6, 2019. from http://www.ccfe.ac.uk/Tokamak.aspx
Culham Centre for Fusion Energy [CCFE] (2012d). Spherical tokamaks. Retrieved June 6, 2019, from http://www.ccfe.ac.uk/ST.aspx
Culham Centre for Fusion Energy [CCFE] (2012e). MAST. Retrieved June 6, 2019, from http://www.ccfe.ac.uk/MAST.aspx
Culham Centre for Fusion Energy [CCFE] (2012f). Materials Reseach Facility. Retrieved June 6, 2019, from http://www.ccfe.ac.uk/mrf.aspx
Culham Centre for Fusion Energy [CCFE] (2012h). The Sun Dome. Retrieved June 19, 2019, from http://www.ccfe.ac.uk/Sun_Dome.aspx
Culham Centre for Fusion Energy [CCFE] (2017, 7 December). £86 million boost for UK nuclear fusion programme. Retrieved August 30, 2019, from http://www.ccfe.ac.uk/news_detail.aspx?id=438

The impact of the UK’s investments in UKAEA fusion research
83
Culham Centre for Fusion Energy [CCFE] (2018, 18 October). Duke of Cambridge unveils Britain's new fusion energy project at CCFE. Retrieved June 6, 2019, from http://www.ccfe.ac.uk/news_detail.aspx?id=467
Culham Science Centre (n.d.). About us. Retrieved June 6, 2019, from http://www.culham.org.uk/about-us/
Department for Business, Innovation and Skills [BIS] (2015). Triennial Review of the UK Atomic Energy Authority. Retrieved from https://assets.publishing.service.gov.uk/government/uploads/system/uploads/attachment_data/file/460640/bis-15-432-triennial-review-of-the-uk-atomic-energy-authority-September-2015.pdf
Department for Business, Energy & Industrial Strategy [BEIS] (2019). Scientific impact of Fusion Research in Culham: Science Technology and Innovation Analysis.
Elliott, D. (2018, November 21). 100% renewables? No problems. Physics World. Retrieved August 12, 2019, from https://physicsworld.com/a/100-renewables-no-problems/
EPSRC (2015). An Updated 20-year Vision for the UK Contribution to Fusion as an Energy Source. Retrieved June 6, 2019, from https://epsrc.ukri.org/newsevents/pubs/fusion20yearvision/
EPSRC (2016). EPSRC Independent Review of Fission and Fusion. Retrieved from https://epsrc.ukri.org/newsevents/pubs/indrevfissionfusion/
EUROfusion (2018). European Research Roadmap to the Realisation of Fusion Energy. Retireved June 6, 2019 from https://www.euro-fusion.org/fileadmin/user_upload/EUROfusion/Documents/2018_Research_roadmap_long_version_01.pdf
EUROfusion (2019a). The demonstration power plant: DEMO. Retrieved Jun 6, 2019, from https://www.euro-fusion.org/programme/demo/
EUROfusion (2019b). Your questions answered. Retrieved August 12, 2019, from https://www.euro-fusion.org/faq/
European Commission (2017). Interim Evaluation of indirect actions of the Euratom Research and Training Programme 2014-2018. Report from the Group of Experts. Retrieved from: https://ec.europa.eu/research/evaluations/pdf/archive/other_reports_studies_and_documents/panel_report_on_indirect_actions_of_euratom_interim_evaluation_2014-2018.pdf
European Commission (2018). Percipient Storage for Exascale Data Centric Computing2. Retrieved August 7, 2019, from https://cordis.europa.eu/project/rcn/216312/factsheet/en
First Light Fusion Ltd. (2019a). History. Retrieved June 6, 2019, from https://firstlightfusion.com/about/#toppage
First Light Fusion Ltd. (2019b). Technology – First Light’s Approach. Retrieved June 6, 2019, from https://firstlightfusion.com/technology/#our-approach

The impact of the UK’s investments in UKAEA fusion research
84
Francis, P., Flagg, R. & Crisp, G. (2016). Nine Thousand Miles of Concrete: A review of Second World War temporary airfield in England. Retrieved July 29, 2019, from https://research.historicengland.org.uk/Report.aspx?i=15802
Fusion CDT (2016, November 23). UK Fusion Education Programme Scores a Perfect 10/10. Retrieved August 7, 2019, from https://www.fusion-cdt.ac.uk/uk-fusion-education-programme-scores-perfect-1010/
Fusion CDT (2019). About. Retrieved June 6, 2019, from https://www.fusion-cdt.ac.uk/about/
FusionForEnergy. (2019). What Is Fusion? Retrieved June 18, 2019, from https://f4e.europa.eu/understandingfusion/
Glasson, J., Weston, & Chadwick, A. (1995). The Joint European Torus Project Impact on the Local Economy. Impacts Assessment Unit, School of Planning, Oxford Brookes University.
Gnansounou, E. & Bebnyagin, D. (2007). Estimating Spillover Benefits and Social Rate of Return of Fusion Research, Development, Demonstration and Deployment Program: Conceptual Model and Implications for Practical Study. Draft Final Report. Retrieved from: https://www.epfl.ch/labs/bpe/wp-content/uploads/2018/10/EPFL_Fusion-RDDD-Spillovers_01July2007.pdf
Harwell Parish Council (2019). The Atomic Energy Research Establishment. Retrieved June 12, 2019, from https://www.village4a1000years.com/1945-1985-2/the-atomic-energy-research-establishment/
HM Government (2013). Nuclear industrial strategy: the UK's nuclear future. Retrieved from https://assets.publishing.service.gov.uk/government/uploads/system/uploads/attachment_data/file/168048/bis-13-627-nuclear-industrial-strategy-the-uks-nuclear-future.pdf
HM Government (2019). Future of JET secured with new European contract. Retrieved August 12, 2019, from https://www.gov.uk/government/news/future-of-jet-secured-with-new-european-contract
HM Treasury (2018). The Green Book: Central Government Guidance on Appraisal and Evaluation. Retrieved October 23, 2019, from https://assets.publishing.service.gov.uk/government/uploads/system/uploads/attachment_data/file/685903/The_Green_Book.pdf
Hughes, T. (2003, May). Report on the Harwell Parish Plan. Produced by the Steering Group for the Harwell Parish Plan. Retrieved from: http://www.harwellparish.co.uk/uploads/files/village_plan/harwell_report_190503.pdf
ITER (2019a). Advantages of Fusion. Retrieved June 14, 2019, from https://www.iter.org/sci/Fusion
ITER (2019b). What is ITER? Retrieved June 14, 2019, from https://www.iter.org/proj/inafewlines
ITER (2019c). Facts & Figures. Retrieved June 6, 2019, from https://www.iter.org/FactsFigures
MCMahon, J. (2018, June 10). ‘Baseload Is Poison’ And 5 Other Lessons From Germany’s Energy Transition. Forbes. Retrieved August 12, 2019, from

The impact of the UK’s investments in UKAEA fusion research
85
https://www.forbes.com/sites/jeffmcmahon/2018/06/10/baseload-is-poison-and-5-other-lessons-from-germanys-energy-transition/#4056cc3f6f88
National Archives (1999). Records of the United Kingdom Atomic Energy Research Establishment: Harwell. Retrieved June 18, 2019, from https://discovery.nationalarchives.gov.uk/details/r/C1178
National Nuclear User Facility [NNUF] (n.d.) National Nuclear User Facility website. Retrieved June 6, 2019, from http://www.nnuf.ac.uk/
OC Robotics (2014). Rob Buckingham to head up new centre for remote handling. Retrieved June 6, 2019, from http://www.ocrobotics.com/news/rob-buckingham-to-head-up-new-centre-for-remote-handling/
Office for National Statistics (2017). UK business register and employment survey (BRES): 2015 revised. Retrieved June 8, 2019, from https://www.ons.gov.uk/releases/ukbusinessregisterandemploymentsurveybresprovisional2016
Office for National Statistics (2019). UK input-output analytical tables. Retrieved June 8, 2019, from https://www.ons.gov.uk/economy/nationalaccounts/supplyandusetables/datasets/ukinputoutputanalyticaltablesdetailed
Oxfordshire Advanced Skills [OAS] (2019). About OAS. Retrieved June 18, 2019, from https://www.oas.ukaea.uk/about-oas/
Oxfordshire Science and Innovation Audit (2017). Retrieved August 30, 2019, from https://www.oxfordshirelep.com/sites/default/files/uploads/OxTTA%20SIA%20report%20-%20September%202018.pdf
RAS (2014). RAS 2020 Robotics and Autonomous Systems: A national strategy to capture value in a cross-sector UK RAS innovation pipeline through co-ordinated development of assets, challenges, clusters and skills. Retrieved 30 August 2019, from https://static1.squarespace.com/static/5981911c4c0dbff2980ad773/t/59e0e6ae9f745603894d3c33/1507911349074/RAS+UK+Strategy.pdf
Reaction Engines (2018). Reaction Engines Website. Retrieved August 7, 2019, from https://www.reactionengines.co.uk/
Robotic Applications in Challenging Environments [RACE] (2018a). About RACE. Retrieved June 6, 2019, from http://www.race.ukaea.uk/about-race/
Robotic Applications in Challenging Environments [RACE] (2018b). Evolving world of robotics and AI is crucial in shaping future nuclear fusion plants. Retrieved June 6, 2019, from http://www.race.ukaea.uk/evolving-world-robotics-ai-crucial-shaping-future-nuclear-fusion-plants/
Rebut, P.H., Bickerton, R.J. & Keen, B.E. (1985). The Joint European Torus (JET): Installation, First Results and Prospects. For EUROfusion. Retrieved June 17, 2019, from http://www.euro-fusionscipub.org/archives/jet-archive/the-joint-european-torus-jet-installation-first-results-and-prospects

The impact of the UK’s investments in UKAEA fusion research
86
Seife, C. (2008). Sun in a Bottle: The Strange History of Fusion and the Science of Wishful Thinking. Viking Adult, New York.
Smith, C. & Ward, D. (2008). Fusion. Energy Policy, 36(12), pp. 4331-4334. DOI: 10.1016/j.enpol.2008.09.071
SystemIQ (2019, July 12). Electrification and Decarbonisation: The Role of Fusion in Achieving a Zero-Carbon Grid. Retrieved August 12, 2019, from https://www.systemiq.earth/news-1/2019/7/11/electrification-and-decarbonisation-the-role-of-fusion-in-achieving-a-zero-carbon-power-grid
Tokamak Energy (2019). Background: World-class research building on solid foundations. Retrieved June 6, 2019, from https://www.tokamakenergy.co.uk/company/background/
Townsend, M. (2019). The ITER Project a multinational partnership for new energy. Retrieved August 30, 2019, from https://www.niauk.org/wp-content/uploads/2019/07/Martin-Townsend-UKAEA_on-behalf-of-ITER.pdf
Trinomics (2018). Study on the impact of the ITER activities in the EU. Final report
UK Atomic Energy Authority [UKAEA] (2018). Annual Reports and Accounts 2017/18. Retrieved from https://assets.publishing.service.gov.uk/government/uploads/system/uploads/attachment_data/file/737294/UKAEA_annual_report___accounts_2017-18_-_web_version.pdf
UK Atomic Energy Authority [UKAEA] (2019). Mission and Goals 2018/19. Retrieved June 18, 2019, from http://www.ccfe.ac.uk/assets/documents/UKAEA_Mission_&_Goals_Brochure_2018-19.pdf
Watt, H. (2017). Hinkley Point: the ‘dreadful deal’ behind the world’s most expensive power plant. The Guardian. Retrieved August 12, 2019, from https://www.theguardian.com/news/2017/dec/21/hinkley-point-c-dreadful-deal-behind-worlds-most-expensive-power-plant
World Nuclear Association (2019). Nuclear Power in the United Kingdom. Retrieved August 12, 2019, from https://www.world-nuclear.org/information-library/country-profiles/countries-t-z/united-kingdom.aspx

The impact of the UK’s investments in UKAEA fusion research
87
Index of Tables and Figures
Tables
Table 1: UKAEA JET-related income and expenditure, 01/01/14 to 31/03/19 .......................... 27 Table 2: Culham Science Centre research activities by top five Topic Clusters, 2009-2018 (reproduced; partial) ................................................................................................................. 29 Table 3: Impact and publications by IPP and Culham, 1996-May 2019 ................................... 38 Table 4: Fusion research publications by top ten institutions, 2009-2018 (reproduced) ........... 39 Table 5: Procurement expenditure multipliers, by sector ......................................................... 44 Table 6: Direct impact of UKAEA contract spending, by sector (UK only, including JET) ........ 46 Table 7: Direct, indirect and induced impact of UKAEA contract spending, by sector (UK only, including JET) .......................................................................................................................... 48 Table 8: Direct, indirect and induced impact of UKAEA contract spending, by region (UK only, including JET) .......................................................................................................................... 50 Table 9: Weighted average output multiplier ............................................................................ 51 Table 10: Weighted average multipliers ................................................................................... 52 Table 11: Discrepancy between UKAEA annual accounts and UKAEA contract data ............. 54 Table 12: Expenditure multipliers for other UKAEA expenditure on raw materials, consumables and other external expenses .................................................................................................... 55 Table 13: Direct impact of ITER contract spending in the UK, by sector .................................. 58 Table 14: Direct, indirect and induced impact of F4E ITER contract spending in the UK, by sector ....................................................................................................................................... 60 Table 15: Direct, indirect and induced impact of IO contract spending in the UK, by sector .... 61 Table 16: Ratios cumulative ITER impact to potential additional impact of spin-offs ................ 63 Table 17: Likelihood of winning contracts without UKAEA support ........... Error! Bookmark not defined. Table 18: Tipping point analysis of UKAEA benefits ................................................................ 70 Table 19: Logic map ................................................................................................................. 89 Table 20: Survey responses by respondent type ..................................................................... 98 Table 21: Industry responses by occupation ............................................................................ 98
Figures
Figure 1: Total direct, indirect and induced impacts of UKAEA, by strand (2009/10 – 2018/19) 6 Figure 2: Process of fusion ......................................................................................................... 9 Figure 3: Expected costs and benefits of UK investments in UKAEA's fusion programme ...... 11 Figure 4: Overview of study approach ...................................................................................... 12 Figure 5: UK fusion research: key milestones .......................................................................... 17 Figure 6: Culham Science Centre ............................................................................................ 18 Figure 7: Internal view of JET ................................................................................................... 19 Figure 8: External view of MAST .............................................................................................. 19 Figure 9: Spherical vs conventional tokamak ........................................................................... 21 Figure 10: UK Government Expenditure on Fusion, 1974-2005 (nominal and real terms) ....... 23 Figure 11: UKAEA group income and expenditure (nominal terms) ......................................... 24 Figure 12: Proportion of UKAEA group income, by source ...................................................... 24 Figure 13: Proportion of UKAEA UK income from UK Government (2016/17-2018/19 average) ................................................................................................................................................. 25

The impact of the UK’s investments in UKAEA fusion research
88
Figure 14: Proportion of UKAEA group expenditure, by source ............................................... 25 Figure 15: UKAEA revenue by segment, 2010/11-2018/19 average ........................................ 26 Figure 16: UKAEA expenditure by revenue, 2010/11-2018/19 average ................................... 26 Figure 17: UKAEA expenditure in skills and talent investment, 2017-2019 .............................. 26 Figure 18: UKAEA Asset breakdown ....................................................................................... 27 Figure 19: Importance of UKAEA in progressing knowledge of fusion energy ......................... 28 Figure 20: Remote Handling Control Room at JET .................................................................. 32 Figure 21: Standing of UKAEA in fusion research relative to other key fusion countries ......... 38 Figure 22: Overview of direct, indirect and induced impacts .................................................... 43 Figure 23: UKAEA contract expenditure, 2009/10 – 2018/19 ................................................... 45 Figure 24: Total direct, indirect and induced impact of UKAEA contract spending (UK only, including JET) .......................................................................................................................... 47 Figure 25: UK contract expenditure by local authority, 2009/10 – 2018/19 (including JET) ..... 49 Figure 26: UKAEA employment, 2009/10 – 2018/19 ................................................................ 52 Figure 27: Total employment supported directly by UKAEA..................................................... 53 Figure 28: Total direct, indirect and induced impact of UKAEA staff expenditure .................... 53 Figure 29: Total direct, indirect and induced impact of other UKAEA expenditure on raw materials, consumables and other external expenses ............................................................. 55 Figure 30: Total direct, indirect and induced impact of F4E ITER contract spending in the UK 59 Figure 31: Total direct, indirect and induced impact of IO contract spending in the UK ........... 59 Figure 32: Total direct, indirect and induced impacts of UKAEA, by strand (2009/10 – 2018/19) ................................................................................................................................................. 65 Figure 33: UKAEA UK Government income (2009/10 – 2018/19) ............................................ 66 Figure 34: Impact of "no UKAEA" scenario on academics and universities ............................. 73 Figure 35: Apprentice training at Culham ................................................................................. 74 Figure 36: Impact of "no UKAEA" scenario on industry ............................................................ 74 Figure 37: Culham Science Centre site .................................................................................... 75 Figure 38: UKAEA greenhouse gas emissions (1,000 tCO2e) ................................................. 78 Figure 39: UKAEA water, electricity and gas consumption ...................................................... 78 Figure 40: UKAEA waste disposal ........................................................................................... 78 Figure 41: Overview of methodology ........................................................................................ 94

The impact of the UK’s investments in UKAEA fusion research
89
Annexes
Annex 1: Logic map Table 17: Logic map
Context1 Inputs Outputs Outcomes and Impacts
Goals Long-term Impacts
Long-term Goals
Continue to support international fusion science at JET
Support research on MAST and the MAST Upgrade facility that will ‘provide a centre of excellence for the UK once JET is decommissioned.’
Support research into materials and technology in support of the ITER project
R&D investments (e.g. research grants and experimental costs)
Investments in facilities and equipment
Administration and staff costs
Investment in other activities (skills development, industry collaborations, outreach, etc.)
Research and Development (e.g. fusion and materials research)
Collaborations with Industry/Academia (incl. consultancy and renting out facilities)
Development of fusion regulations
Software Development
Student placements / In-house PhD training
Employment incl. work experience and
Increase in volume and quality of UK fusion and materials research
Direct commercial benefits to UK industry (e.g. fusion spin-offs, patents and other IP rights, helping UK firms win further contracts and international projects, etc.)
Creation of direct employment (e.g. researchers and other staff)
First generation of commercial fusion power and associated benefits (e.g. carbon neutral energy generation)
Improvement and expansion of adjacent industries (manufacturing and related sciences)
Contribute to UK economic growth by providing clean energy technology for export
Strengthen capability and growth in the UK fusion sector and adjacent technological sectors
Establish a supply chain and product that can be sold to a global market worth trillions of pounds
Create a greener and sustainable
Introduce the next generation of innovative and disruptive technologies
Ensure affordability of fusion solutions for national needs
Ensure a reliable and efficient energy infrastructure which ‘underpins the UK economy’
Development of new tools to ‘adapt to and mitigate climate change’

The impact of the UK’s investments in UKAEA fusion research
90
apprenticeship schemes
Building work and construction and set-up of infrastructure and equipment
R&D on buildings (e.g. reactor design)
Outreach
Improved fusion reactor design (leading to benefits such as reduced reactor design costs)
Improvements in skills leading to a higher skilled workforce
Creation of a set of fusion regulatory standards
environment with cleaner energy sources
Secure substantial inward and private investment into UK science towards 2.4% of GDP target
Enhanced UK fusion research impact and advance fusion science progress
Note: Any, and all, elements in a column can feed in multiple combinations to lead to any of the outcomes/impacts of the column following it – each output is not directly associated with a single input etc.
Source: London Economics; (1) EPSRC (n.d.). UK Magnetic Fusion Research Programme. Available at: https://epsrc.ukri.org/research/ourportfolio/researchareas/ukmagfusion [accessed 13/06/2019]

The impact of the UK’s investments in UKAEA fusion research
91
Annex 2: Methodological annex
This annex provides an overview of the methodology used in this study and a discussion on the rationale for adopting this methodology.
Overview of methodology
To estimate impacts of public investment in UKAEA fusion research, the analysis considered four strands:
• The impact of UKAEA expenditure on contracts. This data was provided to LE by the UKAEA from their Enterprise Resource Planning System (ERP).
• The impact of other UKAEA expenditure on raw materials and other external expenses. This data was accessed from UKAEA annual reports.
• The impact of expenditure by UKAEA staff; and,
• The impact of additional ITER (F4E and IO) contracts to UK companies and the potential additional benefit from spin-offs.
Impact of UKAEA contract expenditure
The analysis made use of data from UK Input-Output tables (for 2015)46 produced by the Office for National Statistics (2019), measuring the total production output of each industry in the UK economy, and the inter-industry (and intra-industry) flows of goods and services consumed and produced by each of these sectors.
To allow calculation of employment impacts, UK Input-Output tables were combined with employment data obtained from the UK business register and employment survey (for 2015)47 produced by the Office for National Statistics (2017).
While the original Input-Output tables were provided separately for 129 sub-sectors, for the purpose of the analysis, we aggregated these tables into ten (more high-level) industries48.
This was necessary to be able to calculate multipliers in terms of employment, since the corresponding employment data required for this calculation (again for 2015, sourced from the Office for National Statistics (2017)) were not available at the very granular (i.e. 129-sector) level. The Input-Output tables were then used to generate measures of GVA per output and
46 Given the complexity involved in the collation of national Input-Output tables, there is a significant delay in the publication of Input-Output analytical tables for any given year. At the time of writing, 2015 was the latest year for which these tables were available. 47 2015 employment data was used to be consistent with the latest Input-Output tables. As with UK Input-Output tables above, there is a delay in the publication of these statistics, with revised 2015 data having been published by the ONS in 2017. 48 This choice was made for simplicity as well as to provide consistency between the output and employment estimates, but also to avoid further uncertainties around classification of firms into granular sectors (discussed in further detail later in this section). The ten aggregate sectors are: Agriculture; Production; Construction; Distribution, transport, hotels and restaurants; Information and communication; Financial and insurance; Real estate; Professional and support activities; Government, health & education; and, Other services.

The impact of the UK’s investments in UKAEA fusion research
92
employment per output for each of the ten industries, as well as, multipliers capturing the total direct, indirect and induced effects of output spending by sector.
These measures were then combined with contract data on contract expenditure with UK firms, from UKAEA’s business ERP system, to calculate impacts of UKAEA contract expenditure. (see Section 5.1) This analysis was done on a sectoral basis, by assigning each contract to one of the ten high-level industries using the Nomenclature of Economic Activities (NACE) code of the firm that won each contract49.
Impact of other UKAEA expenditure UKAEA contract expenditure data held within UKAEA’s business ERP system did not capture all spending on raw materials and consumables, and other external expenses reported in UKAEA’s annual reports. Therefore, we also considered impacts of other UK expenditure on raw materials and other external expenses50. As the analysis cannot distinguish the industries this expenditure flows to, multipliers for the for the general government, health and education sector as a whole were used for this analysis. (see Section 5.3).
Impact of UKAEA staff expenditure
To calculate impacts of expenditure by UKAEA staff, the analysis considered household expenditure across the ten high level sectors to derive a weighted average household expenditure multiplier51. This multiplier was then combined with an estimate of UKAEA staff expenditure on goods and services, derived by adjusting UKAEA staff expenditure by employer and employee national insurance contributions and income tax as well as for household savings52. (see Section 5.2)
Impact of additional ITER (F4E and IO) contracts to UK companies
The presence of UKAEA also helps bring further investment to the UK, for example, in the form of contracts associated with the construction and manufacture of ITER-related materials. Having these contracts in the UK brings further direct economic benefits for UK industry, as well as their suppliers and the wider UK economy. To estimate these impacts, the analysis considered contracts placed with UK organisations by Fusion for Energy (F4E) and the ITER Organisations (IO). Similarly to the analysis of UKAEA contract expenditure, ITER related contracted expenditure was aggregated into the ten high-level industries and combined with multipliers derived from Input-Output tables53.(see Section 5.4)
The analysis in Section 5.4 further considered the potential additional benefits from spin-offs (ITER only). To calculate the potential additional benefit from spin-offs, the analysis
49 To obtain the NACE code for each contract, firms were matched to Orbis, a database providing information on a large number of companies across the globe. 50 To avoid double-counting, expenditure data from UKAEA’s annual accounts was adjusted for the proportion already captured by UKAEA contract data. A further adjustment was made to account for leakage (i.e. expenditure outside of the UK). 51 Note, the analysis therefore implicitly assumes that spending by UKAEA staff follows a similar pattern as spending by UK households overall. 52 The analysis uses the Households' & NPISH saving ratio published by the Office for National statistics. Therefore, the analysis implicitly assumes that the savings rate of UKAEA staff is similar to the national savings rate of UK Households overall. 53 It should be noted that F4E and IO data used in this analysis significantly underestimate the real expenditure flowing to UK companies. The reasons for this are detailed in Section 5.4.

The impact of the UK’s investments in UKAEA fusion research
93
applies the ratio of estimated benefits to potential additional benefit from spin-offs from Trinomics (2018) to ITER data used in this report.54
54 The analysis therefore implicitly assumes that the EU survey data collected for the Trinomics ITER report also holds for the UK. This specifically applies to the 35% of survey respondents who confirmed they had developed new cutting-edge technologies (see Annex D of Trinomics (2018)).

The impact of the UK’s investments in UKAEA fusion research
94
Figure 41: Overview of methodology
Source: London Economics
UKAEA expenditure
Staff expenditure
UK contract expenditure
Other UK expenditure on raw materials and other
external expenses
F4E ITER UK contract
expenditure
IO ITER UK contract expenditure
Total ITER UK contract expenditure
Increase in gross output and GVA for companies
awarded contracts / suppliers
Increase in employment
Increase in disposable income
Increase in consumption
Increase in gross output and GVA
Direct output effect
Increase in gross output and GVA along supply
chain (spillover effects)
Indirect output effect
Indirect employment effect
Induced output effect
Induced employment effect
UKAEA expenditureAdditional contracts attracted to UKImpacts
Direct employment effect
Potential additional benefit from spin-offs
Direct job creation by UKAEA

The impact of the UK’s investments in UKAEA fusion research
95
Rationale for the chosen modelling approach
Fusion is a capital-intensive long-term investment, offering the promise of significant benefits in the form of a safe, green, and abundant power source. The real returns from fusion are the benefits brought by working commercial fusion power. However, commercial fusion reactors are still a long way off. As the study sought to assess benefits from investments in UKAEA fusion research that have already materialised, future benefits of commercial fusion power were excluded from the assessment.
Another key benefit of UKAEA fusion research is the contribution UKAEA makes to the advancement of scientific knowledge in fusion and adjacent technology fields such as materials science and robotics. A large body of literature suggests that scientific research and discovery leads to wider economic benefits, for example, through knowledge spillovers. However, while it is clear that research benefits society in general and benefits can often take a long time to materialise and are extremely difficult to assess.
Given these limitations, the study focused on assessing benefits from UKAEA’s economic activities. The ‘Green Book’ (HM Treasury, 2018) recommends a bottom-up approach to modelling benefits. However, quantitative benefits data from the online survey, interviews and desk-based research conducted as part of this study were limited. Due to these data limitations a bottom up estimation of benefits was not possible.
The Input-Output approach was chosen as it allowed for the estimation of direct economic benefits to UKAEA’s suppliers as well as indirect and spillover effects occurring along the supply chain. Input-Output analysis further enabled us to capture increased job opportunities supported by UKAEA’s economic activities, as well as the ripple effects generated through increased disposable income and consumption.
In addition to benefits resulting from UKAEA’s economic activity in the UK, the analysis further sought to assess benefits of foreign investment attracted to the UK. In particular, the analysis sought to estimate benefits of contracts placed with UK companies in relation to ITER. The Input-Output approach chosen allowed assessment of the direct and spillover benefits of ITER-related contract spending with UK firms. A similar approach was also used to assess benefits of ITER spending across the EU in a recent study by Trinomics (Trinomics 2018).
Caveats and Limitations
UKAEA and ITER contract expenditure: use of aggregate sectors The input-output analysis used to monetise the benefits of UKAEA and ITER contract spend uses ten high level sector definitions rather than the more disaggregated sector definitions. The reasoning for this approach was two-fold.
First, in order to calculate employment multipliers it was not possible to use a more disaggregated sector definition as the ONS does not report employment data at a more desegregated level (again for 2015, sourced from the Office for National Statistics (2017)) were not available at the very granular (i.e. 129-sector) level.
Second, to allocate spend to more disaggregated sector definitions with confidence significant further research would have been required. One example of this are firms undertaking more than one function, which therefore cannot neatly be classified into just one granular sector. For example, a firm may produce both iron (IOG 24.1-3) as well as other basic metals (IOG 24.4-5).

The impact of the UK’s investments in UKAEA fusion research
96
The implication of using the ten high level sector definitions is that the analysis assumes that supply chain patterns of UKAEA and ITER suppliers follow the same, or at least broadly similar, patterns as those for the high-level sectors overall. However, fusion supply chains may be different, and these differences can reduce the robustness of the estimates for fusion specifically.
A common way to deal with this problem is to assign companies to the sector in which the company has the largest share of its revenue. The problem with this approach is that all contracts awarded to that supplier would be assessed using multipliers for that sector, even if the supplied products do not match the sector classification. This approach would give rise to the same problem as using the ten high level sector definitions. That the supply chains do not match those of the firms providing products to the UKAEA. But it would also add the additional issue of having to allocate suppliers to these more disaggregate definitions.
Assigning companies to the aggregate sectors was straightforward in most cases due to the more distinct nature of the aggregate sectors. Whether the uncertainty of more granular sector assignments would have been smaller or larger than the error introduced by using aggregate multipliers instead of the more granular multipliers is difficult to say. However, differences in the results of multiplier effects using more granular I-O data are likely to be small.
Establishing the magnitude of the potential error in both the aggregate and more granular case would require a more comprehensive supply chain assessment of UKAEA and ITER contract suppliers. This was not possible given the scope and timelines of this study.
Unaccounted UKAEA expenditure
Contract expenditure data held within UKAEA’s business ERP system only accounted for approximately 40% of UKAEA spend on raw materials and consumables, and other external expenses reported in UKAEA’s annual reports. As such, only accounting for impacts derived from UKAEA contract expenditure data would significantly underestimate the overall impact of UKAEA. Therefore, the analysis used economic multipliers for the general government, health & education sector to account for spending effects of UKAEA expenditure not accounted for in UKAEA’s business ERP system. However, without further knowledge on where the money is spent, uncertainty surrounds these estimates. Specifically, the analysis assumes that spending patterns of unaccounted UKAEA expenditure follows spending patterns of the general government, health & education sector overall. While this is a pragmatic solution it does mean that the analysis assumes that the spending patterns of this expenditure follow the spending patterns of the government, health & education sector overall.
UKAEA staff expenditure
Similarly to the potential limitation stemming from the possibility that UKAEA / ITER supply chains may be different to those of the aggregate sectors used, the analysis of UKAEA staff expenditure relies on expenditure, as well as savings rates, by UKAEA staff being similar to that of other households in the UK. This may not necessarily be the case. In particular, average earnings by UKAEA staff are higher than the national average. Therefore, expenditure and savings patterns may differ.
Establishing the magnitude of the differences between UKAEA staff expenditures and other households in the UK would require a survey of UKAEA staff to establish their spending and savings pattern. This was beyond the scope of this study.
Underestimation of ITER impacts

The impact of the UK’s investments in UKAEA fusion research
97
As discussed in Section 5.4, ITER expenditure figures used in the analysis potentially significantly underestimate the real expenditure flowing to UK companies. Therefore, the ITER impacts derived in this analysis should be seen as conservative estimates. A fuller discussion on this issue is provided in Section 5.4.

The impact of the UK’s investments in UKAEA fusion research
98
Annex 3: Survey
This annex provides additional details on the survey undertaken as part of the study. The annex first provides a high-level analysis of the number of survey responses received. The second part of this annex provides an overview of how the sampling frame for the survey was compiled. Finally, a word version of the online questionnaire is provided.
The survey received 43 completed responses from UKAEA, academia and industry. The number of responses received are broken down, by respondent type, in Table 18.
Table 18: Survey responses by respondent type Respondent type No. of responses Proportion
Culham / UKAEA employee 3 7%
Academic respondent (not employed by Culham/UKAEA)
26 60%
Respondent for a UK company 11 26%
Respondent for the UK office of a non-UK company
0 0%
Respondent for a non-UK company 2 5%
Advisory organisation 0 0%
Other* 1 2%
Total 43 100%
Note: (*) The other response came from an academic seconded to UKAEA for half of his time. Source: London Economics
Of the 13 responses received from industry, six were from directors or chief executives of organisations. The remaining seven were from managers or senior officials. (Table 19)
Table 19: Industry responses by occupation Occupation No. of
responses Proportion
Director or chief executive of organisations (Director)
6 46%
Professional Occupations without managerial responsibilities (including academics)
0 0%
Managers and Senior Officials (Senior Manager)
7 54%

The impact of the UK’s investments in UKAEA fusion research
99
Associate Professional and technical occupations (Middle Manager - Junior Manager)
0 0%
Administrative and secretarial occupations (clerical)
0 0%
Don't know / not applicable 0 0%
Total 13 100%
Note: Categories were provided by BEIS. Source: London Economics Compilation of sampling frame
Given the specialised area of the evaluation, no publicly available sampling frame/business registers for the survey existed. Therefore, a sampling frame of key stakeholders including industrial specialists, leading academics in fusion research and businesses supported by CCFE was compiled from the following sources:
• stakeholders from the previous EPSRC Independent Review of Fission and Fusion (EPSRC, 2016);
• an analysis of Gateway to Research to identify projects which mention Culham or Fusion;
• desk research on leading academics and private companies working in the fusion sector; and,
• a list of industry stakeholders from UK organisations in the UK fusion supply chain, identified by the Department for International Trade
This resulted in the following sampling frame, which formed the basis for the survey:
• 95 academics from 22 institutions; and,
• 66 contacts from industry from 31 organisations (16 UK and 15 foreign organisations, mostly from the US).
In addition, UKAEA also distributed the survey among their own contacts in the field, mostly from industry.

The impact of the UK’s investments in UKAEA fusion research
100
Survey questionnaire
The impact of the UK’s investments in UKAEA nuclear fusion research Welcome to our survey - what is this survey about? The Department for Business, Energy and Industrial Strategy (BEIS) has engaged London Economics (LE) to assess the costs and benefits of the UK Atomic Energy Authority (UKAEA) fusion research and its associated infrastructure on the UK. The study will generate evidence to inform future UK government policy and investment relating to UKAEA nuclear fusion research. The study seeks to capture the costs and benefits of UKAEA fusion research funding from the 1950s at Harwell, through the establishment of the Culham Centre for Fusion Technology and up to the present day. It will also seek to look forward encompassing the future projected benefits of fusion research. Your input to this study is key to the success of the study, and to ensure we capture all impacts from fusion research. How long will it take? We estimate that it will take around 15 minutes to complete this survey. You can complete it in one session or select 'Save and Continue Later'. You can also print your completed survey by selecting the 'Print My Response' button. Mandatory questions are marked with a *. Is it confidential? Responses to this survey will be collected and analysed by London Economics, and only aggregate answers will be published. The information you provide will also be provided to BEIS for recording and analysis. Individual respondent information will only be shared with BEIS in anonymised form. For further information, please refer to London Economics’ and BEIS’s privacy policies:
• https://londoneconomics.co.uk/privacy-policy/ • https://www.gov.uk/government/organisations/department-for-business-energy-and-industrial-
strategy/about/personal-information-charter Who can I contact about the survey? Should you have any questions in relation to this survey, please do not hesitate to contact Daniel Herr ([email protected]) at London Economics and Yi Zhang ([email protected]) at BEIS. We realise that your time is valuable and would like to thank you in advance for taking the time to participate in this survey.

The impact of the UK’s investments in UKAEA fusion research
101
About your organisation
1. Please provide your details below*.
Organisation / university name*:
Your name:
Your department:
Your role:
Your email:
Your phone number:
2. What type of respondent are you*?
Culham / UKAEA employee Academic respondent (not employed by Culham/UKAEA) Respondent for a UK company Respondent for the UK office of a non-UK company Respondent for a non-UK company Advisory organisation Other (please specify):
3. If representing an organisation, what is your occupation?*
Director or chief executive of organisations (Director) Professional Occupations without managerial responsibilities (including academics) Managers and Senior Officials (Senior Manager) Associate Professional and technical occupations (Middle Manager - Junior Manager) Administrative and secretarial occupations (clerical) Don’t know / not applicable
4. Please briefly describe your work / the work of your organisation.

The impact of the UK’s investments in UKAEA fusion research
102
About your work with the UKAEA Do not ask respondents from UKAEA / Culham In this section we would like to know about your work with UKAEA and the benefits you and / or your organisation derive from working with UKAEA. Please provide as much detail as possible in your answers. 5. Are you involved in any work with UKAEA for example via commercial tender awards, sub-
contracts, grants, research collaborations, etc? Yes No Don’t know / not applicable
6. If yes: Please briefly describe your / your organisation’s work with UKAEA.
7. If yes: Please describe how this work is structured. Please select all that apply.
o Commercial competitive tender award o Sub-contract o Grant o Research collaboration
o Others (please specify):
8. If yes: What benefits has working with UKAEA brought to you / your organisation?
9. If yes: What synergies do you see between UKAEA ’s activities and those of you / your organisation?
10. If yes: Has your/your organisation’s work with UKAEA translated into any licensing agreements, patents, or other intellectual property rights?
Yes No Don’t know / not applicable
11. If yes, please can you provide further details on the licensing agreements, patents, or other intellectual property rights that your work with UKAEA translated into.

The impact of the UK’s investments in UKAEA fusion research
103
Scientific impacts This section focuses on the scientific impacts of UKAEA nuclear fusion research. 12. How would you rate UKAEA’s standing in fusion research relative to other key fusion
countries?
Very strong Strong Average Weak Very weak Don’t know / not applicable
13. If not don’t know / not applicable: Please explain the reasoning for your response.
14. In your opinion, how important has UKAEA been in helping progress the scientific understanding of nuclear fusion internationally?
Very Important Important Moderately Important Slightly Important Not Important Don’t know / not applicable
15. If not don’t know / not applicable: Please explain the reasoning for your response.
16. In your opinion, what have been the key scientific contributions of the UKAEA to date in nuclear fusion?
17. Academics only: Has working with UKAEA contributed to or led to any other research collaborations in the UK or internationally for yourself and/or your research group?
The impact of the UK’s investments in UKAEA fusion research
104
Yes No Don’t know / not applicable
18. If yes, please provide further details on these collaborations and the contribution of the
UKAEA.
Advancement in related technologies
In this section we want to know about related technologies which investment in UKAEA nuclear fusion research has enabled. 19. In your opinion what related technologies has investment in UKAEA nuclear fusion research
enabled?
20. How has UKAEA investment in nuclear fusion research enabled this technology?
21. In your opinion what benefits has this brought to the UK?
22. What would have happened in the absence of UK nuclear fusion research investment?
Commercial impacts
In this section we would like to know about the commercial benefits to your organisation of working with UKAEA. ASK respondents from industry only 23. Has your organisation been supported by UKAEA in winning contracts from any national or
international projects?
Yes No

The impact of the UK’s investments in UKAEA fusion research
105
Don’t know / not applicable
24. If yes: How did UKAEA support your organisation in winning these contracts?
25. If yes: what proportion of activities from the contracts will occur /have taken place in the UK:
All Most About half Little None Don’t know / not applicable
26. If yes: How would you rate the support your organisation has received from UKAEA?
Strongly positive Slightly positive Neither positive nor negative Slightly negative Strongly negative Don’t know / not applicable
Comment:
27. If yes: Please provide the number and value as well as a short description of the contracts won and the support received by UKAEA. If you don’t know for sure, please provide an estimate.
Short description of contracts won and support received by UKAEA:
28. If yes: Without UKAEA’s support, how likely would your organisation have won the contracts?
Very likely Likely Neither likely nor unlikely Unlikely Not likely Don’t know / not applicable
Number of contracts won: Total value of contracts won (in £):
National projects International projects

The impact of the UK’s investments in UKAEA fusion research
106
29. Has your work with UKAEA helped your organisation to reduce any costs, increase sales / turnover, create employment or led to any investments?
Yes No Don’t know / not applicable
30. If yes: Please briefly describe how your work with UKAEA has helped your organisation
reduce any costs, increase sales / turnover, create employment or led to any increases in investments. Please provide estimates where possible.
How has your work with UKAEA helped reduce costs, increase sales / turnover, or create employment?
Estimated cost savings (in £):
Estimated sales/turnover increases (in £):*
Estimated no. of full-time-equivalent Jobs created:
Estimated increase in investment (in £):
* Please note, your answer should exclude contracts won with the support of UKAEA, as this is already captured in the previous set of questions.
31. Has your work with UKAEA helped your organisation develop new products or services? Yes No Don’t know / not applicable
32. IF yes: Please briefly describe the products/services that your work with UKAEA has helped
develop.
33. Do you feel that other organisations within your supply chain have received benefits as a result of your organisation’s work with UKAEA? Yes No

The impact of the UK’s investments in UKAEA fusion research
107
Don’t know / not applicable
34. IF yes: Who has received these benefits? Please select all that apply. Clients Suppliers Partners Customers
Others (please specify):
35. IF yes: What kind of benefits have they received (e.g. cost-reduction, increase in sales/turnover, employment created, etc.)?
36. IF yes: Can the impact be estimated?
Training and skills
In this section we ask about the impact of UKAEA’s training activities
37. What benefits does the UKAEA apprenticeship programme generate for nuclear fusion research in the UK and for the UK economy outside of nuclear fusion?
38. What other benefits are there outside of the apprenticeship programme?
39. How does the UKAEA apprenticeship programme meet the future capability needs of the UK
nuclear fusion sector?

The impact of the UK’s investments in UKAEA fusion research
108
Counterfactual scenario
When assessing the costs and benefits of investment it is important to consider what would have happened if the UK had not invested in nuclear fusion research. In this scenario, UKAEA would not have existed.
40. What would UK nuclear fusion research look like under this scenario?
41. What impact would this scenario have on you / your organisation …?
Major impact Some impact Negligible impact No impact Don’t know / not applicable
42. If not no impact or Don’t know / not applicable: Please describe the impact this scenario
would have on you / your organisation.
43. Nuclear fusion research has also led to innovations in adjacent technologies such as
robotics. If the UK had not invested in nuclear fusion directly, which adjacent technology should the government have invested the money in instead?
44. In broad terms what do you think the benefits of directly investing in this adjacent
technology may have been compared to investing in nuclear fusion research?

The impact of the UK’s investments in UKAEA fusion research
109
Annex 4: Scientific impact of Fusion Research in Culham – Bibliometric analysis

October 2019
SCIENTIFIC IMPACT OF FUSION RESEARCH IN CULHAM
Science, Technology and Innovation Analysis

© Crown copyright 2019
This publication is licensed under the terms of the Open Government Licence v3.0 except where otherwise stated. To view this licence, visit nationalarchives.gov.uk/doc/open-government-licence/version/3 or write to the Information Policy Team, The National Archives, Kew, London TW9 4DU, or email: [email protected].
Where we have identified any third-party copyright information you will need to obtain permission from the copyright holders concerned.
Any enquiries regarding this publication should be sent to us at: [email protected] [replace with team email address if available]

112
Contents Introduction ____________________________________________________________ 113
Overview of research activities in the Culham Science Centre _____________________ 113
Comparison with Max Planck Institute for Plasma Physics ________________________ 116
Trends in Nuclear Fusion Research _________________________________________ 117

The impact of the UK’s investments in UKAEA fusion research
113
Introduction
In this paper, we analysed scientific publications and citations using the Elsevier Scopus database55 to set out evidence on the impact and quantity of fusion research in the past decade undertaken by the United Kingdom Atomic Energy Authority (UKAEA)/Culham Science Centre. In the Scopus database, the Culham Science Centre is an institution entity representing UKAEA, Euratom UKAEA Fusion Association, EFDA-JET and Culham Lab. Further, the paper outlines how UKAEA nuclear fusion research compares with other top institutions in the same field and trends in fusion research across major economies in the world.
Overview of research activities in the Culham Science Centre
The United Kingdom Atomic Energy Authority own and manage the Culham Science Centre. The Culham Science Centre combines world-class publicly funded research into fusion power, commercial technology organisations and Culham Innovation Centre, to create a powerhouse of high technology innovation and enterprise in South Oxfordshire.
Since 2009, the Culham Science Centre have produced 3267 publications from 2241 authors with a field weighted citation impact (FWCI) score of 1.53. This means publications from the Centre received 53% more citations compared to publications on average in the same fields and over the same period. Figure 1 below shows subject areas of the publications from the Culham Science Centre are predominated by Physics/Astronomy (2563), Energy (1191), Material Science (860) and engineering (614). The field weighted citation impacts of the publications on these four subjects from the Culham Centre range from 1.5 to 1.9, indicating high research impacts.
Figure 1: Publications by subject area, Culham Science Centre, 2009-2018
Source: BEIS analysis of Scopus Database, Elsevier.
Notes:
• Others include another 21 subjects ranging from Maths to Nursing.
55 Scopus is the largest abstract and citation database of peer-reviewed literature: scientific journals, books and conference proceedings. Scopus has 55 million records dating back to 1823. BEIS purchased access to the last decade data on most metrics.
1.3
1.6
1.9
1.8
1.5
2.0 1.8 1.6 1.4 1.2 1.0 0.8 0.6 0.4 0.2 0.0
Field weighted citation impact
357
614
860
1191
2563
0 500 1000 1500 2000 2500 3000
others
Engineering
Materials Science
Energy
Physics and Astronomy
Number of publications

The impact of the UK’s investments in UKAEA fusion research
114
• Publications can be assigned to more than one subject.
In addition to subject areas, the Scopus database allows us to examine more detailed research activities by looking at topic clusters which are formed by aggregating key phases in publications with similar research interests together to form a broader, higher-level area of research. Table 1 below exhibits the top five topic clusters of the Culham Science Centre publications with the largest cluster (Magnetoplasma; Tokamak Devices; Plasmas) accounting for 79% of total publications from the Centre and 7.2% of world publications in the same topic cluster in 2009-2018.
Table 1: Culham Science Centre research activities by top five Topic Clusters, 2009-2018
Topic Cluster Number of publications
% of Culham publications
Share of the same topic cluster publications (%)
Field-Weighted Citation Impact
Magnetoplasma; Tokamak Devices; Plasmas 2590 79 7.7 1.6
Microstructure; Steel; Austenite 99 3 0.1 2.3
Discharge; Plasma Applications; Plasma Jets 40 1 0.1 2.1
Magnetic Fields; Ionospheres; Sunspots 35 1 0.1 1.3
Secondary Batteries; Electric Batteries; Lithium Alloys 30 1 0.0 2.3
Source: BEIS analysis of Scopus Database, Elsevier
Note: FWCI for the group containing fewer than 100 publications is indicative.
Research in the Culham Science Centre is more collaborative than the UK average. In 2009-18, about 80% of publications from the centre have international co-authors (Table 2) compared to 46% of publications that have international co-authors in the UK. Around 8% of the publications from the centre have both academic and corporate affiliations, which is greater than the proportion of total UK academia and corporate publications (4.7%) in the same period, indicating the Centre’s strong link to academia.
As the largest intuitional collaborator of the Culham Centre, Max Planck Institute for Plasma Physics co-authored 835 publications with the Centre, making up 26% of total publications produced from the Culham Centre in 2009-19. This is followed by the France Alternative

The impact of the UK’s investments in UKAEA fusion research
115
Energies and Atomic Energy Commission (CEA) and Italy National Agency for New Technologies, Energy and Sustainable Economic Development (ENEA) which respectively
produced 607 (19% of total Culham publications) and 529 (16%) publications with the Centre in the same period. All top ten collaborator institutions of the Culham Centre are from Europe (Figure 3).
Table 2: Culham Science Centre publications by collaboration, citation and impact score, 2009-18
% of publications
Number of publications
Citations per Publication
Field-Weighted Citation Impact
International collaboration
80.4% 2628 11.9 1.64
Only national collaboration
9.8% 321 9.6 1
Only institutional collaboration
6.8% 224 7.7 1.16
Single authorship (no collaboration)
2.9% 95 8.3 1.25
Source: BEIS analysis of Scopus Database, Elsevier
Figure 2: The top 10 institutions that Culham collaborate with

The impact of the UK’s investments in UKAEA fusion research
116
Source: BEIS analysis of Scopus Database, Elsevier
Note: The area of each vertex/node is proportional to the number of collaborative publications (with “Culham” being the total publications from UKAEA)
Comparison with Max Planck Institute for Plasma Physics
With its workforce of approx. 1,100, Max Planck Institute for Plasma Physics (IPP) in Germany is one of the largest fusion research centres in Europe, responsible for operating the tokamak ASDEX Upgrade and investigating the Wendelstein 7-X stellarator. IPP is not the only the largest scientific collaborator of the Culham centre but also the most comparable institution to the Culham Centre in terms of research fields and scale. Table 3 below shows although IPP have produced more publications (9173) than the Culham Centre (6303) since 1996, the Culham Centre have slightly higher citation impacts with an overall FWCI of 1.79 compared to 1.76 of IPP since 1996. Further, the Culham Centre produce more publications (5.7) per £ million public funding than IPP (4.7 per £million public funding) in 2018.
Table 3: Impact and publications by IPP and Culham, 1996-May 2019.
FWCI Publication number
Number of publications per £million Govt funding (in 2018)
Average annual Patent-Citations per 1000 publications
Culham Science Centre 1.79 6303 5.7 45.1
Max Planck Institute for Plasma Physics (IPP) 1.76 9173 4.7 25.4
Source: 2019 Elsevier, BEIS/EPSRC funding (excl. Industrial Strategy Challenge Fund ) and IPP published funding sources for 2018.
Note: data for 2019 is incomplete in Scopus.
The Scopus database allows us to identify and count citations which research papers have received from patents, indicating industrial impacts of research and connections between academia and industry. As shown in Table 3, the Culham Centre have received 45 patent citations56 per 1000 publications on average each year compared to the annual average of 25 citations/1000 publications from IPP. The number of patent citations fluctuates a lot over time for both the institutes. The numbers of patent citations received by the Culham Centre’s publications peaked in early 2000s and then reached peaks again in 2008 and 2012 (Figure 3). Since 1996, a total 225 patents have cited publications from Culham with peaks in 2003 (50), 2004 (35) and 2008 (46). Based on the detailed patent data in Scopus BEIS is able to access, there were 40 patents citing Culham publications in 2013-19, including medical applications, automobile, materials and fusion. Of these, Tokamak Energy patents accounted for 25% of total cited patents (or 10 patents) in the period.
56 A patent citation is a document cited by an applicant, third party or a patent office examiner because its content relates to a patent application.

The impact of the UK’s investments in UKAEA fusion research
117
Figure 3: Number of patent citations per 1000 publications, 1996- 2018
Source: BEIS analysis of Scopus Database, Elsevier 2019.
Note: Data for 2018 is incomplete in Scopus.
Trends in Nuclear Fusion Research
Topic cluster In this section, we use a predefined topic cluster ‘ Magnetoplasma; Tokamak Devices; Plasmas’ in the Scopus database to capture various aspects of nuclear fusion research. This Topic Cluster is made up of 80 topics/key-phrases which were grouped by strong citation links (Figure 4). In the following analysis, this topic cluster is used as proxy representing fusion research to enable comparisons of countries and institutions’ research performance in this area. It’s worth noting this topic cluster would capture a vast majority of fusion research publications if not all of them.
0
50
100
150
200
250
Patent citations per 1000 publications
Culham Science Centre Max Planck Institute for Plasma Physics

The impact of the UK’s investments in UKAEA fusion research
118
Figure 4: Key phrases of the topic cluster ‘Magnetoplasma; Tokamak Devices; Plasmas ‘
Source: Based on 33,473 publications in the Scopus Database 2009-2018, Elsevier 2019
Note: Font size of a phase is proportional to the frequency of the phrase in these publications.
Fusion research by country There are 33,473 publications relating to fusion research represented by the topic cluster of ‘Magnetoplasma; Tokamak Devices; Plasmas’ published worldwide in 2009-2018. Table 4 shows the top 10 countries that produced most fusion research publications include major economies in the world. Of these, the UK published 3455 fusion research papers in this period and ranked the 6th in the world, but the UK fusion research received the joint highest field-weighted citation impacts (1.55) alongside Germany among these top 10 countries (Table 4).
Table 4: Top 10 countries ranked by fusion research output, 2009-2018
Country Number of publications
Views per publication
Field-Weighted Citation Impact
Citations per publication
United States 8111 10 1.26 10
China 6668 8 0.72 5
Germany 6268 14 1.55 10
Japan 4384 12 1 7
France 4161 13 1.48 9

The impact of the UK’s investments in UKAEA fusion research
119
United Kingdom 3455
14 1.55 11
Russia 2904 17 0.92 5
Italy 2870 17 1.37 8
Spain 1801 16 1.37 8
South Korea 1428 12 1.07 7
Source: BEIS analysis of Scopus Database, Elsevier 2019
As shown in Figure 5, numbers of fusion research publications have been largely stable across countries in the past decade despite year-to-year variations except that the number of fusion publications from China has more than trebled in the past decade rising from 310 in 2008 to 974 in 2018.
Figure 5: Fusion research publications by year and country, 2009-18
Source: BEIS analysis of Scopus Database, Elsevier 2019
Fusion research by institution The Culham Science Centre published 2590 fusion research papers in 2009-2018, contributing to 75% of the UK fusion research publications represented by the topic cluster of ‘Magnetoplasma; Tokamak Devices; Plasmas’ in the same period. As aforementioned, this topic cluster made up 79% of total publications from the centre in the last decade. Table 5 below shows the Culham Centre ranked as the third top institution in the world on the quantity of fusion research output and achieves the second highest FWCI (1.6) after ITER (1.7) among these top 10 institutes.
0
100
200
300
400
500
600
700
800
900
1000
2009 2010 2011 2012 2013 2014 2015 2016 2017 2018
Num
ber
of p
ublic
atio
ns
China France Germany Italy Japan
Russian Federation Spain United Kingdom United States South Korea

The impact of the UK’s investments in UKAEA fusion research
120
Table 5: Fusion research publications by top ten institutions, 2009-2018 Institution Number of
publications Views per publication
Field Weighted Citation Impact
Citations per publication
Max Planck Institute for Plasma Physics (Germany)
4,010 12 1.54 11
Chinese Academy of Sciences
3,057 8 0.88 6
Culham Science Centre (UK)
2,590 15 1.61 11
CAS – Institute of Plasma Physics (China)
2,426 8 0.85 6
Princeton University (USA) 2,259 11 1.42 11
CEA – the French Atomic and Alternative Energy Commission
2,155 14 1.57 10
National Institutes of Natural Sciences (China)
1,892 12 0.90 7
National Agency for New Technology, Energy and Sustainable Economic Development (Italy)
1,780 19 1.52 9
ITER 1,616 15 1.70 10
General Atomics (USA) 1,510 11 1.54 13
Source: BEIS analysis of Scopus Database, Elsevier 2019

The impact of the UK’s investments in UKAEA fusion research
121
This publication is available from: www.gov.uk/beis [replace with direct URL if known]
If you need a version of this document in a more accessible format, please email [email protected]. Please tell us what format you need. It will help us if you say what assistive technology you use.