the impact of the integrated stress response on dna
TRANSCRIPT

The impact of the integrated stress response
on DNA replication
____________________________________________________
Dissertation
for the award of the degree
"Doctor of Philosophy" (Ph.D.)
Division of Mathematics and Natural Sciences
of the Georg-August-Universität Göttingen
within the doctoral program Molecular Biology of Cells
of the Georg-August University School of Science (GAUSS)
submitted by
Josephine Ann Mun Yee Choo
from Selangor, Malaysia
Göttingen 2019

Thesis Committee
1. Prof. Dr. Matthias Dobbelstein, Institute of Molecular Oncology, University Medical Center
Göttingen (UMG)
2. PD Dr. Halyna Shcherbata, Research Group – Gene Expression and Signaling, Max Planck
Institute for Biophysical Chemistry (MPI-BPC)
3. Prof. Dr. Steven Johnsen, Clinic for General, Visceral and Pediatric Surgery, University Medical
Center Göttingen (UMG)
Members of the Examination Board
1st reviewer: Prof. Dr. Matthias Dobbelstein, Institute of Molecular Oncology, University Medical
Center Göttingen (UMG)
2nd reviewer: PD Dr. Halyna Shcherbata, Research Group – Gene Expression and Signalling, Max
Planck Institute for Biophysical Chemistry (MPI-BPC)
External members of the Examination Board
1. Dr. Roland Dosch, Department of Developmental Biochemistry, University Medical Center
Göttingen (UMG)
2. Prof. Dr. Heidi Hahn, Department of Human Genetics, University Medical Center Göttingen
(UMG)
3. Prof. Dr. Dieter Kube, Department of Hematology and Oncology, University Medical Center
Göttingen (UMG)
4. Dr. Nuno Raimundo, Department of Cellular Biochemistry, University Medical Center Göttingen
(UMG)
Date of oral examination: 12th December 2019

This thesis is dedicated to my parents.

TABLE OF CONTENTS
Table of Contents
1 Abstract .......................................................................................................................................... 1
2 Introduction .................................................................................................................................... 2
2.1 Central dogma of Molecular Biology ........................................................................................... 2
2.2 Translational initiation – the rate limiting step of protein synthesis ............................................. 3
2.2.1 Cap-dependent initiation ..................................................................................................... 3
2.2.2 Cap-independent initiation ................................................................................................... 5
2.2.3 Signalling pathways affecting translation initiation .............................................................. 7
2.3 The integrated stress response .................................................................................................. 8
2.3.1 ISR sensors/regulators ........................................................................................................ 8
2.3.2 eIF2alpha phosphorylation inhibits cap-dependent protein synthesis ............................... 10
2.3.3 The ISR is active. What happens then? ............................................................................ 11
2.3.4 Termination of the ISR ...................................................................................................... 12
2.3.5 The ISR and cancer .......................................................................................................... 13
2.4 DNA replication......................................................................................................................... 13
2.4.1 Regulation of DNA replication ........................................................................................... 14
2.4.2 Replicative stress .............................................................................................................. 16
2.4.3 Replicative stress in cancer ............................................................................................... 16
2.5 Histones are essential for proper DNA replication .................................................................... 18
2.5.1 Regulation of replication-dependent histones ................................................................... 18
2.6 R-loops ..................................................................................................................................... 20
2.7 Scope of the study .................................................................................................................... 21
3 Manuscript ................................................................................................................................... 24
3.1 Abstract .................................................................................................................................... 25
3.2 Highlights .................................................................................................................................. 25
3.3 Significance .............................................................................................................................. 25

TABLE OF CONTENTS
3.4 Introduction ............................................................................................................................... 26
3.5 Methods and materials ............................................................................................................. 28
3.6 Results...................................................................................................................................... 36
3.7 Discussion ................................................................................................................................ 42
3.8 Acknowledgements .................................................................................................................. 45
3.9 Author contributions.................................................................................................................. 45
3.10 Declaration of Interests ............................................................................................................. 45
3.11 Figures/ Figure Legends ........................................................................................................... 47
3.12 Supplementary Figures/ Supplementary Figure Legends ........................................................ 63
4 Discussion .................................................................................................................................... 82
4.1 Interplay between the ISR and DNA replication ....................................................................... 83
4.1.1 DNA replication is inhibited upon ISR stimulation ............................................................. 83
4.1.2 The ISR does not activate replicative stress signalling ..................................................... 84
4.2 Crosstalk between DNA replication and protein translation ..................................................... 85
4.2.1 The processes of DNA and protein synthesis are co-regulated ........................................ 85
4.2.2 DNA replication proteins have long half-lives .................................................................... 86
4.3 Histones: a limiting factor in DNA replication ............................................................................ 87
4.3.1 Continuous histone synthesis ensures proper DNA replication ........................................ 87
4.3.2 ISR depletes cells of histones ........................................................................................... 87
4.3.3 Histone overexpression restores DNA replication upon ISR ............................................. 89
4.4 R-loops accumulate with the ISR ............................................................................................. 90
4.4.1 The ISR blocks DNA replication through R-loops independent of ATF4 ........................... 90
4.4.2 R-loops are enriched upon histone depletion .................................................................... 92
4.4.3 R-loops formed upon ISR are not threats to genomic stability .......................................... 94
4.5 Therapeutic potential of ISR in cancer ..................................................................................... 95
4.5.1 Activating the ISR to block DNA replication and proliferation in cancer ............................ 95
4.5.2 Inhibiting the ISR to suppress tumourigenesis .................................................................. 97

TABLE OF CONTENTS
4.5.3 Modulating the ISR in combination with other therapies ................................................... 99
4.6 Conclusions and future perspectives ...................................................................................... 100
5 References ................................................................................................................................. 102
6 Appendix .................................................................................................................................... 117
7 Abbreviations ............................................................................................................................. 121
8 List of Figures ............................................................................................................................ 127
9 Acknowledgements .................................................................................................................... 129
10 Curriculum vitae ......................................................................................................................... 131

ABSTRACT
1
1 Abstract
The integrated stress response (ISR) is activated following various stress stimuli which leads to the
phosphorylation of the translation initiation factor eIF2alpha. Phosphorylation of eIF2alpha blocks
cap−dependent translation as it prevents the recruitment of ribosomes and initiator tRNAs to the 5’ cap
of the mRNA. On the other hand, translation of certain mRNAs coding for stress-responsive proteins is
upregulated through cap-independent translation. One major downstream target of the ISR is ATF4,
whose translation is enhanced when cap-dependent translation is impaired. Therefore, stimulation of
the ISR leads to a block in global protein synthesis and also enrichment of the ATF4 transcription
factor. Both inhibiting protein synthesis and upregulating ATF4 play important roles in ensuring survival
during cellular stress. ATF4 can activate genes involved in maintaining survival of these cells. In
addition, inhibiting protein synthesis helps the cell preserve energy and nutrients when conditions are
unfavourable. As DNA replication is a highly regulated and energy-consuming process, we
hypothesised that ISR activation should also hinder DNA replication for the same reason.
Indeed, we found that activation of the ISR dramatically impairs DNA synthesis. This was observed
within an hour of ISR stimulation and occurred independently of ATF4. Furthermore, this inhibition of
DNA replication was not accompanied by an induction of the DNA damage response signalling. ISR led
to the depletion of newly synthesised histones, likely through its role in blocking protein synthesis. Lack
of histones upon ISR favoured a more open chromatin and accumulation of DNA:RNA hybrids
(R−loops) which are responsible for inhibiting DNA replication. Conversely, the addition of histones or
removal of R-loops following ISR induction significantly restored DNA replication progression. More
importantly, the stalling of DNA replication in the context of ISR aids in cellular survival as removal of
R−loops negatively impacted the long-term proliferation of these cells. Taken together, our study further
expands the role of the ISR from blocking protein synthesis to directly hindering DNA replication.
Due to its pro-survival role, some tumours have been shown to rely on the ISR to grow in
nutrient−limiting conditions. In addition, the ISR has also been implicated in chemoresistance, although
most of these studies involve the transcriptional programme changes following ATF4 induction. Our
study suggests that the ISR could also mediate chemoresistance in tumours through slowing down
DNA replication. Moreover, we found that this impairment in DNA replication protects cellular viability
during stress. Although this warrants further investigation, inhibiting the ISR would be an attractive
therapeutic option for cancer. This is especially important for solid tumours growing in areas with limited
access to nutrients and oxygen, and are therefore dependent on the ISR for survival.

INTRODUCTION
2
2 Introduction
2.1 Central dogma of Molecular Biology
The central dogma of Molecular Biology explains how genetic data coded within the DNA is converted
to functional proteins in a biological system (Fig. 2.1) (Pukkila, 2001; Clancy and Brown, 2008). Double
stranded DNA is replicated to form two identical strands which are passed on to each daughter cell
during cellular division. This process maintains the genetic information within the organism. Genetic
information (genes) encoded in the DNA is then transcribed into messenger RNAs (mRNAs), which are
then processed and ultimately exported out of the nucleus. In the cytoplasm, this mRNA encounters the
translational machinery where the information in the mRNA is translated into specific amino acids. The
chain of amino acid forms a polypeptide, which is properly folded to form a fully functional protein.
It is therefore essential that such processes (replication, transcription and translation) are properly
regulated within a system to maintain proper homeostasis. In cancer, these processes are hijacked to
allow for uncontrolled growth of cells. In this study, we touch on the 3 processes, how they are
individually regulated and the possible interplay between them.
Figure 2.1: The central dogma. Duplication
of the double stranded DNA during DNA
replication ensures that each daughter cell
acquires an exact copy of the genetic
information. The information encoded in the
DNA (nucleotides) is then transcribed into
messenger RNAs (mRNAs). These mRNAs
are later translated into amino acids where
they form a polypeptide chain.

INTRODUCTION
3
2.2 Translational initiation – the rate limiting step of protein synthesis
As briefly introduced in Section 2.1, translation occurs when an mRNA sequence is converted into an
amino acid sequence. Similar to other cellular processes, translation is highly regulated involving many
translation factors. Translational control provides the means for the cell to rapidly regulate expression of
certain proteins (Sonenberg and Hinnebusch, 2009). As soon as the mRNA is transcribed from the
template DNA, it undergoes multiple modifications in the nucleus. First, a 7-methyl guanosine
triphosphate (m7GTP) moiety is added to the 5’ end of the RNA. This protects the RNA from
degradation by 5’ to 3’ exonucleases (Gagliardi and Dziembowski, 2018). Then, introns are spliced out
and the 3’ end is poly-adenylated. The mRNA is then exported out of the nucleus to be translated
(Hocine, Singer and Grünwald, 2010). Translation occurs in three steps: initiation, elongation and
termination. Here, we mainly focus on the initiation of translation, which is also the rate limiting step and
the step that is most highly regulated (Choe et al., 2018; Tahmasebi et al., 2018). In eukaryotes,
translation occurs on circularised mRNA. This is through the interaction between the m7GTP moiety at
the 5’ end of the mRNA (or the cap) with the poly-A tail at its 3’ end (Tahmasebi et al., 2018).
Circularisation of the mRNA is crucial as it signals the translational machinery that the mRNA is intact,
thus preventing the translation of non-functional mutant forms of the protein (Kahvejian, Roy and
Sonenberg, 2001; Svitkin and Sonenberg, 2006). Translation initiation can occur through two main
mechanisms: cap-dependent initiation or cap-independent initiation, both of which will be discussed
briefly below.
2.2.1 Cap-dependent initiation
Most mRNAs in a cell are translated through a cap-dependent mechanism where the initiation of
translation starts at the 5’ cap of the mRNA. Once an mRNA leaves the nucleus, it is bound to the
cap−binding complex, the eukaryotic initiation factor 4F (eIF4F). The eIF4F complex is composed of the
RNA helicase (eIF4A) which unwinds secondary structures on the mRNA, the cap-binding protein
(eIF4E), and the scaffold protein (eIF4G) which interacts with both the poly-A binding protein (PABP) at
the 3’ end of the mRNA and the cap-binding protein eIF4E at the 5’ end of the mRNA (Fig. 2.2)
(Kahvejian, Roy and Sonenberg, 2001; López-Lastra, Rivas and Barría, 2005). eIF2 (a complex of
alpha, beta and gamma subunits) is involved in recruiting the ribosomes to the cap of the mRNA. Under
normal conditions, the alpha subunit of eIF2 is not phosphorylated (discussed in Section 2.3.2)
(Silvera, Formenti and Schneider, 2010). Unphosphorylated eIF2 enables the eIF2B guanine exchange
nucleotide factor to exchange the GDP-bound eIF2 to GTP, providing the necessary energy required in

INTRODUCTION
4
the following steps of translation initiation (Sonenberg and Hinnebusch, 2009). eIF2-GTP can then bind
to an initiator methionyl-tRNA and eIF3, which recruits the small ribosomal subunit (40S), making the
pre-initiation complex (PIC) (Merrick and Pavitt, 2018). The PIC associates with the cap of the mRNA,
where the 40S ribosomal subunit scans the mRNA for an initiator codon (AUG) to begin translation at
an open reading frame (ORF) (Richter and Sonenberg, 2005). Once the complex reaches an AUG start
site, GTP is hydrolysed to GDP, resulting in a conformational change and the ejection of eIF2 from the
ribosome. The larger ribosomal 60S subunit then binds to the small subunit and the remaining mRNA is
translated (Hershey, Sonenberg and Mathews, 2012).
Figure 2.2: Mechanism of cap-dependent translation. The eIF4F complex is recruited to the 5’ cap of the mRNA (m7G)
where eIF4E binds the cap. The scaffold protein eIF4G binds to both the poly-A binding protein (PABP) and eIF4A/eIF4E,
producing a circularised complex with the mRNA. When eIF2 is unphosphorylated, GDP can be exchanged to GTP by the
guanine exchange nucleotide factor, eIF2B. eIF2-GTP recruits eIF3, initiator methionyl-tRNA and the 40S ribosome subunit,
forming a pre-initiation complex (PIC) that can then be recruited to the mRNA via interaction with the eIF4F complex. The 40S
ribosome starts scanning along the mRNA until it reaches a start codon (AUG). Upon hydrolysis of the bound GTP,
conformational changes occur resulting in the ejection of eIF2 and subsequent binding of the 60S subunit as translation
proceeds. Phosphorylation of eIF2 at the alpha subunit occurs downstream of multiple kinases (discussed in Section 2.3.2)
and inhibits cap-dependent translation by inhibiting the exchange of GDP to GTP. Figure adapted and modified from Silvera,
Formenti and Schneider, 2010.

INTRODUCTION
5
2.2.2 Cap-independent initiation
In addition to cap-dependent translation initiation, cells can also initiate translation via a
cap−independent manner. This usually occurs under conditions where cap-dependent translation is
inhibited. Although the majority of mRNAs in a cell relies on cap-dependent translation, some mRNAs
can be translated irrespective of the 5’ cap. These mRNAs usually code for proteins necessary for
stress response and their translation is usually inhibited under non-stressed conditions (Komar and
Hatzoglou, 2011). In eukaryotic cells, cap-independent translation initiation can occur through re-
initiation or through an internal ribosomal entry site (IRES).
Re-initiation
A single mRNA may contain untranslated open reading frames (uORFs) upstream of the real ORF.
These uORFs ensure that under unstressed conditions, the real ORFs are not translated at high
efficiency. Once the small ribosomal subunit begins scanning the mRNA for the first AUG codon, it
arrives at the first uORF (usually coding for a 3 amino acid polypeptide) and begins translation of the
non-productive polypeptide. Upon arrival at the termination signal, the short uORF allows the 40S
ribosome (together with eIF3, and possibly eIF4G) to remain on the mRNA as it scans for the next start
codon (Kozak, 2001; López-Lastra, Rivas and Barría, 2005). When the tertiary complex (eIF2, GTP,
Met-tRNAi) is of abundance (in unstressed cells), re-initiation of the second, third (or fourth) uORFs
occurs efficiently and the real ORF is skipped. When the tertiary complex is limiting (stressed cells),
re−initiation is inefficient (Somers, Pöyry and Willis, 2013). As the small ribosomal subunit scans
through the last uORF, it misses the AUG codon and continues scanning. This allows the real ORF
downstream to be recognised, allowing translation to begin, producing a productive polypeptide (Fig.
2.3) (Morris and Geballe, 2000).
INTRODUCTION
6
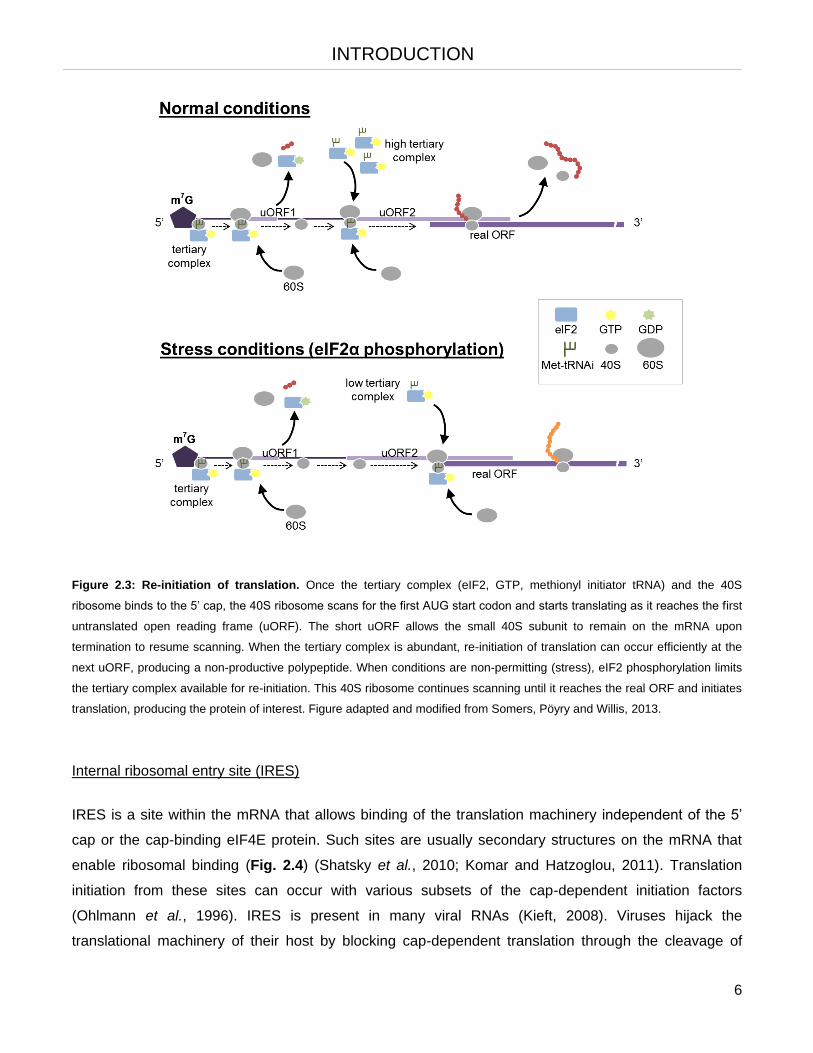
Figure 2.3: Re-initiation of translation. Once the tertiary complex (eIF2, GTP, methionyl initiator tRNA) and the 40S
ribosome binds to the 5’ cap, the 40S ribosome scans for the first AUG start codon and starts translating as it reaches the first
untranslated open reading frame (uORF). The short uORF allows the small 40S subunit to remain on the mRNA upon
termination to resume scanning. When the tertiary complex is abundant, re-initiation of translation can occur efficiently at the
next uORF, producing a non-productive polypeptide. When conditions are non-permitting (stress), eIF2 phosphorylation limits
the tertiary complex available for re-initiation. This 40S ribosome continues scanning until it reaches the real ORF and initiates
translation, producing the protein of interest. Figure adapted and modified from Somers, Pöyry and Willis, 2013.
Internal ribosomal entry site (IRES)
IRES is a site within the mRNA that allows binding of the translation machinery independent of the 5’
cap or the cap-binding eIF4E protein. Such sites are usually secondary structures on the mRNA that
enable ribosomal binding (Fig. 2.4) (Shatsky et al., 2010; Komar and Hatzoglou, 2011). Translation
initiation from these sites can occur with various subsets of the cap-dependent initiation factors
(Ohlmann et al., 1996). IRES is present in many viral RNAs (Kieft, 2008). Viruses hijack the
translational machinery of their host by blocking cap-dependent translation through the cleavage of

INTRODUCTION
7
eIF4G. This allows continuous synthesis of viral proteins despite the inhibition of cap-dependent
translation. To date, there has been no consensus on which initiation factors are required for IRES-
dependent translation initiation and different IRES structures require different subsets of IRES
transacting factors (ITAFs) (Pilipenko et al., 2000). However, the eIF4E cap-binding protein was found
to be dispensable for IRES-mediated translation initiation (Ohlmann et al., 1996; López-Lastra, Rivas
and Barría, 2005). One example is the IRES of hepatitis C virus which does not require eIF4F for 40S
ribosome binding (Sonenberg and Hinnebusch, 2009).
Figure 2.4: Internal ribosomal entry site (IRES)-mediated translation initiation. Viral RNAs and certain cellular mRNAs
contain secondary structures at the 5’ untranslated region that allow for ribosome binding and scanning along the RNA in the
absence of the cap or cap-binding factors. Once the start codon (AUG) is found, the 60S ribosome binds and translation
proceeds. IRES-transacting factors (ITAFs) play a role in recognising such secondary structures along with several other
proteins. The other proteins involved (depicted with a question mark in this diagram) largely depend on the IRES structure
present on the RNA.
2.2.3 Signalling pathways affecting translation initiation
Cells can regulate translation initiation via several pathways (Tahmasebi et al., 2018). Mostly,
translation is regulated at the initiation step through modulating the activity of initiation factors. One
example of a signalling pathway regulating translation is the mammalian target of rapamycin (mTOR)
pathway. The mTOR pathway, mainly through the mTORC1 complex can regulate translation
downstream of the Phosphoinositide 3-kinase/Protein Kinase B (PI3K/AKT) signalling pathway
depending on the energy or redox status and nutrient availability in the cell (Proud, 2019). Briefly, when
mTOR is active in the presence of growth stimuli, phosphorylation of the eIF4E binding proteins

INTRODUCTION
8
(4E−BP) can occur through downstream kinases (Morita et al., 2013). This hyperphosphorylation on
4E-BP blocks its association with eIF4E, allowing eIF4E to bind to eIF4G and the mRNA cap to initiate
cap−dependent translation (Kahvejian, Roy and Sonenberg, 2001; Braunstein et al., 2007). In
situations where nutrient is limiting, mTOR and the downstream kinases are inactive and
hypophosphorylated 4E-BP sequesters eIF4E and block translation. mTOR could also lead to the
phosphorylation of eIF4B, which enhances the eIF4B-eIF3 interaction thereby promoting translation
initiation. The mitogen activated protein kinase (MAPK) pathway could also stimulate translation
through phosphorylation of eIF4B (Roux et al., 2007; Bhat et al., 2015). Apart from these, the integrated
stress response (ISR) can also regulate translation. We will discuss the ISR in more detail in the
following sections.
2.3 The integrated stress response
The integrated stress response (ISR) is a signalling pathway that is triggered following various stress
stimuli. The ISR can be activated upon nutrient starvation, viral infection or during endoplasmic
reticulum (ER) stress when cells cannot maintain proper protein folding (Robichaud et al., 2019). In
addition, haem deprivation in erythroid cells could also trigger the ISR (Harding et al., 2000). These
different stress stimuli can be sensed by the different sensors of the ISR which will be described in
Section 2.3.1.
Activation of the ISR leads to the phosphorylation of the alpha subunit of eIF2 (eIF2alpha).
Phosphorylated eIF2alpha inhibits cap-dependent translation whereas the translation of activating
transcription factor 4 (ATF4) is enhanced. ATF4 then translocates into the nucleus where it can activate
the expression of a multitude of genes involved in stress response leading to a transcriptional
programme that aids in cellular survival (Fig. 2.5). If the extent of the stress is too great to be resolved,
the ISR programme switches to promote cell death (Pakos‐Zebrucka et al., 2016).
2.3.1 ISR sensors/regulators
The ISR can respond to a wide range of stress stimuli due to the four sensors or kinases within the
pathway: protein kinase RNA-activated or protein kinase R (PKR), PKR‐like ER kinase (PERK),
haem−regulated eIF2alpha kinase (HRI), and general control non‐derepressible 2 (GCN2) (Fig. 2.5)
(Tahmasebi et al., 2018). These four kinases have highly homologous C-terminal kinase domains and
only differ in their regulatory N-terminal regions (Donnelly et al., 2013). Binding of these kinases to their
respective regulatory stimuli result in their homo-dimerization and subsequent activation.

INTRODUCTION
9
Figure 2.5: The integrated stress response. Various stimuli such as endoplasmic reticulum (ER) stress, viral infection or
other cellular stress can activate the ISR kinases (HRI, PKR, PERK, and GCN2) which all converge to phosphorylate the eIF2
initiation factor at its alpha subunit. Phosphorylation of eIF2alpha inhibits cap-dependent translation but enhances the
translation of the transcription factor ATF4. Upon translocation into the nucleus, ATF4 undergoes hetero- or homo-dimerisation
to activate genes involved in stress response. Figure adapted and modified from Pakos‐Zebrucka et al., 2016.
PERK is localized at the ER membrane with its regulatory N-terminal domain within the ER lumen and
its C-terminal kinase domain towards the cytoplasm. PERK can be activated upon any disruption to the
ER such as protein misfolding, irregular calcium levels or a change in redox potential (van Vliet et al.,
2017). The N-terminal regulatory domain of PERK binds to a 78 kDa glucose-regulated protein
(GRP78) under normal homeostatic conditions. When misfolded proteins accumulate in the ER, or
upon disruption of calcium/redox status, GRP78 dissociates from PERK, allowing PERK dimerisation
and activation (Ni et al., 2009; Liu et al., 2015).
PKR is activated upon viral infection which often leads to the introduction of double stranded RNA
(dsRNA) in the cell. The dsRNA binding motif present at the N-terminus of PKR allows for dsRNA
binding which activates its kinase activity (García, Meurs and Esteban, 2007). Interestingly, PKR has
also been shown to be stimulated by stresses independent of dsRNA (Pakos‐Zebrucka et al., 2016).
Other stresses that could activate PKR include oxidative stress, ER stress, growth factor deprivation or
ribotoxic stress (Garcia et al., 2006; Bahal et al., 2015). Apoptotic induction can also stimulate PKR
(Saelens, Kalai and Vandenabeele, 2001).

INTRODUCTION
10
GCN2 is highly conserved from yeast to humans and is activated following amino acid starvation.
Within the C-terminal domain of GCN2 is a domain homologous to the histidyl-tRNA synthetase
(HisRS) (Wek, Jackson and Hinnebusch, 1989). tRNA synthetases are enzymes that attach a specific
amino acid to their respective tRNA, also known as tRNA charging. When amino acid is limiting, there
is an accumulation of uncharged tRNAs. It is through this HisRS domain that GCN2 binds uncharged
tRNA and is subsequently activated (Wek, Zhu and Wek, 1995; Donnelly et al., 2013). Studies have
also shown that ultraviolet (UV) light could activate GCN2 either through cross-linking of tRNA to GCN2
or through the depletion of arginine upon nitric oxide synthetase activation by UV (Deng et al., 2002;
Anda, Zach and Grallert, 2017).
Lastly, HRI is activated upon haem depletion in erythroid cells although there has been reports showing
HRI activation by oxidative stress, heat shock and osmotic stress (Igarashi et al., 2004). Upon
activation, all four kinases converge to phosphorylate their major substrate, the initiation factor
eIF2alpha.
2.3.2 eIF2alpha phosphorylation inhibits cap-dependent protein synthesis
eIF2 is a translation initiation factor and is made up of a complex of three subunits – alpha, beta and
gamma. Regulation of eIF2 occurs mainly through its alpha subunit. eIF2beta and eIF2gamma are
involved in binding the guanine exchange nucleotide factor, eIF2B (Kimball, 1999; Clemens, 2001).
Binding of eIF2B to eIF2 is important for the exchange of GDP to GTP, which is required for the
recruitment of the PIC to the mRNA and thus translation initiation (Sonenberg and Hinnebusch, 2009).
Following stimulation, the ISR kinases phosphorylate eIF2alpha at serine 51 and this phosphorylation
of eIF2alpha is inhibitory. Phospho-eIF2alpha is a competitive inhibitor of eIF2B and at the same time
enhances eIF2 and eIF2B binding (Fig. 2.6) (Harding et al., 2000). This results in the inability of eIF2B
to perform its function in nucleotide exchange for eIF2. In addition, due to higher levels of eIF2alpha
compared to eIF2B present in a cell, a small proportion of phospho-eIF2alpha would be sufficient to
sequester the remaining eIF2B, thus blocking protein synthesis (Adomavicius et al., 2019). Dysfunction
of this eIF2alpha phosphorylation has been shown to promote metabolic diseases. For example, mice
harbouring eIF2alpha with a Ser51Ala (S51A) knock in mutation die shortly after birth and suffer from
hypoglycaemia (Pakos‐Zebrucka et al., 2016).

INTRODUCTION
11
Figure 2.6: eIF2-mediated translation control. When eIF2alpha is phosphorylated by either of the kinases, it binds more
tightly to the eIF2B guanine exchange nucleotide factor and inhibits its activity. The GDP-bound eIF2 can no longer exchange
its GDP for GTP, limiting the formation of tertiary complexes available for cap-dependent translation. Figure adapted and
modified from Pakos‐Zebrucka et al., 2016.
2.3.3 The ISR is active. What happens then?
When the ISR is activated (through either of its kinases), eIF2alpha is phosphorylated. This blocks
cap−dependent translation initiation and inhibits global protein synthesis. At the same time, several
mRNAs that can bypass cap-dependent translation are upregulated. One of the major transcripts that
undergo this process is the ATF4 transcription factor. The effects of these responses are discussed
below.
Reduction in global protein synthesis
ISR-induced inhibition of protein synthesis is a major downstream effect of the pathway and plays a
major role in aiding cellular survival during stress. Blocking protein synthesis downstream of PERK
activation (following ER stress) reduces the influx of polypeptide chains entering the ER, thus
minimising the ER load (Donnelly et al., 2013). Moreover, inhibiting protein synthesis following amino
acid deprivation and GCN2 activation reduces the immediate need for more amino acids during
conditions where amino acids are limiting (Anda, Zach and Grallert, 2017). Translation inhibition upon
viral infection and subsequent PKR activation prevent the cells from synthesising viral proteins (Garcia
et al., 2006). In erythroid cells, HRI activation, through inhibiting protein translation prevents an

INTRODUCTION
12
accumulation of globin aggregates, which are toxic when haem is limiting (Han et al., 2001). Hence,
ISR helps the cell survive during stress by blocking protein synthesis, which limits the use of energy
and resources.
ATF4 induction
When cap-dependent translation is inhibited by the ISR (eIF2alpha phosphorylation), translation of
mRNAs independent of the cap is enhanced. This is due to the limiting pool of cap-dependent factors.
As described in Section 2.2.2, these mRNAs encode for proteins that enable cells to recover from
stress. One such protein is ATF4 whose translation increases upon ISR stimulation (Donnelly et al.,
2013; Pakos‐Zebrucka et al., 2016; Taniuchi et al., 2016). ATF4 is a basic leucine zipper transcription
factor and can act as homo- or hetero-dimers to induce or repress target genes (Ameri and Harris,
2008). Human ATF4 mRNA contains three upstream uORFs and its productive translation is usually
inhibited under normal conditions (Vattem and Wek, 2004). When ISR is active and cap-dependent
translation is blocked, translation of the real ORF of ATF4 is enhanced (see Section 2.2.2: Re-
initiation). Although ATF4 is mainly regulated via translational control, transcriptional regulation and
post-translational modifications also play a role in maintaining ATF4 levels and stability (Dey et al.,
2010; Frank et al., 2010; Miyamoto et al., 2011).
ATF4 belongs to the activating transcription factor/cyclic AMP response element binding protein
(ATF/CREB family) and binds to C/EBP-ATF response element (CARE) sequences where it can
activate/repress transcription (Ameri and Harris, 2008). Binding of ATF4 with its interaction partner can
modulate the downstream response of the cell towards certain stress stimuli. ATF4 binding to C/EBP
Homologous Protein (CHOP) (also a downstream target of ATF4) promotes apoptosis whereas ATF4-
ATF3 dimers can induce genes involved in amino acid biogenesis to preserve cellular homeostasis
(Pakos‐Zebrucka et al., 2016). Therefore, the transcriptional programme activated by ATF4 largely
depends on its interaction partners and this is modulated by the strength and length of ISR activation.
2.3.4 Termination of the ISR
Termination of the ISR occurs through the dephosphorylation of eIF2alpha. The phosphatase involved
in removing the phosphate from eIF2alpha consists of two subunits − the catalytic protein phosphatase
1 (PP1c) subunit and a regulatory subunit. The two regulatory subunits present in mammals are
constitutive repressor of eIF2alpha phosphorylation (CreP) and growth arrest and DNA damage-
inducible protein (GADD34). CreP is constitutively expressed in cells and it maintains low

INTRODUCTION
13
phospho−eIF2alpha in unstressed cells. On the other hand, GADD34 is a target of ATF4 and provides
a negative feedback loop following ISR (Novoa et al., 2001; Jousse et al., 2003). ATF4 induces the
expression of GADD34, which in turns binds to the PP1c subunit to dephosphorylate eIF2alpha thus
attenuating the ISR response (Walter and Ron, 2011).
2.3.5 The ISR and cancer
The ISR has been implicated in cancer, although its role in tumourigenesis appears to be context
specific. The pro-survival role of ISR during conditions of nutrient deprivation and hypoxia has been
shown to promote oncogenesis as it helps tumour cells survive harsh conditions in the body (Koromilas,
2015; Robichaud et al., 2019). There have been reports suggesting that the overexpression of
phosphorylated eIF2alpha or its kinases could promote tumourigenesis (Kim et al., 2002; Rosenwald et
al., 2003). ISR has been shown to be involved in mediating chemoresistance in several cancer entities
through the upregulation of pro-survival genes (Palam et al., 2015; Wang et al., 2018; Chen et al.,
2019). On the other hand, long-term activation of ISR can also promote cell death, suggesting tumour
suppressive properties of ISR (Clemens, 2001). This would suggest that a fine balance in ISR
activation is important in cancer. Nevertheless, the impact of ISR on cancer has prompted research on
therapeutic molecules that can either induce or inhibit ISR. This will be discussed further in Section
4.5.
2.4 DNA replication
DNA carries the genetic information of a cell and needs to be maintained with little or no damage to
preserve the integrity of the cell and ultimately the organism. DNA consists of four nucleotides made up
of a nitrogen-containing nucleobase (adenine, A; thymine, T; cytosine, C; or guanine, G), a sugar group
and a phosphate group. Together, these nucleotides form sugar-phosphate covalent bonds to form a
chain of polynucleotides (DNA). The characteristic double helix structure of DNA is held by hydrogen
bonds formed between the bases of each nucleotide of the individual strand (Alberts et al., 2017).
During cell division, DNA is replicated exactly once and in a timely manner to ensure controlled
proliferation of cells (Waga and Stillman, 1998). It is also of importance that the accuracy of replication
is maintained to prevent any error. Any error or mutations that lead to the alteration in structure or
composition of the DNA such as single strand or double strand breaks could pose problems to the cell
during transcription or replication. If unresolved, this could lead to genomic instability which could be
detrimental, leading to either cell death or uncontrolled proliferation and subsequently tumourigenesis.

INTRODUCTION
14
Furthermore, mutations that occur in gametes are passed on to future generations. To prevent this,
DNA replication is tightly regulated in a spatial and temporal manner.
2.4.1 Regulation of DNA replication
The cell cycle is a coordinated series of events occurring in a cell that leads to its division into two
daughter cells. It is divided into 4 distinct phases: the first growth/gap phase (G1), the synthesis phase
(S), the second growth/gap phase (G2) and the final mitotic phase (M). The growth phases allow the
cell to grow in size as it accumulates the necessary nutrients and proteins required for cell division. M
phase involves the separation of the duplicated sister chromatids and subsequent division of the
cytoplasm (cytokinesis) to form two daughter cells (Schafer, 1998; Vermeulen, Van Bockstaele and
Berneman, 2003).
DNA replication occurs during S phase of the cell cycle. Prior to that (late M and G1), cells begin
assembling pre-replication complexes (pre-RCs) at origins of replication (Fig. 2.7). This process is
termed as ‘licensing’ of replication origins (Machida, Hamlin and Dutta, 2005). Pre-RCs consist of origin
recognition complex (ORC), chromatin licensing and DNA replication factor 1 (CDT1) and cell division
cycle 6 (CDC6). CDT1 and CDC6 are involved in the loading of inactive minichromosome maintenance
(MCM2-7) helicases at the origins in an ATP-dependent manner (Sun and Kong, 2010; Fragkos et al.,
2015). In eukaryotes, origins of replication are interspersed throughout the DNA, allowing simultaneous
replication along the genome. DNA replication is ensured to occur only once during the cell cycle by
limiting the assembly and activation of pre-RCs (Waga and Stillman, 1998; Tanaka and Araki, 2011).
Licensed origins are kept dormant until the cell passes through regulatory checkpoints, which activates
a series of kinases and phosphatases (Masai et al., 2010).
As the cell enters S phase, a coordinated series of phosphorylation and de-phosphorylation steps lead
to the activation of the MCM helicases and ‘firing’ at approximately 10% of the licensed origins (Bell and
Dutta, 2002; Montagnoli et al., 2006; Fragkos et al., 2015). The resulting active and functional
replisome moves forward bi-directionally with the help of the MCM helicases and ATP hydrolysis to
unwind the double stranded DNA, leaving behind stretches of single stranded DNA (ssDNA). This
ssDNA is immediately coated with replication protein A (RPA) (Forsburg, 2008; Bochman and
Schwacha, 2009). The stretches of ssDNA are used as templates for the synthesis of the new daughter
strands and this is done by DNA polymerases in a 5’ to 3’ manner (Fig. 2.7). Different polymerases play
a role in synthesising DNA at the leading (Pol ε) or lagging strand (Pol δ) (Langston and O’Donnell,
2006).

INTRODUCTION
15
Figure 2.7: Simplified scheme of eukaryotic DNA replication initiation. Initiation of replication begins at late G1 when
origin recognition complex (ORC) binds to origins of replication (in red). Recruitment of the minichromosome maintenance
(MCM) proteins occurs with the aid of CDC6 and CDT1. At this point, the origin is licensed. At the onset of S phase, cyclin-
dependent kinases (CDKs) become active and this leads to a downstream phosphorylation signal that activates the MCM
proteins and the simultaneous removal of CDC6 and CDT1 from the origin of replication. In addition, this signals for the
association of several other factors (DNA polymerase, CDC45 and GINS complex) to the origin, forming an active replisome.
The MCM helicases (with its associated proteins) then begins to unwind the DNA to expose a single strand template for the
DNA polymerases and replication begins. The ORC is removed to ensure that the DNA is replicated only once per cell cycle.
Figure adapted and modified from Machida, Hamlin and Dutta, 2005.

INTRODUCTION
16
2.4.2 Replicative stress
As DNA replication proceeds, it can run into multiple obstacles that can be endogenously or
exogenously generated. Such impediments (limiting nucleotides, nicks in the DNA, modified bases,
perturbations in DNA structure, or DNA-bound proteins that obstruct replication forks) can cause the
replisome to stall (Yekezare, Gó mez-González and Diffley, 2013). The replication machinery remains
stalled until the obstacle is removed. Under circumstances where the fork stalls for too long, the
replication machinery can ultimately fall off the DNA and the fork can no longer restart (fork collapse).
Collapsed forks can be cleaved by endonucleases, leading to double strand breaks (DSBs) (Sancar et
al., 2004; Yekezare, Gó mez-González and Diffley, 2013).
When a fork meets an obstacle, the MCM helicase usually proceeds to unwind the double strand DNA
(dsDNA) ahead, leading to a long stretch of RPA-coated ssDNA (Zeman and Cimprich, 2014). This
increase in RPA-coated ssDNA activates the Serine/Threonine protein kinase Ataxia Telangiectasia
and Rad3-related (ATR) via the ATR-Interacting Protein (ATRIP) (Masai et al., 2010). ATR then targets
and phosphorylates checkpoint kinase 1 (CHK1) among other substrates which leads to the activation
of a damage signalling cascade and this is indicative of replicative stress (Cimprich and Cortez, 2008;
Iyer and Rhind, 2017). Certain hallmarks of replicative stress include phosphorylation substrates of
ATR such as CHK1, RPA, or the histone variant H2AX (γH2AX). In addition, replicative stress can also
be detected through the accumulation of stalled forks, increase in origin firing (to compensate for the
stalled replication) and stretches of ssDNA (Dobbelstein and Sørensen, 2015). The intra-S checkpoint
is activated when DNA replication is inhibited and aids in removing the specific obstacle (or repairing
the DNA) to enable proper replication of DNA again (Ubhi and Brown, 2019). Apart from ATR, another
Ser/Thr kinase ATM (Ataxia Telangiectasia Mutated) also constitutes the intra-S checkpoint. Unlike
ATR, ATM is activated by DSBs. ATM phosphorylates and activates checkpoint kinase 2 (CHK2) and
several other mediators and effectors of the DNA damage response (not discussed here) (Shiloh and
Ziv, 2013). Briefly, the activation of either ATR or ATM (or both) induces signalling cascades that
mediate cell cycle arrest and repair of the damaged DNA (Fig 2.8) (Maréchal and Zou, 2013; Awasthi,
Foiani and Kumar, 2015).
2.4.3 Replicative stress in cancer
One hallmark of cancer is uncontrolled proliferation (Hanahan and Weinberg, 2000, 2011). Uncontrolled
proliferation occurs due to the deregulation of checkpoints which leads to replicative stress in cancer
(Macheret and Halazonetis, 2015; Ubhi and Brown, 2019). Oncogene overexpression has been

INTRODUCTION
17
proposed to induce replicative stress (Kotsantis, Petermann and Boulton, 2018). Hyperactivation of
proteins involved in the G1/S transition could cause premature entry into S phase. In addition,
overexpression of cyclin E promotes cyclin-dependent kinase 2 (CDK2) activity which can induce
replication origin firing and thereby causing replicative stress (Hills and Diffley, 2014). Conventional
chemotherapy enhances replicative stress in cancer cells. These cells are especially susceptible to
replicative stress as their checkpoints are deregulated (Dobbelstein and Sørensen, 2015; Ubhi and
Brown, 2019). Replicative stress can be induced either through reducing the available nucleotide pools
for replication (gemcitabine, hydroxyurea, 5-fluorouracil), introducing lesions in the DNA template
(platinum compounds, alkylating agents or UV) or by nucleoside analogues that are incorporated into
the newly synthesised DNA (gemcitabine, 5-fluorouracil) (Longley, Harkin and Johnston, 2003; Wang
and Lippard, 2005; Cerqueira, Fernandes and Ramos, 2007). Supercoiling within the DNA could also
lead to defects in replication, and this is normally resolved through the action of topoisomerases.
Therefore, topoisomerase inhibitors form another class of replicative stress inducers (Pommier, 2006).
Figure 2.8: Replication checkpoint. Stalled forks or single strand DNA breaks lead to the accumulation of replication protein
A (RPA). ATR, via ATRIP is recruited to these RPA-bound sites leading to its activation. Double strand breaks lead to the
recruitment and activation of ATM at these sites. ATR can also activate ATM directly through phosphorylation or through
subsequent conversion of single strand breaks to double strand breaks in the DNA. ATR and ATM can phosphorylate and
activate their downstream targets such as CHK1 and CHK2 respectively. Targets of CHK1/2 can then mediate cell cycle arrest
through inhibiting origin firing and S phase progression until the damage is repaired or the lesion is removed. Figure adapted
and modified from Sancar et al., 2004.

INTRODUCTION
18
2.5 Histones are essential for proper DNA replication
A human genome has approximately 3 billion base pairs that can stretch out to about 2 metres in length
(Piovesan et al., 2019). For the DNA to be stored in the nucleus (with an average diameter of 6 µm),
the DNA has to be kept compact in the form of chromatin (Alberts et al., 2017). For this, DNA
(negatively charged) is usually tightly wound around positively charged histones (Annunziato, 2008).
There are four core replication-dependent histones – histone 3 (H3), histone 4 (H4), histone 2A (H2A)
and histone 2B (H2B). Each nucleosome consists of hetero-dimers of (H3/H4)2 and (H2A/H2B)2 and
can wrap a DNA 1.7 times covering approximately 145 base pairs (Mei et al., 2017). It is important to
consider that as DNA duplicates, so must the chromatin. Although recycling of parental histones occur,
new histones must be synthesised during DNA replication to make up the new chromatin.
Approximately 20 million new nucleosomes need to form to properly package the newly replicated
daughter strands (MacAlpine and Almouzni, 2013). When histones are lacking, the newly synthesised
DNA is not decorated with histones. This can lead to genome instability as these naked DNA are now
more prone to external damaging agents (Nair, Shoaib and Sørensen, 2017). Hence, the regulation of
histone synthesis is tightly coupled to DNA replication.
2.5.1 Regulation of replication-dependent histones
Histone genes are separated into two classes based on their expression pattern: the replication-
dependent histones and replication-independent histone variants. The replication-dependent histones
(core histones and linker histone H1) will be of focus in this study. These histones are expressed
specifically in the S phase of the cell cycle in a coordinated manner with DNA replication. In eukaryotes,
each core histone protein can be expressed from 10-12 functional copies of the gene. These gene
copies are usually organised within transcription factor-rich clusters (or Cajal bodies) to facilitate
transcription (Albig et al., 1997; Shopland et al., 2001). Outside of S phase, these histone genes are
usually repressed by transcription repressors such as histone regulator A (HIRA) to limit their
expression and prevent toxicity in cells (Mei et al., 2017). When cells enter S phase, cyclin-dependent
kinases (CDKs) can phosphorylate factors like Nuclear Protein Ataxia-Telangiectasia Locus (NPAT)
which leads to the activation of these histone genes (Zhao et al., 2000). At the end of S phase, the
WEE1 kinase is active and plays a role in repressing histone gene expression again by re-recruiting
repressor factors (Mei et al., 2017). Hence, histone mRNA levels elevate at the beginning of S phase
and decrease at the end of S phase (Schümperli, 1988). To ensure proper histone synthesis, the
histone mRNA has to be properly processed during S phase. Unlike other genes, histone genes are

INTRODUCTION
19
intron-less and the 3’ end of their mRNA are not poly-adenylated. Instead, the 3’ ends of replication-
dependent histone mRNAs contain a highly conserved stem-loop structure that is bound by specific
translation factors to regulate translation (Marzluff, 2005; Gagliardi and Dziembowski, 2018). Similar to
how PABP binds to the poly-A tail at the 3’ end of other mRNAs, the stem-loop binding protein (SLBP)
binds to the stem-loop structure on histone mRNAs (MacAlpine and Almouzni, 2013) (Fig. 2.9). Binding
of SLBP to the 3’ end of histone mRNA is essential for proper translation and processing of these
mRNAs (Sullivan et al., 2009; Koseoglu, Dong and Marzluff, 2010). SLBP recruits proteins such as
SLBP-interacting protein 1 (SLIP1) which interacts with the 5’ cap of the mRNA through eIF4G,
producing a circularised mRNA that is then translated (Fig. 2.9) (Gallie, 1996).
Lack of histones can lead to cell cycle arrest and delayed S phase progression in cells. Studies have
shown that histone depletion impairs DNA replication in cells (Groth, Corpet, et al., 2007; Mejlvang et
al., 2014; Henriksson et al., 2018). However, the exact mechanism is not fully understood. Moreover,
inhibition of replication can also regulate histone levels through enhancing the degradation of histone
mRNAs (Schümperli, 1988; Meaux, Holmquist and Marzluff, 2018). It is this tight coupling of histone
levels and DNA replication during S phase that is essential to prevent genomic instability (Alabert,
Jasencakova and Groth, 2017).
Figure 2.9: Translation of replication-
dependent histone mRNAs. Unlike other
mRNAs present in the cell, replication-coupled
histone mRNAs are not poly-adenylated at the
3’ end. Instead, histone mRNAs contain a
conserved stem-loop structure at the 3’ end,
which is bound by stem-loop binding protein
(SLBP) and this is important for regulating
histone translation. SLBP, through interaction
with the SLBP-interacting protein 1 (SLIP1)
brings the 3’ end of the histone mRNA in
proximity with the 5’ cap through direct
interaction of SLIP1 and eIF4G.

INTRODUCTION
20
2.6 R-loops
As briefly discussed, the DNA replication machinery can encounter multiple perturbations as it
replicates DNA. Some of these lesions include single or double strand breaks, intercalation of the DNA,
bulky adducts within the DNA or R-loops. R-loops are DNA:RNA hybrids with a protruding ssDNA.
R−loops are usually a by-product of transcription as the RNA exiting the RNA polymerase rehybridises
with the template DNA, causing the displacement of the non-template DNA strand (Fig. 2.10) (Aguilera
and García-Muse, 2012; Skourti-Stathaki and Proudfoot, 2014). R-loops are said to be involved in the
termination of transcription as it causes RNA polymerase II (RNAPII) to slow down at the termination
site of transcription (Allison and Wang, 2019). R-loops are also responsible for priming DNA replication
in the mitochondria and play a role in immunoglobulin (Ig) class-switch recombination (Ohsato et al.,
1999; Pavri, 2017). However, R-loops can pose a threat to genomic stability (Crossley, Bocek and
Cimprich, 2019). The protruding ssDNA becomes prone to lesions and exogenous insults. Due to the
higher stability of DNA:RNA hybrid structures, R-loops themselves pose a steric hindrance to the
transcription and replication machinery (Gan et al., 2011).
Figure 2.10: R-loop formation. R-loops are formed as transcriptional by-products when the nascent RNA exiting the RNA
polymerase (RNAPII) hybridises with its template DNA, causing the displacement of a ssDNA. R-loop formation is usually
avoided by proper RNA surveillance through sufficient ribonucleoprotein binding. Factors or events that can favour formation
of R-loops are indicated in the figure. Figure adapted and modified from Aguilera and Gómez-González, 2017.

INTRODUCTION
21
Cells employ a number of mechanisms to prevent the accumulation of R-loops or to remove them. In
eukaryotes, ways to remove R-loops include DNA:RNA helicases (Sentaxin, SENX) to unwind such
structures or ribonucleases (Ribonuclease H, RNaseH) to digest the RNA portion of the R-loops
(Skourti-Stathaki and Proudfoot, 2014; Al-Hadid and Yang, 2016). Nicks in the DNA, negative
supercoiling, uncondensed chromatin and nascent RNA that is not decorated with ribonucleoproteins
(RNP) upon exiting RNAPII can favour the formation of R-loops (Fig. 2.10) (Chédin, 2016; Aguilera and
Gómez-González, 2017). To prevent this, cells use topoisomerase 1 (TOP1) to resolve negative
supercoiling whereas sufficient RNA surveillance is ensured through specific RNA-binding proteins
involved in RNA biogenesis (Li and Manley, 2006; Tuduri et al., 2009). Histones have also been shown
to play a role in regulating R-loops through their role in maintaining proper chromatin compaction and
structure (Castellano-Pozo et al., 2013; Bayona-Feliu et al., 2017; García-Pichardo et al., 2017).
2.7 Scope of the study
In this study, we aim to understand one general concept: the impact of the integrated stress response
on DNA replication. Why is this important? The ISR plays a pivotal role in ensuring cell survival during
stress, especially in situations of nutrient depletion or oxidative stress. Tumour cells often grow in such
conditions, suggesting a high need for ISR activity in tumours. Although the ISR could also lead to
apoptosis, tumour cells often upregulate anti-apoptotic proteins that could be used as a measure of
limiting ISR to its pro-survival functions. Further understanding of the pro-survival mechanisms
downstream of the ISR could help better target tumour cells dependent on these pathways. Although
studies have suggested the role of ISR in chemoresistance, these roles focus on the transcriptional
programme activated by ISR. It would be interesting to see if ISR could also modulate DNA replication
and by that, aid in chemoresistance. Such information would be useful in determining the appropriate
chemotherapy or treatment for these tumours.
We address how the ISR can regulate DNA replication by answering the following questions. Together,
these would provide a mechanistic insight with respect to the role of ISR on DNA replication.
1. How does the ISR influence DNA replication?
To date, there have been no studies showing the direct impact of ISR on DNA replication. Mostly, hints
of the ISR regulating DNA replication is through the use of the compound thapsigargin (Shukla et al.,
1997; Wang et al., 2014; Cabrera et al., 2017). Thapsigargin interferes with calcium signalling in the cell
and this also activates the ISR through ER stress. In addition, most studies on the ISR focus on the

INTRODUCTION
22
transcriptional programme of ATF4 whereas the direct interplay between the ISR and DNA replication
remains in question. It is known that the ISR shuts down protein synthesis under conditions of stress to
reduce energy consumption in the cells. Therefore, we hypothesise that the ISR could save energy and
resources also through slowing down DNA replication. First, we investigate if ISR could impair total
DNA synthesis by measuring 5-ethynyl-2'-deoxyuridine (EdU) incorporation during S phase. We then
study the role of ISR specifically on single replication forks by employing the fibre assay method which
enables us to study and analyse single forks for their speed. Due to the limitations of double-labelled
fibre assays in differentiating between stalled forks vs slowed polymerisation of DNA, we perform
multiple-label fibre assays on ISR−induced cells.
As introduced in Section 2.3.3, ATF4 accumulates with ISR activation. To further characterise how the
ISR affects DNA replication, we follow up with ATF4 knockdown experiments under ISR stimulation and
study the effects on DNA replication. In addition, we overexpress ATF4 to mimic ISR stimulation and
measure DNA replication progression.
2. Can the ISR induce R-loops?
ISR blocks global protein synthesis and at the same time induces a stress-specific transcriptional
programme downstream of ATF4. Approximately 50% of the cell’s transcriptome is positively
upregulated upon ISR (Robichaud et al., 2019). Cap-independent initiation is at best 25% as efficient as
cap-dependent translation (Merrick, 2004). It is not difficult to imagine that under such conditions, the
increase in RNA production coupled with the dependence of the cell on cap-independent translation
could lead to an accumulation of untranslated RNA in the nucleus. RNA surveillance may also be
compromised upon ISR induction as translation of RNA binding proteins could be affected. We
hypothesise that ISR stimulation could lead to a deregulation of the normal transcriptional machinery,
compromised RNA surveillance and thus, enhanced R-loop formation. As R-loops are emerging as a
major source of replication stress, we ask if the ISR could enhance R-loop formation in cells and impair
DNA replication. We explore this by analysing R-loop formation using immunofluorescence and perform
dot blots to detect these DNA:RNA hybrids. If R-loops are formed upon ISR, we ask if these R-loops
impair DNA replication in the context of ISR using DNA fibre assays.
3. Is histone synthesis affected downstream of ISR?
Global protein synthesis is inhibited upon ISR stimulation. As discussed, mRNAs that are implicated are
ones translated in a cap-dependent manner. We know that regulation of histones differ to that of most

INTRODUCTION
23
mRNAs and histone mRNAs are translated using several specific translation factors (Marzluff, 2005;
Gagliardi and Dziembowski, 2018). In this study, we investigate if the block in cap-dependent
translation by ISR can also inhibit histone synthesis. Newly synthesised histones possess specific post-
translational modifications which allow for chaperone binding necessary for rebuilding the chromatin
during DNA replication (MacAlpine and Almouzni, 2013). These post-translational modifications are
usually removed within 30 min of incorporation with DNA making such histone marks a valuable tool in
identifying newly synthesised histones (Jackson et al., 1976; Smith et al., 2008). We perform
immunoblots on soluble proteins to measure levels of newly synthesised histones upon ISR induction.
4. Are R-loops involved in impairing DNA replication following histone depletion?
There have been numerous reports studying how histone levels influence DNA replication. One
proposal includes the direct interaction of histones (through chaperone proteins) with the MCM
helicases. When histones are limited, the MCM helicases respond to the signal and stop unwinding the
double stranded helix. This impairs DNA replication (Groth, Corpet, et al., 2007). In addition, histone
chaperones have also been found to interact directly with the DNA polymerase clamp (PCNA) and can
modulate the processivity of DNA polymerases (Mejlvang et al., 2014). However, most of these
mechanisms proposed have not been fully clarified. As discussed in Section 2.6, R-loops can
accumulate upon changes in chromatin. We hypothesise that histone depletion could potentially block
DNA replication via the accumulation of R-loops. We address this by performing immunofluorescence
and dot blots using an antibody (S9.6) to detect R-loops upon histone depletion. Following that, we
investigate (via DNA fibre assays) if the inhibition in DNA replication when histones are limiting can be
restored upon removal of R-loops by overexpressing RNaseH1.

MANUSCRIPT
24
3 Manuscript
The integrated stress response induces R-loops
and hinders replication fork progression
Josephine Ann Mun Yee Choo1, Anna Magerhans1, Denise Schlösser1, Valentina Manzini1 and
Matthias Dobbelstein1,*
1) Institute of Molecular Oncology, Göttingen Center of Molecular Biosciences (GZMB), University
Medical Center Göttingen, D-37077 Göttingen, Germany
*Corresponding author and lead contact. Correspondence and requests for materials should be
addressed to M. D. (e-mail: [email protected])
Running title: ISR antagonizes DNA replication
Keywords: Integrated stress response, PKR, PERK, GCN2, eIF2alpha, Thapsigargin, BEPP, ISRIB, R-
loops, DNA:RNA hybrids, DNA replication, DNA fiber assays
This manuscript is currently under consideration at PNAS (October 2019)
Contribution to manuscript:
Conducted experiments and data analyses for all figures except Fig 6 E, Supp. Fig. 1 D,F,H, Supp. Fig.
6 H,R,X,Y,AE,AF and Supp. Fig. 7 C. Involved in the conception of the project, as well as figure
arrangement, writing and revising of the manuscript.
** Figures and corresponding figure legends are located at the end of the manuscript

MANUSCRIPT
25
3.1 ABSTRACT
The integrated stress response (ISR) allows cells to rapidly shut down most of their protein synthesis in
response to protein misfolding, amino acid deficiency, or virus infection. These stresses trigger the
phosphorylation of the translation initiation factor eIF2alpha, which prevents the initiation of translation.
Here we show that triggering the ISR drastically reduces the progression of DNA replication forks within
one hour, thus flanking the shutdown of protein synthesis with immediate inhibition of DNA synthesis.
DNA replication is restored by compounds that inhibit eIF2alpha kinases or re-activate eIF2alpha.
Mechanistically, the translational shutdown blocks histone synthesis, thus promoting the formation of
DNA:RNA hybrids (R-loops) which interfere with DNA replication. Histone depletion alone induces R-
loops and compromises DNA replication too. Conversely, histone overexpression or R-loop removal by
RNaseH1 each restores DNA replication in the context of ISR and histone depletion. In conclusion, the
ISR rapidly stalls DNA synthesis through histone deficiency and R-loop formation. We propose that this
shutdown mechanism prevents potentially detrimental DNA replication in the face of cellular stresses.
3.2 HIGHLIGHTS
The integrated stress response (ISR) triggers rapid inhibition of DNA replication.
The lack of histones and the formation of R-loops cause replication stalling as part of the ISR.
Re-supplying histones or removing R-loops restores DNA synthesis upon ISR.
Removing R-loops restores DNA synthesis upon histone depletion.
3.3 SIGNIFICANCE
The integrated stress response has long been explored regarding its immediate impact on protein
synthesis. Translational shutdown represents an indispensable mechanism to prevent the toxicity of
misfolded proteins and virus infections. Our results indicate that the shutdown mechanisms reach far
beyond translation and immediately interfere with DNA synthesis as well. ISR depletes cells of new
histones which induce accumulation of DNA:RNA hybrids. The impairment of DNA replication in this
context supports cell survival during stress.
Our work provides a link between the ISR and another subject of active research, i. e. the regulatory
network of DNA replication forks.

MANUSCRIPT
26
3.4 INTRODUCTION
The integrated stress response (ISR) is widely known as a mechanism to shut down the synthesis of
most proteins when the cell suffers various stresses through the activation of the following kinases
(Pakos‐Zebrucka et al., 2016). Protein kinase R (PKR) is activated upon virus infection and
accumulation of double-stranded RNA. PKR-like endoplasmic reticulum kinase (PERK) becomes active
when unfolded proteins accumulate in the endoplasmic reticulum. General control non-derepressible 2
(GCN2) responds to amino acid deprivation. And heme-regulated inhibitor (HRI) is triggered in the case
of heme depletion in erythrocytes. Each of these kinases triggers the phosphorylation of the translation
initiation factor eIF2 at Serine 51 of its alpha subunit (Taniuchi et al., 2016). This modification of eIF2
shuts down the translation of most mRNAs, with the exception of a few mRNAs that employ alternative
mechanisms of translation initiation. One of these exceptions is the transcription factor ATF4, which is
synthesized with greater efficiency as part of the ISR (Hinnebusch, 1993; Vattem and Wek, 2004) and
then triggers a transcriptional program to counteract the specific stress stimuli (Hetz, Chevet and
Harding, 2013). The ISR thus prevents further damage to the cell by avoiding further protein synthesis
in the context of proteotoxic stress, or as part of a defense mechanism against virus infection.
Besides gene expression, the replication of DNA represents an extreme demand on the cell with regard
to metabolic activity and energy consumption. For one round of DNA replication, each human cell must
synthesize and incorporate 2x3x109 dNTPs. This raises the question whether the ISR might also affect
the replication of DNA, perhaps protecting the cell in the context of nutrient deprivation or infection. And
indeed, the replication of DNA is a highly regulated process. Regulation is not only implied by the
control of cell cycle progression. Rather, even during S phase, the cell can stall the progression of
replication forks (Dobbelstein and Sørensen, 2015). One example of the underlying mechanisms is
provided by the kinase MAPKAPK2, the activation of which diminishes replication fork progression
(Köpper et al., 2013, 2014). Also, the absence of the tumor suppressor p53 or its target gene product
Mdm2 can each enhance replication stress (Klusmann et al., 2016, 2018). Another way of slowing
down DNA replication is through the lack of histone supply, e.g. by depleting histone chaperones
(Groth, Corpet, et al., 2007; Mejlvang et al., 2014). In this situation, the newly synthesized DNA can no
longer associate with nucleosomes to a sufficient extent. By mechanisms that are currently not fully
explained, this leads to a reduction in DNA synthesis (Groth, Corpet, et al., 2007; Jasencakova et al.,
2010; Mejlvang et al., 2014). Finally, replication stress can be induced by the formation of R-loops, i.e.
DNA:RNA hybrids that form by looping out the non-template strand of DNA after transcription, allowing
the previously synthesized RNA to rehybridize with the template strand (Aguilera and García-Muse,
MANUSCRIPT
27
2012; Skourti-Stathaki and Proudfoot, 2014). Such R-loops represent obstacles to DNA replication
(Santos-Pereira and Aguilera, 2015; García-Muse and Aguilera, 2016; Crossley, Bocek and Cimprich,
2019).
Previous findings provided hints that the ISR might not only affect the synthesis of proteins but also that
of DNA (Shukla et al., 1997; Cabrera et al., 2017), with the earlier report mainly focusing on the drug
thapsigargin and its role in replication through interfering with calcium homeostasis. On the other hand,
Cabrera et al., uses thapsigargin to hinder proper protein folding (“ER stress”) which subsequently
inhibited DNA replication (Cabrera et al., 2017). The mechanism was suggested to occur through the
activation of claspin and its associated kinase Chk1 (Cabrera et al., 2017). Moreover, cycloheximide, a
compound that inhibits overall protein synthesis, was found to diminish histone synthesis and slow
down DNA replication (Mejlvang et al., 2014; Henriksson et al., 2018). This raises the question whether
the ISR might generally interfere with DNA replication, through a shortage of histone synthesis.
Here we show that the ISR triggered by various kinases each interferes with the progression of DNA
replication forks. This can be mimicked by the depletion of histones. Strikingly, the removal of R-loops
by RNaseH1, or the overexpression of histones, restores DNA replication upon ISR. This suggests a
general mechanism that links ISR to the impairment of replication forks, through histone depletion and
R-loops.

MANUSCRIPT
28
3.5 METHODS AND MATERIALS
LEAD CONTACT AND MATERIALS AVAILABILITY
Further information and requests for resources and reagents should be directed to and will be fulfilled
by the Lead Contact Matthias Dobbelstein ([email protected]).
This study did not generate unique reagents.
EXPERIMENTAL MODEL AND SUBJECT DETAILS
Cell culture
The human osteosarcoma cell line U2OS (p53 proficient, female) was purchased from ATCC
(RRID:CVCL_0042). Cells were maintained in Dulbecco’s modified Eagle’s medium (DMEM)
supplemented with 10% fetal bovine serum (Merck), 2 mM L-glutamine (Life Technologies), 50 units/ml
penicillin, 50 μg/ml streptomycin (Gibco), and 10 µg/ml ciprofloxacin (Bayer) at 37°C in a humidified
atmosphere with 5% CO2. Cells used were routinely tested and ensured to be negative for mycoplasma
contamination.
METHOD DETAILS
Treatments and transfections
Cells were treated with thapsigargin (Thap, Sigma), 1H-Benzimidazole-1-ethanol, 2,3-dihydro-2-imino-
alpha-(phenoxymethyl)-3-(phenylmethyl)- monohydrochloride (BEPP, Sigma), L-Histidinol (L-Hist,
Sigma), (E)-2-(2-Chlorobenzylidene) hydrazinecarboximidamide (Sephin, Sigma), trans-N,N′-
(Cyclohexane-1,4-diyl)bis(2-(4-chlorophenoxy) acetamide (integrated stress response inhibitor or
ISRIB, Sigma), GSK2606414 (PERK inhibitor or PERK i, Calbiochem), gemcitabine (Gem, Actavis),
cycloheximide (CHX, Sigma), 5,6-Dichloro-1--D- ribofuranosylbenzimidazole (DRB, Sigma) or LDC067
(Selleckchem) as indicated in the figure legends. Thap, BEPP, Sephin, ISRIB, PERK i, DRB and
LDC067 were dissolved in DMSO, L-Hist and gemcitabine dissolved in water, and cycloheximide was
dissolved in 100% ethanol.

MANUSCRIPT
29
siRNA transfections were performed using Lipofectamine 3000 (Life Technologies). Cells were reverse
transfected with 100 nM siRNA against SLBP (Ambion, custom made, pool of 3 siRNAs) or negative
control scrambled siRNA (Ambion, pool of 2 siRNAs), medium replenished after 24 hours and cells
harvested 40 hours post-transfection. For plasmid overexpression, 2 µg of the respective plasmids
were forward transfected using Lipofectamine 2000. Medium was replenished after 4 to 6 hours, and
cells were harvested for experiments 24 hours post-transfection. The following plasmids were used.
Plasmid Origin
pICE-NLS-mCherry Addgene #60364
pICE-RNaseH1-NLS-mCherry Addgene #60365
pICE-RNaseH1-D10R-E48R-NLS-mCherry Addgene #60367
pFRT-ToDest-FlagHA Addgene #26361
pFRT-ToDest-FlagHA-RNaseH1 Addgene #65782
pCDNA3.1-Flag-H2A Addgene #63560
pCDNA3.1-Flag-H2A K118-119R Addgene #63564
V48 pCS2+mRFP-N1 Addgene #17143
pCS-H2B-mRFP1
V48 pCS2+mRFP-N1
Addgene #53745
mEGFP Addgene #18696
mEGFP-H4-23
FP-H4-23
Addgene #56463
Cell synchronization
To obtain a majority population of cells in S phase, cells were synchronized using double thymidine
block. Briefly, cells were seeded accordingly and allowed to settle and attach onto plates or coverslips
for at least 6 hours, then treated with 2 mM Thymidine (Sigma). After 16 hours, cells were washed once
in PBS and then replenished with fresh DMEM for 8 hours prior to the second Thymidine block (2 mM)
for another 16 hours. Depending on the assay, cells were released into fresh DMEM for 1 hour (celigo
proliferation assay) or 4 hours (R-loop detection on cells treated with CHX) prior to treatment, harvest
and analysis.
Immunoblot analysis
Cells were washed once in PBS and harvested in radioimmunoprecipitation assay (RIPA) lysis buffer
(20 mM TRIS-HCl pH 7.5, 150 mM NaCl, 10 mM EDTA, 1% Triton-X 100, 1% deoxycholate salt, 0.1%

MANUSCRIPT
30
SDS, 2 M urea) in the presence of protease inhibitors. Samples were briefly sonicated to disrupt DNA-
protein complexes. The protein extracts were quantified using the Pierce BCA Protein assay kit
(Thermo Scientific Fisher). Protein samples were boiled at 95C in Laemmli buffer for 5 minutes, and
equal amounts were analyzed by sodium dodecyl sulphate polyacrylamide gel electrophoresis (SDS-
PAGE). Subsequently, proteins were transferred onto a nitrocellulose membrane, blocked in 5% (w/v)
non-fat milk in PBS containing 0.1% Tween-20 for 1 hour and incubated with primary antibodies at 4°C
overnight followed by incubation with peroxidase-conjugated secondary antibodies (donkey anti-rabbit
or donkey anti-mouse IgG, Jackson Immunoresearch). The proteins were detected using either Super
Signal West Femto Maximum Sensitivity Substrate (Thermo Fisher) or Immobilion Western Substrate
(Millipore).
Soluble histones were extracted as described (Mejlvang et al., 2014). Briefly, cells were washed once
in PBS and harvested in a low detergent, hypotonic buffer (10 mM Tris pH 7.4, 2.5 mM MgCl2, and
0.5% NP-40) for 10 minutes on ice. Following centrifugation at 1000 x g, the concentration of the
solubilized proteins was determined as described above and equal amounts were analyzed by SDS-
PAGE.
Antibodies Source (Catalog number) Research Resource
Identifiers (RRID) ATF4 (D4B8) Cell Signaling (#11815) RRID:AB_2616025
Chk1 Cell Signaling (#2360) RRID:AB_2080320
eIF2alpha Cell Signaling (#9722) RRID:AB_2230924
Flag Sigma (F1804) RRID:AB_262044
gamma H2AX, γH2AX (S139) Cell Signaling (#2577) RRID:AB_2118010
GFP Clontech (632375) N/A
H2B Abcam (ab52484) RRID:AB_1139809
H3 Abcam (ab1791) RRID:AB_302613
H3K56ac Cell Signaling (#4243) RRID:AB_10548193
H4K5ac (EP1000Y) Abcam (ab51997) RRID:AB_2264109
H4K12ac (EPR17906) Abcam (ab177793) RRID:AB_2651187
HSC70 Santa Cruz (sc-7298) RRID:AB_627761
mCherry Abcam (ab167453) RRID:AB_2571870
PERK (C33E10) Cell Signaling (#3192) RRID:AB_2095847

MANUSCRIPT
31
phospho-Chk1 (S317) Cell Signaling (#2344) RRID:AB_331488
phospho-eIF2alpha (S51) Cell Signaling (#9721) RRID:AB_330951
RNaseH1 Abcam (ab56560) RRID:AB_945244
SLBP (EPR12673) Abcam (ab181972) N/A
DNA fiber assay
DNA fiber assays were performed as described previously (Klusmann et al., 2016). Briefly, cells were
incubated with 5-chloro-2’-deoxyuridine (CldU, Sigma Aldrich) for 30 minutes, followed by 60 minutes
incubation with 5-iodo-2’-deoxyuridine (IdU, Sigma Aldrich) in the presence of inhibitors or treatments
as indicated. For the 7-label assay, cells were incubated with CldU for 1 h and then pulsed labeled with
IdU and CldU for 15 min each for a total duration of 1.5 h.
Cells were lysed using spreading buffer (200 mM Tris pH 7.4, 50 mM EDTA, 0.5% SDS) and DNA
fibers spread on glass slides prior to fixation in a methanol:acetic acid solution (3:1). Upon treatment
with 2.5 M HCl, fibers were incubated with rat anti-BrdU antibody (Abcam, RRID:AB_305426, 1:1000,
to detect CldU) and mouse anti-BrdU (Becton Dickinson, RRID:AB_10015219, 1:400, to detect IdU) for
1 h at room temperature, then fixed with 4% paraformaldehyde in PBS for 10 minutes. Slides were
incubated with Alexa Fluor 555-conjugated goat anti-rat IgG antibody (RRID:AB_141733) and Alexa
Fluor 488-conjugated goat anti-mouse IgG antibody (RRID:AB_138404) (both from Thermo Fisher,
1:200) for 2 hours at room temperature.
S9.6 Immunofluorescence
Cells were seeded on glass coverslips, transfected or treated with reagents accordingly and fixed with
4% paraformaldehyde in PBS for 10 minutes. Then, cells were permeabilized with 0.5% Triton X-100 in
PBS for 15 minutes, blocked with 3% bovine serum albumin (BSA) in PBS containing 0.1% Tween-20
for 1 hour and incubated overnight at 4C with S9.6 antibody (Kerafast, RRID:AB_2687463, 1:100, to
detect DNA:RNA hybrids). Coverslips were washed in PBS prior to incubation with Alexa Fluor 488-
conjugated donkey anti-mouse IgG antibody (Thermo Fisher, RRID:AB_141607, 1:250) for 2 hours and
subsequently counterstained with 0.5 µg/ml DAPI (Sigma) for 5 minutes prior to mounting using the
Fluorescent Mounting Medium from DakoCytomation (#S302380-2) and imaged.

MANUSCRIPT
32
Dot blot analysis
Cells were seeded in 6-well plates, treated with Thap, BEPP or CHX as indicated and harvested. Prior
to CHX treatment, cells were synchronized using double thymidine block as described (chapter “Cell
synchronization”) and released into fresh DMEM for 4 hours prior to addition of CHX. Cells were
washed once in PBS and fixed with 1.1% paraformaldehyde in a solution of 0.1 M NaCl, 1 mM EDTA,
0.5 mM EGTA and 50 mM HEPES pH 7 for 30 minutes at room temperature. To quench the cross-
linking reaction, glycin was added to a final concentration of 0.125 M for 5 minutes. Subsequently, the
cells were lysed in 1% Triton X-100, 0.15 M NaCl, 1 mM EDTA, 0.3% SDS with protease inhibitors. The
cell lysates were sonicated for 10 cycles (30 sec on/off) (Bioruptor, Diagenode) and then subjected to 2
mg/ml proteinase K (Thermo Fisher) treatment for 1 h at 50°C. DNA was isolated using phenol-
chloroform extraction and DNA concentration normalized between samples.
The DNA (1.3 µl) was spotted onto pre-wet nitrocellulose membrane, allowed to air dry and then cross-
linked with UVC for 5 minutes. The membrane was blocked in 5% BSA in PBS containing 0.25%
Tween-20 for 30 minutes at room temperature and subsequently incubated with S9.6 antibody
(Kerafast, 1:300) in blocking solution overnight at 4°C. Following incubation with peroxidase-conjugated
donkey anti-mouse IgG (Jackson Immunoresearch, RRID:AB_2340773,1:10000), DNA:RNA hybrids
(as measured using S9.6 intensity) were detected using Super Signal West Femto Maximum Sensitivity
Substrate (Thermo Fisher). To confirm the specificity of the antibody, one half of the DNA samples
were also pre-treated with RNaseH (0.03 U/ng DNA, Ambion Thermo Fisher) for 3 h at 37°C prior to
spotting. As a loading control, the membrane was subsequently incubated with antibodies to single-
stranded DNA (ssDNA). Briefly, the membrane was incubated with 2.5 M HCl for 15 minutes (to
denature the DNA), washed with PBS, and incubated with antibody to ssDNA (Millipore,
RRID:AB_570342, 1:1000) for 2 hours at room temperature. The detection of ssDNA was performed
following exposure to secondary antibody using Super Signal West Femto Maximum Sensitivity
Substrate (Thermo Fisher).
EdU Incorporation Assay
5-ethynyl-2´-deoxyuridine (EdU, Thermo Fisher Scientific, #A10044) was added to exponentially
growing cells to a final concentration of 20 µM for 1 hour until harvest. Prior to imaging, the cells were
fixed and permeabilized as done for immunofluorescence staining. The following reagents were added
to 100 mM Na-Phosphate buffer (pH 7) in the following order: 5 µM Alexa Fluor 488 picolyl-azide or 5
µM Alexa Fluor 594 picolyl-azide (Jena Biosciences, #CLK-1276-1 or #CLK-1296-1), 100 µM CuSO4

MANUSCRIPT
33
(Jena Biosciences, #CLK-MI004) in 500 µM tris-hydroxypropyltriazolylmethylamine (THPTA; Sigma-
Aldrich, #762342) and 5 mM Na-Ascorbate (Jena Biosciences, #CLK-MI005). The click reaction was
performed for 1 h on a shaker, at room temperature and protected from light. Samples were
subsequently washed thrice for 10 min with PBS, followed by incubation with 0.3 µg/ml DAPI (Sigma-
Aldrich, #D9542) for 5-10 min. For experiments in Fig. 1, cells were kept in PBS prior to image
acquisition with the Celigo Imaging Cytometer (Nexcelom Bioscience). DAPI was used to create a
nuclear mask and quantify the DNA content while the nuclear EdU signal was quantified using the
Celigo image analysis software. EdU and DAPI signals were presented in a horseshoe plot. For
experiments in Fig. 4 and Fig. 6, cover slips were mounted using the fluorescent mounting medium
(DakoCytomation, #S302380-2) and imaged.
Proliferation assay (Celigo)
To study the long-term effect of ISR on cells in S phase, proliferation assay was conducted on
synchronized cells. Cells were seeded in duplicates in 24-well plates, synchronized using double
thymidine block (as described), and released into fresh medium for 1 hour then treated with BEPP (30
µM) for 6 h to ensure ISR activation during S phase of the cells. During synchronization, cells were also
transfected with plasmids to RNaseH1 or an empty vector control as described previously. After 6 hours
of treatment, medium was replenished and confluency of cells at day 0 was measured using Celigo
Imaging Cytometer (Nexcelom Bioscience). Measurements were made subsequently every 24 or 48
hours and medium was changed prior to every measurement.
MNase sensitivity assay
Cells were seeded onto coverslips and subsequently treated with Thap in the presence of 20 µM EdU
to label nascent chromatin. Cells were also transfected with a plasmid to express RNaseH1. Then, the
cells were fixed, permeabilized and click chemistry performed as described. Following multiple washes
with PBS, the cells were subjected to digestion with 0.7 U/µl micrococcal nuclease (MNase, Thermo
Fisher) in digestion buffer (10 mM Tris pH 7.4, 10 mM NaCl, 5 mM MgCl2 and 2 mM CaCl2) at 37°C.
The cells were then washed again and incubated with 0.3 µg/ml DAPI (Sigma-Aldrich) for 5-10 min and
mounted using DAKO fluorescence mounting medium, followed by image acquisition.

MANUSCRIPT
34
QUANTIFICATION AND STATISTICAL ANALYSIS
DNA fiber analysis
To avoid bias, data acquisition and analysis were conducted in a double-blinded manner where
identities of the samples were blinded prior to imaging and analysis. Whenever possible, a minimum of
100 DNA fiber structures were visualized with fluorescence microscopy (Axio Scope A1 microscope
(Zeiss) equipped with an Axio Cam MRc/503 camera) and analyzed.
For the 7-label fiber assay, the number of labels incorporated was counted using the cell counter plugin
on Fiji. Fork stalling was then calculated by dividing the number of tracks with less than all seven labels
by the total number of tracks and converted into percentage. The length of the second to third label was
measured to determine the replication progression for the 7-label fiber assay. The Fiji software
(RRID:SCR_002285) (Schindelin et al., 2012) was used to measure the labeled tracks in pixels and
converted to micrometers using the conversion factor of 1 µm = 5.7 pixels (as determined by measuring
scale bar under the same microscope settings) and then to kilo base (kb) using the conversion factor 1
µm = 2.59 kb. Rate of fork progression was calculated by dividing the number of bases by the labeling
time of the track.
For the 2-label fiber assays, fibers were analyzed for their IdU track length and IdU fork progression
rate calculated as described.
Nuclear quantification of immunofluorescence
Images were acquired (same exposure time for all images for each fluorescent channel per experiment)
with Axio Scope A1 microscope (Zeiss) equipped with an Axio Cam MRc/503 camera.
The Fiji software was used for automated analysis and quantification of nuclear S9.6 or EdU staining.
DAPI staining was used to identify regions of interest (nuclei) prior to measuring mean intensity of the
Alexa Fluor 488 staining (S9.6), Alexa Flour 488 picolyl-azide or Alexa Fluor 594 picolyl-azide (EdU). In
the case of the MNase sensitivity assay, the mean intensity of DAPI was also measured. At least 200
cells were subjected to analysis and quantification.

MANUSCRIPT
35
Statistical testing
Statistical testing was performed using Graph Pad Prism 6 (RRID:SCR_002798). An unpaired
Student’s t-test was calculated with an assumed significance for p-values ≤ 0.05. Asterisks represent
significance in the following way: ****, p ≤ 0.0001, ***, p ≤ 0.005; **, p ≤ 0.01; *, p ≤ 0.05.

MANUSCRIPT
36
3.6 RESULTS
DNA replication is compromised shortly after ISR induction
The ISR triggers a shutdown of protein synthesis, representing an emergency response to nutrient
deprivation or proteotoxic stress. Here, we tested whether this response might also affect the synthesis
of DNA. We induced the ISR and the consequent phosphorylation of eIF2alpha at Serine 51 by
stimulating the kinases PERK, PKR and GCN2, or by inhibiting GADD45A (regulatory subunit of the
PP1 phosphatase) using the small compounds thapsigargin (Thap) (Thastrup et al., 1994), BEPP-
monohydrochloride (Hu et al., 2009), L-Histidinol (Hansen, Vaughan and Wang, 1972) or Sephin (Das
et al., 2015), respectively (Fig. 1 A). Increased phosphorylation of eIF2alpha and elevated expression
of ATF4 following treatment confirmed ISR activation in all cases (Fig. 1 B and Supp. Fig. 1 A). Sephin
inhibits the removal of constitutive phosphate modifications on eIF2alpha. This induces a moderate
increase in phosphorylation of eIF2alpha, less pronounced than with Thap or BEPP, i.e. activators of
eIF2alpha kinases. We first performed an EdU incorporation assay to measure overall DNA synthesis
in individual cells upon ISR activation during S phase. As shown in Fig. 1 C,D and Supp. Fig. 1 B, the
activation of ISR using Thap or BEPP significantly reduced DNA synthesis in S phase. Then, we
measured the progression of single DNA replication forks using DNA fiber assays, measuring the
length of DNA tracks with incorporated IdU (Fig. 1 E). Treatment with Thap led to a reduction in fork
progression (Fig. 1 F,G and Supp. Fig. 1 C,D). In addition, we found that treatment of U2OS cells with
BEPP, Sephin or L-Histidinol all impaired DNA fork progression significantly, albeit to different extents
(Fig. 1 H–L and Supp. Fig. 1 E–L). To understand if the reduction in fork progression upon ISR was
due to lower speed of DNA polymerase or a higher frequency of polymerase stalling, we conducted a
7−label fiber assay on Thap−treated cells (Fig. 1 M) as described in our previous publications
(Klusmann et al., 2016, 2018). This revealed both increased stalling of DNA polymerase (i.e. decreased
processivity) and slower DNA polymerization (Fig. 1 N−P and Supp. Fig. 1 M).
Interestingly, despite the significant reduction in DNA replication progression following ISR stimulation,
we did not observe a substantial increase in phosphorylation of Chk1 or histone variant H2AX (gamma
H2AX) (Supp. Fig. 1 N) as compared to gemcitabine, a well-established inducer of replicative stress
(Köpper et al., 2013) indicating that the ISR slows down replication forks without triggering a strong
DNA damage response. These results suggest that the ISR not only triggers a shutdown in protein
synthesis but also imposes severe and immediate restrictions on DNA replication.

MANUSCRIPT
37
Pharmacological antagonists of ISR partially rescue DNA replication
Based on our findings suggesting that the ISR interferes with DNA replication, we now investigated if
these effects are downstream of phosphorylated eIF2alpha and could be reversed using a small
molecule inhibitor of ISR known as ISRIB (Sidrauski et al., 2013; Tsai et al., 2018; Zyryanova et al.,
2018) (Fig. 1 A). ISRIB enhances the activity of the nucleotide exchange factor eIF2B, thereby
overcoming the inhibitory effect of eIF2alpha phosphorylation. We pre-treated cells with ISRIB, followed
by the ISR inducers Thap, BEPP or Sephin, and then measured DNA replication fork progression (Fig.
2 A,B). Single treatment of cells with Thap, BEPP or Sephin resulted in an impairment of DNA
replication as observed before, but pre-treatment of these cells with ISRIB significantly prevented this
inhibition of DNA replication (Fig. 2 C–H, Supp. Fig. 2 A−E). Similarly, inhibition of PERK with a
pharmacological inhibitor, PERK i or GSK2606414 (Axten et al., 2012), was also able to significantly
rescue DNA replication defects by Thap treatment (Fig. 2 I−K and Supp. Fig. 2 F,G). Activation and
inhibition of ISR were confirmed using ATF4 detection as a readout in all cases (Fig. 2 L,M). These
findings clarify that the compounds used interfere with DNA replication through the ISR and through
eIF2alpha phosphorylation.
Stimulation of the ISR induces R-loops
We were now searching for a mechanism that allows the ISR to interfere with DNA replication.
DNA:RNA hybrids have recently emerged as one of the major players in regulating DNA replication
(Gan et al., 2011; Skourti-Stathaki and Proudfoot, 2014; Crossley, Bocek and Cimprich, 2019). They
form by hybridizing just-synthesized RNA to its template DNA and looping out the opposite DNA strand
and are termed R-loops. R-loops can pose as a steric hindrance to an oncoming replisome, thereby
blocking DNA replication (Santos-Pereira and Aguilera, 2015). We investigated if an enrichment in R-
loops was inducible through the ISR. In cells treated with Thap or BEPP, we detected DNA:RNA
hybrids by immunofluorescence with an antibody against them (S9.6) (Spitzer et al., 2011; Britton et al.,
2014) (Fig. 3 A). As a negative control, we overexpressed RNaseH1 (Spitzer et al., 2011) in these
cells, i. e. an RNase that specifically removes the RNA portion of DNA:RNA hybrids (Skourti-Stathaki
and Proudfoot, 2014). By quantification, we found a significant increase in the intensity of S9.6
fluorescence in the nuclei of cells treated with Thap (1 h) or BEPP (3 h) (Fig. 3 B and Supp. Fig. 3 A).
Upon RNaseH1 overexpression, the S9.6 staining intensity within these nuclei decreased to intensities
similar to control−treated cells (Fig. 3 A,B and Supp. Fig. 3 A). We confirmed RNaseH1
overexpression and ISR induction by immunoblot analysis of RNaseH1 and ATF4 levels (Fig. 3 C). To
supplement our immunofluorescence experiments, we performed dot blot analyses using the antibody

MANUSCRIPT
38
S9.6. Cells were treated with Thap and BEPP, followed by chromatin preparation. Samples were also
treated with RNaseH as a negative control. In each case, DNA:RNA hybrids were then detected on dot
blots. Similar to the immunofluorescence, we observed a strong increase in S9.6 staining intensity upon
ISR, which was largely abolished by RNaseH (Fig. 3 D,E and Supp. Fig. 3 B,C). Thus, ISR activation
leads to an enrichment of R-loops.
Removal of R-loops re-establishes DNA replication upon induction of ISR but compromises
survival of stressed cells
As ISR activation induced more R-loops, we hypothesized that these R-loops were responsible for
compromising DNA replication. To test this, we first overexpressed wildtype or catalytically mutant
RNaseH1 (Britton et al., 2014) and treated these cells with Thap or BEPP to induce ISR, and measured
total DNA synthesis by EdU incorporation. As seen previously (Fig. 1 C,D), EdU incorporation was
reduced upon ISR (Fig. 4 A,B and Supp. Fig. 4 A,B). Strikingly, we now observed that the
overexpression of catalytically active RNaseH1 largely restored EdU incorporation and thus DNA
synthesis in both Thap and BEPP−treated cells (Fig. 4 A,B and Supp. Fig. 4 A,B). To test if removal of
R-loops was also able to rescue single DNA fork progression, we subjected cells overexpressing
wildtype or catalytically inactive RNaseH1 and treated with Thap or BEPP to DNA fiber assay analysis
(Fig. 4 C and Supp. Fig. 4 E). The removal of R-loops with wildtype but not mutant RNaseH1
completely rescued DNA replication in the context of ISR (Fig. 4 D,E and Supp. Fig. 4 C,D,F−I).
Immunoblot analysis confirmed that RNaseH1 overexpression did not interfere with eIF2alpha
phosphorylation (Supp. Fig. 4 J,K) and thus not with the ISR per se. We then hypothesized that R-loop
induction and the resulting impairment of DNA replication upon ISR might help cells to survive by
halting the complex DNA replication program in the face of stress conditions. To investigate if the
inhibition of DNA replication following accumulation of R-loops upon ISR is protective to the cell, we
conducted a long-term proliferation assay of cells treated with BEPP in the presence or absence of
RNaseH1. Indeed, removal of R-loops via the overexpression of RNaseH1 further reduced proliferation
of cells compared to cells that were treated with BEPP alone (Fig. 4 F, and Supp. Fig. 4 L,M). Our
findings therefore suggest that ISR impairs DNA replication through inducing R-loops and that this
inhibition in DNA replication is supporting cell survival during stress.

MANUSCRIPT
39
Ongoing transcription is required for compromising DNA replication by the ISR
R-loops were suggested to form between RNA and its DNA template, shortly after transcription
(Skourti-Stathaki and Proudfoot, 2014). This raised the hypothesis that short-term inhibition of
transcription should re-activate DNA synthesis in the context of the ISR. To test this, we employed two
different CDK9 inhibitors, DRB (Baumli, Endicott and Johnson, 2010) and LDC067 (Albert et al., 2014).
CDK9 inhibition is an established way to interfere with the elongation of transcription (Morales and
Giordano, 2016). We measured DNA replication of cells treated with Thap or BEPP, in the presence or
absence of CDK9 inhibitors (Fig. 5 A,B). And indeed, the inhibition of transcription significantly rescued
DNA replication from its impairment by ISR (Fig. 5 C−F and Supp. Fig. 5 A−D), suggesting that
ongoing transcription and R-loops formed by ISR are responsible for impairing DNA replication.
ISR activation blocks the synthesis of histones required for DNA replication, reducing
chromatin assembly on newly synthesized DNA
Phosphorylation of eIF2alpha at Ser51 during ISR inhibits cap-dependent translation, thereby blocking
the synthesis of most proteins in the cell. To investigate if abolished protein synthesis is sufficient to
impair DNA replication, we treated cells with a well-established ribosome inhibitor, cycloheximide
(CHX), and measured DNA replication progression (Supp. Fig. 6 A). Within an hour of CHX treatment,
we observed a strong reduction in DNA replication (Supp. Fig. 6 B−D), mimicking the effects we
observed with the ISR inducers (Fig 1 E−L and Supp. Fig.1 C−L). Next, we asked which kind of
proteins need to be synthesized continuously to sustain DNA replication. Based on previous reports
(Gunjan, Paik and Verreault, 2005; Groth, Corpet, et al., 2007; Mejlvang et al., 2014; Henriksson et al.,
2018) we suspected that histones need to be provided throughout DNA synthesis to avoid replication
stress. Indeed, inducing the ISR by Thap or BEPP quickly reduced the levels of newly synthesized
soluble histones, as marked by acetylation of lysine residue 56 (K56) on Histone 3 (H3K56ac) or lysine
residues 5 (K5) or 12 (K12) on Histone 4 (H4K5ac or H4K12ac) (Sobel et al., 1995; Masumoto et al.,
2005; Groth, Rocha, et al., 2007; Alabert and Groth, 2012; Mejlvang et al., 2014), to a similar extent as
upon CHX treatment (Fig. 6 A and Supp. Fig. 6 E). To test if a reduction in histone synthesis alone is
sufficient to hinder DNA replication in our system, as found earlier (Mejlvang et al., 2014), we used
siRNA to deplete the stem loop-binding protein (SLBP) that is required for translation of histones. As
expected, SLBP depletion also resulted in a mark decrease in soluble H3K56ac, H4K5ac and H4K12ac
(Fig. 6 A and Supp. Fig. 6 E). Of note, a significant impairment in DNA replication was observed by
SLBP depletion alone (Supp. Fig. 6 F−I), strongly suggesting that histones are the critical protein
species the reduced synthesis of which is responsible for impaired DNA replication during ISR.

MANUSCRIPT
40
To find out whether restoring histone levels alone might allow DNA replication even during ISR, we
measured DNA replication in cells overexpressing histone H2A and treated with Thap or BEPP (Fig. 6
B and Supp. Fig. 6 L). We transfected cells to express either wildtype H2A or H2A with a mutation at
its ubiquitination residues (K118−119R) (Mattiroli et al., 2012). Strikingly, overexpression of wildtype
histone H2A restored DNA replication despite ISR activation (Fig. 6 C,D and Supp. Fig. 6 J−O).
Moreover, the ubiquitination residues of H2A were necessary for supporting DNA replication (Supp.
Fig. 6 P,Q), as reported previously in a different replication context (Klusmann et al., 2018). As shown
in Fig. 6 A, the ISR led to the general decrease in newly synthesized histones, making it difficult to
explain how the overexpression of H2A alone could rescue DNA replication upon ISR. We
hypothesized that the overexpression of any one histone (H2A in this case) could increase the levels of
other free histones necessary for replication, e.g. by forming histone complexes. Indeed, we also
observed an increase in histone H4 carrying an acetylation of lysine 5 upon H2A overexpression (Fig. 6
E and Supp. Fig. 6 R). This modification is typically found on newly synthesized H4 (Mejlvang et al.,
2014). We performed additional fiber assay experiments to address if the overexpression of other
histones such as H4 and H2B could also rescue DNA replication upon ISR. Indeed, similar to H2A, the
overexpression of either H4 or H2B (Megason, 2009) restored DNA replication impairment downstream
of ISR to a considerable extent (Fig. 6 F−I and Supp. Fig. 6 S−AF). It has been shown previously that
histone depletion leads to an accumulation of nucleosome-free regions especially in areas of newly
synthesized DNA (Mejlvang et al., 2014). To investigate if newly replicating DNA accumulates
nucleosome-free regions during ISR as well, we conducted a micrococcal nuclease (MNase) assay on
nascent chromatin pulse labeled with EdU on Thap−treated cells. We found that nascent chromatin of
Thap−treated cells was more sensitive to MNase, as observed by a larger decrease in the EdU signal
in these cells compared to the control−treated cells. In contrast, there was no detectable differences in
the MNase accessibility of global, non-labeled chromatin (Fig. 6 J,K and Supp. Fig. 6 AG,AH). We
conclude that the ISR interferes with DNA replication through inhibiting histone synthesis, leading to an
enrichment of open chromatin at newly replicated sites.
Inhibition of histone synthesis induces R-loops which impairs DNA replication
We have found that the ISR compromises DNA replication and that the lack of newly synthesized
histones upon ISR leads to the accumulation of nucleosome-free regions (Fig. 6). Moreover, the ISR
can induce R-loops (Fig. 3), which are also required to perturb DNA replication (Fig. 4 and 5). Lack of
chromatin compaction promotes R-loop formation since a more accessible chromatin structure favors
rehybridization of RNA to its DNA template (Chédin, 2016). Therefore, we hypothesized that histone
deprivation induces the formation of R-loops which then compromises DNA replication. To investigate

MANUSCRIPT
41
this, we performed immunofluorescence staining using the S9.6 antibody to detect R-loops on cells that
had been treated with CHX to deplete newly synthesized histones, with and without RNaseH1
overexpression. Indeed, CHX−treated cells accumulated DNA:RNA hybrids (Fig. 7 A and Supp. Fig. 7
A−C). Similarly, dot blot analysis using the S9.6 antibody on chromatin from these cells also revealed a
profound induction of R-loops which was removed upon RNaseH treatment (Fig. 7 B,C and Supp. Fig.
7 D,E). Next, to investigate if DNA replication impairment by histone depletion could also be restored by
removing R-loops, we depleted cells of new histones using CHX or by siRNA to SLBP, in the presence
or absence of either wildtype or catalytically inactive RNaseH1, and then measured the progression of
DNA replication (Fig. 7 D,E). We observed that overexpression of wildtype RNaseH1 but not its mutant
rescued DNA replication upon histone depletion (Fig. 7 F−I and Supp. Fig. 7 F−K). Together, these
results suggest a mechanistic concept of ISR-induced DNA replication impairment. Accordingly, ISR
blocks histone synthesis which then interferes with DNA replication through R-loops.
MANUSCRIPT
42
3.7 DISCUSSION
Our results indicate that the ISR compromises DNA replication, within the first hour of eIF2alpha
phosphorylation, and through the depletion of histones. When new histones become unavailable, by
ISR or histone chaperone inhibition, R-loops mediate the impairment of DNA replication fork
progression.
Is this replication stress? Previous reports suggest that the depletion of histones slow down replication
fork progression, but do not detectably trigger the activation of Chk1, a classical hallmark of replication
stress (Mejlvang et al., 2014; Dobbelstein and Sørensen, 2015; Henriksson et al., 2018). Similarly, in
our hands, Chk1 phosphorylation or phosphorylation of the histone variant H2AX (gamma H2AX) are
observed only to a low extent (when compared to treatment with the nucleoside analogue gemcitabine)
(Supp. Fig. 1 N). Taken together with the observed accumulation of R-loops, we conclude that R-loops
as such do not necessarily activate Chk1, despite interfering with the progression of DNA replication
forks, at least not within the first few hours of blocking DNA replication.
It was previously reported that the lack of histone supply hinders replication fork progression (Groth,
Corpet, et al., 2007; Mejlvang et al., 2014; Henriksson et al., 2018). The mechanism(s) were suggested
to include interactions of histones with the MCM helicase and/or the delayed removal of PCNA from
Okazaki fragments but remain to be fully clarified (Mejlvang et al., 2014). Our results provide the
following explanation. When histones are missing, nucleosome-free DNA accumulates upon replication
(Fig. 6 J,K). This provides more opportunities of DNA:RNA hybridization (Fig. 7 A−C). The resulting R-
loops turned out to be required for the observed replication fork impairment, since RNaseH1 enhanced
DNA synthesis in the context of histone depletion (Fig. 7 D−I). However, it remains to be determined
how exactly such R-loops lead to stalled replication. Apart from physical collisions, the accumulation of
R-loops might trigger signaling pathways that attenuate fork progression (García-Muse and Aguilera,
2016). Indeed, it has been shown that R-loops induce the phosphorylation of Histone H3 at Ser10
(H3S10), a mark of chromatin compaction (Castellano-Pozo et al., 2013). It is thus possible that the R-
loops formed could lead to torsional stress throughout the DNA surrounding them through chromatin
condensation, which then signals the replication machinery ahead to stop replicating DNA (Santos-
Pereira and Aguilera, 2015).
We propose that the inhibition of DNA replication as part of the ISR provides an advantage for cell
survival. Under conditions of nutrient deprivation, it is conceivably advantageous that protein synthesis
is reduced to a minimum. On top of this, our results show that slowing down DNA synthesis through R-

MANUSCRIPT
43
loop accumulation, as a newly established part of the ISR, helps the cell to survive nutrient restriction.
This can be seen with a substantial impairment in proliferation of cells overexpressing RNaseH1 under
ISR stimulation (Fig. 4 F). After all, replicating a diploid human genome within one cell requires 2x3x109
deoxynucleoside-triphosphates, each of which contains two energy-rich anhydride bonds. Stalling
replication forks reduces the rate by that dNTPs are used and might thus contribute to survival under
conditions of limited available energy. This might have contributed to the evolution of a tight coupling
mechanism that immediately shuts down DNA synthesis in the context of ISR.
The ISR has also been suggested as a target for cancer therapy (Urra et al., 2016; Ojha and
Amaravadi, 2017). The idea is mainly to exacerbate proteotoxicity and the accumulation of unfolded
proteins in cancer cells by inhibitors of kinases that would otherwise stimulate the ISR. Based on the
results presented here, it is possible that negatively interfering with the ISR may also overcome the
stalling in DNA replication, perhaps enhancing the vulnerability of cancer cells towards drugs that
provoke replication stress, e.g. nucleoside analogues or ATR inhibitors (Dobbelstein and Sørensen,
2015). This suggests the use of ISR inhibitors with nucleoside analogues and/or ATR inhibitors in an
attempt to achieve synergistic responses to eliminate cancer cells.
Proteasome inhibitors and HSP90 inhibitors form part of a general strategy to eliminate cancer cells by
targeting essential cellular machineries (Dobbelstein and Moll, 2014), exploiting non-oncogene
addiction (Luo, Solimini and Elledge, 2009; Nagel, Semenova and Berns, 2016). However, these
inhibitors induce the ISR as well (Suh et al., 2012). The results presented here suggest that this will
also halt DNA replication forks. It remains to be determined whether this will diminish the activity of
DNA-damaging chemotherapeutics towards cancer cells. In such a case, the simultaneous
administration of proteotoxic drugs with certain conventional chemotherapeutics might need to be
avoided to prevent drug antagonisms. On the other hand, the addition of an ISR inhibitor might restore
the cooperation of a proteotoxic and a DNA-damaging drug.
In contrast to the direction explored here, replication stress can also induce the ISR, as has been
reported in the case of the nucleoside analogue gemcitabine (Palam et al., 2015). Of note, however,
gemcitabine was found to induce eIF2alpha phosphorylation with a delay of at least 6 hrs. In
accordance with this, we were also unable to detect eIF2alpha phosphorylation within shorter periods of
time upon gemcitabine treatment (data not shown). Thus, the ISR probably does not affect the
immediate response of cells towards direct triggers of replication stress. However, upon long-term
application of chemotherapy, the ISR might represent a mechanism of cell resistance, not only by
avoiding proteotoxic stress but also by slowing down DNA replication.

MANUSCRIPT
44
Another important aspect of the ISR consists in the defense against virus infection, in particular through
activation of the kinase PKR (Balachandran et al., 2000; Garcia et al., 2006). Most obviously, this will
reduce the production of virus proteins, e.g. for building new virus particles. Our results suggest that, in
addition, DNA synthesis is diminished. On top of cellular DNA, this may also pertain to viral genomes,
especially when they are associated with nucleosomes and thus require histone synthesis. This
packaging of viral DNA into nucleosomes has been observed (Bock et al., 1994; Lieberman, 2008;
Knipe et al., 2013). It is therefore tempting to speculate that the ISR might also contribute to a decrease
in the synthesis of viral DNA, perhaps antagonizing virus production more efficiently than through
translational shutdown alone.
MANUSCRIPT
45
3.8 ACKNOWLEDGEMENTS
pICE-NLS-mCherry, pICE-RNaseH1-WT-NLS-mCherry and pICE-RNaseH1-D10R-E48R-NLS-mCherry
were gifts from Patrick Calsou (Addgene plasmid #60364, #60365 and #60367 respectively).
pFRT_TO_DESTFLAGHA and pFRT-TODestFLAGHA_RNAseH1 were gifts from Thomas Tuschl
(Addgene plasmid #26361 and #65782 respectively). pCDNA3.1-Flag-H2A and pCDNA3.1-Flag-H2A
K118-119R were gifts from Titia Sixma (Addgene plasmid #63560 and #64564 respectively). V48
pCS2+mRFP-N1 was a gift from Randall Moon (Addgene plasmid # 17143). pCS-H2B-mRFP1 was a
gift from Sean Megason (Addgene plasmid # 53745). mEGFP was a gift from Karel Svoboda (Addgene
plasmid # 18696) and mEGFP-H4-23 was a gift from Michael Davidson (Addgene plasmid # 56463)
Our work was supported by the Else Kröner-Fresenius-Stiftung, the Deutsche Krebshilfe, the Wilhelm
Sander-Stiftung, the Deutsche José Carreras Stiftung, and the Deutsche Forschungsgemeinschaft. VM
was a member of the Göttingen Graduate School GGNB and of the IMPRS/MSc./PhD program
Molecular Biology, and JC was a member of the Göttingen Graduate School GGNB during this work.
3.9 AUTHOR CONTRIBUTIONS
JC and MD conceived the project and designed experiments. JC performed most experiments. AM and
DS performed some experiments. VM optimized the click reaction for the EdU assays. MD drafted the
manuscript. JC revised the manuscript. All authors read and approved the manuscript.
3.10 DECLARATION OF INTERESTS
The authors declare no competing interests.

MANUSCRIPT
46

MANUSCRIPT
47
3.11 FIGURES/ FIGURE LEGENDS
FIGURE 1: DNA replication is compromised shortly after ISR induction
(A) Schematic representation of the integrated stress response (ISR) that can be activated upon
stimulation of the kinases PERK, PKR or GCN2 or upon inhibition of the phosphatase PP1 using
Thapsigargin (Thap), BEPP-monohydrochloride (BEPP), L-Histidinol or Sephin respectively. Activation
of ISR can be measured by an increase in eIF2alpha phosphorylation or by the accumulation of the
transcription factor ATF4. ISR can be inhibited using a small molecule inhibitor, ISRIB.
(B) Immunoblot analysis of cells treated with Thap (4 μM, 1 h), BEPP (10 μM, 2.5 h) or Sephin (25
μM, 2.5 h) to confirm ISR induction. HSC70 as loading control. For each set of treatment, a different
exposure time was used to detect ISR activation.
(C) Representative horseshoe plots showing EdU incorporation in relation to DNA content (DAPI) of
cells treated with DMSO, Thap (4 μM, 1 h) or BEPP (10 μM, 2.5 h).
(D) Average EdU staining intensity of cells in S phase as determined from the plots in (C) and
displayed as mean ± SEM. For second biological replicate, see Supp. Fig. 1 B.
(E) U2OS cells were incubated with 5’-chloro-2’-deoxy-uridine (25 μM CldU, 30 min) followed by 5-
iodo-2’-deoxyuridine (250 μM IdU, 60 min) in the presence of 4 μM Thap prior to harvesting for DNA
fiber analysis.
(F) Representative labeled tracks of newly synthesized DNA incorporating CldU (red) and IdU
(green) of cells treated with Thap as indicated in (E).
(G) Fork progression as determined from IdU track length (kb/min), displayed as 5-95 percentile
whiskers boxplot of Thap–treated cells. Box plots represent data from one out of 3 independent
experiments. See Supp. Fig. 1 C,D for additional experiments.
(H) U2OS cells were pre-treated with 10 μM BEPP or 25 μM Sephin for 1 h and subsequently
incubated with CldU (25 μM, 30 min) and IdU (250 μM, 60 min) in the presence of these reagents and
then harvested for analysis. Different time periods were used for treatment and labeling in the cases of
BEPP or Sephin treatment, to account for the different strengths of ISR induction by these compounds.

MANUSCRIPT
48
(I/J) Representative fiber tracks as visualized by immunostaining of CldU (red) and IdU (green) of
BEPP (I) or Sephin (J) −treated cells.
(K/L) Fork progression calculated from the IdU label (kb/min) of BEPP (K) or Sephin (L) –treated
cells. Fork progression displayed as boxplots with 5-95 percentile whiskers which are representative of
one out 3 independent experiments. See Supp. Fig. 1 E–H.
(M) Cells were pulsed labeled with CldU (25 μM, 60 min) and then alternately with IdU (25 μM) and
CldU (25 μM) for 15 min intervals for a duration of 1.5 h in the presence of Thap (4 μM) as indicated,
then harvested for 7-label fiber assay analysis (Klusmann et al., 2016). From this, the number of labels
incorporated was used for fork stalling analysis and the length of labels 2-3 was used for fork
progression analysis.
(N) Representative images of fiber tracks that have incorporated all 7 labels.
(O) Percentage of forks with less than 7 labels indicating lower processivity or higher fork stalling
rate of cells treated with Thap. Chart represents mean ± SEM of two independent experiments.
(P) Velocity of fork determined from track length of labels 2 to 3 (kb/min) displayed as box plots (5-
95 percentile whiskers). Plot is a representative of 2 independent experiments. See Supp. Fig. 1 M.
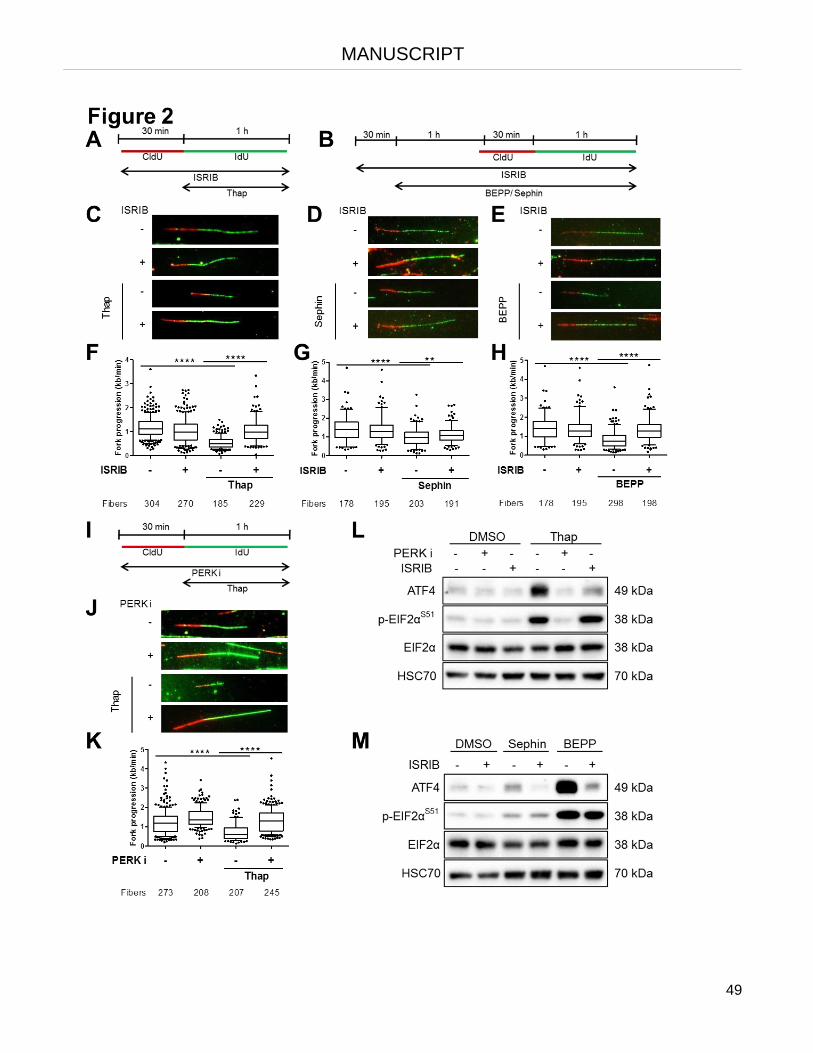
MANUSCRIPT
49

MANUSCRIPT
50
FIGURE 2: Pharmacological antagonists of ISR partially rescue DNA replication
(A) U2OS cells were treated with 1 μM ISRIB and at the same time incubated with CldU (25 μM, 30
min). Cells were labeled with IdU (250 μM, 60 min) in the presence of ISRIB and 4 μM Thap and then
harvested for DNA fiber assay analysis.
(B) Cells were pre-treated with 1 μM ISRIB for 30 minutes and then with 10 μM BEPP or 25 μM
Sephin in the presence of ISRIB for 2.5 h. To label newly synthesized DNA, cells were incubated with
CldU (25 μM, 30 min) and IdU (250 μM, 60 min) during the last 1.5 h as shown, and then harvested for
analysis.
(C−E) Representative DNA tracks as labelled in red (CldU) and green (IdU) of cells treated with
ISRIB/Thap (C), ISRIB/Sephin (D), or ISRIB/BEPP (E).
(F−H) Fork progression (kb/min) of IdU label of cells treated with ISRIB/Thap (F), ISRIB/Sephin (G) or
ISRIB/BEPP (H) represented as 5-95 percentile box plots. Plots shown are a representative of 2 or 3
independent experiments. See Supp. Fig. 2. A–E.
(I) U2OS cells were treated with 0.5 μM PERK i in the presence of CldU (25 μM, 30 min) followed
by IdU (250 μM, 60 min) with both PERK i and 4 μM Thap as indicated prior to DNA fiber analysis.
(J) DNA fiber tracks (representative) of cells in (I) visualized with immunostaining of CldU (red) and
IdU (green).
(K) DNA replication fork progression (kb/min) of PERK i and Thap–treated cells measured using the
IdU track length. Representative box plot (5-95 percentile whiskers) of one of 3 independent
experiments shown. See Supp. Fig. 2 F,G.
(L) Western blot analysis of PERK i or ISRIB–treated cells with or without Thap confirming
activation and inhibition of ISR in the context of PERK stimulation. HSC70 was used as loading control.
(M) Expression of ATF4 and eIF2alpha phosphorylation status as measured via immunoblot
analysis to ensure ISR activation and/or inhibition. HSC70 was visualized to ensure equal loading.

MANUSCRIPT
51

MANUSCRIPT
52
FIGURE 3: Stimulation of the ISR induces R-loops
(A) Cells were treated with 4 μM Thap or 10 μM BEPP for 1 h or 3 h respectively with/without
RNaseH1 overexpression prior to fixation and immunofluorescence analysis as described.
Representative images of cells as visualized using DAPI (nuclei) or Alexa-Fluor488 (S9.6) staining.
S9.6 antibody was used to detect R-loops as described in methods and materials. Note that the
antibody also gives rise to a fluorescence signal in the cytoplasm, in agreement with previous reports
(Schwab et al., 2015; Salas‐Armenteros et al., 2017). Unlike the nuclear signal, the cytoplasmic
fluorescence was not removed by RNaseH1 and thereby confirmed to be non-specific. DAPI was used
to determine the regions of interests within the nuclei for quantification of S9.6 staining as indicated by
the white outlines. Of note, the nuclear S9.6 signal was removed by RNaseH1, indicating that it truly
reflects DNA:RNA hybrids. Scale bar: 20 μm.
(B) Scatter plot of S9.6 intensity per nucleus of cells (in arbitrary units), determined by quantification
from one of 2 independent experiments (see Supp. Fig. 3 A). Red line represents mean nuclear S9.6
staining.
(C) Western blot analysis confirming RNaseH1 overexpression and ISR activation (ATF4 level).
HSC70 was used as loading control.
(D) ISR was induced in cells using Thap (4 μM, 1 h) or BEPP (10 μM, 3 h), followed by dot blot
analysis to quantify DNA:RNA hybrids. Equal amounts of DNA were spotted onto nitrocellulose
membrane, and R-loops were detected using the S9.6 antibody. RNaseH treatment was conducted
alongside and used as a negative control to confirm the specificity of the signal. The signal of ssDNA
was used as an internal sample loading control. See Supp. Fig. 3 B for a replicate.
(E) The S9.6 signals obtained in (D) were quantified, normalized against the loading control (ssDNA
signal), then against DMSO (without RNaseH) and plotted as bar charts. See Supp. Fig. 3 C.

MANUSCRIPT
53

MANUSCRIPT
54
FIGURE 4: Removal of R-loops re-establishes DNA replication upon induction of ISR but
compromises survival of stressed cells
(A) U2OS cells transfected with control, RNaseH1 wildtype (wt) or catalytically mutant RNaseH1
(D10R-E48R) (mut) expression plasmids for 24 h were treated with Thap (4 μM, 1 h) or BEPP (10 μM,
2.5 h). During the last 1 h of treatment, the cells were labeled with 20 μM EdU and then washed, fixed
and subjected to fluorescence analysis of EdU incorporation. Representative images of DAPI (blue)
and EdU (red) signals of one independent experiment out of 3 are shown. Scale bar: 100 μm
(B) Box plot (5-95 percentile whiskers) of the quantified EdU intensities per nucleus of one of 3
independent experiments. For replicates, see Supp. Fig. 4 A,B.
(C) Transfection of cells with control or RNaseH1 plasmids (wt or mut) were conducted as
described in (A) 24 h prior to labeling with CldU (25 μM, 30 min) and IdU (250 μM, 60 min). Cells were
treated with 4 μM Thap during the IdU label and then harvested for analysis.
(D) Representative DNA fiber tracks stained for CldU (red) and IdU (green) of Thap–treated cells
overexpressing the respective plasmids as described in (C).
(E) Box plot (5-95 percentile whiskers) of DNA fork progression (kb/min) of cells overexpressing
RNaseH1 wt or mut plasmids in the presence/absence of Thap. Fork progression was measured using
the IdU label and the plot shown is a representative of one out of 3 independent experiments. See
Supp. Fig. 4 C,D.
(F) Long-term proliferation assay of BEPP−treated cells with/without RNaseH1 overexpression
displayed as percentage of confluence. Transfected cells that were synchronized at S phase were
treated with either DMSO or BEPP (30 μM) for 6 hours. The media was then replenished and cell
confluency at day 0 was measured using the Celigo Cytometer. Confluency was measured on the
indicated days for 2 weeks. Mean ± SD of technical duplicates were plotted. The plot is a
representation of 3 biological repeats (Supp. Fig. 4 L,M).

MANUSCRIPT
55

MANUSCRIPT
56
FIGURE 5: Ongoing transcription is required for compromising DNA replication by the ISR
(A) Cells were pre-treated with CDK9 inhibitors (25 μM DRB, 10 μM LDC067 or the solvent control)
for 1 h prior to labeling with CldU (25 μM, 30 min) and IdU (250 μM, 60 min) in the presence of CDK9i
and Thap (4 μM). Cells were then harvested for DNA fiber analysis as described.
(B) U2OS cells were treated with CDK9i (25 μM DRB or 10 μM LDC067) and BEPP (10 μM) for 1 h
and then labelled with CldU (25 μM, 30 min) and IdU (250 μM, 60 min) with both CDK9i and BEPP as
indicated prior to analysis.
(C/D) Representative DNA fiber tracks of cells treated with CDK9i/ Thap (C) or CDK9i/BEPP (D)
visualized via immunostaining of CldU (red) and IdU (green).
(E/F) IdU tracks of cells treated with CDK9i and Thap (E) or CDK9i and BEPP (F) were used to
measure fork progression (kb/min) and are presented as box plots (5-95 percentile whiskers). One
representative plot from 3 independent experiments shown. See Supp. Fig. 5 A–D.

MANUSCRIPT
57

MANUSCRIPT
58
FIGURE 6: ISR activation blocks the synthesis of histones required for DNA replication,
reducing chromatin assembly on newly synthesized DNA
(A) Soluble proteins were extracted from cells treated with Thap (4 µM), BEPP (10 µM), CHX (50
µg/ml) or cells transfected with siRNA against SLBP (100 nM) for the indicated periods of time.
Immunoblot analyses of soluble histone-3 lysine-56 acetylation (H3K56ac) and histone-4 lysine-5
acetylation (H4K5ac) were used to measure newly synthesized histones (Masumoto et al., 2005;
Mejlvang et al., 2014). HSC70 was detected as a loading control.
(B) Cells were transfected with plasmids, labeled with CldU (25 μM, 30 min) followed by IdU (250
μM, 60 min). Cells were treated with Thap (4 μM) during the IdU label as indicated prior to subsequent
analysis.
(C) Representative DNA fiber tracks of cells transfected with plasmids (control, H2A wt or H2A
K118R-K119R mutant) and labeled as described in (B) using CldU (red) and IdU (green).
(D) Fork progression (kb/min) of cells in (C) calculated using IdU track length. DNA fork progression
displayed as box plot (5-95 percentile whiskers) and is a representative data of one of 3 independent
experiments. See Supp. Fig. 6 J,K.
(E) Western blot analysis of soluble H4K5ac from H2A-overexpressing cells. HSC70 used as
loading control. Representative blot shown. For replicate, see Supp. Fig. 6 R.
(F/G) Images of DNA fibers (representative) of Thap–treated cells overexpressing either H4 (F) or
H2B (G) and labeled for DNA fiber assay as described in (B).
(H/I) DNA fork progression (kb/min) displayed as box plots (5-95 percentile whiskers). IdU-labeled
tracks were used to calculate fork progression of Thap−treated cells overexpressing H4 (H) or H2B (I).
Plots are a representation of one out of 3 independent experiments. See Supp. Fig. 6 S,T,Z,AA.
(J) MNase sensitivity assay on nascent and global chromatin. Cells were incubated with 20 µM
EdU for 1 hour in the presence of DMSO or 4 µM Thap to label newly synthesized DNA (or nascent
chromatin). To overcome the lower DNA replication rate by Thap, the cells were transfected to
overexpress RNaseH1. After fixation, and following click chemistry reaction to label nascent chromatin
(EdU signal), the cells were subjected to MNase degradation for 0, 2 or 5 min as indicated, then stained
for global DNA with DAPI. Images were acquired using fluorescence microscopy detecting EdU and

MANUSCRIPT
59
DAPI. Representative images of the EdU and DAPI signals from samples subjected to digestion with
MNase for 0 or 2 min are shown. Scale bar: 100 µm.
(K) The EdU (nascent chromatin) and DAPI (global chromatin) signals were quantified and
normalized to their respective 0 min MNase control and plotted to display relative intensity vs MNase
digestion time. See Supp. Fig. 6 AH for a replicate.

MANUSCRIPT
60

MANUSCRIPT
61
FIGURE 7: Inhibition of histone synthesis induces R-loops which impairs DNA replication
(A) Cells synchronized at S phase and transfected with either control or RNaseH1 expression
plasmids were treated with cycloheximide (CHX; 50 µg/ml) for 1 h, then harvested for S9.6
immunofluorescence analysis as described in Fig. 3 A. Intensity of S9.6 staining per nucleus was
quantified and displayed as a scatter plot. Red line represents mean S9.6 intensity per nucleus. See
Supp. Fig. 7 A,B for a replicate.
(B) Dot blot analysis of S phase cells to detect R-loops using S9.6 antibody. Synchronized cells in S
phase were treated with CHX (50 µg/ml, 1 h) and harvested. Equal amounts of DNA were spotted onto
nitrocellulose membrane. R-loops were detected using S9.6 antibody whereas subsequent ssDNA
detection (on denatured DNA) was used as an internal loading control. As a negative control, samples
were treated with RNaseH enzyme for 3 h at 37°C. Blot is a representative of 2 independent
experiments. See Supp. Fig. 7 D.
(C) Signal from the spots in (B) were quantified and normalized to the loading control (ssDNA) and
then to the sample without ISR or RNaseH treatment. See Supp. Fig. 7 E.
(D) U2OS cells were transfected with plasmids (control, RNaseH1 wt or RNaseH1 catalytically
mutant) 24 hours prior to labeling with CldU (25 μM, 30 min) and IdU (250 μM, 60 min). CHX (50 μg/ml)
was added to the cell during the IdU label.
(E) Cells were transfected with siRNA (scrambled non-specific control or siCtrl, or siSLBP, 100 nM)
16 h prior to overexpression with plasmids (control, RNaseH1 wt or RNaseH1 mut) as indicated. Cells
were then incubated with CldU (25 μM, 30 min) and IdU (250 μM, 60 min) to label newly synthesized
DNA and then harvested.
(F/G) DNA fiber tracks of CHX–treated cells (F) or cells depleted from SLBP (G) with overexpression
of either control, RNaseH1 wt or RNaseH1 mutant plasmids. Fiber tracks were observed by
immunostaining of CldU (red) and IdU (green).
(H/I) Box plot (5-95 percentile whiskers) showing the fork progression (kb/min) as measured using
IdU track length of CHX−treated (H) or SLBP–depleted (I) cells in the presence/absence of RNaseH1
overexpression. Representative data shown from one of 3 independent experiments. See Supp. Fig. 7
F−I.

MANUSCRIPT
62

MANUSCRIPT
63
3.12 SUPPLEMENTARY FIGURES/ SUPPLEMENTARY FIGURE LEGENDS
SUPP FIGURE 1: DNA replication is compromised shortly after ISR induction. Related to Fig. 1.
(A) Immunoblot analysis of cells treated with control or L-Hist (4 mM ,1 h) to confirm ISR induction
(eIF2alpha phosphorylation status and ATF4 levels). HSC70 as loading control.
(B) Average EdU intensity of cells in S phase displayed as mean ± SEM of the second independent
experiment conducted in technical triplicates. See Fig. 1 D.
(C−H) DNA fork progression (kb/min) of Thap (C,D), BEPP (E,F) or Sephin (G,H) –treated cells as
described in Fig. 1 E or 1 H. Fork progression calculated using IdU track and displayed as box plots
with 5-95 percentile whiskers. Replicate experiments for Fig. 1 G,K,L respectively.
(I) U2OS cells were incubated with 5’-chloro-2’-deoxy-uridine (25 μM CldU, 30 min) followed by 5-
iodo-2’-deoxyuridine (250 μM IdU, 60 min) in the presence of 4 mM L-Hist prior to harvesting for DNA
fiber analysis.
(J) Representative images of IdU (green) and CldU (red) track lengths of L-Hist−treated cells.
(K/L) Box plot (5-95 percentile) of DNA fork progression (kb/min) of IdU label of cells treated with L-
Hist. Cells were treated and labeled as described in (I). Two biological replicates of 3 shown.
(M) Fork progression as determined using the track length of label 2-3 of the 7-label fiber assay.
Box plot with 5-95 percentile whiskers of the second biological repeat of Fig. 1 P shown.
(N) Cells were treated with Thap (4 μM) or Gem (500 nM) for 1 h and then harvested for western
blot analysis. Chk1 phosphorylation and gamma H2AX induction marks replicative stress (Dobbelstein
and Sorensen, 2015). Total Chk1 levels and H3 were used as loading controls. Thap treatment does
not induce Chk1 phosphorylation or gamma H2AX to a similar extent as Gemcitabine treatment, a
widely used replicative stress inducer.
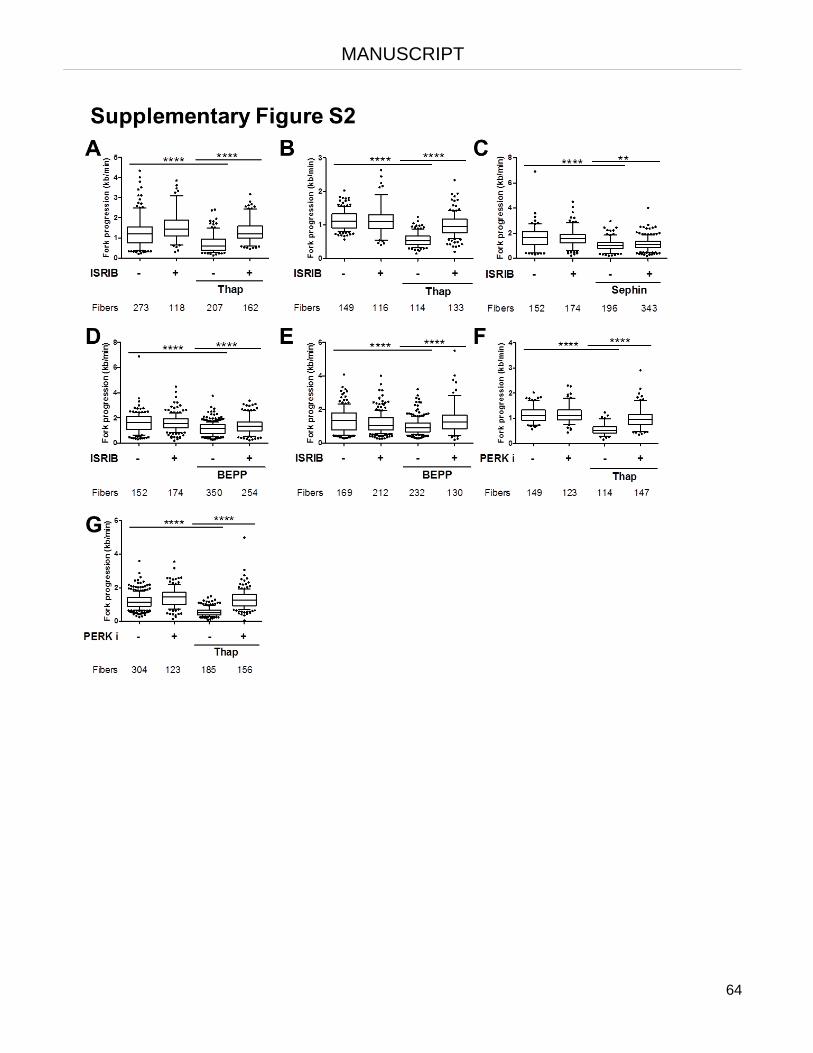
MANUSCRIPT
64

MANUSCRIPT
65
SUPP FIGURE 2: Pharmacological antagonists of ISR partially rescue DNA replication. Related to
Fig. 2.
(A/B) Biological repeats of the experiment described in Fig. 2 A. Box plot (5-95 percentile whiskers)
showing fork progression rate (kb/min) of ISRIB/Thap–treated cells, calculated using IdU length.
Corresponding to Fig. 2 F.
(C−E) Box plot (5-95 percentile whiskers) showing DNA fork progression rate (kb/min) measured using
IdU length of ISRIB/Sephin (C) or ISRIB/BEPP (D,E) –treated cells as described in Fig. 2 B. Replicates
to Fig. 2 G,H.
(F/G) Fork progression rate (kb/min) of PERK i/Thap –treated cells of the experiment described in Fig.
2 I. IdU label was used to calculate fork rate and displayed as box plots (5-95 percentile whiskers). See
Fig. 2 K.

MANUSCRIPT
66

MANUSCRIPT
67
SUPP FIGURE 3: Stimulation of the ISR induces R-loops. Related to Fig. 3.
(A) Biological replicate of the experiment described in Fig. 3 A,B showing S9.6 intensity per
nucleus of cells (in arbitrary units) after quantification. Red line represents mean nuclear S9.6 staining.
(B) Replicate of the dot blot analysis for S9.6 detection to quantify R-loops and ssDNA as internal
sample loading control. Samples were subjected to RNaseH treatment to confirm the specificity of the
signal. See Fig. 3 D.
(C) Quantification of the S9.6 signal detected in (B) normalized against the ssDNA and against the
DMSO (without RNaseH) control. See Fig. 3 E.

MANUSCRIPT
68

MANUSCRIPT
69

MANUSCRIPT
70
SUPP FIGURE 4: Removal of R-loops re-establishes DNA replication upon induction of ISR but
compromises survival of stressed cells. Related to Fig. 4.
(A/B) Biological replicates showing EdU intensity per nucleus of Thap or BEPP−treated cells in the
presence/absence of wildtype or mutant RNaseH1. Box plots with 5-95 percentile whiskers shown.
Corresponding to Fig. 4 B.
(C/D) DNA fork progression (kb/min) measured using IdU track length of Thap–treated cells
with/without RNaseH1 overexpression plasmids as described in Fig. 4 C. Results displayed as box
plots with 5-95 percentile whiskers. Replicates to Fig. 4 E.
(E) Transfection of cells with control or RNaseH1 plasmids (wt or mut) were conducted as
described. Cells were then treated with 10 μM BEPP for 1 h and then incubated in CldU (25 μM, 30
min) and IdU (250 μM, 60 min) in the presence of BEPP prior to analysis.
(F) Labeled DNA fibers visualized via immunostaining of CldU (red) and IdU (green) of BEPP–
treated cells overexpressing the respective plasmids described in (E).
(G−I) Box plots (5-95 percentile whiskers) showing the DNA fork progression (kb/min) of cells
overexpressing RNaseH1 wt/mut and treated with BEPP as described. IdU label was used to measure
fork progression.
(J/K) Activation of ISR and RNaseH1 overexpression confirmed with immunoblot analysis of
phosphorylated eIF2alpha and mCherry respectively with HSC70 as loading control.
(L/M) Biological replicates of the proliferation assay described in Fig. 4 F of S phase cells treated with
30 µM BEPP for 6 hours with/without RNaseH1 overexpression.

MANUSCRIPT
71

MANUSCRIPT
72
SUPP FIGURE 5: Ongoing transcription is required for compromising DNA replication by the
ISR. Related to Fig. 5.
(A−D) IdU fork progression in kb/min of cells treated with CDK9i and Thap (A−B) or BEPP (C−D) as in
Fig. 5 A,B displayed as box plots (5-95 percentile whiskers). Biological replicates to Fig. 5 E,F
respectively.

MANUSCRIPT
73

MANUSCRIPT
74

MANUSCRIPT
75

MANUSCRIPT
76
SUPP FIGURE 6: ISR activation blocks the synthesis of histones required for DNA replication,
reducing chromatin assembly on newly synthesized DNA. Related to Fig. 6.
(A) U2OS cells were labelled with CldU (25 μM, 30 min) followed by IdU (250 μM, 60 min) in the
presence of cycloheximide (CHX, 50 μg/ml) and then harvested.
(B) Representative DNA fibers of cells treated with CHX or solvent control (EtOH) visualized with
immunostaining of CldU (red) and IdU (green).
(C/D) Box plot (5-95 percentile whiskers) showing fork progression (kb/min) calculated using IdU track
length of CHX–treated cells in (A). Two biological replicates of 3 shown.
(E) Soluble proteins were extracted as described from Thap (4 µM), BEPP (10 µM), CHX (50 µg/ml)
–treated cells or cells transfected with siRNA against SLBP (100 nM). Immunoblot analysis of soluble
histone-4 lysine-12 acetylation (H4K12ac) was used as a mark for newly synthesized histones. HSC70
was used as loading control.
(F) U2OS cells were transfected with control or siRNA against SLBP (100 nM) for 40 hours prior to
incubation with CldU (25 μM, 30 min) and IdU (250 μM, 60 min). Cells were the harvested for DNA fiber
analysis.
(G) Representative DNA fiber tracks of cells treated depleted of SLBP visualized via
immunostaining of CldU (red) and IdU (green).
(H) IdU track length of cells in (G) was used to measure DNA fork progression (kb/min) as displayed
as box plots (5-95 percentile whiskers). One representative experiment out of 3 shown.
(I) Western blot analysis of cells treated in (F) confirming SLBP knock down. HSC70 used as
loading control.
(J/K) Box plots (5-95 percentile whiskers) showing DNA fork progression (kb/min) measured using the
IdU tracks of cells treated with Thap and transfected with H2A plasmids as described (Fig. 6 B).
Replicates to Fig. 6 D.
(L) Cells were transfected with plasmids and treated with BEPP for 2.5 h. Newly synthesized DNA
was labeled with CldU (25 μM, 30 min) followed by IdU (250 μM, 60 min) during the last 1.5 h in the
presence of BEPP then harvested for analysis.

MANUSCRIPT
77
(M) Images of DNA fibers (representative) of BEPP–treated cells overexpressing control, H2A
wildtype or H2A K118R-K119R mutant plasmids visualized as CldU (red) and IdU (green).
(N/O) DNA fork progression (kb/min) of cells treated as in (L) and displayed as box plots (5-95
percentile whiskers). IdU label was used to calculate fork progression. Two biological replicates of 3
shown.
(P/Q) Immunoblot analysis of cells confirming H2A overexpression (Flag) in cells treated with Thap (P)
or BEPP (Q). Functional (or wildtype) and mutant H2A expression was confirmed using ubiquitylation
status of H2A. HSC70 was used as loading control.
(R) Biological replicate of Fig. 6 E showing induction of H4K5ac upon H2A overexpression. HSC70
as loading control.
(S/T) Biological replicates of Fig. 6 H. Rate of DNA fork progression (kb/min) shown as box plots (5-
95 percentile whiskers). IdU track length was used to calculate fork progression of Thap−treated cells
overexpressing H4.
(U) Representative fiber images of control or H4−overexpressing cells treated with BEPP and
labeled for fiber assay as described in (L).
(V/W) Box plots (5-95 percentile whiskers) of IdU fork progression (kb/min) of cells described in (U).
(X/Y) Overexpression of H4 (tagged with GFP) in Thap (X) or BEPP (Y)−treated cells confirmed using
immunoblot analysis against GFP antibody. HSC70 used as loading control.
(Z/AA) Replicate experiments showing fork progression of cells overexpressing H2B and treated with
Thap as in Fig. 6 I. Box plots with 5-95 percentile whiskers of fork progression calculated using IdU
track length shown.
(AB) Fiber tracks of BEPP−treated cells with/without H2B overexpression. CldU is visualized in red
and IdU in green.
(AC/AD)Fork progression of cells treated with BEPP, and overexpressing H2B were calculated using
IdU tracks and plotted as box plots (5-95 percentile whiskers). Two replicates of 3 shown.
(AE/AF)Immunoblot analysis confirming H2B overexpression in Thap (AE) or BEPP (AF)−treated cells.

MANUSCRIPT
78
(AG) Immunofluorescence images of cells labeled with/without EdU (20 µM, 1 h) (top).
Representative images of DAPI signal of cells treated with MNase for 0 min vs 5 min (bottom). Scale
bar: 100 µm.
(AH) Biological replicate of experiment in Fig. 6 K to measure nucleosome occupancy in newly
replicated regions. Relative EdU intensity (nascent chromatin) or relative DAPI intensity (global
chromatin) plotted against MNase digestion time of Thap−treated cells overexpressing RNaseH1.

MANUSCRIPT
79

MANUSCRIPT
80

MANUSCRIPT
81
SUPP FIGURE 7: Inhibition of histone synthesis induces R-loops which impairs DNA replication.
Related to Fig. 7.
(A) S phase cells overexpressing control or RNaseH1 plasmids were treated with CHX (50 µg/ml)
for 1 h and then harvest for S9.6 immunofluorescence analysis as described. Representative images of
cells as visualized using DAPI (nuclei) or Alexa-Fluor 488 (S9.6) staining to detect R-loops. DAPI was
used to determine regions of interests within the nuclei for quantification as indicated by the white
outlines. Scale bar: 20 μm.
(B) Biological replicate of S9.6 immunofluorescence staining of CHX−treated cells quantified and
plotted as scatted plots. Red line represents mean S9.6 intensity per nucleus. Corresponding to Fig. 7
A.
(C) Western blot analysis confirming RNaseH1 overexpression in cells describe in Fig. 7 A and in
(B). Total H3 used as loading control.
(D/E) Biological replicate of the dot blot analysis in Fig. 7 B,C. S9.6 signal intensity in (D) was
quantified and normalized to the internal loading control (ssDNA), then to the EtOH control (without
RNaseH) and plotted as bar charts (E).
(F/G) Box plots with 5-95 percentile whiskers displaying the DNA fork progression of cells
treated/transfected as in Fig. 7 D. IdU track length was used to calculate the fork progression of
CHX−treated cells with RNaseH1 overexpression. Replicates to Fig. 7 H.
(H/I) Cells transfected with siRNA/plasmid as described in Fig. 7 E were harvested for DNA fiber
analysis upon labeling with CldU and IdU. DNA fork progression of the IdU label (kb/min) of the
additional 2 independent experiments corresponding to Fig. 7 I shown as box plots (5-95 percentile
whiskers).
(J) Immunoblot analysis of mCherry confirming overexpression of RNaseH1 in cells described in
Fig. 7 D.
(K) RNaseH1 overexpression and SLBP knockdown were confirmed with immunoblot analysis to
mCherry and SLBP respectively. HSC70 as loading control.

DISCUSSION
82
4 Discussion
In this study, we investigated the role of the integrated stress response (ISR) on DNA replication. We
observed that the short-term induction of the ISR leads to a drastic impairment of DNA replication. We
found that inhibition of DNA replication was due to both increased fork stalling and a lower rate of DNA
polymerisation. In addition, we showed that the ISR leads to the accumulation of R-loops, and this is
due to the lack of newly synthesised histones. Removing R-loops or introducing histones exogenously
to the cell restores DNA replication upon ISR. Overall, we propose a model where ISR blocks cap-
dependent translation and thus histone synthesis. The lack of histones favour a more open chromatin
and this leads to an increase in R-loop formation. R-loops inhibit DNA replication in the context of ISR
and this is a protective mechanism to help the cell conserve nutrients and energy during stress (Fig.
4.1). We discuss these observations in more detail in the following sub-sections.
Figure 4.1: ISR impairs DNA replication. ISR activation blocks histone synthesis through inducing eIF2alpha
phosphorylation and subsequently inhibiting cap-dependent translation. Consequently, insufficient histone supply leads to the
accumulation of R-loops which impedes DNA replication.

DISCUSSION
83
4.1 Interplay between the ISR and DNA replication
4.1.1 DNA replication is inhibited upon ISR stimulation
The ISR has mainly been studied for its pro-survival role in situations of stress (Pakos‐Zebrucka et al.,
2016). ISR is activated upon stress stimuli, leading to the inhibition of global protein synthesis and the
activation of a stress-associated transcriptional programme downstream of ATF4 (Kroemer, Mariño and
Levine, 2010). Blocking protein synthesis enables the cell to reduce the need for amino acids and
energy when conditions are not permitting. We proposed that the ISR should slow down DNA
replication for the same reason. However, despite extensive studies on the ISR, there has been very
little reported on its role in regulating DNA replication.
Approximately 2x3x109 deoxynucleoside-triphosphates (dNTPs) are required to fully replicate a diploid
human genome in a cell (Piovesan et al., 2019). Defects in DNA replication could lead to accumulating
mutations which can favour genomic instability in cells. It is not surprising that an energy-consuming
process such as DNA replication would need to be extensively regulated. Carbon and nitrogen
precursors for dNTP synthesis are usually provided by amino acids (Lane and Fan, 2015). Under
conditions of limited nutrients and energy, dNTP metabolism is impaired. Therefore, stalling DNA
replication and reducing the consumption of dNTPs could be of importance for survival.
We observed that the induction of ISR severely impaired DNA replication. This was not limited to single
replication forks but also affected total DNA synthesis in the cell (Manuscript Fig. 1 C−L, Supp. Fig. 1
B−L). The use of multiple ISR-inducing compounds in parallel, along with the reversal of the phenotype
with ISRIB strongly suggests the role of ISR in inhibiting DNA replication (Manuscript Fig. 2, Supp.
Fig. 2). Thapsigargin inhibits the calcium pump in the ER. This disrupts calcium homeostasis and
induces ER stress which activates PERK (Thastrup et al., 1989). L-Histidinol competitively binds to and
inhibits Histidine tRNA synthetase (Iiboshi et al., 1999). This results in an increase in uncharged
tRNAHis which then activates GCN2. BEPP-monohydrochloride was shown to induce eIF2alpha
phosphorylation in a PKR dependent manner (Hu et al., 2009). Sephin1 inhibits the GADD34 inducible
phosphatase involved in dephosphorylating eIF2alpha (Das et al., 2015). Hence, Sephin1 acts by
blocking dephosphorylation of naturally occurring phospho-eIF2alpha. As each ISR inducing agent
used has a different mode of activating the pathway, we ruled out non-specific effects of these
compounds.

DISCUSSION
84
Although the direct role of ISR on DNA replication has not been investigated, there have been some
reports with hints of ISR regulating DNA replication. In one such study, Shukla et al. used several
compounds such as thapsigargin, 2,5-di-tert-butylhydroquinone (DBHQ), ionomycin, cyclo-piozonic acid
and the Ca2+ ionophore A23187 to increase cytosolic Ca2+ in human vascular smooth muscle cells
(VSMC). Interestingly, they found that although all compounds tested raised cytosolic Ca2+, only
thapsigargin significantly suppressed cell proliferation and nucleoside analogue incorporation (Shukla
et al., 1997). This study clearly suggested the calcium homeostasis independent role of thapsigargin in
impairing replication in cells. Similarly, exposure to thapsigargin for two days inhibited proliferation of
human rheumatoid arthritis synovial cells (MH7A) (Wang et al., 2014). Another publication by Cabrera
et al. elaborated this further. They showed that thapsigargin inhibited DNA replication in the
osteosarcoma cell line U2OS by inducing ER stress and eIF2alpha phosphorylation (Cabrera et al.,
2017). The results from these studies complemented our observations. More importantly, our study
expanded this to a whole range of ISR inducing agents. It is worth pointing out that thapsigargin
negatively hampered replication in both transformed (U2OS) and non-transformed cells (VSMC and
MH7A) (Shukla et al., 1997; Wang et al., 2014; Cabrera et al., 2017). In the studies mentioned, a
significant reduction in replication was observed upon one hour of thapsigargin treatment in U2OS cells
vs the 48 hour treatment required in the non-transformed cell lines. Although speculative, it is possible
that tumour cells are more sensitive to ISR-mediated DNA replication inhibition. Tumour cells have a
higher replicative capacity and a higher demand for nutrients and energy for cell division. We
hypothesise that tumour cells, especially those growing in hypoxic, low-nutrient environments depend
on the reduced speed of DNA replication induced by ISR to survive. Indeed, a direct comparison of
ISR-mediated DNA replication block between transformed and non-transformed cell lines would be
more conclusive.
4.1.2 The ISR does not activate replicative stress signalling
Replicative stress describes defects in DNA replication that lead to the activation of kinases such as
ATR and ultimately the induction of the DNA damage response. Cancer cells have high intrinsic
replicative stress due to their elevated replicative potential (Dobbelstein and Sørensen, 2015). Recent
research on cancer therapeutics aims to utilise this aspect, using compounds that further accelerate
their replication (Ubhi and Brown, 2019). As a result, these cells may either acquire more mutations or
undergo premature mitosis and progress to cell death. A greater understanding on the pathways that
could lead to replicative stress would allow for more effective and specific targeting of cancer cells.

DISCUSSION
85
As described in Section 2.4.2, certain markers of replicative stress include an increase in phospho-
CHK1, γH2AX, and phospho-RPA, long stretches of ssDNA or increased origin firing (Cimprich and
Cortez, 2008; Iyer and Rhind, 2017). Interestingly, the impairment in DNA replication upon ISR was not
accompanied by an increase in γH2AX or phospho-CHK1. In contrast, treatment of the same cells with
gemcitabine, a typical replicative stress inducer significantly increases the expression of both those
marks (Manuscript Supp. Fig. 1 N) (Köpper et al., 2013). Is ISR-mediated attenuation of DNA
replication equivalent to replicative stress? Although the lack of these markers suggests otherwise,
long-term treatment of cells with ISR-inducing compounds negatively impacted cell proliferation
(Manuscript Fig. 4 F, Supp. Fig 4 L−M). Indeed, it would be worthwhile to study the other markers of
replicative stress such as phosphorylated RPA, ATR or measure origin firing following ISR. Hence,
based on our current knowledge, we cannot conclude if impairment of DNA replication upon ISR is
protective or destructive to the cell.
On a different note, although replicative stress signalling was not observed even after 4 hours of ISR
stimulation, studies have shown that replicative stress itself can activate the ISR (Palam et al., 2015;
Wang et al., 2018; Chen et al., 2019). Work by Palam et al. showed an increase in eIF2alpha
phosphorylation after 6 hours of treatment with gemcitabine. They found that the activation of ISR was
important for gemcitabine resistance of pancreatic cancer cells (Palam et al., 2015). The proposed
mechanism involved the upregulation of anti-apoptotic, pro-survival genes downstream of ATF4
accumulation. Moreover, ATF4-mediated induction of antioxidant enzymes in breast and gastric cancer
alleviates oxidative stress imposed by paclitaxel and cisplatin treatment respectively, resulting in better
survival of these cells (Wang et al., 2018; Chen et al., 2019). Therefore, although the ISR did not lead
to replicative stress and DNA damage within the time frame tested, replicative stress activates the ISR.
4.2 Crosstalk between DNA replication and protein translation
4.2.1 The processes of DNA and protein synthesis are co-regulated
It is of no surprise that protein synthesis would play a major role in regulating DNA replication. After all,
signalling pathways that promote cell proliferation (and DNA replication) such as the MAPK or
PI3K/AKT pathways also activate translation (described in Section 2.2.3). Such pathways favour the
G1/S transition of the cell cycle and promote origin firing by stimulating CDK activity through the
upregulation of cyclins (Proud, 2019). As a cell prepares to divide, it would have to grow to a sufficient
size and synthesise the necessary cellular components (Du and Stillman, 2002). Recently, it was
shown that as many as 1400 different proteins are synthesised as cells enter the S phase, where DNA

DISCUSSION
86
replication occurs (Chen, Smeekens and Wu, 2016). Molecular function clustering of these newly
synthesised proteins revealed an enrichment of proteins involved in DNA replication such as helicases,
topoisomerases and DNA polymerases (Chen, Smeekens and Wu, 2016). This is in agreement with
several independent studies showing an enhanced translation of CDC6, MCM3 and DNA polymerase
(delta) upon entry of cells into S phase (Zeng et al., 1994; Musahl et al., 1998; Petersen et al., 2000).
Furthermore, many studies have shown that blocking protein synthesis with cycloheximide is sufficient
to severely halt DNA replication (Gautschi and Kern, 1973; Mejlvang et al., 2014; Henriksson et al.,
2018). The tight regulation between these two processes has also been widely observed in different
organisms. Studies in archaea, yeast and bacteria showed that guanosine pentaphosphate (pppGpp)
or guanosine tetraphosphate (ppGpp) accumulate upon starvation (Wang, Sanders and Grossman,
2007; Srivatsan and Wang, 2008; Maciag et al., 2010; Denapoli, Tehranchi and Wang, 2013). These
small molecules signal the cell to stop both translation and DNA replication. For example, pppGpp or
ppGpp in Escherichia coli blocks DNA replication through reducing transcription of replication initiation
proteins (Wang, Sanders and Grossman, 2007). Moreover, certain genes associated with DNA
replication and translation are clustered together on the genome and this is conserved through
evolution (Berthon, Fujikane and Forterre, 2009). Berthon et al. discovered that some ribosomal
proteins can directly interact with MCM proteins. When translation is inhibited and there is a lack of
requirement for ribosomal proteins, these proteins sequester the MCM helicases from origins of
replication thus impairing DNA replication (Berthon, Fujikane and Forterre, 2009). Taken together,
these studies and observations further indicate a tight regulation between DNA replication and protein
translation.
4.2.2 DNA replication proteins have long half-lives
DNA replication is tightly regulated and involves many different proteins which can directly or indirectly
interact with the replication machinery. Interestingly, studies revealed that most of these DNA
replication proteins are relatively stable and have a half-life of at least 4 hours (Gautschi and Kern,
1973; Chen, Smeekens and Wu, 2016). Few reports have shown stable levels of proliferating cell
nuclear antigen (PCNA), MCM helicases and DNA polymerases (δ and ε) for up to 3 hours after
cycloheximide treatment (Roseaulin et al., 2013; Henriksson et al., 2018). Therefore, it was puzzling
that blocking protein synthesis for 20 minutes was able to profoundly halt DNA replication (Gautschi
and Kern, 1973; Henriksson et al., 2018). It is unlikely that the induction of ISR (and inhibition of protein
synthesis) in one hour could lead to the sufficient depletion of these replication proteins to negatively
impact DNA replication. On the other hand, it may be worth noting that the continuous syntheses of

DISCUSSION
87
proteins that do not form the replisome or origin licencing complex are still required for proper DNA
replication. Rather, inhibition of protein synthesis could hamper DNA replication because duplication of
DNA and chromatin are tightly coupled (MacAlpine and Almouzni, 2013). As DNA replicates to form two
daughter strands, these strands are wrapped in histones to reform chromatin. Although histone
recycling occurs, formation of a new DNA duplex urges the need for newly synthesised histones.
4.3 Histones: a limiting factor in DNA replication
4.3.1 Continuous histone synthesis ensures proper DNA replication
Although dNTPs make up the DNA, DNA is wrapped around histones to form chromatin. As DNA
content in a cell doubles during replication, the amount of histones available should also double for
proper chromatin formation (MacAlpine and Almouzni, 2013). Because histones are not actively
required during DNA replication, they are not usually immediately considered a limiting factor for DNA
replication. Nevertheless, many recent works have shown that depletion of histones negatively impacts
DNA replication (Groth, Corpet, et al., 2007; Koseoglu, Dong and Marzluff, 2010; MacAlpine and
Almouzni, 2013; Klimovskaia et al., 2014; Alabert, Jasencakova and Groth, 2017; Henriksson et al.,
2018).
First, replication-dependent histone transcription is highly regulated according to the cell cycle status.
Expression of these histone genes is elevated during S phase (Schümperli, 1988). The presence of
more than one copy of these genes clustered in transcriptionally active regions suggests a need for the
highly proficient expression of histones when cells replicate their DNA. Histone RNAs are intron-less
(Marzluff, 2005; Gagliardi and Dziembowski, 2018). Moreover, histone RNAs do not require poly-
adenylation, suggesting their large-scale and rapid production during replication (Mei et al., 2017). This
could be an evolutionary conserved mechanism to increase the efficiency of histone mRNA translation
during DNA replication. Taken together, we hypothesise that histone RNAs are processed in a slightly
different manner to non-histone RNAs. It is not difficult to speculate that a niche set of RNA processing
factors could also further increase translation efficiency, as histone RNAs would not have to compete
with other RNAs for such factors.
4.3.2 ISR depletes cells of histones
Since most proteins that associate with the DNA replication complex are relatively stable (Section
4.2.2), we hypothesised that ISR-mediated block of protein synthesis after one hour affects DNA

DISCUSSION
88
synthesis by attenuating histone production in the cell. To date, cap-dependent translation regulation
has not been directly affiliated with histone translation. Replication-dependent histone mRNAs are
regulated differently to other mRNAs (Marzluff, Wagner and Duronio, 2008). mRNAs of replication-
dependent histones are the only non-polyadenylated mRNAs in a cell. Instead, histone mRNAs contain
a conserved stem-loop bound by the stem-loop binding protein (SLBP) (MacAlpine and Almouzni,
2013). SLBP has similar functions to the poly-A binding protein (PABP) required for poly-A binding of
other cellular mRNAs. Removal of SLBP impaired translation of histone mRNAs but also enhanced
degradation of these mRNAs (Kaygun and Marzluff, 2005; Meaux, Holmquist and Marzluff, 2018).
PABP mediates circularisation of mRNAs through direct interaction with eIF4G at the 5’ cap. On the
other hand, direct interaction between SLBP and the eIF4F complex requires SLBP-interacting protein
1 (SLIP1) (Cakmakci et al., 2008; Marzluff, Wagner and Duronio, 2008). Studies have speculated that
translation of histone mRNAs requires proper circularisation of the mRNA in a way similar to cap-
dependent translation of poly-adenylated mRNAs (Marzluff, 2005; Marzluff, Wagner and Duronio, 2008;
Mei et al., 2017). Although speculative, this would suggest that histone mRNA translation occurs in a
cap-dependent manner. It is interesting to note that although depletion of SLBP led to a marked
reduction in histone levels, SLIP1 knock down which would impede circularisation and interaction with
the 5’cap only moderately reduces histone levels in the cell (Cakmakci et al., 2008). This observation
would argue against circularisation-dependent translational control of histone mRNAs.
However, our results suggest that translation of histone mRNAs requires the cap-dependent
translational complex. Upon ISR stimulation, newly synthesised histones are diminished (Manuscript
Fig. 6 A, Supp. Fig. 6 E). Newly synthesised histones are marked with acetylation at several residues.
Few examples include acetylation at lysine 5 or lysine 12 on histone 4 (H4K5ac or H4K12ac) or lysine
56 on histone 3 (H3K56ac) (MacAlpine and Almouzni, 2013; Mejlvang et al., 2014). Once incorporated,
these acetylation marks are removed within 30 minutes by histone deacetylases (HDACs) (Jackson et
al., 1976; Smith et al., 2008). Therefore, soluble levels of H4K5/K12ac or H3K56ac are good indicators
for measuring the synthesis of new histones. Histone chaperones such as anti-silencing function
protein 1 (ASF1) and chromatin assembly factor 1 (CAF1) play a major role in bringing newly
synthesised histones to the newly replicated DNA (Groth, Corpet, et al., 2007; Klimovskaia et al., 2014).
As histone chaperones interact with histones through these acetylation marks, it is possible that
recycled parental histones are also acetylated during transcription or DNA replication. Hence,
measurement of soluble H4K5/K12ac or H3K56ac may not be the most accurate readout of newly
synthesised histones. Recycled histones would not exist in the cytoplasm whereas newly synthesised
histones are translated in the cytoplasm. Fractionating the cell prior to soluble protein extraction could

DISCUSSION
89
eliminate this problem. In addition, newly synthesised histones can also be distinguished through the
use of radioactively-labelled 35S-Methionine. Of note, although we have yet to test this, it is also
possible that ISR indirectly affects histone mRNA translation through the depletion of SLBP or SLIP1.
ISR-induced depletion of histone pools could lead to decreased occupancy of histones on the DNA.
This would lead to large amounts of naked DNA in the cell and can be demonstrated by an increase in
micrococcal nuclease (MNase) sensitivity of newly replicated chromatin with ISR stimulation
(Manuscript Fig. 6 J,K, Supp. Fig. 6 AH). Importantly, MNases mainly target naked DNA and can
therefore be used as a good reflection of chromatin ‘openness’ (Luo et al., 2018; Pajoro et al., 2018;
Ramani, Qiu and Shendure, 2019). Similar observations were made by Mejlvang et al. by directly
depleting histones, further suggesting that the ISR leads to impaired histone synthesis (Mejlvang et al.,
2014).
4.3.3 Histone overexpression restores DNA replication upon ISR
Since ISR depletes cells of histones, we hypothesised that ISR impairs DNA replication through
attenuating histone synthesis. Indeed, DNA replication in the context of ISR was restored upon single
overexpression of H2A, H2B or H4 (Manuscript Fig. 6 C,D,F−I, Supp. Fig. 6 J−Q, S−AF). However, if
ISR blocks overall histone synthesis, it was surprising that overexpression of either one of the core
histones was able to rescue DNA replication inhibition by ISR.
It is important to note that histone levels are tightly regulated in a cell. This not only ensures sufficient
histone synthesis during DNA replication, but prevents accumulation of excess histones that could be
toxic. Studies have shown that an enrichment of a single core histone is cytotoxic (Singh et al., 2010;
Liang et al., 2012). A nucleosome is made of (H3/H4)2 and (H2A/H2B)2 hetero-dimers. To prevent an
excess of any one histone, all core histones are regulated similarly. On top of that, the expression of
each is tightly adjusted to the others (Marzluff, Wagner and Duronio, 2008). Taken together, it is
unlikely that the ISR would only inhibit the translation of a subset of histone mRNAs.
Interestingly we did not observe any obvious toxicity in control cells after 24 hours of histone
overexpression. The histone expression plasmids used in our study are under the control of a
constitutively active promoter. Expression of histones under such promoters has been shown to be
lower compared to replication-dependent histone expression during S phase (Das and Tyler, 2012).
Lack of cytotoxicity seen in our hands could reflect this. Furthermore, we observed an increase in newly
synthesised H4 (marked by H4K5ac) in the cell upon H2A overexpression (Manuscript Fig. 6 E. Supp.

DISCUSSION
90
Fig. 6 R). These observations indicate that overexpression of a single histone could enhance the
expression of other histones in a cell, possibly to avoid excess of this single histone. We hypothesise a
regulatory mechanism where a short-term and ‘low-level’ histone overexpression could enhance
expression of other histones in the cell. In this way, cells react to transient increase in histone
expression to avoid cytotoxicity.
We showed that the DNA damage response was not activated following ISR-mediated DNA replication
impairment (Manuscript Supp. Fig. 1 N). Importantly, DNA replication block upon histone depletion did
not activate the ATR/ATM checkpoints or lead to any detectable DNA damage (Mejlvang et al., 2014;
Henriksson et al., 2018). Inhibiting protein synthesis for up to 7 hours also did not induce γH2AX
(Bertoli et al., 2016). Activation of the DNA damage response pathways requires the accumulation of
RPA due to increased stretches of ssDNA (Dobbelstein and Sørensen, 2015). When the helicase
continues to unwind the dsDNA helix ahead whilst the DNA polymerase stops moving forward (or
stalls), this is identified as helicase-polymerase uncoupling (Henriksson et al., 2018). Interestingly,
histone depletion was shown to not lead to helicase-polymerase uncoupling (Henriksson et al., 2018).
This could be explained by direct interaction of histones with the MCM helicases (Groth, Corpet, et al.,
2007; Klimovskaia et al., 2014). Therefore, the lack of histones keeps the MCM helicase from
continuously unwinding the dsDNA. These observations further corroborate with our results suggesting
the role of histones in blocking DNA replication upon ISR stimulation.
4.4 R-loops accumulate with the ISR
4.4.1 The ISR blocks DNA replication through R-loops independent of ATF4
DNA:RNA hybrids (or R-loops) are transcriptional by-products (Aguilera and García-Muse, 2012). As
the ISR also leads to the induction of the ATF4 transcription factor, we hypothesised that this could lead
to an accumulation of R-loops. Moreover, we predict that inhibition of cap-dependent protein synthesis
could lead to an enrichment of transcripts that cannot be properly translated. These situations could
enhance R-loop formation.
We observed an accumulation of R-loops with ISR induction using the S9.6 antibody that specifically
recognises these structures (Manuscript Fig. 3, Supp. Fig. 3) (Britton et al., 2014). R-loops are
removed by DNA:RNA helicases or nucleases. Specifically, RNaseH are the enzymes involved in
digesting the RNA portion of R-loops. Hence, we confirmed our S9.6 signal by overexpressing
RNaseH1 in the immunofluorescence (IF) experiments or via RNaseH treatment in the dot blot

DISCUSSION
91
experiments. Indeed, RNaseH1 overexpression or RNaseH treatment significantly removed the S9.6
signal observed (Manuscript Fig. 3, Supp. Fig. 3). Importantly, we observed that RNaseH1
overexpression also restored DNA replication downstream of ISR (Manuscript Fig. 4 A−E, Supp. Fig.
4 A−K). This clearly indicates that R-loops are responsible for blocking DNA replication upon ISR
stimulation. Further analysis of DNA replication showed increased fork stalling with ISR (Manuscript
Fig. 1 O). The inherent structure of R-loops make these hybrids more stable than DNA duplexes
(Allison and Wang, 2019). Thus, R-loops pose a direct steric hindrance to the MCM helicases and the
replication machinery, and can stall the replisome. Chromatin compaction surrounding the R-loops has
also been observed, and this could also give rise to problems for the replication machinery (Castellano-
Pozo et al., 2013). Studies have shown that R-loop accumulation is accompanied by phosphorylation of
Histone 3 at Ser 10 (H3S10) and this also marks a tightly compact chromatin (Castellano-Pozo et al.,
2013). In addition, torsional stress induced by R-loops could directly interfere with DNA replication
(Aguilera and García-Muse, 2012).
Enhanced transcription could promote R-loop formation (Aguilera and García-Muse, 2012). This is
mainly through an accumulation of RNA molecules which increases the probability of hybridisation to
their DNA template. The activity of RNA polymerase II (RNAP II) is controlled through phosphorylation
of its C-terminal domain (Hahn, 2004). CDK7 and CDK9 are the main kinases involved in regulating
RNAP II activity (Fisher, 2005; Bacon and D’Orso, 2019). Thus, inhibition of CDK9 is considered a well-
established mechanism to inhibit transcription (Morales and Giordano, 2016). We hypothesise that
CDK9 inhibition could supress R-loop formation. Indeed, CDK9 inhibition was able to significantly
restore DNA replication in the context of ISR (Manuscript Fig. 5, Supp. Fig. 5). Although confirming
the decrease in R-loops with CDK9 inhibition in our system would be interesting, our results further
verifies the role of R-loops in impeding DNA replication downstream of the ISR.
We observed an increase in ATF4 levels within one hour of ISR stimulation on western blots
(Manuscript Fig. 1 B, Supp. Fig. 1 A). However, we find it unlikely that ATF4 is able to activate genes
required to modulate DNA replication within that timeframe. Moreover, gene expression changes upon
ATF4 induction have mainly been studied in cells after at least 6 hours post ATF4 accumulation (Han et
al., 2013; Fusakio et al., 2016; Quirós et al., 2017). As discussed previously, transcription favours R-
loop formation and this can block DNA replication. This led us to propose that inhibition of DNA
replication by ISR is independent of the transcriptional targets of ATF4. Rather, the increase in
transcriptional rate upon enrichment of ATF4 could induce R-loops and block DNA replication. If true,
ATF4 depletion following ISR activation should restore DNA replication progression. Interestingly, we
found ATF4 to be dispensable in blocking DNA replication upon ISR. Knockdown of ATF4 did not

DISCUSSION
92
rescue the suppression of DNA replication by ISR (Appendix Fig. 1). Moreover, ATF4 overexpression
was unable to phenocopy ISR inducers in impairing DNA replication (Appendix Fig. 2). Therefore,
ATF4 is dispensable for attenuating DNA replication downstream of ISR.
It is important to note that the ISR can also upregulate other transcription factors. Thapsigargin induces
ER stress and this activates PERK. At the same time, ER stress (through the unfolded protein
response) can also lead to the activation of other transcription factors such as ATF6 and XBP1
(Schröder and Kaufman, 2005). Moreover, a study in 1999 showed that approximately 200 cellular
mRNAs remain translated despite the inactivation of cap-dependent translation (Johannes et al., 1999).
Among these proteins, transcription factors such as ATF3 and c-myc were significantly upregulated
(Johannes et al., 1999). Upregulation of these transcription factors could equally play a role in impeding
DNA replication through R-loop accumulation following ISR. Interestingly, RNAP II translation was also
enhanced upon inhibition of cap-dependent translation (Johannes et al., 1999). Indeed, it would be
interesting to confirm if ISR leads to an enhanced transcriptional activity and thus more R-loops.
4.4.2 R-loops are enriched upon histone depletion
We have shown that ISR blocks histone synthesis which led to an impairment of DNA replication. In
addition, activation of ISR also enhanced the sensitivity of nascent DNA to MNase digestion,
suggesting a more ‘open’ chromatin. Disruption in chromatin compaction can also favour R-loop
formation (Aguilera and Gómez-González, 2017; García-Pichardo et al., 2017). R-loops have been
studied with respect to histone modifications and chromatin compaction (Castellano-Pozo et al., 2013;
Bayona-Feliu et al., 2017). However, the level of histones has not been directly correlated to R-loops.
Therefore, we asked if histone depletion, which leaves large amount of naked DNA, leads to the
accumulation of R-loops. Indeed, we found an enrichment of R-loops in cells treated with
cycloheximide, which has been used as a quick way to deplete cells of histones (Manuscript Fig. 7
A−C, Supp. Fig. 7 A−E) (Groth, Corpet, et al., 2007; Henriksson et al., 2018). Furthermore, impairment
of DNA replication by histone depletion was also restored upon removal of R-loops through RNaseH1
overexpression (Manuscript Fig. 7 D−I, Supp. Fig. 7 F−K). Despite extensive research with multiple
hypotheses proposed, the mechanism of how histone levels can regulate DNA replication remains to be
fully clarified (Liu and Gong, 2011; Mejlvang et al., 2014). Our results expand on this by showing that
histone depletion favours R-loop formation which stalls DNA replication.
It is important to note that new histones are of utmost importance at newly replicated DNA. Therefore,
when protein synthesis is inhibited, regions of newly replicated DNA are likely the most affected and

DISCUSSION
93
devoid of histones. Hence, these areas would be most susceptible to R-loop formation. Our hypothesis
suggests that ISR depletes cells of histones and this leads to more R-loops which impairs DNA
replication. If R-loops are primarily formed at sites depleted of histones (newly replicated regions), how
do these R-loops affect replication of the DNA ahead? We propose a few possible explanations. First,
R-loops could lead to the compaction of the chromatin in regions in front of and behind the R-loops. In
this way, R-loops formed at newly replicated regions can inhibit the replication machinery ahead
through increasing the torsional stress of the chromatin in front (Aguilera and García-Muse, 2012; Al-
Hadid and Yang, 2016). Next, R-loop accumulation could potentially activate signalling pathways that
modulate DNA replication. Indeed, R-loops have been shown to non-canonically activate ATM
(Marteijn, Vermeulen and Tresini, 2017; Marabitti et al., 2019). Moreover, R-loops can also activate the
Fanconi Anaemia (FA) pathway (García-Rubio et al., 2015; Schwab et al., 2015). Although the direct
interplay between the activation of these pathways and a slower DNA replication progression has not
been observed, it is possible that activation of the DNA repair signalling itself could suppress DNA
replication. In fact, this would make sense as slowing down DNA replication provides the cell some time
to repair their DNA.
Both transcription and DNA replication require the DNA to be stripped off histones to provide a single
strand DNA template for the RNA polymerases and DNA polymerases respectively. Both these
processes rely on histone chaperones to recycle these existing histones. Usually, recycling of histones
during transcription and replication is kept separate with specific histone chaperones required for each
process. Facilitates chromatin transcription (FACT) is a histone chaperone specific for transcription-
induced histone recycling (Belotserkovskaya et al., 2003; Hsieh et al., 2013). On the other hand, the
ASF1-HIR histone chaperone is involved in recycling parental histones during DNA replication (Groth,
Corpet, et al., 2007; Das and Tyler, 2012). However, functional interchange between the histone
chaperones has been observed. Cells with non-functional FACT are able to hijack the ASF1-HIR
chaperones to recycle histones during transcription (Jeronimo, Poitras and Robert, 2019). When
histones are limiting during DNA replication, the cell could possibly try to use histones removed during
transcription and incorporate them into the newly replicated DNA (Fig. 4.2). In such cases, R-loops
could occur in regions that have not been replicated ahead of the replication machinery.

DISCUSSION
94
Figure 4.2: Hypothetical model depicting the role of histone recycling on R-loop formation. (Top) Under normal
conditions, specific histone chaperones recycle histones that are removed upon transcription and DNA replication respectively.
Normal histone synthesis enables the newly replicated DNA to be properly wrapped around histones to form chromatin.
Transcription-induced histone recycling occurs normally and R-loop formation is prevented. (Bottom) When ISR is activated
and newly synthesised histones depleted, some of the histones removed during transcription could be used to decorate the
newly synthesised DNA. This non-efficient recycling of histones downstream of transcription could facilitate R-loop formation
which could then block the upcoming DNA replication machinery.
4.4.3 R-loops formed upon ISR are not threats to genomic stability
Studies on R-loops have suggested their role in causing genomic instability (Allison and Wang, 2019;
Crossley, Bocek and Cimprich, 2019). This can be attributed to several factors. First, the displacement
of the single strand non-template DNA is now more prone to mutations and external damaging agents.
Indeed, R-loops have been shown to be more sensitive to activation-induced cytidine deaminase (AID),

DISCUSSION
95
an enzyme that catalyses the deamination of cytosine into uracil (Skourti-Stathaki and Proudfoot,
2014). Moreover, the highly stable structure of these DNA:RNA hybrids stalls DNA replication, which
could result in the detachment of the replisome from the DNA (Sollier and Cimprich, 2016; Aguilera and
Gómez-González, 2017; Allison and Wang, 2019). This could lead to breaks in the DNA. DNA
replication and transcription both require DNA as their template and can occur simultaneously in a cell.
These processes are highly regulated to prevent collisions with each other (Hamperl and Cimprich,
2016). R-loops could also stall transcription or DNA replication which can lead to collisions between the
DNA replication and transcription machineries, forming breaks in the DNA (Brambati et al., 2015; Lang
et al., 2017).
Importantly, although R-loops accumulate upon ISR, this was not accompanied by DNA damage (at
least not as far as detectable γH2AX induction). Similarly, our proliferation assay indicates that removal
of R-loops in the context of ISR is more detrimental to the cell (Manuscript Fig. 4 F, Supp. Fig 4 L,M).
These results suggest that R-loops play a protective role in the context of the ISR. Indeed, physiological
roles of R-loops have been extensively discussed (Aguilera and García-Muse, 2012). R-loops are
important in antibody class switching in B cells and also play a major role in regulating transcription and
expression of genes (Pavri, 2017; Crossley, Bocek and Cimprich, 2019). R-loops have also been
discussed for their role in protecting the genome, mainly through regulating DNA repair (Sollier and
Cimprich, 2015, 2016). Therefore, R-loops themselves may not necessarily be a threat to genomic
integrity, but rather the persistence of these structures that could pose problems to a cell. We
hypothesise that a short-term accumulation of R-loops is not a threat to genomic stability. In fact, the
ISR relies on such R-loops to slow down DNA replication during conditions of stress.
4.5 Therapeutic potential of ISR in cancer
4.5.1 Activating the ISR to block DNA replication and proliferation in cancer
The ISR is mainly recognised as a pro-tumourigenic pathway. However, our results have shown that
ISR induction significantly impairs DNA replication (Manuscript Fig. 1, Supp. Fig. 1). Although this
was not immediately accompanied by the activation of the DNA damage cascade, we have seen that
long-term activation of ISR in cancer cells negatively affected proliferation and viability of these cells
(Manuscript Fig. 4 F, Supp. Fig. 4 L,M). The impairment in proliferation was also observed by several
independent studies using thapsigargin (Shukla et al., 1997; Wang et al., 2014). A sustained ISR
signalling has been shown to upregulate pro-apoptotic proteins such as CHOP. Moreover, γH2AX was
found to accumulate after long-term inhibition of histone synthesis (Henriksson et al., 2018). Indeed, we

DISCUSSION
96
showed a downregulation of histone synthesis upon ISR (Manuscript Fig. 6 A, Supp. Fig. 6 E). Taken
together, compounds that stimulate the ISR could be a good option to target cancer. On one hand, our
results showed that ISR activation impairs DNA replication. On the other hand, pro-apoptotic genes can
be induced by the ISR (Pakos‐Zebrucka et al., 2016).
In this study, we used a variety of ISR inducers to activate the pathway. One such compound is
thapsigargin, which blocks the ATP-dependent calcium pump on the ER (Thastrup et al., 1989).
Thapsigargin does not only lead to ER stress and activation of the ISR. Disruption in calcium
homeostasis in the cell can also activate a multitude of signalling pathways which could lead to cell
death, making thapsigargin a potent and toxic compound to most cells (Shukla et al., 1997; Son et al.,
2014; Wang et al., 2014). Recently, a prodrug version of thapsigargin named mipsagargin has been
developed (Andersen et al., 2015). Mipsagargin retained the potency of thapsigargin with fewer side
effects. Once administered, the inactive mipsagargin is cleaved and activated by prostate specific
membrane antigen (PSMA) (Mahalingam et al., 2016). As PSMA is often overexpressed in solid
tumours, mipsagargin might act on tumour cells with greater specificity (Liu et al., 1997; Chang et al.,
1999; Haffner et al., 2009; Samplaski et al., 2011; Mahalingam et al., 2016). Mipsagargin has been
evaluated under Phase II clinical trials for treatment of prostate cancer, renal cell carcinoma,
glioblastoma and hepatocellular carcinoma (Andersen et al., 2015; Doan et al., 2015; Mahalingam et
al., 2016, 2019).
A different approach to activate the ISR could be through interfering with protein folding (Marcu et al.,
2002; Gallerne, Prola and Lemaire, 2013). Heat shock protein 90 (HSP90) are a class of chaperone
proteins required for maintaining proper protein folding. Cancer cells usually have elevated expression
of HSP90 (Neckers et al., 2018). This is of no surprise considering as many as 400 of the HSP90
clients have roles in maintaining cancer cell signalling (Jaeger and Whitesell, 2019). Hence, a lot of
work has gone into the development and clinical testing of HSP90 inhibitors such as ganestespib or
tanespimycin (17-AAG) (Butler et al., 2015). Using HSP90 inhibitors to target cancer may not only be
useful with respect to the downregulation of important cancer driving proteins that require the HSP90
chaperone system. Our results suggest that HSP90 inhibition may also block DNA synthesis and
possibly induce apoptosis in cancer cells through activating the ISR. Interestingly, HSP90 inhibition has
not only been implicated with respect to PERK activation (through inducing ER stress) (Davenport et
al., 2007). HSP90 was also found to associate with PKR and this interaction inhibits PKR. Inhibiting
HSP90 using geldanamycin resulted in the dissociation of HSP90 from PKR and subsequent activation

DISCUSSION
97
of PKR (Donzé, Abbas-Terki and Picard, 2001). Taken together, HSP90 inhibition may be a promising
strategy to stimulate ISR via the activation of more than one ISR kinase.
Recent studies have discovered a compound ONC201 (or TIC10) with anti-cancer properties (Allen et
al., 2016). ONC201 was first identified as being able to induce expression of TNF-related apoptosis-
inducing ligand (TRAIL) and death receptor 5 (DR5), independent of p53 (Allen et al., 2015). Thus,
ONC201 appears to be a promising compound to target cancer cells irrespective of their p53 status.
Subsequent investigation has found ONC201 to severely inhibit cancer cell proliferation through the
downregulation of cyclin D1 following impairment of protein synthesis (Kline et al., 2016). Importantly,
this occurs downstream of PKR or HRI-mediated eIF2alpha phosphorylation (Kline et al., 2016).
Although the exact mechanism of ONC201-induced activation of HRI and PKR is currently unknown,
the role of ISR in mediating these responses can be appreciated. Moreover, ATF4-induced expression
of pro-apoptotic genes was found to be responsible for ONC201-mediated cell death (Allen et al., 2016;
Ishizawa et al., 2016). ONC201 is currently under investigation for multiple solid tumour malignancies
and has shown preliminary signs of efficacy in glioblastomas (Ralff et al., 2017; Stein et al., 2019).
In contrast, ISR can also be activated through the inhibition of the phosphatases responsible for
dephosphorylating eIF2alpha. Salubrinal and guanabez (or its derivative, Sephin1) are compounds that
inhibit eIF2alpha dephosphorylation. Salubrinal has been used in pre-clinical models of Huntington’s
and Alzheimer’s diseases (Reijonen et al., 2008; Lee et al., 2010). Importantly, guanabez is an US
Food and Drug Administration (FDA)-approved drug for the treatment of hypertension (Tsaytler et al.,
2011). In this study, we used its derivative, Sephin1 and showed that cells treated with Sephin1 had
impaired DNA replication (Manuscript Fig. 1 L, Supp. Fig. 1 G,H). Although we did not directly test the
impact of Sephin1 on cell proliferation, we observed an inhibition in cell proliferation upon ISR activation
with other inducers (Manuscript Fig. 4 F, Supp. Fig. 4 L,M). The fact that guanabez is already FDA-
approved makes it a strong candidate for clinical testing in diseases apart from hypertension. Our work
suggests that guanabez, through activating the ISR could potentially be used as an anti-cancer
compound via inhibiting both DNA replication and cell proliferation.
4.5.2 Inhibiting the ISR to suppress tumourigenesis
Inhibiting the ISR would also be a feasible approach to target cancers that rely on the pro-survival
effects of this pathway. Although long-term ISR activation has been shown to induce apoptosis, cancer
cells can overexpress anti-apoptotic proteins to counter this. In such situations, the ISR allows for the
uncontrolled growth of cancer cells in conditions of stress. More importantly, ISR activation has been

DISCUSSION
98
implicated in mediating chemoresistance in a multitude of malignancies (Palam et al., 2015; Wang et
al., 2018; Chen et al., 2019). Our results would suggest that blocking ISR could enhance DNA
replication progression in the presence of stress stimuli. Cell proliferation assays upon RNaseH1
overexpression and ISR induction suggest that continuous DNA replication during stress is a threat to
cell survival (Manuscript Fig. 4 F, Supp. Fig. 4 L,M). We propose that ISR inhibitors could specifically
target tumours not just through blocking the expression of pro-survival genes downstream of ATF4.
Inhibiting ISR could also enhance replicative stress in these cells, which could lead to an accumulation
of mutations and genomic instability. These observations suggest the potential of using ISR inhibitors in
treating cancer. Indeed, this would first require us to correctly stratify patients with tumours that are
reliant on the ISR, either through eIF2alpha phosphorylation status or through the expression levels of
the eIF2alpha kinases.
Stimulation of ISR relies mainly on the phosphorylation of eIF2alpha. Phospho-eIF2alpha is not only
required to block cap-dependent protein synthesis, but this is also essential for the enhanced
translation of ATF4. Therefore, inhibiting eIF2alpha phosphorylation is an obvious approach to inhibiting
the ISR. Phosphorylation of eIF2alpha is mediated by four different kinases with homologous C-
terminal kinase domains (Donnelly et al., 2013). Due to the deep, active sites on kinase proteins,
targeting kinases using small molecules inhibitors are highly favourable. Indeed, kinases are the
second most targeted class of proteins in cancer drug development (Bhullar et al., 2018). GSK2606414
and GSK2656157 are PERK inhibitors, which inhibit the autophosphorylation and activation of PERK
(Axten et al., 2012, 2013). GSK2656157 has been shown to exhibit antitumour and antiangiogenic
properties in human tumour mice xenografts (Atkins et al., 2013). Moreover, treatment of leukemic cell
lines with GSK2606414 compromised viability of these cells (Mahameed et al., 2019). Importantly,
PERK inhibitors can be administered orally and can penetrate the blood-brain barrier making these
compounds even more attractive for clinical use in the future (Ma and Klann, 2014).
Nevertheless, highly conserved active sites (ATP binding pockets) on kinases could also result in a lack
of specificity of these small molecule inhibitors, leading to possible off-target effects (Berndt, Karim and
Schönbrunn, 2017). Studies have demonstrated off-target effects of GSK2606414 and GSK2656157 in
inhibiting receptor-interacting serine/threonine-protein kinase 1 (RIPK1) with comparable IC50 to a
RIPK1 inhibitor (Rojas-Rivera et al., 2017). RIPK1 is involved in inducing apoptosis following tumour
necrosis factor (TNF) stimuli (Degterev, Ofengeim and Yuan, 2019). Hence, PERK inhibitors may also
promote resistance to TNF-induced apoptosis in cancer cells. This further illustrates the importance of
extensive pre-clinical investigations on small molecule inhibitors to avoid undesirable side effects.
DISCUSSION
99
The ISR can also be inhibited downstream of eIF2alpha phosphorylation. A small molecule integrated
stress response inhibitor (ISRIB) was found to impair ISR signalling irrespective of the eIF2alpha
phosphorylation status (Sidrauski et al., 2013). Phospho-eIF2alpha inhibits the eIF2B guanine
nucleotide exchange factor. eIF2B is necessary for the formation of eIF2-GTP and translation initiation.
ISRIB binds to eIF2B and enhances its catalytic function by favouring the formation of the large hetero-
decameric complex (Sidrauski et al., 2015; Zyryanova et al., 2018). Hence, ISRIB attenuates the ISR
independent of eIF2alpha phosphorylation. ISRIB was found to be a specific and well-tolerated
compound (Chou et al., 2017). Indeed, studies have found that inhibition of ISR using ISRIB was much
better tolerated compared to a PERK inhibitor (Palam et al., 2015). Although potent in impeding growth
of pancreatic cancer in mouse models, PERK inhibitor also led to the degeneration of normal
pancreatic tissue whereas ISRIB did not (Palam et al., 2015). ISRIB has been mainly investigated for
treatment of neurodegenerative diseases by restoring protein synthesis in brain tissue (Chou et al.,
2017; Halliday et al., 2017). A recent study using patient-derived xenografts (PDXs) found ISRIB to
promote cytotoxicity in metastatic and castration resistant prostate cancer (Nguyen et al., 2018).
Furthermore, ISRIB was also shown to attenuate expression of genes involved in stemness thereby
preventing resistance to therapy in breast cancer cells (Jewer et al., 2019).
4.5.3 Modulating the ISR in combination with other therapies
Previous sections discussed the therapeutic potential of both ISR activators and inhibitors as single
treatment in cancer. Here, we highlight the pros and cons of combining ISR modulators with other
therapies for the treatment of cancer.
The role of ISR in mediating chemoresistance to drugs like gemcitabine or paclitaxel have been studied
(Palam et al., 2015; Wang et al., 2018; Chen et al., 2019). Mostly, chemoresistance by ISR relies on
the transcriptional expression of pro-survival genes. We showed that ISR impairs DNA replication
(Manuscript Fig. 1, Supp. Fig. 1). It is possible that ISR activation, through slowing down DNA
replication progression helps cells survive drugs targeting the DNA replication machinery. With these
considerations in mind, combining ISR inhibitors with chemotherapeutics should be a promising
approach in enhancing replicative stress in cancer. Indeed, PERK inhibitors and ISRIB were found to
sensitise both breast and pancreatic cancer cells to chemotherapy that interferes with DNA replication
(Palam et al., 2015; Alasiri et al., 2019).
HSP90 inhibitors are widely accepted as a strategy to target cancer cells due to their high dependency
on HSP90 clients for tumourigenesis (Neckers, 2007). Thus, HSP90 inhibitors in combination with
DISCUSSION
100
chemotherapeutics have been under extensive evaluation to better target cancer cells (Neckers, 2002;
Kryeziu et al., 2019). We have previously discussed the role of HSP90 inhibitors as possible ISR
inducers (Section 4.5.1). Based on our results, we hypothesise that HSP90 inhibitors could also slow
down DNA replication. Although speculative, HSP90 inhibitors could possibly protect cells from the
DNA damaging activity of chemotherapeutics. Co-treatment of cells with an ISR inhibitor could help
prevent this and restore cooperation between HSP90 inhibitors and chemotherapeutics.
In contrast, a study combining cycloheximide with a replicative stress inducer, hydroxyurea (HU)
showed that blocking protein synthesis exacerbates the DNA damage response triggered by HU alone
(Bertoli et al., 2016). They proposed a need for continuous protein synthesis to sustain the DNA
damage response (DDR). Degradation of DNA damage signalling proteins such as CHK1 was greater
upon replicative stress (Bertoli et al., 2016). Hence, lack of CHK1 upon protein synthesis inhibition may
act in a similar manner to CHK1 inhibition, which could promote replicative stress in cells leading to
accumulation of γH2AX (Syljuasen et al., 2005; Wayne, Brooks and Massey, 2016; González Besteiro
et al., 2019). Indeed, the ISR blocks protein synthesis. This study would suggest that ISR inducers in
combination with drugs that provoke replication stress would be beneficial to enhance DNA damage in
cancer cells. It is important to note that in our hands, one hour of ISR stimulation did not affect the
levels of total CHK1 (Manuscript Supp. Fig. 1 N).
Replicative stress can also stimulate the ISR (Palam et al., 2015; Wang et al., 2018; Chen et al., 2019).
Long-term activation of ISR could switch the pro-survival programme to a pro-apoptotic one (Pakos‐
Zebrucka et al., 2016). Therefore, it would be interesting to test if co-treating cancer cells with
chemotherapeutics and ISR inducers could stimulate the ISR, further leading to apoptosis in these
cells.
4.6 Conclusions and future perspectives
In conclusion, we observed a strong impairment of DNA replication upon ISR stimulation. ISR depletes
cells of histones, which enhances R-loop formation and this is crucial for stalling DNA replication. Our
work has expanded on the protective role of ISR in regulating protein synthesis and controlling DNA
replication during stress. Although a few explanations were proposed, how ISR-mediated R-loop
accumulation downstream of histone depletion could interfere with DNA replication remains to be fully
clarified. Furthermore, we have yet to identify if impairment of DNA replication upon ISR is protective or
destructive to the cell. Our experiments would suggest that ISR slows down DNA replication to protect
the cells during stress, since ISR-mediated DNA replication impairment was not accompanied by an

DISCUSSION
101
induction of DNA damage markers. In addition, restoring DNA replication under ISR stimulation was
detrimental to the viability of cells. However, long-term ISR activation alone also hampers cellular
proliferation. In a similar manner to p53, it is likely that the timing and strength of ISR induction may
play a role in determining the downstream effects of ISR. On one hand, p53 activity is required for DNA
replication processivity and the depletion of p53 induces replicative stress (Klusmann et al., 2016). On
the other hand, long-term p53 activation leads to the induction of apoptosis (Ryan, Phillips and
Vousden, 2001; Zilfou and Lowe, 2009). Moreover, the dependency of cancer on the ISR could also be
of importance. Solid tumours growing in areas of hypoxia and low nutrient availability may rely on ISR
more. In such cases, inhibiting ISR and enhancing protein and DNA synthesis in these cells when
nutrient is limited could be a viable option to target these tumours. In contrast, when tumours are not
dependent on the ISR for growth, activating the pathway could severely impede DNA replication in
these cells and also induce apoptosis. Stratifying patients based on the eIF2alpha phosphorylation
status of tumours would be a plausible way of identifying ISR-dependent cancers. Importantly, the
combination of ISR inducers or inhibitors with other treatments requires further investigation to avoid
antagonistic effects of ISR modulators with chemotherapeutics. The rising problem of chemoresistance
in cancer, especially in the case of a relapse raises the need for the development of new cancer
therapeutics. Understanding molecular pathways that regulate tumourigenesis would help better target
these cells. Taken together, as non-malignant cells proliferate slower and should be less susceptible to
stress stimuli and less dependent on the ISR for survival, this provides a suitable therapeutic window
for ISR modulation in tumours. Therefore, the ISR is an extremely promising target for cancer
treatment.

REFERENCES
102
5 References
Adomavicius, T. et al. (2019) ‘The structural basis of translational control by eIF2 phosphorylation’, Nature Communications. doi: 10.1038/s41467-019-10167-3.
Aguilera, A. and García-Muse, T. (2012) ‘R Loops: From Transcription Byproducts to Threats to Genome Stability’, Molecular Cell. doi: 10.1016/j.molcel.2012.04.009.
Aguilera, A. and Gómez-González, B. (2017) ‘DNA-RNA hybrids: The risks of DNA breakage during transcription’, Nature Structural and Molecular Biology. doi: 10.1038/nsmb.3395.
Al-Hadid, Q. and Yang, Y. (2016) ‘R-loop: An emerging regulator of chromatin dynamics’, Acta Biochimica et Biophysica Sinica. doi: 10.1093/abbs/gmw052.
Alabert, C. and Groth, A. (2012) ‘Chromatin replication and epigenome maintenance’, Nature Reviews Molecular Cell Biology. doi: 10.1038/nrm3288.
Alabert, C., Jasencakova, Z. and Groth, A. (2017) ‘Chromatin replication and histone dynamics’, in Advances in Experimental Medicine and Biology. doi: 10.1007/978-981-10-6955-0_15.
Alasiri, G. et al. (2019) ‘Regulation of PERK expression by FOXO3: a vulnerability of drug-resistant cancer cells’, Oncogene. doi: 10.1038/s41388-019-0890-7.
Albert, T. K. et al. (2014) ‘Characterization of molecular and cellular functions of the cyclin-dependent kinase CDK9 using a novel specific inhibitor’, British Journal of Pharmacology. doi: 10.1111/bph.12408.
Alberts, B. et al. (2017) Molecular Biology of the Cell. doi: 10.1201/9781315735368.
Albig, W. et al. (1997) ‘Human histone gene organization: Nonregular arrangement within a large cluster’, Genomics. doi: 10.1006/geno.1996.4592.
Allen, J. E. et al. (2015) ‘Identification of TRAIL-inducing compounds highlights small molecule ONC201/TIC10 as a unique anti-cancer agent that activates the TRAIL pathway’, Molecular Cancer. doi: 10.1186/s12943-015-0346-9.
Allen, J. E. et al. (2016) ‘Discovery and clinical introduction of first-in-class imipridone ONC201’, Oncotarget. doi: 10.18632/oncotarget.11814.
Allison, D. F. and Wang, G. G. (2019) ‘R-loops: formation, function, and relevance to cell stress’, Cell Stress. doi: 10.15698/cst2019.02.175.
Ameri, K. and Harris, A. L. (2008) ‘Activating transcription factor 4’, International Journal of Biochemistry and Cell Biology. doi: 10.1016/j.biocel.2007.01.020.
Anda, S., Zach, R. and Grallert, B. (2017) ‘Activation of Gcn2 in response to different stresses’, PLoS ONE. doi: 10.1371/journal.pone.0182143.
Andersen, T. B. et al. (2015) ‘Thapsigargin-From Thapsia L. to Mipsagargin’, Molecules. doi: 10.3390/molecules20046113.
Annunziato, A. T. (2008) ‘DNA Packaging: Nucleosomes and Chromatin’, in Nature Education.
Atkins, C. et al. (2013) ‘Characterization of a novel PERK kinase inhibitor with antitumor and antiangiogenic activity’, Cancer Research. doi: 10.1158/0008-5472.CAN-12-3109.
Awasthi, P., Foiani, M. and Kumar, A. (2015) ‘ATM and ATR signaling at a glance’, Journal of Cell Science. doi: 10.1242/jcs.169730.
Axten, J. M. et al. (2012) ‘Discovery of 7-Methyl-5-(1-{[3-(trifluoromethyl)phenyl]acetyl}-2,3-dihydro-1H-

REFERENCES
103
indol-5-yl)-7H-pyrrolo[2,3-d]pyrimidin-4-amine (GSK2606414), a Potent and Selective First-in-Class Inhibitor of Protein Kinase R (PKR)-like Endoplasmic Reticulum Kinase (PERK)’, Journal of Medicinal Chemistry. American Chemical Society, 55(16), pp. 7193–7207. doi: 10.1021/jm300713s.
Axten, J. M. et al. (2013) ‘Discovery of GSK2656157: An optimized PERK inhibitor selected for preclinical development’, ACS Medicinal Chemistry Letters. doi: 10.1021/ml400228e.
Bacon, C. W. and D’Orso, I. (2019) ‘CDK9: a signaling hub for transcriptional control’, Transcription. doi: 10.1080/21541264.2018.1523668.
Bahal, R. et al. (2015) ‘Protein kinase R and the metabolic syndrome’, Journal of Cellular Biotechnology. doi: 10.3233/jcb-15006.
Balachandran, S. et al. (2000) ‘Essential role for the dsRNA-dependent protein kinase PKR in innate immunity to viral infection’, Immunity. doi: 10.1016/S1074-7613(00)00014-5.
Baumli, S., Endicott, J. A. and Johnson, L. N. (2010) ‘Halogen bonds form the basis for selective P-TEFb inhibition by DRB’, Chemistry and Biology. doi: 10.1016/j.chembiol.2010.07.012.
Bayona-Feliu, A. et al. (2017) ‘Linker histone H1 prevents R-loop accumulation and genome instability in heterochromatin’, Nature Communications. doi: 10.1038/s41467-017-00338-5.
Bell, S. P. and Dutta, A. (2002) ‘DNA Replication in Eukaryotic Cells’, Annual Review of Biochemistry. doi: 10.1146/annurev.biochem.71.110601.135425.
Belotserkovskaya, R. et al. (2003) ‘FACT facilitates transcription-dependent nucleosome alteration’, Science. doi: 10.1126/science.1085703.
Berndt, N., Karim, R. M. and Schönbrunn, E. (2017) ‘Advances of small molecule targeting of kinases’, Current Opinion in Chemical Biology. doi: 10.1016/j.cbpa.2017.06.015.
Berthon, J., Fujikane, R. and Forterre, P. (2009) ‘When DNA replication and protein synthesis come together’, Trends in Biochemical Sciences. doi: 10.1016/j.tibs.2009.05.004.
Bertoli, C. et al. (2016) ‘Sustained E2F-Dependent Transcription Is a Key Mechanism to Prevent Replication-Stress-Induced DNA Damage’, Cell Reports. doi: 10.1016/j.celrep.2016.04.036.
Bhat, M. et al. (2015) ‘Targeting the translation machinery in cancer’, Nature Reviews Drug Discovery. doi: 10.1038/nrd4505.
Bhullar, K. S. et al. (2018) ‘Kinase-targeted cancer therapies: Progress, challenges and future directions’, Molecular Cancer. doi: 10.1186/s12943-018-0804-2.
Bochman, M. L. and Schwacha, A. (2009) ‘The Mcm Complex: Unwinding the Mechanism of a Replicative Helicase’, Microbiology and Molecular Biology Reviews. doi: 10.1128/mmbr.00019-09.
Bock, C. T. et al. (1994) ‘Hepatitis B virus genome is organized into nucleosomes in the nucleus of the infected cell’, Virus Genes. doi: 10.1007/BF01703079.
Brambati, A. et al. (2015) ‘Replication and transcription on a collision course: Eukaryotic regulation mechanisms and implications for DNA stability’, Frontiers in Genetics. doi: 10.3389/fgene.2015.00166.
Braunstein, S. et al. (2007) ‘A Hypoxia-Controlled Cap-Dependent to Cap-Independent Translation Switch in Breast Cancer’, Molecular Cell. doi: 10.1016/j.molcel.2007.10.019.
Britton, S. et al. (2014) ‘DNA damage triggers SAF-A and RNA biogenesis factors exclusion from chromatin coupled to R-loops removal’, Nucleic Acids Research. doi: 10.1093/nar/gku601.
Butler, L. M. et al. (2015) ‘Maximizing the therapeutic potential of HSP90 inhibitors’, Molecular Cancer Research. doi: 10.1158/1541-7786.MCR-15-0234.

REFERENCES
104
Cabrera, E. et al. (2017) ‘PERK inhibits DNA replication during the Unfolded Protein Response via Claspin and Chk1’, Oncogene. doi: 10.1038/onc.2016.239.
Cakmakci, N. G. et al. (2008) ‘SLIP1, a Factor Required for Activation of Histone mRNA Translation by the Stem-Loop Binding Protein’, Molecular and Cellular Biology. doi: 10.1128/mcb.01500-07.
Castellano-Pozo, M. et al. (2013) ‘R loops are linked to histone H3 S10 phosphorylation and chromatin condensation’, Molecular Cell. doi: 10.1016/j.molcel.2013.10.006.
Cerqueira, N. M. F. S. A., Fernandes, P. A. and Ramos, M. J. (2007) ‘Understanding ribonucleotide reductase inactivation by gemcitabine’, Chemistry - A European Journal. doi: 10.1002/chem.200700260.
Chang, S. S. et al. (1999) ‘Prostate-specific membrane antigen is produced in tumor-associated neovasculature’, Clinical Cancer Research.
Chédin, F. (2016) ‘Nascent Connections: R-Loops and Chromatin Patterning’, Trends in Genetics. doi: 10.1016/j.tig.2016.10.002.
Chen, L. et al. (2019) ‘EIF2A promotes cell survival during paclitaxel treatment in vitro and in vivo’, Journal of Cellular and Molecular Medicine. doi: 10.1111/jcmm.14469.
Chen, W., Smeekens, J. M. and Wu, R. (2016) ‘Systematic study of the dynamics and half-lives of newly synthesized proteins in human cells’, Chemical Science. doi: 10.1039/c5sc03826j.
Choe, J. et al. (2018) ‘mRNA circularization by METTL3–eIF3h enhances translation and promotes oncogenesis’, Nature. doi: 10.1038/s41586-018-0538-8.
Chou, A. et al. (2017) ‘Inhibition of the integrated stress response reverses cognitive deficits after traumatic brain injury’, Proceedings of the National Academy of Sciences of the United States of America. doi: 10.1073/pnas.1707661114.
Cimprich, K. A. and Cortez, D. (2008) ‘ATR: An essential regulator of genome integrity’, Nature Reviews Molecular Cell Biology. doi: 10.1038/nrm2450.
Clancy, S. and Brown, W. (2008) ‘Translation : DNA to mRNA to Protein’, Nature Education.
Clemens, M. J. (2001) ‘Initiation factor eIF2 alpha phosphorylation in stress responses and apoptosis.’, Progress in molecular and subcellular biology.
Crossley, M. P., Bocek, M. and Cimprich, K. A. (2019) ‘R-Loops as Cellular Regulators and Genomic Threats’, Molecular Cell. doi: 10.1016/j.molcel.2019.01.024.
Das, C. and Tyler, J. K. (2012) ‘Histone exchange and histone modifications during transcription and aging’, Biochimica et Biophysica Acta - Gene Regulatory Mechanisms. doi: 10.1016/j.bbagrm.2011.08.001.
Das, I. et al. (2015) ‘Preventing proteostasis diseases by selective inhibition of a phosphatase regulatory subunit’, Science. doi: 10.1126/science.aaa4484.
Davenport, E. L. et al. (2007) ‘Heat shock protein inhibition is associated with activation of the unfolded protein response pathway in myeloma plasma cells’, Blood. doi: 10.1182/blood-2006-11-053728.
Degterev, A., Ofengeim, D. and Yuan, J. (2019) ‘Targeting RIPK1 for the treatment of human diseases’, Proceedings of the National Academy of Sciences of the United States of America. doi: 10.1073/pnas.1901179116.
Denapoli, J., Tehranchi, A. K. and Wang, J. D. (2013) ‘Dose-dependent reduction of replication elongation rate by (p)ppGpp in Escherichia coli and Bacillus subtilis’, Molecular Microbiology. doi: 10.1111/mmi.12172.

REFERENCES
105
Deng, J. et al. (2002) ‘Activation of gcn2 in uv-irradiated cells inhibits translation’, Current Biology. doi: 10.1016/S0960-9822(02)01037-0.
Dey, S. et al. (2010) ‘Both transcriptional regulation and translational control of ATF4 are central to the integrated stress response’, Journal of Biological Chemistry. doi: 10.1074/jbc.M110.167213.
Doan, N. T. Q. et al. (2015) ‘Targeting thapsigargin towards tumors’, Steroids. doi: 10.1016/j.steroids.2014.07.009.
Dobbelstein, M. and Moll, U. (2014) ‘Targeting tumour-supportive cellular machineries in anticancer drug development’, Nature Reviews Drug Discovery. doi: 10.1038/nrd4201.
Dobbelstein, M. and Sørensen, C. S. (2015) ‘Exploiting replicative stress to treat cancer’, Nature Reviews Drug Discovery. doi: 10.1038/nrd4553.
Donnelly, N. et al. (2013) ‘The eIF2α kinases: Their structures and functions’, Cellular and Molecular Life Sciences. doi: 10.1007/s00018-012-1252-6.
Donzé, O., Abbas-Terki, T. and Picard, D. (2001) ‘The Hsp90 chaperone complex is both a facilitator and a repressor of the dsRNA-dependent kinase PKR’, EMBO Journal. doi: 10.1093/emboj/20.14.3771.
Du, Y. C. N. and Stillman, B. (2002) ‘Yph1p, an ORC-interacting protein: Potential links between cell proliferation control, DNA replication, and ribosome biogenesis’, Cell. doi: 10.1016/S0092-8674(02)00773-0.
Fisher, R. P. (2005) ‘Secrets of a double agent: CDK7 in cell-cycle control and transcription’, Journal of Cell Science. doi: 10.1242/jcs.02718.
Forsburg, S. L. (2008) ‘The MCM helicase: Linking checkpoints to the replication fork’, Biochemical Society Transactions. doi: 10.1042/BST0360114.
Fragkos, M. et al. (2015) ‘DNA replication origin activation in space and time’, Nature Reviews Molecular Cell Biology. doi: 10.1038/nrm4002.
Frank, C. L. et al. (2010) ‘Control of activating transcription factor 4 (ATF4) persistence by multisite phosphorylation impacts cell cycle progression and neurogenesis’, Journal of Biological Chemistry. doi: 10.1074/jbc.M110.140699.
Fusakio, M. E. et al. (2016) ‘Transcription factor ATF4 directs basal and stress-induced gene expression in the unfolded protein response and cholesterol metabolism in the liver’, Molecular Biology of the Cell. doi: 10.1091/mbc.E16-01-0039.
Gagliardi, D. and Dziembowski, A. (2018) ‘50 and 30 modifications controlling RNA degradation: From safeguards to executioners’, Philosophical Transactions of the Royal Society B: Biological Sciences. doi: 10.1098/rstb.2018.0160.
Gallerne, C., Prola, A. and Lemaire, C. (2013) ‘Hsp90 inhibition by PU-H71 induces apoptosis through endoplasmic reticulum stress and mitochondrial pathway in cancer cells and overcomes the resistance conferred by Bcl-2’, Biochimica et Biophysica Acta - Molecular Cell Research. doi: 10.1016/j.bbamcr.2013.02.014.
Gallie, D. R. (1996) ‘Translational control of cellular and viral mRNAs’, Plant Molecular Biology. doi: 10.1007/BF00039381.
Gan, W. et al. (2011) ‘R-loop-mediated genomic instability is caused by impairment of replication fork progression’, Genes and Development. doi: 10.1101/gad.17010011.
García-Muse, T. and Aguilera, A. (2016) ‘Transcription-replication conflicts: How they occur and how they are resolved’, Nature Reviews Molecular Cell Biology. doi: 10.1038/nrm.2016.88.

REFERENCES
106
García-Pichardo, D. et al. (2017) ‘Histone Mutants Separate R Loop Formation from Genome Instability Induction’, Molecular Cell. doi: 10.1016/j.molcel.2017.05.014.
García-Rubio, M. L. et al. (2015) ‘The Fanconi Anemia Pathway Protects Genome Integrity from R-loops’, PLoS Genetics. doi: 10.1371/journal.pgen.1005674.
Garcia, M. A. et al. (2006) ‘Impact of Protein Kinase PKR in Cell Biology: from Antiviral to Antiproliferative Action’, Microbiology and Molecular Biology Reviews. doi: 10.1128/mmbr.00027-06.
García, M. A., Meurs, E. F. and Esteban, M. (2007) ‘The dsRNA protein kinase PKR: Virus and cell control’, Biochimie. doi: 10.1016/j.biochi.2007.03.001.
Gautschi, J. R. and Kern, R. M. (1973) ‘DNA replication in mammalian cells in the presence of cycloheximide’, Experimental Cell Research. doi: 10.1016/0014-4827(73)90270-X.
González Besteiro, M. A. et al. (2019) ‘Chk1 loss creates replication barriers that compromise cell survival independently of excess origin firing’, The EMBO Journal. doi: 10.15252/embj.2018101284.
Groth, A., Rocha, W., et al. (2007) ‘Chromatin Challenges during DNA Replication and Repair’, Cell. doi: 10.1016/j.cell.2007.01.030.
Groth, A., Corpet, A., et al. (2007) ‘Regulation of replication fork progression through histone supply and demand’, Science. doi: 10.1126/science.1148992.
Gunjan, A., Paik, J. and Verreault, A. (2005) ‘Regulation of histone synthesis and nucleosome assembly’, in Biochimie. doi: 10.1016/j.biochi.2005.02.008.
Haffner, M. C. et al. (2009) ‘Prostate-specific membrane antigen expression in the neovasculature of gastric and colorectal cancers’, Human Pathology. doi: 10.1016/j.humpath.2009.06.003.
Hahn, S. (2004) ‘Structure and mechanism of the RNA polymerase II transcription machinery’, Nature Structural and Molecular Biology. doi: 10.1038/nsmb763.
Halliday, M. et al. (2017) ‘Repurposed drugs targeting eIF2α-P-mediated translational repression prevent neurodegeneration in mice’, Brain. doi: 10.1093/brain/awx074.
Hamperl, S. and Cimprich, K. A. (2016) ‘Conflict Resolution in the Genome: How Transcription and Replication Make It Work’, Cell. doi: 10.1016/j.cell.2016.09.053.
Han, A. P. et al. (2001) ‘Heme-regulated eIF2α kinase (HRI) is required for translational regulation and survival of erythroid precursors in iron deficiency’, EMBO Journal. doi: 10.1093/emboj/20.23.6909.
Han, J. et al. (2013) ‘ER-stress-induced transcriptional regulation increases protein synthesis leading to cell death’, Nature Cell Biology. doi: 10.1038/ncb2738.
Hanahan, D. and Weinberg, R. A. (2000) ‘The hallmarks of cancer’, Cell. doi: 10.1016/S0092-8674(00)81683-9.
Hanahan, D. and Weinberg, R. A. (2011) ‘Hallmarks of cancer: The next generation’, Cell. doi: 10.1016/j.cell.2011.02.013.
Hansen, B. S., Vaughan, M. H. and Wang, L. (1972) ‘Reversible inhibition by histidinol of protein synthesis in human cells at the activation of histidine.’, Journal of Biological Chemistry.
Harding, H. P. et al. (2000) ‘Regulated translation initiation controls stress-induced gene expression in mammalian cells’, Molecular Cell. doi: 10.1016/S1097-2765(00)00108-8.
Henriksson, S. et al. (2018) ‘Distinct mechanistic responses to replication fork stalling induced by either nucleotide or protein deprivation’, Cell Cycle. doi: 10.1080/15384101.2017.1387696.
Hershey, J. W. B., Sonenberg, N. and Mathews, M. B. (2012) ‘Principles of translational control: An

REFERENCES
107
overview’, Cold Spring Harbor Perspectives in Biology. doi: 10.1101/cshperspect.a009829.
Hetz, C., Chevet, E. and Harding, H. P. (2013) ‘Targeting the unfolded protein response in disease’, Nature Reviews Drug Discovery. doi: 10.1038/nrd3976.
Hills, S. A. and Diffley, J. F. X. (2014) ‘DNA replication and oncogene-induced replicative stress’, Current Biology. doi: 10.1016/j.cub.2014.04.012.
Hinnebusch, A. G. (1993) ‘Gene‐specific translational control of the yeast GCN4 gene by phosphorylation of eukaryotic initiation factor 2’, Molecular Microbiology. doi: 10.1111/j.1365-2958.1993.tb01947.x.
Hocine, S., Singer, R. H. and Grünwald, D. (2010) ‘RNA processing and export.’, Cold Spring Harbor perspectives in biology. doi: 10.1101/cshperspect.a000752.
Hsieh, F. K. et al. (2013) ‘Histone chaperone FACT action during transcription through chromatin by RNA polymerase II’, Proceedings of the National Academy of Sciences of the United States of America. doi: 10.1073/pnas.1222198110.
Hu, W. et al. (2009) ‘Double-stranded RNA-dependent protein kinase-dependent apoptosis induction by a novel small compound.’, The Journal of pharmacology and experimental therapeutics, 328(3), pp. 866–872. doi: 10.1124/jpet.108.141754.
Igarashi, J. et al. (2004) ‘Activation of heme-regulated eukaryotic initiation factor 2α kinase by nitric oxide is induced by the formation of a five-coordinate NO-heme complex: Optical absorption, electron spin resonance, and resonance Raman spectral studies’, Journal of Biological Chemistry. doi: 10.1074/jbc.M310273200.
Iiboshi, Y. et al. (1999) ‘Amino acid-dependent control of p70(s6k). Involvement of tRNA aminoacylation in the regulation.’, The Journal of biological chemistry. United States, 274(2), pp. 1092–1099. doi: 10.1074/jbc.274.2.1092.
Ishizawa, J. et al. (2016) ‘ATF4 induction through an atypical integrated stress response to ONC201 triggers p53-independent apoptosis in hematological malignancies’, Science Signaling. doi: 10.1126/scisignal.aac4380.
Iyer, D. R. and Rhind, N. (2017) ‘The intra-S checkpoint responses to DNA damage’, Genes. doi: 10.3390/genes8020074.
Jackson, V. et al. (1976) ‘Modifications to histones immediately after synthesis’, Journal of Molecular Biology. doi: 10.1016/0022-2836(76)90282-5.
Jaeger, A. M. and Whitesell, L. (2019) ‘HSP90: Enabler of Cancer Adaptation’, Annual Review of Cancer Biology. doi: 10.1146/annurev-cancerbio-030518-055533.
Jasencakova, Z. et al. (2010) ‘Replication Stress Interferes with Histone Recycling and Predeposition Marking of New Histones’, Molecular Cell. doi: 10.1016/j.molcel.2010.01.033.
Jeronimo, C., Poitras, C. and Robert, F. (2019) ‘Histone Recycling by FACT and Spt6 during Transcription Prevents the Scrambling of Histone Modifications’, Cell Reports. doi: 10.1016/j.celrep.2019.06.097.
Jewer, M. et al. (2019) ‘Translational control of breast cancer plasticity’, bioRxiv. Cold Spring Harbor Laboratory. doi: 10.1101/596544.
Johannes, G. et al. (1999) ‘Identification of eukaryotic mRNAs that are translated at reduced cap binding complex elF4F concentrations using a cDNA microarray’, Proceedings of the National Academy of Sciences of the United States of America. doi: 10.1073/pnas.96.23.13118.
Jousse, C. et al. (2003) ‘Inhibition of a constitutive translation initiation factor 2α phosphatase, CReP,

REFERENCES
108
promotes survival of stressed cells’, Journal of Cell Biology. doi: 10.1083/jcb.200308075.
Kahvejian, A., Roy, G. and Sonenberg, N. (2001) ‘The mRNA closed-loop model: The function of PABP and PABP-interacting proteins in mRNA translation’, in Cold Spring Harbor Symposia on Quantitative Biology. doi: 10.1101/sqb.2001.66.293.
Kaygun, H. and Marzluff, W. F. (2005) ‘Regulated degradation of replication-dependent histone mRNAs requires both ATR and Upf1’, Nature Structural and Molecular Biology. doi: 10.1038/nsmb972.
Kieft, J. S. (2008) ‘Viral IRES RNA structures and ribosome interactions’, Trends in Biochemical Sciences. doi: 10.1016/j.tibs.2008.04.007.
Kim, S. H. et al. (2002) ‘Neoplastic progression in melanoma and colon cancer is associated with increased expression and activity of the interferon-inducible protein kinase, PKR’, Oncogene. doi: 10.1038/sj.onc.1205987.
Kimball, S. R. (1999) ‘Eukaryotic initiation factor eIF2’, Int J Biochem Cell Biol.
Klimovskaia, I. M. et al. (2014) ‘Tousled-like kinases phosphorylate Asf1 to promote histone supply during DNA replication’, Nature Communications. doi: 10.1038/ncomms4394.
Kline, C. L. B. et al. (2016) ‘ONC201 kills solid tumor cells by triggering an integrated stress response dependent on ATF4 activation by specific eIF2a kinases’, Science Signaling. doi: 10.1126/scisignal.aac4374.
Klusmann, I. et al. (2016) ‘p53 Activity Results in DNA Replication Fork Processivity’, Cell Reports. doi: 10.1016/j.celrep.2016.10.036.
Klusmann, I. et al. (2018) ‘Chromatin modifiers Mdm2 and RNF2 prevent RNA:DNA hybrids that impair DNA replication’, Proceedings of the National Academy of Sciences of the United States of America. doi: 10.1073/pnas.1809592115.
Knipe, D. M. et al. (2013) ‘Snapshots: Chromatin control of viral infection’, Virology. doi: 10.1016/j.virol.2012.09.023.
Komar, A. A. and Hatzoglou, M. (2011) ‘Cellular IRES-mediated translation: The war of ITAFs in pathophysiological states’, Cell Cycle. doi: 10.4161/cc.10.2.14472.
Köpper, F. et al. (2013) ‘Damage-induced DNA replication stalling relies on MAPK-activated protein kinase 2 activity’, Proceedings of the National Academy of Sciences of the United States of America. doi: 10.1073/pnas.1304355110.
Köpper, F. et al. (2014) ‘The MAPK-activated protein kinase 2 mediates gemcitabine sensitivity in pancreatic cancer cells’, Cell Cycle. doi: 10.4161/cc.28292.
Koromilas, A. E. (2015) ‘Roles of the translation initiation factor eIF2α serine 51 phosphorylation in cancer formation and treatment’, Biochimica et Biophysica Acta - Gene Regulatory Mechanisms. doi: 10.1016/j.bbagrm.2014.12.007.
Koseoglu, M. M., Dong, J. and Marzluff, W. F. (2010) ‘Coordinate regulation of histone mRNA metabolism and DNA replication’, Cell Cycle. doi: 10.4161/cc.9.19.13300.
Kotsantis, P., Petermann, E. and Boulton, S. J. (2018) ‘Mechanisms of oncogene-induced replication stress: Jigsaw falling into place’, Cancer Discovery. doi: 10.1158/2159-8290.CD-17-1461.
Kozak, M. (2001) ‘Constraints on reinitiation of translation in mammals’, Nucleic Acids Research. doi: 10.1093/nar/29.24.5226.
Kroemer, G., Mariño, G. and Levine, B. (2010) ‘Autophagy and the Integrated Stress Response’, Molecular Cell. doi: 10.1016/j.molcel.2010.09.023.

REFERENCES
109
Kryeziu, K. et al. (2019) ‘Combination therapies with HSP90 inhibitors against colorectal cancer’, Biochimica et Biophysica Acta - Reviews on Cancer. doi: 10.1016/j.bbcan.2019.01.002.
Lane, A. N. and Fan, T. W. M. (2015) ‘Regulation of mammalian nucleotide metabolism and biosynthesis’, Nucleic Acids Research. doi: 10.1093/nar/gkv047.
Lang, K. S. et al. (2017) ‘Head-on replication-transcription collisions lead to formation of life threatening R-loops’, bioRxiv, p. 154427. doi: 10.1101/154427.
Langston, L. D. and O’Donnell, M. (2006) ‘DNA Replication: Keep Moving and Don’t Mind the Gap’, Molecular Cell. doi: 10.1016/j.molcel.2006.05.034.
Lee, D. Y. et al. (2010) ‘Activation of PERK signaling attenuates Aβ-mediated ER stress’, PLoS ONE. doi: 10.1371/journal.pone.0010489.
Li, X. and Manley, J. L. (2006) ‘Cotranscriptional processes and their influence on genome stability’, Genes and Development. doi: 10.1101/gad.1438306.
Liang, D. et al. (2012) ‘Histone dosage regulates DNA damage sensitivity in a checkpoint-independent manner by the homologous recombination pathway’, Nucleic Acids Research. doi: 10.1093/nar/gks722.
Lieberman, P. M. (2008) ‘Chromatin organization and virus gene expression’, Journal of Cellular Physiology. doi: 10.1002/jcp.21421.
Liu, H. et al. (1997) ‘Monoclonal antibodies to the extracellular domain of prostate-specific membrane antigen also react with tumor vascular endothelium’, Cancer Research.
Liu, Q. and Gong, Z. (2011) ‘The coupling of epigenome replication with DNA replication’, Current Opinion in Plant Biology. doi: 10.1016/j.pbi.2010.12.001.
Liu, Z. et al. (2015) ‘Protein kinase R-like ER kinase and its role in endoplasmic reticulum stress-decided cell fate’, Cell Death and Disease. doi: 10.1038/cddis.2015.183.
Longley, D. B., Harkin, D. P. and Johnston, P. G. (2003) ‘5-Fluorouracil: Mechanisms of action and clinical strategies’, Nature Reviews Cancer. doi: 10.1038/nrc1074.
López-Lastra, M., Rivas, A. and Barría, M. I. (2005) ‘Protein synthesis in eukaryotes: The growing biological relevance of cap-independent translation initiation’, Biological Research. doi: 10.4067/S0716-97602005000200003.
Luo, D. et al. (2018) ‘MNase, as a probe to study the sequence-dependent site exposures in the +1 nucleosomes of yeast’, Nucleic Acids Research. doi: 10.1093/nar/gky502.
Luo, J., Solimini, N. L. and Elledge, S. J. (2009) ‘Principles of Cancer Therapy: Oncogene and Non-oncogene Addiction’, Cell. doi: 10.1016/j.cell.2009.02.024.
Ma, T. and Klann, E. (2014) ‘PERK: A novel therapeutic target for neurodegenerative diseases?’, Alzheimer’s Research and Therapy. doi: 10.1186/alzrt260.
MacAlpine, D. M. and Almouzni, G. (2013) ‘Chromatin and DNA replication’, Cold Spring Harbor Perspectives in Biology. doi: 10.1101/cshperspect.a010207.
Macheret, M. and Halazonetis, T. D. (2015) ‘DNA Replication Stress as a Hallmark of Cancer’, Annual Review of Pathology: Mechanisms of Disease. doi: 10.1146/annurev-pathol-012414-040424.
Machida, Y. J., Hamlin, J. L. and Dutta, A. (2005) ‘Right place, right time, and only once: Replication initiation in metazoans’, Cell. doi: 10.1016/j.cell.2005.09.019.
Maciag, M. et al. (2010) ‘ppGpp inhibits the activity of Escherichia coli DnaG primase’, Plasmid. doi: 10.1016/j.plasmid.2009.11.002.

REFERENCES
110
Mahalingam, D. et al. (2016) ‘Mipsagargin, a novel thapsigargin-based PSMA-Activated prodrug: Results of a first-in-man phase i clinical trial in patients with refractory, advanced or metastatic solid tumours’, British Journal of Cancer. doi: 10.1038/bjc.2016.72.
Mahalingam, D. et al. (2019) ‘A Phase II, Multicenter, Single-Arm Study of Mipsagargin (G-202) as a Second-Line Therapy Following Sorafenib for Adult Patients with Progressive Advanced Hepatocellular Carcinoma’, Cancers. doi: 10.3390/cancers11060833.
Mahameed, M. et al. (2019) ‘The unfolded protein response modulators GSK2606414 and KIRA6 are potent KIT inhibitors’, Cell Death and Disease. doi: 10.1038/s41419-019-1523-3.
Marabitti, V. et al. (2019) ‘ATM pathway activation limits R-loop-associated genomic instability in Werner syndrome cells’, Nucleic acids research. doi: 10.1093/nar/gkz025.
Marcu, M. G. et al. (2002) ‘Heat Shock Protein 90 Modulates the Unfolded Protein Response by Stabilizing IRE1 ’, Molecular and Cellular Biology. doi: 10.1128/mcb.22.24.8506-8513.2002.
Maréchal, A. and Zou, L. (2013) ‘DNA damage sensing by the ATM and ATR kinases’, Cold Spring Harbor Perspectives in Biology. doi: 10.1101/cshperspect.a012716.
Marteijn, J. A., Vermeulen, W. and Tresini, M. (2017) ‘Noncanonical ATM activation and signaling in response to transcription-blocking DNA damage’, in Methods in Molecular Biology. doi: 10.1007/978-1-4939-6955-5_25.
Marzluff, W. F. (2005) ‘Metazoan replication-dependent histone mRNAs: A distinct set of RNA polymerase II transcripts’, Current Opinion in Cell Biology. doi: 10.1016/j.ceb.2005.04.010.
Marzluff, W. F., Wagner, E. J. and Duronio, R. J. (2008) ‘Metabolism and regulation of canonical histone mRNAs: Life without a poly(A) tail’, Nature Reviews Genetics. doi: 10.1038/nrg2438.
Masai, H. et al. (2010) ‘Eukaryotic Chromosome DNA Replication: Where, When, and How?’, Annual Review of Biochemistry. doi: 10.1146/annurev.biochem.052308.103205.
Masumoto, H. et al. (2005) ‘A role for cell-cycle-regulated histone H3 lysine 56 acetylation in the DNA damage response’, Nature. doi: 10.1038/nature03714.
Mattiroli, F. et al. (2012) ‘RNF168 ubiquitinates K13-15 on H2A/H2AX to drive DNA damage signaling’, Cell. doi: 10.1016/j.cell.2012.08.005.
Meaux, S. A., Holmquist, C. E. and Marzluff, W. F. (2018) ‘Role of oligouridylation in normal metabolism and regulated degradation of mammalian histone mRNAs’, Philosophical Transactions of the Royal Society B: Biological Sciences. doi: 10.1098/rstb.2018.0170.
Megason, S. G. (2009) ‘In toto imaging of embryogenesis with confocal time-lapse microscopy.’, Methods in molecular biology (Clifton, N.J.). doi: 10.1007/978-1-60327-977-2_19.
Mei, Q. et al. (2017) ‘Regulation of DNA replication-coupled histone gene expression’, Oncotarget. doi: 10.18632/oncotarget.21887.
Mejlvang, J. et al. (2014) ‘New histone supply regulates replication fork speed and PCNA unloading’, Journal of Cell Biology. doi: 10.1083/jcb.201305017.
Merrick, W. C. (2004) ‘Cap-dependent and cap-independent translation in eukaryotic systems’, Gene. doi: 10.1016/j.gene.2004.02.051.
Merrick, W. C. and Pavitt, G. D. (2018) ‘Protein synthesis initiation in eukaryotic cells’, Cold Spring Harbor Perspectives in Biology. doi: 10.1101/cshperspect.a033092.
Miyamoto, N. et al. (2011) ‘Transcriptional regulation of activating transcription factor 4 under oxidative stress in retinal pigment epithelial ARPE-19/HPV-16 cells’, Investigative Ophthalmology and Visual

REFERENCES
111
Science. doi: 10.1167/iovs.10-5775.
Montagnoli, A. et al. (2006) ‘Identification of Mcm2 phosphorylation sites by S-phase-regulating kinases’, Journal of Biological Chemistry. doi: 10.1074/jbc.M512921200.
Morales, F. and Giordano, A. (2016) ‘Overview of CDK9 as a target in cancer research’, Cell Cycle. doi: 10.1080/15384101.2016.1138186.
Morita, M. et al. (2013) ‘MTORC1 controls mitochondrial activity and biogenesis through 4E-BP-dependent translational regulation’, Cell Metabolism. doi: 10.1016/j.cmet.2013.10.001.
Morris, D. R. and Geballe, A. P. (2000) ‘Upstream Open Reading Frames as Regulators of mRNA Translation’, Molecular and Cellular Biology. doi: 10.1128/mcb.20.23.8635-8642.2000.
Musahl, C. et al. (1998) ‘Stability of the replicative Mcm3 protein in proliferating and differentiating human cells’, Experimental Cell Research. doi: 10.1006/excr.1998.4041.
Nagel, R., Semenova, E. A. and Berns, A. (2016) ‘Drugging the addict: non‐oncogene addiction as a target for cancer therapy’, EMBO reports. doi: 10.15252/embr.201643030.
Nair, N., Shoaib, M. and Sørensen, C. S. (2017) ‘Chromatin dynamics in genome stability: Roles in suppressing endogenous DNA damage and facilitating DNA repair’, International Journal of Molecular Sciences. doi: 10.3390/ijms18071486.
Neckers, L. (2002) ‘Hsp90 inhibitors as novel cancer chemotherapeutic agents’, Trends in Molecular Medicine. doi: 10.1016/S1471-4914(02)02316-X.
Neckers, L. (2007) ‘Heat shock protein 90: The cancer chaperone’, Journal of Biosciences. doi: 10.1007/s12038-007-0051-y.
Neckers, L. et al. (2018) ‘Methods to validate Hsp90 inhibitor specificity, to identify off-target effects, and to rethink approaches for further clinical development’, Cell Stress and Chaperones. doi: 10.1007/s12192-018-0877-2.
Nguyen, H. G. et al. (2018) ‘Development of a stress response therapy targeting aggressive prostate cancer’, Science Translational Medicine. doi: 10.1126/scitranslmed.aar2036.
Ni, M. et al. (2009) ‘Regulation of PERK signaling and leukemic cell survival by a novel cytosolic isoform of the UPR regulator GRP78/BiP’, PLoS ONE. doi: 10.1371/journal.pone.0006868.
Novoa, I. et al. (2001) ‘Feedback inhibition of the unfolded protein response by GADD34-mediated dephosphorylation of eIF2α’, Journal of Cell Biology. doi: 10.1083/jcb.153.5.1011.
Ohlmann, T. et al. (1996) ‘The C-terminal domain of eukaryotic protein synthesis initiation factor (eIF) 4G is sufficient to support cap-independent translation in the absence of eIF4E.’, The EMBO Journal. doi: 10.1002/j.1460-2075.1996.tb00479.x.
Ohsato, T. et al. (1999) ‘R-Loop in the replication origin of human mitochondrial DNA is resolved by RecG, a Holliday junction-specific helicase’, Biochemical and Biophysical Research Communications. doi: 10.1006/bbrc.1998.0133.
Ojha, R. and Amaravadi, R. K. (2017) ‘Targeting the unfolded protein response in cancer’, Pharmacological Research. doi: 10.1016/j.phrs.2017.04.003.
Pajoro, A. et al. (2018) ‘Profiling nucleosome occupancy by MNase-seq: Experimental protocol and computational analysis’, in Methods in Molecular Biology. doi: 10.1007/978-1-4939-7318-7_11.
Pakos‐Zebrucka, K. et al. (2016) ‘The integrated stress response’, EMBO reports. doi: 10.15252/embr.201642195.
Palam, L. R. et al. (2015) ‘Integrated stress response is critical for gemcitabine resistance in pancreatic

REFERENCES
112
ductal adenocarcinoma’, Cell Death and Disease. doi: 10.1038/cddis.2015.264.
Pavri, R. (2017) ‘R loops in the regulation of antibody gene diversification’, Genes. doi: 10.3390/genes8060154.
Petersen, B. O. et al. (2000) ‘Cell cycle- and cell growth-regulated proteolysis of mammalian CDC6 is dependent on APC-CDH1’, Genes and Development. doi: 10.1101/gad.832500.
Pilipenko, E. V. et al. (2000) ‘A cell cycle-dependent protein serves as a template-specific translation initiation factor’, Genes and Development.
Piovesan, A. et al. (2019) ‘On the length, weight and GC content of the human genome’, BMC Research Notes. doi: 10.1186/s13104-019-4137-z.
Pommier, Y. (2006) ‘Topoisomerase I inhibitors: Camptothecins and beyond’, in Nature Reviews Cancer. doi: 10.1038/nrc1977.
Proud, C. G. (2019) ‘Phosphorylation and Signal Transduction Pathways in Translational Control’, Cold Spring Harbor Perspectives in Biology. doi: 10.1101/cshperspect.a033050.
Pukkila, P. J. (2001) ‘Molecular Biology: The Central Dogma’, in Encyclopedia of Life Sciences. doi: 10.1038/npg.els.0000812.
Quirós, P. M. et al. (2017) ‘Multi-omics analysis identifies ATF4 as a key regulator of the mitochondrial stress response in mammals’, Journal of Cell Biology. doi: 10.1083/jcb.201702058.
Ralff, M. D. et al. (2017) ‘ONC201: A new treatment option being tested clinically for recurrent glioblastoma’, Translational Cancer Research. doi: 10.21037/tcr.2017.10.03.
Ramani, V., Qiu, R. and Shendure, J. (2019) ‘High Sensitivity Profiling of Chromatin Structure by MNase-SSP’, Cell Reports. doi: 10.1016/j.celrep.2019.02.007.
Reijonen, S. et al. (2008) ‘Inhibition of endoplasmic reticulum stress counteracts neuronal cell death and protein aggregation caused by N-terminal mutant huntingtin proteins’, Experimental Cell Research. doi: 10.1016/j.yexcr.2007.12.025.
Richter, J. D. and Sonenberg, N. (2005) ‘Regulation of cap-dependent translation by eIF4E inhibitory proteins’, Nature. doi: 10.1038/nature03205.
Robichaud, N. et al. (2019) ‘Translational Control in Cancer.’, Cold Spring Harbor perspectives in biology. United States, United States, 11(7). doi: 10.1101/cshperspect.a032896.
Rojas-Rivera, D. et al. (2017) ‘When PERK inhibitors turn out to be new potent RIPK1 inhibitors: Critical issues on the specificity and use of GSK2606414 and GSK2656157’, Cell Death and Differentiation. doi: 10.1038/cdd.2017.58.
Roseaulin, L. C. et al. (2013) ‘Coordinated Degradation of Replisome Components Ensures Genome Stability upon Replication Stress in the Absence of the Replication Fork Protection Complex’, PLoS Genetics. doi: 10.1371/journal.pgen.1003213.
Rosenwald, I. B. et al. (2003) ‘Expression of translation initiation factor eIF-2α is increased in benign and malignant melanocytic and colonic epithelial neoplasms’, Cancer. doi: 10.1002/cncr.11619.
Roux, P. P. et al. (2007) ‘RAS/ERK signaling promotes site-specific ribosomal protein S6 phosphorylation via RSK and stimulates cap-dependent translation’, Journal of Biological Chemistry. doi: 10.1074/jbc.M700906200.
Ryan, K. M., Phillips, A. C. and Vousden, K. H. (2001) ‘Regulation and function of the p53 tumor suppressor protein’, Current Opinion in Cell Biology. doi: 10.1016/S0955-0674(00)00216-7.
Saelens, X., Kalai, M. and Vandenabeele, P. (2001) ‘Translation inhibition in apoptosis: Caspase-

REFERENCES
113
dependent PKR activation and eIF2-α phosphorylation’, Journal of Biological Chemistry. doi: 10.1074/jbc.M103674200.
Salas‐Armenteros, I. et al. (2017) ‘ Human THO –Sin3A interaction reveals new mechanisms to prevent
R‐loops that cause genome instability ’, The EMBO Journal. doi: 10.15252/embj.201797208.
Samplaski, M. K. et al. (2011) ‘Folate hydrolase (prostate-specific antigen) 1 expression in bladder cancer subtypes and associated tumor neovasculature’, Modern Pathology. doi: 10.1038/modpathol.2011.112.
Sancar, A. et al. (2004) ‘Molecular Mechanisms of Mammalian DNA Repair and the DNA Damage Checkpoints’, Annual Review of Biochemistry. doi: 10.1146/annurev.biochem.73.011303.073723.
Santos-Pereira, J. M. and Aguilera, A. (2015) ‘R loops: New modulators of genome dynamics and function’, Nature Reviews Genetics. doi: 10.1038/nrg3961.
Schafer, K. A. (1998) ‘The Cell Cycle: A Review’, Veterinary Pathology. doi: 10.1177/030098589803500601.
Schindelin, J. et al. (2012) ‘Fiji: An open-source platform for biological-image analysis’, Nature Methods. doi: 10.1038/nmeth.2019.
Schröder, M. and Kaufman, R. J. (2005) ‘THE MAMMALIAN UNFOLDED PROTEIN RESPONSE’, Annual Review of Biochemistry. doi: 10.1146/annurev.biochem.73.011303.074134.
Schümperli, D. (1988) ‘Multilevel regulation of replication-dependent histone genes’, Trends in Genetics. doi: 10.1016/0168-9525(88)90074-1.
Schwab, R. A. et al. (2015) ‘The Fanconi Anemia Pathway Maintains Genome Stability by Coordinating Replication and Transcription’, Molecular Cell. doi: 10.1016/j.molcel.2015.09.012.
Shatsky, I. N. et al. (2010) ‘Cap- and IRES-independent scanning mechanism of translation initiation as an alternative to the concept of cellular IRESs’, Molecules and Cells. doi: 10.1007/s10059-010-0149-1.
Shiloh, Y. and Ziv, Y. (2013) ‘The ATM protein kinase: Regulating the cellular response to genotoxic stress, and more’, Nature Reviews Molecular Cell Biology. doi: 10.1038/nrm3546.
Shopland, L. S. et al. (2001) ‘Replication-dependent histone gene expression is related to Cajal body (CB) association but does not require sustained CB contact’, Molecular Biology of the Cell. doi: 10.1091/mbc.12.3.565.
Shukla, N. et al. (1997) ‘Short-term exposure to low concentrations of thapsigargin inhibits replication of cultured human vascular smooth muscle cells’, British Journal of Surgery. doi: 10.1002/bjs.1800840315.
Sidrauski, C. et al. (2013) ‘Pharmacological brake-release of mRNA translation enhances cognitive memory’, eLife. doi: 10.7554/eLife.00498.
Sidrauski, C. et al. (2015) ‘Pharmacological dimerization and activation of the exchange factor eIF2B antagonizes theintegrated stress response’, eLife. doi: 10.7554/eLife.07314.
Silvera, D., Formenti, S. C. and Schneider, R. J. (2010) ‘Translational control in cancer’, Nature Reviews Cancer. doi: 10.1038/nrc2824.
Singh, R. K. et al. (2010) ‘Excess histone levels mediate cytotoxicity via multiple mechanisms’, Cell Cycle. doi: 10.4161/cc.9.20.13636.
Skourti-Stathaki, K. and Proudfoot, N. J. (2014) ‘A double-edged sword: R loops as threats to genome integrity and powerful regulators of gene expression’, Genes and Development. doi: 10.1101/gad.242990.114.

REFERENCES
114
Smith, J. J. et al. (2008) ‘A class II histone deacetylase acts on newly synthesized histones in tetrahymena’, Eukaryotic Cell. doi: 10.1128/EC.00409-07.
Sobel, R. E. et al. (1995) ‘Conservation of deposition-related acetylation sites in newly synthesized histones H3 and H4’, Proceedings of the National Academy of Sciences of the United States of America. doi: 10.1073/pnas.92.4.1237.
Sollier, J. and Cimprich, K. A. (2015) ‘Breaking bad: R-loops and genome integrity’, Trends in Cell Biology. doi: 10.1016/j.tcb.2015.05.003.
Sollier, J. and Cimprich, K. A. (2016) ‘R-Loops Breaking Bad’, Trends in Cell Biology. doi: 10.1016/j.tcb.2015.05.003.R-Loops.
Somers, J., Pöyry, T. and Willis, A. E. (2013) ‘A perspective on mammalian upstream open reading frame function’, International Journal of Biochemistry and Cell Biology. doi: 10.1016/j.biocel.2013.04.020.
Son, S. M. et al. (2014) ‘Reduced IRE1 mediates apoptotic cell death by disrupting calcium homeostasis via the InsP3 receptor’, Cell Death and Disease. doi: 10.1038/cddis.2014.129.
Sonenberg, N. and Hinnebusch, A. G. (2009) ‘Regulation of Translation Initiation in Eukaryotes: Mechanisms and Biological Targets’, Cell. doi: 10.1016/j.cell.2009.01.042.
Spitzer, J. I. et al. (2011) ‘mRNA and protein levels of FUS, EWSR1, and TAF15 are upregulated in liposarcoma’, Genes Chromosomes and Cancer. doi: 10.1002/gcc.20858.
Srivatsan, A. and Wang, J. D. (2008) ‘Control of bacterial transcription, translation and replication by (p)ppGpp’, Current Opinion in Microbiology. doi: 10.1016/j.mib.2008.02.001.
Stein, M. N. et al. (2019) ‘Safety and enhanced immunostimulatory activity of the DRD2 antagonist ONC201 in advanced solid tumor patients with weekly oral administration’, Journal for ImmunoTherapy of Cancer. doi: 10.1186/s40425-019-0599-8.
Suh, D. H. et al. (2012) ‘Unfolded protein response to autophagy as a promising druggable target for anticancer therapy’, Annals of the New York Academy of Sciences. doi: 10.1111/j.1749-6632.2012.06739.x.
Sullivan, K. D. et al. (2009) ‘Knockdown of SLBP results in nuclear retention of histone mRNA’, RNA. doi: 10.1261/rna.1205409.
Sun, J. and Kong, D. (2010) ‘DNA replication origins, ORC/DNA interaction, and assembly of pre-replication complex in eukaryotes’, Acta Biochimica et Biophysica Sinica. doi: 10.1093/abbs/gmq048.
Svitkin, Y. V. and Sonenberg, N. (2006) ‘Translational control by the poly(A) binding protein: a check for mRNA integrity’, Molekuliarnaia biologiia.
Syljuasen, R. G. et al. (2005) ‘Inhibition of Human Chk1 Causes Increased Initiation of DNA Replication, Phosphorylation of ATR Targets, and DNA Breakage’, Molecular and Cellular Biology. doi: 10.1128/mcb.25.9.3553-3562.2005.
Tahmasebi, S. et al. (2018) ‘Translation deregulation in human disease’, Nature Reviews Molecular Cell Biology. doi: 10.1038/s41580-018-0034-x.
Tanaka, S. and Araki, H. (2011) ‘Multiple regulatory mechanisms to inhibit untimely initiation of DNA replication are important for stable genome maintenance’, PLoS Genetics. doi: 10.1371/journal.pgen.1002136.
Taniuchi, S. et al. (2016) ‘Integrated stress response of vertebrates is regulated by four eIF2α kinases’, Scientific Reports. doi: 10.1038/srep32886.

REFERENCES
115
Thastrup, O. et al. (1989) ‘Thapsigargin, a novel molecular probe for studying intracellular calcium release and storage.’, Agents and actions. Switzerland, 27(1–2), pp. 17–23. doi: 10.1007/bf02222186.
Thastrup, O. et al. (1994) ‘Thapsigargin, a novel molecular probe for studying intracellular calcium release and storage.’, Agents and actions. Switzerland, 27(1–2), pp. 17–23. doi: 10.1007/bf02222186.
Tsai, J. C. et al. (2018) ‘Structure of the nucleotide exchange factor eIF2B reveals mechanism of memory-enhancing molecule’, Science. doi: 10.1126/science.aaq0939.
Tsaytler, P. et al. (2011) ‘Selective inhibition of a regulatory subunit of protein phosphatase 1 restores proteostasis’, Science. doi: 10.1126/science.1201396.
Tuduri, S. et al. (2009) ‘Topoisomerase I suppresses genomic instability by preventing interference between replication and transcription’, Nature Cell Biology. doi: 10.1038/ncb1984.
Ubhi, T. and Brown, G. W. (2019) ‘Exploiting DNA replication stress for cancer treatment’, Cancer Research. doi: 10.1158/0008-5472.CAN-18-3631.
Urra, H. et al. (2016) ‘Endoplasmic Reticulum Stress and the Hallmarks of Cancer’, Trends in Cancer. doi: 10.1016/j.trecan.2016.03.007.
Vattem, K. M. and Wek, R. C. (2004) ‘Reinitiation involving upstream ORFs regulates ATF4 mRNA translation in mammalian cells’, Proceedings of the National Academy of Sciences of the United States of America. doi: 10.1073/pnas.0400541101.
Vermeulen, K., Van Bockstaele, D. R. and Berneman, Z. N. (2003) ‘The cell cycle: A review of regulation, deregulation and therapeutic targets in cancer’, Cell Proliferation. doi: 10.1046/j.1365-2184.2003.00266.x.
van Vliet, A. R. et al. (2017) ‘The ER Stress Sensor PERK Coordinates ER-Plasma Membrane Contact Site Formation through Interaction with Filamin-A and F-Actin Remodeling’, Molecular Cell. doi: 10.1016/j.molcel.2017.01.020.
Waga, S. and Stillman, B. (1998) ‘THE DNA REPLICATION FORK IN EUKARYOTIC CELLS’, Annual Review of Biochemistry. doi: 10.1146/annurev.biochem.67.1.721.
Walter, P. and Ron, D. (2011) ‘The unfolded protein response: From stress pathway to homeostatic regulation’, Science. doi: 10.1126/science.1209038.
Wang, D. and Lippard, S. J. (2005) ‘Cellular processing of platinum anticancer drugs’, Nature Reviews Drug Discovery. doi: 10.1038/nrd1691.
Wang, H. et al. (2014) ‘Effects of thapsigargin on the proliferation and survival of human rheumatoid arthritis synovial cells’, The Scientific World Journal. doi: 10.1155/2014/605416.
Wang, J. D., Sanders, G. M. and Grossman, A. D. (2007) ‘Nutritional Control of Elongation of DNA Replication by (p)ppGpp’, Cell. doi: 10.1016/j.cell.2006.12.043.
Wang, S. F. et al. (2018) ‘Activated Integrated Stress Response Induced by Salubrinal Promotes Cisplatin Resistance in Human Gastric Cancer Cells via Enhanced xCT Expression and Glutathione Biosynthesis’, International journal of molecular sciences. doi: 10.3390/ijms19113389.
Wayne, J., Brooks, T. and Massey, A. J. (2016) ‘Inhibition of Chk1 with the small molecule inhibitor V158411 induces DNA damage and cell death in an unperturbed S-phase’, Oncotarget. doi: 10.18632/oncotarget.13119.
Wek, R. C., Jackson, B. M. and Hinnebusch, A. G. (1989) ‘Juxtaposition of domains homologous to protein kinase and histidyl-tRNA synthetases in GCN2 protein suggests a mechanism for coupling GCN4 expression to amino acid availability’, Proceedings of the National Academy of Sciences of the United States of America. doi: 10.1073/pnas.86.12.4579.

REFERENCES
116
Wek, S. A., Zhu, S. and Wek, R. C. (1995) ‘The histidyl-tRNA synthetase-related sequence in the eIF-2 alpha protein kinase GCN2 interacts with tRNA and is required for activation in response to starvation for different amino acids.’, Molecular and Cellular Biology. doi: 10.1128/mcb.15.8.4497.
Yekezare, M., Gó mez-González, B. and Diffley, J. F. X. (2013) ‘Controlling DNA replication origins in response to DNA damage - inhibit globally, activate locally’, Journal of Cell Science. doi: 10.1242/jcs.096701.
Zeman, M. K. and Cimprich, K. A. (2014) ‘Causes and consequences of replication stress’, Nature Cell Biology. doi: 10.1038/ncb2897.
Zeng, X. R. et al. (1994) ‘Regulation of human DNA polymerase δ during the cell cycle’, Journal of Biological Chemistry.
Zhao, J. et al. (2000) ‘NPAT links cyclin E-Cdk2 to the regulation of replication-dependent histone gene transcription’, Genes and Development. doi: 10.1101/gad.827700.
Zilfou, J. T. and Lowe, S. W. (2009) ‘Tumor suppressive functions of p53.’, Cold Spring Harbor perspectives in biology.
Zyryanova, A. F. et al. (2018) ‘Binding of ISRIB reveals a regulatory site in the nucleotide exchange factor eIF2B’, Science. doi: 10.1126/science.aar5129.

APPENDIX
117
6 Appendix

APPENDIX
118
APPENDIX FIG 1: Knockdown of ATF4 does not rescue DNA replication impairment upon ISR
(A) U2OS cells were transfected with non-targeting control or ATF4 siRNA (100 nM) then incubated
with 5’-chloro-2’-deoxy-uridine (25 μM CldU, 30 min) followed by 5-iodo-2’-deoxyuridine (250 μM IdU,
60 min) in the presence of 4 μM Thap prior to harvesting for DNA fiber analysis.
(B) Fork progression of cells treated in (A) calculated using the IdU track length. Fork progression
represented as box plots with 5-95 percentile whiskers.
(C) Immunoblot analysis of cells treated in (A) confirming ATF4 knockdown and ISR induction.
HSC70 as loading control.
(D) Cells were transfected with non-targeting control or ATF4 siRNA (100 nM) then incubated with
CldU (25 μM, 30 min) followed by IdU (250 μM, 60 min). BEPP (10 μM) was added to the cells 1 hour
prior to labeling and during labeling with CldU and IdU.
(E) Box plots (5-95 percentile whiskers) showing IdU fork progression (kb/min) of cells treated in
(D).
(F) Western blot confirming ATF4 knockdown and ISR activation of cells treated in (D). HSC70 as
loading control.

APPENDIX
119

APPENDIX
120
APPENDIX FIG 2: ATF4 overexpression does not hinder DNA replication
(A) Cells were transfected with control or ATF4-overexpression plasmid for 24 hours and then
labeled with CldU (25 μM CldU, 30 min) and IdU (250 μM IdU, 60 min) for DNA fiber assay analysis.
(B) Fork progression (kb/min) of cells treated in (A) calculated using the IdU track length. Fork
progression represented as box plots with 5-95 percentile whiskers.
(C) Immunoblot analysis of cells treated in (A) confirming ATF4 overexpression. HSC70 as loading
control.

ABBREVIATIONS
121
7 Abbreviations
°C Degree celsius
µg microgram
µl microlitre
µm micrometre
µM micromolar
4E-BP eIF4E binding protein
5’UTR 5’ untranslated region
AKT Protein Kinase B
ASF1 Anti-silencing function protein 1
ATF3 Activating transcription factor 3
ATF4 Activating transcription factor 4
ATM Ataxia Telangiectasia Mutated
ATP Adenosine triphosphate
ATR Ataxia Telangiectasia and Rad3-related
ATRIP ATR- Interacting Protein
BEPP BEPP-mono hydrochloride
bp Base pair
BSA Bovine serum albumin
Ca2+ Calcium ions
CaCl2 Calcium chlloride
CAF1 Chromatin assembly factor 1
CARE C/EBP-ATF response element
CDC6 Cell division cycle 6
CDK Cyclin-dependent kinase
ABBREVIATIONS
122
CDT1 Chromosome licensing and DNA replication factor 1
CHK1 Checkpoint kinase 1
CHK2 Checkpoint kinase 2
CHOP C/EBP Homologous Protein
CHX Cycloheximide
CldU 5-chloro-2′-deoxyuridine
CreP Constitutive repressor of eIF2alpha phosphorylation
DAPI 4′,6-diamidino-2-phenylindole
DBHQ 2,5-di-tert-butylhydroquinone
DDR DNA damage response
DMSO Dimethylsulfoxide
DNA Deoxyribonucleic acid
dNTP Deoxynucleotide triphosphate
DR5 Death receptor 5
DSB Double strand break
dsDNA Double stranded DNA
dsRNA Double stranded RNA
EdU 5-ethynyl-2'-deoxyuridine
eIF Eukaryotic initiation factor
ER Endoplasmic reticulum
EtOH Ethanol
FACT Facilitates chromatin transcription
FBS Fetal bovine serum
g Gravitational force
GADD34 DNA damage-inducible protein

ABBREVIATIONS
123
GCN2 General control non‐derepressible 2
GDP Guanosine diphosphate
GFP Green fluorescent protein
GRP78 78 kDa glucose-regulated protein
GTP Guanosine triphosphate
h Hour
H2A Histone 2A
H2AX Histone variant 2A.X
H2B Histone 2B
H2O Water
H3 Histone 3
H3K56ac Histone 3 Lysine 56 acetylation
H4 Histone 4
H4K12ac Histone 4 Lysine 12 acetylation
H4K5ac Histone 4 Lysine 5 acetylation
HCl Hydrochloric acid
HCV Hepatitis C virus
HRA Histone regulator A
HRI Haem‐regulated eIF2alpha kinase
HSC70 Heat shock cognate 71 kDa protein
HSP90 Heat shock protein 90
i Inhibitor
IdU 5-iodo-2'-deoxyuridine
IF Immunofluorescence
IRES Internal ribosome entry site

ABBREVIATIONS
124
ISR Integrated stress response
ISRIB Integrated stress response inhibitor
ITAF IRES-transacting factor
kDa Kilodalton
L-Hist L-histidinol
MAPK Mitogen activate protein kinase
MCM Minichromosome maintenance
MEF Mouse embryonic fibroblast
MgCl2 Magnesium chloride
mM millimolar
mRNA Messenger ribonucleic acid (RNA)
mTOR Mammalian target of rapamycin
mut Mutant
NaCl Sodium chloride
ng Nanogram
nM Nanomolar
NPAT Nuclear Protein Ataxia-Telangiectasia Locus
ORC Origin replication complex
ORF Open reading frame
PABP Poly-A binding protein
PBS Phosphate buffer saline
PCNA Proliferating cell nuclear antigen
PERK PKR‐like ER kinase
PFA Paraformaldehyde
Phospho Phosphorylated

ABBREVIATIONS
125
PI3K Phosphoinositide 3-kinase
PIC Pre-initiation complex
PKR Protein kinase RNA-activated or protein kinase R
PP1 Protein phosphatase 1
pre-RC Pre-replication complex
PSMA Prostate specific membrane antigen
RFP Red fluorescent protein
RNA Ribonucleic acid
RNAPII RNA polymerase II
RNaseH Ribonuclease H
RNP Ribonucleoproteins
RPA Replication protein A
SDS Sodium dodecyl sulphate
SDS-PAGE SDS-polyacrylamide gel electrophoresis
SENX Sentaxin
siRNA small interfering RNA
SLBP Stem loop binding protein
SLIP1 SLBP-interacting protein 1
ssDNA Single stranded DNA
TBS Tris buffered saline
Thap Thapsigargin
TNF Tumour necrosis factor
TOP1 Topoisomerase 1
TRAIL TNF-related apoptosis-inducing ligand
Tris Trisamine

ABBREVIATIONS
126
tRNA Transfer RNA
uORF Untranslated open reading frame
UV Ultraviolet
w/v Weight per volume
wt Wildtype
γH2AX Phosphorylated H2AX (S319)

LISTOF FIGURES
127
8 List of Figures
Fig 2.1: The central dogma…………………………………………………………………................ 2
Fig 2.2: Mechanism of cap-dependent translation…………………………………………………... 4
Fig 2.3: Re-initiation of translation…………………………………………………………………….. 6
Fig 2.4: Internal ribosomal entry site (IRES)-mediated translation initiation…………….............. 7
Fig 2.5: The integrated stress response……………………………………………………………… 9
Fig 2.6: eIF2-mediated translational control…………………………………………………………. 11
Fig 2.7: Simplified scheme of eukaryotic DNA replication initiation……………………………….. 15
Fig 2.8: Replication checkpoint………………………………………………………………………... 17
Fig 2.9: Translation of replication-dependent histone mRNAs…………………………………….. 19
Fig 2.10: R-loop formation……………………………………………………………………………... 20
Manuscript Fig 1: DNA replication is compromised shortly after ISR induction………………… 46
Manuscript Fig 2: Pharmacological antagonists of ISR partially rescue DNA replication……… 49
Manuscript Fig 3: Stimulation of the ISR induces R-loops………………………………………… 51
Manuscript Fig 4: Removal of R-loops re-establishes DNA replication upon induction of ISR
but compromises survival of stressed cells…………………………………………………………... 53
Manuscript Fig 5: Ongoing transcription is required for compromising DNA replication by the
ISR………………………………………………………………………………………………….......... 55
Manuscript Fig 6: ISR activation blocks the synthesis of histones required for DNA
replication, reducing chromatin assembly on newly synthesized DNA……………………………. 57
Manuscript Fig 7: Inhibition of histone synthesis induces R-loops which impairs DNA
replication………………………………………………………………………………………………… 60
Supplementary Fig 1: DNA replication is compromised shortly after ISR induction (related to
Manuscript Fig 1) ……………………………………………………………………………………….. 62

LISTOF FIGURES
128
Supplementary Fig 2: Pharmacological antagonists of ISR partially rescue DNA replication
induction (related to Manuscript Fig 2)………………………………………………………………...
64
Supplementary Fig 3: Stimulation of the ISR induces R-loops induction (related to
Manuscript Fig 3)………………………………………………………………………………………... 66
Supplementary Fig 4: Removal of R-loops re-establishes DNA replication upon induction of
ISR but compromises survival of stressed cells induction (related to Manuscript Fig 4)………... 68, 69
Supplementary Fig 5: Ongoing transcription is required for compromising DNA replication by
the ISR induction (related to Manuscript Fig 5)……………………………………………………… 71
Supplementary Fig 6: ISR activation blocks the synthesis of histones required for DNA
replication, reducing chromatin assembly on newly synthesized DNA induction (related to
Manuscript Fig 6)………………………………………………………………………………………... 73−75
Supplementary Fig 7: Inhibition of histone synthesis induces R-loops which impairs DNA
replication induction (related to Manuscript Fig 7)…………………………………………………… 79, 80
Fig 4.1: The ISR impairs DNA replication……………………………………………………………. 82
Fig 4.2: Hypothetical model depicting the role of histone recycling on R-loop formation……….. 94
Appendix 1: Knockdown of ATF4 does not rescue DNA replication impairment upon ISR……. 117
Appendix 2: ATF4 overexpression does not hinder DNA replication…………………………… 119

ACKNOWLEDGEMENTS
129
9 Acknowledgements
I would first like to thank Prof. Matthias Dobbelstein – for this amazing opportunity to work with him
during my PhD. His never ending support and encouragement for his students and staff is inspiring. I
have enjoyed every scientific discussion we have had during our Jour Fixes and I am very grateful to
him always being around to help me with any doubts.
To my thesis committee members, Dr. Halyna Shcherbata and Prof. Steven Johnsen – thank you for
the past 4 years of annual meetings and always being there to provide feedback and valuable input for
my project. I am grateful to Dr. Roland Dosch, Prof. Heidi Hahn, Prof. Dieter Kube and Dr. Nuno
Raimundo, for agreeing to be my extended committee members and taking the time to participate as
my extended examination committee.
Furthermore, I would like to extend my gratitude to the Göttingen Graduate School for Neurosciences,
Biophysics, and Molecular Biosciences (GGNB) and the program Molecular Biology of Cells for
accepting me into their program and graduate school.
In my 4 years here, I have had a great time working in such a fantastic environment and I only have the
members of the 3rd floor of GZMB to thank for that. I especially want to thank the members of the
Molecular Oncology group. I will never forget how welcomed I felt when I first came here for my
interview in February 2015. Everyone was extremely friendly and welcoming and I knew then that
leaving London to do my PhD here was the right move.
Veena Jagannathan – thank you for supervising me in my first few months, teaching me techniques
and guiding me through the project. It made being the ‘newbie’ so much less nerve-wrecking with her
around. To my lab rotation students, Karolin Vossgröne, Stefan Erdelt, Fang Cheng Wong, Jose
Lorenzo Ferrer and Denise Schlösser – thank you all for your contributions to the projects. Moreover, I
would like to thank my office members, past and present – Anusha Sriraman, Ina Klusmann, Florian
Wegwitz, Vijayalakshmi Kari, Simon Baumgart, Robyn Kosinsky, Feda Hamdan, Kester Henningsen
and Joshua Blume. Thank you for making this office such a joy to work in and for your amazing
company over the years. My usual lunchtime comrades − Anusha, Katharina Ewers, Luisa Klemke and
Valentina Manzini. Thanks for making lunchtime at the canteen much more fun and bearable, even
when the food was not always the tastiest.

ACKNOWLEDGEMENTS
130
To the wonderful people I met during my time here, and am lucky enough to call my good friends – Ana
Kutschat, Anusha, Kai Wohlberedt, Lorenz Chua, Madhobi Sen, Merit Wildung, Xin Wang and Zeynab
Najafova. Thank you for being there for me throughout my ups and downs and for making Göttingen so
much more like home. I have thoroughly enjoyed time spent with them both in and outside the lab.
Special thanks to Anusha and Madhobi, the two best friends I did not expect I would get during my
PhD. Thank you for always having my back, for believing in me, for taking me out for good food,
cooking for me and listening to my endless complains. And Kai – for always making me laugh, cheering
me on and for his support. I don’t know what I would have done without them.
I am truly thankful for the friends I have made throughout my life, those I met in school, college and in
university. Special shout out to my support system in London (Akifumi Shibakawa and Marina
Georgiou) and at home (Cindy Yong and Megan Lim) for their encouragement during my PhD.
I would also like to specially thank Ana, Anusha, Justine, Kai, Katharina, Luisa, Madhobi, Merit,
Valentina, Xin and my parents for taking the time to proofread my thesis.
Last but not least, I would like to thank my family for their never ending support. No words can express
the gratitude I have for them. My sister, Justine Choo – thank you for always being there to listen to me,
for giving me great advice, for visiting me in Göttingen, adding on to my great memories here and for
being the best travel buddy I could ever ask for. To my mom and dad – for all their sacrifices while
raising me and ensuring I receive not just a good education, but the best that they can provide despite
all costs. I know it was not always the easiest but thank you, and I love you!