the impact of the european crisis - caritas … to the impact of the crisis as well as austerity and...
TRANSCRIPT

A S T UDY O F T H E I M PA C T O F T H E C R I S I S A ND AU S T E R I T Y ON P E O P L E ,
W I T H A S P E C I A L F O C U S ON
G R E E C E , I R E L AND , I TA LY, P O RTUGA L AND S PA I N
T H E I M P A C T O FT H E E U R O P E A N C R I S I S

Caritas Europa is proud to present this comprehensive, timely and in-depth study on the impacts of theeconomic crisis and austerity policies on the European Union’s most vulnerable people. The Report has a specialfocus on the five EU Member States most-affected by the crisis – Greece, Ireland, Italy, Portugal and Spain. Thereport’s findings are grounded not just in empirical research but most importantly in the practical work carriedout by Caritas member organisations in the five countries.
The report describes very clearly the human impacts of the crisis and of austerity policies, with a specialemphasis on people experiencing poverty and social exclusion. It outlines the responses of Caritas organisationsin the five countries as they try to help those who have been worst affected by the crisis. The findings of thereport demonstrate beyond any doubt that austerity measures are impacting very negatively on the lives ofpeople in poverty, and driving many more into poverty for the first time.
I hope that this report will not only provide timely information on a worsening situation, but also serve as atool for European and national decision makers in their attempts to identify more appropriate policy responsesto deal with the crisis. Caritas Europa and its member organisations across Europe wish to work in partnershipwith the EU institutions and national governments to develop effective and socially just approaches tomanaging the crisis and promoting recovery in Europe.
I want to express my deepest gratitude to Caritas Europa member organisations in Greece, Italy, Portugal andSpain, for the research and analysis which they contributed to this report. A special acknowledgement goes tothe team of Social Justice Ireland, and to its Director Fr. Séan Healy, who provided the overall analysis as wellas an analysis of the situation in Ireland, and also prepared the full version of the Report.
Jorge Nuño-MayerSecretary General Caritas Europa
A Caritas Report prepared by Social Justice IrelandAnn Leahy, Seán Healy, and Michelle Murphy
Social Justice Ireland wishes to specially acknowledge the assistance it received from Caritas member organisations inGreece, Ireland, Italy, Portugal and Spain in the preparation of this study. The Trojan work they are doing in their countriesin responding to this current crisis is clear to be seen in the following pages.
Preface
This publication is financed by the INCLUSION II Project under the PROGRESS Programme.PROGRESS (2007-2013) is the EU programme for Employment and Social Solidarity, set up to provide financial support for contributing to the implementationof the Europe 2020 Strategy. For more information see: http://ec.europa.eu/progress.The content of this publication is the sole responsibility of Caritas Europa and can inno way be taken to reflect the views of the European Commission.

Preface
Executive Summary 04
Part 1 | The European Crisis 06Introduction 07
Causes of the Crisis 07
Official Responses to the Crisis 08
Key Economic and Social Impacts 10
Outlook 12
Part 2 | Impact of the Crisis on Five European Countries 13
Introduction 14Background – Government Budgets 14
Welfare Systems 14
Statistical Issues 15
Greece 16Background and Government Finances 16
Policy Responses 17
Employment/Unemployment 18
Poverty 19
Discussion: Impacts on Vulnerable Groups 20
Ireland 22Background and Government Finances 22
Policy Responses 23
Employment/Unemployment 24
Poverty 25
Discussion: Impacts on Vulnerable Groups 26
Italy 27Background and Government Finances 27
Policy Responses 28
Employment/Unemployment 28
Poverty 29
Discussion: Impacts on Vulnerable Groups 30
Portugal 32Background and Government Finances 32
Policy Responses 33
Employment/Unemployment 34
Poverty 34
Discussion: Impacts on Vulnerable Groups 35
Contents

Spain 37Background and Government Finances 37
Policy Responses 38
Employment/Unemployment 39
Poverty 39
Discussion: Impacts on Vulnerable Groups 40
Part 3 | The Caritas Response 42
Programmes and Initiatives of Caritas Member organisations 43Caritas Member Programmes – Responding to the Crisis 45Challenges Faced 48
Part 4 | Conclusions and Recommendations 49
General trends 50
Main conclusions 51
Recommendations 511. European Institutions 52
2. National Governments and relevant Local/Regional Authorities 53
3. Non-Governmental Organisations – Non for profit Social Services Providers 55
Role and Commitment of Caritas 55
References 57
Appendices 60Appendix 1 Gross Debt, Greece, Ireland, Italy, Portugal, Spain 60
Appendix 2 Government Deficit/Surplus 2004-2011, Greece, Ireland, Italy, Portugal, Spain 60
Appendix 3 Poverty Rates according to Four different Indicators – Greece, Ireland, Italy, Portugal, Spain 61
Appendix 4 At Risk of Poverty Rates, EU27 62
Appendix 5 At Risk of Poverty Thresholds, Greece, Ireland, Italy, Portugal, Spain 62
Appendix 6 GDP Growth Rates, 2003-2013, Greece, Ireland, Italy, Portugal, Spain 62
Appendix 7 Unemployment, September 2012, EU27 62
Appendix 8 Job Guarantee Schemes 63

FIGURE 1 Employment, Greece and the EU Average, 2006-2011 18
FIGURE 2 Greece: Poverty Indicators: PAROP, SMD and VLWI (%), 2003-2010 19
FIGURE 3 Employment Rate, Ireland and the EU Average, 2006-2011 24
FIGURE 4 Ireland, Poverty Indicators: PAROP, SMD, VLWI, 2003-2010 25
FIGURE 5 Employment Rate, Italy and the EU average, 2006-2011 28
FIGURE 6 Italy: Poverty Indicators: PAROP, SMD, VLWI, 2004-2010 29
FIGURE 7 Employment Rate, Portugal and the EU average, 2006-2011 34
FIGURE 8 Portugal, Poverty Indicators: PAROP, SMD, VLWI, 2003-2011 35
FIGURE 9 Employment Rate, Spain and the EU Average, 2006-2011 39
FIGURE 10 Spain: Poverty Indicators: PAROP, SMD, VLWI, 2003-2011 39
TABLE 1 Greece: Headline Government Debt Rates 16
TABLE 2 Greece: Real GDP Growth 17
TABLE 3 Greece: Unemployment Headline Statistics 18
TABLE 4 Ireland: Headline Government Debt Rates 22
TABLE 5 Ireland: Real GDP Growth Rate 23
TABLE 6 Ireland: Unemployment Headline Statistics 24
TABLE 7 Italy: Headline Debt Figures 27
TABLE 8 Italy and EU average: GDP Growth Rates 27
TABLE 9 Italy: Unemployment Headline Statistics 29
TABLE 10 Portugal: Government Debt Rates 32
TABLE 11 Portugal: Real GDP Growth Rates 33
TABLE 12 Portugal: Unemployment: Headline Statistics 34
TABLE 13 Spain: Government Debt Rates 37
TABLE 14 Spain: Real GDP Growth Rates 38
TABLE 15 Spain: Unemployment Headline Statistics 39
Figures and Tables

developments in relation to employment and unemployment,and in relation to poverty looking at various indicators andlooking at some affected groups in more detail. We finish thesection on each country with a discussion of the impact onvulnerable groups, including some observations by Caritasmember organisations on their first-hand experience ofsupporting them.
Part 3 | The Caritas Response
In this section, we look in more detail at the experience ofCaritas member organisations in the five countries and outlinesome of the projects that they have undertaken to support thepeople that they serve. The organisations work in differentcontexts and in different ways, but their accounts of theirwork help to illustrate on the problems that ordinary peopleface. A common theme is the increasing calls that are made onCaritas member organisations for basic supports and the waysin which they are having to develop and innovate to addressthis.
Part 4 | Conclusions and Recommendations
The background to the crisis is different in each of the countriesand it has impacted and evolved differently in each. This meansthat there are both similarities and differences observablebetween the countries in the impact on vulnerable people.
Before concluding, we draw out some general trends across thefive countries as well as referencing some dissimilarities. Thecountries have in common:
5 High levels of unemployment, that, in four of the fivecountries are well above the European average;
5 Very high youth unemployment levels in all five countries,and marked increases within the past year in mostcountries;
5 Long-term unemployment high in all countries and a veryhigh proportion of those who are unemployed are long-term unemployed, indicating that the problem is becomingstructural;
5 Increases in income poverty in most of the countries, withchildhood poverty a particular problem in each and showingan increase in all countries since 2007.
Many of the countries have gaps in their welfare systems thatleave certain groups – often casual or atypical workers or thosewho reach the end of finite unemployment payments – inextreme difficulty. Strong traditions of family support that are afeature in each country are being severely tested in many cases.
This report looks at the impact of the economic crisis and atthe policy measures taken to address it focusing on fivecountries that have been severely affected – Greece, Ireland,Italy, Portugal and Spain. While the phrase ‘protecting thevulnerable’ has been part of the terminology used nationallyand internationally relating to the measures undertaken since2008, Caritas member organisations in these five countries aredaily trying to support people who are increasingly vulnerabledue to the impact of the crisis as well as austerity andstructural measures. The report is written in the knowledgethat the authorities have choices in deciding what policyapproaches to use and how measures are targeted – in otherwords, who should pay most – and recommendations aremade in Part 4 for alternative policy approaches.
Part 1 | The European Crisis
Part 1 starts with a general overview of the causes of the crisisin Europe, the official response to it, its impacts on Europe as awhole and the outlook for the future. Some of the facts set outhere present a picture of a Europe in which social risks areincreasing, social systems are being tested and individuals andfamilies are under stress. The picture is one of a very sharp dropin employment, and consequent increases in unemploymentparticularly affecting younger people; growing levels of long-term unemployment, which is becoming structural; high levelsof poverty, including childhood poverty, a deepening of povertylevels and reductions in access to essential services. Overall,economic sentiment in Europe is considered to be at its lowestlevel in years, and growth projections have been increasinglydowngraded during the year 2012 by international bodies suchas the International Monetary Fund (IMF). The IMF is now ofthe opinion that cutbacks have had a larger than expectednegative impact on output, and are recommending thatEuropean policy-makers gradually ease financial conditionsfurther in the periphery economies.
The section concludes that, while austerity may be necessary insome situations where people or societies have been livingbeyond their means, the prioritization of austerity measures tothe virtual exclusion of other responses will not solve the crisis.
Part 2 | Impact of the Crisis on FiveEuropean Countries
Here we look in detail at the position of the five countries,sketching briefly the background to the crisis in each andlooking at their current public debt levels and their recent andprojected estimates for growth in GDP. We go on to referencethe kinds of policy-measures introduced, and examine
ExecutiveSummaryFocus of the Report
Main conclusions
5 The evidence presented in this report shows that thePolicy of Prioritising Austerity is Not Working and analternative is required. The approach of imposing austeritymeasures and structural reforms aimed at reducinggovernment borrowing and the debt/GDP ratio within ashort number of years is not working in economic terms.Simultaneously, it is putting the social cohesion of Europeand the very political legitimacy of the European Union atrisk.
5 Fair Solution to the Debt-crisis must be found: The recentEU agreement to recapitalise Spanish banks without addingto sovereign debt (June 2012) recognises that makingtaxpayers responsible for the massive debts of their banksis unsustainable. Turning banking debt into sovereign debtmust be recognised as unfair and unsustainable for allaffected countries and a fairer burden-sharing approachadopted.
5 Despite rhetoric to the contrary there is currently a failureto integrate economic and social policies, and a lack of alonger-term commitment to an inclusive society, which inturn is necessary to building a sustainable economy. Thepeople paying the highest price currently are those who hadno part in the decisions that led to the crisis, and thecountries worst affected are amongst those with thebiggest gaps in their social protection systems so theirwelfare systems are least able to protect their vulnerablepopulations. This process is unfair and unjust.
Part 4 goes on to propose a series of recommendations aimed at(1) The European Institutions and the Commission, (2) NationalGovernments, and (3) Non-Governmental Organisations. Theserecommendations are made include the following:
European Institutions and EU Commission5 Provide Leadership in relation to Groups at particular Riskof Poverty,
5 Ensure an adequate social dimension to the Europe 2020Strategy process for all countries,
5 Introduce Social Monitoring for Countries in EU/IMF Pro-grammes,
5 Ensure that the 2014-2020 Structural Funds will play a biggerrole in addressing poverty,
5 Lead on Policy-development and Monitoring of Child Poverty,5 Provide Leadership in Respect of Youth Unemployment,5 Ensure the involvement of Civil Society in Governance.
National Governments and relevant LocalRegional Authorities5 Strengthen Welfare Systems,5 Strengthen Essential Services,5 Poverty Proof All New Measures,5 Use Appropriate Labour Market Active Inclusion Measures,5 Frame any further measures such that those who can affordto do so actually do pay more,
5 Consider how Government could become an employer oflast resort,
5 Ensure the involvement of Civil Society in Governance.5 Introduce Better Monitoring and Planning.
Non-Governmental Organisations5 Accompany and help people in need; provide services forsocial and active inclusion,
5 Give a Voice to People Experiencing Poverty or Social Exclusion,5 Document Increases in Service Use,5 Work for Social Change,5 Work to Influence Decision-Making.
Part 4 concludes with some comments on the role andcommitment of the Catholic Church.
As is clear from Part 1 of this report, the crisis in Europe andthe official response to it is leaving the peripheral countries inEurope in a double bind. By cutting expenditure in an attemptto reach the targets set for the debt to GDP ratio, they loserevenue. This, along with interest payments and higher socialcosts due to rising unemployment, makes their growth difficultif not impossible. Furthermore, commentators like the IMF arenow noting an impact (or ‘spillover effect’) from the peripheryto the rest of Europe and, indeed, that Europe’s low growthand uncertainty is also affecting emerging markets.
The recommendations in this report also have wider implicationsbeyond the five countries considered, and this is clearly the casegiven that two of Europe’s largest economies (Spain and Italy) areincluded in the analysis. The report’s recommendations point tonew approaches to addressing the problems of Europe that areboth socially just and sustainable. All countries need to recognisethat just as social and economic development are interlinked,and in fact are two sides of the same coin, so pursuing austeritymeasures alone will not solve the crisis in Europe. Insteadausterity is putting social cohesion and the very future of theEuropean Union at risk.
T H E I M P A C T O F T H E E U R O P E A N C R I S I S C A R I T A S R E S P O N S E T O A U S T E R I T y 05

THE EUROPEANCRIS I S
Part 1

T H E I M P A C T O F T H E E U R O P E A N C R I S I S C A R I T A S R E S P O N S E T O A U S T E R I T y 07
The economic crisis of 2007/8 and the austerity measures thatfollowed it aimed at reducing government budget deficitswere always going to impact on the incomes and the relativepositions of different income groups. While the generalrecession affects incomes (due to reductions in marketincomes, increasing unemployment and underemployment),the authorities also have choices in deciding what policyapproaches to use and how measures are targeted – in otherwords, who should pay most. The mantra ‘while protecting thevulnerable’ has been used repeatedly in the surveillanceprocedures of the IMF and of the European bodies involved inadvising on and enforcing measures intended to address thecrisis. But in practice, Caritas member organisations across the‘peripheral’ nations witness poverty, unemployment, exclusionand distress amongst increasing numbers of people who relyon their services.
The human cost of the crisis is impossible to assess fully atthis stage as its impact is still unfolding with wave after waveof ad-hoc crisis driven measures and a series of structuralmeasures being implemented in each country. By examiningrecent trends in employment, unemployment, poverty rates,severe material deprivation and low work intensity in fivecountries severely affected by the crisis, (Greece, Ireland, Italy,Portugal, and Spain) it is hoped that this report can contributeto more awareness of the impact on more vulnerable groups,and of alternative policy approaches that could be taken by
the authorities to alleviate its worst effects. We also hopethat the conclusions and recommendations outlined here,which flow from this analysis concerning alternativeapproaches and different choices Governments could make,will be taken aboard by the decision-makers concerned andacted upon so as to alleviate the extraordinary levels ofsuffering which have been imposed unfairly on large numbersof people in the period since 2008.
Parts Two and Three include accounts from the five countriesconcerned of the first-hand experience of people directlyaffected by the crisis from Caritas organisations, as well assome of the measures they undertake to alleviate the problemsthey encounter. Caritas organisations are on the ground inthese countries and address the challenges being faced bythose who are vulnerable on a daily basis. Their work rangesfrom the provision of basic necessities to the poorest to theprovision of detailed analysis of the causes of problems andtheir likely solutions. They provide a unique perspective thathas much to offer to policy makers at local, regional, nationaland EU-wide levels.
Here we look, briefly, at the overall causes of the crisis and atthe official response of the main institutions concerned. Wethen look at its key economic and social consequences forEurope and at the outlook for the future.
Introduction
The crisis evolved in different ways in each European countrydepending on a wide range of local circumstances. In thisgeneral introduction it is not possible to discuss in detail thecourse it has taken in each of the five countries underconsideration. Instead we attempt to outline the broadercontext of the background to the crisis.
Nobel prize-winning economist Joseph Stiglitz has characterizedthe global financial and economic crisis as likely to be thedeepest and longest economic downturn since the GreatDepression that followed the financial crash of 1929. Hedescribes it as having been caused by bad regulation and badfinancial practices in the US, which affected the entire world(2009). Stiglitz attributes this lax monetary policy and weakregulation of banks and financial institutions to an effort toboost demand in order to keep the economy going – so poorpeople who had no money were encouraged to keep spending
and a massive debt finance bubble enabled them to do so. Theunderlying cause of the lack of spending by poorer people,Stiglitz attributes to a rise in inequality over the past 30 years:
‘In effect, we have been transferring moneyfrom the poor to the rich, from people whowould spend the money to people who do notneed to spend the money, and the result ofthat is weaker aggregate demand’
(Stiglitz, 2009, p 7)
The massive expansion and lax regulation in the banking andfinance sector whose implosion was the trigger for the globalcrisis in 2008, and indeed the rise in inequality that Stiglitzrefers to, is associated with economic theories and policies
Causes of the Crisis

T H E I M P A C T O F T H E E U R O P E A N C R I S I S C A R I T A S R E S P O N S E T O A U S T E R I T y08
that arose in the 1970s which can be described as marketliberalism policies (Quiggin, 2011). These policies, based on abelief that free markets are efficient,1 involved
5 removing state controls on the growth, use and flow ofcapital, and
5 redistribution of income from the poor and middle classesto the rich (Healy et al, 2012).
The first led to ‘financialisation’ which involved the creation ofnew and complex financial products and to the lowering ofinterest rates which led to increased investment in thefinancial world itself and in property – and in turn led to hugeprice increases and a property bubble in the US and elsewhere.The bursting of the bubble in 2008 exposed the huge risks thathad been taken with lending and the precarious state of theworld’s financial institutions.
The second tenet is based on the famous ‘trickle down’approach which assumes that policies that benefit the wealthywill eventually benefit everyone. The evidence does notsupport that hypothesis, however. As Quiggin points out, most
of the benefits of economic growth in the US, for example,went to the top 1% of people; by 2007, the top 1% in the USwere receiving nearly ¼ of all personal income, more than thebottom 50% put together (2011).
As Joseph Stiglitz concludes (2009), the problem is that thesystem is now broken, because it was based on consumersspending beyond their means by excessive borrowing,something that cannot continue. That is not to say, however,that lessons have been learned. As Quiggin argues, the concernof policy-makers has been to restore the pre-crisis ‘normalcy’as rapidly as possible, noting that, as the crisis has continued,the focus of attention has turned away from the obviousfailures of financial markets and toward the alleged failures ofgovernment (2011).
Other commentators point to fundamental problemsunderlying the world’s economic development model that thecrisis has thrown into relief and that measures taken to datewill not address, pointing to the need for more radicalapproaches aimed at producing a fairer and more just solution(Healy et al, 2012).
1 That is, the idea that prices generated by financial markets are the best possible estimate of the value of any investment (Quiggin, 2011)
Europe has taken a series of measures in response to thevarious stages and escalations of the crisis aimed at protectingits weaker economies against pressures from the bondmarkets.
Chief amongst them has been a determination that no bankshould fail and that the issue of budget deficits will berectified by the imposition of austerity measures andstructural ‘reforms’. The need for fundamental reform ofbanking worldwide is accepted by many although rejected bysome. The overall approach reflects the view that cuts inbudget deficits will ‘promote ‘business confidence,’ particularlyif they are achieved through reductions in expenditure’(Quiggin, 2011).
The European Central Bank, in particular, has taken the viewthat if banks defaulted there would be a serious risk ofcontagion. Of course, contagion has not been contained,despite this approach, as lack of market confidence becamean issue in one country after another and the focus of thecrisis moved from Greece, to Ireland, Portugal and morerecently Spain and Italy. Nor has the approach ensured thatbanks are working well – in the sense of making credit
available appropriately. The IMF, for example considers thatthe forces hampering growth in advanced economies are‘fiscal consolidation and a still-weak financial system’ (2012f,p xv).
This approach has meant that in a country such as Ireland, forexample, burden sharing with bond-holders has not beenpermitted. Revisions to the blanket bank guarantee originallyput in place by the Irish government in 2008 have not beenallowed and no ‘haircuts’ have been taken by the internationallenders who lent to Irish banks. Instead the responsibility forpaying the debts of private banks has been moved to the State,and consequently to tax-payers and ordinary people (who didnot cause the problems in the first place). To achieve this aseries of tax hikes and cuts in public expenditure were agreedwith the IMF, the European Commission and the EuropeanCentral Bank equivalent to 18.5% of the GDP forecast for 2015which has been directly removed by government from theeconomy.
However, since June of this year when Spain, with an economyconsidered ‘too big to fail,’ was confronted with a similarbanking crisis to that of Ireland, another approach is in
Official Responses to the Crisis

T H E I M P A C T O F T H E E U R O P E A N C R I S I S C A R I T A S R E S P O N S E T O A U S T E R I T y 09
contemplation (for Spain and Italy at least) enabling banks tobe recapitalized without adding to sovereign debt (IMF, 2012f,p. xvi). Furthermore, there has been some burden-sharing withbondholders in the case of Greece. So, at the June 2012summit, and in response to the escalating problems in Spain,European leaders agreed to start work on a banking union anda single supervisory mechanism (the European StabilityMechanism or ESM). Once established this would allow thepossibility of the ESM taking direct equity stakes in banks. Asthe IMF put it, ‘this is critical because it will help break theadverse feedback loops between sovereigns and banks’ (2012f).
The other part of this approach has focused on austeritymeasures and structural reforms aimed at bringingGovernment deficits and gross debt down to the levelspermitted in the Stability and Growth Pact – and doing sowithin a short number of years. The two major rules on thelevel of government debt and deficits are:
5 Government deficit must not be more than 3% of GDPexcept in particular circumstances,
5 Government debt must not be more than 60% of GDP.
The Stability and Growth Pact came into force in 1998, but itsenforcement has always been problematic. It was amended anumber of times since then, notably in December 2011 withthe so-called ‘Six Pack,’ requiring stricter application of thefiscal rules and sanctions for non-compliance. Some see thesemoves as arising from a policy of ‘institutionalizing austerity’(Quiggin, 2011).
Most recently all but two EU member States have agreed tothe Treaty on Stability, Coordination and Governance in theEconomic and Monetary Union. As a result there will be a‘deficit-brake’ and a ‘debt-brake’ and sanctions for a breach.This involves a balanced-budget rule as part of nationalconstitutions or laws, and external oversight by the EuropeanCommission, which will involve less discretion for nationalgovernments over fiscal policy than formerly. Only thosecountries who have signed up will be able to access thepermanent bailout European Stability Mechanism (ESM).
Each of the countries that are the subject of this report areworking to reduce their deficit levels to under the Stabilityand Growth Pact target of 3 % of GDP through measuresaimed at increasing government revenue and cuttingexpenditure. For all countries, but especially the ‘programme’countries (Greece, Ireland, Portugal) there is a lot at stake inthis process as their debt levels are such that they have largelylost their ability to raise money on the markets.
Strict and short time limits for achieving these targets havebeen set and reset as they have not been reached (as will beevident from Part Two, below). The reality is that the countriesare, for the most part, in a double bind. Despite highunemployment, governments are attempting to reach thetargets set by the European Stability and Growth Pact byimplementing policies that serve to deepen the recession. Theylose revenue as they cut spending, which, along with interestpayments, makes it impossible to cut deficits or to reduce themsufficiently. With GDP falling, the 3% deficit target reducesalso in monetary terms, making it harder and harder to reach.While it is acknowledged that some austerity is required toreduce excessive spending and ensure government’s get bestvalue for the money they spend many experts believe that theEurozone’s current focus on cutting as much spending aspossible will not solve the crisis (Menendez, 2012).
Even the IMF is now acknowledging that cutbacks have hadlarger than expected negative multiplier effects on output.They have recommended that European policy-makersgradually ease financial conditions further in the peripheryeconomies (IMF, 2012f, p xvii, 1).
All the countries that are the subject of this report havecommitted to the Europe 2020 Strategy with its aim offostering inclusive growth, and its targets in areas likeimproving educational attainment and reducing poverty2. TheEurope 2020 strategy requires the submission of annualNational Reform Programmes by member states setting outtheir progress towards achieving its targets to which theCommission responds with recommendations. However, statesthat are subject to an EU/IMF programme are not required tosubmit a separate National Reform Programme (Frazer &Marlier, 2012). Thus it is of concern that, where programmecountries are concerned, the focus appears to have beenremoved from the social targets of the 2020 Strategy. In thecase of Ireland, for example, the July 2011 country-specificrecommendations from the Commission refer only tofulfilment of the loan agreements entered into under its‘bailout’ package,3 which do not of course contain socialobjectives.
This divergence from efforts to meet the objectives of theEurope 2020 Strategy points to a lack of policy coherence ata European level. It is hard not to agree with thosecommentators (such as Frazer & Marlier, 2012)who areconcerned that economic priorities have taken precedenceover social priorities, at least in so far as the ‘programme’countries are concerned.
2 The EU 2020 Strategy was adopted in 2010; it aims to turn the EU into a ‘smart, sustainable and inclusive economy delivering high levels of employment, productivity and socialcohesion’ (European Commission, 2010, p. 5). Its targets aim, amongst other things, to reduce poverty, raise employment, and raise educational levels.
3 ‘Implement the measures laid down in the Implementing Decision 2011/77/EU, as amended by Implementing Decision, 2011/326/EU, and further specified in the Memorandum ofUnderstanding of 16 December 2010 and its update of 18 May 2011.’

T H E I M P A C T O F T H E E U R O P E A N C R I S I S C A R I T A S R E S P O N S E T O A U S T E R I T y10
The 2008 financial crisis led to the most serious economicrecession that the European Union has faced. The EU has againbeen in recession or on the verge of it since late 2011. BothGDP and employment rates were down for the EU over theyear to Quarter 2, 2012 (that is, EU27). The decline was -0.2%in the case of employment, and -0.3% in the case of GDP(European Commission, 2012, p. 5). The fall in economic activitywas associated with a decline in domestic demand andinvestment, cushioned somewhat by increased exports. However,weakening global demand is also holding back exports. Thedecline in GDP in Europe is associated by the Commission withnegative effects of fiscal consolidation, as well as a weakerinternational environment and a further loss of confidence(European Commission, 2012, p 10). Meanwhile governmentdebt is increasing. It stands at an average of 84.9% of GDP inEU27 and at a 90% average in the Euro area (Eurostat, 2012L).
Looking at the rates for quarter 2, 2012, Eurostat concludedthat even in Europe’s five largest economies (Germany, France,Italy, Spain and the UK) growth was weak or negative(Eurostat, 2012p, p5). Short-term perspectives are consideredvery uncertain for Europe.
The latest review by the European Commission of theemployment and social situation concludes that social risksare increasing (European Commission, 2012, p 5).
Amongst the most serious social consequences of the crisis arethose related to young people given their high levels of
unemployment (see below) and detachment from the labourmarket since 2008, which may have lasting adverse effects ontheir prospects. The European Commission describes the issueas ‘the most urgent social matter of our times’ (EuropeanCommission, 2012, p 26). It is envisaged that this maydeteriorate further leading to poverty and social exclusion andother social challenges (European Commission, 2012, p 25). Forsociety there is also the risk of ‘losing the productive talents ofa whole generation’ (European Commission, 2012, p 25).
Long-term unemployment is another important consequenceof the crisis, because it means that unemployment is becomingstructural, and this militates against skills retention. At anindividual level it militates against re-entering the labourmarket and it also adversely affects self-esteem and health(the Social Protection Committee 2012, p. 24).
One of the problems of the current austerity measures beingimplemented across Europe is that measures that result inshort-term saving can have very negative longer-termconsequences. Governments need to make assessments ofwhat the long-term impacts of the cuts to welfare andservices are in areas such as education, health and social care.
These are amongst a number of very negative trends that areclearly identifiable in Europe in areas like employment andunemployment, poverty and incomes and essential services.Some key facts relative to these areas are as follows:
5 Unemployment has reached a historically high level of25.7million people or 10.6% of the labour force in September2012 (EU27), a rise of 2.1 million within one year (Eurostat,2012n),
5 In addition to those classified as unemployed, an additional19.5million people (aged 15-74) were identified in the EUin 2011 as underemployed or a potential additional workforce4
(European Commission, 2012),5 Long-term unemployed people reached 10.7million (Q1,2012) roughly twice the figures seen in mid-2008 meaningthat two out of five unemployed people in the EU are onaverage likely to remain unemployed for more than one year,a trend likely to continue (European Commission, 2012);
5 The youth unemployment rate (under 25s) is 22.8%,representing 5.5million young people in EU27 (September 12)5
Employment/Unemployment
(Eurostat, 2012n), with the greatest losses having occurred infull-time and permanent jobs, and with a rise of youngpeople neither in employment nor in education (NEETs)(European Commission, 2012),
5 The employment situation of migrants from third countrieshas worsened due to the crisis, and their unemployment rate(22.1%) stands at more than twice the rate for EU nationals(Quarter 1, 2012) (European Commission, 2012, p 27),
5 Disparities have widened between member states with agap of over 20 percentage points in the unemployment ratebetween the lowest rate (Austria) and the highest (Spain),an all time record since harmonised statistics exist (EuropeanCommission, 2012).
Key Economic and Social Impacts
4 This means that they are either part-time workers who are underemployed, or they form a category between unemployment and inactivity who are available for work but not seekingit or seeking work but not immediately available
5 With a higher rate for young men than young women (23. 2%, men; 21.7%, women) as of July 2012 (European Commission, 2012, p 23)

T H E I M P A C T O F T H E E U R O P E A N C R I S I S C A R I T A S R E S P O N S E T O A U S T E R I T y 11
5 23.4% of the EU population ( 115.7million people ) were atrisk of poverty or social exclusion in 20106 an increase ofnearly 2 million since 2009 (Eurostat, 2012c),
5 When the at risk of poverty measure is considered, the shareof people living below the 40% threshold (that is, peoplewho are the poorest of the poor, living with less than 40%of the median income) has been increasing since 2008 (TheSocial Protection Committee, 2012, p. 13),
5 With a rate of 26.9% in 2010 (EU27), children were at agreater risk of poverty or social exclusion than the rest ofthe population in 21 of the 25 member States for whichdata are available (Eurostat, 2012u); According to theEuropean Commission Social Protection Committee, childpoverty is becoming more of an issue and is likely to worsenfurther, something liable to affect the life-chances of thoseaffected and their potential as adults, and to have a directimpact on both the economic and social future of Europe(The Social Protection Committee, 2012, p 19),
5 The rate of poverty for those who are working is a problemacross Europe and the average rate has increased slightlybetween 2010 and 2011 (8.7%, EU27 average, 2011) (Eurostat,
Income / Poverty
2012g); the rate for those who are the least well educated(that is, with lower secondary education or less) has increasedmore, and has gone from 16.3% (in 2010) to 18.1% (in 2011)(Eurostat, 2012v),
5 Inflation is rising faster than GDP and the main items drivinginflation upwards in 2011 have been food, commodity pricesand energy, which will disproportionately affect low-incomehouseholds (Social Protection Committee, 2012, p 6),
5 The share of the EU population reporting that theirhouseholds are experiencing financial distress remainshistorically high; in households with the lowest incomequartile (that is, the bottom 25%), the share of peopleexperiencing financial distress has increased further inrecent years in the majority of Member States and wasobserved to increase sharply in early 2012 (EuropeanCommission, 2012, p. 5, 29).
5 European citizens perceive rising inequalities and viewthis trend as a problem that goes beyond nationalities(Eurobarometer, 2011 cited in the Social ProtectionCommittee, 2012, p 27).
5 For many countries austerity measures are leading to acontraction or lowering of quality in public services that areparticularly important for people at risk of poverty or socialexclusion (Frazer & Marlier, 2012).
5 In many countries healthcare systems are under pressure toreduce costs, and access to essential health and socialservices has worsened during the crisis, according to arecent Eurobarometer study showing that some peoplereport facing difficulties in accessing healthcare8 (The SocialProtection Committee, 2012, p. 6, 41).
5 Cuts in social spending have a strong impact on theavailability of social and health support services to thepublic, especially to disadvantaged groups (The SocialProtection Committee, 2012, p. 45).
5 According to UNICEF’s major report on child poverty, it isevident that front-line services for families are everywhereunder strain as austerity measures increase the numbers inneed while depleting the services available (UNICEF, 2012,p. 49)
Access to Essential Services7
5 Despite the fact that the collapse of the housing boom wasthe trigger for the economic crisis in several countries, theEU Network of Independent Experts on Social Inclusionconcludes that policies in relation to housing andhomelessness have not been strengthened during the pastyears and most consider that they have been weakened(Frazer & Marlier, 2012, p 5).
There is, however, some evidence that some social protectionsystems, particularly pension systems, have met their functionas automatic stabilisers in a number of Member States10
(Social Protection Committee, 2012, p 21). This seems to bethe case at least in the early years of the crisis and at least in-so-far as it is possible to assess this on the basis of availableEurostat data on poverty. This has occurred notwithstandingthe fact that pensions have not increased and have remainedlargely unchanged due to the crisis (The Social ProtectionCommittee, 2012, p 20). Also, it is not the case in all countries– in Greece, for example, pensions have been subject to a
6 See Glossary or see Part Two for a discussion of the term ‘at risk of poverty or social exclusion’
7 For example, health, education, social care, support to families, older people, people with disabilities and long-term care
8 32% of European citizens say it is more difficult to afford general healthcare, 38% say it is more difficult to afford childcare, and 40% say it is more difficult to afford long-term care(cited in The Social Protection Committee, 2012, p 6)
9 This report contains a great deal of information on child poverty drawn mainly from 2009 statistics
10 Although it is also notable that there are lower pension entitlements in many countries for women due to short or non-existent working careers

T H E I M P A C T O F T H E E U R O P E A N C R I S I S C A R I T A S R E S P O N S E T O A U S T E R I T y12
series of cuts at all levels of income and the at risk of povertyrate for over 65s has increased (see Part Two).
Notwithstanding this, there is no room for complacencyrelative to poverty in older age, as pension systems changeand more people are exposed to market risks. The Council ofthe European Union has highlighted how the longer-termimplications of the crisis could be very serious for futurepensioners as the exposure of private pension schemes to thevolatility of financial markets becomes manifest. This, theyargue, requires policy-makers and regulators to promote moreprudent approaches to pension provision (2010).
The European Commission points out a difference between thefirst phase of the crisis (up to 2009) and the second phase
since then. The welfare system and the taxation systemsplayed a stronger role in protecting household incomes in thefirst phase, but cuts in benefits and increases in taxes haveeroded that protection since 2009 in those countries wherethe recession is prolonged (European Commission, 2012, p 38).
The Social Protection Committee considers that, as long-termunemployment as a share of total unemployment rises andunemployment benefits run out, there is now a risk of seeinga significant decline in disposable income, especially for low-earners. Considering too that their propensity to consume ishigh (meaning that they must spend their incomes rather thansave or invest them) this may have a long-term impact ondomestic demand and on overall economic performance (TheSocial Protection Committee, 2012, p 15).
The EU Commission (2012) considers that overall economicsentiment in Europe is at its lowest level in years. Recentforecasts from the IMF, the European Central Bank (ECB) andthe Organisation for Economic Cooperation and Development(OECD) are also pessimistic and forecasts have been furtherdowngraded.
The IMF World Economic Outlook report, October 2012, reviseddown its growth forecasts from those of only a few monthspreviously (IMF, 2012f). As they see it, in advanced economieslike the US and Europe, growth is now too low to make a dentin unemployment. And what is most affecting growth isfinancial consolidation and the weak banking/fiscal system.The recession in most of the ‘periphery’ countries in Europe isspilling over into the rest of Europe. According to a senior IMFofficial, even core Euro countries, including France andGermany, face similar problems on a more limited scale. Eventheir economic growth is forecast to be low: 1% for Germany,0.3% for France in 2012, and a bit higher for both in 2013(Blanchard, 2012). Low growth and uncertainty are alsoaffecting emerging markets.
So far, the focus of the European Institutions has been on eachof the peripheral countries reaching the Stability and GrowthPact deficit target of less than 3% of GDP. But, even assumingthat is reached, the overall debt reduction target of theStability and Growth Pact will also have to be attained (thatis, 60% of GDP for gross government debt). This means thereis a prospect of very long-term austerity measures, with itsattendant dampening of overall growth. Given the high levelsof child poverty, youth unemployment and long-termunemployment in Europe generally and, in particular, in the
countries under review in this report (see Part Two), this couldbe a recipe not just for one lost generation in Europe, but forseveral lost generations. European Leaders need to present along-term vision for how this is to be avoided, and how,instead, inclusive growth is going to be fostered.
A former senior IMF official has written that after a decade ofausterity the debt ratios of Greece, Ireland, Italy, Portugal andSpain, Europe’s five most heavily indebted countries, willremain at debt levels which leave them vulnerable until atleast 2017 (that is, with debt levels greater than 100% of GDP)(Mody, 2012). He believes that the debt ratios will rise furtheras the full extent of the austerity-induced damage to growthbecomes evident. He also thinks that growth will remain‘throttled’ and debt ratios high.
He concludes that perpetual austerity is destined to fail, andthat European debt is impacting on the global economy asindebted nations scale back imports from other Europeancountries and Asia with knock-on effects on world trade.
It has been commented that even if the policy of austerity andstructural reforms somehow calms the bond-markets it willdestroy the political legitimacy of the European Union(Quiggin, 2011). It is difficult to conclude otherwise than thatthe outlook is bleak for Europe as a result of the crisis, andbleak also for the outcomes of the austerity approach in botheconomic and social terms. It is clear that damage is beingdone to European countries in the short-term and the longer-term consequences, though unclear, could be much worse. Analternative approach is urgently required, one that can be bothjust and sustainable.
Outlook
IMPACT OF THECRIS I S ON FIVE
EUROPEANCOUNTRIES
Part 2

T H E I M P A C T O F T H E E U R O P E A N C R I S I S C A R I T A S R E S P O N S E T O A U S T E R I T y14
In this section we will look at the situation of each of the fivecountries in turn looking first at their overall levels ofgovernment indebtedness and their recent performance ineconomic terms. We will then look at the policy measures thathave been introduced since the crisis began and examine
each country’s performance in areas like employment andunemployment and in protecting people from poverty. Eachsection will finish by discussing the impacts of policies onvulnerable groups.
Government budgets were fundamentally affected by thefinancial and economic crises in the period following 2007. Ofthe five countries considered in this report, two were runningbudget surpluses in 2007 (Ireland and Spain), others hadbudget deficits within or close to the Stability and GrowthPact limit of 3% of GDP (Italy and Portugal). One (Greece) wasrunning a deficit which exceeded the 3% of GDP limit, but theprevious years (2004-2006) had seen some decline in the levelof the Greek deficit (Eurostat, 2012k). By 2008 all fivecountries were showing Government deficits, and by 2011three (Greece, Ireland and Spain) had budget deficits muchabove the EU27 average while two (Italy, -3.9%; and Portugal,-4.4%) had deficits around the average EU27 deficit rate (of-4.4% of GDP) (Eurostat, 2012k).
All have also seen substantial increases in their levels of generalgovernment gross debt between 2007 and 2011 although they
Background – Government Budgets
vary considerably as to their levels prior to 2007. For example,in 2004 Ireland, at one end of the scale, had a gross debt equalto 29.4% of GDP and that for Spain was 46.3% of GDP. InGreece, on the other hand, the rate was nearly equal to 100%(98.6%) of GDP in 2004 and in Italy it exceeded 100% (103%)of GDP (Eurostat, 2012j). By 2011 four of these countries hadthe highest levels of gross debt in Europe as a percentage ofGDP: Greece (170.6%), Italy (120.7%), Portugal (108.1%) andIreland (106.4%). At 69.3%, the rate in Spain was still belowthe EU27 average (82.5%). (See Glossary for definitions ofgovernment deficit/surplus and government gross debt).
Four of the countries therefore exceed the gross debt level(100% of GDP) that the IMF has identified as a significant debtthreshold, which is high relative to the historical experience,beyond which political and economic forces tend to exertdownward pressure (IMF, 2012f).
Stiglitz (2009) draws attention to the important role thatwelfare plays in operating as automatic stabilizers in a recession– meaning that when the economy weakens, spending on socialprotection and unemployment schemes should automaticallygo up, helping to stabilize the economy – and the need tomaintain automatic stabilizers and social protections (2009).Social protection systems vary greatly within Europe. Typicallysystems like unemployment benefit work best for those alreadyintegrated into the labour market than for those who are at itsmargins – like temporary and casual workers. Progressivetaxation is also considered an automatic stabilizer in aneconomic crisis in the sense that lower incomes (from reducedearnings or reduced working-times) are taxed less heavily thannormal wages (Basso et al, 2011).
Southern European countries tend to have significantly smallermechanisms of automatic stabilization than Scandinavian andContinental European Countries (Basso et al, 2011).
Researchers (Basso et al, 2011) have used a model to assess theability of the systems in different countries to withstand shocks
Welfare Systems
– that is, loss of income through wage-cuts and unemployment.It is notable that all five countries that are the subject of thisreport were below the European average (of 19 Europeancountries included) in terms of their ability to withstand theseshocks based on this modelling – which means that their welfaresystems were capable of replacing less income than othercountries.
In Italy, Portugal, Greece and Spain the tax and social transfersystem is described as providing ‘only weak stabilization for low-income groups’ (Basso et al, 2011). That study identified aparticular problem with non-standard workers and new labourmarket entrants (often young people) who experience less stablejobs and also less social protection (Basso et al, 2011).
For its part, Ireland’s welfare system is considered to be amixture of the liberal approach associated with the US and theconservative-corporatist approach of Continental Europe. Theliberal approach is characterized by services being purchased inthe market with residual means-tested benefits for those whocannot afford them, often for a limited time only; Ireland’s
Introduction

T H E I M P A C T O F T H E E U R O P E A N C R I S I S C A R I T A S R E S P O N S E T O A U S T E R I T y 15
It is important to note that the main source of comparabledata on poverty and social exclusion, the EU Survey on Incomeand Living Conditions (EU-SILC), has a significant time-lagwith data from 2010 being the latest available update forsome countries. However, data from 2010 and 2011 refers tothe situation for 2009 and 2010 respectively. Thus, the mostrecent data available represents only the early impacts of thecrisis on poverty and income levels.
Another important point relative to the data presented here isthat there are different approaches to the measurement ofpoverty and social exclusion. Under the EU 2020 Strategy11
headline targets have been set for reductions in poverty andsocial exclusion (European Commission, 2010). These targetsare based on a combination of three indicators: 1) personswho are at risk of poverty or 2) severely materially deprived or3) living in households with very low work intensity. One ofthe three measures, the ‘at risk of poverty’ measure, had
Statistical Issues
previously been the most prominent indicator at EU level. It isa relative income poverty threshold, which means that it isused to assess poverty levels relative to the national medianincome, something that relates it to local conditions that shiftin line with changes in general income/salary levels. Thresholdsare assessed at 40%, 50% and 60% of median income withthe 60% measure being used most frequently. Thus the ‘at riskof poverty’ measure depends on the local income povertythreshold which means that it varies across Europe.
In this report data on poverty is generally taken from theEuropean Commission’s statistical body Eurostat, rather thanfrom the national bodies responsible for statistics. There canoccasionally be slight differences of definition and differencesof interpretation between national bodies and Eurostat. Usingthe figures from Eurostat makes it possible to compare likewith like across countries.
tendency is to go more in the direction of the liberal model(Healy et al, 2012a). In relation to unemployment benefit, forexample, one significant difference between Ireland and thetypical Continental European model is that in the Irish systempayments are flat and not related to past income.
This discussion points to a further risk for vulnerable groups inthe peripheral countries. In many ways the welfare systems inthese countries were at the outset of the crisis less well placedthan those of other European countries to withstand the shock
to incomes that the crisis involves, and less well able to protectthe poorest people from the austerity measures and structuralreforms that followed. In all five countries, there is a strongtradition of family support, which is particularly relied uponwhen services and social transfers are not adequate to meetneeds or where they are of finite duration. However, this canplace a large burden on families in difficult times. In Spain,for example, the current period is considered by Caritas Spainto be a time of greatly increased pressures within family groups.
11 The EU 2020 Strategy was adopted in 2010; It aims to turn the EU into a ‘smart, sustainable and inclusive economy delivering high levels of employment, productivity and socialcohesion’ (European Commission, 2010, p. 5).

T H E I M P A C T O F T H E E U R O P E A N C R I S I S C A R I T A S R E S P O N S E T O A U S T E R I T y16
Between 1997 and 2007 Greece had an average rate of GDPgrowth of 4% annually almost twice the EU average (Menendez,2012). In 2006 the GDP growth rate was 5.5% when the EU27average was 3.3% of GDP. However, the effects of the 2008global financial crisis can be seen in the drop to negative growthin 2008 (-0.2%). See Table 2, below, and Appendix 6 (whichsets out GDP growth rates, 2003-2013(f)). According to theOECD, difficulties were brewing in Greece for years such thatwhen the economic crisis came, the country was significantlymore exposed than other countries (OECD, n.d., p 1).
One of Greece’s problems is tax evasion – between 1996 and2006 the size of Greece’s shadow economy was estimated atbetween 20% and 25% of GDP; another was excessivegovernment regulation and bureaucracy (Menendez, 2012).
Greece’s general gross debt as a percentage of GDP wasrelatively very high throughout the 2000s, and, at 106.1% in2006, was the second highest level in the EU27, just behindthat for Italy, at a time when the average in EU27 was 61.6%of GDP. Since then Greece’s gross debt (as a percentage ofGDP) has overtaken even the very high levels of Italy. At170.6% (or €355,658million) it stands as the highest rate inEU27 in 2011. See Table 1, below, and Appendix 1.
Greece’s fiscal deficit has been above 3% of GDP almost everyyear for 10 years in violation of the Stability and Growth Pact(Menendez, 2012). In 2011 it stood at -9.4%. See Table 1.
Background and Government Finances
2004 2005 2006 2007 2008 2009 2010 2011
Government deficit/surplus, % GDP -7.5 -5.2 -5.7 -6.5 -9.8 -15.6 -10.7 -9.4General Government Gross Debt % GDP 98.6 100 106.1 107.4 112.9 129.7 148.3 170.6
Source: Eurostat, 2012j, 2012k, tsdde410, gov_dd_edpt1
GREECE TABLE 1 Government Debt Rates
When borrowing on the markets to refinance its debt becameprohibitively expensive, Greece required assistance fromEuropean institutions and the IMF, which was made availablein 2010. However, ‘contagion’ nonetheless resulted in thespread of the sovereign debt crisis from Greece, to Ireland andPortugal, and eventually to Spain and then Italy as investorseither took their money elsewhere or sought higher interestrates from countries perceived to have high debts.
When important targets were not met, further measures wereagreed in 2011. Following this agreement a further packageof assistance (€130billion) and a restructuring of debt12 wasmade in 2012 involving a €1.4billion reduction in debt by wayof reduction in the interest rate agreed in 2010. There was alsoadditional finance for bank recapitalization (Thomsen Fasano,2012). Banks, insurers and other private sector investorsholding about €206billion of Greek bonds took a 53.5%reduction in the nominal value of their securities (Reuters,2012). According to the European Commission (2012a), factorsthat had hampered implementation of the measures that hadbeen originally agreed were political instability, social unrest,issues related to administrative capacity, and a more severerecession than anticipated.
The most recent economic assessment from the EuropeanCommission confirms that Greece is in a deep recession, whichis now expected to continue until 2013 (European Commission,2012b). Forecasts for growth have been further downgradedand are shown in Table 2, below.
Greece
12 A senior IMF official describes the restructuring as having reduced the debt burden of every man, woman, and child in Greece by close to €10,000 on average (Blanchard, IMF, 2012).However, there were no ‘haircuts’, the ECB and national central banks agreed to disperse profits made on Greek bonds back to Greece (Thomsen Fasano, 2012)
….the crisis is likely to have a significant social cost….OECD

T H E I M P A C T O F T H E E U R O P E A N C R I S I S C A R I T A S R E S P O N S E T O A U S T E R I T y 17
Amongst the measures introduced in Greece up to 2010 were:5 A special tax on pensions (‘Pensioners’ Solidarity Contribution’)with rates ranging from 3% to 10% (with pensions below€1,400 exempt),
5 Abolition of special pension payments (the 13th and 14thmonth) (partially offset by the introduction of an allowanceof €800 per year for pensions below €2,500 per month),
5 Raising of the child tax allowance (to €1,500, €3,000 and€1,500 per annum for households with 1,2 and 3 childrenrespectively) (an attempt to cushion families with childrenfrom the effects of other measures),
5 Increases in the standard rate of VAT from 19% to 23% andin the reduced rates from 4.4% to 5.5% and from 9% to 11%,
5 Excise duty increased by 30% on fuel, tobacco and alcohol,5 Personal income tax made more progressive with changesincluding a personal allowance of €12,000 per year and anincreased top rate of 45% for incomes over €100,000 alongwith a once-off (retrospective) tax of 1% of annual incomesin 2009 over €100,000,
5 Tax base extended to include unemployment benefits, largefamily benefits and contributory disability benefits forpeople with a taxable income over €30,000 per year
5 Cuts and other changes to public sector pay, includingabolition of the 13th and 14th month salaries
5 Reductions in the tax allowed on charitable donations(Callan et al, 2011).
A range of further measures have followed. These includechanges to labour laws (especially concerning collectiveagreements), and there are plans for reductions in socialsecurity contribution rates for employers (Ministry of Finance,Greece, 2012).Furthermore:5 The minimum wage was reduced,5 Unemployment benefits are being reduced in line withreductions to the minimum wage,
5 Stricter conditions are being applied to availability ofunemployment benefits,
5 Suspension of the rent subsidy programme for low-incomeemployees,
Policy Response
5 Means testing of some benefits (e.g. large family benefit),5 Reduction of others (e.g. family benefits for public sectoremployees),
5 Stricter eligibility rules for some benefits (e.g. old agesolidarity benefit – EKAS)
(Ministry of Finance, 2012, p.27, 30, 32).
There have also been a series of measures by the OAED (GreekManpower Organisation) aimed at job retention as well astraining and employment. The Government estimates thatthese measures have contributed significantly to reducing theunemployment rate (Ministry of Finance, Greece, 2012, p 27).
On 7 November 2012 the Greek Parliament passed measuresworth €13.5 billion over two years, designed to ensure therelease of €31billion aid (by the IMF and the EuropeanInstitutions) much of which is required to shore up banks.Measures will involve further and severe pension cuts, a two-year increase in the retirement age to 67, tax increases andlaws that will make it easier to fire and transfer civil servants(Reuters, 2012). There are also proposed cuts in health andeducation spending (Caritas Athens, 2012). The measures weremet with protests in Athens by some 100,000 people and camein the middle of a two-day general strike called by thecountry’s two biggest unions.
Despite the pressure on the Greek government, and five yearsinto the crisis, it continues to exempt commercial shippingcompanies, its most successful industrial sector, from all taxes(Spiegel Online International, 2012). In addition, tax evasioncontinues to be a major problem and a recent study suggestedthat seven out of ten self-employed Greeks continue tosignificantly underreport their incomes (Spiegel OnlineInternational, 2012). This causes anger and frustration amongstmany Greek people affected by round after round of austerity:‘in Greece, there is a breach of the social contract, which sinkstax morale. People are angry and rightfully so’ (FriedrichSchneider, Professor of Economics, University of Linz, Austria,an expert on Greece’s shadow economy - Spiegel OnlineInternational, 2012). Some of this anger is directed against
Percentage change on previous year2006 2007 2008 2009 2010 2011 2012 (f) 2013 (f)
EU (27 countries) 3.3 3.2 0.3 -4.3 2.1 1.5 -0.3* 0.4*Greece 5.5 3.5 -0.2 -3.1 -4.9 -7.1 -6.0* -4.2*
Source: Eurostat, 2012a, tec00115.*European Commission, 2012b - f: forecast. Figures described as provisional for each year - IMF forecast: for 2012: -6.0 %; for 2013: -4.0% (IMF, 2012f, p. 66)
GREECE TABLE 2 Real GDP growth rate - volume
The current aim is to achieve a primary budget balance by2013 requiring additional measures of around 5% of GDP,
which are being adopted as part of 2013 budget measures(European Commission, 2012b).

migrants and newspapers report severe attacks on migrants,something that is being worsened by the rise in the far-rightpolitics evidenced by the rise of the Golden Dawn party.
In the Eurobarometer survey of the views of Europeans on thesocial climate, Greece has been the lowest ranked MemberState in three of the last four years (in 2010 it was second to
Romania). Its index has declined in each year since 2009(when the survey started) although the decline from -0.4 in2011 to -5.8 in 2012 is much more marked than in previousyears, which in all likelihood reflects the increasing economicand political turbulence being experienced by people there(European Commission, 2012, p 43-46).
In 2011, the employment rate in Greece was 59.9% comparedto an EU27 average of 68.6% for people aged 20-64. Mostrecently, the rate (at Quarter 1, 2012), is 56.4%, compared withan EU27 average of 68%13. Greece experienced the worst dropin employment levels in the EU27 in the last year to Quarter 2,2012. The fall of9% represented 405,000 people. The decline inGreece was far worse than the European average ( -0.2%)(European Commission, 2012, p 13, 69). As Figure 1 shows, italso extends a persistent downward trend observed since 2008.
One feature of the labour market in recent years is thereduction in full-time posts and a growth in part-time or‘rotation’ contracts (Ministry of Finance, Greece, 2012, p. 29).
Employment/Unemployment
The Greek government has also drawn attention to the issue oflarge numbers of people who are economically inactive, whichin 2011 (4.37million, average) exceeded the number of peopleemployed (4.09million, average). This is explained by largernumbers of people retired and people who are discouraged fromlooking for work (Ministry of Finance, Greece, 2012, p. 24).
With employment declining, the unemployment rate has risen.In 2011 it was 17.7% (Eurostat, 2012i). It has increased sinceand stands at 25.1% at July 2012 (1.2million people) wellabove the European average and the second highest rate inthe EU close behind that of Spain14 (Eurostat, 2012n, 2012o).See Appendix 7.
Youth unemployment (age 15-24) is particularly high,standing at 55.4% (June 2012), the highest rate in the EU(June 2012) and nearly 2.5 times the average rate (of 22.5%)(European Commission, 2012, p 72). The rate is increasingrapidly, having increased by nearly 11 percentage points fromJuly 2011.
At 12.3% the long-term unemployment rate is the highest inEurope and has increased dramatically in the year to Quarter1, 2012 – by 5.2 percentage points – the highest increase inthe EU (European Commission, 2012, p 73). The share of thoseunemployed who are long-term unemployed (that is,unemployed for 12 months or more) was just under 50%, 2011(Eurostat, 2012i).
T H E I M P A C T O F T H E E U R O P E A N C R I S I S C A R I T A S R E S P O N S E T O A U S T E R I T y18
13 This data is from European Commission, 2012, from the EU LFS and is non-seasonally adjusted, p 71
14 The Spanish rate of 25.8% is given for September 2012, whereas the Greek rate is only given to July 2012 in Eurostat, 2012n
75
70
65
60
55
50
Percentage (%)
EU (27 Countries) Greece
Employment Rate, age group 20-64
2006 2007 2008 2009 2010 2011
GREECE FIGURE 1
Source: Eurostat, 2012b, t2020_10
2011 2012
Unemployment – rate (%) 17.7% 25.1% (July)Unemployment – number of people 877,000 2.2million (July)Youth Unemployment Rate (15-24) 55.4% (June)Long-term Unemployment Rate (unemployed for 12 months or more) 12.3% (Q1)Share of unemployment that is long-term 49.6%
Source: Eurostat, 2012i; Eurostat, 2012n, European Commission, 2012, p 72
GREECE TABLE 3 Unemployment-Headline Statistics

T H E I M P A C T O F T H E E U R O P E A N C R I S I S C A R I T A S R E S P O N S E T O A U S T E R I T y 19
Poverty: The Europe-wide comparable data available on povertyfor Greece has just become available for 2011 (though relyingon data from the previous year). The time lag means that thepoverty statistics relied on in this report only indicate impacts ofthe earlier phases of the crisis. In 2012 the Greek governmenthas acknowledged that austerity measures combined withwage and labour income reductions are likely to have had aneffect on poverty rates not yet shown by the statistics (Ministryof Finance, Greece, 2012, p 30,31).
The combined ‘at risk of poverty or social exclusion’ indicatorused under the Europe 2020 strategy has risen markedly inGreece from 27.6% in 2009 to 31% in 2011. In 2011 itrepresented over 3.4 million people (Eurostat, 2012c.). TheEuropean average rate is 23.4%.
The ‘at risk of poverty or social exclusion’ measure is a combinedone, which includes 3 separate measures of poverty. Rates foreach of the three measures are shown in Figure 2 and set out inAppendix 3. In addition, Appendix 4 presents a graph showingthe rates for 2010 and 2011 (where available) across Europe.Examining the three measures separately, gives a more detailedpicture of poverty in European countries since 2008. The at riskof poverty measure is the one most commonly used in Europe.
As Figure 2 shows, Greece’s relatively high at risk of povertylevels in the 2000s had shown a slight decline in 2009, but theselevels are increasing and show a sharp increase in 2011, pushingthe level to a rate higher than that for 2003. The at risk ofpoverty indicator is a relative poverty measure, which means itis related to an income threshold in each country, influenced bythe general level of income and its distribution in the population(Social Protection Committee, 2011, p. 11). In Greece the increasein poverty levels occurred notwithstanding the fact that the 60%
Poverty
risk of poverty threshold fell significantly between 2010 and 2011in line with a fall in incomes generally15 (Eurostat, 2012h). SeeAppendix 5 for the at risk of poverty thresholds, 2007-2011.
At 21.4% in 2011, Greece’s rate has increased substantiallysince 2008 (from 19.7%). In 2010 (when availability of datapermits comparison), Greece had one of the highest at risk ofpoverty rates in EU27 (Eurostat, 2012c). The EU27 average ratewas 16.4%. Greece’s rate was the sixth highest rate onlyslightly exceeded by five other countries Lithuania, Bulgaria,Spain, Romania and Latvia (Eurostat, 2012c). The 21.4% ratefor 2011 shows an increase of 1.3 percentage points in oneyear; it represents over 2.3million people (Eurostat, 2012c).
As shown in Figure 2, between 2010 and 2011 there was alsoa marked increase in the other two indicators of poverty –people who were severely materially deprived and those whowere living in households with very low work intensity.
The severely materially deprived rate jumped from 11.6% in2010 to 15.2% in 2011 representing a total of 1.6 millionpeople and an increase of 398,000 in one year (Eurostat,2012c). The rate for people living in households with very lowwork intensity went from 7.5% in 2010 to 11.8% in 2011, anincrease of 360,000 people (Eurostat, 2012c).
The EU SILC data allows analysis of the share of people whoare living below the 40% threshold – meaning the poorestpeople whose incomes are less than 40% of the medianincome. Overall, in EU27 the average rate has been increasingslightly since 2008 with the average at 5.6% in 2010 (thelatest year for which Europe-wide data is available). In Greeceby contrast the increase has been marked between 2009 and2011, going from 6.6% to 8.2% (Eurostat, 2012d). This suggeststhat within the entire population living below the standardpoverty threshold there are signs of a deepening of povertylevels amongst the poorest people.
Another indication of the depth of poverty is the relativemedian at-risk-of-poverty gap, which helps to quantify justhow poor the poor are. The at risk of poverty gap has widenedin Greece by 2.7 percentage points between 2010 and 2011. In2011 it stood at 26.1%, a rate exceeded only by Spain and fourEastern European countries (Latvia, Romania, Bulgaria andLithuania) (Eurostat, 2012q).
In Greece, there has also been a striking increase between2010 and 2011 in households reporting strain in maintaininga basic standard of living. For example,5 those unable to keep their homes adequately warm rose byover 3 percentage points from 15.4% to 18.6%.( The rate in2006 was 12%) (Eurostat, 2012r);
25
20
15
10
5
0
Percentage (%)
PAROP
Greece, PAROP, SMD and VLWI (%)
2003 2004 2005 2006 2007 2008 2009 2010 2011
GREECE FIGURE 2
SMD VLWI
Source: Eurostat, 2012c, t2020,51,52,53PAROP: People at risk of poverty, 60% thresholdSMD: Severely Materially DeprivedVLWI: Very Low Work Intensity (See Glossary for definitions)
15 The 60% at risk of poverty threshold is 60% of median equivalised incomes. The at risk of poverty threshold in Greece for a single person was €7,178 in 2010 and it fell to €6,591 in2011. See Appendix 5

5 those unable to afford a meal with meat, chicken or fish (orvegetarian equivalent) every second day increased from7.9% in 2010 to 9.2% in 2011 (Eurostat, 2012s).
Children: Greece’s rate of child poverty has been high relativeto the EU27 average since at least 2005 (when comparabledata are available from Eurostat). At 23% in 2010 Greece hasa rate of poverty amongst children that is above the EU27average (of 20.5%) and this was exceeded only by six othercountries - Spain, Italy, Bulgaria, Latvia, Lithuania and Romania.Childhood poverty rates had risen in Greece between 2004 and2007 and have been at around 23% since then, but the rate for2011 shows a slight increase to 23.7%% (Eurostat, 2012e).
Older People: The risk of poverty rate for those over 65 in Greecewas 21.3% in 2010, which was above the EU27 average rate of16% (Eurostat, 2012f). It is also higher than the risk of povertyrate for the working age population (19%) (The Social ProtectionCommittee, 2012, Table 5). Latest figures show a sizable increase
(more than two percentage points) in the poverty rate for thisage group between 2010 and 2011 – standing at 23.6%, a ratewhich exceeds the rate it had been in 2007 (Eurostat, 2012e).
At 25.2% older women in Greece have a higher risk of povertyrate than the rate for older men (21.7%) (Eurostat, 2012e).Older women in Greece also have a higher rate of severematerial deprivation than older men, with a difference ofalmost 5 percentage points in 2010 (The Social ProtectionCommittee, 2012, Table 11).
Working Poor: The rate of poverty in Greece for people whoare employed and who still do not earn enough to protectthem from poverty (the working poor) is 11.9% (2011). This isone of the highest rates in Europe, exceeded only by Spain andRomania in 2011 (of the countries for which data are available)(Eurostat, 2012g). The OECD has identified this as a particularproblem facing Greece with part-time workers and those ontemporary contracts worst affected (OECD, n.d, p. 12).
Greece’s employment levels have been on a downwardtrajectory since 2008 and the country has experienced theworst drop in employment in Europe in the year to quarter 2,2012. Unemployment is very high – just behind the rate forSpain, which has the highest rate in Europe (See Appendix 7).The youth unemployment rate is the highest in Europe andexceeds 50% of young people (that is, under 25s). Long-termunemployment rates are the highest in Europe and haverecently shown the highest rate of increase.
Income inequality has grown in Greece between 2010 and2011. In 2011 the income share of the richest 20% of thepopulation was 6 times that of the poorest 20%. This hadincreased from 5.6% in 2010 (EL. STAT, 2012, p. 51).
Some measures have been taken to address the shadoweconomy16, but despite the length of time during which theeconomic crisis has lasted and the successive rounds ofausterity measures, it is commonly understood that taxevasion is still rife and that wealthy Greeks are under no morepressure to pay taxes now than they were before (SpiegelOnline International, 2012).
The economic crisis and the austerity measures taken toaddress it are impacting in Greece, a country with already highlevels of poverty, and there is a particularly marked worseningof the position in the poverty rates that have recently becomeavailable for 2011 (albeit with a 2010 reference period). The atrisk of poverty rate is one of the highest in Europe and all ofthe indicators used to assess poverty levels (under the schema
Discussion: Impacts on Vulnerable Groups
laid down by the Europe 2020 Strategy) have shown markedincreases. Furthermore, there are signs of deepening povertylevels amongst the poorest people.
The Greek government characterizes the problem of povertyas high (as compared with the EU average), severe (the poorare deeply poor) and persistent (the poor remain poor foryears) (Ministry of Finance, Greece, 2012). In the opinion ofsocial workers based with Caritas Athens, amongst those mostaffected in the current climate are one-parent families withsmall children. Indeed official statistics suggest that this typeof household had the highest at risk of poverty rate in 2011(43.2%) (EL.Stat, 2012, p.45).
Greece’s child poverty rate is high in European terms and therate has begun to increase (between 2010 and 2011). Studiesof the distributional impact of austerity measures suggest thatthey have not affected households with children in Greece asmuch as they have in other countries such as Ireland, Portugaland Spain (Sutherland & Matsaganis, 2011, p 3; Callan et al,2011, p 17). However, those studies looked at the impact ofausterity measures only to 2010 in Greece (Callan et al, 2011, p6), when it was clear that some of the measures introduced bythe Greek government (and listed above) had attempted tocushion the effect on families with children in the early years ofthe crisis. Of course, even if the effects of the crisis and themeasures introduced to address it had affected households withchildren less than other households, this does not mean thatthe poorest households with children did not suffer hardship.17
T H E I M P A C T O F T H E E U R O P E A N C R I S I S C A R I T A S R E S P O N S E T O A U S T E R I T y20
16 For example, inspections regarding social contribution evasion have been increased and arrangements have been made for settling owed contributions aiming to counter avoidanceand fraud (The Social Protection Committee, 2012, p 46)
17 The studies concerned do not signify if the distribution is equitable or not (Callan et al, 2011 p 12, 13).

T H E I M P A C T O F T H E E U R O P E A N C R I S I S C A R I T A S R E S P O N S E T O A U S T E R I T y 21
Other measures such as the introduction of consumer taxeswill have disproportionately affected all lower income families.It has been shown that the effect of large VAT increases inGreece (4% increase in the standard rate) has been particularlystrong on households at the bottom of the incomedistribution, particularly for the bottom two decile groups(that is the bottom 20%) (Sutherland & Matsaganis, 2011, p.4,Callan et al, 2011, p. 15, 17). Indeed, the Greek governmentconcedes that measures such as increases in VAT and duties onfuel are regressive in nature and will have had an impact onpoverty (Ministry of Finance, 2012, p. 32).
Amongst the other types of people most affected, in theobservation of Caritas Athens, are disabled people and theirfamilies, migrants, older people with health problems andthose on the minimum pension (Caritas Athens, 2012). Oneissue, for example, is that pensioners who own property haveto meet the new property taxes which are assessed on assetvalue rather than income; another is a requirement to pay inadvance for medicines and medical treatment, which isreimbursed by Government, but reimbursement can takemonths (Caritas, Athens, 2012).
A range of public policy measures (listed above) have affected theincome of pensioners. In Greece pensions have been cut acrossall household income levels (Sutherland &Matsaganis, 2011, p 3).A marked increase in poverty rates amongst older people is nowin evidence between 2010 and 2011, with older women at aparticular risk. Against that backdrop, the further severe pensioncuts passed in November 2012 must be of concern.
Migrant workers are always amongst the first to be hurt in aneconomic crisis (Stiglitz, 2009). In Greece, the status ofimmigrant workers who become unemployed changes toillegal/undocumented after a few months (according to CaritasAthens, 2012), which leaves them especially vulnerable.
Other particular problems that Caritas Athens identifies are thatmany working households have lost a high percentage of theirincome (through salary cuts, cuts in pensions, cuts in otherincome sources) combined with a significant rise in taxationand a significant rise in the cost of living since 2010. Structuresidentified by Caritas Athens, which have a particular impact onlow-income families, include the fact that unemploymentbenefits last only one year and that a range of subsidies thathelped low-income families have been cut or cancelled since201018. They argue that a high proportion of Greeks arestruggling with daily expenses including food, water, electricityand heating, and they observe that each time there are cuts andmore taxation, more companies and shops close down and evenmore jobs are lost (Caritas, Athens, 2012).
Greece already has a very high rate of in-work poverty, whichwould suggest the need for policy measures that strengthenthe incomes of low-earners. Instead the decision to reduce theminimum wage seems likely to make their situation worse.
Because of their potential impact on people who are alreadystruggling, the cuts passed by the Parliament (7 November2012) are of particular concern to Caritas Athens.
Finally, the impact of cuts to services (like health, social careor education) cannot be assessed in a report of this nature.However, it is inevitable that these cuts particularly affectthose with least income who do not have sufficient income tocompensate for them. Furthermore, many services in Greece aretraditionally provided by NGOs, but in many cases their fundinghas been cut or withdrawn by the State19, and changes intaxation policy have also made their operating environmentmore difficult (Caritas, Athens, 2012).
Mrs. X is a 38 years old mother who came for help to Caritas throughthe Social Services of the Athens Municipality, as this service doesnot have the resources to help more people at the moment. Sheis a housewife and cannot find work. She has two children. Theolder child attends primary school, but the younger one wasrejected at a State day care centre due to long waiting lists. Shehad married five years ago, her husband worked and rented a flatin Athens. When the recession really hit Greece two years ago, helost his work and finally abandoned his family. When she was lefton her own with the children without a job and somebody to helpher look after them, she decided to move with her mother, whohad a pension of €480 per month. After seven months her motherpassed away and the family lost their income. When Mrs X cameto the Caritas Social Services she owed 8 months rent, water andelectricity bills. She has neither water nor electricity at home andwas at risk of being thrown out of her flat. While her mother wasalive, she at least had a home, electricity and water.
Caritas Athens
CASE STUDY
Mr. P. and his wife came for help to Caritas Social Services. Theyare aged 83 and 81, respectively, and have a pension of €640 permonth. He worked on the island of Chios, but because of hisserious medical condition, they came to live in Athens when heretired to be close to the hospital for his treatment. At Caritasthey receive food every month. They own a small house in Chiosbut cannot move again there, as they fear he will not have good
CASE STUDY
medical treatment. They have an only son who is unemployed andare desperate to help him.
Caritas Athens
18 Such as cancellation of a rental subsidy that was paid to families with private sector earnings of a maximum annual income less than €10,000, a mortgage subsidy for private sectorworkers, subsidies for one-week holidays, cinema tickets and books for workers in deprived areas with incomes under €12,000 (one person) or €25,000 (family income, both working)Caritas Athens, 2012
19 Caritas Athens gives as an example the case of disabled children in special schools who had received a State contribution for each child, which has ceased (Caritas, Athens, 2012)

T H E I M P A C T O F T H E E U R O P E A N C R I S I S C A R I T A S R E S P O N S E T O A U S T E R I T y22
Following approximately a decade of export-led growth, from2003 the Irish economy underwent a domestic boom basedon lax lending and property price inflation. Membership of theEURO area gave banks access to wholesale funding that‘turbocharged’ their asset expansion (IMF, 2012). In the fiveyears to mid-2008 the property bubble inflated bank assets tosome 500% of GDP (IMF, 2012). In this context it is importantto note that Irish Government borrowing was very low andIreland’s national debt was 24.8% of GDP when the crisisbegan in 2007 (See Table 4 below). The borrowing that wasdone was not done to fund Government expenditure but,rather, to fund private ‘investment’ particularly in propertydevelopment. This borrowing was done by private banks, forthe most part.
Ireland’s property price decline started in 2007 and post-Lehman Brothers financial turmoil tipped the vulnerable banksinto crisis. After facing losses on property assets, the banksfaced a run on wholesale funding, leading to massive recourseto the Euro system liquidity fund (IMF, 2012). The IrishGovernment issued a blanket guarantee from September 2008,and transferred large-scale distressed commercial anddevelopment properties to the (newly-established for thispurpose) National Asset Management Agency (NAMA) fromApril 2009. The Government also provided large-scale supportfor banks and had to borrow in order to do so. With a cost of€64.1billion or some 40% of GDP, Ireland’s banking crisis isconsidered the costliest in the world since at least the 1930safter Iceland (IMF, 2012).
Background and Government Finances
There has been no burden sharing with the banks senior debtholders because this was insisted on as the correct approach bythe European Central Bank to ensure pan-European fiscalstability. In practice this has meant that the banks andbondholders (among them some of Europe’s largest banks), whogambled recklessly by investing in Ireland’s private banks andsaw their gambles fail, had their debts repaid in full by the Irishtaxpayer. While the decision to repay in full was taken by theIrish Government, under pressure from the European CentralBank and the European Commission, it was not approved bythe Irish people – a situation that has led to further questioningof the democratic deficit that has been a marked characteristicof decision-making in the EU for some time.
A steep decline in construction occurred in 2008 which wasworsened by contractions in world trade in 2009. Tax revenues,which had been highly dependent on the construction/propertyboom, collapsed, employment fell, unemployment rose and netemigration returned. As Table 4 shows, the general Governmentbalance, which had been in surplus until 2007, dropped in 2008to -7.4% of GDP and the situation has disimproved furthereach year since then. The General Government gross debt wasone of the lowest in Europe in 2006 and 2007 but stood at106.4% of GDP in 2011 which was more than a four-foldincrease in the rate from 2006. In 2011 Ireland’s rate was oneof the highest in Europe, exceeded only by the rates for Greece,Italy and Portugal (Eurostat, 2012j). Total national debt at end2011 was approximately €169billion, of which the proportionused to rescue banks was 25% (€43bn) (which does not includean additional €20billion from the National Pension ReserveFund also used to rescue banks) (Social Justice Ireland, 2012).
Ireland
2004 2005 2006 2007 2008 2009 2010 2011
Government deficit/surplus, % GDP 1.4 1.7 2.9 0.1 -7.4 -13.9* -30.9* -13.4*General Government Gross Debt % GDP 29.4 27.2 24.5 24.8 44.5 64.9 92.2 106.4
Source: Eurostat, 2012j,2012k, tsdde410; gov_dd_edpt1* In 2010 especially, and also in 2009 and 2011, these rates include once-off measures (European Commission, 2012b) related to recapitalization of banks
IRELAND TABLE 4 Government Debt Rates
Successive cuts to most welfare rates once the crisis beganmean that most social welfare payments in Irelandare below the poverty line.
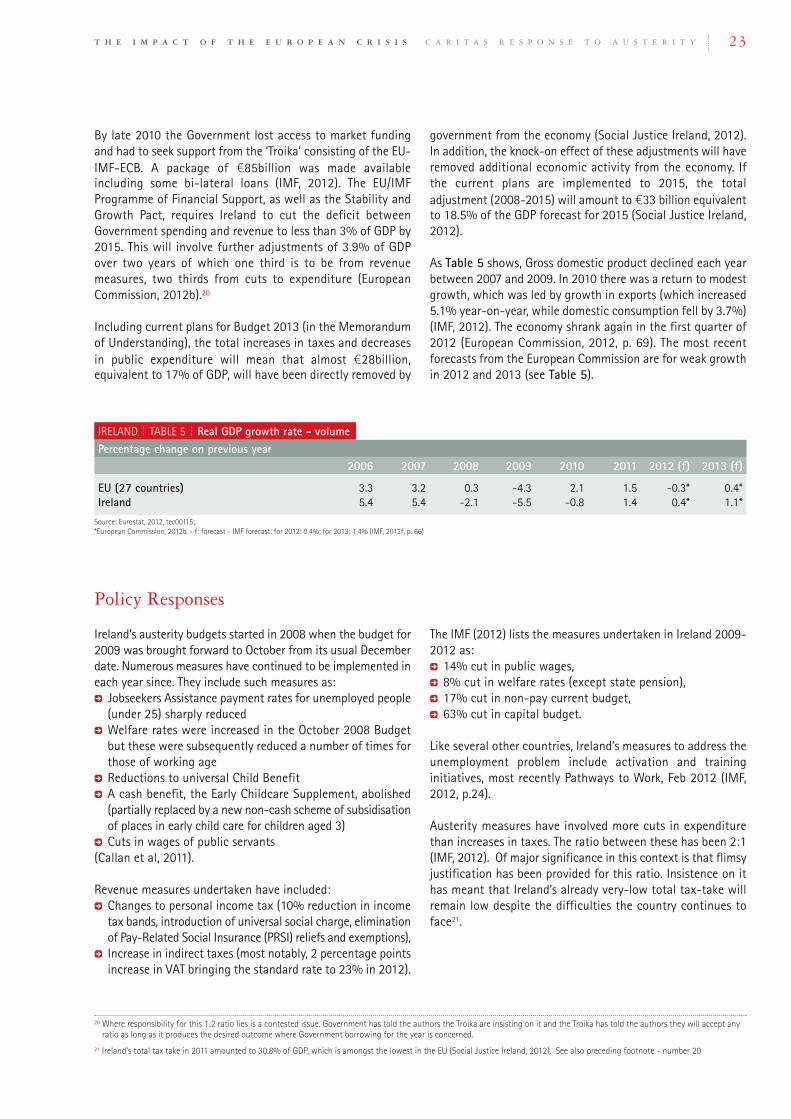
T H E I M P A C T O F T H E E U R O P E A N C R I S I S C A R I T A S R E S P O N S E T O A U S T E R I T y 23
By late 2010 the Government lost access to market fundingand had to seek support from the ‘Troika’ consisting of the EU-IMF-ECB. A package of €85billion was made availableincluding some bi-lateral loans (IMF, 2012). The EU/IMFProgramme of Financial Support, as well as the Stability andGrowth Pact, requires Ireland to cut the deficit betweenGovernment spending and revenue to less than 3% of GDP by2015. This will involve further adjustments of 3.9% of GDPover two years of which one third is to be from revenuemeasures, two thirds from cuts to expenditure (EuropeanCommission, 2012b).20
Including current plans for Budget 2013 (in the Memorandumof Understanding), the total increases in taxes and decreasesin public expenditure will mean that almost €28billion,equivalent to 17% of GDP, will have been directly removed by
government from the economy (Social Justice Ireland, 2012).In addition, the knock-on effect of these adjustments will haveremoved additional economic activity from the economy. Ifthe current plans are implemented to 2015, the totaladjustment (2008-2015) will amount to €33 billion equivalentto 18.5% of the GDP forecast for 2015 (Social Justice Ireland,2012).
As Table 5 shows, Gross domestic product declined each yearbetween 2007 and 2009. In 2010 there was a return to modestgrowth, which was led by growth in exports (which increased5.1% year-on-year, while domestic consumption fell by 3.7%)(IMF, 2012). The economy shrank again in the first quarter of2012 (European Commission, 2012, p. 69). The most recentforecasts from the European Commission are for weak growthin 2012 and 2013 (see Table 5).
Ireland’s austerity budgets started in 2008 when the budget for2009 was brought forward to October from its usual Decemberdate. Numerous measures have continued to be implemented ineach year since. They include such measures as:5 Jobseekers Assistance payment rates for unemployed people(under 25) sharply reduced
5 Welfare rates were increased in the October 2008 Budgetbut these were subsequently reduced a number of times forthose of working age
5 Reductions to universal Child Benefit5 A cash benefit, the Early Childcare Supplement, abolished(partially replaced by a new non-cash scheme of subsidisationof places in early child care for children aged 3)
5 Cuts in wages of public servants(Callan et al, 2011).
Revenue measures undertaken have included:5 Changes to personal income tax (10% reduction in incometax bands, introduction of universal social charge, eliminationof Pay-Related Social Insurance (PRSI) reliefs and exemptions),
5 Increase in indirect taxes (most notably, 2 percentage pointsincrease in VAT bringing the standard rate to 23% in 2012).
Policy Responses
The IMF (2012) lists the measures undertaken in Ireland 2009-2012 as:5 14% cut in public wages,5 8% cut in welfare rates (except state pension),5 17% cut in non-pay current budget,5 63% cut in capital budget.
Like several other countries, Ireland’s measures to address theunemployment problem include activation and traininginitiatives, most recently Pathways to Work, Feb 2012 (IMF,2012, p.24).
Austerity measures have involved more cuts in expenditurethan increases in taxes. The ratio between these has been 2:1(IMF, 2012). Of major significance in this context is that flimsyjustification has been provided for this ratio. Insistence on ithas meant that Ireland’s already very-low total tax-take willremain low despite the difficulties the country continues toface21.
20 Where responsibility for this 1:2 ratio lies is a contested issue. Government has told the authors the Troika are insisting on it and the Troika has told the authors they will accept anyratio as long as it produces the desired outcome where Government borrowing for the year is concerned.
21 Ireland’s total tax take in 2011 amounted to 30.8% of GDP, which is amongst the lowest in the EU (Social Justice Ireland, 2012). See also preceding footnote - number 20
Percentage change on previous year2006 2007 2008 2009 2010 2011 2012 (f) 2013 (f)
EU (27 countries) 3.3 3.2 0.3 -4.3 2.1 1.5 -0.3* 0.4*Ireland 5.4 5.4 -2.1 -5.5 -0.8 1.4 0.4* 1.1*
Source: Eurostat, 2012, tec00115;*European Commission, 2012b. - f: forecast - IMF forecast: for 2012: 0.4%; for 2013: 1.4% (IMF, 2012f, p. 66)
IRELAND TABLE 5 Real GDP growth rate - volume
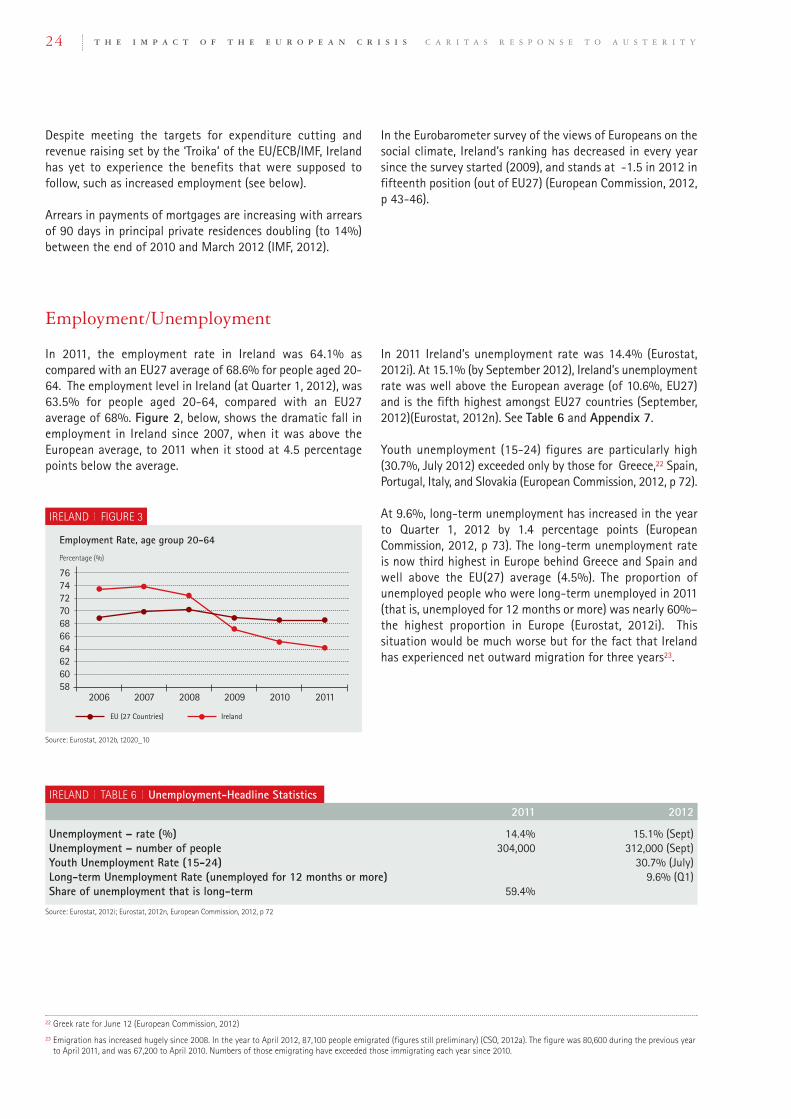
Despite meeting the targets for expenditure cutting andrevenue raising set by the ‘Troika’ of the EU/ECB/IMF, Irelandhas yet to experience the benefits that were supposed tofollow, such as increased employment (see below).
Arrears in payments of mortgages are increasing with arrearsof 90 days in principal private residences doubling (to 14%)between the end of 2010 and March 2012 (IMF, 2012).
In the Eurobarometer survey of the views of Europeans on thesocial climate, Ireland’s ranking has decreased in every yearsince the survey started (2009), and stands at -1.5 in 2012 infifteenth position (out of EU27) (European Commission, 2012,p 43-46).
In 2011, the employment rate in Ireland was 64.1% ascompared with an EU27 average of 68.6% for people aged 20-64. The employment level in Ireland (at Quarter 1, 2012), was63.5% for people aged 20-64, compared with an EU27average of 68%. Figure 2, below, shows the dramatic fall inemployment in Ireland since 2007, when it was above theEuropean average, to 2011 when it stood at 4.5 percentagepoints below the average.
Employment/Unemployment
In 2011 Ireland’s unemployment rate was 14.4% (Eurostat,2012i). At 15.1% (by September 2012), Ireland’s unemploymentrate was well above the European average (of 10.6%, EU27)and is the fifth highest amongst EU27 countries (September,2012)(Eurostat, 2012n). See Table 6 and Appendix 7.
Youth unemployment (15-24) figures are particularly high(30.7%, July 2012) exceeded only by those for Greece,22 Spain,Portugal, Italy, and Slovakia (European Commission, 2012, p 72).
At 9.6%, long-term unemployment has increased in the yearto Quarter 1, 2012 by 1.4 percentage points (EuropeanCommission, 2012, p 73). The long-term unemployment rateis now third highest in Europe behind Greece and Spain andwell above the EU(27) average (4.5%). The proportion ofunemployed people who were long-term unemployed in 2011(that is, unemployed for 12 months or more) was nearly 60%–the highest proportion in Europe (Eurostat, 2012i). Thissituation would be much worse but for the fact that Irelandhas experienced net outward migration for three years23.
T H E I M P A C T O F T H E E U R O P E A N C R I S I S C A R I T A S R E S P O N S E T O A U S T E R I T y24
22 Greek rate for June 12 (European Commission, 2012)
23 Emigration has increased hugely since 2008. In the year to April 2012, 87,100 people emigrated (figures still preliminary) (CSO, 2012a). The figure was 80,600 during the previous yearto April 2011, and was 67,200 to April 2010. Numbers of those emigrating have exceeded those immigrating each year since 2010.
76747270686664626058
Percentage (%)
EU (27 Countries) Ireland
Employment Rate, age group 20-64
2006 2007 2008 2009 2010 2011
IRELAND FIGURE 3
Source: Eurostat, 2012b, t2020_10
2011 2012
Unemployment – rate (%) 14.4% 15.1% (Sept)Unemployment – number of people 304,000 312,000 (Sept)Youth Unemployment Rate (15-24) 30.7% (July)Long-term Unemployment Rate (unemployed for 12 months or more) 9.6% (Q1)Share of unemployment that is long-term 59.4%
Source: Eurostat, 2012i; Eurostat, 2012n, European Commission, 2012, p 72
IRELAND TABLE 6 Unemployment-Headline Statistics

T H E I M P A C T O F T H E E U R O P E A N C R I S I S C A R I T A S R E S P O N S E T O A U S T E R I T y 25
As already mentioned, the comparable data available onpoverty for some European countries relates to 2010 (relyingon data from the previous year, 2009). This is so for Ireland;therefore, the data indicates the impact of the early stages ofthe crisis only.
The combined ‘at risk of poverty or social exclusion’ indicatorused under the Europe 2020 strategy has risen significantly inIreland from 23.7% in 2008 to 29.9% in 2010, representing1.3 million people, and an increase of some 285,000 people inthe year (source, Eurostat, 2012c.). The 2010 rate is one of thehighest rates of poverty and social exclusion in Europe, muchhigher than the European average (of 23.4%), equal to thatof Hungary and exceeded only by four Eastern Europeancountries – Bulgaria, Latvia, Lithuania and Romania (Eurostat,2012c). Rates for each of the three measures that make upthe combined ‘at risk of poverty or social exclusion’ indicatorare shown in Figure 4 and are set out in Appendix 3.
As Figure 4 shows, within the combined measures, Ireland hasa high proportion of adults with very low work intensity –meaning they are distanced from the labour market – andthere have been very significant increases in this measuresince 2008, something that is consistent with the rise in long-term unemployment.
When the at risk of poverty measure is considered as shown byFigure 4, Ireland had high levels in the early 2000s, but ratesfell in the last years of the decade. That position is changingagain with an increase in the at risk of poverty rate between2009 and 2010 of over 1 percentage point – this was one ofthe highest rates of increase in EU27, exceeded only by Spainand Slovenia (The Social Protection Committee, 2012, Table 4,p.112). The 2010 rate was 16.1% representing 716,000 peopleand was similar to the EU27 average rate of 16.4% (Eurostat,
Poverty
2012c). This occurred notwithstanding the fact that the 60%risk of poverty threshold fell between 2008 and 2010 in linewith a fall in incomes generally24 (Eurostat, 2012h).
When we examine the share of people who are living with lessthan 40% of the median income there has been a markedincrease between 2009 and 2010, going from 3.3% to 4.8%(Eurostat, 2012d, tessi126). This suggests that there are signsof a deepening of poverty levels amongst the poorest people.
Ireland is highly dependent on social transfers (or welfarepayments) to keep people out of poverty. At 51%, Ireland,jointly with Hungary, has the highest poverty rate in the EU27before social transfers and pensions (CSO, 2012, p. 42). Inother words, this shows how dependent a large number ofpeople in Ireland, especially people over 65, are on welfarepayments to protect them from poverty.
Children: Having fallen during the 2000s to a rate of 18% in2008, there have been significant increases in Ireland’s childpoverty rate since 2008. In 2010 the rate was 19.7% ofchildren (those under 18), a rate which is just under the EU27average of 20.5% (Eurostat, 2012e). This has risen from 18%in 2008 or by almost 2 percentage points.
Older People: In Ireland the risk of poverty rate for people over65 has fallen since 2008 and was 10.6% in 2010 (Eurostat,2012f). It is important to note, as the EU Social ProtectionCommittee argues generally in relation to pensions, thatapparent improvements relative to poverty should be seen inrelation to declines in the poverty thresholds rather than asimprovements in the economic situation of people aged 65+ inreal terms (2012, p 20). Neither does it prove that people haveenough to live on, and light has been shed on this issue by studiespublished in Ireland since 2010. Having regard to the needs(personal, psychological and social) of an older person livingalone in rural Ireland, the study found that a weekly income of€349.09 was necessary (McMahon et al, 2010, updated for2012). This would be considerably more than the weekly incomeof someone living on the poverty line in Ireland25 and exceedsconsiderably the amount of the State pension (contributory andnon-contributory). It is also important to note how dependentIrish older people are on social welfare payments to protect themfrom poverty. Without social welfare payments, around 90%of over 65s would be living in poverty (CSO, 2010).
Working Poor: The rate of poverty in Ireland for people whowork and who still do not earn enough to protect them frompoverty (the working poor) is 7.6% (2010), which is just underthe EU27 average of 8.4% (Eurostat, 2012g). There has beena considerable increase in the rate in Ireland since 2008, whenit was 6.5%.
25
20
15
10
5
0
Percentage (%)
PAROP
Ireland, PAROP, SMD and VLWI (%)
2003 2004 2005 2006 2007 2008 2009 2010
IRELAND FIGURE 4
SMD VLWI
Source: Eurostat, 2012c, t2020,51,52,53PAROP: People at risk of poverty, 60% thresholdSMD: Severely Materially DeprivedVLWI: Very Low Work Intensity (See Glossary for definitions)
24 The 60% at risk of poverty threshold is 60% of median equivalised incomes. The at risk of poverty threshold n Ireland for a single person was €13,797 in 2008. It fell to €11,929 in2010. See Appendix 5
25 The 60% at risk of poverty threshold is 60% of median equivalised incomes, which was €11,929 in 2010. This amounts to €229 per week. See Appendix 5. This amount is above thegeneral rate of the non-contributory state pension (€219 per week) and almost equates to the contributory state pension (€230 per week).

T H E I M P A C T O F T H E E U R O P E A N C R I S I S C A R I T A S R E S P O N S E T O A U S T E R I T y26
26 In Greece, Spain and Portugal the percentage reduction in disposable income was between 2-3% but in all cases the researchers note that more austerity measures were beingplanned in all the countries they reviewed – remember too that this research was published in 2011.
27 Ireland had a General Election in March 2011 and a change of Government followed.
Research undertaken on the impact of austerity measuresacross income groups (to 2011) in a number of Europeancountries (including Ireland, Greece, Spain and Portugal andalso the UK and Estonia) found that the size of the adjustmentundertaken in Ireland was substantially greater than in theother countries representing approximately 8% of disposableincome26 (Callan et al, 2012, p. 53; Callan et al 2011, p 11).
Overall, the measures introduced between 2009 and 2011 inIreland are described as progressive with, for example, the cutsto public sector pay affecting people with higher incomes morethan those in the bottom deciles (Callan et al, 2012). The term‘progressive’ means that better-off households pay a largershare, although this is not surprising as better-off householdshave a disproportionate share of total income – they also havea greater ability to pay, so this does not signify if the distributionis related to ability of groups to pay or, in other words, whetherit is equitable or not (Callan et al, 2011, p 12. 13).
The situation worsened for those in the bottom income groupsin 2012. Measures implemented as part of Budget 2012 byIreland’s new government27 (since the cross-country studydiscussed above was completed) have been found to affect thepoorest more than the richest. In 2012, the poorest 40% ofhouseholds were predicted to see a fall of between 2-2.5% intheir incomes; the richest 30% to lose only 0.7% of theirs as aresult of Government’s decisions in Budget 2012 (Callan et al,2012). The measures involved were indirect tax increases (VATand carbon levy) and selective reductions in welfare payments.
It is notable that along with Cyprus, Ireland is the onlyEuropean country where within the last year the greatestimpact of financial distress in households has been seen in thelower income quartiles rather than the upper quartile(European Commission, 2012, p.29).
Discussion: Impacts on Vulnerable Groups
Relative to future measures, the IMF has conceded that no‘low-hanging fruit’ is left and has suggested that expenditurereductions become progressively more difficult in the laterphases of consolidation or when key services begin to beaffected (IMF, 2012, p. 22).
Successive cuts to most welfare rates once the crisis beganmean that most social welfare payments in Ireland are belowthe poverty line, with the weekly social assistance paymentfor a single adult being €19.94 below the poverty line (SocialJustice Ireland, 2012; Healy et al, 2012) and this is so eventhough the poverty threshold is decreasing (See Appendix 5).
In Ireland account must be taken of this before any furtherexpenditure cuts are contemplated. The effect of Budget 2012measures in relation to the highly negative impact of indirecttaxes on lower-income groups should also be factored intothese decision-making processes.
Cuts have already been made in health and education services,and severe cuts in essential home care supports to olderpeople have been announced (Autumn, 2012). However, whilethe impact of cuts to services (like health, social care oreducation) cannot be assessed in a report of this nature, thesecuts inevitably particularly affect those who do not havesufficient income to compensate for them.

T H E I M P A C T O F T H E E U R O P E A N C R I S I S C A R I T A S R E S P O N S E T O A U S T E R I T y 27
In the late 1980s and early 1990s Italy had strong economicgrowth and strong performance in exports. However, growtheventually stagnated, and between 2001 and 2008 averagegrowth was only 0.8% of GDP (Menendez, 2012).
For many years in the 2000s Italy’s debt was the highest inEurope. In more recent years, debt levels in Greece haveovertaken Italy at the top of the league, but Italy’s debt levelsremain second only to Greece. By 2011 the ratio of governmentdebt to GDP was 120.7%. Table 7, below, shows the increasein both the government deficit and the government gross debt(as a percentage of GDP) between 2004 and 2011. See alsoAppendix 1.
Latest figures from Eurostat relating to quarter 2, 2012,suggest that the ratio of government gross debt has continuedto increase and is now 126.1% of GDP, second only to Greeceand followed by Portugal and Ireland (Eurostat, 2012L).
Large public debt and low growth left Italy vulnerable to theeconomic crisis of 2008 and to the subsequent crisis in theEuro zone. Italy came under intense financial pressures in2011 as Government bond yields went above 7%. It was urgedseveral times by the Institutions of the European Union toaddress structural weaknesses considered to be causing itsvery low growth rates. However, like Spain, Italy is considered‘too big to fail.’
Background and Government Finances
Some measures to address the crisis were introduced underthe government of Silvio Berlusconi, and the new Government(under Mario Monti) introduced a large range of measuresincluding fiscal consolidation, plans to liberalise services andto introduce labour reforms (IMF, 2012e).
The IMF regularly monitors and advises Italy on possibleeconomic risks and on consequent policy adjustments as partof its surveillance role (as it does with its other members) (IMF,2012b). Italy is not, of course, a ‘programme’ country in thesense of having requested assistance in the way that Greece,Ireland and Portugal have. According to the IMF’s latest reporton Italy, successive rounds of austerity measures haveimpacted on employment and growth (IMF, 2012e, StaffStatement, p.1). The IMF still considers Italy vulnerable to anintensification of the Euro area crisis (IMF, 2012e).
As Table 8, below, shows, Italy’s economy contracted from2006 and returned to modest growth in 2010. However, mostrecently, GDP has contracted for a fourth consecutive quarterat the end of quarter 2, 2012 (European Commission, 2012,Table 6, p.69). The European Commission has recently reducedits forecasts for 2012 and 2013.
Italy
2004 2005 2006 2007 2008 2009 2010 2011
Government deficit/surplus, % GDP -3.5 -4.4 -3.4 -1.6 -2.7 -5.4 -4.5 -3.9General Government Gross Debt % GDP 103.4 105.7 106.3 103.3 106.1 116.4 119.2 120.7
Source: Eurostat, 2012j,2012k, tsdde410; gov_dd_edpt1
ITALY TABLE 7 Government Debt Rates
Percentage change on previous year2006 2007 2008 2009 2010 2011 2012 (f) 2013 (f)
EU (27 countries) 3.3 3.2 0.3 -4.3 2.1 1.5 -0.3* 0.4*Italy 2.2 1.7 -1.2 -5.5 1.8 0.4 -2.3* -0.5*
Source: Eurostat, 2012, tec00115;*European Commission, 2012b - f: forecast - IMF forecast: for 2012: -2.3 %; for 2013: -0.7% (IMF, 2012f, p. 66)
ITALY TABLE 8 Real GDP growth rate - volume
On the social climate, Italy has seen the single largestdecline of any of the 27 Member States from 2011 to 2012.

T H E I M P A C T O F T H E E U R O P E A N C R I S I S C A R I T A S R E S P O N S E T O A U S T E R I T y28
A number of modifications to the tax and benefits system wereintroduced by the Berlusconi government in 2008 before theimpact of the crisis was felt. They intended to cushion theeffects of the crisis on poor families. These included a ‘socialcard’, a ‘family bonus’, a power (electricity) bonus, gas bonusand relief from property tax on residences. Such measures wereintended to address the type of welfare system operating, whichhas been characterized as a relatively ‘weak’ Mediterraneanmodel which relies a great deal on family supports.28 Themeasures have been extended and maintained during the crisis,although without, in the opinion of Caritas Italy, being modifiedsufficiently in light of the circumstances to make them effective.In addition, extensions were made to the Wage Guarantee Fund(Caritas Italiana, 2012a). This latter measure along withunemployment benefit are considered by Caritas Italy to havemade the greatest contribution to protecting people frompoverty, although to have been of limited value to workers onatypical contracts (who are often young people and more casualworkers) (Caritas Italiana, 2012a).
Over the past 3-4 years, new tax-deduction measures havefollowed for certain types of families (for example, those withchildren under 3, families paying mortgages). However, CaritasItaly points out that there is a gap in respect of ‘famiglieincapienti,’ - those who have insufficient income to declare taxesto whom the measures do not apply (Caritas Italiana, 2012c).
A number of large-scale cuts over the period 2009-2012 werealso proposed to funds available for social policies (includingpolicies for young people, families, housing, children andadolescents) under the Berlusconi government and otherprogrammes were cancelled (including programmes for inclusionof immigrants and childcare services) (Caritas Italiana, 2012a).
Policy Responses
A series of austerity packages were introduced in 2011 (July andSeptember), and in October 2011 at a crisis summit of EU leaders,significant additional measures were required (Thomsen-Fasano,2012). The new Government introduced a range of measures(associated with the ‘Save Italy’ decree, Dec 2011). These included:5 Changes to pensions such as progressive raising of the pensionage aiming for longer term sustainability,
5 A shift from direct to indirect taxes,5 Higher taxation on wealthy, especially on property andmeasures to counter tax evasion,
5 Increased VAT and excise taxes on fuels,5 Wage cuts for senior civil servants (by 10%), wage freeze forother public servants since 2010
5 ‘streamlining’ costs in healthcare and education(IMF, 2012e, p. 20, 21, Staff Statement, p.1,2, Ministero DellEconomia E Delle Finanze, Italy, 2012, p. 42-47).
Roughly two-thirds of the measures relied on raising revenue,while one third relied on expenditure cuts (IMF, 2012e).
The Italian government has approved changes in labour marketpolicy intended to promote growth in the economy. Themeasures provide for an easing of licensing systems in someprofessions designed to make them more open, measures tomake it easier to dismiss employees and also, in an effort tobalance those measures, the introduction of universalunemployment insurance (European Commission, 2012, p. 64;IMF, 2012e, Staff Statement, p. 3).
Caritas Italy has welcomed measures recently approved relativeto exchange transactions intended to dissuade financialspeculation, and wishes to see those measures strengthenedand extended (Caritas Italiana, 2012c).
In 2011, the employment rate in Italy was 61.2% as comparedwith an EU27 average of 68.6% for people aged 20-64. Figure5, below, shows how employment fell from 2008, with a slightimprovement in 2011. However, in the first quarter of 2012 it fellagain and stands at 60.7%, as compared with an EU27 averageof 68% (European Commission, 2012, Table 11, p. 71).
Employment/Unemployment
28 See discussion above under the heading ‘Welfare Systems’. The Mediterranean model can be classified as weak in terms of its performance by comparison with the standard of typicalScandinavian or Continental European countries as it, amongst other things, relies on the role of the family as a social security cushion and informal networks (Ponzini and Pugliese,cited in Caritas Italiana, 2012b). The usefulness of these measures (that is, those such as the ‘Social card’, ‘Family bonus’ and ‘power bonus’) in addressing poverty in anycomprehensive way is also questioned by Caritas Italy
727068666462605856
Percentage (%)
EU (27 Countries) Italy
Employment Rate, age group 20-64
2006 2007 2008 2009 2010 2011
ITALY FIGURE 5
Source: Eurostat, 2012b, t2020_10

T H E I M P A C T O F T H E E U R O P E A N C R I S I S C A R I T A S R E S P O N S E T O A U S T E R I T y 29
The employment rate varies strongly between regions, rangingfrom 65.1% in the north (Settentrione) to 44.2% in the south(Mezzogiorno) (2nd quarter 2012) (European Commission,2012, p. 63).
Another feature of the employment situation in Italy is the largenumber of part-time jobs. In the past year (to July 2012) therewas a further loss of full-time jobs (down 2.3% or 439,000 full-time jobs) and an increase in part-time jobs (+10.9% or 391,000part-time jobs). The share of part-time jobs of all jobs thereforerose to 17.3% (European Commission, 2012, p. 63).
The unemployment rate was 8.4% in 2011 representing2.1million people (Eurostat, 2012i). The rate is worsening andhas gone from a rate which was below the EU27 average inJuly, 2011 to a rate of 10.8% in September 2012 – just abovethe average of 10.6% (Eurostat, 2012n). See Appendix 7. Innumerical terms, the annual increase (to July 2012)represented 726,000 more unemployed people resulting in atotal of 2.7million unemployed people (quarter 2, 2012)(European Commission, 2012, p.63). See Table 9.
The European Commission has noted that the rate of increasein unemployment in the south (Mezzogiorno) is particularlyworrying in the past year, having risen from 13.1% to 17.1%,and that the rise is especially notable among men in thatregion (from 11% to 16%) (European Commission, 2012, p.63).
Amongst non-Italians the unemployment rate rose from10.9% to 13.6% (in the year to July 2012) (EuropeanCommission, 2012, p. 63).
Youth unemployment (age 15-24) is particularly marked inItaly. The youth unemployment rate is 35.3%, and amongstEuropean countries is exceeded only by Spain, Portugal andGreece (July 201229) (European Commission, 2012, p 72). Whilethe average unemployment rate increased by 2.5 percentagepoints between July 2011 and July 2012, the rate of increasein youth unemployment was 7.5 percentage points, thehighest rate of increase in the EU of the 19 countries for whichdata is available EU (to July 2012) (European Commission,2012, p 72).
A growing number of young people have moved to Germanyor outside the EU to work (European Commission, 2012, p. 63).
Italy’s long-term unemployment rate is also increasing,standing at 5.3% (Quarter 1, 2012) and above the EU27average (4.5%). More than half (53.1%) of those who areunemployed are long-term unemployed (that is, unemployedfor more than 12 months) (2nd quarter, 2012) (EuropeanCommission, 2012, p 63).
2011 2012
Unemployment – rate (%) 8.4% 10.8% (Sept)Unemployment – number of people 2.1million 2.7million (Q2)Youth Unemployment Rate (15-24) 35.3% (July)Long-term Unemployment Rate (unemployed for 12 months or more) 5.3% (Q1)Share of unemployment that is long-term 51.9% 53.1% (Q2)
Source: Eurostat, 2012i; Eurostat, 2012n, European Commission, 2012, p. 63, 72
ITALY TABLE 9 Unemployment-Headline Statistics
The comparable data available on poverty for Italy relates to2010 (relying on data from the previous year, 2009), indicatingthe impact only of the early stages of the crisis.
The Italian rate under the combined ‘at risk of poverty or socialexclusion’ indicator used throughout Europe (for the purposesof assessing progress toward the targets of the Europe 2020Strategy) was 24.5% in 2010 representing some 14.7millionpeople, a rate which exceeds the EU27 average of 23.4%(Eurostat, 2012c). Rates for each of the three measures thatmake up the combined ‘at risk of poverty or social exclusion’indicator are set out in Appendix 3 and indicated below inFigure 6.
Poverty
29 The rate for Greece (of 55.4%) relates to June 2012 as data from Greece for July 2012 is not available
20
15
10
5
0
Percentage (%)
PAROP
Italy, PAROP, SMD and VLWI (%)
2003 2004 2005 2006 2007 2008 2009 2010
ITALY FIGURE 6
SMD VLWI
Source: Eurostat, 2012c, t2020,51,52,53PAROP: People at risk of poverty, 60% thresholdSMD: Severely Materially DeprivedVLWI: Very Low Work Intensity (See Glossary for definitions)

The rate of relative income poverty or ‘at risk of poverty rate’in Italy was 18.2% in 2010, which is a slight fall on the 2010level (18.4%) but above the EU27 average rate of 16.4%. Thisrepresents 10.9 million people (Eurostat, 2012c). Italy stood in21st place with a level very similar to Portugal and exceededby only six countries (Greece, Lithuania, Bulgaria, Spain,Romania and Latvia). See Appendix 4. It might be asked whythe risk of poverty rate did not increase, given the fall inemployment and expenditure cuts, but there is a time lag inthe availability of data, meaning that these poverty ratesrelate only to the early years of the economic crisis in Europe.
As Figure 6 shows, one of the indicators within the threeindicators of poverty increased between 2009 and 2010 - thatfor people living in households with very low work intensity.This rate went from 8.8% in 2009 (which was just below theEU27 average) to 10.2% in 2010, which is just above the EU27average, and represents an increase of 592,000 in one year(Eurostat, 2012c). This is a worrying trend, as it signals adanger of long term exclusion from the labour marketsomething that is also reflected in the high rate of long-termemployment amongst those who are unemployed (as discussedabove).
Furthermore, the indicator for severe material deprivation isalso at a higher level in 2010 (6.9%) than it was in 2006(6.3%) having climbed, in between times, to 7.5% in 2008
(Eurostat, 2012c, see Appendix 3). The increase in numericalterms represents an increase of some 477,000 people between2006 and 2010, totaling 4.1million in 2010 (Eurostat, 2012c).
Child Poverty: Italy’s rate of child poverty has been highrelative to the EU27 average since at least 2005 (whencomparable data are available from Eurostat). In 2010 the ratewas 24.7% and there had been a slight increase between 2009and 2010. This rate was above the EU27 average of 20.5%(Eurostat, 2012e), exceeded only by Spain, Bulgaria, Latvia andRomania.
Older People: The risk of poverty rate for people aged 65+ inItaly is 16.6% - similar to the EU27 average rate (16%) for2010 (Eurostat, 2012f), and similar to the rate for the workingage population (16.9%) (The Social Protection Committee,2012, Table 5). The rate has fallen in recent years. However,the rate is considerably higher for older women in Italy(19.5%) than older men (12.6%) in 2010 – a gap of nearly 7percentage points (Eurostat, 2012f).
Working Poor: The rate of poverty in Italy for people whowork and who still do not earn enough to protect them frompoverty (the working poor) is 9.4% (2010), which is above theEU27 average of 8.4% (Eurostat, 2012g). The rate has shownconsiderable variation since 2006 and is slightly lower in 2010than in was in 2009.
T H E I M P A C T O F T H E E U R O P E A N C R I S I S C A R I T A S R E S P O N S E T O A U S T E R I T y30
30 In fact it shows a slight decrease between 2009 and 2010
31 This is based on the collection of data from a representative sample of 195 Centres located in 15 regions.
Italy already had a high rate of income poverty relative to theEU27 average before 2008. (See Appendix 3). As has alreadybeen said, the time lag in availability of comparable datameans that the poverty rates examined in this report captureonly the early stages of the economic crisis. While the rate ofrelative income poverty (the at risk of poverty rate) does notyet show an increase,30 some deteriorations are identifiablewithin the recognised indicators for poverty, such as theincrease in people living in households that are distanced fromthe labour market (that is, people in households where no oneis working or working much) between 2009 and 2010, and therise in severe material deprivation between 2006 and 2010.
The rate for child poverty is above the European average andhas shown a slight increase. The rate of poverty of olderwomen must be of particular concern.
The fall in employment since 2008 has meant that there hasbeen a sharp rise in unemployment (particularly marked in thesouth within the past year), as well as an increase in part-time
Discussion: Impacts on Vulnerable Groups
jobs as a proportion of all jobs. Unemployment amongst youngpeople (aged 15-24) is a particular problem and the rate ofincrease in youth unemployment is the highest rate of increasein the EU in the year to July 2012 (of the countries for whichdata is available). Long-term unemployment is increasing andover half of those who are unemployed are now in thiscategory.
On the ground there is evidence of a rise in those seeking helpfor income and social problems since 2007. Caritas Italy hasbeen able to identify a large increase in those seeking helpfrom the approximately 3,000 ‘Centri di Ascolta’ (orCounselling Centres) located throughout Italy, which deal withpeople experiencing a wide range of social problems. Since2007 there has been an increase in the numbers seeking helpin each year to 2011. In 2008 this increase was 8.5% over theprevious year. In 2011, there was a marked rise in requests forhelp, representing 54.1% more people seeking help than haddone so in 200731 (Caritas Italiana, 2012c). Similarly, there hasbeen a large increase (70.7%) between 2010 and 2012

T H E I M P A C T O F T H E E U R O P E A N C R I S I S C A R I T A S R E S P O N S E T O A U S T E R I T y 31
amongst the projects delivered by local churches and CaritasItaly to address poverty and exclusion32 (Caritas Italiana,2012c).
There is also some independent evidence of a rise in distressamongst Italian households during 2011 and 2012, inparticular. The European-wide consumer surveys (carried outunder the joint harmonised EU programme of business andconsumer surveys) show how many households are facingfinancial difficulties, such as running into debt to covercurrent expenses. Amongst European countries, there are someinteresting points to note about the situation of Italy over thepast year (to July 2012):
5 Italy is the country in which consumer opinion has declinedmost sharply, and
5 Amongst households in the lower income quartile (that is, thelowest 25%), Italy is the country in which financial distresshas risen most sharply, showing a rise of 10 percentage points(European Commission, 2012, p 30).
In the Eurobarometer survey of the views of Europeans on thesocial climate, Italy has seen the single largest decline of anyof the 27 Member States from 2011 to 2012, from -1.1 to -3.1.Its ranking has declined from thirteenth in 2011 to twenty-third in 2012 (out of EU27) (European Commission, 2012, p43-46).
Finally, it may be worth noting that the impact of cuts toservices (like health, social care or education) cannot beassessed in a report of this nature. However, these cuts aremost likely to particularly affect those who do not havesufficient income to compensate for them. Measures taken tocut education budgets in Italy should take account of the highrate of early school leaving33 that already exists (18.2% in2011, which is above the EU27 average rate of 13.5%), whichif worsened will have both personal effects on the life chancesof those involved as well, ultimately, on the economy. The lowrates of attainment of tertiary education34 (20.3% in Italy asopposed to an EU27 average rate of 34.5% in 2011) also needto be borne in mind (Eurostat, 2012m).
32 Such as microloans, grants, information provision on employment and housing, and innovative projects aimed especially at supporting families
33 Early leavers from education and training refers to the % of the population aged 18-24 with at most lower secondary education and not in further education or training (Eurostat, 2012m)
34 Tertiary education attainment levels are assessed as the share of the population aged 30-34 years who have successfully completed university or university-like (tertiary-level)education (Eurostat, 2012m)
Caritas Italy programmes are responding to new types of povertythat they identify as emerging, such as:5 Adults aged 40-50 years who find themselves unemployed
after a lifetime of regular work,5 Young adults whose work consists of temporary contracts,
which means that they are constantly having to seek new workand are prevented from planning for the future,
5 Entrepreneurs with debt trouble and facing bankruptcy,5 Immigrants who had formerly been beneficiaries who (some 4-
5 years later) have to seek help again having lost their jobs orhaving to seek work in the grey economy
5 Older people trying to help children and sometimes grandchildren,sometimes by entering into arrangements where they sell theirhouses retaining only a right of residence until death (CaritasItaliana, 2012c)
Caritas Italy
PROFILE

T H E I M P A C T O F T H E E U R O P E A N C R I S I S C A R I T A S R E S P O N S E T O A U S T E R I T y32
35 The Portuguese Authorities have noted, however, that rising unemployment and growth in exports is less favourable to tax revenues (IMF, 2012a, Letter of Intent, June 27, 2012 p49)
Since joining the Euro in 1999, Portugal has had the lowestgrowth in the Eurozone and suffered from low productivityand competitiveness. Between 2001 and 2007 Portugalexperienced only 1.1% average annual growth (Menendez,2012). The government deficit was -6.5% of GDP in 2005 andit was -3.1% in 2007 (see Table 10). When the global financialcrisis occurred, a drop in tax revenues led to further increasesin the government deficit and in general gross debt. At 108.1%in 2011, Portugal had the third highest general governmentgross debt to GDP ratio in Europe (EU27), behind only Greeceand Italy (Eurostat, 2012j).
As debt continued to grow investors were unwilling to lendand in May 2011 Portugal was the third country to seek a‘bailout’ from the EU-ECB-IMF troika. The programme reviewone year later was published by the IMF in July 2012 (IMF,2012a). The objective agreed was to reduce the Governmentdeficit to 4.5% of GDP by 2012 and to 3% of GDP by 2013(IMF, 2012a, p. 12, 21). More recently agreement has beenreached in light, inter alia, of the ‘considerable sacrifice beingmade by the Portuguese people’ to change the target for 2013to 4.5% (IMF, 2012d). Amongst the July objectives set for theprogramme the following is outlined:
Background and Government Finances
‘..maintain fiscal consolidation over themedium term up to a balanced budgetaryposition, notably by containing expendituregrowth. This consolidation will be achievedby means of high-quality permanent measuresminimizing the impact of consolidation onvulnerable groups’
(IMF, 2012a, MOU, p 4 – emphasis added)
Additional consolidation measures of about 3% of GDP are tobe adopted in 2013 to meet the 4.5% of GDP deficit target(European Commission, 2012b, p 98).
As Table 11 shows, the Portuguese economy shrank between2007 and 2010, and again in 2011 and is likely to continue tobe in negative figures in 2012. Domestic demand in particularis shrinking but this is balanced somewhat by the exportperformance35 (IMF, 2012a, Table 1, p 26). Most recently theeconomy shrank again in quarter 2, 2012, which was the fifthconsecutive quarter showing a decline (European Commission,2012, p. 9, 69). The Autumn projections for 2012 from theEuropean Commission are more pessimistic than the Springforecasts due, in the Commission’s opinion, to the dampeningof domestic demand by consolidation measures and a declinein external demand (2012b, p 97).
Portugal
‘The most vulnerable social groups have been hit hardest by the fiscal austerity measuresimplemented in Portugal. The government should strengthen its efforts to mitigate thenegative impact of the financial crisis, in particular on children, elderly and the Roma,’Commissioner Muižnieks, Commissioner for Human Rights of the Council of Europe
2004 2005 2006 2007 2008 2009 2010 2011
Government deficit/surplus, % GDP -4.0 -6.5 -4.6 -3.1 -3.6 -10.2 -9.8 -4.4General Government Gross Debt % GDP 61.9 67.7 69.4 68.4 71.7 83.2 93.5 108.1
Source: Eurostat, 2012j,2012k, tsdde410; gov_dd_edpt1
PORTUGAL TABLE 10 Government Debt Rates
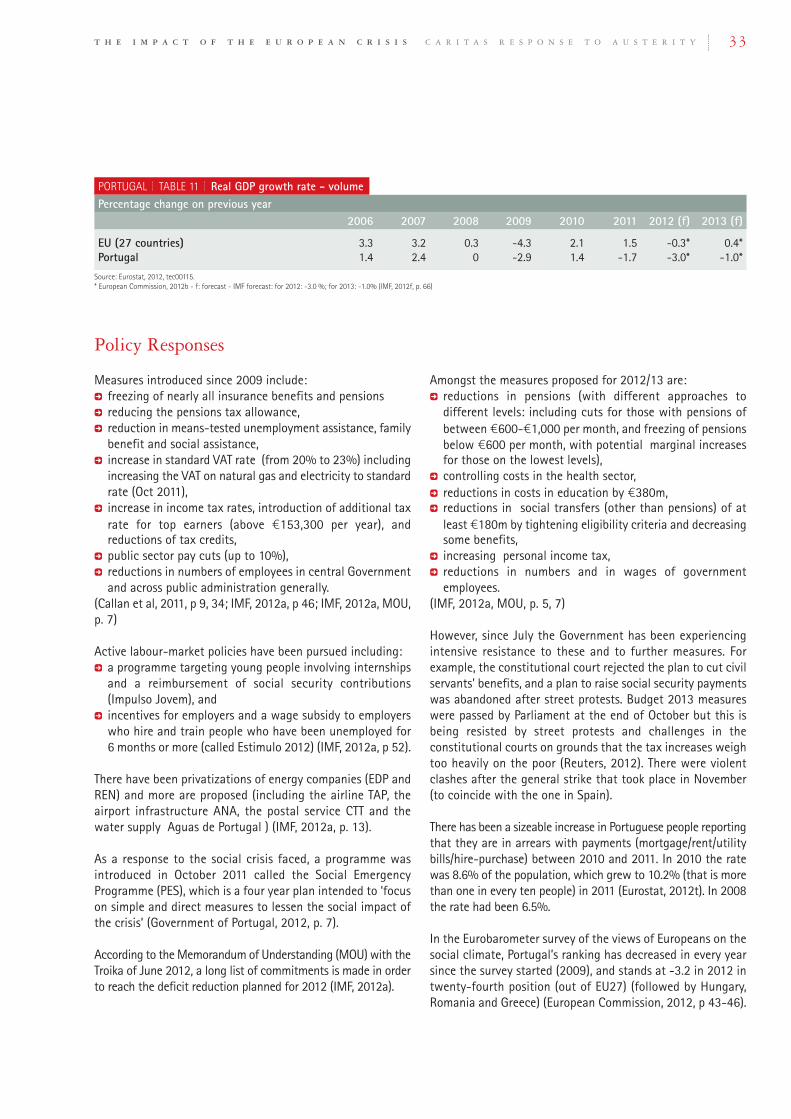
T H E I M P A C T O F T H E E U R O P E A N C R I S I S C A R I T A S R E S P O N S E T O A U S T E R I T y 33
Percentage change on previous year2006 2007 2008 2009 2010 2011 2012 (f) 2013 (f)
EU (27 countries) 3.3 3.2 0.3 -4.3 2.1 1.5 -0.3* 0.4*Portugal 1.4 2.4 0 -2.9 1.4 -1.7 -3.0* -1.0*
Source: Eurostat, 2012, tec00115.* European Commission, 2012b - f: forecast - IMF forecast: for 2012: -3.0 %; for 2013: -1.0% (IMF, 2012f, p. 66)
PORTUGAL TABLE 11 Real GDP growth rate - volume
Measures introduced since 2009 include:5 freezing of nearly all insurance benefits and pensions5 reducing the pensions tax allowance,5 reduction in means-tested unemployment assistance, familybenefit and social assistance,
5 increase in standard VAT rate (from 20% to 23%) includingincreasing the VAT on natural gas and electricity to standardrate (Oct 2011),
5 increase in income tax rates, introduction of additional taxrate for top earners (above €153,300 per year), andreductions of tax credits,
5 public sector pay cuts (up to 10%),5 reductions in numbers of employees in central Governmentand across public administration generally.
(Callan et al, 2011, p 9, 34; IMF, 2012a, p 46; IMF, 2012a, MOU,p. 7)
Active labour-market policies have been pursued including:5 a programme targeting young people involving internshipsand a reimbursement of social security contributions(Impulso Jovem), and
5 incentives for employers and a wage subsidy to employerswho hire and train people who have been unemployed for6 months or more (called Estimulo 2012) (IMF, 2012a, p 52).
There have been privatizations of energy companies (EDP andREN) and more are proposed (including the airline TAP, theairport infrastructure ANA, the postal service CTT and thewater supply Aguas de Portugal ) (IMF, 2012a, p. 13).
As a response to the social crisis faced, a programme wasintroduced in October 2011 called the Social EmergencyProgramme (PES), which is a four year plan intended to ‘focuson simple and direct measures to lessen the social impact ofthe crisis’ (Government of Portugal, 2012, p. 7).
According to theMemorandum of Understanding (MOU) with theTroika of June 2012, a long list of commitments is made in orderto reach the deficit reduction planned for 2012 (IMF, 2012a).
Policy Responses
Amongst the measures proposed for 2012/13 are:5 reductions in pensions (with different approaches todifferent levels: including cuts for those with pensions ofbetween €600-€1,000 per month, and freezing of pensionsbelow €600 per month, with potential marginal increasesfor those on the lowest levels),
5 controlling costs in the health sector,5 reductions in costs in education by €380m,5 reductions in social transfers (other than pensions) of atleast €180m by tightening eligibility criteria and decreasingsome benefits,
5 increasing personal income tax,5 reductions in numbers and in wages of governmentemployees.
(IMF, 2012a, MOU, p. 5, 7)
However, since July the Government has been experiencingintensive resistance to these and to further measures. Forexample, the constitutional court rejected the plan to cut civilservants' benefits, and a plan to raise social security paymentswas abandoned after street protests. Budget 2013 measureswere passed by Parliament at the end of October but this isbeing resisted by street protests and challenges in theconstitutional courts on grounds that the tax increases weightoo heavily on the poor (Reuters, 2012). There were violentclashes after the general strike that took place in November(to coincide with the one in Spain).
There has been a sizeable increase in Portuguese people reportingthat they are in arrears with payments (mortgage/rent/utilitybills/hire-purchase) between 2010 and 2011. In 2010 the ratewas 8.6% of the population, which grew to 10.2% (that is morethan one in every ten people) in 2011 (Eurostat, 2012t). In 2008the rate had been 6.5%.
In the Eurobarometer survey of the views of Europeans on thesocial climate, Portugal’s ranking has decreased in every yearsince the survey started (2009), and stands at -3.2 in 2012 intwenty-fourth position (out of EU27) (followed by Hungary,Romania and Greece) (European Commission, 2012, p 43-46).

T H E I M P A C T O F T H E E U R O P E A N C R I S I S C A R I T A S R E S P O N S E T O A U S T E R I T y34
Employment levels in Portugal have fallen markedly since2008, as Figure 7, below, shows, but were still marginallyhigher than the EU27 average in 2011 (69.1% in Portugal;68.6% average, age group 20-64). However, the latestindications are that the employment rate in quarter 1, 2012,was 67% for people aged 20-64, compared with an EU27average of 68%. Portugal’s employment rate declinedmarkedly (-4.2%) in the year to quarter 2, 2012 representing205,000 people. Its decline was exceeded only by Greece (-9%) (European Commission, 2012, p 13, 69).
Employment/Unemployment
At 12.9% at the end of 2011, the unemployment rate inPortugal represented 706,000 people and was above theEuropean average of 9.6% (Eurostat, 2012i). By September2012 the rate had increased markedly to 15.7% (855,000people), well above the European average of 10.6%, EU27(Eurostat, 2012n). In September Portugal had the fourth highestrate in Europe – behind, Spain, Greece and Latvia, and closelyfollowed by Ireland (Eurostat, 2012n). See Table 12, below, andAppendix 7.
At a rate of 36.4% youth unemployment (age 15-24) is veryhigh, and has grown at a rate of 7 percentage points in theyear to July 2012, a rate of growth exceeded only marginally byItaly (European Commission, 2012, p 72) .
Portugal’s long-term unemployment rate is also increasing,standing at 6.9% (Quarter 1, 2012) and well above the EU27average (4.5%). The proportion of those amongst theunemployed who were long-term unemployed (without workfor 12 months or more) at the end of 2011 was nearly 50%(48.2%) (Eurostat, 2012i).
747372717069686766
Percentage (%)
EU (27 Countries) Portugal
Employment Rate, age group 20-64
2006 2007 2008 2009 2010 2011
PORTUGAL FIGURE 7
Source: Eurostat, 2012b, t2020_10
2011 2012
Unemployment – rate (%) 12.9% 15.7% (Sept)Unemployment – number of people 706,000 855,000 (Sept)Youth Unemployment Rate (15-24) 36.4% (July)Long-term Unemployment Rate (unemployed for 12 months or more) 6.9% (Q1)Share of unemployment that is long-term 48.2%
Source: Eurostat, 2012i; Eurostat, 2012n, European Commission, 2012, p 72
PORTUGAL TABLE 12 Unemployment-Headline Statistics
As already mentioned there is a time-lag in the availability ofdata on comparable poverty measures across Europe. Figuresare now published for Portugal for 2011 (with a 2010 referenceperiod), but this still represents the relatively early stages ofthe impact of the crisis. It also relates to the period beforePortugal entered the IMF/EU assistance programme. Thediscussion of poverty indicators included in this section mustbe considered with those limitations in mind.
Poverty
Portugal has a high rate of ‘poverty and social exclusion’,which is the combined indicator used under the Europe 2020strategy. The rate rose in Portugal between 2009 and 2010 butshows a slight fall to a rate of 24.4% in 2011 (similar to the2009 level). This represents 2.6 million people (source,Eurostat, 2012c.). Portugal’s rate is higher than the EU27average rate of 23.4% (2010) (Eurostat, 2012c).

T H E I M P A C T O F T H E E U R O P E A N C R I S I S C A R I T A S R E S P O N S E T O A U S T E R I T y 35
The most commonly used indicator of poverty in Europe is theat risk of poverty rate – which is a relative poverty indicatorlinked to 60% of median incomes. Having fallen between 2004and 2009, the Portuguese at risk of poverty rate was 17.9% in2009 and 2010 and rose to 18% in 2011, which represents (in2011) over 1.9million people (Eurostat, 2012c). This increasehappened notwithstanding the fact that the risk of povertythreshold fell (between 2010 and 2011) in line with a fall inincomes generally36 (Eurostat, 2012h).
Portugal’s at risk of poverty rate is higher than the EU27average (of 16.4%). At 2010 levels, when availability of datamakes it possible to make a comparison with other countries,Portugal’s ranking was 20th, exceeded by only 7 othercountries: Italy, Greece, Lithuania, Bulgaria, Spain, Romaniaand Latvia (Eurostat, 2012c). See Appendix 4.
As Figure 8 shows, the indicator for people in households withvery low work intensity rose by 1.7 percentage points between
2009 and 2010, but in 2011 it fell marginally (to 8.2%).Therehas also been a slight reduction in the indicator for severematerial deprivation between 2010 and 2011 (Eurostat, 2012c).
Rates for each of the three measures that make up thecombined ‘at risk of poverty or social exclusion’ indicator areset out in Appendix 3.
Child Poverty: Portugal’s rate of child poverty has been abovethe EU27 average rate since at least 2005 (when comparabledata are available from Eurostat). Portugal’s child poverty ratefell between 2004 and 2007, but there was a sizable increasebetween 2007 and 2008 and the rate has remained at aboutthat level since. The 2010 rate is above the EU27 average: theaverage rate was 20.5%, while Portugal’s rate was 22.4%(2010 and 2011) (Eurostat, 2012e).
Older People: The risk of poverty rate for people aged 65+ inPortugal was 21% in 2010 and latest figures suggest a rate of20% for 2011, which is similar to the rate for 2009 (Eurostat,2012f). This is higher than the EU27 average of 16% (2010).Even though the rate has declined, it still remains considerablyhigher than the rate for the working age population (of 15.7%,aged 18-64) (2010) (The Social Protection Committee, 2012,Table 5). There was also a gap of 3.4 percentage pointsbetween the at risk of poverty rate for older men (18%) in2010 and that for older women (21.4%) (Eurostat, 2012f).Similarly, older women were more likely to be experiencingsevere material deprivation in 2010, with a rate of 10.8% asopposed to 7.9% for older men (The Social ProtectionCommittee, 2012, Table 11).
Working Poor: The rate of poverty in Portugal for people whowork and who still do not earn enough to protect them frompoverty (the working poor) is 10.3% (2011), which is abovethe 2010 EU27 average of 8.4% (in 2010) (Eurostat, 2012g).
25
20
15
10
5
0
Percentage (%)
PAROP
Portugal, PAROP, SMD and VLWI (%)
2003 2004 2005 2006 2007 2008 2009 2010 2011
PORTUGAL FIGURE 8
SMD VLWI
Source: Eurostat, 2012c, t2020,51,52,53PAROP: People at risk of poverty, 60% thresholdSMD: Severely Materially DeprivedVLWI: Very Low Work Intensity (See Glossary for definitions)
36 That is the 60% at risk of poverty threshold is 60% of median equivalised incomes. The at risk of poverty threshold in Portugal for a single person was €5,207 in 2010, and it fell to€5,046 in 2011. See Appendix 5
Portugal’s employment rate declined rapidly from 2008 andhas fallen markedly (-4.2%) in the year to Quarter 2, 2012, adecline exceeded only by Greece (European Commission, 2012,p 13, 69). Portugal’s unemployment rate is rising rapidly and(in July 2012) is the second highest of the 22 countries forwhich data are available. The youth unemployment rate is veryhigh (36.4%, July 2012), and the long-term unemploymentrate is increasing and represents around half of those who areunemployed.
As already mentioned, when it comes to assessing the positionof Portugal’s residents relative to poverty, the time-lag in
Discussion: Impacts on Vulnerable Groups
availability of data makes it difficult to give an up-to-datepicture. That being said, by comparison with Europeanaverages, Portugal has high rates of poverty. There are signs ofincrease between 2010 and 2011 in the at risk of poverty rate(which is the most commonly used poverty indicator acrossEurope). Portugal’s rates are higher than the EU27 averagerates across most of the indicators that are generally usedacross Europe. The rate of poverty of children increased in2008 and has stayed at that relatively high level since. Ratesfor both children and older people (particularly older women)remain of particular concern.

The Commissioner for Human Rights of the Council of Europereported on concerns for vulnerable groups in Portugalfollowing a visit in May 2012. Among these groups hehighlighted the situation of children, older people and Romapeople. The Commissioner drew attention to how thecombined effects of unemployment, cuts in salaries, increasedtaxes and reduced social and unemployment benefits hasresulted in growing poverty among many Portuguese families.The Commissioner (Muižnieks, 2012) noted that:5 Child poverty is rising with evictions due to non-paymentof mortgages having a particularly negative impact, andbudgetary restrictions in education being harmful in anoverall context where there is a high rate of school drop-outs. All of these factors suggest the risk of a resurgence ofchild labour, notably in the informal economic sector andagriculture.
5 Older people on low incomes are affected by the austeritymeasures including freezing of pensions and cuts in socialbenefits, increases in costs of health care, public transport,gas, electricity and food products affecting especially thoseliving in isolated rural areas. Violence towards older peoplehas increased with reportedly almost 40% of the olderpopulation in Portugal having suffered abuse within thefamily.
5 Roma continue to suffer from social exclusion and variousforms of discrimination, particularly as regards housing,education and access to employment.
For its part, according to Caritas Portuguesa, the Government’sSocial Emergency Programme is not able to deal with thesuffering caused by the crisis and the austerity measures. Theypoint to a mismatch between the measures undertaken andthe immediate and unfolding reality for families. The crisis isnot well understood by many people leaving those affectedwithout hope (Caritas Portuguesa, 2012). For many of thefamilies that Caritas Portugal is supporting, it is their first timehaving to seek help outside their family.
An analysis using the EUROMOD model of the impact ofausterity measures implemented up to mid-2011 in Portugalmade some important findings about the way that the measuresare impacting across income groups. In particular, the studyfound that the measures were regressive – meaning that lowerincome groups lost a higher proportion of their income thanhigher income groups (Callan et al, 2011). In fact, of the sixcountries considered in that research37 (up to mid-2011),Portugal was the only country in which percentage losses wereconsiderably larger (to 2011) in the first and second decilegroups than higher up the income distribution – in other wordsthe poorest people were hardest hit (Callan et al, 2011, p.13).
Furthermore, the increase in the standard rate of VAT (in 2011)was found to have resulted in a significant reduction in thelevel of household income, with the poorest quintiles (orpoorest 20%) being disproportionately affected whencompared to the top ones (Callan et al, 2011).
Across most of the countries included in their studyresearchers found that households with children have beenparticularly affected by increases in household incomes as aresult of austerity measures. This includes Portugal where theadverse effect on children is particularly marked forhouseholds with low incomes (Sutherland & Matsganis, 2011,p3; Callan et al, 2011, p13, 17).
It may be worth noting that the research just referred to of theimpact of austerity measures on households did not includethe impact of cuts to services like health, social care oreducation. These cuts are most likely to particularly affectthose who do not have sufficient income to compensate forthem. Bearing this in mind the researchers note that theiranalysis does not represent the full picture of the impact ofausterity measures (Callan et al, 2011, p 16). Proposals to cutexpenditure on education would have to take account of thefact that Portugal has one of the highest rates of early schoolleaving38 in Europe (23.2% as opposed to an EU27 average of13.5% in 2011). Any worsening of this situation would bedetrimental to the life chances of those involved and also, inthe longer term, to the economy. Portugal also has a tertiaryeducation attainment rate39 below the average (26.1% asopposed to an EU27 average rate of 34.6% in 2011) (Eurostat,2012m).
A very comprehensive list of austerity measures was agreed insummer 2012 with the Troika under Portugal’s assistancepackage (IMF 2012a), which included further reductions in socialtransfers and pensions, cuts in education and controllinghealth-care costs as outlined above. Given the high levels ofunemployment and poverty already being experienced inPortugal, and the findings that early measures disproportionatelyaffected poorer people, very serious impacts might be anticipatedon vulnerable groups. Protests and court challenges are nowaffecting the ability of Government to proceed with furthermeasures. As of early November 2012, the IMF is meeting withthe Government ahead of schedule to identify areas where it canmake additional cuts to spending (Reuters, 2012).
T H E I M P A C T O F T H E E U R O P E A N C R I S I S C A R I T A S R E S P O N S E T O A U S T E R I T y36
37 Estonia, Ireland, Greece, Portugal, Spain and UK
38 Early leavers from education and training refers to the % of the population aged 18-24 with at most lower secondary education and not in further education or training (Eurostat, 2012m)
39 Tertiary education attainment levels are assessed as the share of the population aged 30-34 years who have successfully completed university or university-like (tertiary-level)education (Eurostat, 2012m)
T H E I M P A C T O F T H E E U R O P E A N C R I S I S C A R I T A S R E S P O N S E T O A U S T E R I T y 37
Similar to Ireland, in Spain housing-market and banking crisesled to a sovereign debt crisis (Menendez, 2012, p 14). Factorswhich fuelled the property market boom included membershipof the Eurozone and availability of cheap credit frominternational banks and other lending institutions as well asfavourable tax treatment for mortgage payments (Menendez,2012, p 14). Prior to 2007, while there was significant privatedebt (that is, borrowings by citizens), Spain’s governmentborrowing was not high by relative standards (see Appendices1 & 2). But Spain had changed from the 1990s,when it hadlittle foreign borrowing, to relying heavily on external lenders(Menendez, 2012).
With the end of the housing boom in 2007 and the globalfinancial crisis, government deficit and general gross debtincreased from 2007 on as Table 13 shows. This was contributedto by the government’s measures to try and rescue its bankingsector, which had been severely affected by the collapse inproperty prices and by defaulting borrowers whose incomes haddropped due to the global recession.
All of these factors, and a forecast that the fiscal deficit wouldbe 8% of GDP (rather than the 6% forecast) for 2011, causedthe Government to introduce a series of measures at the endof 2011 (IMF, 2012c). Nonetheless, market tensions in Spring2012 necessitated seeking financial assistance and in Junethere was an announcement that assistance would be soughtto recapitalize the banks (IMF, 2012c, p 6). Financing of up to€100 billion has been made available to recapitalise the banks(IMF, 2012f, p3).
Background and Government Finances
While Spain is not a ‘programme’ country in the sense thatGreece, Ireland and Portugal are – assistance is being madeavailable relative to its banks’ recapitalization from EFSF/ESMand there is surveillance by the IMF (IMF, 2012b). TheEuropean Council has given Spain another year to reduce itsdeficit below 3% of GDP40.
One of the differences relative to Ireland is the sheer size ofthe Spanish economy – the fourth biggest in Europe, and assuch it was considered ‘too big to fail.’ Amongst the measuresenvisaged for the management of Spain’s banking crisis is debtsharing with the hybrid/subordinated bondholders (IMF,2012c).
According to the IMF, Spain is now in the middle of anunprecedented double-dip recession, with access to marketfinancing costly, unemployment high and public debtincreasing and sectors of the financial sector lacking capitaland access to markets. This situation poses risks to the rest ofEurope (IMF, 2012c). The IMF considers that the outlook is verydifficult (IMF, 2012c, p 10).
As Table 14 shows, following a contraction from 2007, growthwas very weak in 2011 and the forecasts are not good. Theeconomy shrank in quarter 2, 2012, which was the thirdconsecutive quarter showing a decline (European Commission,2012, p. 9, 69).
The latest analysis from the European Commission suggeststhat revenue shortfalls, higher interest payments and risingsocial transfers (due presumably to rising unemployment) havealmost offset savings from expenditure cuts (EuropeanCommission, 2012b, p 68).
Spain
40 The plan is as follows: 2012: 6.3% (previously 5.3%); 2013: 4.5% (previously 3%); 2014: 2.8% (previously 2.2%) (IMF, 2012c)
2004 2005 2006 2007 2008 2009 2010 2011
Government deficit/surplus, % GDP -0.1 1.3 2.4 1.9 -4.5 -11.2 -9.7 -9.4General Government Gross Debt % GDP 46.3 43.2 39.7 36.3 40.2 53.9 61.5 69.3
Source: Eurostat, 2012j,2012k, tsdde410; gov_dd_edpt1
SPAIN TABLE 13 Government Debt Rates
Youth unemployment (age 15-24)is a particular problem, with a rate of 52.9%.

T H E I M P A C T O F T H E E U R O P E A N C R I S I S C A R I T A S R E S P O N S E T O A U S T E R I T y38
Percentage change on previous year2006 2007 2008 2009 2010 2011 2012 (f) 2013 (f)
EU (27 countries) 3.3 3.2 0.3 -4.3 2.1 1.5 -0.3* 0.4*Spain 4.1 3.5 0.9 -3.7 -0.3 0.4 -1.4* -1.4*
Source: Eurostat, 2012, tec00115;*European Commission, 2012b - f: forecast - IMF forecast: for 2012: -2.3 %; for 2013: -0.7% (IMF, 2012f, p. 66)
SPAIN TABLE 14 Real GDP growth rate - volume
Responding to the economic crisis, Spain introduced a numberof stimulus measures in 2008-2009, some of which werereversed subsequently in 2010 when austerity measures wereintroduced as a response to pressure from financial marketsand the European Commission due to the rising deficit (Callanet al, 2011, p 8). Measures introduced in the 2010-11 periodincluded:5 elimination of universal birth grant from January 2011,5 freeze of the Indicator for Social benefits (IPREM) in 2012 –this affected child benefit and unemployment insurance andassistance,
5 tightening of the eligibility conditions for the TemporaryUnemployment Protection Programme (Programa Temporalde Proteccion por Desempleo e Insercion),
5 reduction of child benefit for children under 2 (from €500-€291) in 2011
5 means-testing of the €400 personal tax credit from 2010,5 cut to pay of Civil Servants (5% average, but could be up to9.7%) in 2010, pay freeze in 2011,
5 standard rate of VAT increased from 16% to 18%, andreduced rate increased from 7% to 8% from July 2010,
5 increased taxes for top earners (over €120,000) andincreases in taxes on capital income.
(Callan et al, 2011).
As it became clear that Spain’s deficit was going to be worsethan projected for 2011, Spain’s new Government introducedmeasures in December 2011 and subsequently in a draftbudget in April 2012. They included:5 expenditure cuts in education and health equal to 1% of GDP,5 increases on marginal tax rates on personal and capitalincome and on property sales.
(IMF, 2012c, p. 19).
There were also some ‘offsetting measures’ such as:5 slight pension increases,5 reinstatement of a mortgage deduction for housing,5 extension of the lower VAT rate for property transactions.(IMF, 2012c, p. 19)
Overall, the Budget 2012 measures presented to Parliament inApril 2012 involved a ratio of two thirds expenditure cuts, onethird revenue raising (IMF, 2012c, p 18, 19).
Policy Responses
In July 2012 the Government proposed a series of measuresincluding:5 VAT increases (standard rate increased from 18 to 21%;reduced rate from 8 to 10%; super-reduced rate unchangedat 4%) with some products moving to the higher rate,
5 unemployment benefit reduced (with the replacement rateafter six months falling from 60% to 50%),
5 mortgage income tax deduction to be removed,5 social security contributions reduced by one percentagepoint in 2013 and a further point in 2014
5 extra payment in December to civil servants suspended for2012 (equivalent to nearly a monthly wage)
(IMF, 2012c, p.2).
A range of other measures are also in train aimed at introducinggreater flexibility in employment contracts and dismissals(IMF, 2012c, p. 29).
In September 2012 an increased sales tax led to the sharpestmonthly fall on record in retail sales (Reuters, 2012).
Austerity measures have led to increasingly frequent protestsand caused a rise in separatist sentiments especially inCatalonia (Reuters, 2012). A general strike was held onNovember 14th, 2012 the second against the new Governmentsince they took office in December 2011. It was marked byviolent clashes in several cities.
In November also the issue of mortgage debt is high on thepolitical agenda as a series of suicides associated withevictions caused the government to promise action onmortgage debt for those hardest hit. Banks have repossessedsome 400,000 properties since 2008 (though not all of themare homes) (Reuters, 2012).
In the Eurobarometer survey of the views of Europeans on thesocial climate, Spain’s ranking has decreased in every yearsince the survey started (2009), and stands at -2.1 in 2012 ineighteenth position out of EU27 (European Commission, 2012,p 43-46).

T H E I M P A C T O F T H E E U R O P E A N C R I S I S C A R I T A S R E S P O N S E T O A U S T E R I T y 39
Figure 9, below, shows how Spain’s employment rate declinedrapidly from 2007 reaching 61.6% in 2011 as opposed to anEU27 average of 68.6% for those aged 20-64. The employmentlevel at quarter 1, 2012) is 59.6% for people aged 20-64,extending the persistent downward trend observed since 2008.Latest figures suggest that the employment rate declinedmarkedly (-4%) in the year to quarter 2, 2012, representing745,000 people. This decline was exceeded only by Greece (-9%) and (marginally) by Portugal (-4.2%). (EuropeanCommission, 2012, p 13, 69).
Employment/Unemployment
In 2011, Spain had the highest unemployment rate in the EU at21.7% well above the EU27 average rate of 9.6%, andrepresenting some 4.9 million people (Eurostat, 2012i). By July2012 the rate had worsened further to 25.1%. It was still thehighest rate in Europe and was 20.6 percentage points abovethe country with the lowest unemployment rate (Austria), thelargest gap seen in a decade (European Commission, 2012, p14, 72). Latest figures suggest that the rate has worsened againand in September, 2012 stands at 25.8% (just under 6millionpeople), the highest in EU27 countries and well above thecurrent EU27 average of 10.6% (Eurostat, 2012n). See Table15, below, and Appendix 7.
Youth unemployment (age 15-24) is a particular problem, witha rate of 52.9% (July 2012), a rate which is exceeded only bythat for Greece (55.4%, June 2012) and approaching 2.5 timesthe average rate (of 22.5%) (European Commission, 2012, p 72).
Spain’s long-term unemployment rate has increased in the pastyear (to quarter 1, 2012) by 1.7 percentage points, and nowstands at 10.3 %, second only to Greece and well above theEU27 average (4.5%) (European Commission, 2012). A highproportion (41.6%) of those amongst the unemployed waslong-term unemployed (without work for 12 months or more)at the end of 2011 (Eurostat, 2012i).
727068666462605856
Percentage (%)
EU (27 Countries) Spain
Employment Rate, age group 20-64
2006 2007 2008 2009 2010 2011
SPAIN FIGURE 9
Source: Eurostat, 2012b, t2020_10
2011 2012
Unemployment – rate (%) 21.7% 25.1% (July) - 25.8% (Sept)Unemployment – number of people 4.9million 5.9million (Sept)Youth Unemployment Rate (15-24) 52.9% (July)Long-term Unemployment Rate (unemployed for 12 months or more) 10.3% (Q1)Share of unemployment that is long-term 41.6%
Source: Eurostat, 2012i; Eurostat, 2012n, European Commission, 2012, p 72
SPAIN TABLE 15 Unemployment-Headline Statistics
For Spain comparable figures on poverty are published for2011 (with a 2010 reference period), but this represents therelatively early stages of the impact of the crisis and does notshow the impact of many of the measures introduced in Spainmore recently.
Nonetheless, the combined ‘at risk of poverty or socialexclusion’ indicator used under the Europe 2020 strategy hasrisen in Spain each year since 2008 (when the rate was22.9%). The 2011 rate is 27%, representing an increase ofsome two million people since 2008 and above the EU27average of 23.4% (Eurostat, 2012c.).
Rates for each of the three measures that make up thecombined ‘at risk of poverty or social exclusion’ indicator areset out in Appendix 3 and shown below in Figure 10.
Poverty
25
20
15
10
5
0
Percentage (%)
PAROP
Spain, PAROP, SMD and VLWI (%)
2003 2004 2005 2006 2007 2008 2009 2010 2011
SPAIN FIGURE 10
SMD VLWI
Source: Eurostat, 2012c, t2020,51,52,53PAROP: People at risk of poverty, 60% thresholdSMD: Severely Materially DeprivedVLWI: Very Low Work Intensity (See Glossary for definitions)
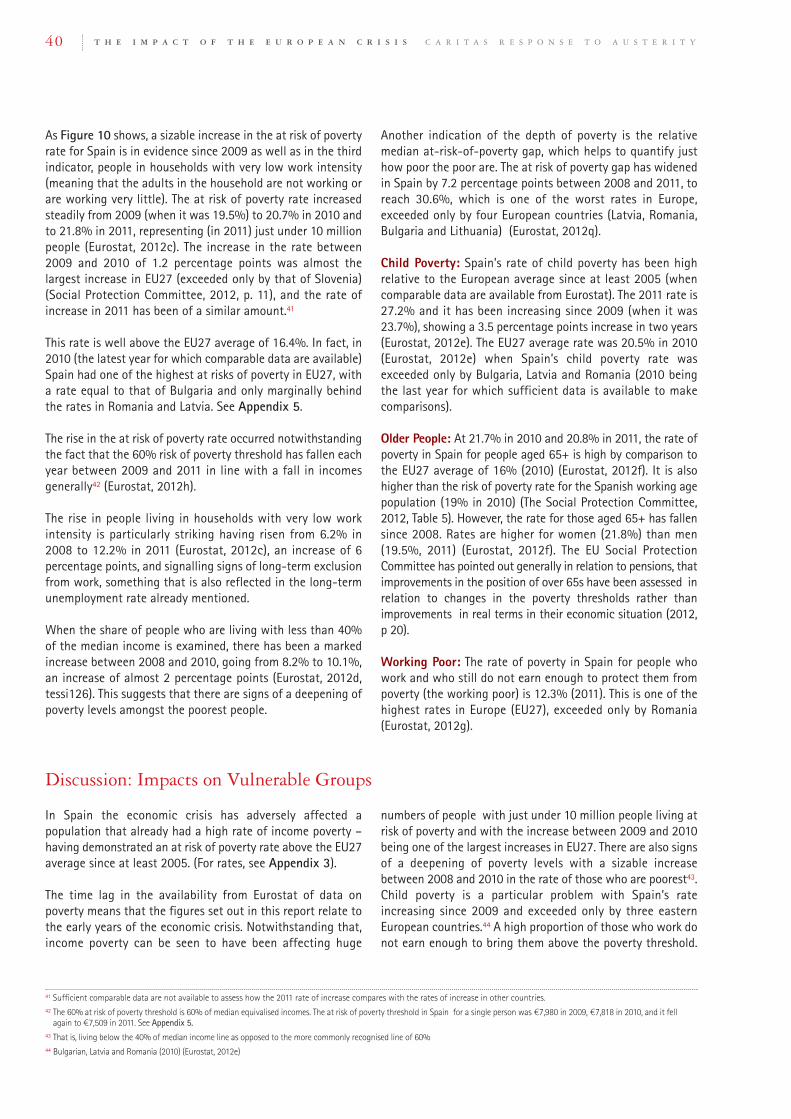
As Figure 10 shows, a sizable increase in the at risk of povertyrate for Spain is in evidence since 2009 as well as in the thirdindicator, people in households with very low work intensity(meaning that the adults in the household are not working orare working very little). The at risk of poverty rate increasedsteadily from 2009 (when it was 19.5%) to 20.7% in 2010 andto 21.8% in 2011, representing (in 2011) just under 10 millionpeople (Eurostat, 2012c). The increase in the rate between2009 and 2010 of 1.2 percentage points was almost thelargest increase in EU27 (exceeded only by that of Slovenia)(Social Protection Committee, 2012, p. 11), and the rate ofincrease in 2011 has been of a similar amount.41
This rate is well above the EU27 average of 16.4%. In fact, in2010 (the latest year for which comparable data are available)Spain had one of the highest at risks of poverty in EU27, witha rate equal to that of Bulgaria and only marginally behindthe rates in Romania and Latvia. See Appendix 5.
The rise in the at risk of poverty rate occurred notwithstandingthe fact that the 60% risk of poverty threshold has fallen eachyear between 2009 and 2011 in line with a fall in incomesgenerally42 (Eurostat, 2012h).
The rise in people living in households with very low workintensity is particularly striking having risen from 6.2% in2008 to 12.2% in 2011 (Eurostat, 2012c), an increase of 6percentage points, and signalling signs of long-term exclusionfrom work, something that is also reflected in the long-termunemployment rate already mentioned.
When the share of people who are living with less than 40%of the median income is examined, there has been a markedincrease between 2008 and 2010, going from 8.2% to 10.1%,an increase of almost 2 percentage points (Eurostat, 2012d,tessi126). This suggests that there are signs of a deepening ofpoverty levels amongst the poorest people.
Another indication of the depth of poverty is the relativemedian at-risk-of-poverty gap, which helps to quantify justhow poor the poor are. The at risk of poverty gap has widenedin Spain by 7.2 percentage points between 2008 and 2011, toreach 30.6%, which is one of the worst rates in Europe,exceeded only by four European countries (Latvia, Romania,Bulgaria and Lithuania) (Eurostat, 2012q).
Child Poverty: Spain’s rate of child poverty has been highrelative to the European average since at least 2005 (whencomparable data are available from Eurostat). The 2011 rate is27.2% and it has been increasing since 2009 (when it was23.7%), showing a 3.5 percentage points increase in two years(Eurostat, 2012e). The EU27 average rate was 20.5% in 2010(Eurostat, 2012e) when Spain’s child poverty rate wasexceeded only by Bulgaria, Latvia and Romania (2010 beingthe last year for which sufficient data is available to makecomparisons).
Older People: At 21.7% in 2010 and 20.8% in 2011, the rate ofpoverty in Spain for people aged 65+ is high by comparison tothe EU27 average of 16% (2010) (Eurostat, 2012f). It is alsohigher than the risk of poverty rate for the Spanish working agepopulation (19% in 2010) (The Social Protection Committee,2012, Table 5). However, the rate for those aged 65+ has fallensince 2008. Rates are higher for women (21.8%) than men(19.5%, 2011) (Eurostat, 2012f). The EU Social ProtectionCommittee has pointed out generally in relation to pensions, thatimprovements in the position of over 65s have been assessed inrelation to changes in the poverty thresholds rather thanimprovements in real terms in their economic situation (2012,p 20).
Working Poor: The rate of poverty in Spain for people whowork and who still do not earn enough to protect them frompoverty (the working poor) is 12.3% (2011). This is one of thehighest rates in Europe (EU27), exceeded only by Romania(Eurostat, 2012g).
T H E I M P A C T O F T H E E U R O P E A N C R I S I S C A R I T A S R E S P O N S E T O A U S T E R I T y40
41 Sufficient comparable data are not available to assess how the 2011 rate of increase compares with the rates of increase in other countries.42 The 60% at risk of poverty threshold is 60% of median equivalised incomes. The at risk of poverty threshold in Spain for a single person was €7,980 in 2009, €7,818 in 2010, and it fellagain to €7,509 in 2011. See Appendix 5.
43 That is, living below the 40% of median income line as opposed to the more commonly recognised line of 60%44 Bulgarian, Latvia and Romania (2010) (Eurostat, 2012e)
In Spain the economic crisis has adversely affected apopulation that already had a high rate of income poverty –having demonstrated an at risk of poverty rate above the EU27average since at least 2005. (For rates, see Appendix 3).
The time lag in the availability from Eurostat of data onpoverty means that the figures set out in this report relate tothe early years of the economic crisis. Notwithstanding that,income poverty can be seen to have been affecting huge
Discussion: Impacts on Vulnerable Groups
numbers of people with just under 10 million people living atrisk of poverty and with the increase between 2009 and 2010being one of the largest increases in EU27. There are also signsof a deepening of poverty levels with a sizable increasebetween 2008 and 2010 in the rate of those who are poorest43.Child poverty is a particular problem with Spain’s rateincreasing since 2009 and exceeded only by three easternEuropean countries.44 A high proportion of those who work donot earn enough to bring them above the poverty threshold.

T H E I M P A C T O F T H E E U R O P E A N C R I S I S C A R I T A S R E S P O N S E T O A U S T E R I T y 41
The at risk of poverty rate for older people continues to exceedthat for the working age population.
As discussed above, Spain has the highest unemployment ratein Europe (EU27). There are also very high rates of both youthunemployment and long term unemployment, which are bothsecond only to Greece. Youth unemployment is a particular issuewith more than half of those aged 15-24 being unemployed.
There are big income gaps between those on permanent andthose on temporary contracts. Spain has the highest share oftemporary workers in OECD countries (IMF, 2012c, p. 28). Youngpeople are, of course, particularly affected by unemploymentand those that are employed are often employed on temporarycontracts (IMF, 2012c).
The IMF recognises that income inequality is rising in Spain,with one of the worst deteriorations in income distributionssince the crisis (IMF, 2012c, p. 8).
Net emigration has started again for the first time since theearly 1990s (IMF, 2012c, p. 8).
Researchers who studied the impact of austerity measuresintroduced to mid 2011 across 6 countries (and as such havecaptured impacts of the early measures introduced), havenoted some features relating to Spain:5 As with most of the other countries included in the study,austerity measures impacted more on households withchildren than on those without (Callan et al, 2011, p 13, 27),
5 Cuts to benefits have had a particularly large effect onhouseholds in the lower part of income distribution whilecuts in public sector pay affect those on higher incomesmore (Callan et al, 2011, p 13).
Furthermore, while some measures had the effect of distributingthe cuts in income relatively evenly across all income groups (inother words, each decile group paid roughly the same proportionof income), this was changed by VAT increases, which placed alarger burden on those on low incomes relative than on thoseon high incomes (Callan et al, 2011, p. 13). Of course, even ifthe effects of the crisis and the measures introduced to addressit had proportionately affected people on low incomes and thoseon high incomes equally, this would not say anything aboutability to contribute of the poorest people.45
Again we repeat that the study cited (Callan et al, 2011) datesfrom 2011 and would not take into account the subsequentproposed changes in VAT, which it seems reasonable to anticipatewould continue this trend towards disproportionately affectinglower income households. In Spain the crisis (and measuresadopted to address it) is worsening levels of poverty that werealready high.
On the ground, calls on the services of Caritas Spain haveincreased by some 170% since the start of the crisis. They pointto the adverse impact of austerity measures on peopledependent on social services and an increase in people lackingfood and money to pay utility bills, as well as people needingjobs and social interaction. They also express concern aboutchildhood poverty rates and about malnutrition in children dueespecially to cutbacks affecting school meals (Caritas Europa,2012). They also point to families now depending on a singleincome of a grandparent’s low pension, and they are concernedat an increase in tension within families, which the crisis hasprecipitated as people have to rely on family members foressential needs like never before.
In addition, while it is impossible to analyse impacts of cuts toservices like health and education in detail in this report, it isreasonable to assume that they may particularly affect thosewho are poorest and who do not have sufficient income tocompensate for them. Decreasing the educational budget inSpain has to be considered in light of the fact that Spain hasone of the highest rates of early school leaving46 in Europe(26.5% as opposed to an EU27 average rate of 13.5% in 2011)(Eurostat, 2012m), as measures which might worsen thissituation would be short-sighted in view of the personal cost- in terms of life chances and even health - and indeed thecost to the economy in the longer term.
As set out above a comprehensive list of further cuts andausterity measures were proposed in summer 2012, whichincluded further reductions in welfare and increases in VAT.The impact of these measures on vulnerable groups is likely tobe serious, given the high levels of unemployment and povertyalready being experienced in Spain, and the finding thatincreases in VAT have already disproportionately affectedpoorer people.
45 It is only to be expected that better off households pay a larger share, as they have a higher share of total income – it does not signify that the burden of the measures in relation totheir ability to pay is also larger and it does not tell us if the distribution is equitable or not (Callan et al, 2011 p 12, 13).
46 Early leavers from education and training refers to the % of the population aged 18-24 with at most lower secondary education and not in further education or training (Eurostat, 2012m)

THE CARITASRESPONSE
Part 3

T H E I M P A C T O F T H E E U R O P E A N C R I S I S C A R I T A S R E S P O N S E T O A U S T E R I T y 43
Caritas member organisations and affiliates work in a widerange of contexts and in a range of ways across Europe, andthey are each responding to the current crisis. Many provideservices to people in need, others focus on work for socialchange through advocacy. Five of these organisations havecontributed to this report by gathering relevant data, by sharingaccounts of their work to support people affected by the crisis,
and by reflecting on the impacts of the crisis and of austeritymeasures as they observe them relative to different groups.
In this section we include some accounts of their work, somecase studies representing their different approaches andillustrating their different impacts, and we finish by listingsome of the challenges they face.
Caritas Athens Refugee Programme has concentrated in recentyears mainly on the needs of refugees and migrants. They havea fixed staff of only five people – a cook, a cleaner, a secretary,a doorman and a social worker – who are assisted by more thanseventy part-time volunteers who help on a daily, weekly ormonthly basis to keep the centre functioning. The work involves5 serving up to 300 meals a day,5 distributing food parcels to nearly 100 families a month(including immigrant families and now Greek families also),
5 sorting and distributing free clothes and bed-linen twice-weekly, and
5 providing language lessons in Greek and English usingvolunteer teachers.
A social worker and a number of volunteer doctors and lawyersare involved in education (in health care and hygiene), inorganizing vaccinations for children (otherwise children ofmigrants may miss out on vaccinations given routinelythrough the school system) and in routing asylum casestowards professional help.
They report that support to a range of groups is also given byCaritas Athens and the Archbishopric, and also through local
Greece
organisations of Caritas and parishes throughout Greece.Those supported include low income families (many of whomcannot pay their food or electricity bills or their health-carecosts), people at risk of losing their homes, older people wholack family support and the prison community.
Groups particularly affected by the crisis that the CaritasAthens Refugee Programme works with include single parentfamilies with young children (for whom access to kindergartenfacilities is becoming more difficult due to closures). However,they are also registering concern (as stated in Part Two, above)in respect of disabled people (whose cases are being re-examined) and disabled children, people coming to the end ofaccess to unemployment payments (which are subject to aone-year limit), pensioners on the minimum pension,pensioners with medical problems (who must now pay inadvance for medicines and await reimbursement, which cantake months), and immigrants, many of whom are faced withunemployment (which soon leads to their status becomingundocumented/illegal, despite having been in Greece foryears). The position of new immigrants who continue to cometo the country is also difficult.
Social Justice Ireland is a non-political organisation ofindividuals and groups across Ireland committed to theconcept of a just society. It has an unparalleled reputation forresearch, advocacy and dissemination of accurate, evidence-based social analysis and public policy in relation, in particular,to issues of social justice, poverty, inequality, social exclusion,and sustainability. It works with Caritas Europa on a widerange of issues particularly at an EU level.
Ireland
Social Justice Ireland draws on the work being done by itsmembers in a wide range of local contexts. It builds on thisand ensures that the voice and experience, the knowledge andwisdom of its members are reflected in the various arenas inwhich decisions are made. In all of this Social Justice Irelandwill seek to promote the development of all people and thewhole person simultaneously and in solidarity.
Programmes and Initiativesof Caritas Members

T H E I M P A C T O F T H E E U R O P E A N C R I S I S C A R I T A S R E S P O N S E T O A U S T E R I T y44
Within its programmes Social Justice Ireland:5 Plays an active part in the national Social Dialogue processin Ireland and the EU,
5 Produces and publishes an annual socio-economic review andregular policy briefings on relevant topics and maintains awebsite with relevant up-to-date material on a wide range ofsocial justice topics,
5 Resources and supports a post-graduate Masters degree inSocial Justice and Public Policy programme,
5 Leads a Budget analysis project which includes the analysisand critique of Government’s annual Budget and makessubmissions to Government and other relevant bodies onpolicy issues as appropriate,
5 Organises an annual social policy conference on a relevanttopic with broad participation from across a wide range ofsectors,
5 Networks with other groups and organisations and maintainsrepresentation on a range of public bodies,
5 Maintains an on-going dialogue with a wide range ofnational and international agencies and bodies includingthe International Monetary Fund, the European Commissionand the European Central Bank.
In the context of this research Social Justice Ireland hasconsistently researched and published detailed analysis of thesituation as it has developed, addressed its causes andconsequences, monitored the impact of Government initiativesand annual budgets, dialogued with the troika (IMF, EuropeanCommission and the European Central Bank) and developedalternatives to Government and troika proposals, alternativesthat would protect the vulnerable and promote economicdevelopment in a sustainable manner while protecting thebasic infrastructure of Irish society.
Caritas Italy, along with local churches, and sometimes alongwith local authorities and a wide range of actors from civilsociety, delivers a range of programmes to service users.Programmes include:5 microcredit/microloans, which are made to families and tosmall businesses (sometimes also involving local banks),
5 grants and donations,5 innovative projects, which are very varied (see below) oftenaiming help families and individuals to meet basic needs,
5 information services, which offer counselling and orientationon issues like employment and housing (often working withother organisations such as Unions and others) (CaritasItaliana, 2012c).
The highest number of projects is in the South (41.5%),followed by the North (33%) and the Middle (25.5%).
Italy
Under the heading of ‘innovative projects’ a wide variety ofservices are offered. Their main aim is to help families andindividuals to meet their basic needs or to modify their life-styles. They can also include second-hand stores, cards,organising mutual help between families, working withsupermarkets and big stores, offering training to help createnew businesses or social cooperatives, budgeting help,psychological counselling centres for business people who arein financial difficulty, new forms of home care (such as helpingwith carrying shopping).
As already mentioned in Part Two, Caritas Italy has noticedan increase in projects across all categories, with the exceptionof providing microloans, where repayment has become anissue for many borrowers (and sometimes local banks arewithdrawing cooperation). In just one year there has been a22.2% increase in projects. In two years (since 2010), theincrease has been 70.7%.
Caritas Portugal is a national service of the Portuguese BishopsConference for the social pastoral action of the Church. Theaim is integrated human development and socialtransformation, working for a more just society with theparticipation of those affected by any form of exclusion.
In Portugal there are 20 diocesan Cáritas, each of whichresponds to the local needs and accordingly they offer differenttypes of social responses. Overall, the Cáritas network deals witha range of social problems that includes problems of children,older people, migrants, Roma, people affected by drug abuse,by HIV/AIDS, homelessness and by many other issues. Cáritasinterventions are conducted by volunteers and paid staff whowork closely with communities.
Portugal
Caritas Portugal, the national office, is active in a range of areasincluding training programmes for pastoral agents,communications, social policy, advocacy, responding toemergencies (both national and international) and internationalcooperation. The international emergencies are supportedthrough the Cáritas network and with the national partners.Caritas Portugal is a member Caritas Internationalis, CaritasEuropa, the National Confederation of Solidarity Institutions,the Portuguese Confederation of Volunteering, the non-Governmental Forum for Social Inclusion and the PortuguesePlatform of NGO’s.

T H E I M P A C T O F T H E E U R O P E A N C R I S I S C A R I T A S R E S P O N S E T O A U S T E R I T y 45
In recent months, the Caritas Athens Refugee programme hashelped immigrants and also many Greek families whosecircumstances have changed and who now find themselves indire need. Below we include two case studies to give examplesof the types of problems that their programme is encountering.
Caritas Athens reports that faced with the crisis there is theemergence of a more targeted and proactive approach by anumber of NGOs in Athens. Amongst them they list the GreekOrthodox Church, the Municipality of Athens and the privatecharitable foundation of the Niarchos family and others.
Greece
Caritas Member Programmes –Responding to the Crisis
Caritas Spain operates through 68 diocesan offices thatmanage the work of some 65,000 volunteers. Caritas Spainworks to support vulnerable and marginalized people, the poorand needy, immigrants and young people in difficulty, amongothers. It supports research into the causes of poverty andregularly produces publications on related issues. Caritas Spaincollaborates with partners in humanitarian and developmentprogrammes in countries in Africa, Asia, Europe, the MiddleEast and Latin America.
Spain
In 2011, Caritas Spain’s projects succeeded in integrating13,000 people in the labour market; they spent €33million ingiving direct help (such as in paying bills, school-books,health-related costs), and they helped 1,015,276 people. Thenumbers helped had increased hugely by 2011 from around300,000 in 2007 (Caritas Europa, 2012).
M. is a 33 year old unemployed, single mother with a 4 year-oldchild. The father of the child did not legally recognise him andabandoned them both when it was discovered that he was autisticand had serious motor-coordination problems. She had no workand went to live with her widowed mother, who has a €500 euromonthly pension (from next year this income will be reduced by€1.000 per annum). She came to the Caritas Athens centre askingfor food and for help to get her child accepted by one of the veryfew day centres for children with a learning disability. Up to nowthis has not been possible (as there were no places available in anyspecial school). Our social worker is encouraging her to finish hersecondary education while her mother looks after the child.
Mrs.DB is a 37 years old Polish mother of two children. She wasmarried to a Polish man and they were both legal and working ata café in Athens before having children. When the first was born,as they were both working legally, he was able to attend a stateday care. When recession started, she lost her job and when shebecame pregnant again, her husband left her. The Catholic Churchprovides for the rent of her flat and the Social Services of CaritasAthens Refugee Programme provide her with food and got thesmaller child accepted at one of the day care centre of theMunicipality. She has found a small cleaning job and is looking formore work. Her husband refuses to help and she has no money fora lawyer to start legal proceedings to obtain his help to supportthe children. She has no family and no house in Poland, thereforeshe stays in Greece. She is still theoretically legal through herhusband if he has legal work. If not, the status of both will becomeirregular.
Caritas Athens Refugee Programme
CASE STUDY

T H E I M P A C T O F T H E E U R O P E A N C R I S I S C A R I T A S R E S P O N S E T O A U S T E R I T y46
The experience of Social Justice Ireland represents a case studyof a response to the crisis and to the imposition of austeritymeasures on the level of advocacy.
Ireland
As part of its work in the context of Ireland’s current bailoutagreement, Social Justice Ireland meets with the ‘troika’(IMF/EC.ECB) a number of times each year. At its meeting withthe ‘troika’ in October 2012, Social Justice Ireland presented adetailed Briefing which analysed the selective use of data by Troikaorganisations in some of their recent publications. The Briefingshowed how this misuse of data is leading to inaccurate analysiswhich in turn is producing inappropriate policy recommendationsfor Ireland.
The ‘Troika’s analysis sets most of the parameters for the IrishGovernment’s decisions on the Budget and other key areas ofpolicy. So it is crucially important that the analysis is as accurate
CASE STUDY
as possible. The selective use of data identified in the Briefingconcerned five key areas (i.e. the poverty rate, the reduction ofwelfare payments to unemployed people over time, the changesin welfare rates generally in the past, on replacement ratios for jobseekers and on the distribution of ‘hits’ following from Governmentdecisions in recent years).
Under each of these issues the Briefing identified where data hadbeen selectively chosen in recent troika publications, where thisselectivity has led to inaccurate analysis which in turn has led toinappropriate policy proposals being made.
The analysis was not disputed by the troika. Social Justice Irelandwas invited to engage with the IMF and the European Commissiontechnical teams on the analytical issues identified and on policyproposals set out by Social Justice Ireland. This dialogue is on-going. It remains to be seen if the inappropriate policy proposalspresented by the ‘troika’ will be taken up by Government.
Social Justice Ireland
Caritas Italy faces increased demands on its services and isengaged in a range of responses across the country. Nationalmonitoring revealed the presence of 985 anti-crisis projectsby 212 Italian dioceses (out of a total of 220 dioceses) (CaritasItaliana, 2012c). Amongst these initiatives are:5 Barnaba Project, Let’s Give Credit to Hope (Caritas Andria,Puglia, South Italy)This is a microcredit project for young unemployed people(aged 18-35), aimed at supporting productive activities andcreating new jobs. The project offers financial support tothose who cannot obtain it elsewhere, as well as training,technical assistance, tutoring, work orientation, organisingsolidarity networks, and supporting new life-styles. The projectfinances the start-up of different types of new business andsmall enterprises: social cooperation, associations, freelancingand professional activities in the social field.
5 One Hour For You, Caritas Teramo-Atri (Abruzzo, Central-South Italy)In cooperation with Banca Popolare Ancona, a fund hasbeen established to give practical help to families that havelost all sources of income through offers from local familiesthat have a regular work. The idea is to offer regular helpequivalent of one hour work. The beneficiaries don’t receivemoney, but, after an interview, they can take advantage ofperiods of training (average 3 months) with localcompanies.
5 Budgeting Project, Caritas Nardo-Gallipoli (Puglia, SouthItaly)This project helps families amongst the ‘new poor’ to controlhousehold spending, taking account of family basic needsand the amount of household income.
Italy
5 Project Penelope, Caritas Treviso (North Italy)This project consists of a specialized counseling centre(Centro di Ascolto), which helps entrepreneurs and businesspeople in financial difficulty from a human and relationalpoint of view. The project offers psychological tools todevelop resilience and deeper understanding and awarenessof their personal situation and social context.
5 Solidarity General Store (Emporio Della Solidarieta), CaritsRomaThe Emporio is a real supermarket (500 square meters), withautomated pay desk, trolleys etc. A magnetic cardauthorizes an allocation of spending for people affected bypoverty who are screened through the social services oflocal authorities or the Centri di Ascolto of roman parishes.The project is based on a partnership between Caritasdiocesana di Roma and Roman Municipality.
5 Loan of Hope, Italian Episcopal Conference (CEI), CaritasItaly, Italian Bank AssociationEstablished in 2009 by the Italian Episcopal Conference(CEI) and the National Association of Italian banks, theproject grants loans at an affordable interest rate, based onan ad hoc fund established by CEI. The beneficiaries aresmall enterprises (family businesses) and families in difficultsituation. Since 2009, 1,662 families have been helped, and10 million euro has been provided.
5 Caritas Services Against Poverty and Anti-Usury FoundationsAccording to last data (January 2010), diocesan Caritaspromote and/or manage 4,991 activities, services and projectsaimed at helping people experiencing poverty. Amongst themare some 3,583 distribution centres of primary goods, 449social canteens, 414 shelters and hostels for homeless people,

T H E I M P A C T O F T H E E U R O P E A N C R I S I S C A R I T A S R E S P O N S E T O A U S T E R I T y 47
and 230 residential services for immigrants. Importantly thereare 146 anti-usury diocesan foundations, and there has beenan increase in this area as many people turn to unlicensedlenders and are in difficulty due to the very high interestrates. The Foundations offer different forms of help such aspsychological assistance, privileged access to small loans,accompaniment to legal practices and more.
E is 40 years old, married, mother of two children (6 and 9 years).She had a stable occupation as an employee in a fabric factory.Her family took out a mortgage to buy their house, counting ontwo stable salaries, that would allow the family to lead a simplebut decent life. In July 2010 the company where E was workingclosed and she was made unemployed. Although the local labourmarket is difficult, E didn’t give up, she started to look for a newjob immediately, but she was not able to find one. Their troublesreally started when they came to the end of savings: E’s familycannot now afford the usual expenses and maintain the formerway of life. In the meantime, her husband fell ill and had anemotional breakdown and had to get leave from work. The family
CASE STUDY
had to confront the father’s illness and the related health carecosts. E tried to persuade her husband to get treatment. In theend, she went to Caritas to get some help, mostly in order tosatisfy her family’s basic needs: overdue bills, daily shopping,clothes, etc. She tried to protect their children from the suddenchange, maintaining the hope and the willpower to move forward.
In March 2011 she was included by Caritas in a ‘work grant’project called “Together it weighs less,” as an accountant at aschool. Thanks to the project, she is able to integrate the salary ofthe husband. The basic family needs are met by the expensesreimbursed by the project. She is now regaining self-confidenceand slowly overcoming a difficult situation. The project is not overyet, but some recruitment opportunities are emerging.
Extracted from: Caritas diocesana di Prato, “Prima e durante lacrisi. Un’analisi dei dati dei Centri di Ascolto Caritas dal 2006 al2010”, Prato (FI), Novembre 2011.
Caritas Italy
Caritas Portugal draws attention to a perceived lack of hopeamongst many of the people they serve within a fast-changingreality. For many of the families that they are supporting, it istheir first time having to seek help outside their family. CaritasPortugal identifies an alarming increase in people seeking theirhelp, pointing out that those unemployed are particularly hard-hit, and that housing issues, especially making repayments tobanks, is a major difficulty. They also point to the fact thatchildren are being reported by schools to be lacking food.
Portugal
There has been an enormous increase in the demand for theirservices between 2011 and 2012. The figures for all CaritasDiocesan centres throughout the country suggests that duringthe first half of 2012 over 30,000 families were helped – anincrease on the figures for the same period last year. Ifindividuals are reckoned, the number in the first half of theyear exceeded 88,000, representing an increase of over 64%on the same period last year (Caritas Portugal, 2012).
Caritas Portugal also points to the crisis having begun toawaken a national awareness of the need to defend thehuman rights of everyone.
Caritas Spain has had to develop new responses and reorganiseits existing systems to address the new situation that is beingconfronted. Examples of these initiatives are:5 DFC (Distribution of Food and Cleaning products)The DFC Project operates as a low cost store. The idea arosein an attempt to respond to the large numbers of peoplecontacting parishes and the volunteer teams’ efforts toserve all of them. A premises was obtained and the project’smain objective is to supply, at affordable prices, food,personal hygiene products and household cleaning topeople in difficult situations. Some 50 products are madeavailable at 40% of the cost price and families (that havebeen screened and given access for a year) are given a
Spain
monthly quota of purchases. It is all about dignifying fooddistribution, and also offering an environment for meetingand training through the team of volunteers. The volunteerteam initially numbered 10 but this has expanded.
5 Rethinking the Parish Reception – Caixa Pro-ChildhoodProjectThis is a new project aimed at ensuring a quality responseto the increased demands being made on parishes. It isoperating for almost four years. It has involved training forvolunteers to give them more skills in social support forfamilies and different approaches to organizing how supportis offered. There are two highly-motivated volunteers are incharge.
T H E I M P A C T O F T H E E U R O P E A N C R I S I S C A R I T A S R E S P O N S E T O A U S T E R I T y48
5 All for One – ‘Rescuing Poverty’ FundIn response to requests for help from people unable to paymortgages and facing eviction, and to people becomingunemployed, an extraordinary campaign was established in2008, followed in early 2009 with the establishment of acommittee to manage the fund. The role of the committee isto assess and grant-aid requests for funding which individualparishes are unable to meet, prioritizing families with children.The committee has also become a focal point for sharing the
different realities and experiences that are arising from theeconomic crisis, something that has contributed to informingadvocacy on social policy. (For example, the demand for apolicy on basic incomes and an extension of services providedby municipal social services). There has also been a shift ofemphasis relative to the people who are helped (who oftennow do not have any income or social benefit), moving froma once-off support to accompanying them and coordinatingwith Social Services.
Monitoring and Compilation of Statistical records: SomeCaritas member organisations can demonstrate good practicein record-keeping relative, for example, to increased use ofservices since the beginning of the economic crisis. Thepractice of Caritas Italy represents an example of this (CaritasItaliana, 2012c). However, there are also challenges faced inrecording all service users across a huge range of centres andprogrammes in a uniform manner.
Funding Squeeze and More Demands on Services: Theenvironment in which some NGOs are operating is particularlychallenging, due to funding difficulties at precisely a time whenthere are increasing calls on their services. A range of funding
sources are reducing simultaneously, including church collectionseven in affluent areas. In Greece, in particular, NGOs have to dealwith a much changed and less favourable taxation system thathas been introduced in recent years. Some (such as CaritasPortugal) have to engage in different kinds of fundraisingcampaigns such as audio-visual campaigns and others.
Demands on Services Requiring New Responses: New formsof poverty that are emerging, and new situations of distressbeing faced are causing Caritas member organisations to haveto develop, adapt and innovate. This appears to be an ongoingneed as new projects have to adapt as the demands continueto increase and to change.
Challenges Faced

CONCLUS IONS ANDRECOMMENDATIONS
Part 4

T H E I M P A C T O F T H E E U R O P E A N C R I S I S C A R I T A S R E S P O N S E T O A U S T E R I T y50
5 There are high levels of unemployment. The rates are wellabove the EU average in four of the five countries; onlyItaly’s rate is above, but closer to, the EU average than theothers; Spain and Greece have the highest rates in theEU27, with the latest figures suggesting rates of over twicethat of the EU average.
5 There are very high youth unemployment levels (15-24year-olds) in all five countries, with the levels in Greeceand Spain over 50%, nearly 2.5 times the EU average; thisis against a backdrop of an EU27 average level of youthunemployment at the dramatically high level of 22.5%;
Employment/ Unemployment
increases in the year to mid-2012 were very marked inItaly, Portugal and Spain and especially in Greece where thepercentage increase was highest of all at 10.9 percentagepoints.
5 Long-term unemployment (meaning people unemployed formore than a year) has reached its highest level in a decadein Greece (12.3%), Ireland (9.6%), Portugal (6.9%) andSpain (10.3%); Italy’s rate is lower but, at 5.3%, is alsoabove the EU average; In all countries a high proportion ofthose unemployed are long-term unemployed, and thisproportion is highest in Ireland (nearly 60%).
5 Over the past year households in all five countries reportedrises in financial distress, which were particularly sharp inItaly, followed by Greece, Ireland, Portugal and Spain; therise has been sharp amongst lower income families inseveral countries (in Italy, for example). In all these countries,with the exception of Ireland, the top 25% saw theirincomes fall by a larger proportion than was the case for thelower quartiles ; in Ireland it was the lower quartiles thatbore the brunt in the last year.
5 While available data on poverty levels relates to the earlieryears of the crisis, rates of income poverty have risen in allof the countries included in this report other than Italy (andalbeit only slightly in Portugal); in Spain and Greece, wherethe available data is more up-to-date than in Italy orIreland, there has been a marked increase in the at risk ofpoverty rate between 2010 and 2011.
5 Child poverty is a problem for all five countries; its ratehas begun to show an increase in all five countries, withparticularly notable increases in Spain and Ireland
5 The latest available data from Greece shows a significantincrease in poverty of older people (that is over 65s)between 2010 and 2011.
5 A study of distributional effects of the austerity measuresintroduced in the early years of the crisis (to 2011) suggeststhat in Ireland, Spain and Portugal, the measures have hada larger effect on households with children than thosewithout and this was particularly marked for low-incomehouseholds in Portugal (Callan et al, 2011, p 17). That samestudy showed that measures taken (up to 2011) affectedpoorer households in Portugal more than richer ones.
Income/ Poverty
5 Increases in VAT (often on fuel) in several countries have adisproportionate effect on those who are poorest (Callanet al, 2011). Since that study was completed VAT has beenraised (in countries such as Ireland) and more increases toVAT are now planned in other countries.
5 Indebtedness of households and inability to meet financialobligations, especially housing loans, has been registeredin many European countries since the crisis started in 2008,and it has been particularly notable in all of the countriesthat are the subject of this report, other than Italy (TheSocial Protection Committee, 2012, p.32). However, withinthe past year in Italy there has been a sharp increase inhouseholds reporting financial distress (European Com-mission, 2012, p 30).
It is predicted that as governments cut public spending andraise taxes even more to try to address structural deficits,household incomes will be hit for between 3 – and 10 yearsdepending on when growth returns (Jenkins et al, 2011, citedin The Social Protection Committee, 2012, p. 15).
Since 2009, the EU Commission has tracked the views ofEuropeans of their personal situation, the situation of the countryand of the welfare state and society (Eurobarometer on socialclimate, which is conducted annually). It operates as a comple-ment to the official socio-economic statistics. Overall the indexis at a low point in the four-year series – with an index of -0.8(based on a scale from +10 to -10). All five of the countries withwhich this report is concerned rank in the lower half of theEU27 rankings for 2012 (European Commission, 2012, p. 44).
General trends are observable across the five countries(Greece, Ireland, Italy, Spain and Portugal). There are somesimilar patterns and some dissimilarities between the five
countries relating to employment and unemployment and toincome and poverty amongst vulnerable groups. Among theseare the following:
General trends

T H E I M P A C T O F T H E E U R O P E A N C R I S I S C A R I T A S R E S P O N S E T O A U S T E R I T y 51
‘The focus on fiscal consolidation has, in many cases,been at the price of social policies’Frazer & Marlier, 2012, p. 7
5 The evidence presented in this report shows that thePolicy of Prioritising Austerity is Not Working and analternative is required. The imposition of austeritymeasures and structural reforms aimed at reducinggovernment borrowing and the debt/GDP ratio within ashort number of years is not working in economic terms.Simultaneously, it is putting the social cohesion of Europeand the very political legitimacy of the European Union atrisk. Given the requirement for a balanced budget there areobviously situations in which austerity may be required(such as when a country has been living beyond its means).In such cases a reduction in expenditure would positivelyimpact on creating a viable economic future for thatcountry. However, the overall analysis presented in thisreport makes it clear that a policy approach that prioritisesausterity above all else, particularly at the expense of theweakest members of society, cannot succeed.
5 Fair Solution to the Debt-crisis must be found: The recentEU agreement to recapitalise Spanish banks without addingto sovereign debt (June 2012) recognises that makingtaxpayers responsible for the massive debts of their banksis unsustainable. Turning banking debt into sovereign debtmust be recognised as unfair and unsustainable for allaffected countries and a fairer burden-sharing approachadopted.
5 Despite much public rhetoric that suggests otherwise therehas been a failure to integrate economic and socialpolicies at EU and national levels. This is despite the factthat a longer-term commitment to an inclusive society isnecessary to build a truly sustainable economy. The peoplecurrently paying the highest price are those who had nopart in the decisions that led to the crisis. The countriesworst affected include those with the biggest gaps in theirsocial protection systems, and as a result their welfaresystems are least able to protect their most vulnerablepopulations. This process is unfair and unjust.
Main conclusions

T H E I M P A C T O F T H E E U R O P E A N C R I S I S C A R I T A S R E S P O N S E T O A U S T E R I T y52
This Report calls on the EU institutions to ProvideLeadership in relation to Groups at particular Risk ofPoverty. Leadership is called for in finding other, and moreradical, ways to address what is a Europe-wide, and indeed aworld-wide crisis rather than pursuing the current approach inwhich poor and vulnerable people across the Member Statesbear the burden of economic reforms.
Leadership from the European level means a strongcommitment to the EU’s agreed strategy of “Europe 2020”with its target of reducing poverty levels by 20 million peopleby 2020. European leadership means taking responsibility forthe welfare of all European citizens, including the weakest andmost vulnerable; ensuring that the policy decisions made arebased on good information and communicated properly tocitizens; entering into dialogue with, and ensuring theparticipation of citizens and Civil Society Organisations inpublic processes that contribute to official policy developmentand decision-making.
A new approach on the part of EU institutions requires themto take a lead on some of the initiatives outlined below.
The EU Institutions should:
1 Ensure an adequate social dimension to the Europe2020 Strategy process for all Member States. The Com-mission’s policy coherence must be seriously questioned giventhat the social objectives set by the Europe 2020 strategy (inareas such as employment, education, and poverty reduction)are at odds with the economic policies being pursued relativeto achieving the deficit reductions required under the currentausterity approach. Implicit in the approach of the Europe2020 Strategy is that economic development, socialdevelopment and environmental protection are complementaryand interdependent – three sides of the same reality. Thefollowing practical steps should be taken in relation to the‘European Semester’ of the Europe 2020 Strategy:
5 Governments should be encouraged to include specific sub-targets for poverty reduction amongst groups most at riskof poverty or social exclusion in their National ReformProgrammes submitted to the EU Commission on an annualbasis. The groups targeted in this process might varysomewhat from country to country but are likely to includechildren, migrants, working poor, disabled people and older
1. European Institutions
people (especially older women). Progress made in reducingpoverty levels amongst these groups should be monitoredas part of the Europe 2020 Strategy Monitoring process.Country Specific Recommendations should also be issuedby the EU to Member States proposing concrete measuresaimed at diminishing poverty among these groups. Ofparticular importance in this process would be arequirement on governments to monitor and report on howtheir policy choices are assisting their countries to movetowards achieving these targets. Where this process revealsthat progress is not being made, there should be amechanism available to allow the relevant policy initiativesto be revised so as to achieve the original poverty reductiontargets set.
5 The Commission should ensure proper monitoring of theimplementation of the Europe 2020 Strategy in“Programme Countries” by adopting country specificrecommendations for these countries every year. (This doesnot happen at present). These country specific recommen-dations should not be limited to implementing the termsof the Memorandum of Understanding entered into withthe EC/ECB/IMF, as is the current practice. The structureof recommendations should be similar to those addressed toother countries (that is, they should specify the actionsneeded to achieve all the Europe 2020 targets, including inrelation to employment, education and poverty reduction).
2 Introduce Social Monitoring for Countries in EU/IMFProgrammes: Social impact assessments should be part ofregular reporting on the implementation of lendingprogrammes and/or fiscal consolidation measures. This shouldinclude assessments that (1) consider the cumulative effectsof measures (not just their individual effects), (2) giveparticular attention to the most disadvantaged groups in eachcountry, (3) outline policies that are aimed at reducing highlevels of inequality. The Social Protection Committee of theEuropean Commission has stressed the need to monitor thesocial consequences of the crisis and to find new ways ofstrengthening the social dimension of the Europe 2020Strategy (2012, p 6). We endorse that approach andrecommend that more policy coherence be brought to theagreements with the peripheral countries where the processof working toward the social objectives of the Europe 2020Strategy are considered integral to the objectives also beingsought in respect of debt/GDP and borrowing reduction.
We conclude this report with recommendations aimed atEuropean Institutions and the European Commission, Nationaland Local Governments, and NGOs (non-governmental
organisations). We finish with some comments on the role andcommitment of Caritas and the Catholic Church.
Recommendations

T H E I M P A C T O F T H E E U R O P E A N C R I S I S C A R I T A S R E S P O N S E T O A U S T E R I T y 53
3 Ensure that the 2014-2020 EU Structural Funds willplay a bigger role in addressing poverty and encouraging socialinclusion across Member States in order to better respond tothe worsening social situation of many Europeans. The use ofEuropean Structural Funds shouldn’t replace the responsibilityof national governments to ensure that their policies andbudgets effectively target poverty. Instead the availability ofEU Structural Funds should provide necessary Europeansolidarity with the most vulnerable people and regions, andcomplement the use of national resources. The EuropeanSocial Fund is the main source for funding projects aimed atthe Active Inclusion of the most vulnerable, linking them withaccess to employment, basic services and minimum incomeschemes. Therefore, the EU Cohesion Budget (2014-2020)should not be further reduced as this would make it incapableof responding to current and future needs. The minimumallocation of 25% of the Cohesion Policy funds to theEuropean Social Fund (ESF) should be ensured and at least20% of the ESF budget should be earmarked for socialinclusion and the fight against poverty. Moreover, the Fund of2.5 billion for European Aid to the Most Deprived should bekept in a separate budget within the overall Cohesion Policybudget. The European Commission should ensure that theallocation of EU funds to assist Member States in meetingtheir anti-poverty targets, complementing other nationalsocial policies, is actually happening. This can be measured byconducting quality audits of ‘co-financed’ actions. EUStructural Funds can also be used to support initiativesdedicated to creating employment in the ‘Social Economy’.This sector offers valuable employment opportunities forpeople from various marginalised or vulnerable groups.Leadership and support from the EU for other employmentinitiatives (e.g. the creation of jobs in care services acrossEU Member States) would benefit people requiring care andthose seeking employment.
4 Take a Lead in tackling Child Poverty: Child poverty isa significant and worsening problem in the countries whosesituations are reviewed in this report. There has been somemomentum at a European level relative to a coordinatedapproach to tackling child poverty. The Social Protection
Committee notes however that there is a danger that thismomentum will be lost as a result of the current crisis, withservices and policies being affected by cutbacks (2012a). It isvital that the Commission issues its planned ‘Recommendationon Child Poverty’ immediately. This Recommendationmust bemade a policy priority for the countries that are the subject ofthis report, including those involved in EU/ECB/IMF assistancepackages.
5 More attention should be also paid by the EU institutionsto policies supporting other groups in need such as long-term unemployed, people with health problems anddisabilities, lone parents, immigrants and Roma. Strongleadership in Respect of Youth Unemployment should alsobe ensured. This would involve publishing the proposedCouncil recommendation for ‘youth guarantees’ aiming toensure that all young people are in employment, education ortraining within four months of leaving school (EuropeanCommission, 2012b) and making sufficient structural fundsavailable to assist those countries (including Greece, Ireland,Italy, Portugal and Spain), where youth unemployment ishighest, to ensure the social inclusion of their young people.
6 Ensure Civil Society involvement in GovernanceStructures: The Charter on Shared Social Responsibilities,currently being considered by the Council of Europe, arguesthat having a well-defined deliberative process can ensure,among other things, that individual preferences are reconciledwith widespread priorities in the field of social, environmentaland intergenerational justice. It can also reduce the ‘imba-lances of power between stakeholders’ (Council of Europe,2011, p 24). The Commission should require evidence ofmeaningful stakeholder involvement (such as civil societyorganisations) in deliberative processes leading to theformulation, implemen-tation and ongoing monitoring ofpolicies under the monitoring systems in place under theEurope 2020 Strategy. (It should also strengthen thoseprocesses relative to EU/IMF programme countries, asrecommended above). This is of particular importance in aEuropean Union faced with the biggest threat to socialcohesion and political legitimacy in its existence.
Note: The recommendations in this section are addressed toNational Governments and also to local authorities andmunicipalities, wherever they have the power to act in relationto the areas covered).
1 Strengthen Welfare Systems: Given the depth and durationof the economic crisis and the impacts of structural measures,the resilience of social protection systems must be improvedto enable them to provide protection to the entire populationin need. This is an urgent requirement in countries included inthis report with significant gaps in safety nets such as where
2. National Governments and relevant Local/Regional Authorities
access to unemployment benefits/assistance is restricted forsome groups or is subject to time limits. An example is Italywhere there is a need to ensure that there is a minimumincome policy to provide an integrated approach that ensuresa safety net for everyone (as Caritas Italy has called for over along period of time). Policy-makers should now introducesocial protection schemes for the future which overcome thepresent inequalities within the system, which, in many countries,result in non-standard workers, young people, and new entrantssuffering a double disadvantage, being more vulnerable tounemployment and also entitled to less social protection.

2 Strengthen Essential Services: Social protection transfersand provision of quality services (like affordable childcare,education, health, disability and other social services) arecrucial to the employability prospects and social mobility ofdifferent income groups as they indirectly reduce inequalities,so ensuring equal access to service and care, strengthen socialcohesion and ensure social stability (The Social ProtectionCommittee, 2012, p 28, 50). However, the economic crisis andausterity measures are worsening existing inequalities inincome and in access to services and care. Social assessmentsof the impacts of cuts to services that focus beyond the short-term cost saving should be integrated into decision-makingprocesses. Many of the decisions being made currently toachieve short-term budgetary savings are choices that maywell make social cohesion more difficult in the long-term.
3 Poverty Proof All New Measures: Reducing poverty requiresa number of different, integrated responses including incomesupport and access to education and other vital services. Withregard to child poverty, the Social Protection Committee hasnoted the important role that universal measures have playedin reducing child poverty in many states. Amongst themeasures needed are maintenance of all existing universalbenefits paid to the main carer coupled with other measures.Access to services like early childhood care and education arealso essential supports. Of particular importance in thiscontext is the need to recognise and monitor the effect thatcumulative ‘hits’ can have on particular groups. This is thesituation where a range of decisions are made that impact onthe same group and have a disproportionate effect.
4 Use Appropriate Labour Market Active Inclusion Measures:EU recommendations commit to a balanced approach to activeinclusion involving three equally important pillars: inclusivelabour markets, adequate income support and access to high-quality services (European Commission, 2008). However, theIndependent Network of Experts on Social Inclusion hasconcluded that in reality the focus of European countries ison activation measures at the expense of the other pillars(Frazer & Marlier, 2012). With pressure on social welfaresystems high, most of the countries under review in this reportare pursuing measures involving support to job-seekers andactivation of some kind. Given the scale of the fall inemployment in all countries and the bleak outlook for jobcreation, it is important that these measures focus onsupporting unemployed people. This might for example aim tomaintain and develop appropriate skills. Most importantly,such measures must not be accompanied by the threatenedloss of welfare benefit or assistance, as, with the scale of thelosses in employment, this is illogical and will merely causepoverty and worsening desperation.
5 Frame any further measures such that those who canafford to do so actually do pay more: National Governments(and regional authorities/municipalities as appropriate to theirroles) must adopt approaches to raising revenue and providingservices that do not disproportionately negatively affect lowincome groups. The Social Protection Committee has argued
that there is scant evidence that a shift to indirect taxes onconsumption would have a strong revenue-generating effect(2012, p 45). In this report we have included instances of howshifting the tax burden from labour to consumption (byincreasing VAT and/or excise on essential items) causedproportionately larger losses on low-income households inseveral countries (as low-income households spend a relativelyhigher proportion of their income on goods, like fuel/energy,on which they are levied). This means, amongst other things,that any proposed increases in indirect taxes on consumption(like VAT) must be very carefully considered.
6 Consider new ways of cooperation between national/regional/local Governments, enterprises, NGOs and tradeunions in order to create new employment, and also sociallyuseful work and jobs of last resort: Given the huge fall inemployment identified in this report and the impact this ishaving among unemployed people of every age, andrecognising that governments want to increase the number oflong-term viable jobs paying good wages in their owncountries, governments should identify good practices in othercountries and cities and search for new ways of cooperationbetween all stakeholders: enterprises, trade unions, socialNGOs and public administration, addressing needs at locallevel and creating employment. In the context of this dialoguegovernments should still contemplate being an employer oflast resort through voluntary programmes that do not distortthe market economy but provide some socially useful work forthe millions currently seeking employment. The lessons of theGreat Depression are as valid in social terms now as they werein the 1930s. No country, no society can afford to regard somany of its unemployed citizens as expendable. There aremany areas in which such employment could be created in thesocial economy (for example, in long-term care). This shouldnot be misunderstood to mean that social services should bedependent on people who are long-term unemployed takingup positions on a government programme. These servicesshould be provided as part of mainstream provision. However,this approach does have the potential for adding capacity,particularly at a time of economic difficulty. In Appendix 8 weconsider the issue of a jobs guarantee in some more detail andinclude some examples of implementation in differentcontexts.
7 Ensure the involvement of Civil Society Organisationsand People Experiencing Poverty in Governance: Commit toa genuine engagement with stakeholders to ensure thatgroups at risk of poverty and social exclusion can influencepolicy-direction and implementation, and that their experien-ces become part of the dialogue with European andInternational agencies (like the EU/ECB/IMF troika), to try andbolster social cohesion and political legitimacy.
8 Introduce Better Monitoring and Planning: Introducepoverty proofing relative to new measures, and address theirlonger term consequences as well as their short-term ones;use macroeconomic modelling processes to assess the impactof proposed changes in social policies.
T H E I M P A C T O F T H E E U R O P E A N C R I S I S C A R I T A S R E S P O N S E T O A U S T E R I T y54

T H E I M P A C T O F T H E E U R O P E A N C R I S I S C A R I T A S R E S P O N S E T O A U S T E R I T y 55
1 Accompany and help people in need; provide servicesin order to promote their social and active inclusion :People who are poor need help here and now. NGOs can assista society to identify people in need and to develop solutionsto address their immediate and longer-term needs. NGOs canmobilise solidarity in society, organise volunteers and innovatewithin the limits of existing resources.
2 Give a Voice to People Experiencing Poverty or SocialExclusion: Those NGOs that provide services to peopleexperiencing poverty are in a position to give a voice to theexperience of the people they serve, a voice that tends to havefew outlets for expression or influence – and these accountscan have an impact within and beyond individual nationalborders. This might involve documenting accounts of staff or,in some cases (and with care), first-hand accounts by serviceusers. However, working with the media has to be approachedwith skill and, as is obvious, with particular sensitivity ifservice users are to be part of the process if they are not to becompromised.
3 Document Increases in Service Use: The current situationis challenging and unfolding rapidly. Official systems fortracking and monitoring poverty are subject to limitations andtime-lags. NGOs who work in providing services can, byputting appropriate systems in place, track the increaseddemands– and the new kinds of demands - made on their
3. Non-Governmental Organisations – Not for profit Social Services Providers:
services. Thus they can help to provide an earlier and morerounded view of the picture as it emerges as well as make thecase to protect existing funding streams.
4 Work for Social Change: The world documented in thisreport is not just. It needs to be profoundly changed in a waythat eliminates poverty and exclusion as well as addressingunemployment in a sustainable manner. A model ofdevelopment that is sustainable in economic, social andenvironmental terms is required. NGOs have great experienceand knowledge of the impacts the current approach is havingon so many people who are vulnerable in one form or another.They must use that experience and knowledge to work towardsthe articulation and development of a sustainable future thatprotects human dignity, promotes wellbeing, is built on thecommon good and protects the environment.
5 Work to Influence Decision-Making: NGOs must seek tochallenge the official approach to the crisis in which thosewho are vulnerable are paying the highest price. This mayrequire a commitment to develop a capacity for independentand accurate analysis and advocacy, which is sometimesconsidered secondary to the work of providing services.However, it is an important means of addressing the causesof the problem, not only its symptoms. This is especiallyvaluable when the major providers of social analysis do not, inpractice, include data, analysis or proposals targeting thesituations of those who are vulnerable.
This report has been commissioned by Caritas Europa, aCatholic organisation which acts to help people, particularlythose who are poor, vulnerable or excluded. It responds to “theteaching and most ancient practice of the Church in herconviction that she is obliged by her vocation - she herself, herministers and each of her members - to relieve misery andsuffering, both near and far.” (Sollicitudo Rei Socialis 31). Itoperates from the tradition which “allows faith, theology,metaphysics and science to come together in a collaborativeeffort in the service of humanity” (Caritas in Veritate 31).
According to Pope Benedict XVI, “The Church's charitableorganisations, beginning with those of Caritas (at diocesan,national and international levels), ought to do everything intheir power to provide the resources and above all the personnelneeded for this work” (Deus Caritas Est 31a). Caritas Europamember organisations work extensively in all five countriescovered by this report as well as in more than 40 othercountries across Europe, including all 27 member countries ofthe EU, responding to the challenges currently being faced.
Role and Commitmentof Caritas,as expression of the service of the Catholic Church

In its work Caritas is building on the long and wide traditionof Catholic Social Thought expressed in many Papal and otherChurch documents and carried forward into action by a greatmany committed organisations and individuals at local, regional,national and international levels. The Catholic Social Thoughttradition has long highlighted the importance of addressingboth the causes and the consequences of poverty andexclusion and this is being carried through in practice today byCaritas across Europe and the wider world through action,prayer and advocacy, bringing together social justice, peaceand charity.
In this context a threefold action based on values has tobe developed by Caritas and Church: with Christiancommunities, with society and with political stakeholders.
A number of key areas have been identified in which Caritasand Church at different levels can play a responsible role:
1 Help and accompany the people in need: “Following theexample given in the parable of the Good Samaritan, Christiancharity is first of all the simple response to immediate needs andspecific situations: feeding the hungry, clothing the naked, caringfor and healing the sick, visiting those in prison, etc.” (DeusCaritas Est 31). Caritas organisations from the local level on,the volunteers and staff in parishes and in social and healthservices, will be always there to give immediate help and toensure a pathway towards the autonomy of the person andtheir active inclusion in society. It is from this deep experienceof human encounter at grassroots level that Caritas commitswith the further mentioned roles.
1 Articulate and promote the protection of human dignity:Human dignity is at the core of the Catholic Social Thoughttradition. The Second Vatican Council reminded us that “thedignity and total vocation of the human person must behonoured and advanced along with the welfare of society as awhole.” (Gaudium et Spes 63) Promotion and protection ofhuman dignity should always be at the core of the choicesGovernments make, particularly in difficult situations. Asoutlined in this report the basics required to protect humandignity are not available to large numbers of people in thecrisis countries and their situation is becoming more difficultas time passes. This situation must be reversed. While we allhave a responsibility, the choices made by Governments mustprioritise the protection of human dignity.
2 Argue for the common good: In difficult times there isalways a danger that democracy will become a democratictyranny in which the majority oppresses the minority. It is verynecessary that the general public have an understanding ofthe common good and the concepts that underlie it. TheChurch’s understanding of the common good is articulated bythe Vatican Council when it says “the common good embracesthe sum of those conditions of social life by which individuals,families, and groups can achieve their own fulfillment in arelatively thorough and ready way.” (Gaudium et Spes 74) It is
critical that public opinion support this principle, otherwise,they will be unlikely to support actions by public authoritiesthat are not to the immediate advantage of the powerful andvocal. Individuals have a claim on each other and on societyfor certain basic minimum conditions without which the valueof human life is diminished or even negated. Those rights areinalienable, in that individuals and societies may not set themat nought. This is why the Church argues for the commongood and works as best it can with others to place thecommon good at the centre of decision-making.
3 Promote solidarity as a guiding principle in the relationshipbetween all groups in society: Pope Benedict XVI tells us“Solidarity is first and foremost a sense of responsibility on thepart of everyone with regard to everyone”. (Caritas in Veritate38) Solidarity means the willingness to see others as of equalimportance to ourselves and so to regard injustice committedagainst another as no less serious than an injustice againstourselves. Church has a responsibility to exercise an influenceon behalf of what it believes to be true and good, especially insolidarity with people everywhere who are on low incomes,disabled, ill or infirm, homeless or poorly housed, in prison,migrants, refugees, or people who are otherwise vulnerable,powerless and at a disadvantage. This is especially true in thecontext outlined in this report.
4 Foster and ensure participation and create communion,being open towards everybody in a spirit of ecumenicalcharity. This means to involve and engage as many people aspossible, including volunteers, in taking action to addressthese issues: Loving one’s neighbour is at the centre of theChristian message. Flowing from this the Catholic SocialThought tradition highlights the importance of people doingwhat they can to tackle the poverty and exclusion experiencedby so many of their fellow human beings. Having reminded usthat charity goes beyond justice, Pope Benedict XVI says that“the individual who is animated by true charity labours skilfullyto discover the causes ofmisery, to find themeans to combat it,to overcome it resolutely”. (Caritas in Veritate 30). In all ofthis it is very important to acknowledge the central role ofvolunteers who “assume responsibility for providing a variety ofservices” (Deus Caritas Est 30b).
5 Ensure that Catholic people across the European Uniontake up the challenge of applying in their own lives and intheir spheres of influence all the principles of Catholic SocialTeaching and thus advance the common good in collaborationwith like-minded citizens of every political and religiousallegiance and none: The political arena should give priority tothe common good. Governments should not be allowed to giveway to utilitarian expediency and the pursuit of short-termgains which have dangerous long-term consequences. Societymust not be allowed to turn its back on poor people nor on thestranger at the gate. These are core values in the Catholic SocialThought tradition and they are as relevant today as they haveeven been.
T H E I M P A C T O F T H E E U R O P E A N C R I S I S C A R I T A S R E S P O N S E T O A U S T E R I T y56

T H E I M P A C T O F T H E E U R O P E A N C R I S I S C A R I T A S R E S P O N S E T O A U S T E R I T y 57
_ Basso, G., Dolls, M., Eichhorst, W., Leoni, T., Reichi, A., 2011 The Effects of the Recent Economic Crisis on Social Protection and Labour MarketArrangements Across Socio Economic Groups. IZA, DP No 6080. IZA: Germany
_ Blanchard, O., 2012. Various Posts on the IMF website including: The Logic and Fairness of Greece’s Program, 19 March 2012; World FacesWeak Economic Recovery, 16 July 2012. [Online] Available from< http://blog-imfdirect.imf.org/bloggers/olivier-blanchard> Accessed 7November 2012.
_ Callan, T., Leventi C., Horatio, L., Matsaganas, M., & Sutherland, H., 2011. The Distributional Effects of Austerity Measures: A Comparison of SixEU Countries. EUROMOD Working Paper No. EM6/11 [online] Available at https://www.iser.essex.ac.uk/people/hollys?material=Monograph[Accessed 18 October 2012]
_ Callan, T., Keane. C., Savage, M., & Walsh, J.R., 2012. Special Articles: Distributional Impact of Tax, Welfare and Public Sector Pay Policies, 2009-2012 [Online] Available at< http://www.esri.ie/UserFiles/publications/QEC2011Win_SA_Callan.pdf> [Accessed, 25 October 2012]
_ Caritas, 2012. [Online]. Caritas Around the World [Online] http://www.caritas.org/worldmap/europe/portugal.html Accessed 27 November 2012
_ Caritas, Athens, 2012, Report by the Refugee Centre of Caritas Athens (complied by volunteers Laura Panagiotou, Marinos Kalligas, andGegona Kalliga, with information from Aglaia Kanstanakopoulou)Caritas Europa, 2012. A New Social Structure is Appearing in Spain [Online]Available from <http://www.caritas-europa.org/code/EN/soci.asp?Page=1437> Accessed 28 November 2012
_ Caritas Europa, 2012a. Achieving EU Targets for Reducing Poverty and social exclusion by 2020 through Prioritising Innovation in SocialProvision and Unemployment Support Systems. February 2012
_ CaritasItaliana, 2012a INDEX, The Crisis During the Years 2010-2011 and the impact of reforms.
_ CaritasItaliana,2012b. Are the Countries of the Mediterranean Model Moving in the same direction (Are there similar policy trends?)
_ Caritas Italianna, 2012c, Various documents, including, Caritas Statistics on Poverty; Local Churches and Caritas face poverty and economiccrisis: new projects and services
_ Caritas Portuguesa, 2012. Crisis in Portugal: Context, Challenges and Hopes
_ Central Statistics Office (CSO), 2010. Survey of Income and Living Conditions, 2009. Dublin: Central Statistics Office
_ Central Statistics Office (CSO), 2012. Measuring Ireland’s Progress, 2012. Dublin: Central Statistics Office
_ Central Statistics Office (CSO), 2012a. Population and Migration Estimates, April 2012. Dublin: Central Statistics Office
_ Council of Europe, 2011. Charter on Shared Social Responsibilities. [draft] Strasburg: Council of Europe
_ Council of the European Union, 2010. Draft Joint Report on Social Protection and Social Inclusion. 15 February 2010. 6500/10. Brussels
_ Economic and Social Research Institute, 2012. Distributional Impact of Tax, Welfare and Public Sector Pay Policies: 2009-2012 [Online]Available from http://www.esri.ie/news_events/latest_press_releases/distributional_impact_of_/index.xml> [Accessed 31 July 2012]
_ EL STAT (Hellenic Statistical Authority), 2012. Living Conditions in Greece, Updated, 2 November 2012. [Online] Available at< http://www.statistics.gr/portal/page/portal/ESYE/PAGE-livingcond/content/LivingConditionsInGreece_1112.pdf> [Accessed 6 November 2012]
_ EAPN (European Anti-Poverty Network), Ireland, 2011. Europe 2020 Strategy- Briefing September 2011.
_ European Commission, 2008. Commission Recommendation of 3 October 2008 on the Active Inclusion of People Excluded from the LabourMarket. C2008/867/EC. Official Journal of the European Union. [Online] Available from< http://eur-lex.europa.eu/LexUriServ/LexUriServ.do?uri=OJ:L:2008:307:0011:0014:EN:PDF> Accessed 17 November 2012
_ European Commission, 2010. Europe 2020: A Strategy for smart, sustainable and inclusive growth. COM (2010) 2020. Brussels: EuropeanCommission
_ European Commission, 2012. EU Employment and Social Situation, Quarterly Review, September 2012
_ European Commission, 2012a. Europe 2020 in Greece. [Online] Latest update 12.7.12. Available from>http://ec.europa.eu/europe2020/europe-2020-in-your-country/ellada/index_en.htm> Accessed 6 November 2012
_ European Commission, 2012b. European Economic Forecast, Autumn 2012. European Economy 7(2012).
_ European Commission, 2012b, EU Youth Report Calls for Employment and Social Inclusion to be Top Priority. Press Release, Brussels, 10September 2012. [Online] Available on< http://europa.eu/rapid/press-release_IP-12-948_en.htm?locale=en> [Accessed 30 October 2012]
_ Eurostat, 2012, National Accounts (including GDP)) Real GDP growth rate - volume Percentage change on previous year, tec00115. [online]Accessed at: http://epp.eurostat.ec.europa.eu/tgm/table.do?tab=table&init=1&language=en&pcode=tec00115&plugin=1] Updated 8.10.12[Accessed 11 Oct, 2012]
References

T H E I M P A C T O F T H E E U R O P E A N C R I S I S C A R I T A S R E S P O N S E T O A U S T E R I T y58
_ Eurostat, 2012a. National Accounts (including GDP)) Gross Domestic Product at Market Prices, tec 00001. [Online] Available athttp://epp.eurostat.ec.europa.eu/tgm/refreshTableAction.do?tab=table&plugin=1&pcode=tec00001&language=en.Accessed 11 Oct 2012
_ Eurostat, 2012b, Employment rate by sex, age group 20-64%. Code: t2020_10. Available at: http://epp.eurostat.ec.europa.eu/tgm/table.do?tab=table&init=1&plugin=1&language=en&pcode=t2020_10&tableSelection=1. Updated 10.10.12. Accessed 14 October 2012
_ Eurostat, 2012c. Headline Targets. t2020_50, 51,52,53 [Online] (Updated 8.11.12) Available at < http://epp.eurostat.ec.europa.eu/portal/page/portal/europe_2020_indicators/headline_indicators. [Accessed, 9 November 2012]
_ Eurostat, 2012d. Income and Living Conditions, Main Tables. tessi126 [Online] (Updated 15.10.13) Available online at <http://epp.eurostat.ec.europa.eu/portal/page/portal/income_social_inclusion_living_conditions/data/main_tables> [Accessed, 7 Nov 2012]
_ Eurostat, 2012e. At Risk of Poverty Rate by Detailed Age Group, tessi120 [Online] (Updated 9.11.12) Available at http://epp.eurostat.ec.europa.eu/tgm/table.do?tab=table&init=1&language=en&pcode=tessi120&plugin=1 [Accessed, 10 November 2012]
_ Eurostat, 2012f. At-risk-of-poverty rate of elderly people, by sex. tsdde320. [Online] (Updated 5.11.2012) Available at < http://epp.eurostat.ec.europa.eu/tgm/table.do?tab=table&plugin=1&language=en&pcode=tsdde320. [Accessed, 7 November 2012]
_ Eurostat, 2012g. In Work at risk of poverty rate, tesov110. [Online] (Updated 5.11.12/26.11.12). Available at < http://epp.eurostat.ec.europa.eu/tgm/table.do?tab=table&init=1&language=en&pcode=tesov110&plugin=1> [Accessed, 8, & 28 November 2012]
_ Eurostat, 2012h. 2012. At-risk-of-poverty thresholds [ilc_li01] [Online] (Updated 5.11.12) Available at < http://appsso.eurostat.ec.europa.eu/nui/show.do?dataset=ilc_li02&lang=en> [Accessed 7 November 2012]
_ Eurostat, 2012i, European Union Labour Force Survey, Annual Results, 2011. Statistics in Focus, 40/2012. Available athttp://epp.eurostat.ec.europa.eu/cache/ITY_OFFPUB/KS-SF-12-040/EN/KS-SF-12-040-EN.PDF [Accessed 28 October 2012]
_ Eurostat, 2012j. General Government Gross Debt, tsdde410 [Online] (Updated, 26.10.12). Available at< http://epp.eurostat.ec.europa.eu/tgm/table.do?tab=table&init=1&plugin=1&language=en&pcode=tsdde410> Accessed 30 October 2012
_ Eurostat, 2012k. Government Deficit/Surplus, gov_dd_edpt1 [Online] (Updated, 26.10.12). Available at<http://appsso.eurostat.ec.europa.eu/nui/show.do?dataset=gov_dd_edpt1&lang=en> Accessed 30 October 2012
_ Eurostat, 2012L. Newsrelease: Euroindicators, 150/2012, 24 October 2012.
_ Eurostat, 2012m, Early leavers from education and training by sex and Tertiary educational attainment by sex, age group 30-34. t2020_40 andt2020_41. Last update 25.9.12 [Online] Available at http://epp.eurostat.ec.europa.eu/portal/page/portal/europe_2020_indicators/headline_indicators Accessed 4 November 2012
_ Eurostat, 2012n, Eurostat Newsrelease 155/2012, 31 October 2012. [Online] Available at< http://epp.eurostat.ec.europa.eu/cache/ITY_PUBLIC/3-31102012-BP/EN/3-31102012-BP-EN.PDF> Accessed 5 November 2012
_ Eurostat, 2012o. Harmonised Unemployment Rate by Sex (seasonally adjusted) Latest Update: 5.11.12. teilm020 and teilm010[Online] Availableat < http://epp.eurostat.ec.europa.eu/portal/page/portal/euroindicators/peeis/> Accessed 6 November 2012
_ Eurostat, 2012p. Eurostatistics Data for Short-term Economic Analysis, Issue number 10/2012
_ Eurostat, 2012q.Relative at risk of poverty gap by poverty threshold (Source: SILC) [ilc_li11] Latest Update: 5.11.12. Available at< http://appsso.eurostat.ec.europa.eu/nui/show.do?dataset=ilc_li11&lang=en> Accessed 8 November 2012
_ Eurostat, 2012r, Inability to Keep Home Adequately warm. ilc_mdes01. Updated 14.11.12. Available on< http://appsso.eurostat.ec.europa.eu/nui/show.do> Accessed 17 November 2012
_ Eurostat, 2012s, Inability to Afford a meal with meat, chicken, fish (or vegetarian equivalent) every second day. ilc_mdes03. Last Updated14.11.12. [Online] Available at < http://appsso.eurostat.ec.europa.eu/nui/show.do> Accessed 19 November 2012
_ Eurostat, 2012t. Arrears (mortgage, rent, utility bills or hire purchase). ilc_mdes05. [Online]. Available at< http://appsso.eurostat.ec.europa.eu/nui/show.do> Accessed 19 November 2012
_ Eurostat, 2012u. Statistics in Focus, 9/2012
_ Eurosat, 2012v, In Work at-risk-of poverty rate by education level.ilc_iw04. [Online] Available at< http://appsso.eurostat.ec.europa.eu/nui/show.do?dataset=ilc_iw04&lang=en> Accessed 28 November 2012
_ Government of Ireland, 2011. Medium Term Fiscal Statement, November 2011. [Online] Available at< http://per.gov.ie/wp-content/uploads/Medium-Term-Fiscal-Statement-November-2011.pdf> Accessed 24 October 2012
_ Government of Portugal, 2012. National Social Report, Portugal, 2012. [Online] Available from http://ec.europa.eu/social/keyDocuments.jsp?policyArea=750&subCategory=758&type=0&country=0&year=0&advSearchKey=SPCNationalSocialReport&mode=advancedSubmit&langId=en Accessed 27 November 2012
_ Frazer, H., & Marlier, E., 2012. 2011 Assessment of Social Inclusion Policy Developments in the EU. January 2012. EU Network of IndependentExperts on Social Inclusion.
_ Healy, S., Mallon, S., Murphy, M., & Reynolds, B., 2012. Shaping Ireland’s Future: Securing Economic Development, Social Equity andSustainability. Dublin: Social Justice Ireland

T H E I M P A C T O F T H E E U R O P E A N C R I S I S C A R I T A S R E S P O N S E T O A U S T E R I T y 59
_ Healy, S., Reynolds, B., & Murphy, M., 2012a. ‘The European Social Model and Ireland – Re-imagining for the twenty first century’. In Does theEuropean Social Model Have a Future? Challenges and Responses, 70 Years after the Beveridge Report. Dublin: Social Justice Ireland
_ International Monetary Fund (IMF), 2012. Ireland: 2012. Article IV and the Seventh Review Under the Extended Arrangement. IMF CountryReport, No 12/264. Washington DC.
_ International Monetary Fund (IMF), 2012a. Portugal: Fourth Review Under the Extended Arrangement and Request for a Waiver of Applicabilityof End-June Performance Criteria (Including in an Annex, Memorandum of Understanding on Specific Economic Policy Conditionality, FourthUpdate, 27 June 2012). IMF Country Report, No 12/179. July 2012. Washington DC.
_ International Monetary Fund (IMF), 2012b. The IMF and Europe. Factsheet, September 19, 2012. [Online] Available at< www.imf.org/external/np/exr/facts/europe.htm> Accessed 28 October 2012.
_ International Monetary Fund (IMF), 2012c. Spain: 2012 Article IV Consultation, IMF Country Report No. 12/202 July 2012. [Online] Available at< http://www.imf.org/external/pubs/cat/longres.aspx?sk=26125.0> Accessed 28 October 2012.
_ International Monetary Fund (IMF), 2012d. Transcript of a Conference call on the Conclusion of the Fifth Review under an EFF Arrangementwith Portugal.Washington, D.C., October 25, 2012 [Online] Available at http://www.imf.org/external/np/tr/2012/tr102512b.htm Accessed 2 November 2012
_ International Monetary Fund (IMF), 2012e. Italy: 2012. Article IV Consultation. IMF Country Report No. 12/167. July 2012 Includes StaffStatement of 9 July 2012.
_ International Monetary Fund (IMF), 2012f. World Economic Outlook: Coping with High Debt and Sluggish Growth, October 2012
_ McMahon, B., Weld, G. & Thornton, R, 2010. Minimum Essential Budgets for Households in Rural Areas as Updated for 2012 (Weekly Budgetsfor Rural Households, 2012) [online] Available from < http://www.budgeting.ie/images/stories/Publications/Minimum_Essential_Budgets_for_Households_in_Rural_Areas.pdf> Accessed 9 November 2012
_ Menendiz, L. 2012. The Spread of the European Debt Crisis. [Online] ebook. University of IOWA Center for International Finance andDevelopment. Part 6 of UICIFD E-Book. Available from < http://ebook.law.uiowa.edu/ebook/uicifd-ebook> [Accessed 25 October 2012]
_ Ministero Dell Economia E Delle Finanze, Italy, 2012. Economic and Finance Document, Section III National Reform Programme.
_ Ministry of Finance, Greece, 2012. Hellenic National Reform Programme, 2012-2015: Report on the progress toward ‘Europe 2020’ and theImplementation of the Euro Plus Pact Commitments
_ Mody A., 2012. Time for Euro Zone to Revisit debt Default Option. The Irish Times, 14 November
_ Muižnieks, N., Commissioner for Human Rights of the Council of Europe, 2012. Report following his Visit to Portugal, 7-9 May 2012.CommDH(2012)22. Strasbourg: 10 July 2012
_ OECD (Organisation for Economic Co-operation and Development), n.d. Greece at a Glance: Policies for a Sustainable Recovery. [Online]Available from< http://www.oecd.org/greece> Accessed 6 November 2012
_ OFCE, The Collective Blog of the French Economic Observatory: Youth Jobs of the Future: What Impact on employment and GovernmentFinances [Online] Available at < http://www.ofce.sciences-po.fr/blog/?p=2468%23more-2468.> Accessed 28 November 2012
_ Quiggin, J., 2011, What Have We Learned – Policy Responses? The Australian Economics Review, Vol 44, No. 4, pp 355-365
_ Reuters, 2012. http://www.reuters.com/ Various articles
_ Social Justice Ireland, 2012. Ensuring Justice and Fairness Guide Policy Decisions: Briefing for IMF, European Central Bank and EuropeanCommission.
_ Social Protection Committee, 2011. Opinion of the Social Protection Committee on Reinvigorating the Social OMC in the context of the Europe2020 Strategy. 23 May 2011. In Cover Note, Council of the European Union, 10405/11. Brussels: Council of the European Union
_ Social Protection Committee of the European Commission, 2012. The Social Impact of the economic crisis and ongoing fiscal consolidation:Third Report of the Social Protection Committee (2011). Directorate-General for Employment, Social Affairs and Inclusion.
_ Social Protection Committee of the European Commission, 2012a. SPC Advisory Report to the European Commission in Tackling andPreventing Child Poverty, Promoting Child Well-being. Brussels, 27 June 2012
_ Spiegel Online International, 2012. The Life of Greece’s One Percent, Wealthy Greeks Still Don’t Pay Taxes, and other Articles. Available on< www.spiegal.de/international/europe/> [Accessed on several dates in November 2012]
_ Stiglitz, J., 2009. ‘The Global crisis, social protection and jobs.’ International Labour Review, Vol 148 (2009) No. 1-2, ps 1-13
_ Sutherland, H & Matsaganas, M., 2011. Who is bearing the cost of austerity? A distributional analysis of 6 EU countries. Research Paper[Online] [ Available at: https://www.iser.essex.ac.uk/people/hollys?material=Monograph [Accessed 18 October 2012]
_ Thomsen Fasano, K, , 2012. What measures did Europe Take to Control the Crisis? April 2012. UICIFD E-Book. Available from< http://ebook.law.uiowa.edu/ebook/uicifd-ebook> [Accessed 25 October 2012]
_ UNICEF, 2012. Measuring Child Poverty: New League Tables of Child Poverty in the World’s Richest Countries.

T H E I M P A C T O F T H E E U R O P E A N C R I S I S C A R I T A S R E S P O N S E T O A U S T E R I T y60
Appendix 1 Gross Debt, Greece, Ireland, Italy, Portugal, Spain
Appendices
2004 2005 2006 2007 2008 2009 2010 2011
EU (27 countries) 62.3 62.8 61.6 59 62.2 74.6 80 82.5Greece 98.6 100 106.1 107.4 112.9 129.7 148.3 170.6Ireland 29.4 27.2 24.5 24.8 44.5 64.9 92.2 106.4Italy 103.4 105.7 106.3 103.3 106.1 116.4 119.2 120.7Portugal 61.9 67.7 69.4 68.4 71.7 83.2 93.5 108.1Spain 46.3 43.2 39.7 36.3 40.2 53.9 61.5 69.3Source: Eurostat, 2012j, tsdde410
General Government Gross Debt, 2004-2011 % GDP
2004 2005 2006 2007 2008 2009 2010 2011
EU (27 countries) 6613633 6963230 7214104 7319610 7763975 8764582 9826981 10433926Greece 183157 195421 224204 239300 263284 299682 329513 355658Ireland 44255.1 44443.3 43765.5 47161.2 79607.9 104630.9 144226.9 169231.9Italy 1445858 1518556 1587781 1605126 1670993 1769226 1851217 1906738Portugal 92442 104407.3 111689.8 115786.4 123302 140225.7 161529.9 184699.3Spain 389142 392497 391055 382307 436984 565082 644692 736468Source: Eurostat, 2012j, tsdde410
General Government Gross Debt, 2004-2011 €millions
Appendix 2 Government Deficit/Surplus 2004-2011, Greece, Ireland, Italy, Portugal, Spain
2004 2005 2006 2007 2008 2009 2010 2011
European Union (27 countries) -2.9 -2.5 -1.5 -0.9 -2.4 -6.9 -6.5 -4.4Greece -7.5 -5.2 -5.7 -6.5 -9.8 -15.6 -10.7 -9.4Ireland 1.4 1.7 2.9 0.1 -7.4 -13.9 -30.9 -13.4Italy -3.5 -4.4 -3.4 -1.6 -2.7 -5.4 -4.5 -3.9Portugal -4.0 -6.5 -4.6 -3.1 -3.6 -10.2 -9.8 -4.4Spain -0.1 1.3 2.4 1.9 -4.5 -11.2 -9.7 -9.4Source: Eurostat, 2012k gov_dd_edpt1
Government deficit/surplus, % GDP
2004 2005 2006 2007 2008 2009 2010 2011
Greece -13,940 -10,068 -12,109 -14,475 -22,880 -36,125 -23,732 -19,686Ireland 2,065.8 2,711.2 5,182.7 124.1 -13,160 -22,484.1 -48,297.3 -21,255.8Italy -49,361 -63,918 -51,188 -25,273 -42,700 -82,752 -69,270 -61,758Portugal -5,988.3 -10,069.8 -7,408.2 -5,332.8 -6,235.6 -17,103.3 -16,950.1 -7,525Spain -941 11,511 23,349 20,255 -48,897 -117,143 -101,438 -100,402Source: Eurostat, 2012k gov_dd_edpt1
Government deficit/surplus, 2004-2011, millions of Euro

T H E I M P A C T O F T H E E U R O P E A N C R I S I S C A R I T A S R E S P O N S E T O A U S T E R I T y 61
Appendix 3 Poverty Rates according to Four different Indicators – Greece, Ireland, Italy, Portugal, Spain
2004 2005 2006 2007 2008 2009 2010 2011
EU (27 countries) 25.6 25.2 24.4 23.5 23.1 23.4Greece 30.9 29.4 29.3 28.3 28.1 27.6 27.7Ireland 24.8 25 23.3 23.1 23.7 25.7 29.9Italy 26.4 25 25.9 26 25.3 24.7 24.5Portugal 27.5 26.1 25 25 26 24.9 25.3 24.4Spain 24.4 23.4 23.3 23.1 22.9 23.4 25.5 27Source: Eurostat, 2012c: t2020_50
1. People at Risk of Poverty or Social Exclusion, %
2003 2004 2005 2006 2007 2008 2009 2010 2011
EU (27 countries) 16.4 16.5 16.5 16.4 16.3 16.4Greece 20.7 19.9 19.6 20.5 20.3 20.1 19.7 20.1 21.4Ireland 20.5 20.9 19.7 18.5 17.2 15.5 15 16.1Italy 19.1 18.9 19.6 19.8 18.7 18.4 18.2Portugal 19 20.4 19.4 18.5 18.1 18.5 17.9 17.9 18Spain 19 19.9 19.7 19.9 19.7 19.6 19.5 20.7 21.8Source: Eurostat, 2012c: t2020_52
2. People at Risk of Poverty, %.
2003 2004 2005 2006 2007 2008 2009 2010 2011
EU (27 countries) 10.7 9.8 9.1 8.4 8.1 8.1Greece 16.9 14.1 12.8 11.5 11.5 11.2 11 11.6 15.2Ireland 5.6 4.8 5.1 4.8 4.5 5.5 6.1 7.5Italy 6.9 6.4 6.3 6.8 7.5 7 6.9Portugal 9.9 9.3 9.1 9.6 9.7 9.1 9 8.3Spain 4.3 3.4 3.4 3 2.5 3.5 4 3.9Source: Eurostat, 2012c: t2020_53
3. People Severely Materially Deprived, %
2004 2005 2006 2007 2008 2009 2010 2011
EU (27 countries) 10.3 10.5 9.6 9 9 10Ireland 12.8 14.6 12.8 14.2 13.6 19.8 22.9Greece 7.4 7.5 8 8 7.4 6.5 7.5 11.8Italy 12 10.3 10.8 10 9.8 8.8 10.2Portugal 6.9 5.9 6.6 7.2 6.3 6.9 8.6 8.2Spain 7.2 6.5 6 6.3 6.2 7 9.8 12.2Source: Eurostat, 2012c: t2020_51
4. People Living in Households with very low work intensity, %
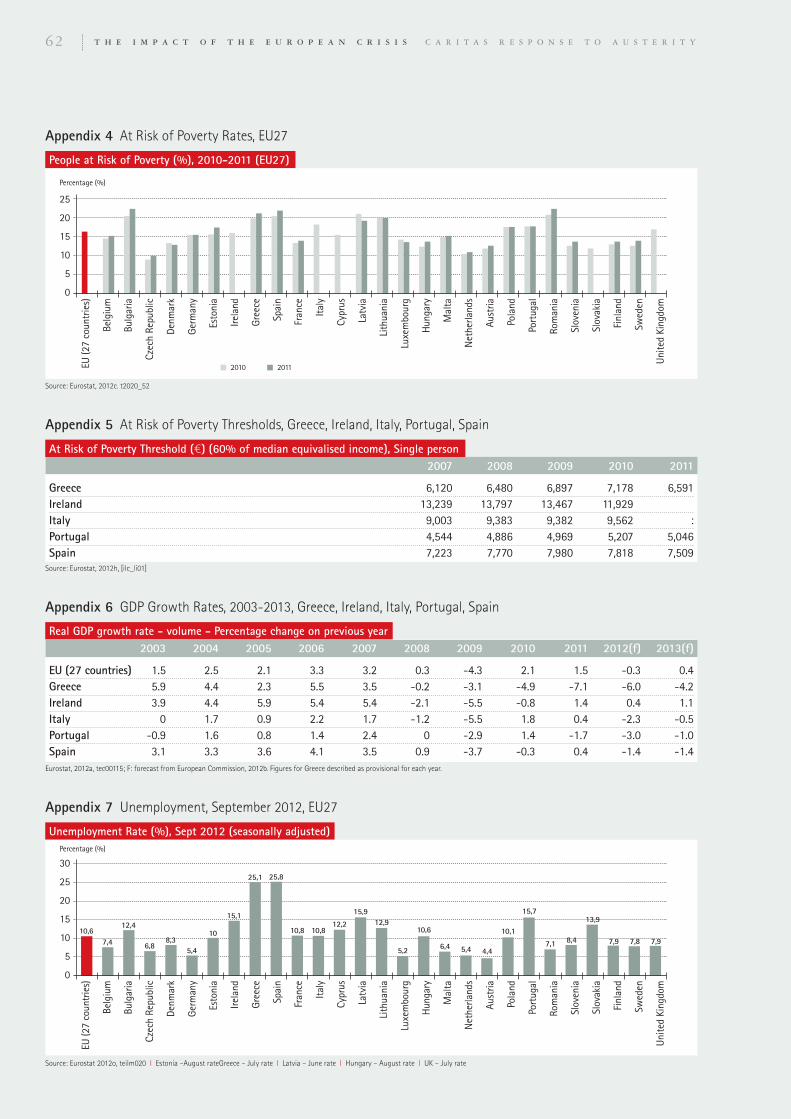
T H E I M P A C T O F T H E E U R O P E A N C R I S I S C A R I T A S R E S P O N S E T O A U S T E R I T y62
Appendix 5 At Risk of Poverty Thresholds, Greece, Ireland, Italy, Portugal, Spain
2007 2008 2009 2010 2011
Greece 6,120 6,480 6,897 7,178 6,591Ireland 13,239 13,797 13,467 11,929Italy 9,003 9,383 9,382 9,562 :Portugal 4,544 4,886 4,969 5,207 5,046Spain 7,223 7,770 7,980 7,818 7,509Source: Eurostat, 2012h, [ilc_li01]
At Risk of Poverty Threshold (€) (60% of median equivalised income), Single person
Appendix 6 GDP Growth Rates, 2003-2013, Greece, Ireland, Italy, Portugal, Spain
2003 2004 2005 2006 2007 2008 2009 2010 2011 2012(f) 2013(f)
EU (27 countries) 1.5 2.5 2.1 3.3 3.2 0.3 -4.3 2.1 1.5 -0.3 0.4Greece 5.9 4.4 2.3 5.5 3.5 -0.2 -3.1 -4.9 -7.1 -6.0 -4.2Ireland 3.9 4.4 5.9 5.4 5.4 -2.1 -5.5 -0.8 1.4 0.4 1.1Italy 0 1.7 0.9 2.2 1.7 -1.2 -5.5 1.8 0.4 -2.3 -0.5Portugal -0.9 1.6 0.8 1.4 2.4 0 -2.9 1.4 -1.7 -3.0 -1.0Spain 3.1 3.3 3.6 4.1 3.5 0.9 -3.7 -0.3 0.4 -1.4 -1.4Eurostat, 2012a, tec00115; F: forecast from European Commission, 2012b. Figures for Greece described as provisional for each year.
Real GDP growth rate - volume - Percentage change on previous year
People at Risk of Poverty (%), 2010-2011 (EU27)
Appendix 4 At Risk of Poverty Rates, EU27
25
20
15
10
5
0
Percentage (%)
Source: Eurostat, 2012c. t2020_52
EU(27countries)
Belgium
Bulgaria
CzechRepublic
Denm
ark
Germany
Estonia
Ireland
Greece
Spain
France
Italy
Cyprus
Latvia
Lithuania
Luxembourg
Hungary
Malta
Netherlands
Austria
Poland
Portugal
Romania
Slovenia
Slovakia
Finland
Sweden
UnitedKingdom
2010 2011
Unemployment Rate (%), Sept 2012 (seasonally adjusted)
Appendix 7 Unemployment, September 2012, EU27
30
25
20
15
10
5
0
Percentage (%)
Source: Eurostat 2012o, teilm020 I Estonia –August rateGreece – July rate I Latvia – June rate I Hungary – August rate I UK – July rate
EU(27countries)
Belgium
Bulgaria
CzechRepublic
Denm
ark
Germany
Estonia
Ireland
Greece
Spain
France
Italy
Cyprus
Latvia
Lithuania
Luxembourg
Hungary
Malta
Netherlands
Austria
Poland
Portugal
Romania
Slovenia
Slovakia
Finland
Sweden
UnitedKingdom
10,67,4
12,4
6,88,3
5,4
10
15,1
25,1 25,8
10,8 10,812,2
15,912,9
5,2
10,6
6,4 5,4 4,4
10,1
15,7
7,1 8,4
13,9
7,9 7,8 7,9

T H E I M P A C T O F T H E E U R O P E A N C R I S I S C A R I T A S R E S P O N S E T O A U S T E R I T y 63
In this Appendix we introduce and discuss the issue of Jobs Guarantee Schemes and afterwards provide two contrasting examples of theirimplementation.
1. Job Guarantee Schemes – General Introduction
Unemployment is one of the most serious issues facing the EU at the moment, particularly where its youth is concerned. Unemploymentgives rise to increased poverty, a greater prevalence of mental health problems and growing levels of social exclusion. High levels ofunemployment across the EU co-exist with significant potential employment opportunities in, for example, the conservation and developmentof the social and environmental capital of EU Member States. This paradox could be solved by a positive innovation known as the Job GuaranteeScheme (JGS). This describes a jobs programme in which the State assumes the role of ‘employer of last resort’ in the event that unemployedindividuals opt to avail of structured employment opportunities. Under such schemes, employment opportunities are created in areas notcurrently undertaken by either the public or the private sector. The extensive academic literature on job guarantee schemes provide numerousexamples of possible positions that could be filled, such as school classroom assistants; safety monitors; neighbourhood clean-up; low-incomehousing restoration; library assistants; community or cultural historians; musicians and event organizers.
Such schemes would not subsidise private sector jobs or threaten to undercut unionised public sector jobs. Any jobs with a set rate of pay orin the private sector should not be considered for the programme. Only those jobs that directly benefit the public purpose and do not impingeon other workers would be considered .This would mean that when unemployed workers are channelled into these sectors, it would not resultin a ‘crowding out effect’ for other workers.
A Job Guarantee Scheme is not conceived as a means to replace other social programmes such as social welfare. Many people are not able to takeup a job and safety nets for these people must be kept in place. However, Job Guarantee Schemes could complement a social support system suchas the Unconditional Basic Income, and provide individuals with a low level of income security while they transition from unemployment to a state-sponsored employment scheme and ultimately back into the open labour market if or when jobs become available on the scale across the economy.
Large-scale jobs programmes have been successful in the past in kick- starting flagging economies. The most famous of these was the WorkProgress Administration (WPA) enacted under Franklin Delano Roosevelt during the Great Depression47. A more recent example is the Jefesprogram which was enacted under the administration of Nestor Kirchner in Argentina after the economic collapse that took place there in200148. There is no legal impediment under the Maastricht or Lisbon Treaties of which Caritas is aware that would prevent the governmentsof EU Member States from implementing such a measure.Source: extract from Caritas Europa, 2012a
2. Two Examples – one from France (with a youth focus initiated by Government), and one from Ireland (initiated by anNGO and mainstreamed by Government)
2.1. France: Emplois D’Avenir
In France a new initiative aimed at young people from disadvantaged areas has been introduced called Emplois D’Avenir. It was an initiativeof the French Government approved by Parliament in October 2012 to create 150,000 jobs for young people. Features:5 The programme aims to create 100,000 jobs in 2013 and a further 50,000 in 2014.5 Jobs will primarily be open in the public sector, local authorities and other associations, foundations or businesses in non-commercialactivities with a social purpose.
5 The sectors favoured for job creation are those labelled by the European Commission as areas with largest potential for future job growthi.e. green economy, health services and ICT.
5 The jobs will be aimed at young people aged 16-25 without degrees from deprived urban and rural areas or areas hit by high unemployment.The estimated cost is €1.5b.
5 The jobs will be full-time, or fixed term contract of 3 years and the recipients will be paid at least the minimum wage, of which 75% ofthe gross wage will be funded by the State.
These full-time jobs, which are planned to last a maximum of five years and are paid at least the minimum wage (SMIC), will be 75% funded bythe State, with the rest of the cost being borne by local authorities, associations, foundations and business. Based on the assumption that two-thirds of the “jobs for the future” created would be in the non-market sector and one-third in the market sector, the total average annual costfor the public finances therefore comes to 23,015 euros per contract. When fully implemented, the cost of creating 150,000 “jobs for the future”is estimated at 3.45 billion euros a year.
ImpactBy assuming the creation of 100,000 subsidized jobs in the non-market sector and 50,000 in the market sector, the impact would be as follows:With relatively weak deadweight and substitution effects in the non-market sector (20% according to Fontaine and Malherbet, 2012), 100,000“jobs for the future” would lead to the net creation of 80,000 jobs over the presidential term. The ex-ante annual cost to the public financesfor 100,000 “jobs for the future” in the non-market sector would be 0.12 GDP, but ex post this would be only 0.07 GDP because of the extraincome – and thus tax and social security revenue – generated by the jobs created.
Appendix 8 Job Guarantee Schemes
47 www.u-s-history.com/pages/h1589.html48 http://www.levyinstitute.org/pubs/wp_534.pdf. For an appraisal, see http://www.epicoalition.org/docs/ArgentinaJefes.htm

T H E I M P A C T O F T H E E U R O P E A N C R I S I S C A R I T A S R E S P O N S E T O A U S T E R I T y64
The state aid (75% of the gross salary) allows a reduction in the cost of labour of 52% at the SMIC level, i.e. a total reduction of 71% of theactual cost of a minimum wage job if one includes the reductions in charges. With the impact of employment elasticities at a maximum labourcost at the level of the SMIC (1.2 according to a DGTPE study in 2007), the 50,000 “jobs of the future” in the market sector would generate27,300 jobs. The ex-ante cost to the public finances would be 0.05 GDP point, and 0.03 GDP point ex post.
Ultimately, the measure would eventually create 107,300 jobs (about 25% of these in the market sector), i.e. an annual net creation of 72%.The ex-ante cost for the public finances would be 0.17 GDP point, but the ex-post impact of the measure on the public balance would be only-0.1 GDP point because of the extra tax and social security revenue generated by the jobs created and the consequent income gains (Table 1).
Source: OFCE, The Collective Blog of the French Economic Observatory: Youth Jobs of the Future: What Impact on employment and GovernmentFinances < http://www.ofce.sciences-po.fr/blog/?p=2468%23more-2468.>
2.2. Ireland: Part-time Jobs Initiative, Social Justice Ireland
A programme piloted by the current Directors of Social Justice Ireland, Seán Healy and Brigid Reynolds, from 1994-1998 created 1,000 part-timejobs paying the ‘going hourly rate’ for the job. The jobs were open to a number of categories of people who were unemployed. They worked thenumber of hours necessary to earn their social welfare payment plus a small top-up. After that they were free to seek further employment and,of course, pay tax on the money they earned in the normal way but they were entitled to continue receiving their secondary benefits (e.g. medicalcard). The programme was taken on by 162 organisations and was extremely successful. 500 of the original 1,000 employees left during the courseof the programme – almost all of these took up full-time employment. These were all replaced by others who fitted the criteria for participants.The programme was piloted in six very different pilot city, town, rural and the islands off the coast. There was huge demand for the programmeand there was always a waiting list of eligible candidates.
Social Justice Ireland has proposed on a number of occasions during the current crisis that the Irish Government create 100,000 part-timejobs in the public sector and in the community and voluntary sector following the model piloted in the 1994-98 period.
Outline of the programmeThis programme would enable unemployed people to be employed on a part time basis:5 In the public sector (e.g. local authorities, Government departments, the healthcare and educational authorities) and the community andvoluntary sector
5 Voluntarily5 Doing work of public or social value which is not being done or is only partly being done at present5 At the hourly ‘going rate for the job’5 For as many hours as would give them a net income equivalent to what they were receiving from jobseekers allowance (i.e. their basic socialwelfare payment) plus an additional €20 a week. (They would work for a minimum of 8 hours and a maximum of 19.5 hours.)
5 The person taking up the new position would lose none of his/her other social welfare entitlements5 Once the required number of hours had been worked, the person would be free to do whatever she/he wished for the remainder of the week5 The money paid to the person filling the new position would be reallocated to the employing organisation by the Department for Social Protection5 The employer would be encouraged to give extra hours to the worker who would be taxed accordingly5 If the person received further income from another job, this income would be assessed for tax purposes in the normal way5 To protect against a ‘deadweight effect’ no position could be created if a person had been employed to do this particular work at any pointduring the previous two years
EligibilityThe Programme would be available to:5 All recipients of jobseekers allowance5 All recipients of jobseekers benefit after 6 months
Voluntary nature of the programmeThe voluntary nature of the programme is considered very important from the point of view of the worker and the employer. It must not haveany of the characteristics of ‘workfare’.5 From the viewpoint of the worker, he/she must freely choose to come on the programme, and must be free to leave if he/she chooses, subjectonly to normal requirements with regard to notice to the employer
5 From the point of view of the employer, there must be free choice in selecting workers from among those eligible for the programme. Theemployer should also be free to select the number of workers required. This ensures that the work offered is real. The pilot programmeshowed that there would be more demand for these jobs than there were positions to accommodate them
To protect the voluntary nature of the programme and to ensure that the work is real the following would be expected:5 Positions should be advertised publicly by the employing body, through local media, or any other method used in the local area.5 A job description would be provided.5 Workers should be interviewed for the positions.5 Written job contracts should be provided.5 Employers would not be pressurised to take more workers than they need.5 Leaving a particular job would not prejudice a worker seeking to participate in another project or training programme.

EU27 The 27 countries who are members of the European Union. Theseinclude Austria, Belgium, Bulgaria, Cyprus, the Czech Republic, Denmark,Estonia, Finland, France, Germany, Greece, Hungary, Ireland, Italy, Latvia,Lithuania, Luxembourg, Malta, the Netherlands, Poland, Portugal, Romania,Slovenia, Slovakia, Spain, Sweden and the United Kingdom.
Government Deficit/ Surplus The government deficit/surplus is the netborrowing/net lending of general government. It is the difference betweenthe total revenue and the total expenditure of the general government sector.What is included in it is set out in detail in the European System of Accounts‘95 (Eurostat, gov_dd_esms).
Government Debt The government debt is defined as the total consolidatedgross debt at nominal value at the end of the year in the following categoriesof government liabilities: currency and deposits, securities other than sharesexcluding financial derivatives, and loans. What is included in it is set out indetail in the European System of Accounts ‘95 (Eurostat, gov_dd_esms).
In-work-at-risk-of-poverty rate This is defined by Eurostat as the share ofpersons who are at work and have an equivalised disposable income below therisk-of-poverty threshold, which is set at 60 % of the national medianequivalised disposable income (after social transfers) (Eurostat, 2012g)
People at risk-of-poverty Persons are at risk of poverty if they have anequivalised disposable income below the risk-of-poverty threshold, which isgenerally set at 60 % of the national median equivalised disposable income(after social transfers) (Eurostat, 2012c). It is also possible to examine thedispersion around the at-risk-of-poverty threshold by looking at people withan equivalised disposable income below respectively 40%, 50%, 60% and70% of the national median equivalised disposable income (Eurostat, 2012d)
People at Risk of Poverty or Social Exclusion The combined indicator usedunder the Europe 2020 strategy. This indicator corresponds to the sum ofpersons who (1) are at risk of poverty or (2) severely materially deprived or (3)living in households with very low work intensity. Persons are only countedonce even if they are present in several sub-indicators (Eurostat, 2012c)
Relative median at-risk-of-poverty gap is a measure of the depth of poverty.It is calculated as the difference between the median equivalised disposableincome of people below the at-risk-of-poverty threshold and the at-risk-of-poverty threshold, expressed as a percentage of the at-risk-of-povertythreshold (cut-off point: 60 % of national median equivalised disposableincome) (Eurostat).
Severely Materially Deprived Material deprivation covers poverty indicatorsrelating to economic strain and durables. Severely materially deprived personshave living conditions severely constrained by a lack of resources; they aredeprived of at least 4 out of 9 following items: cannot afford i) to pay rent orutility bills, ii) keep home adequately warm, iii) face unexpected expenses, iv)eat meat, fish or a protein equivalent every second day, v) a week holidayaway from home, vi) a car, vii) a washing machine, viii) a colour TV, or ix) atelephone (Eurostat, 2012c).
The Stability and Growth Pact was introduced as part of the MaastrichtTreaty in 1992, and set limits upon member countries' budget deficits andlevels of public debt at 3 % t and 60% of GDP respectively
Very Low Work Intensity People living in households with very low workintensity are those aged 0-59 living in any households where the adults (aged18-59) work less than 20% of their total work potential during the past year(Eurostat, 2012c).
Glossary

Caritas Europa
Rue de Pascale, 41040 Brussels - BelgiumTel. +32 (0)2 280 02 80Fax +32 (0)2 230 16 58
design